Embed Size (px)
Citation preview

The Pennsylvania State University
The Graduate School
College of Education
ENGLISH LANGUAGE PROFICIENCY AND TEACHER JUDGMENTS OF THE
ACADEMIC AND INTERPERSONAL COMPETENCE OF
ENGLISH LANGUAGE LEARNERS
A Dissertation in
School Psychology
by
Miranda E. Freberg
© 2014 Miranda E. Freberg
Submitted in Partial Fulfillment of the Requirements
for the Degree of
Doctor of Philosophy
May 2014
ii
The dissertation of Miranda E. Freberg was reviewed and approved* by the following:
Beverly J. Vandiver Associate Professor Emeritus of Education Dissertation Adviser Co-Chair of Committee
James D. DiPerna Associate Professor of Education Co-Chair of Committee Professor in Charge of the School Psychology Program
Barbara A. Schaefer Associate Professor of Education Keith B. Wilson Professor of Education Shirley A. Woika Associate Professor of Education *Signatures are on file in the Graduate School.

iii
ABSTRACT
The purpose of the study was to investigate how English language proficiency is related to
teacher judgments of students’ academic and interpersonal competence. It was hypothesized that
English Language Learner (ELL) students would generally be perceived as having weaker
academic and interpersonal skills than their non-ELL counterparts regardless of race/ethnicity.
Additionally, it was proposed that teachers’ ratings would be more predictive of the performance
of non-ELL versus ELL students. Data were obtained from the Early Childhood Longitudinal
Study–Kindergarten Class of 1998-1999 (ECLS-K). Participants were 260 third-grade students
whose academic and interpersonal skills were rated by their teachers on the Academic Rating
Scale (ARS; Atkins-Burnett, Meisels, & Correnti, 2000) and Social Rating Scale (SRS; Atkins-
Burnett, Meisels, & Correnti, 2000), respectively. Teachers’ academic ratings were compared to
students’ actual performance on the reading and math sections of the ECLS-K direct cognitive
assessment and teachers’ interpersonal ratings were compared to students’ self-ratings on the
Self-Description Questionnaire (SDQ; Marsh, 1990). Multiple regression analyses were used to
assess the effects of language status and race/ethnicity on teacher ratings. Additional regression
analyses were conducted to investigate whether teacher ratings were predictive of students’
academic performance and students’ self-ratings of interpersonal skills. Results showed that, in
contrast to what was hypothesized, teacher ratings were not significantly related to language
status, but race/ethnicity was found to be a significant predictor of both academic and social
ratings. Specifically, teachers rated African American students as having weaker reading and
interpersonal skills than their Hispanic counterparts. As hypothesized, teacher ratings were
found to be more predictive for non-ELL students on math and reading skills than ELL students.
These findings suggest that race/ethnicity may be more of an influential factor than language
iv
status when teachers make academic and interpersonal judgments and support previous research
(e.g., Hodson, Dovidio, & Gaertner, 2002; Jussim & Eccles, 1995) that teachers may have pre-
existing biases towards students of different races or ethnicities. Additionally, given the lower
predictive accuracy of teacher ratings of ELL than non-ELL students, teachers may need more
training to work with and to ensure a fair assessment of ELL students’ academic capabilities.

v
TABLE OF CONTENTS
LIST OF TABLES……………………………………………………………………………...viii
INTRODUCTION………………………………………………………………………………...1
LITERATURE REVIEW……………………………………………………………....................3
The Self-Fulfilling Prophecy………………………...........................................................3
Teacher Expectations and Student Outcomes……………………………………………..5
Accuracy of Teacher Judgments…………………………………………………………..8
Potential Influences on Teacher Judgments and Expectations…………………………..11
English Language Learners in Mainstream Classrooms………………………………....19
Perceptions of Language and Academic Competence…………………………………...27
Conclusions………………………………………………………………………………29
Current Study: Research Questions and Hypotheses………………………………….....31
METHOD………………………………………………………………………………………..33
Overview…………………………………………………………………………………33
Participants……………………………………………………………………………….33
Measures…………………………………………………………………………………39
Oral Language Development Scale (OLDS)…………………………………….39
Direct Cognitive Assessments…………………………………………………. .41
Self-Description Questionnaire (SDQ)…………………………………………..45
Academic Rating Scale (ARS)…………………………………………………...46
Social Rating Scale (SRS)……………………………………………………….48
Procedure………………………………………………………………………………...50
ECLS-K Data Collection………………………………………………………...50

vi
Data Acquisition…………………………………………………………………51
RESULTS………………………………………………………………………………………..52
Descriptive Statistics……………………………………………………………………..52
Preliminary Analyses………………………………………………………………….....55
Student Variables………………………………………………………………...56
Parent Variables………………………………………………………………….57
Teacher Variables………………………………………………………………..59
School Variables………………………………………………………………....60
Language Status and Teacher Perceptions…………………………………………….…61
Reading Skills……………………………………………………………………62
Math Skills……………………………………………………………………….65
Interpersonal Skills………………………………………………………………65
Language Status and Teacher Perceptions across Racial/Ethnic Groups………………..65
Unweighted Analyses……………………………………………………………66
Weighted Analyses………………………………………………………………68
Additional Analyses…………………………………………………………………...…69
Socioeconomic Status…………………………………………………………....71
National Origin of Mother……………………………………………………….72
School Location………………………………………………………………….73
Teacher Ratings as Predictors of Student Performance………………………………….73
Unweighted Analyses……………………………………………………………74
Reading Skills……………………………………………………………74
Math Skills……………………………………………………………….80

vii
Interpersonal Skills………………………………………………………81
Weighted Analyses……………………………………………………………....81
Reading Skills……………………………………………………………83
Math Skills……………………………………………………………….85
Interpersonal Skills………………………………………………………87
Post-Hoc Analyses……………………………………………………………………….88
DISCUSSION……………………………………………………………………………………96
Language Status and Teacher Perceptions……………………………………………….96
Language Status and Teacher Perceptions across Racial/Ethnic Groups………………..98
Additional Analyses…………………………………………………………………….100
Teacher Ratings as Predictors of Student Performance………………………………...101
Limitations……………………………………………………………………………...103
Implications for Practice and Future Research…………………………………………105
Conclusion……………………………………………………………………………...106
REFERENCES…………………………………………………………………………………108

viii
LIST OF TABLES
Table 1 Demographic Characteristics of Unweighted Sample of Students………………35
Table 2 Demographic Characteristics of Weighted Sample of Students…………………37 Table 3 Demographic Characteristics of the Unweighted and Weighted Sample of Teachers………………………………………………………………39 Table 4 Descriptive Statistics for Teacher Ratings, Self-Ratings, and
Reading and Math Assessment Scores for All Students…………………………53 Table 5 Descriptive Statistics for Teacher Ratings, Self-Ratings, and
Reading and Math Assessment Scores for Students of Hispanic Ethnicity based on Language Status……………………………………………..54
Table 6 Descriptive Statistics for Teacher Ratings, Self-Ratings, and
Reading and Math Assessment Scores for Non-ELL Students of Caucasian and African American Race……………………………………….55
Table 7 Unweighted Frequency (Percentage) of ELL and Non-ELL
Students by SES Level…………………………………………………………...57 Table 8 Unweighted Frequency (Percentage) of ELL and Non-ELL
Students by Parent’s National Origin....................................................................58 Table 9 Unweighted Frequency (Percentage) of ELL and Non-ELL
Students by Teacher’s Level of Education………………………………………59 Table 10 Unweighted Frequency (Percentage) of ELL and Non-ELL
Students by School Location……….....................................................................60 Table 11 Summary of Unweighted Hierarchical Regression Analyses on Teacher
Ratings of Reading, Math, and Interpersonal Skills based on Students’ Language Status and Teacher’s Education and ESL Training…………………...63
Table 12 Summary of Weighted Hierarchical Regression Analyses on Teacher
Ratings of Reading, Math, and Interpersonal Skills based on Students’ Language Status and Teachers’ Education and ESL Training…………………..64
Table 13 Summary of Unweighted Regression Analyses for the Prediction of
Teacher Ratings of Reading, Math, and Interpersonal Skills for Students Grouped by Language Status and Race/Ethnicity……………………………….67

ix
Table 14 Summary of Weighted Regression Analyses for the Prediction of Teacher Ratings of Reading, Math, and Interpersonal Skills for Students Grouped by Language Status and Race/Ethnicity……………………………….70
Table 15 Summary of Unweighted ANOVA for Teacher Ratings of Reading,
Math, and Interpersonal Skills based on SES, National Origin, and School Location………………………………………………………………….71
Table 16 Summary of Weighted ANOVA for Teacher Ratings of Reading,
Math, and Interpersonal Skills based on SES, National Origin, and School Location …………………………………………………………………72
Table 17 Summary of Unweighted Regression Analyses for the Prediction of
Students’ Reading Scores by Language Status, Race/Ethnicity, and Teacher Ratings………………………………………………………………….75
Table 18 Summary of Unweighted Regression Analyses for the Prediction of Students’ Math Scores by Language Status, Race/Ethnicity, and Teacher Ratings………………………………………………………………….77
Table 19 Summary of Unweighted Regression Analyses for the Prediction of Students’ Interpersonal Self-Ratings by Language Status, Race/Ethnicity, and Teacher Ratings……………………………………………………………...79
Table 20 Summary of Weighted Regression Analyses for the Prediction of Students’ Reading Scores by Language Status, Race/Ethnicity, and Teacher Ratings………………………………………………………………….82
Table 21 Summary of Weighted Regression Analyses for the Prediction of Students’ Math Scores by Language Status, Race/Ethnicity, and Teacher Ratings………………………………………………………………….84
Table 22 Summary of Weighted Regression Analyses for the Prediction of Students’ Interpersonal Self-Rating by Language Status, Race/Ethnicity, and Teacher Ratings……………………………………………………………...86
Table 23 Summary of Unweighted Regression Analyses Investigating the
Influence of Time in ESL Classroom on the Accuracy of Teacher Ratings of ELL Students’ Reading Skills……………………………………….89
Table 24 Summary of Unweighted Regression Analyses Investigating the
Influence of Time in ESL Classroom on the Accuracy of Teacher Ratings of ELL Students’ Math Skills…………………………………………..90

x
Table 25 Summary of Unweighted Regression Analyses Investigating the Influence of Time in ESL Classroom on the Accuracy of Teacher Ratings of ELL Students’ Interpersonal Skills…………………………………..91
Table 26 Summary of Weighted Regression Analyses Investigating the
Influence of Time in ESL Classroom on the Accuracy of Teacher Ratings of ELL Students’ Reading Skills……………………………………….92
Table 27 Summary of Weighted Regression Analyses Investigating the
Influence of Time in ESL Classroom on the Accuracy of Teacher Ratings of ELL Students’ Math Skills…………………………………………..93
Table 28 Summary of Weighted Regression Analyses Investigating the
Influence of Time in ESL Classroom on the Accuracy of Teacher Ratings of ELL Students’ Interpersonal Skills………………………………….94

1
INTRODUCTION
Recent estimates suggest that English Language Learners (ELLs) currently constitute
approximately 10% of the total student population in the Unites States – an increase of over 80%
in the past decade (Gottlieb, 2006; National Center for Education Statistics, 2007). As the ELL
population continues to grow in U.S. schools, it becomes increasingly important to conduct
research that addresses the overall well-being and functioning of these students in schools. In
alignment with the No Child Left Behind Act of 2001, which mandates increased focus on equal
opportunities and the promotion of academic success for all students, research is needed about
ways to promote successful outcomes for the growing ELL population.
Existing research indicates that teachers’ perceptions of, and expectations for, students
can influence their academic outcomes (Hoge & Coladarci, 1989) and, in some cases, can even
become self-fulfilling prophecies (Lumsden, 1997). Additionally, the findings of some studies
(e.g., Gill & Reynolds, 1999; Jussim, Eccles, & Madon, 1996 Jussim & Harber, 2005) suggest
that teacher expectancy effects, particularly negative ones, may be most prominent for students
from stigmatized groups, such as students of diverse ethnic minority backgrounds, of low
socioeconomic status, or of limited English proficiency. Given these findings, teachers need to
become more aware of their beliefs, perhaps subconsciously, towards different groups of
students. Armed with this awareness, teachers can take conscious action to positively influence
students’ achievement on a consistent basis by maintaining positive perceptions and
communicating high expectations to all of their students, regardless of differences.
Much of the existing research on teachers’ perceptions and expectations has focused on
English-speaking students in regular education classrooms. However, some research exists that
specifically examines mainstream teachers’ perceptions of ELL students. Early ethnographic

2
studies (e.g., Clair, 1993; Penfield, 1987) exploring teachers’ perceptions of ELL students
suggest a general lack of awareness and knowledge for working with these students. Later
surveys (Mantero & McVicker, 2006; Reeves, 2006; Vollmer, 2000; Young & Youngs, 2001)
indicate somewhat increased awareness and knowledge of ELL students, but the general
consensus continues to be that more teacher training in this area is needed.
One recurring theme in the extant literature on mainstream teachers’ perceptions of ELL
students is the potential impact of limited English proficiency on ELL students’ performance in
the regular education classroom. While some researchers have explored teachers’ attitudes
toward language diversity and development (e.g., Byrnes & Kiger, 1994; Byrnes, Kiger, &
Manning, 1997; Williams, Whitehead, & Miller, 1972), the relationship between level of English
language proficiency and teacher perceptions of academic and interpersonal competence has not
been extensively investigated. As such, the purpose of the current study is to specifically
investigate how teachers’ perceptions of English language proficiency are related to their
judgments of the academic and interpersonal competence of ELL students.
Several areas relevant to the current study are examined in the following literature
review. First, the concept of the self-fulfilling prophecy will be introduced, followed by a
general review of studies about the influence of the self-fulfilling prophecy in the classroom and
the potential impact of teachers’ expectations on student outcomes. Next, the predictive
accuracy of teachers’ judgments will be examined in conjunction with potential intervening
factors, such as student behavior, gender, race/ethnicity, socioeconomic status, and physical
attractiveness. Also, literature that specifically focuses on ELL students and teachers’
perceptions of them and their use of language will be reviewed. Finally, the purpose of the
current study, including research questions and hypotheses, will be presented.

3
LITERATURE REVIEW
The Self-Fulfilling Prophecy
It has been proposed that teachers’ beliefs, perceptions, and expectations affect students’
overall educational experiences (Alva, 1991). Cummins (2001) states that teachers’ perceptions
and expectations can have a major impact on teacher-student relationships, which are central to
student learning. Lumsden (1997), specifically, suggests that teachers’ general beliefs about
students and academic expectations have an impact on students’ attitudes and performance in the
classroom, as students may internalize beliefs about their abilities that teachers have. Lumsden
additionally indicates that teachers’ expectations for students can become a self-fulfilling
prophecy as students adapt to these expectations—whether high or low.
The self-fulfilling prophecy, a prediction that becomes true because people act as if it is
true, has been studied repeatedly since the introduction of the concept by 20th century
sociologist, Robert Merton (1957). Rosenthal (1963, 1966) conducted a series of studies
investigating the self-fulfilling prophecy and found that experimenters’ expectations indeed had
an effect on experimental outcomes. A few years later, Rosenthal and Jacobson (1968) tested the
related phenomenon known as the Pygmalion effect (higher expectations lead to better
performance) in the classroom setting. Specifically, teachers were told that certain children (who
were in fact chosen randomly) could be expected to be “growth-spurters” based on their
supposed results on a nonexistent test. In this ground-breaking study, Rosenthal and Jacobson
found support for the self-fulfilling prophecy and Pygmalion effect, as the students expected to
show greater intellectual growth actually demonstrated larger gains on an IQ test.
Rosenthal and Jacobson’s (1968) findings sparked a lot of debate about whether teachers’
expectations could actually have an effect on students’ performance. Since this time, hundreds of

4
related studies have been conducted with mixed results; self-fulfilling prophecy effects have
been found to occur in some cases, but not in others. In essence, all perceptions and expectations
are not automatically self-fulfilling.
Blease (1983) proposed that in order for expectation effects to occur, expectations must
first be successfully communicated. The successful transmission of expectations depends on the
existence of certain conditions. First, the school must provide an environment in which
expectations will be formed and articulated. Such an environment would include prolonged
student-teacher interactions, activities that facilitate verbal communication, and the opportunity
for teachers to make regular subjective judgments about their students. Second, the teacher’s
behavior is important. Blease notes that based on their expectations, teachers must consistently
provide qualitatively different classroom experiences for each student. Third, when a group of
individuals share similar perceptions of particular children, there is likely to be a cumulative
effect, increasing the likelihood that those expectations will be transmitted. This “expectation
network” could include other school staff, parents, siblings, and peers. As information
accumulates, expectations within this network are more likely to become firmly established and
more resistant to change. A final important factor is the receptivity of the students to whom the
expectations are being transmitted. Blease indicates that students must believe that their teachers
are legitimate and competent judges of their behavior and performance. That is, the student must
accept as true the situation, which has been defined by the teacher (Blease, 1983).
While recognizing that self-fulfilling prophecy effects do not automatically occur
between every teacher and student, and not every teacher expectation is self-fulfilled, Babad
(2009) states, “Today there is no doubt that the phenomenon of teachers’ SFP [self-fulfilling
prophecy] does indeed exist and can be measured empirically” (p. 79). He further suggests, “In

5
the reality of the classroom, teachers form differential expectations about all students, and they
interact with students according to their expectations and interpretations” (Babad, p. 87).
Teacher expectations and student outcomes. Studies to date vary in the reported
magnitude of teachers’ expectancy effects. In an early meta-analysis of 47 studies, Smith (1980)
investigated the effect of teacher expectations on students’ IQ test performance and academic
achievement. While Smith found a small average effect size (Cohen’s d = .16) for teacher
expectations on students’ IQ test performance, teacher expectations had a larger effect on
students’ academic achievement (Cohen’s d = .38). Raudenbush (1984) conducted a meta-
analysis of 18 studies also examining the effects of teacher expectations on student IQ test
performance. Like Smith (1980), Raudenbush found a small average effect size (Cohen’s d =
.11). However, expectancy effects varied (-.04 to .32), depending on how long the teacher had
known the student. Specifically, the longer the teacher had known a student, the smaller the
expectancy effect.
In another study on teachers’ expectations and self-fulfilling prophecy, Brophy (1983)
found that teachers’ expectation effects occur in only a minority of cases and that such effects are
minimal because teachers’ expectations are generally accurate. However, Brophy noted that it is
difficult to fully predict the direct effects of teachers’ expectations due to the possible
interactions with various factors, such as teachers’ beliefs about learning and instruction, or
students’ perceptions, interpretations, and responses to teacher expectations.
In 1989, Jussim began a series of studies on teachers’ expectations. Jussim (1989)
examined whether students’ academic performance confirmed teachers’ expectations due to the
creation of self-fulfilling prophecies or due to the accuracy of teachers’ expectations.
Longitudinal data collected over the course of a year were obtained from 27 teachers and 429

6
students in sixth grade math classes in a public school district in southeastern Michigan. More
than 90% of the students sampled were White, with a majority coming from middle- or upper
middle-class backgrounds. Teachers were given questionnaires, which assessed perceptions of
each student’s talent, effort, and performance in math; students were given questionnaires, which
were designed to measure self-concept of ability in math, effort in math, time spent on math
homework, and value placed on math. Standardized test scores and math grades were used as
measures of students’ achievement.
Path analytic techniques were used to assess the relationship between teachers’
expectations, students’ motivation, and students’ achievement. Consistent with the self-fulfilling
prophecy hypothesis, Jussim (1989) found a modest self-fulfilling prophecy effect on students’
achievement and motivation, but also found that teachers’ expectations predicted student
achievement due to their accuracy rather than actually “causing” students to perform in a certain
way. Results of a subsequent study by Jussim and Eccles (1992) using the same measures and an
expanded sample (98 teachers & 1,731 students from 11 school districts in southeastern
Michigan) also found that teachers’ expectations were significant predictors of changes in
students’ achievement.
A more recent review of 35 years of empirical research led Jussim and Harber (2005) to
conclude that self-fulfilling prophecies do occur in the classroom, but the effects are generally
small (averaging r = .10 to .20), with self-fulfilling prophecies affecting approximately 5 to 10%
of students. However, expectancy effects may be stronger for stigmatized social groups or
children for whom teachers hold lower expectations. In an early longitudinal study of a group of
urban African American children in the lower elementary grades, Rist (1970) observed the self-
fulfilling prophecy first-hand when children were placed into reading groups reflective of social

7
class and treated differently by the teacher, with subsequent effects on the children’s academic
achievement.
In a later study, Jussim, Eccles, and Madon (1996) studied self-fulfilling prophecies
among students from stigmatized demographic groups based on sex, race/ethnicity, and social
class. Although no significant effects were found based on sex, students from lower social class
backgrounds were more susceptible to self-fulfilling prophecies. Teachers’ expectations for low
achieving students from lower social class backgrounds produced a self-fulfilling prophecy
effect size of .60. Additionally, effect sizes based on teachers’ expectations for African
American students ranged from .40 to .60.
Using a subsample of 712 students (out of a total sample of 1,539 students) from the
Chicago Longitudinal Study, Gill and Reynolds (1999) also examined teachers’ expectations on
the achievement of low-income African American sixth graders. Parents and teachers were
asked to rate their expectations for students’ educational attainment, and students rated their
perceptions of both parents’ and teachers’ academic expectations. Prior achievement was
determined based on students’ third grade math and reading scores on the Iowa Tests of Basic
Skills (ITBS: Hoover, Hieronymus, Frisbie, & Dubar, 1993). Current reading and math
achievement was also assessed by the ITBS. The results of path analyses revealed that teachers’
expectations had the largest direct effect on both reading and math achievement (R2 = .32 and
.35, respectively; p < .01).
While results across studies are somewhat varied, the findings indicate that expectation
effects are likely to exist to some extent, most notably among marginalized or lower achieving
groups of students. However, the reviewed literature also suggests that teachers may just be
accurate predictors rather than potential “causers” of students’ academic achievement levels. An

8
extensive amount of research has been conducted on the predictive accuracy of teachers’
judgments.
Accuracy of teacher judgments. In a survey of literature on teacher-based judgments of
academic achievement, Hoge and Coladarci (1989) reviewed 16 published studies to determine
the overall match between teacher-based assessments of students’ achievement and objective
measures of students’ learning. In most of the reviewed studies, researchers employed
correlational analyses to assess the accuracy of teacher judgments while only a few researchers
examined the exact agreement between student performance and teacher judgments. Overall, the
results revealed moderate to strong correspondence between teacher judgments and student
achievement with correlations ranging from .28 to .92 (Mdn = .66).
Hoge and Coladarci (1989) suggested that the underlying variability in the results of the
reviewed studies may be due to notable differences between the studies. For example, nine of
the reviewed studies used indirect ratings or rankings of student achievement whereas the seven
remaining studies contained direct estimates of how students would perform on a specific
achievement test. Additionally, some studies used norm-referenced judgments whereas others
employed peer-independent judgments. Across studies, five different types of judgment
measures were used, each differing in level of judgment specificity (presented here in order from
lowest to highest specificity level): (a) rating of each student’s academic ability, (b) ranking
students according to academic ability, (c) estimating grade equivalents likely to be obtained on
a concurrently administered achievement test, (d) estimating the number of items a student
would get correct on an achievement test, and (e) estimating actual item responses or whether or
not a student would get a particular item correct on an achievement test.
9
In a follow-up to Hoge and Coladarci’s (1989) review, Demaray and Elliott (1998)
investigated the relationship between teachers’ judgments of students’ academic achievement
and actual performance on an academic achievement test, using both direct and indirect methods.
Participants were 12 teacher volunteers and their 47 randomly selected first through fourth grade
students (30 female and 17 male) from Wisconsin public schools. No information was provided
on the race/ethnicity of the participating students and teachers. Teachers completed the
Academic Competence scale from the Social Skills Rating System–Teacher Version (SSRS;
Gresham & Elliott, 1990) as well as a questionnaire specifically developed to measure teachers’
direct predictions of student performance on the Kaufman Test of Education Achievement –
Brief Form (K-TEA; Kaufman & Kaufman, 1985). Subsequently, students were administered
the K-TEA.
Pearson correlations and percent of agreements were used to investigate proposed
relationships. The results showed moderately strong correspondence between teacher
predictions (both direct and indirect) and actual student achievement, which were similar to
Hoge and Coladarci’s (1989) review of prior findings. Demaray and Elliott (1998) also found
moderately high (r = .70) correlations between indirect teacher ratings on the SSRS and actual
student performance on the K-TEA. Additionally, there was a mean 79% agreement between
teachers’ direct item predictions and students’ actual item performance.
Subsequent studies have also shown support for the predictive accuracy of teachers’
judgments. Alvidrez and Weinstein (1999) found that preschool teachers’ judgments of student
ability had a predictive relationship with students’ later high school performance. Additionally,
Hecht and Greenfield (2002) determined that teachers were able to accurately predict the future
reading ability of a sample of first grade students. Much of the previously summarized research

10
has compared teachers’ judgments/ratings with students’ performance on norm-referenced
measures of academic achievement. In contrast, Eckert, Dunn, Coding, Begeny, and Kleinmann
(2006) compared teacher ratings with students’ performance on Curriculum-Based Measurement
(CBM) probes, a more direct and curriculum-relevant estimate of students’ skill levels in math
and reading. Participants were 33 students (51.5% male) from two second-grade classrooms in
an elementary school in a Northeastern suburban school district. The mean age of the students
was 7.3 years and a majority (78.8%) of the students were Caucasian with the remaining students
classified as African American (18.2%) or Latino/Hispanic (3%). Almost 6% of the participants
received special education services and approximately 32% participated in Title I programming.
Teacher ratings were assessed through interviews and the creation of teacher reading and
mathematics assessment charts. On the charts, teachers were asked to rate students on five
reading grade levels (i.e., Grades 1-5) and four hierarchically arranged basic mathematics skills
involving addition and subtraction. During interviews, teachers were asked to estimate targeted
students’ reading and math abilities, including general skill, instructional level, and class-wide
comparisons of skills. Student participants were given specifically developed CBM reading and
math probes to assess their oral reading and math computational fluency.
Overall, the results of this study suggested that teachers were not consistently accurate in
assessing their students’ reading and math fluency. In general, correlations between judgments
of students’ instructional levels in reading and their actual reading performance ranged from
moderate (r = .59) to high (r = .83), whereas correlations between teachers’ judgments and math
CBM performance were low (ranging from .09 to .32). Specific analyses of patterns of
correspondence indicated that teachers often overestimated student performance in math as well
as performance on reading material that was at or below grade level.
11
While there is some variability in research findings on the accuracy of teachers’ academic
judgments and predictions, especially as related to using different types of measures to assess
students’ skills (i.e., norm-referenced versus CBM), existing research indicates that with some
exceptions, teachers are generally fairly accurate judges of their students’ academic skills.
However, the accuracy of such judgments may vary across academic domain and may also
decrease when certain variables are introduced into the prediction equation. In some of the
previous studies and others, researchers have explored intervening factors, which may have an
impact on teachers’ judgments and subsequently their expectations as well.
Potential influences on teacher judgments and expectations. In addition to examining
the accuracy of teachers’ judgments, researchers have also explored specific variables that have
been proposed to influence teachers’ perceptions or judgments of students’ academic potential or
achievement. Based on meta-analysis, Hoge and Coladarci (1989) suggested that differences
among teachers, student gender, subject matter, and student ability were potential moderating
variables. In another meta-analysis of 77 studies, Dusek and Joseph (1983) used Stouffer’s
(1949) method of adding z-scores to provide a summary of statistically significant influences on
teachers’ academic and social expectations and used Cohen’s (1977) d for effect size. Based on
these calculations, Dusek and Joseph concluded that student attractiveness, behavior/conduct,
race, and social class were also potentially related to teachers’ expectations.
Bennett, Gottesman, Rock, and Cerullo (1993) explored the possible influence of gender
and perceived student behavior on teachers’ judgments of academic skills. Participants in this
study were 794 regular education students, the entire student population in kindergarten through
second grade at three parochial schools in Cleveland, Ohio, and one public school in the Bronx,
New York. Approximately half of the participants were male, with 45% of the sample classified

12
as White, 33% African American, 21% Hispanic, and fewer than 1% classified as belonging to
other racial/ethnic minority groups. Participants were administered the Einstein Assessment of
School-Related Skills (Gottesman, Doino-Ingersoll, & Cerullo, 1990), a brief academic screener
consisting of five to seven subtests (depending on grade level): Arithmetic, Language-Cognition,
Auditory Memory, Visual-Motor Integration, Letter Recognition, Word Recognition, Oral
Reading, and Reading Comprehension. Behavioral perceptions were based on grades assigned to
behavior at the end of the term; academic judgments were report card grades and structured
ratings in relation to word recognition, reading comprehension, mathematics, handwriting, and
language. A path model was created to examine the relationship between tested academic skill,
gender, behavior grades, and teachers’ academic judgments.
Results indicated that across grades and schools, teachers’ perceptions of students’
behavior accounted for a significant amount of variance (i.e., R2 = .36 to .49) in their academic
judgments. Students who were perceived as exhibiting bad behaviors were also regarded as
weaker academically, regardless of their gender or actual measured academic skill. While
gender appeared to influence behavior perceptions, with girls consistently receiving higher
behavior grades than boys, no direct effect was found between gender and teachers’ academic
judgments.
This study contained some notable limitations, including considerable missing data for
behavior and academic grades in one of the school districts (approximately 40 to 45% of students
were missing data in these areas), and the use of measures limited in generalizability and scope.
Different criteria were used across districts for behavior and report card grades making
generalizability of teachers’ judgments difficult. Additionally, the range and degree of assessed
academic skills were limited, and there was a mismatch between measured academic skills and

13
teachers’ academic judgments. While the findings of this study suggest that variables do exist
that affect teachers’ judgments and expectations, these findings should be interpreted with
caution due to the methodological flaws.
Helwig, Anderson, and Tendal (2001) focused primarily on the potential influence of
gender, but also considered classroom behavior and effort. The purpose of the study was to
examine whether the accuracy of elementary school teachers’ predictions of math achievement
was influenced by gender (after controlling for effort and compliance with classroom rules). The
sample consisted of 15 third-grade and 14 fifth-grade teachers and their 512 students in six
public school districts in a western state. Teachers were given three 5-point Likert scale items to
rate students on math skill, amount of effort in math, and overall classroom behavior and
compliance with rules. Students were given computer-based multiple choice math and reading
tests designed by the Northwest Evaluation Association.
Contrary to what was hypothesized, results of correlation and regression analyses
revealed that gender was not a statistically significant contributor to teacher predictions of math
achievement. Instead, for both third and fifth graders, actual math and reading achievement test
scores, together with student effort, were statistically significant predictors of teachers’ ratings of
math achievement. When participants were divided according to educational setting (i.e., regular
education versus special education), the results of analyses were similar to those previously
stated. Overall, these results indicated that teachers did not make academic judgments primarily
based on gender, but instead focused on other more relevant factors (e.g., past performance).
Hecht and Greenfield (2002) further explored potential factors that influence teacher
judgments of their students’ academic ability. In this longitudinal study teachers predicted the
future (third grade) reading proficiency of students currently in first grade. The sample consisted

14
of 170 children from low socioeconomic status backgrounds who were part of a larger multi-site
study, the National Head Start/Public School Early Childhood Transition Demonstration Project
(Kagan & Neuman, 1998). Using specific scales from the Social Skills Rating System (SSRS;
Gresham & Elliott, 1990), teachers rated each child on academic competence and classroom
behavior in comparison to other children in the classroom. Additionally, various tests were used
to assess students’ print knowledge, phonemic awareness, word identification, receptive
vocabulary, and reading comprehension.
Using hierarchical regression analyses, Hecht and Greenfield (2002) examined the extent
to which first grade child characteristics (i.e., emergent literacy skills, classroom behavior, and
gender) were related to third grade reading skills; the extent to which first grade child
characteristics were related to teachers’ ratings of students’ reading skills; and finally, the extent
to which child characteristics accounted for associations between initial teacher ratings and later
reading outcomes. Results of the first set of hierarchical regression analyses indicated that
classroom behavior explained approximately 37% and 38% of the variance in later word reading
and reading comprehension skills, respectively. Independently, classroom behavior was not
found to substantially influence later reading acquisition. In the second set of analyses,
approximately 59% and 49% of the variability in teacher ratings was accounted for by emergent
literacy skills in first and third grade, respectively. Finally, while the predictive accuracy of
teachers’ ratings was almost entirely accounted for by students’ emergent literacy skills, gender
and classroom behavior appeared to act as extraneous child characteristics that may reduce the
accuracy of teacher judgments.
Other student characteristics have also been investigated in relation to teachers’
judgments and expectations, including physical attractiveness, name, and ethnicity. Tompkins

15
and Boor (1980) investigated whether students who were deemed more physically attractive or
had more popular first names were rated higher academically or socially. Forty-four male and
ninety-seven female student teachers were given a packet of information about a seventh grade
boy. All of the presented information remained the same except that the cases presented to each
participant contained pictures of students varying in attractiveness (attractive, unattractive, or no
picture) and first name popularity (popular first name, unpopular first name, or no name
indicated). After reading the presented information, participants were asked to rate the described
student on six academic attributes (intelligence, class standing, creativity, probability of learning
disabilities, level of future educational attainment, and severity of behavioral problems in class)
and five social attributes (popularity with peers, general personality, family socioeconomic
status, extent of participation in extracurricular club activities, and extent of participation in
sports). Tompkins and Boor (1980) reported that teachers rated students who were physically
attractive higher across all five social attributes whereas this same characteristic did not appear to
influence their ratings of academic attributes. Additionally, first name popularity was found to
have no effect on ratings of either social or academic attributes.
More recent research on the relationship between first names and teacher expectations
has indicated the opposite to be true. Anderson-Clark, Green, and Henley (2008) asked 130
elementary school teachers in a Dallas school district to rate academically-related behaviors
based on a presented vignette of a “typical” fifth grade student. Exactly half of the teachers in
the sample were African American while the other half was Caucasian. Teachers ranged in age
from 20 to 75 years (M = 40.3 years) and had a range of teaching experience from 6 months to
40 years (M = 12.5 years).

16
Each participant was presented with one of four versions of a brief description of a fifth
grade boy. The only notable difference between the four versions was the name (Xavier or
Ethan) and race (African American or Caucasian) of the identified student. (Names were chosen
based on popularity ratings of the local Social Security Administration). After reviewing the
presented description, participants were asked to complete the School Achievement Motivation
Rating Scale (SAMRS; Chiu, 1997), which consists of 15 five-point Likert scale items. Results
revealed a statistically significant main effect for teachers’ expectations based on student name,
while the effect for student ethnicity was not statistically significant. Teachers held more
negative expectations for the student with the African American sounding name, but did not hold
correspondingly negative expectations for the student actually designated as African American.
Additional analyses based on rater’s ethnicity, age, gender, and years of teaching experience
showed no statistically significant differences.
Unlike the previous study, Rubie-Davies, Hattie, and Hamilton (2006) found differences
in teachers’ expectations based on student ethnicity. In this study, 21 primary teachers from 12
schools in Auckland, New Zealand were surveyed in regards to 540 students, who were
classified as New Zealand European (n = 261), Pacific Islander (n = 97), Asian (n = 94), or
Maori (n = 88). Teachers were given two Likert-scale surveys, one at the beginning of the
school year and one at the end. In the first survey they were asked to indicate students’ expected
reading achievement at the end of the year while in the subsequent survey they were asked to
judge their students’ actual reading achievement. In addition to the teacher surveys, running
records of students’ oral reading were also reviewed.
A group (ethnicity) x time (beginning or end of school year) mixed model repeated
measures ANOVA was conducted. Results indicated statistically significant differences between

17
Maori students and all other ethnic groups. Even though Maori students’ achievement was not
below that of any other ethnic group at the beginning of the year, teachers had lower
expectations for Maori students’ achievement over time. In alignment with these lower
expectations, Maori students made the fewest academic gains as compared to the other ethnic
groups. As such, Rubie-Davies et al. (2006) suggest that ethnic stereotypes may lead to
sustaining teacher expectation effects, which results in altered teaching practices and student
opportunity to learn. These altered teaching practices in turn are likely to have an impact on the
amount of academic progress made by students for whom teachers have lowered expectations,
such as reported about the Maori.
While providing important information about what may influence teachers’ academic
judgments and expectations for students, one limitation of the summarized research is that the
primary source of measurement has been teacher self-report. There may be a difference between
what teachers report and how they actually behave. Hodson, Dovidio, and Gaertner (2002)
propose that a difference exists between what people know and believe is “right” versus how
they actually behave towards people who do not fit into their “in-group” (i.e., people of the same
ethnic and linguistic background who maintain similar beliefs and worldview).
In 1970, Kovel coined the term “aversive racism,” which refers to a subtle type of racial
bias rationalized by appeal to rules or stereotypes. The premise of the aversive racism theory
(Gaertner & Dovidio, 1986) is that negative evaluations of racial/ethnic minorities are realized
by a persistent avoidance of interaction with other racial and ethnic groups. Hodson, Dovidio,
and Gaertner (2002) further describe aversive racism as “socialization practices and normal
cognitive biases which form the basis of negative feelings that exist under the surface of
consciousness, conflicting with more deliberative, consciously-held beliefs regarding the positive

18
values of equality and justice among racial groups” (p. 2). This subtle form of bias may apply to
teachers and their expectations for students from typically stigmatized groups (e.g., ethnic and
language minorities or low SES students). That is, while teachers may be aware of the influence
their expectations have and believe that they should maintain and communicate high
expectations for all students, they may still unintentionally treat certain groups of children
differently based on subconsciously lower expectations.
While much of the more recent research on aversive racism has been conducted in the
laboratory, workplace, or a higher education institution (e.g., Dovidio, Gaertner, Kawakami, &
Hodson, 2002; Wolfe & Spencer, 1996), an early observational study conducted by Rist (1970)
provides what may be an illustration of this effect in an elementary school setting. Rist’s goal
was to “describe the manner in which inequalities imposed on children become manifest within
an urban ghetto school and the resultant differential educational experience for children from
dissimilar social class backgrounds” (p. 270). Data were collected through twice-weekly
observations of a single group of African American children in an urban school. Formal
observations were conducted throughout the children’s kindergarten year and then again during
the first half of their second grade year. Additionally, the children were observed four times
during their first grade year. Interviews were also conducted with the children’s kindergarten
and second grade teachers. Based on his observations, Rist argued that the children were placed
in reading groups that reflected social class and persisted through second grade. Additionally,
Rist noted that teachers consistently treated the groups differently, which ultimately influenced
children’s achievement.
In summary, general research on teachers’ academic judgments indicates moderate to
strong correlation (i.e., r = .50-.80) with actual academic outcomes. Research further suggests,

19
however, that the accuracy of teachers’ judgments is sometimes affected by extraneous variables,
such as gender (e.g., Hoge & Coladarci, 1989), student behavior (e.g., Bennett, Gottesman,
Rock, & Cerullo, 1993), socioeconomic status (e.g., Dusek & Joseph, 1983), physical
attractiveness (e.g., Tompkins & Boor, 1980), ethnicity (e.g., Rubie-Davies, Hattie, & Hamilton,
2006), and name (e.g., Anderson-Clark, Green, & Henley, 2008). It is important to further
investigate these and other variables and their effect on teachers’ judgments and expectations.
These investigations are especially important in light of the body of research on aversive racism,
which suggests the existence of contemporary subtle bias towards racial/ethnic minority groups.
Much of the research on teachers’ judgments and expectations has been conducted with
regular education English-speaking students. However, there is a growing body of literature that
focuses on the educational needs and outcomes of ELL students. Survey research exists which
investigates mainstream teachers’ perceptions of ELL students and the specific variables which
moderate these perceptions.
English Language Learners in Mainstream Classrooms
Research has been conducted on teachers’ perceptions of and expectations for
students who have limited English proficiency. Cummins (2001) suggests that teachers’
attitudes toward and perceptions of ELL students are especially important due to the potential
impact on student-teacher relationships and ultimately students’ achievement, which may be
undermined by struggles to fit in and learn a new language. Within the past 20 years, research
has gradually evolved that examines teachers’ perceptions and attitudes towards ELL students in
the mainstream classroom (e.g., Clair, 1993, 1995; Mantero & McVicker, 2006; Penfield, 1987;
Reeves, 2002, 2006; Vollmer, 2000; Youngs & Youngs, 2001). The focus of this line of
research has been not only on identifying teachers’ perceptions and attitudes towards ELL

20
students, but also investigating variables that might predict or influence these overall perceptions
and attitudes.
In 1987, Penfield administered an open-ended questionnaire to 162 New Jersey teachers,
who had ELL students in their classrooms. Eighty five percent of respondents taught grades K-8
and the remainder taught Grades 9-12. While the ELL students were reportedly from many
different countries, the majority were said to have originated from Taiwan, India, or Puerto Rico.
A majority of respondents (61%) suggested that the regular classroom was a better instructional
setting for ELL students than segregated classrooms. However, this integration was also noted as
problematic; for example, some statements reflected concern about the possible impact on non-
ELL students, such as slowing of their academic progress. Responses also indicated a general
belief that ELL instruction should primarily be the role of the ELL teacher, not the regular
education teacher. The most commonly noted frustration was the inability to communicate
effectively with ELL students and their parents. Additionally, more than half (54%) of the
respondents indicated an overall lack of knowledge on how to work with ELL students as well as
a need for more training and access to appropriate, adapted curricular materials. Other
comments reflected teachers’ perceptions of the stigmatization of ELL students and the tendency
of ELL students to stick together and to isolate themselves from their English-speaking peers.
Despite some limitations (e.g., lack of standardization and thus limited generalizability),
Penfield’s (1987) research reveals a sample of teacher perspectives, both positive and negative,
regarding ELL students in the mainstream classroom. Based on the results, Penfield makes some
broad recommendations, such as increased training for working with ELL students (including
coursework and inservice training) and increased cooperation and collaboration between ELL
and mainstream teachers.

21
Limited research was published immediately following Penfield’s (1987) study, but later
studies (Clair, 1993; Vollmer, 2000) have investigated mainstream teachers’ perceptions of ELL
students. Clair conducted a year-long qualitative study exploring the beliefs, self-reported
practices, and professional development needs of three mainstream classroom teachers (Grades
4, 5, and 10) with ELL students. Case histories were compiled based on transcripts of in-depth
interviews, notes from classroom observations, and entries from teachers’ and researcher
journals. In general, the three teachers reported not knowing much about their ELL students
beyond speculation of national origin and native language. To some extent all three teachers
erroneously believed that academic or social difficulties stemmed solely from internal factors
within the ELL student and thus these teachers tended to have unconsciously lower expectations
for these students. Additionally, all three teachers expressed beliefs about their ELL students’
cultural background based heavily on stereotypes and assumptions. Finally, while the three
teachers indicated their belief that ELL students were generally accepted by non-ELL peers,
there were some contradictory responses describing community prejudice and the stigma
attached to participating in an English as a Second Language (ESL) program.
Clair (1993) concluded that many of the beliefs held by the teachers interviewed were
based on hearsay and misinformation, and that their beliefs appeared to stem from individual
experience. All three teachers seemed to have minimal understanding of their ELL students and
tended to express the belief that solely internal factors cause academic and social difficulties,
while neglecting to consider important external factors, such as societal attitudes, political
structures, and acculturation patterns. In light of the role beliefs may play in shaping actual
behavior, Clair suggests that more education and staff development is needed to change teachers’
beliefs and their resulting instructional practices for working with ELL students.
22
In 2000, Vollmer examined teachers’ constructions of the “typical ESL student,” based
on data collected as part of a year-long ethnographic study in an urban, public high school. For
the purposes of the current study, Vollmer chose to examine a relatively new group of ELL
students, 17 Russian-speaking students from republics of the former Soviet Union. Responses
from seven semi-structured teacher interviews were analyzed as well as informal interactions and
unsolicited comments gathered from the same teachers throughout the year. Interview questions
focused on teachers’ perceptions of the “typical” ELL student, the fit of this image to the Russian
students, their perceptions of individual students, and teacher experiences with the students in the
classroom.
While Vollmer (2000) focused on a group of Russian students, the teachers who were
interviewed frequently compared this group of Russian students to ELL students of different
ethnic/racial backgrounds in the same high school. For example Vollmer’s critical discourse
analysis revealed that Russian students were frequently singled out for praise whereas other ELL
students in the school, including Chinese and Latino/a (primarily Mexican and Central
American) students, were often stigmatized. Teachers consistently described the Russian
students as bright, confident, assertive, and passionate. Additional comments highlighted the
Russian students’ unique individuality, level of communication, and interpersonal skills. In
general, Vollmer observed that the Russian students were frequently described as a distinct group
of second language learners with atypical characteristics as compared to other ELL groups.
Vollmer’s (2000) findings highlight some important implications. Most notably, this “atypical”
positive conceptualization of Russian students may be related to the general
perception/acceptance of Russians as White/European, whereas the “typical” ELL student (e.g.,
Asian or Latino/a) is viewed more conclusively as non-White. Overall, these findings support

23
the idea that teacher perceptions and expectations may differ between ethnic groups and perhaps
within groups as well.
While Clair’s (1993) and Vollmer’s (2000) ethnographic studies reveal valuable in-depth
information, one limitation of these studies is the small sample size and thus potential lack of
generalizability. Additionally, due to the qualitative nature of the studies, these results may be
interpreted somewhat differently. The next set of studies expands on these limitations by
including a larger sample size and using different measurement techniques (e.g., survey).
Youngs and Youngs (2001) investigated what influences teachers’ general perceptions of
ELL students by constructing a general model containing five categories of possible predictors:
(a) general educational experiences (i.e., the quantity, quality, and content of general coursework
completed); (b) specific ELL training, (c) direct personal contact with diverse cultures, (d) prior
contact with ELL students (including frequency, diversity, and intensity), and (e) demographic
characteristics (e.g., gender, ethnicity, and age). A survey was distributed to all teachers in three
middle/junior high schools in a U.S. Great Plains community; out of 224 distributed surveys, 143
usable surveys were returned. The sample of respondents was relatively balanced with respect to
gender, age, and grade level/subject taught.
Overall, the results supported a multi-predictor model of teacher attitudes with most
respondents reporting a neutral to slightly positive attitude toward teaching ELL students.
Youngs and Youngs (2001) suggested that most of the identified predictors (i.e., training to work
with ESL students, participation in a foreign language or multicultural class, living or teaching
outside of the United States, teaching humanities or social sciences versus more applied
disciplines, and interaction with a diverse population of ELL students) collectively represented a
teacher’s exposure to cultural diversity. Together, these predictors accounted for 26% of the

24
variance in teachers’ attitudes. The researchers conclude that it is collective exposure rather than
any one variable that leads to positive teacher attitudes towards ELL students in their classrooms.
Reeves (2002, 2006) created and piloted a survey instrument designed to gauge teachers’
agreement or disagreement with 16 Likert-scale items related to attitudes toward inclusion of
ELL students in mainstream classrooms. Other sections of the survey tapped the frequency of
teaching behaviors, open-ended responses about the benefits and challenges of ELL inclusion,
and demographic information about the participating teachers. Participants were 279 high school
teachers, primarily women (60.9%) and native-English speakers (98.2%), from a Southeastern
school district.
Results revealed that 72% of the surveyed teachers had a welcoming attitude toward
inclusion of ELL students in their classrooms. However, almost half of the respondents
indicated that not all students benefited from the inclusion of ELLs in mainstream classrooms
and that ELL students should not be mainstreamed until they had attained a minimal level of
English proficiency. While supportive of students using their native language at school, a
majority of the teachers indicated that English should be made the official language of the United
States and that ELL students should be able to learn English within two years of enrollment in a
U.S. school. More than half of respondents suggested that certain modifications (e.g., extended
time) were justifiable for ELL students; however, nearly 70% of surveyed teachers reported that
they did not have enough time to deal with the additional needs of ELL students. A majority of
the surveyed teachers indicated that they had not received sufficient training to work with ELL
students; however, only half of the teachers indicated interest in obtaining specialized ELL
training.

25
As Reeves (2006) pointed out, these findings illuminate a discrepancy between teachers’
general viewpoints toward ELL inclusion and their attitudes towards specific aspects of ELL
inclusion. In particular, some teachers appeared to have conceptions regarding second language
learning that have not been supported by research. Specifically, ELL students should be able to
acquire English within two years and that ELL students should avoid using their native language
because it interferes with the acquisition of English. While the amount of time needed to acquire
a second language has not been agreed on, some experts (e.g., Cummins, 1979; Thomas &
Collier, 1997) suggest that it can take more than seven years. Additionally, according to research
(e.g., Cummins, 1981; Krashen, 2003), continued first-language use can facilitate and improve
the development of second-language literacy.
Mantero and McVicker (2006) also investigated differences in the beliefs of mainstream
and ELL teachers in regard to middle school ELL students and second language learning.
Participants were 148 mainstream teachers and 12 ELL teachers from a sixth grade academy and
a middle school located in Atlanta, Georgia. Researchers used a modified survey designed by
Reeves (2002, 2006). Demographic information was also collected about general subject area
taught, years of teaching, gender, number of undergraduate and graduate course taken with an
ELL focus, and hours spent in professional development on ELL students.
Results of t-tests and ANOVAs showed a statistically significant difference between
mainstream and ELL teachers’ perceptions of ELL students in the regular education classroom;
ELL teachers indicated more positive perceptions than mainstream teachers. While ELL
teachers reported more positive perceptions, mainstream teachers were generally neutral rather
than negative. The number of years of teaching was found to be positively related to teacher
perceptions of ELL students, with the most positive perceptions expressed by teachers who had

26
between 6 and 10 years of teaching experience. Additionally, both ELL and mainstream teachers
who had taken more undergraduate coursework about working with ELL students had more
positive perceptions of this population. In regard to graduate studies, this finding was also true
for mainstream teachers, but not for ELL teachers. As such, it appears that the completion of
more coursework on the graduate level does not modify ELL teachers’ perceptions, which was
generally positive, regardless of number of courses taken. Finally, the more hours both types of
teachers spent in professional development, the more positive their perception of ELL students;
professional development experiences had a slightly greater impact on ELL teachers than
mainstream teachers. Mantero and McVicker (2006) concluded that it is imperative for teacher
education programs to incorporate courses that specifically address the learning needs of ELL
students. Not only does this increase teachers’ overall knowledge and awareness, but these types
of courses also appear to have a positive impact on how teachers perceive ELL students.
There appears to be some consistent trends across the studies reviewed. Over time
multicultural awareness among teachers has gradually increased with resultant changes in
viewpoints (in a positive direction), perhaps due to expanded educational opportunities and
increased experiences interacting and working with ELL students. However, researchers (e.g.,
Reeves, 2006) continue to note mainstream teachers’ overall lack of specific training for working
with this ever-growing population and suggest more training in this area. Recent studies
(Mantero & McVicker, 2006; Young & Youngs, 2001) suggest that increased training leads to
better awareness and knowledge, which ultimately facilitates more positive perceptions of ELL
students in general.
A major limitation of the extant literature on teachers’ perceptions of ELL students is the
broad grouping of all ELL students together. Vollmer (2000) notes that not all ELL students are

27
perceived equally and that teachers’ perceptions and expectations may differ significantly
depending on a student’s ethnic and/or cultural background. Future research needs to move
beyond this typical monolithic view of ELL students to more specific examinations of distinct
ELL groups and to focus on the nature of teacher perceptions about specific racial/ethnic
minorities, such as Mexicans or Puerto Ricans.
Perceptions of Language and Academic Competence
Some researchers have investigated teachers’ attitudes towards language and linguistic
diversity. In some cases there have been unfavorable attitudes toward bilingualism or the use of
languages other than English (e.g., Rueda & Garcia, 1996). It is possible that negative attitudes
toward other languages or lack of knowledge about second language development may influence
teachers’ judgments and expectations for ELL students.
Byrnes and Kiger (1994) developed the Language Attitudes of Teachers Scale (LATS) to
investigate 191 regular education teachers’ attitudes about linguistic diversity in a standardized
fashion. The scale is used to assess language politics (e.g., English as official language),
tolerance of ELL students in the regular classroom, and language support through teacher
training and more resources to provide better programs for ELL students. ANOVAs were
conducted to investigate the relationship of five specific teacher characteristics to teacher
attitudes toward language diversity: (a) previous experience with linguistically diverse students,
(b) formal training in second-language learning, (c) graduate education, (d) geographical region,
and (e) grade level taught. Results revealed that language attitudes differed with experience and
across region, with the most positive attitudes maintained by teachers from Arizona in
comparison to those in Utah and Virginia. Additionally, teachers who held a graduate degree or
had more formal training also had more positive language attitudes.
28
Edl, Jones, and Estell (2008) examined the teachers’ attitude about language proficiency
and ethnicity in relation to their ratings of students’ academic and interpersonal competence.
Participants were fourth grade students in seven schools from two suburban school districts in a
major Midwestern city; the final sample consisted of 703 European Americans (53.9% female)
and 172 Latino/a students (50.0% female) in regular classrooms and 99 Latino/a students (44.4%
female) in bilingual classrooms. Teachers rated students on the Interpersonal Competence Scale
–Teacher (ICS-T; Cairns, Leung, Gest, & Cairns, 1995), which contains six distinct subscales:
Aggression, Popularity, Academics, Affiliative, Olympian-like traits, and Internalizing.
Using discriminant function analyses at four different time points (fall and spring of
fourth and fifth grade), Edl et al. (2008) found that Latino/a students in bilingual classrooms
were consistently rated lower by teachers on several of the competence variables. In the fall of
fourth grade, three factors most strongly differentiated the groups: Popularity, Academic
Competence, and Olympian-like traits. Multivariate contrasts indicated that teachers rated
European American students in both regular and bilingual classrooms highest on Academic
Competence, followed by Latino/a students in regular classrooms; Latino/a students in bilingual
classrooms were rated as least academically competent. In contrast, for Popularity and
Olympian-like traits, all regular education students (both European American and Latino/a) were
rated similarly while Latino/as in bilingual classrooms were rated lower than their regular
classroom counterparts. Edl et al. (2008) suggest that language proficiency may influence
teacher ratings of competence more so than ethnicity.
Also, some of the variables that were determined to differentiate between the groups in
the fall of both years no longer distinguished the groups in the spring, suggesting that teacher
perceptions likely changed over time, perhaps based in part on more experience with and

29
knowledge of their students. While teacher ratings of Academic Competence continued to
distinguish between European American and Latino students in the spring of fourth grade,
ratings of Popularity no longer differentiated the groups.
The results of this study have important implications for educational practice. Edl et al.
(2008) highlight the need for school psychologists to be aware of the academic and social
challenges that ELL students face, indicating “a key component of this awareness is knowing
how teachers perceive them in relation to their European counterparts” (p. 43). Awareness of
specific challenges and the impact of culture, ethnicity, and language proficiency on ELL
students’ educational performance and social involvement will assist school professionals in
determining ways to better meet all students’ needs in accordance with recent educational
regulations.
Conclusions
In summary, findings vary somewhat, but research generally suggests that the self-
fulfilling prophecy can occur in the classroom, especially given certain conditions (Blease,
1983). The reviewed studies show that teachers’ expectations can influence student outcomes
(e.g., Hoge & Coladarci, 1989; Jussim, 1989; Jussim & Eccles, 1992) and furthermore that
stronger expectancy effects may exist for stigmatized groups (e.g., Gill & Reynolds, 1999;
Jussim, Eccles, & Madon, 1996). While research generally supports the predictive accuracy of
teachers’ judgments, several researchers (e.g., Bennett, Gottesman, Rock, & Cerullo, 1993;
Dusek & Joseph, 1983; Hoge & Coladarci, 1989) have found evidence for intervening factors,
which may influence teachers’ beliefs and expectations, such as student behavior (e.g., Bennett,
Gottesman, Rock, & Cerullo, 1993), gender (Hoge & Coladarci, 1989), race/ethnicity (e.g.,
Rubie-Davies, Hattie, & Hamilton, 2006), socioeconomic status (e.g., Dusek & Joseph, 1983),

30
physical attractiveness (e.g., Tompkins & Boor, 1980), and even names (e.g., Anderson-Clark,
Green, & Henley, 2008). Teachers’ expectations and behavior may even be influenced by a
subtle form of bias termed aversive racism (Kovel, 1970; Gaertner & Dovido, 1986), in which
individuals, such as teachers, have a tendency to unknowingly act in a discriminatory manner
towards those who are perceived as different.
Early in-depth ethnographic studies (e.g., Clair, 1993; Penfield, 1987) on teachers’
perceptions of ELL students showed a general lack of knowledge as well as the existence of
beliefs and practices based heavily on assumptions and stereotypes. More recent surveys (e.g.,
Mantero & McVicker, 2006; Youngs & Youngs 2001) of teachers’ perceptions of ELL students
show an overall increase in awareness and knowledge for working with these students, but the
general consensus continues to be that more education and training to work with ELL students is
needed (Reeves, 2006). In particular, efforts are needed to increase awareness of the possible
subtle biases which teachers may exhibit towards ELL students. To develop adequate, effective
training that increases teachers’ awareness and knowledge, more research is needed to further
investigate the proposed link between teachers’ perceptions, expectations, and outcomes for ELL
students.
Edl et al. (2008), in particular, provide fertile ground for future research. As noted by the
authors, there are several opportunities to expand based on their study’s limitations. First, while
their findings implicate that it is language proficiency more than ethnicity that influences
teachers’ perceptions, this contention has not been specifically investigated. They also noted that
the research was conducted in an area in which less than 20% of the students were of Latino/a
heritage. Communities with larger Latino/a or multicultural populations may present different
results. Additionally, Edl et al. grouped all Latino/a ELL students together. However, previous

31
research findings (e.g., Clair, 1993; Vollmer, 2000) suggest that not all ELL students are viewed
the same; further research is needed that focuses on teachers’ perceptions of specific groups of
ELL students.
Current Study
The purpose of the current study was to further examine the impact of English language
proficiency on teachers’ perceptions of ELL students’ competence by expanding on the
limitations noted in Edl et al.’s (2008) study. Edl et al. suggest that English language proficiency
may have a stronger influence than ethnicity on teachers’ ratings of ELL students. To investigate
this premise, both ethnicity and English language proficiency were included as variables in the
current study. Additionally, in the current study, the data examined were based on a larger
multicultural population across a wider geographical region. Finally, instead of considering ELL
students as a whole, the current study considered the national origin of students and their parents.
Research questions. Three research questions guided the study:
1. Do teachers’ perceptions of academic and interpersonal abilities differ for Spanish-
speaking ELL and English-speaking non-ELL students of the same (Hispanic non-
White) general ethnic background?
2. Do teachers’ perceptions of academic and interpersonal abilities differ for Spanish-
speaking ELL and English-speaking non-ELL students of different racial/ethnic
backgrounds (i.e., Hispanic, African American, and Caucasian)?
3. How accurate are teachers’ perceptions of ELL and non-ELL students’ academic and
interpersonal competence?
Hypotheses. Three hypotheses guided the study as well:
1. It is hypothesized that Spanish-speaking ELL students will be judged as having

32
weaker academic and interpersonal skills than their English-speaking non-ELL
counterparts of the same (Hispanic non-White) general ethnic background.
2. It is hypothesized that Spanish-speaking ELL students will be judged as having
weaker academic and interpersonal skills than their English-speaking non-ELL
counterparts of different racial/ethnic backgrounds.
3. It is hypothesized that teachers’ ratings would be more predictive of the academic
performance and interpersonal self-ratings of non-ELL versus ELL students.

33
METHOD
Overview
An archival data set was used for this study and was obtained from the Early Childhood
Longitudinal Study – Kindergarten Class of 1998-1999 (ECLS-K), a longitudinal data set
collected by the U.S. Department of Education. The ECLS-K contains data on 21,399 students, a
sample considered nationally representative of U.S. kindergarteners in 1998-1999. The children
in the ECLS-K came from both public and private schools and are considered representative of
diverse socioeconomic and racial/ethnic backgrounds. Data contained in the ECLS-K are
information about family, school, community, and individual factors associated with school
performance, as the focus of the ECLS-K study has been on children’s early school experiences
beginning with kindergarten and following these same children through middle school.
Participants
Participants were a sample of 260 third-grade students (133 boys, 127 girls) taken from
the ECLS-K database representative of the cohort of children who were in kindergarten in 1998–
99 or in first grade in 1999–2000, but were not necessarily representative of all third graders in
2001-02. This sample contained native English-speaking students as well as non-native English
speaking students, normally noted as English language learners (ELL). For the purposes of the
current study, ELL students were defined as students who spoke a language other than English in
the home per parent report and who also did not pass the English-proficiency screening test used
by the ECLS-K (the Oral Language Development Scale [OLDS]). The sample of ELL students
obtained scores on the OLDS ranging from 0 to 36 (M = 22.31, SD =10.99). Anything above a
36 was considered a passing score.

34
Four subsamples of 65 participants each were obtained from the ECLS-K: (a) ELL
students of Hispanic ethnicity (33 boys, 32 girls), (b) non-ELL students of Hispanic ethnicity (30
boys, 35 girls), (c) non-ELL Caucasian students (36 boys, 29 girls), and (d) non-ELL African
American students (34 boys, 31 females). Participants ranged in age from 8.75 to 9.75 years. In
accordance with the recommendations of ECLS-K staff (due to the oversampling of certain
groups of participants (including ELL students) and to correct for differential nonresponse as
well as students moving away over time), the ECLS-K data were weighted accordingly. While
the weighted data allowed for generalization of the findings beyond the sample, the weighting
significantly reduced the sample size (from 260 to 97) in the current study. In comparison to the
four equal subsamples of 65 students each in the unweighted sample, the weighted sample
contained the following: (a) 24 ELL students of Hispanic ethnicity, (b) 28 non-ELL students of
Hispanic ethnicity, (c) 17 non-ELL Caucasian students, and (d) 28 non-ELL African American
students. A summary of the demographic characteristics of the unweighted and weighted
samples of students are presented in Tables 1 and 2, respectively.
Participants also included 238 teachers from the ECLS-K study who provided ratings of
the students. (This number was reduced to 90 teachers when the sample was weighted).
Nineteen of these teachers provided ratings for 2 or 3 students. The teachers ranged in age from
24 to 62 years (M= 42.61; SD = 11.55) and years of teaching experience ranged from 1 to 35
years (M= 14.15; SD = 10.43). Information on the gender and race/ethnicity of teachers was not
available in the public-use dataset of the ECLS-K database. Further teacher characteristics, for
both the unweighted and weighted sample, are presented in Table 3. These characteristics
include teachers’ highest level of education, number of ESL training classes taken in college, and
whether or not teachers had obtained ESL certification.

35
Table 1
Demographic Characteristics of Unweighted Sample of Students (N = 260)
ELL Students Non-ELL Students Hispanic Hispanic African American Caucasian
Gender n % n % n % n % Total Male 33 50.8 30 46.2 34 52.3 36 55.4 133 Female 32 49.2 35 53.8 31 47.7 29 44.6 127 Age < 8.75 years 6 9.2 9 13.8 2 3.1 3 4.6 20 8.75 to < 9 years 18 27.7 16 24.6 14 21.5 14 21.5 62 9 to < 9.25 years 17 26.2 13 20.0 6 9.2 15 23.1 51 9.25 to < 9.5 years 13 20.0 15 23.1 23 35.4 13 20.0 64 9.5 to < 9.75 years 8 12.3 10 15.4 16 24.6 10 15.4 44 > 9.75 years 3 4.6 2 3.1 4 6.2 10 15.4 19 SES First Quintile 49 75.4 9 13.8 16 24.6 1 1.5 75 Second Quintile 9 13.8 16 24.6 17 26.2 10 15.4 52 Third Quintile 5 7.7 16 24.6 16 24.6 14 21.5 51 Fourth Quintile 1 1.5 15 23.1 11 16.9 14 21.5 41 Fifth Quintile 1 1.5 9 13.8 5 7.7 26 40.0 41 School Location Rural - - 14 21.5 13 20.0 16 24.6 43 Suburban 18 72.3 21 32.3 28 43.1 31 47.7 98 Urban 47 27.7 30 46.2 24 36.9 18 27.7 119 Mother’s Origin Not Applicable - - 3 4.6 4 6.2 1 1.5 8 United States 5 7.7 50 76.9 56 86.2 61 94.8 172 Bermuda - - - - 1 1.5 - - 1 Cuba - - 2 3.1 - - - - 2 Dominica - - 1 1.5 - - - - 1 Dominican Republic 1 1.5 - - - - - - 1 El Salvador 3 4.6 - - - - 1 1.5 4 France - - - - - - 1 1.5 1 Haiti - - - - 1 1.5 - - 1 Honduras 1 1.5 - - - - - - 1 Liberia - - - - 1 1.5 - - 1 Mexico 53 81.5 7 10.8 - - - - 60 Netherlands 1 1.5 - - - - - - 1 Nigeria - - - - 1 1.5 - - 1 Puerto Rico 1 1.5 1 1.5 - - - - 2 United Kingdom - - - - 1 1.5 - - 1 Venezuela - - - - - - 1 1.5 1 Vietnam - - 1 1.5 - - - - 1

36
Table 1 continued ELL Students Non-ELL Students
Hispanic Hispanic African American Caucasian Father’s Origin n % n % n % n % Total Not Applicable 14 21.5 11 16.9 23 35.4 5 7.7 53 United States 4 6.2 42 64.6 36 55.4 58 89.2 140 Bermuda - - - - 1 1.5 - - 1 Dominica - - 1 1.5 - - - - 1 El Salvador 1 1.5 - - - - - - 1 The Gambia - - - - 1 1.5 - - 1 Guatemala 1 1.5 - - - - - - 1 Haiti - - - - 1 1.5 - - 1 Honduras 1 1.5 - - - - - - 1 Hungary - - 1 1.5 - - - - 1 Italy - - - - - - 1 1.5 1 Jamaica - - - - 1 1.5 - - 1 Liberia - - - - 1 1.5 - - 1 Mayotte - - 1 1.5 - - - - 1 Mexico 43 66.2 6 9.2 - - - - 49 Nigeria - - - - 1 1.5 - - 1 Philippines - - 1 1.5 - - - - 1 Puerto Rico 1 1.5 2 3.1 - - - - 3 Switzerland - - - - - - 1 1.5 1 Mother’s Education Not Applicable - - 3 4.6 4 6.2 1 1.5 8 8th grade or below 20 30.8 - - 1 1.5 - - 21 9th to 12th grade 10 15.4 6 9.2 7 10.8 1 1.5 24 HS diploma 19 29.2 18 27.7 15 23.1 16 24.6 68 Vocational/Tech. 6 9.2 4 6.2 3 4.6 3 4.6 16 Some college 8 12.3 21 32.3 24 36.9 23 35.4 76 Bachelor’s degree 1 1.5 8 12.3 8 12.3 9 13.8 26 Some grad. School - - 2 3.1 2 3.1 2 3.1 6 Master’s degree - - 3 4.6 1 1.5 8 12.3 12 Doctorate 1 1.5 - - - - 2 3.1 3 Father’s Education Not Applicable 14 21.5 11 16.9 23 35.4 5 7.7 53 8th grade or below 20 30.8 - - - - - - 20 9th to 12th grade 7 10.8 4 6.2 7 10.8 2 3.1 20 HS diploma 11 16.9 24 36.9 15 23.1 15 23.1 65 Vocational/Tech. 3 4.6 1 1.5 4 6.2 4 6.2 12 Some college 8 12.3 15 23.1 10 15.4 10 15.4 43 Bachelor’s degree 1 1.5 6 9.2 2 3.1 14 21.5 23 Some grad. School - - - - 1 1.5 1 1.5 2 Master’s degree 1 1.5 4 6.2 3 4.6 8 12.3 16 Doctorate - - - - - - 6 9.2 6

37
Table 2 Demographic Characteristics of Weighted Sample of Students (N = 97)
ELL Students Non-ELL Students
Hispanic Hispanic African American Caucasian Gender n % n % n % n % Total Male 13 53.5 15 54.5 17 60.9 9 52.7 54 Female 11 46.5 13 45.5 11 39.1 8 47.3 43 Age < 8.75 years 3 11.6 3 11.8 0 1.5 1 3.0 7 8.75 to < 9 years 8 31.3 6 23.5 8 29.6 5 28.3 27 9 to < 9.25 years 5 20.1 7 26.4 1 4.8 3 18.8 16 9.25 to < 9.5 years 5 19.8 4 15.5 10 38.1 3 17.6 22 9.5 to < 9.75 years 3 13.5 5 19.7 6 20.4 3 18.8 17 > 9.75 years 1 3.7 1 3.1 2 5.7 2 17.6 6 SES First Quintile 17 71.4 8 29.8 6 21.6 0 1.4 31 Second Quintile 4 16.8 5 19.5 7 23.8 3 16.4 19 Third Quintile 2 10.1 5 18.9 8 28.5 4 24.1 19 Fourth Quintile 0 1.3 5 17.2 5 17.1 3 20.2 13 Fifth Quintile 0 0.3 4 14.5 2 8.9 6 37.9 12 School Location Rural - - 8 29.4 3 10.8 3 17.6 14 Suburban 6 26.8 8 30.7 11 38.8 6 37.5 31 Urban 18 73.2 11 39.8 14 50.4 7 42.8 50 Mother’s Origin Not Applicable - - 1 4.9 3 12.1 0 2.2 4 United States 1 4.5 22 78.8 21 77.1 16 91.8 60 Bermuda - - - - 0 0.7 - - 0 Cuba - - 1 4.6 - - - - 1 Dominica - - 0 .4 - - - - 0 Dominican Republic 0 1.8 - - - - - - 0 El Salvador 1 3.9 - - - - 1 4.1 2 France - - - - - - 0 0.9 0 Haiti - - - - 0 .3 - - 0 Honduras 0 1.2 - - - - - - 0 Mexico 20 84.6 2 6.0 - - - - 22 Liberia - - - - 0 .6 - - 0 Netherlands 1 2.9 - - - - - - 1 Nigeria - - - - 2 5.9 - - 2 Puerto Rico 0 1.0 1 5.0 - - - - 1 United Kingdom - - - - 1 3.3 - - 1 Venezuela - - - - - - 0 0.9 0 Vietnam - - 0 0.3 - - - - 0

38
Table 2 continued ELL Students Non-ELL Students
Hispanic Hispanic African American Caucasian Father’s Origin n % n % n % n % Total Not Applicable 6 25.2 7 25.9 10 35.2 1 7.2 24 United States 2 8.3 17 62.8 15 54.7 16 90.5 50 Bermuda - - - - 0 0.7 - - 0 Dominica - - 0 0.4 - - - - 0 El Salvador 0 1.2 - - - - - - 0 The Gambia - - - - 1 2.5 - - 1 Guatemala 0 1.2 - - - - - - 0 Haiti - - - - 0 0.3 - - 0 Honduras 0 1.2 - - - - - - 0 Hungary - - 1 1.9 - - - - 1 Italy - - - - - - 0 1.3 0 Jamaica - - - - 0 0.0 - - 0 Liberia - - - - 0 0.6 - - 0 Mayotte - - 0 .3 - - - - 0 Mexico 15 62.0 2 6.9 - - - - 17 Nigeria - - - - 2 5.9 - - 2 Philippines - - 0 0.4 - - - - 0 Puerto Rico 0 1.0 0 1.3 - - - - 0 Switzerland - - - - - - 0 0.9 0 Mother’s Education Not Applicable - - 1 4.9 3 12.1 0 1.4 4 8th grade or below 8 33.1 - - 0 1.2 - - 8 9th to 12th grade 3 12.2 7 26.4 3 10.1 0 1.4 6 HS diploma 7 30.6 6 22.0 8 27.5 4 26.1 25 Vocational/Tech. 3 12.7 0 1.7 3 10.6 1 8.6 7 Some college 2 9.8 7 26.2 7 25.4 5 28.3 21 Bachelor’s degree 0 0.3 4 14.1 3 11.3 3 15.1 10 Some grad. school - - 0 1.3 0 1.5 2 10.8 2 Master’s degree - - 1 3.4 0 .3 1 6.2 2 Doctorate 0 1.3 - - - - 0 2.0 0 Father’s Education Not Applicable 6 25.2 7 25.9 10 35.2 1 6.4 24 8th grade or below 7 29.2 - - - - - - 7 9th to 12th grade 2 8.5 4 13.3 4 14.6 1 3.4 11 HS diploma 4 16.3 8 29.3 5 17.7 3 20.0 20 Vocational/Tech. 2 6.7 0 0.7 2 7.6 1 5.8 5 Some college 3 13.4 5 16.8 4 15.7 3 16.3 15 Bachelor’s degree 0 0.4 2 6.6 0 1.6 6 34.2 8 Some grad. school - - - - 0 0.4 0 0.8 0 Master’s degree 0 0.3 2 7.3 2 7.1 1 8.3 5 Doctorate - - - - - - 1 4.8 1

39
Table 3
Demographic Characteristics of the Unweighted and Weighted Sample of Teachers
Unweighted (N = 238) Weighted (N = 90) n % n % Highest Educational Level Not Ascertained 2 0.8 1 1.5 Bachelor’s Degree 80 33.6 32 36.0 Bachelor’s Degree plus 1 year 69 29.0 24 26.3 Master’s Degree 72 30.3 26 29.2 Ed. Specialist/Prof. Diploma/ Doctorate
15
6.3
6
7.1
Teachers ESL Training Courses 0 166 69.8 63 70.5
1 19 8.0 6 7.0 2 8 3.4 5 5.6 3 16 6.7 6 6.5 4 7 2.9 2 2.4 5 4 1.7 2 1.7 6+ 18 7.6 6 6.3
ESL Certification Yes 41 17.2 15 16.8 No 197 82.7 75 83.2
Measures
Oral Language Development Scale (OLDS). The OLDS (Montgomery, 1997) was
developed specifically for use in the ECLS-K study to determine the English language
proficiency of students who speak a language other than English in the home. The OLDS
consists of a subset of tests taken from the Pre-Language Assessment Scales (Pre-LAS) 2000
(Duncan & DeAvila, 1998), which was designed to assess the English and Spanish language
proficiency and pre-literacy skills of early childhood learners (ages 4-6) and is one of the most
commonly used instruments to assess oral English language proficiency (Genesee, Lindholm-
Leary, Saunders, & Christian, 2006). Staff from the American Institutes for Research
recommended using the Pre-LAS 2000 on the basis of a literature search, advice from experts in

40
language minority assessment issues, and information from the departments of education in the
four states with the largest percentages of ELL individuals. The Pre-LAS 2000 was ultimately
chosen as the basis for the ECLS-K English language screener due to its widespread use and
acceptance for the targeted age group (K-1), content matching the ECLS-K requirements, and
similarity to the ECLS-K cognitive battery in format and administration procedures.
Edward De Avila, co-author of the Pre-LAS 2000, consulted with ECLS-K project staff
in selecting three of the six scales from the Pre-LAS 2000 to form the OLDS. The first subtest
chosen is “Simon Says,” which measures listening comprehension of directives presented in
English. This subtest consists of ten items, which are presented orally and direct the child to
follow a one-step command (e.g., touch your ear, pick up a piece of paper, or knock on the
table). Each item is scored 0 or 1 point depending on whether the child is able to follow the
given directive. The next subtest selected, “Art Show,” uses images to assess children’s naming
and descriptive vocabulary. This subtest also consists of ten items, which are scored on a 1-point
basis. Each item presents a picture to the child which he or she is to name, with one point given
for each correct response. The third and final subtest, “Let’s Tell Stories,” is used to obtain a
sample of a child’s natural speech by asking the child to retell a story read by the examiner. The
child reads two different stories (selected at random from three possibilities) and is asked to
retell it in his or her own words using pictures as prompts. The child’s version of the story is
evaluated based on the use of appropriate receptive and expressive language, sequencing, syntax,
complexity of sentence structure, and vocabulary. This subtest is scored 0 to 5 points for each
story and weighted at four times the items from the first 2 subtests resulting in a total of 60
points possible for the three OLDS subtests. Based on De Avila’s recommendation, 37 out of 60

41
points was determined as the minimal passing score. This score is based on the results of a
national norming sample for the Pre-LAS 2000, extrapolated to the three selected subtests.
Split-half reliability coefficients were found to be 96 or higher for the scores from each
administration of the English OLDS test. While limited research has been completed on the
psychometric properties and factor structure of the OLDS, research on the Pre-LAS 2000, the
basis for the OLDS, has provided some support for the factor structure and psychometric
strength of the measure. The concurrent and predictive validity of the Pre-LAS was investigated
with a sample kindergarten ELL students (Schrank, Fletcher, & Alvarado, 1996), in which a
significant and positive correlation (r = 0.91) was found among the oral subtest scores of the
original Pre-LAS and the Woodcock Language Proficiency Battery–Revised (WLPB-R;
Woodcock, 1991). A lesser yet still statistically significant correlation was found between scores
on the Pre-LAS and teacher ratings of English language proficiency (r = .74). Schrank et al. also
reported that correlations among the Pre-LAS subtests ranged from .55 to .93 (Mdn = .75).
Correlations between the subtests on the Pre-LAS and the WLPB-R subtests ranged from .36 to
.90, with the higher correlations suggesting similarity between what aspects of oral language
proficiency the subtests are measuring.
Direct cognitive assessments. The National Center for Education Statistics and
contractor staff assembled school curriculum specialists, teachers, and academicians to consult
on the design and development of the assessment instruments. The direct cognitive assessments
were created specifically for the ECLS-K study by this panel of experts and were based on
existing and commonly used commercial assessments, including the Peabody Individual
Achievement Test–Revised (Markwardt, 1989), the Peabody Picture Vocabulary Test-Revised
(Dunn & Dunn, 1981), the Primary Test of Cognitive Skills (Huttenlocher & Levine, 1990), the

42
Test of Early Reading Ability–Second Edition (Reid, Hresko, & Hammill, 1989), the Test of
Early Mathematics Ability–Second Edition (Ginsburg & Baroody, 1990), and the Woodcock-
Johnson Tests of Achievement–Revised (Woodcock & Bonner, 1989). The direct assessments
were derived from national and state standards, and designed to measure children’s knowledge in
various subject areas (reading, math, science, and general knowledge) at designated time points
as well as track children’s academic growth over time. These assessments were administered by
trained evaluators1 and were typically computer-assisted as the evaluators read questions from
and entered children’s responses into a computer program.
Prior to administering the direct child assessments, evaluators were trained in Los
Angeles, California in March of 2002 across 5 days. Two hundred sixty six assessors completed
the training, which included an overview of study activities, interactive lectures on the direct
child assessments and parent interviews, role-play scripts to practice parent interviews and direct
child assessments, precertification exercises on each form of the direct child domain
assessments, techniques for parent refusal avoidance, and strategies for building rapport with
children. The culmination of the child assessments training was a practice session administering
the cognitive assessment battery to children. Staff already certified on the child assessments
observed trainees during the practice administrations and gave feedback on performance using a
specially designed assessment certification form.
Pools of over 200 test items in each of the content domains (reading, mathematics, and
science) were developed by a team of educational specialists. Then curriculum specialists
reviewed test items for appropriateness of content and difficulty as well as sensitivity to
1 Information about specific evaluator demography (e.g., ethnicity/race, age, gender, educational level) was not available.

43
minority2 concerns. Items that passed screenings of content, construct, and sensitivity were pilot
tested. Evidence for the validity of the direct cognitive assessments was derived from several
sources, including a review of national and state performance standards, comparison with state
and commercial assessments, and the judgments of curriculum experts and teachers. The content
validity of the ECLS-K items was established by comparing the results of the ECLS-K with
scores on the Woodcock-McGrew-Werder Mini-Battery of Achievement (Woodcock, McGrew,
& Werder, 1994), which was also administered during the field test. Support for the construct
validity of the direct cognitive assessments was evidenced in the correlational patterns between
test scores both within and across rounds. The correlation between the third-grade reading and
mathematics scores was .73, which is relatively consistent with the correlations found in both the
kindergarten (.77) and first grade (.74) rounds of data collection (U.S. Department of Education,
2005).
The direct cognitive assessments were individually administered, two-stage adaptive
tests; that is, all students first took a routing test to determine what difficulty level should be
administered of the second-stage test form. Adaptive assessments were utilized to maximize the
accuracy of measurement and to minimize floor and ceiling effects. Some items overlapped
between the three different levels of forms to ensure a sufficient number of test items. A variety
of scores were obtained: (a) number of items answered correctly, (b) item response theory (IRT)
scale scores, (c) standardized scores (T scores), (d) item cluster scores, and (e) proficiency level
scores. For the purposes of this study, only standardized scores from the third-grade reading and
math assessments were analyzed. Reliability estimates and validity information for the scores
2 No elaboration was provided regarding the use of the term minority. It was not clear whether the term was used to define only racial/ethnic minorities or to reflect various diverse groups, who are not a numerical majority.

44
from the direct cognitive assessment as well as the results of factor analyses are summarized
below for each respective area.
Reading. The reading assessment was designed to measure basic skills, such as print
familiarity, letter identification, phonemic awareness, decoding skills, sight word recognition,
vocabulary knowledge, and passage comprehension. Passages used represent a variety of literary
genres, such as fiction, nonfiction, poetry, and letters. While the focus in the earlier grades was
on basic reading skills, greater emphasis was placed on reading comprehension by the third
grade. Five proficiency levels are contained within the third-grade reading assessment: (a) sight
word recognition, (b) passage comprehension, (c) literal inferences, (d) extrapolation or
identifying clues to make inferences, and (e) evaluation and application of narrative to real life
situations.
Internal consistency coefficients ranged from .75 to .84 for the scores obtained from the
reading assessment (U.S. Department of Education, 2005). Evidence for the construct validity of
the ECLS-K reading item pool was supported by its correlation in the mid-to upper .80 range
with the Kaufman Test of Educational Achievement (K-TEA; Kaufman & Kaufman 1985).
Additionally, there was a strong correlation between the reading scores on the Mini-Battery of
Achievement (Woodcock, McGrew, & Werder, 1994) and the IRT ability estimate (theta) from
the reading field test items (r = .83). Factor analyses suggested a single underlying factor for
reading as the percentage of variance accounted for by the first factor was more than four times
that accounted for by the potential second factor. Attempts to identify additional distinct factors
resulted in factors related to item difficulty, but not content (U. S. Department of Education,
2005), but no elaborations or examples were provided to clarify this conclusion.

45
Math. The math assessment was designed to measure both conceptual and procedural
knowledge of math as well as applied problem solving. Depending on grade-level, math content
included (a) number sense, properties, and operations; (b) measurement; (c) geometry and spatial
sense; (d) data analysis, statistics, and probability; and/or (e) patterns, algebra, and functions.
Proficiency levels within the third-grade math assessment involved (a) solving simple addition
and subtraction problems, (b) solving multiplication and division problems, (c) determining
place value, and (d) calculating rate and measurement. Internal consistency coefficients ranged
from .72 to .86 for scores obtained from the math assessment. The correlation between the math
scores on the Mini-Battery of Achievement and theta scores from the math field test items on the
ECLS-K was .84. Similar to the reading section, factor analyses also suggested a single factor
underlying math performance as the percentage of variance accounted for by the first factor was
more than six times the percentage of variance accounted for by the potential second factor (U.S.
Department of Education, 2005).
Self-Description Questionnaire (SDQ). The SDQ (Marsh, 1990) is a measure of
students’ perception about themselves in two major areas: (a) academic interest/competence and
(b) social competence. The SDQ also contains subscales, which are designed to assess targeted
problem behaviors (both externalizing and internalizing) that may interfere with academic and
social competence. The 42-item SDQ is divided into six subscales: Perceived
Interest/Competence in Reading (8 items), Perceived Interest/Competence in Math (8 items),
Perceived Interest/Competence in All Subjects (6 items), Perceived Interest/Competence in Peer
Relations (6 items), Externalizing Problems (6 items), and Internalizing Problems (8 items).
For the purposes of this study only the mean score for the Perceived Interest/Competence
in Peer Relations subscale was used. This subscale contains six items, which assess how easily

46
children make friends and get along with others as well as the perception of their popularity.
Specifically, students were asked to provide ratings on the following items: “I have lots of
friends,” “I make friends easily,” “I get along with kids easily,” “I am easy to like,” “Other kids
want me to be their friend,” and “I have more friends than most other kids.” On each of these
items children were asked to rate themselves using a 1 to 4 response scale: 1 (not at all true), 2
(a little bit true), 3 (mostly true), or 4 (very true). To avoid effects of reading ability on
responses, the items were read aloud to each child.
The internal consistency coefficient for the scores of third-graders’ ratings on the peer
relations subscale was .79 (U.S. Department of Education, 2005). Correlations of children’s self-
ratings on the SDQ with the other direct and indirect measures were low, ranging from .03 to .21
(U.S. Department of Education, 2005). This finding suggests that children use different criteria
than teachers when rating their academic competence and skills. Children’s ratings of social
competence (i.e., Peer Relations) were not included in these cross-correlational studies. No
rationale was provided for the exclusion of the children’s ratings.
Academic Rating Scale (ARS). The ARS (Atkins-Burnett, Meisels, & Correnti, 2000)
was developed for the ECLS-K to measure teachers’ evaluations of students’ academic
achievement in four domains: (a) literacy (reading and writing), (b) science, (c) social studies,
and (d) math. Furthermore, the ARS was designed to measure children’s skills within the same
broad curricular domains as the direct cognitive assessment and was intended to overlap and
supplement this information. Content experts familiar with the early grades and teachers from
both public and private schools and from different regions of the country reviewed proposed
items and made recommendations. Items were then piloted and tested in the field to gather
statistical evidence of the appropriateness of the items. For the purposes of the current study,

47
only overall teacher ratings from the literacy and math sections will be used. Ratings on all
items were made on a 5-point Likert scale: 1 = child has not yet demonstrated skill, 2 = child is
just beginning to demonstrate skill, but does so very inconsistently, 3 = child demonstrates skills
with some regularity, but varies in level of competence, 4 = child demonstrates skill with
increasing regularity and average competence, but is not completely proficient, and 5 = child
demonstrates skills consistently and competently. Teachers were also given the option of
selecting “not applicable” to indicate that the skill had not been introduced in the classroom.
The one-parameter item response theory (IRT) model (Rasch, 1960) was used to estimate
the scores on ARS. The resulting reliabilities for the scores of the scales were .95 for literacy
and .94 for math (U.S. Department of Education, 2005). Evidence for the discriminant and
convergent validity of the ARS items was based on correlations among thirteen scores from the
third grade measures, including four teacher ratings of children’s academic achievement (taken
from the ARS), three selected teacher ratings of children’s attitudes and behaviors (taken from
the SRS), three children’s self-ratings of achievement (taken from the SDQ), and direct cognitive
scores in the three subject areas assessed (reading, math, and science). No other validity
information was readily available and no factor structure information for either the literacy or
mathematics sections of the ARS was reported. Teachers’ ratings of students’ literacy and math
skills on the ARS correlated at .82.
Literacy. The literacy section of the ARS consists of eight items designed to assess a
student’s reading and writing abilities. Using the abovementioned 5-point Likert scale, teachers
are asked to rate each child’s proficiency in reading grade-level text, using strategies to gain
information, and expressing ideas through writing. The person reliability (analogous to
Cronbach’s alpha) was .95 for the scores from the literacy section. The correlation between
48
teachers’ ratings on the literacy section of the ARS and reading theta scores from the direct
cognitive measure was .65.
Math. The math section consists of nine items on which teachers rate each child’s skills
in the following areas: number concepts (e.g., place value, fractions, and estimation), data
analysis, measurement, basic operations, geometry, application of mathematical strategies, and
pattern analysis. The person reliability for the math scores was .94. The correlation between
teachers’ ratings on the math section of the ARS and math theta scores from the direct cognitive
measure was .59.
Social Rating Scale (SRS). The SRS (Atkins-Burnett, Meisels, & Correnti, 2000) is an
adaptation of the Social Skills Rating System (SSRS; Gresham & Elliot, 1990). The SRS
contains five subscales adapted from the original nine (Cooperation, Empathy, Assertion, Self-
Control, Responsibility, Externalizing Problems, Internalizing Problems, Hyperactivity, and
Academic Competence) of the SSRS. The first subscale of the SRS, Approaches to Learning,
measures behaviors that affect the ease with which children can benefit from the learning
environment, such as attentiveness, task persistence, eagerness to learn, learning independence,
flexibility, and organization. Self-Control assesses children’s ability to control their behavior by
respecting the property of others, managing anger, accepting peer ideas for group activities, and
responding appropriately to pressure from peers. Interpersonal Skills assesses children’s skills in
establishing and maintaining friendships, getting along with people who are different, responding
empathetically to or helping other children, appropriately expressing feelings and opinions, and
showing sensitivity to others’ feelings. Externalizing Problem Behaviors assesses “acting out”
behaviors such as arguing, fighting, disturbing others, and acting impulsively. Lastly,
Internalizing Problem Behaviors asks about the apparent presence of anxiety, loneliness, low

49
self-esteem, and sadness. On each SRS scale, third-grade teachers were asked to indicate how
often students exhibited the identified social skills and behaviors using a 4-point rating scale (1 =
never to 4 = very often).
Factor analyses (both exploratory analyses and confirmatory factor analyses using
LISREL) were used to confirm the SRS scales. Intercorrelations between the five SRS factors
ranged from .59 to.81 for third graders (U.S. Department of Education, 2002). No further
psychometric information or details about the strength of the evidence for the factor structure
was provided. However, results of studies examining the psychometric properties of the SSRS
on which the SRS is based have provided support for the proposed factor structure and internal
consistency of the SSRS scores. For example, Van der Oord et al. (2004) found a similar factor
structure to that found by Gresham and Elliot (1990). The phi coefficients for all subscales were
.78 or higher and coefficients of congruence for factors that were not proposed to be related were
all far below .80, ranging from .00 to .24. All internal consistency coefficients were above .76
with a mean alpha of .83 (range = .76 to .88).
Due to a pattern of SRS ratings in the third-grade round of data collection, suggesting a
strong positive correlation between interpersonal skills and self-control (r = .81), an additional
scale was created that combined all five items from the Interpersonal Skills scale and four items
from the Self-Control scale that were specifically related to control of emotions and behavior in
social interactions. The resulting Peer Relations scale was designed to comprehensively
represent a child’s overall skill in establishing and maintaining peer relationships. This newly
created Peer Relations scale was the only SRS scale used in the current study. The split-half
reliability coefficient for the scores on the Peer Relations scale was .92 (U.S. Department of
Education, 2005). Intercorrelations between teachers’ ratings on the Peer Relations subscale and

50
children’s’ ratings on the SDQ ranged from .03 to .12. However, only children’s ratings of
academic (not social) competence were compared.
Procedure
ECLS-K data collection. As indicated earlier, data were obtained from the third-grade
round of the ECLS-K public-use database. The ECLS-K third-grade data collection was
conducted in the fall and spring of the 2001–2002 school year. Several in-person training
sessions were conducted to prepare staff for the third-grade data collection. Data collection
contained the direct child assessments, parent interviews, teacher and school questionnaires,
student record abstract, and facilities checklist.
Self-administered questionnaires were used to gather information from teachers, school
administrators, and student records. Packets of hard-copy teacher and school administrator
questionnaires were assembled and mailed to schools in February 2002. Teachers and school
administrators were asked to either complete the questionnaires for pickup on assessment day, or
to return the questionnaires by mail in the enclosed postage-paid, self-addressed envelopes.
Teachers were specifically asked to complete a questionnaire consisting of three distinct parts.
The first section, Part A, asked about the teacher’s classroom and the characteristics of the
students, instructional activities and curricular focus, instructional practices in different subject
areas, and student evaluation methods. Part B included questions on school and staff activities
and the teacher’s views on teaching, the school environment, and overall school climate.
Background questions about the teachers were also included in this section. Lastly, teachers
were requested to complete one copy of Part C for each of the sampled children in their
classrooms. This part contained 39 questions about the child’s academic performance as well as
questions from the Social Rating Scale.
51
Direct child assessments were conducted from March through June 2002. These
assessments were conducted in 90-minute one-on-one sessions using both hard-copy instruments
and computer-assisted interviewing (e.g., interviewers read questions from and entered responses
into a computer program).
Data acquisition. The ECLS-K public-use data set is available for no fee on CD-ROM or
DVD from the Department of Education (Ed Pubs at http://edpubs.ed.gov). The CD-ROMs and
DVDs contain data files, electronic codebooks, user’s manuals, methodology reports, survey
instruments, and file record layouts. The ECLS-K public-use data are also available through an
online version of the electronic codebook called the EDAT system, which can be accessed at
http://nces.ed.gov/edat/. As the public-use data are made readily available to the public, no
additional authorization to use the data was required from the National Center for Education
Statistics - Institute of Education Sciences (NCES-IES). However, the researcher did attend a
three-day long training seminar to learn how to access and use the ECLS-K public-use data and
obtained a DVD with the data on it at that time. Additionally, approval was obtained from The
Pennsylvania State University’s Institutional Review Board (IRB) and Office of Research
Protections (ORP) to conduct the current study. This study was classified as exempt from further
review by the IRB and ORP as it was determined that it did not meet the definition of “human
participant research”.

52
RESULTS
Descriptive Statistics
Descriptive statistics, including means, standard deviations, ranges, reliability estimates
of the scores (on scales for which item-level data were available) and correlations, for the major
variables (teacher ratings, student ratings, and reading and math T scores) are presented in Table
4. All descriptive statistics were calculated based on the unweighted data. Statistically
significant correlations (p < .01) were found between students’ reading and math scores as well
as between teacher ratings of students’ literacy and math skills on the Academic Rating Scale
(ARS). Coefficients ranged from .38 to .48 (Mdn = .46). Teacher ratings of interpersonal skills
on the Social Rating Scale (SRS) were also statistically significantly correlated with teacher
ratings of literacy (r = .32) and math (r = .25), although the effect size for the latter correlation
was less than 10%. Additionally, teacher ratings of interpersonal skills on the SRS were
statistically significantly correlated with student T scores on the reading assessment (r = .19); the
effect size was less than 4%. For math, none of the correlations between the relevant variables
were statistically significant. Finally, no relationship was found between students’ self-
perceptions of their social competence and any other variable.
Descriptive statistics for the same variables are presented in Table 5 for Hispanic students
based on language status (ELL vs. non-ELL), and in Table 6 based on the race of monolingual
English speakers: Caucasian and African American students. Similar to the overall sample,
teacher ratings of students’ reading and math skills were statistically significantly correlated for
all of the subsamples, with coefficients ranging from .78 to .84 (Mdn = .82). Teacher ratings of
interpersonal skills were not statistically significantly correlated with teacher ratings of academic
skills for any of the non-ELL groups. However, there was a statistically significant correlation

53
Table 4
Descriptive Statistics for Teacher Ratings, Self-Ratings, and Reading and Math Assessment Scores for All Students (unweighted N = 260) Variable
1
2
3
4
5
6
M
SD
Range
α
Academic Rating Scale
.91
1. Literacy -- .81* .32* -.01 .45* .48* 3.23
.82
4.00 .85
2. Math
-- .25* .01 .38* .46* 3.00
.68 3.66 .86
Social Rating Scale
3. Interpersonal Skills
-- .03 .19* .14
3.00
.63 2.60 --
Self-Description Questionnaire
.83
4. Peer Relations
-- -.06 -.09 3.11 .64 3.00 .77
Direct Cognitive Assessment
5. Reading
-- .73* 48.34
9.94 52.84 --
6. Math
-- 48.49 9.73 52.11 --
Note. Reliability estimates of the scores could not be calculated for the Social Rating Scale and reading and math assessments due to the lack of access to item-level data. *p < .01. between teacher ratings of ELL students’ interpersonal skills and (a) reading (r = .35) and (b)
math (r = .29) skills; the effect size of the latter correlation was less than 10%. The pattern was
opposite between teacher ratings of reading and math skills, and students’ actual performance on
the reading and math assessments. For the racial/ethnic subsamples (Hispanic, Caucasian, and
African American) of non-ELL students, there were statistically significant correlations between
teachers’ academic ratings and student performance on the cognitive assessments, with

54
Table 5
Unweighted Descriptive Statistics for Teacher Ratings, Self-Ratings, and Reading and Math Assessment Scores for Students of Hispanic Ethnicity based on Language Status Variable
1
2
3
4
5
6
M
SD
Range
α
1. Literacy
--
.84*
.35*
.12
.16
.19
3.06
.88
3.68
.93
2. Math
.78* -- .29 .19 .13 .29 2.94 .75 3.66 .93
3. Interpersonal Skillsa
.30 .32 -- -.14 .25 .03 2.94 .59 2.20 --
4. Peer Relations
-.07 -.14 .06 -- .06 .07 3.07 .70 2.67 .76
5. Reading Assessmenta
.46 .40* .20 -.19 -- .40* 39.06 7.48 37.73 --
6. Math Assessmenta
.50 .62* .12 -.17 .64* -- 42.40 7.41 35.70 --
M
3.35 3.02 3.13 3.08 51.35 51.07
SD
.78 .56 .58 .58 7.63 8.49
Range
3.09 2.89 2.40 2.50 41.59 38.09
α .81 .78 -- .75 -- -- Note. Intercorrelations for ELL participants of Hispanic ethnicity (n = 65) are presented above the diagonal, and intercorrelations for non-ELL participants of Hispanic ethnicity (n = 65) are presented below the diagonal. Means, standard deviations, ranges, and Cronbach’s internal reliability coefficients (α) for ELL Hispanic students are presented in the vertical columns, and means, standard deviations, ranges, and reliability coefficients for non-ELL Hispanic students are presented in the horizontal rows. aReliability coefficients of the scores could not be calculated for the SRS, and reading and math assessments due to the lack of access to item-level data. * p < .01. coefficients ranging from .39 to .62 (Mdn = .50). In contrast, teachers’ academic ratings of ELL
students were not statistically significantly correlated with ELL students’ actual reading and
math scores. Additionally, a statistically significant relationship was not observed between
student and teacher ratings of interpersonal skills for any of the subsamples. Furthermore,

55
Table 6
Unweighted Descriptive Statistics for Teacher Ratings, Self-Ratings, and Reading and Math Assessment Scores for Non-ELL Students of Caucasian and African American Race Variable
1
2
3
4
5
6
M
SD
Range
α
1. Literacy
--
.80*
.24
-.07
.56*
.57*
3.50
.78
3.32
.88
2. Math
.83* -- .21 -.03 .48* .50* 3.24 .71 3.04 .88
3. Interpersonal Skillsa
.24 .12 -- .08 .10 .10 3.15 .60 2.00 --
4. Peer Relations
-.01 -.03 .19 -- -.07 -.02 3.09 .60 2.17 .85
5. Reading Assessmenta
.53* .49* -.06 -.16 -- .64 56.23 8.40 48.08 --
6. Math Assessmenta
.46* .39* -.08 -.24 .75 -- 55.54 9.09 49.46 --
M
3.02 2.93 2.77 3.20 46.72 44.94
SD
.76 .65 .69 .68 7.24 8.13
Range
4.00 3.45 2.60 3.00 34.03 39.08
α .81 .85 -- .76 -- -- Note. Intercorrelations for Caucasian participants (n = 65) are presented above the diagonal, and intercorrelations for African American participants (n = 65) are presented below the diagonal. Means, standard deviations, ranges, and Cronbach’s internal reliability coefficients (α) for Caucasian students are presented in the vertical columns, and means, standard deviations, ranges, and reliability coefficients for African American students are presented in the horizontal rows. aReliability coefficients of scores could not be calculated for the SRS, and reading and math assessments due to the lack of access to item-level data. * p < .01. student ratings of interpersonal competence were not statistically significantly correlated with
student scores on the reading and math assessments for any of the subgroups.
Preliminary Analyses
Preliminary analyses were also conducted using the unweighted data. One set of analyses

56
focused on whether the two sets of participants (ELL vs. non-ELL) differed based on various
demographic features, namely personal ones (age and gender), parent characteristics
(socioeconomic status and national origin), teacher characteristics (age, years of teaching
experience, educational level, and ESL training), and school features (school type and
geographical location). If any of these findings was statistically significant (p < .01), then
consideration was given to using the specific variable as a covariate in the major analyses.
Parametric assumptions for the major statistical analyses are reported as well.
Student variables. Preliminary analyses were conducted to assess whether the ELL and
non-ELL groups differed on the demographic variables of age and gender. All students were in
third grade and varied only slightly in age. The only available data for age of students were
categorized into six age groups based on months: (a) < 105 months, (b) 105 to < 108 months, (c)
108 to < 111 months, (d) 111 to < 114 months, (e) 114 to < 117 months, and (f) > 117 months.
A 2 (language status) x 6 (age group) contingency table analysis was conducted to determine if
the frequency of ELL and non-ELL students varied as a result of the age range. The finding was
not statistically significant, χ2 (5, N = 260) = 5.39, p = .37, Cramer’s V = .14. A 2 (language
status) x 2 (gender) chi-square analysis was also conducted and found not to be statistically
significant, χ2 (1, N = 260) = .01, p = .94, Cramer’s V .004. Thus, the number of ELL and non-
ELL students did not differ across the various age ranges or gender.
Other demographic variables. Based on prior literature (e.g., Montero & McVicker,
2006; Reeves, 2006; Youngs & Youngs, 2001), other potentially relevant variables were also
investigated to determine whether there were statistically significant differences between the two
language groups. These variables were socioeconomic status (SES); parents’ national origin;
teacher demographics, such as age, years of teaching experience, highest educational level, and

57
English as a Second Language (ESL) training and certification; and school characteristics, such
as school status (public or private) and geographical location (rural, suburban, or urban).
Parent variables. In the available dataset, SES had been categorized into five quintiles,
with the first quintile representing the lowest SES and the fifth quintile representing the highest
SES. A 2 (language status) x 5 (SES) contingency table analysis was conducted to determine
whether the frequency of the ELL and non-ELL students varied as a result of SES. The finding
was statistically significant, χ2 (4, N = 260) = 95.25, p < .01. The effect size was .61 (Cramer’s
V), which is considered to be a moderate effect (Cohen, 1992). More than five times the number
of ELL students (75.4%) fell into the first (lowest) quintile for SES in comparison to the non-
ELL students (13.3%). The opposite held true for the other end of the spectrum, with 41% of
non-ELL students falling into the upper (highest) two quintiles compared to only 3% of ELL
students. The percentage of students in each SES category by language status is presented in
Table 7.
Table 7
Frequency (Percentage) of ELL and Non-ELL Students by SES Level
First Quintile
(n = 75)
Second Quintile
(n = 52)
Third Quintile
(n = 51)
Fourth Quintile
(n = 41)
Fifth Quintile
(n = 41) ELL
75.4%
13.8%
7.7%
1.5%
1.5%
Non-ELL
13.3%
22.1%
23.6%
20.5%
20.5%
Note. Unweighted N = 260. The first quintile represents the lowest SES and the fifth quintile represents the highest SES.
Two 2-way contingency table analyses were conducted to determine whether the
frequency of language status differed due to parents’ national origin (one for mothers; the other

58
for fathers). However, the analysis could not be conducted because of the numerous (25)
countries represented by a small number of each parent (less than 5). Thus, national origin was
grouped into three categories based on the geographical location frequently reported: United
States, Mexico, and Other (e.g., Puerto Rico, El Salvador, Cuba).3 Subsequently, two 2
(language status) x 3 (national origin) contingency table analyses, one for each parent, were
conducted and statistically significant differences were found: mother’s country of origin, χ2 (2,
N = 260) = 176.04, p < .01, Cramer’s V = .82; father’s country of origin, χ2 (2, N = 260) =
127.66, p < .01, Cramer’s V = .70.
The frequency and percentages of ELL and non-ELL students by parents’ national origin
are presented in Table 8. A higher percent of both parents of non-ELL students (67.2%) were
born in the United States compared to the percent of parents of ELL students (6.9% of fathers
and 2% of mothers) born in the United States. In contrast, approximately 22% of the sampled
ELL fathers and 23% of ELL mothers were born in a country other than the United States
compared to only 3.8% of the sampled non-ELL fathers and 7.7% of non-ELL mothers.
Table 8
Unweighted Frequency (Percentage) of ELL and Non-ELL Students by Parent’s National Origin Mother’s National Origin Father’s National Origin
U.S. (n = 180)
Mexico (n = 60)
Other
(n = 20)
U.S.
(n = 193)
Mexico (n = 49)
Other
(n = 18) ELL
1.9%
20.5%
2.7%
6.9%
16.6%
5.4%
Non-ELL 67.2% 2.7% 5.0% 67.2% 2.3% 1.5%
3See Tables 1 and 2 for a complete listing of all represented countries.

59
Teacher variables. In regard to the teacher demographics, two independent t-tests were
conducted on age and teaching experience (years) based on students’ language status. Neither
finding was statistically significant, age (t = .51, p = .61); years of teaching experience (t = 1.40,
p = .16). Additionally, a two-way contingency analysis was conducted between students’
language status and teachers’ educational level. In the available dataset, teachers’ educational
level had been categorized into four groups: (a) Bachelor’s Degree, (b) At least one year beyond
Bachelor’s Degree, (c) Master’s Degree, or (d) Educational Specialist/Professional
Diploma/Doctorate. A 2 (language status) x 4 (educational level) contingency table analysis was
conducted and was found to be statistically significant, χ2 (3, N = 260) = 17.03, p = .002,
Cramer’s V = .26. A higher percent of teachers of non-ELL students had obtained a master’s
degree (32.3%) or higher (7.2%) compared to teachers of ELL students (18.5% and 1.5%,
respectively). The percent of ELL and non-ELL students taught by teachers’ educational level is
depicted in Table 9.
Table 9
Unweighted Frequency (Percentage) of ELL and Non-ELL Students by Teacher’s Level of
Education
Bachelor’s
Degree
At least one year beyond Bachelor’s
Degree
Master’s Degree
Ed. Specialist/ Prof. Diploma/
Doctorate (n =89) (n = 79) (n = 75) (n = 15)
ELL
30.8%
49.2%
18.5%
1.5%
Non-ELL
36.4%
24.1%
32.3%
7.2%
Note. N = 258 (Teacher’s level of education was not ascertained for two of the participants).
Two 2 x 2 chi-square analyses were conducted between language status and (a) whether
teachers had taken classes on ESL and (b) whether teachers had received ESL certification. Both

60
analyses were statistically significant, ESL Training, χ2 (1, N = 260) = 65.57, p = .000, Cramer’s
V = .55; ESL certification, χ2 (1, N = 260) = 66.91, p = .000, Cramer’s V = .51. Approximately
84% of teachers of ELL students had taken one or more ESL training classes compared to 22.8%
of teachers of non-ELL students. Additionally, 55% of teachers of ELL students had ESL
certification versus 7.9% of teachers of non-ELL students.
School variables. A final set of preliminary analyses were conducted to investigate
potential differences between the language status of students and two school characteristics: (a)
type of school (public versus private), and (b) geographical location of school (urban, suburban,
or rural). The two-way contingency table analysis was not statistically significant for type of
school, χ2 (1, N = 260) = 6.85, p = .033, Cramer’s V = .17, but was for the geographical location
of the school, χ2 (2, N = 260) = 28.42, p = .000, Cramer’s V = .34. As depicted in Table 10, the
number of non-ELL students was more evenly spread across the different types of school
locations compared to the ELL students. Approximately 72% percent of the ELL students
attended an urban school compared to 38% of the non-ELL students. In contrast, none (0%) of
the ELL students attended a rural school whereas 23% of the non-ELL students did. The
difference was less for suburban schools (28% of ELL students and 39% of non-ELL students).
Table 10
Unweighted Frequency (Percentage) of ELL and Non-ELL Students by School Location Urban
(n = 119) Suburban (n= 91)
Rural (n = 43)
ELL
72.3%
27.7%
0%
Non-ELL 38.3% 38.8% 22.9% Note. N = 253 (The school’s geographical location was not available for 7 of the participants).

61
Selection of covariates. Based on the findings of the preliminary analyses, two of the
previously investigated variables were selected to be used as covariates in the primary analyses
for the first two hypotheses. Two of the teacher characteristics, level of education and training to
work with ELL students, were used as covariates because of their potential relationship with
teacher judgments of ELL and non-ELL students’ academic and social skills. Additionally, in
the preliminary analyses these two variables were found to be statistically significantly different
across the ELL and non-ELL students, with more teachers of non-ELL students holding a more
advanced degree (e.g., Master’s or higher) and more teachers of ELL students having received at
least one ESL training class. Thus, teacher level of education and ESL training were included as
possible contributors to teachers’ academic and interpersonal judgments.
Statistical assumptions. The basic assumptions of multiple regression analysis
(normality, linearity, and homoscedasticity of residuals) were tested and met. Visual inspection
of histograms suggested normally distributed standardized residual values around the mean of
zero and normal P-P plots indicated little deviation of the observed values from the expected
values. Independence of errors was assumed because the Durbin-Watson statistic for each
analysis was within the recommended range of one to three (Field, 2000). Multicollinearity,
examined through the Variance Inflation Factor (VIF), was not present as the VIF values were
within the recommended range (Bowerman & O’Connell, 1990). For comparison purposes, all
subsequent analyses were conducted with both the unweighted and weighted data, and the
findings for both are presented and interpreted in the text and the tables.
Language Status and Teacher Perceptions
For Hypothesis I, teachers of Spanish-speaking ELL students of Hispanic ethnicity were
expected to judge them as having weaker academic and interpersonal skills than their English-

62
speaking non-ELL peers, also of Hispanic ethnicity. Three hierarchical regression analyses were
conducted to test this hypothesis with each analysis using a different outcome variable: (a)
teacher ratings of reading skills, (b) teacher ratings of math skills, and (c) teacher ratings of
interpersonal skills. In all analyses, two steps were used. In the first step, covariates were
entered and in the second step, the predictor variable, language status, was entered. Based on
preliminary analyses reported above, teacher’s level of education and ESL training were used as
covariates. Teacher’s level of education was dummy coded, with 0 representing a Bachelor’s
degree and 1 representing more than a Bachelor’s degree. The other covariate, teacher’s ESL
training, was dummy coded with 0 representing no ESL training and 1 representing some ESL
training. The predictor variable, language status, was dummy coded (0 for the non-ELL group; 1
for the ELL group). A summary of the regression analyses (unstandardized and standardized
regression coefficients, standard errors, t values, and the proportion of variance accounted for) is
reported for all three outcome variables in Table 11 for the unweighted data and Table 12 for the
weighted data.
Reading skills. Whether the data were weighted or not, the omnibus test was not
statistically significant for teacher judgments of students’ reading skills at any step: Unweighted
step 1: F (2, 129) = 1.02, p = .36, R2 = .016; step 2: F (3, 129) = 1.53, p = .21, R2 ∆ = .019;
Weighted step 1: F (2, 51) = .28, p =.75, R2 = .012; step 2: F (3, 51) = .19, p = .91, R2 ∆ = .000.
Less than 2% of the variance in teachers’ perceptions of students’ reading skills was accounted
for by the covariates of teacher’s level of education and ESL training. Above and beyond the
covariates, language status was not found to be a predictor of teachers’ judgments of student
reading skills, accounting for 0% (weighted) to less than 2% (unweighted) of the variance.

63
Table 11 Summary of Hierarchical Regression Analyses on Teacher Ratings of Reading, Math, and Interpersonal Skills based on Student’s Language Status and Teacher’s Education and ESL Training (Unweighted n =130)
Reading Skills Math Skills Interpersonal Skills Variable
B
SE B
β
t
B
SE B
β
t
B
SE B
β
t
Step 1
F (2, 129) = 1.02, p = .36
R2 = .016
F (2, 129) = .43, p = .65
R2 = .007
F (2, 129) = 1.82, p =.17
R2 = .028
Teacher Level of Education
-.01 .17 -.01 -.06 -.01 .13 -.01 -.04 -.11 .12 -.08 -.94
Teacher ESL Training -.21 .15 -.13 -1.43 -.11 .12 -.08 -.92 -.17 .10 -.14 -1.64 Step 2
F (3, 129) = 1.53, p = .21
R2 = .019
F (3, 129) = .32, p =.81
R2 = .001
F (3, 129) = 2.1, p = .10
R2 = .020
Teacher Level of Education
-.06
.17
-.03
-.33
-.01
.13
-.01
-.09
-.14
.12
-.11
-1.21
Teacher ESL Training
-.13 .16 -.07 -.79 -.09 .13 -.07 -.75 -.11 .11 -.09 -.99
Language Status
.25 .16 .15 1.59 .04 .13 .03 .32 .18 .11 .15 1.61
Note. R2Δ = R2 change. ELL = 65; Non-ELL = 65. Teacher level of education was dummy coded with 0 representing teachers who hold a Bachelor’s degree or less and 1 representing teacher who hold a Master’s degree or higher. Teacher ESL training was dummy coded with 0 representing teachers who hadn’t taken any ESL training classes and 1 representing teachers who have taken one or more ESL training class. ELL status was dummy coded with 0 representing the non-ELL group and 1 representing the ELL group. None of the findings were statistically significant at p < .01.

64
Table 12 Summary of Hierarchical Regression Analyses on Teachers’ Ratings of Reading, Math, and Interpersonal Skills based on Students’ Language Status and Teachers’ Education and ESL Training (Weighted n =52)
Reading Skills Math Skills Interpersonal Skills Variable
B
SE B
β
t
B
SE B
β
t
B
SE B
β
t
Step 1
F (2, 51) = .28, p =.75
R2 = .012
F (2, 51) = .32, p = .73
R2 = .013
F (2, 51) = .07, p = .94
R2 = .003
Teacher Level of Education
.09
.28
.05
.31
.02
.22
.01
.09
-.01
.18
-.01
-.06
Teacher ESL Training -.18 .25 -.11 -.73 -.16 .20 -.12 -.79 -.06 .16 -.05 -.34 Step 2
F (3, 51) = .19, p = .91
R2 = .000
F (3, 51) = .28, p = .84
R2 = .004
F (3, 51) = .27, p = .85
R2 = .014
Teacher Level of Education
.09
.29
.05
.31
.04
.23
.03
.19
-.05
.19
-.04
-.24
Teacher ESL Training
-.19 .28 -.11 -.67 -.20 .22 -.14 -.91 .01 .18 .01 .02
Language Status
-.01 .28 -.01 -.04 -.10 .22 -.07 -.46 .15 .18 .13 .83
Note. R2Δ = R2 change. The sample size was reduced from 130 to 52 when the data were weighted. Teacher level of education was dummy coded with 0 representing teachers who hold a Bachelor’s degree or less and 1 representing teacher who hold a Master’s degree or higher. Teacher ESL training was dummy coded with 0 representing teachers who hadn’t taken any ESL training classes and 1 representing teachers who have taken one or more ESL training class. ELL status was dummy coded with 0 representing the non-ELL group and 1 representing the ELL group. None of the findings were statistically significant at p < .01.

65
Math skills. The omnibus test for teacher judgments of student math skills for both the
weighted and unweighted data was not statistically significant at either step, Unweighted step 1:
F (2, 129) = .43, p = .65, R2 = .013; step 2: F (3, 129) = .32, p = .81, R2 ∆ = .001; Weighted step
1: F (2, 51) = .32, p = .73, R2 = .013; step 2: F (3, 51) = .28, p = .84, R2 ∆ = .004.
Approximately 1% (weighted) or less (unweighted) of the variance in teachers’ perceptions of
students’ math skills was accounted for by the teacher covariates, level of education and ESL
training. Language status accounted for less than 1% of the variance in the teachers’ ratings of
math skills.
Interpersonal skills. The omnibus test for teacher judgments of student interpersonal
skills was also not statistically significant for either the unweighted or weighted data,
Unweighted step 1: F (2, 129) = 1.82, p = .17, R2 = .028; step 2: F (3, 129) = 2.1, p = .10, R2 ∆ =
.020; Weighted step 1: F (2, 51) = .07, p = .94, R2 = .003; step 2: F (3, 51) = .27, p = .85, R2 ∆ =
.014. The covariates of teacher level of education and teacher ESL training were not statistically
significant contributors to teacher predictions of interpersonal skills, with the effect sizes ranging
between less than 1% (weighted) to less than 3% (unweighted). Furthermore, after controlling
for the covariates, language status was not a statistically significant predictor of teacher
judgments of interpersonal skills, contributing only 1% (weighted) to 2% (unweighted) of the
variance.
Language Status and Teacher Perceptions across Racial/Ethnic Groups
For Hypothesis II, it was proposed that teachers would rate ELL students as having
weaker academic and interpersonal skills in comparison to non-ELL students, regardless of the
ethnic/racial background of the non-ELL students (Hispanic, Caucasian, or African American).
Three standard multiple regression analyses were conducted to test this hypothesis, with teacher

66
ratings as the outcome variables: (a) reading, (b) math, and (c) interpersonal skills. Participants
were divided into four groups based on language status and race/ethnicity: (a) ELL Hispanic, (b)
non-ELL Hispanic, (c) non-ELL Caucasian, and (d) non-ELL African American. This combined
language/race variable was coded (with three resulting contrasts) and entered as the predictor
variable. The first contrast examined potential differences between teacher ratings of the non-
ELL African American students and the non-ELL Hispanic students. The second contrast
compared non-ELL Caucasian students to both non-ELL Hispanic and non-ELL African
American students. The final contrast considered the comparison between the ELL Hispanic
students and all three non-ELL groups (Hispanic, African American, and Caucasian). Teacher
level of education (dummy coded with 0 representing Bachelor’s degree and 1 representing
Master’s degree or higher) and teacher ESL training (dummy coded with 0 representing no ESL
training and 1 representing some ESL training) were included as covariates in these analyses.
These two covariates were entered in the first step of the regression analyses and the three
contrast variables for the predictor were entered into the second step of the regression analyses.
Unweighted analyses. The results for the unweighted data, including unstandardized and
standardized regression coefficients, standard errors, t values, and the proportion of variance
accounted for (R2 and R2 change) by the two covariates and the combined language/race variable
for all three outcome variables are reported in Table 13. For the analyses investigating teacher
ratings of math skills, the omnibus test for the unweighted teacher covariates was statistically
nonsignificant for the first step, F (2, 257) = 1.67, p = .19, R2 = .013). Additionally, the omnibus
test was statistically nonsignificant at the second step, F (5, 257) = 1.87, p = .10, R2 ∆ = .036),
suggesting that above and beyond the teacher covariates, race/ethnicity of the students was not a
predictor of teacher ratings of students’ math skills.

67
Table 13 Summary of Regression Analyses for the Prediction of Teacher Ratings of Reading, Math, and Interpersonal Skills for Students Grouped by Language Status and Race/Ethnicity (Unweighted N = 260)
Reading Skills Math Skills Interpersonal Skills Variable
B
SE B
β
t
B
SE B
β
t
B
SE B
β
t
Step 1 R2 = .021 R2 = .013 R2 = .000 Teacher Level of Education
.21
.11
.12
1.92
.10
.09
.07
1.12
-.01
.08
-.01
-.11
Teacher ESL Training -.15 .11 -.09 -1.39 -.13 .09 -.09 -1.46 -.01 .08 -.01 -.03 Step 2 R2 = .047 R2 = .023 R2 = .059 Teacher Level of Education
.17
.11
.10
1.53
.07
.09
.05
.78
-.03
.08
-.03
-.40
Teacher ESL Training
-.13 .13 -.07 -.97 -.10 .11 -.07 -.94 -.01 .10 -.01 -.04
Language Status and Race/Ethnicity (C1) Non-ELL Minority (C2) Caucasian (C3) ELL
-.19 .09
-.03
.07 .04 .03
-.16 .13
-.07
-2.54*
2.15
-.91
-.06 .08
-.01
.06 .04 .03
-.06 .14
-.03
-.91
2.21
-.41
-.18 .06
-.02
.06
.03
.03
-.20
.12
-.06
-3.21*
1.99
-.77 Note. R2Δ = R2 change. The predictor variable was divided into four equal groups (n =65 for each group): ELL Hispanic, non-ELL Hispanic, non-ELL African American, and non-ELL Caucasian. Three contrasts were created: contrast 1 (C1) = non-ELL African American vs. non-ELL Hispanic; contrast 2 (C2) = non-ELL Caucasian vs. non-ELL Hispanic and African American; and contrast 3 (C3) = ELL Hispanic vs. non-ELL Hispanic, African American, and Caucasian. Teacher level of education was dummy coded with 0 representing a Bachelor’s degree or less and 1 representing a Master’s degree or higher. Teacher ESL training was dummy coded with 0 representing teachers who hadn’t taken any ESL training classes and 1 representing teachers who have taken one or more ESL training class. *p < .01

68
The omnibus test for the unweighted teacher covariates was also nonsignificant at the
first step for teacher ratings of reading skills, F (2, 257) = 2.78, p = .06, R2 = .021). However, the
omnibus test was statistically significant at the second step, F (5, 257) = 3.69, p < .01, R2 ∆ =
.047), suggesting that, above and beyond teacher covariates (level of education and ESL
training), the race/ethnicity of the student was a predictor of teachers’ ratings of students’
reading skills. An examination of the contrast variables revealed that teachers rated non-ELL
African American students more negatively than their non-ELL Hispanic counterparts on reading
skills (t = -2.54, p < .01, semipartial r = -.16). As noted in Table 13, the second contrast between
non-ELL Caucasian and the other two non-ELL groups (Hispanic and African American), and
the third contrast between all three non-ELL groups (Hispanic, African American, and
Caucasian) and the ELL Hispanic group, were both statistically nonsignificant.
The omnibus test for teacher ratings of interpersonal skills was also statistically
nonsignificant for teacher covariates at the first step, F (2, 257) = .01, p = .99, R2 = .000), but
statistically significant at the second step F (5, 257) = 3.18, p < .01, R2 ∆ = .059). This finding
indicated that teachers’ level of education and teachers’ ESL training were not predictors of
teacher judgments, but that race/ethnicity of students was a predictor of teachers’ interpersonal
ratings of students. An examination of the contrast variables revealed higher negative ratings of
the interpersonal skills of non-ELL African American students than their non-ELL Hispanic
counterparts (t = -3.21, p < .01, semipartial r = -.20). The second and third racial/ethnic contrasts
were statistically nonsignificant for these analyses.
Weighted analyses. The results of analyses conducted with the weighted data were all
statistically nonsignificant, including the covariates. The only weighted analysis that came close
to statistical significance was the contrast between non-ELL Hispanic students and non-ELL

69
African American students in predicting teacher ratings of interpersonal skills (t = -2.27, p = .03,
semipartial r = -.23). The complete results of the regression analyses for the weighted data are
presented in Table 14.
Additional Analyses: SES, Mother’s National Origin, and School Location
Based on prior literature (e.g., Montero & McVicker, 2006; Reeves, 2006; Youngs &
Youngs, 2001), and the findings of preliminary analyses reported above (see pp. 54-59),
additional analyses were conducted to investigate how the various characteristics of the student,
parent, and school location were related to teachers’ academic and interpersonal judgments of
ELL and non-ELL students. The variables examined were SES, mother’s national origin, and
the school’s geographical location. These variables were chosen based on the preliminary
findings that SES, national origin, and school location were statistically significantly different
across the ELL and non-ELL groups. Because the aim of these analyses was solely to
investigate differences based on language status and not race/ethnicity, the subsample of just
ELL and non-ELL Hispanic students (n = 130) was used for these analyses. Nine 2-way
ANOVAs were conducted to investigate the nature of the relationship between each
demographic variable (SES, mother’s national origin, and school location) and language status
(ELL versus non-ELL) on each of the teacher ratings of students’ reading, math, and
interpersonal skills.
Assumptions. Visual examination of P-P plots indicated minimal deviation of the
observed values from the expected values, suggesting that the data met the assumption of
univariate normality. Homogeneity of variance was investigated through Levene’s Test of
Equality. For each analysis, the Levene’s test was not statistically significant (p = .05). Results
of the additional analyses are presented in Table 15 (unweighted) and Table 16 (weighted).

70
Table 14 Summary of Regression Analyses for the Prediction of Teacher Ratings of Reading, Math, and Interpersonal Skills for Students Grouped by Language Status and Race/Ethnicity (Weighted n = 97)
Reading Skills Math Skills Interpersonal Skills Variable
B
SE B
β
t
B
SE B
Β
t
B
SE B
β
t
Step 1 R2 = .049 R2 = .036 R2 = .006 Teacher Level of Education
.35
.19
.19
1.84
.20
.16
.13
1.26
-.05
.14
-.04
-.34
Teacher ESL Training -.24 .19 -.13 -1.25 -.23 .16 -.15 -1.43 .10 .14 .07 .69 Step 2 R2 = .010 R2 = .020 R2 = .082 Teacher Level of Education
.32
.20
.17
1.58
.17
.17
.11
1.01
-.08
.14
-.06
-.53
Teacher ESL Training
-.23 .25 -.12 -.93 -.22 .20 -.14 -1.08 .06 .17 .04 .34
Language Status and Race/Ethnicity (C1) Non-ELL Minority (C2) Caucasian (C3) ELL
-.01 .08
-.01
.13 .08 .07
-.01 .10
-.01
-.08 .97
-.07
.02 .09 .01
.11 .07 .05
.02 .14 .01
.18
1.33 .06
-.20 .09
-.02
.09
.06
.05
-.24
.16
-.04
-2.27
1.52
-.33 Note. R2Δ = R2 change. The sample size was reduced from 260 to 97 when the data were weighted. The predictor variable was divided into four groups: ELL Hispanic (n = 24), non-ELL Hispanic (n = 28), non-ELL African American (n = 28), and non-ELL Caucasian (n = 17). Three contrasts were created: contrast 1 (C1) = non-ELL African American vs. non-ELL Hispanic; contrast 2 (C2) = non-ELL Caucasian vs. non-ELL Hispanic and African American; and contrast 3 (C3) = ELL Hispanic vs. non-ELL Hispanic, African American, and Caucasian. Teacher level of education was dummy coded with 0 representing a Bachelor’s degree or less and 1 representing a Master’s degree or higher. Teacher ESL training was dummy coded with 0 representing teachers who hadn’t taken any ESL training classes and 1 representing teachers who have taken one or more ESL training class. *p < .01

71
Table 15
Summary of ANOVA for Teacher Ratings of Reading, Math, and Interpersonal Skills based on SES, National Origin, and School Location (Unweighted n =130) Reading Skills Math Skills Interpersonal Skills df F p ηρ2 df F p ηρ2 df F p ηρ2
SES
A. Language Status
1 .52 .47 .004 1 .39 .54 .003 1 .03 .87 .000
B. SES
4 2.08 .09 .065 4 .91 .46 .029 4 1.40 .24 .044
Interaction (A x B)
4 2.24 .07 .070 4 .79 .53 .026 4 .42 .80 .014
Error (Within Groups)
120 120 120
Mother’s National Origin
A. Language Status
1 .83 .36 .007 1 .08 .78 .001 1 .54 .21 .012
B. National Origin
1 .07 .79 .001 1 .01 .94 .000 1 .01 .88 .000
Interaction (A x B)
1 .92 .34 .007 1 .17 .68 .001 1 .03 .76 .001
Error (Within Groups)
126 126 126
School Location A. Language Status
1 6.82 .01 .052 1 1.73 .19 .014 1 2.79 .10 .022
B. School Location
2 1.54 .21 .036 2 1.08 .36 .026 2 .48 .70 .012
Interaction (A x B)
2 .12 .73 .001 2 .73 .40 .006 2 .25 .62 .002
Error (Within Groups)
124 124 124
Note. ηρ2 = partial eta squared.
Socioeconomic status. Three 2 (language status) by 5 (SES) ANOVAs were conducted
to examine the effect of language status and SES (categorized into five levels) on teacher
judgments of students’ academic and interpersonal skills. None of the analyses for both the
unweighted and weighted data were statistically significant for any of the outcome variables.

72
Table 16 Summary of ANOVA for Teacher Ratings of Reading, Math, and Interpersonal Skills based on SES, National Origin, and School Location (Weighted n = 26) Reading Skills Math Skills Interpersonal Skills df F p ηρ2 df F p ηρ2 df F p ηρ2
SES
A. Language Status
1 .75 .40 .040 1 1.47 .24 .075 1 .32 .58 .018
B. SES
4 1.01 .43 .184 4 1.80 .17 .285 4 .98 .44 .179
Interaction (A x B)
2 .14 .87 .016 2 1.50 .25 .143 2 .11 .90 .012
Error (Within Groups)
18 18 18
Mother’s National Origin
A. Language Status
1 .15 .70 .006 1 .16 .69 .007 1 1.36 .26 .056
B. National Origin
1 .45 .51 .019 1 .49 .49 .021 1 3.02 .10 .116
Interaction (A x B)
0 -- -- .000 0 -- -- .000 0 -- -- .000
Error (Within Groups)
23 23
School Location A. Language Status
1 .76 .39 .037 1 .09 .76 .005 1 .06 .81 .003
B. School Location
2 1.60 .22 .193 2 .46 .71 .064 2 .27 .84 .039
Interaction (A x B)
1 1.09 .31 .051 1 .44 .52 .021 1 1.39 .25 .065
Error (Within Groups)
20 20 20
Note. ηρ2 = partial eta squared.
National origin of mother. For the additional analyses, mother’s national origin
(country) was recoded further into two groups, United States (n =58) and Other (n = 72). Similar
to the results for SES, the results of three 2 (language status) by 2 (mother’s national origin)
ANOVAs revealed no statistically significant effects between mother’s national origin and
language status for any of the outcome variables.

73
School location. Three 2 (language status) by 3 (school location) ANOVAs were
conducted to investigate the potential relationship of school location to teacher judgments of
ELL and non-ELL students. Schools were classified as rural (n = 14), suburban (n = 39), or
urban (n = 77). Again none of the effects were statistically significant for either the unweighted
or weighted data.
Teacher Ratings as Predictors of Student Performance
Hypothesis III was that teachers’ ratings of academic and interpersonal competence were
expected to be more predictive of non-ELL students’ actual performance and self-ratings in
comparison to teacher ratings of ELL students. Three hierarchical regression analyses were
conducted with the entire sample (unweighted N = 260) to investigate this hypothesis. Each
analysis was conducted on a different student outcome variable: (a) actual reading scores, (b)
actual math scores, and (c) self-ratings of interpersonal skills. Based on the findings of
preliminary analyses, five covariates were entered into the first step: SES, teachers’ highest level
of education, teachers’ training to work with ELL students, mother’s national origin, and the
geographical location of the school. These variables were coded in the same manner as for
previous analyses. Participants were divided into four groups based on language status and
race/ethnicity: (a) ELL Hispanic, (b) non-ELL Hispanic, (c) non-ELL Caucasian, and (d) non-
ELL African American. This combined language/race variable was coded in the same manner as
previous analyses (with three resulting contrasts) and entered as the first predictor variable. The
first contrast compared non-ELL African American and non-ELL Hispanic students, the second
contrast compared non-ELL Caucasian students to both non-ELL Hispanic and non-ELL African
American students, and the third contrast compared the ELL Hispanic students and all three
groups of non-ELL students (Hispanic, African American, and Caucasian). Teacher ratings of

74
students’ skills (reading, math, or interpersonal) was entered as the second predictor in the
second step of each analysis. In accordance with recommendations by Cohen et al. (2003),
teachers’ ratings were centered to make interpretation more meaningful. The third step
contained three interaction variables, including the interaction of each contrast with teacher
ratings. Due to the number of tests included in each analysis, the criteria for interpretation of
statistical significance were based on a fixed alpha level of .001 to minimize Type I error.
Unweighted analyses. A summary of the results for the unweighted data is reported in
Table 17 (Reading), Table 18 (Math), and Table 19 (Interpersonal). Unstandardized and
standardized regression coefficients, standard errors, t values, and the proportion of variance
accounted for (R2 and R2 change) are presented in the tables for the five covariates, the combined
language/race variable, teacher ratings, and the interactions between the combined language/race
variable and teacher ratings for all three outcome variables.
Reading skills. For the unweighted analyses, the omnibus test for teachers’ ratings of
students’ reading skills was statistically significant for the covariates at the first step, F (5, 256) =
21.07, p < .001, R2 = .296). SES was the only covariate that was a statistically significant
contributor to the prediction of students’ reading scores (t = 7.76, p < .001, semipartial r = .41).
Specifically, students from higher SES categories had higher scores on the reading assessment.
The omnibus test was also statistically significant at the second step (language status,
race/ethnicity, and teacher ratings), F (9, 256) = 30.59, p < .001, R2 ∆ = .231). Above and
beyond the covariates, the combined language/race variable as well as teacher ratings of
students’ reading skills were statistically significant predictors of students’ actual reading scores.
The significance was associated with the second and third contrasts of race/ethnicity, and teacher

75
Table 17 Summary of Regression Analyses for the Prediction of Students’ Reading Scores by Language Status, Race/Ethnicity and Teacher Ratings (Unweighted N = 260) Variable
B
SE B
β
t
Step 1
R2 =.296
SES
3.07 .40 .44 7.76*
Teacher Level of Education
1.10 1.13 .05 .97
Teacher ESL Training
-4.02 1.18 -.19 -3.40
Mother’s National Origin
-.07 .19 -.02 -.36
School Location
.34 .28 .07 1.23
Step 2
R2Δ =.231
SES
1.06 .39 .15 2.73*
Teacher Level of Education
-.43 .96 -.02 -.45
Teacher ESL Training
-.99 1.13 -.05 -.88
Mother’s National Origin
-.09 .16 -.03 -.59
School Location
.20 .23 .04 .86
(C1) Non-ELL Minority
-1.55 .65 -.11 -2.39
(C2) Caucasian
1.59 .39 .20 4.07*
(C3) ELL
-2.30 .34 -.40 -6.80*
Teacher Ratings
3.83 .55 .32 6.96*
Step 3
R2Δ =.023
SES
1.06 .38 .15 2.77*
Teacher Level of Education
-.66 .95 -.03 -.70

76
Table 17 continued B SE B β t
Teacher ESL Training
-1.36
1.12
-.06
-1.21
Mother’s National Origin
-.06 .16 -.02 -.40
School Location
.24 .23 .05 1.06
(C1) Non-ELL Minority
-1.47 .65 -.11 -2.28
(C2) Caucasian
1.36 .40 .17 3.44*
(C3) ELL
-2.34 .34 -.41 -6.96*
Teacher Ratings
4.08 .55 .34 7.47*
Non-ELL Minority x Teacher Ratings
.19 .80 .01 .24
Caucasian x Teacher Ratings
.50 .46 .05 1.10
ELL x Teacher Ratings -.98 .29 -.15 -3.35* Note. R2Δ = R2 change. The covariates were dummy coded as follows: teacher level of education (0 = Bachelor’s degree or less, 1 = Master’s degree or higher), teacher ESL training (0 = no ESL training classes, 1 = one or more ESL training class), mother’s national origin (0 = United States, 1 = other), and school location (0 = urban, 1 = rural/suburban). The first predictor variable was divided into four equal groups (n =65 for each group): ELL Hispanic, non-ELL Hispanic, non-ELL African American, and non-ELL Caucasian. Three contrasts were created: contrast 1 (C1) = non-ELL African American vs. non-ELL Hispanic; contrast 2 (C2) = non-ELL Caucasian vs. non-ELL Hispanic and African American; and contrast 3 (C3) = ELL Hispanic vs. non-ELL Hispanic, African American, and Caucasian. *p < .001 ratings of students’ reading skills. Further examination of the second and third race/ethnicity
contrast variables revealed that non-ELL Caucasian students had higher reading scores than
those of their non-ELL Hispanic and African American counterparts (t = 4.07, p < .001,
semipartial r = .18), and conversely, that ELL students had lower reading scores than the non-
ELL students (t = -6.80, p < .001, semipartial r = -.30). Teacher ratings of students’ reading
skills were also a statistically significant predictor of students’ actual reading performance (t =
6.96, p < .001, semipartial r = .31). In general, teacher ratings predicted student scores on the
direct reading assessment.

77
Table 18
Summary of Regression Analyses for the Prediction of Students’ Math Scores by Language Status, Race/Ethnicity and Teacher Ratings (Unweighted N = 260) Math Skills Variable
B
SE B
β
t
Step 1
R2 = .189
SES
2.55 .41 .38 6.22*
Teacher Level of Education
.95 1.18 .05 .80
Teacher ESL Training
-2.31 1.23 -.11 -1.88
Mother’s National Origin
.12 .20 .04 .62
School Location
-.11 .29 -.02 -.37
Step 2
R2Δ =.246
SES
1.03 .41 .15 2.51*
Teacher Level of Education
.11 1.01 .01 .11
Teacher ESL Training
-.94 1.20 -.05 -.78
Mother’s National Origin
.11 .17 .03 .66
School Location
-.27 .25 -.05 -1.11
(C1) Non-ELL Minority
-2.74 .68 -.20 -4.03*
(C2) Caucasian
1.59 .41 .20 3.85*
(C3) ELL
-1.32 .36 -.24 -3.68*
Teacher Ratings
5.26 .69 .37 7.57*
Step 3
R2Δ =.023
SES
.95 .41 .14 2.34*
Teacher Level of Education .19 1.00 .01 .19

78
Table 18 continued B SE B β t
Teacher ESL Training
-1.44
1.19
-.07
-1.21
Mother’s National Origin
.11 .17 .03 .64
School Location
-.25 .24 -.05 -1.03
(C1) Non-ELL Minority
-2.88 .68 -.21 -4.27*
(C2) Caucasian
1.53 .42 .19 3.69*
(C3) ELL
-1.33 .35 -.24 -3.75
Teacher Ratings
5.67 .70 .40 8.10*
Non-ELL Minority x Teacher Ratings
-2.05 1.09 -.09 -1.89
Caucasian x Teacher Ratings
-.29 .57 -.03 -.51
ELL x Teacher Ratings -1.01 .37 -.13 -2.72* Note. R2Δ = R2 change. The covariates were dummy coded as follows: teacher level of education (0 = Bachelor’s degree or less, 1 = Master’s degree or higher), teacher ESL training (0 = no ESL training classes, 1 = one or more ESL training class), mother’s national origin (0 = United States, 1 = other), and school location (0 = urban, 1 = rural/suburban). The first predictor variable was divided into four equal groups (n =65 for each group): ELL Hispanic, non-ELL Hispanic, non-ELL African American, and non-ELL Caucasian. Three contrasts were created: contrast 1 (C1) = non-ELL African American vs. non-ELL Hispanic; contrast 2 (C2) = non-ELL Caucasian vs. non-ELL Hispanic and African American; and contrast 3 (C3) = ELL Hispanic vs. non-ELL Hispanic, African American, and Caucasian. *p < .001
Finally, the omnibus test was statistically significant at the third step (interaction effects
of language status, race/ethnicity & teachers’ ratings), F (12, 256) = 24.86, p < .001, R2 ∆ =
.023). Thus, the prediction of students’ reading performance varied as the result of the combined
effects of language status, race/ethnicity, and teacher ratings. The interaction between the third
contrast variable (ELL vs. non-ELL) and teacher ratings of reading skills was statistically
significant (t = -3.35, p < .001, semipartial r = -.14). The pattern indicated that teacher ratings of
reading were more predictive for non-ELL students’ actual reading scores than for ELL students.

79
Table 19 Summary of Regression Analyses for the Prediction of Students’ Interpersonal Self-Ratings by Language Status, Race/Ethnicity and Teacher Ratings (Unweighted N = 260) Interpersonal Skills Variable
B
SE B
β
t
Step 1
R2 = .008
SES
-.01 .03 -.01 -.13
Teacher Level of Education
.04 .09 .03 .50
Teacher ESL Training
-.05 .09 -.04 -.61
Mother’s National Origin
.02 .01 .08 1.18
School Location
-.01 .02 -.02 -.38
Step 2
R2Δ =.014
SES
.01 .04 .01 .16
Teacher Level of Education
.04 .09 .03 .50
Teacher ESL Training
-.02 .10 -.02 -.21
Mother’s National Origin
.02 .01 .08 1.29
School Location
-.01 .02 -.02 -.33
(C1) Non-ELL Minority
.08 .06 .09 1.35
(C2) Caucasian
-.04 .04 -.08 -1.16
(C3) ELL
-.01 .03 -.02 -.18
Teacher Ratings
.06 .07 .06 .93
Step 3
R2Δ =.016
SES
.01 .04 .01 .16
Teacher Level of Education .03 .09 .02 .33

80
Table 19 continued B SE B β t
Teacher ESL Training
-.06
.11
-.04
-.52
Mother’s National Origin
.02 .01 .08 1.21
School Location
-.01 .02 -.02 -.31
(C1) Non-ELL Minority
.09 .06 .10 1.52
(C2) Caucasian
-.05 .04 -.10 -1.35
(C3) ELL
-.01 .03 -.02 -.23
Teacher Ratings
.05 .07 .05 .73
Non-ELL Minority x Teacher Ratings
.06 .09 .05 .71
Caucasian x Teacher Ratings
-.01 .06 -.01 -.17
ELL x Teacher Ratings -.07 .04 -.12 -1.82 Note. R2Δ = R2 change. The covariates were dummy coded as follows: teacher level of education (0 = Bachelor’s degree or less, 1 = Master’s degree or higher), teacher ESL training (0 = no ESL training classes, 1 = one or more ESL training class), mother’s national origin (0 = United States, 1 = other), and school location (0 = urban, 1 = rural/suburban). The first predictor variable was divided into four equal groups (n =65 for each group): ELL Hispanic, non-ELL Hispanic, non-ELL African American, and non-ELL Caucasian. Three contrasts were created: contrast 1 (C1) = non-ELL African American vs. non-ELL Hispanic; contrast 2 (C2) = non-ELL Caucasian vs. non-ELL Hispanic and African American; and contrast 3 (C3) = ELL Hispanic vs. non-ELL Hispanic, African American, and Caucasian. *p < .001
Math skills. A similar pattern of statistical significance was found for the unweighted
regression analyses on the prediction of students’ math scores. The omnibus test was again
significant at all three steps: step 1 F (5, 256) = 11.72, p < .001, R2 = .189), step 2 F (9, 256) =
21.13, p < .001, R2 ∆ = .246), and step 3 F (12, 256) = 17.18, p < .001, R2 ∆ = .023). In the first
step, SES was again the only statistically significant covariate (t = 6.22, p < .001, semipartial r =
.35). Similar to the findings for reading, students from higher SES categories obtained higher
scores on the reading assessment.

81
Unlike the previous analyses for reading, all three contrasts were statistically significant
predictors of students’ math scores in the second step. For the first contrast, non-ELL African
American students had lower math scores than the non-ELL Hispanic students (t = -4.03, p <
.001, semipartial r = -.19). The second contrast revealed that non-ELL Caucasian students had
higher math scores than the groups of non-ELL Hispanic and non-ELL African American
students (t = 3.85, p < .001, semipartial r = .18). Finally, the third contrast showed that ELL
students had lower math scores than the non-ELL students (t = -6.80, p < .001, semipartial r =
-.30). Teacher ratings were also a statistically significant predictor of students’ actual math
scores (t = 7.57, p < .001, semipartial r = .36), suggesting that teacher ratings were closely
aligned with students’ performance on the math assessment. And at the third step, the interaction
between teacher ratings and the third contrast (ELL vs. non-ELL) was statistically significant (t =
-2.72, p < .001, semipartial r = .36). Teachers’ ratings of students’ math skills varied as a result
of language status. Teachers’ math ratings were more predictive of non-ELL students’ actual
math scores than their ratings of ELL students’ actual math scores.
Interpersonal skills. Unlike the previous sets of analyses on the prediction of students’
actual reading and math scores, none of the omnibus tests were significant for the prediction of
students’ self-ratings of interpersonal skills, including the covariates. The complete results for
the unweighted analyses investigating the prediction of interpersonal skills are presented in Table
19.
Weighted analyses. A summary of the results for the weighted data is reported in Table
20 (Reading), Table 21 (Math), and Table 22 (Interpersonal). Unstandardized and standardized
regression coefficients, standard errors, t values, and the proportion of variance accounted for
(R2 and R2 change) are presented in the tables for the five covariates, the combined language/race

82
Table 20 Summary of Regression Analyses for the Prediction of Students’ Reading Scores by Language Status, Race/Ethnicity and Teacher Ratings (Weighted n = 95) Variable
B
SE B
β
t
Step 1
R2 = .253
SES
2.40 .74 .34 3.25*
Teacher Level of Education
4.53 2.02 .21 2.24
Teacher ESL Training
-3.20 2.17 -.15 -1.47
Mother’s National Origin
-.19 .31 -.06 -.62
School Location
-.11 .39 -.03 -.27
Step 2
R2Δ = .244
SES
.66 .70 .09 .95
Teacher Level of Education
1.61 1.77 .08 .91
Teacher ESL Training
1.73 2.14 .08 .81
Mother’s National Origin
-.21 .26 -.07 -.81
School Location
-.19 .33 -.04 -.56
(C1) Non-ELL Minority
.05 1.10 .01 .05
(C2) Caucasian
1.41 .77 .15 1.83
(C3) ELL
-2.83 .60 -.49 -4.68*
Teacher Ratings
4.15 .92 .36 4.47*
Step 3
R2Δ = .045
SES
.51 .69 .07 .74
Teacher Level of Education
1.30 1.75 .06 .75

83
Table 20 continued B SE B β t Teacher ESL Training
.64 2.13 .03 .30
Mother’s National Origin
-.14 .26 -.04 -.55
School Location
-.14 .32 -.03 -.43
(C1) Non-ELL Minority
-.13 1.08 -.01 -.12
(C2) Caucasian
1.2 .77 .13 1.57
(C3) ELL
-2.92 .60 -.50 -4.91*
Teacher Ratings
4.51 .91 .39 4.94*
Non-ELL Minority x Teacher Ratings
-.06 1.32 -.01 -.05
Caucasian x Teacher Ratings
.13 .76 .01 .17
ELL x Teacher Ratings -1.38 .49 -.22 -2.82* Note. R2Δ = R2 change. The covariates were dummy coded as follows: teacher level of education (0 = Bachelor’s degree or less, 1 = Master’s degree or higher), teacher ESL training (0 = no ESL training classes, 1 = one or more ESL training class), mother’s national origin (0 = United States, 1 = other), and school location (0 = urban, 1 = rural/suburban). The first predictor variable was divided into four equal groups (n =65 for each group): ELL Hispanic, non-ELL Hispanic, non-ELL African American, and non-ELL Caucasian. Three contrasts were created: contrast 1 (C1) = non-ELL African American vs. non-ELL Hispanic; contrast 2 (C2) = non-ELL Caucasian vs. non-ELL Hispanic and African American; and contrast 3 (C3) = ELL Hispanic vs. non-ELL Hispanic, African American, and Caucasian. *p < .001 variable, teacher ratings, and the interactions between the combined language/race variable and
teacher ratings for all three outcome variables.
Reading skills. Similar to the unweighted data, the omnibus test for the weighted
analyses of reading skills were statistically significant at all three steps: step 1 F (5, 94) = 6.01, p
< .001, R2 = .253), step 2 F (9, 94) = 9.30, p < .001, R2 ∆ = .244), and step 3 F (12, 94) = 8.05, p
< .001, R2 ∆ = .045). In the first step, SES was the only statistically significant covariate (t =
3.25, p < .001, semipartial r = .30), with students from higher SES categories obtaining higher
reading scores.
At step 2, above and beyond the covariates, the ELL contrast (t = -4.68, p < .001,
semipartial r = -.36) and teacher ratings of students’ reading skills (t = 4.46, p < .001, semipartial

84
Table 21 Summary of Regression Analyses for the Prediction of Students’ Math Scores by Language Status, Race/Ethnicity and Teacher Ratings (Weighted n = 95) Variable
B
SE B
β
t
Step 1
R2 = .181
SES
1.89 .77 .27 2.46
Teacher Level of Education
3.61 2.11 .17 2.24
Teacher ESL Training
-3.90 2.26 -.18 -1.47
Mother’s National Origin
-.03 .32 -.01 -.62
School Location
-.11 .41 -.03 -.27
Step 2
R2Δ = .252
SES
.44 .74 .06 .60
Teacher Level of Education
1.93 1.86 .09 1.04
Teacher ESL Training
-1.42 2.27 -.07 -.62
Mother’s National Origin
-.04 .28 -.01 -.15
School Location
-.34 .35 -.08 -.97
(C1) Non-ELL Minority
-2.21 1.16 -.17 -1.91
(C2) Caucasian
.44 .74 .06 .60
(C3) ELL
-2.83 1.28 .82 .14
Teacher Ratings
4.15 -1.64 .64 -.28
Step 3
R2Δ = .069
SES
.50 .72 .07 .70
Teacher Level of Education
1.81 1.78 .09 1.01

85
Table 21 continued B SE B β t
Teacher ESL Training
-2.49 2.24 -.11 -1.12
Mother’s National Origin
.02 .27 .01 .08
School Location
-.32 .34 -.08 -.96
(C1) Non-ELL Minority
-2.39 1.13 -.18 -2.13
(C2) Caucasian
.76 .81 .08 .94
(C3) ELL
-1.47 .62 -.25 -2.39
Teacher Ratings
6.49 1.19 .47 5.46*
Non-ELL Minority x Teacher Ratings
.47 1.87 .02 .25
Caucasian x Teacher Ratings
1.18 .98 .10 1.21
ELL x Teacher Ratings -1.75 .60 -.25 -2.90* Note. R2Δ = R2 change. The covariates were dummy coded as follows: teacher level of education (0 = Bachelor’s degree or less, 1 = Master’s degree or higher), teacher ESL training (0 = no ESL training classes, 1 = one or more ESL training class), mother’s national origin (0 = United States, 1 = other), and school location (0 = urban, 1 = rural/suburban). The first predictor variable was divided into four equal groups (n =65 for each group): ELL Hispanic, non-ELL Hispanic, non-ELL African American, and non-ELL Caucasian. Three contrasts were created: contrast 1 (C1) = non-ELL African American vs. non-ELL Hispanic; contrast 2 (C2) = non-ELL Caucasian vs. non-ELL Hispanic and African American; and contrast 3 (C3) = ELL Hispanic vs. non-ELL Hispanic, African American, and Caucasian. *p < .001 r = .34) were statistically significant predictors of students’ actual reading performance. ELL
students had lower reading scores than their non-ELL counterparts. At the third step, the
interaction between the ELL contrast and teachers’ ratings was statistically significant (t = -2.82,
p < .001, semipartial r = -.21). Teachers’ ratings of reading skills were more predictive of non-
ELLs’ actual reading scores in comparison to those of ELL students.
Math skills. The three omnibus tests for the weighted analyses were also statistically
significant: step 1 F (5, 94) = 3.93, p < .001, R2 = .181), step 2 F (9, 94) = 7.21, p < .001, R2 ∆ =
.252), and step 3 F (12, 94) = 6.89, p < .001, R2 ∆ = .069). SES was statistically significant in the
first step (t = 2.46, p < .001, semipartial r = .24). After controlling for the covariates at the

86
Table 22 Summary of Regression Analyses for the Prediction of Students’ Interpersonal Self-Ratings by Language Status, Race/Ethnicity and Teacher Ratings (Weighted n = 95) Variable
B
SE B
β
t
Step 1
R2 = .027
SES
-.01 .06 -.01 -.02
Teacher Level of Education
.09 .15 .07 .62
Teacher ESL Training
-.04 .16 -.03 -.22
Mother’s National Origin
.03 .02 .15 1.40
School Location
-.01 .03 -.02 -.20
Step 2
R2Δ = .028
SES
-.01 .06 -.01 -.10
Teacher Level of Education
.11 .16 .08 .69
Teacher ESL Training
-.02 .19 -.01 -.08
Mother’s National Origin
.04 .02 .17 1.51
School Location
-.01 .03 -.02 -.21
(C1) Non-ELL Minority
-.02 .10 -.02 -.16
(C2) Caucasian
-.07 .07 -.12 -1.04
(C3) ELL
-.03 .05 -.07
-.50
Teacher Ratings
.10 .12 .10 .88
Step 3
R2Δ = .010
SES
-.01 .06 -.01 -.10
Teacher Level of Education
.11 .16 .08 .67

87
Table 22 continued B SE B β t Teacher ESL Training
-.05 .20 -.03 -.24
Mother’s National Origin
.04 .02 .17 1.48
School Location
-.01 .03 -.02 -.20
(C1) Non-ELL Minority
-.01 .10 -.01 -.07
(C2) Caucasian
-.08 .07 -.13 -1.10
(C3) ELL
-.03 .06 -.07 -.46
Teacher Ratings
.10 .12 .10 .82
Non-ELL Minority x Teacher Ratings
.02 .16 .01 .11
Caucasian x Teacher Ratings
.01 .11 .01 .02
ELL x Teacher Ratings -.06 .07 -.10 -.89 Note. R2Δ = R2 change. The covariates were dummy coded as follows: teacher level of education (0 = Bachelor’s degree or less, 1 = Master’s degree or higher), teacher ESL training (0 = no ESL training classes, 1 = one or more ESL training class), mother’s national origin (0 = United States, 1 = other), and school location (0 = urban, 1 = rural/suburban). The first predictor variable was divided into four equal groups (n =65 for each group): ELL Hispanic, non-ELL Hispanic, non-ELL African American, and non-ELL Caucasian. Three contrasts were created: contrast 1 (C1) = non-ELL African American vs. non-ELL Hispanic; contrast 2 (C2) = non-ELL Caucasian vs. non-ELL Hispanic and African American; and contrast 3 (C3) = ELL Hispanic vs. non-ELL Hispanic, African American, and Caucasian. *p < .001 second step, the ELL contrast was a statistically significant predictor of students’ math scores.
ELL students had lower math scores than their non-ELL counterparts (t = -2.56, p < .001,
semipartial r = -.21). Teacher ratings of students’ math skills were also a significant predictor
ofstudents’ actual math performance (t = 5.10, p < .001, semipartial r = .42). In the final step,
the interaction between the third contrast and teacher ratings was statistically significant (t = -
2.90, p < .001, semipartial r = .86). Teacher ratings of math were more predictive of actual math
scores for non-ELL than ELL students.
Interpersonal skills. Similar to the unweighted analyses on the prediction of students’
self-ratings of interpersonal skills, none of the omnibus tests were significant for the prediction

88
of students’ self-ratings of interpersonal skills, including the covariates. The complete results for
the weighted analyses investigating the prediction of interpersonal skills are presented in Table
22.
Post-hoc analyses. Post-hoc regression analyses were conducted with both the
unweighted and weighted data to examine whether time spent in the ESL classroom had an
impact on teachers’ academic and interpersonal ratings of ELL students. Only the sample of
ELL students (n = 65) was used in these analyses. All five previously investigated covariates
(SES, teachers’ highest level of education, teachers’ ESL training, mother’s national origin, and
geographical location of school) plus time spent in the ESL classroom were entered into the first
step of the analyses. In the available data, time spent in the ESL classroom were collected as a
categorical variable based on four ranges of time in minutes: (a) 1-30 minutes, (b) 31-60
minutes, (c) 61-90 minutes, and (d) more than 90 minutes. This variable was dummy coded with
0 representing students who spent 60 minutes or less per day in the ESL classroom and 1
representing students who spent more than 60 minutes in the ESL classroom. Teacher ratings of
students’ reading, math, and interpersonal skills were entered into the second step of the
analyses. The three student outcome variables were again actual reading and math scores, and
students’ self-ratings of interpersonal skills.
None of these analyses were statistically significant. Time in the ESL classroom was not
a statistically significant contributor to the prediction of students’ academic scores and
interpersonal ratings. Teacher ratings of ELL students were also statistically nonsignificant. A
summary of the unweighted results is reported in Table 23 (Reading), Table 24 (Math), and
Table 25 (Intepersonal). The weighted results are presented in Table 26 (Reading), Table 27
(Math), and Table 28 (Interpersonal). Unstandardized and standardized regression coefficients,

89
Table 23
Summary of Regression Analyses Investigating the Influence of Time in ESL Classroom on the Accuracy of Teacher Ratings of ELL Students’ Reading Skills (Unweighted n = 65) Variable
B
SE B
β
t
Step 1
R2 =.195
Time in ESL Classroom
-.06 .29 -.03 -.22
SES
-.95 1.16 -.11 -.82
Teacher Level of Education
2.00 2.29 .11 .88
Teacher ESL Training
-1.47 2.04 -.09 -.72
Mother’s National Origin
-.52 .28 -.22 -1.84
School Location
6.42 2.04 .39 3.15
Step 2
R2Δ =.032
Time in ESL Classroom
-.01 .29 -.01 -.02
SES
-1.0 1.15 -.11 -.87
Teacher Level of Education
1.97 2.26 .10 .87
Teacher ESL Training
-1.01 2.04 -.06 -.49
Mother’s National Origin
-.52 .28 -.22 -1.87
School Location
6.44 2.02 .39 3.19
Teacher Ratings
1.55 1.02 .18 1.51
Note. R2Δ = R2 change. The covariates were dummy coded as follows: time in ESL classroom (0 = 60 minutes or less, 1 = more than 60 minutes), teacher level of education (0 = Bachelor’s degree or less, 1 = Master’s degree or higher), teacher ESL training (0 = no ESL training classes, 1 = one or more ESL training class), mother’s national origin (0 = United States, 1 = other), and school location (0 = urban, 1 = rural/suburban). None of the findings were statistically significant at p < .001.

90
Table 24 Summary of Regression Analyses Investigating the Influence of Time in ESL Classroom on the Accuracy of Teacher Ratings of ELL Students’ Math Skills (Unweighted n = 65) Variable
B
SE B
β
t
Step 1
R2 = .042
Time in ESL Classroom
.03 .31 .01 .09
SES
-.48 1.25 -.05 -.38
Teacher Level of Education
.29 2.46 .02 .12
Teacher ESL Training
-1.51 2.20 -.09 -.68
Mother’s National Origin
.37 .30 .16 1.23
School Location
1.35 2.20 .08 .61
Step 2
R2Δ =.133
Time in ESL Classroom
.03 .30 .01 .09
SES
-.48 1.20 -.05 -.40
Teacher Level of Education
.07 2.37 .01 .03
Teacher ESL Training
-.48 2.16 -.03 -.22
Mother’s National Origin
.38 .29 .16 1.30
School Location
1.43 2.11 .09 .77
Teacher Ratings
3.05 1.26 .31 2.43
Note. R2Δ = R2 change. The covariates were dummy coded as follows: time in ESL classroom (0 = 60 minutes or less, 1 = more than 60 minutes), teacher level of education (0 = Bachelor’s degree or less, 1 = Master’s degree or higher), teacher ESL training (0 = no ESL training classes, 1 = one or more ESL training class), mother’s national origin (0 = United States, 1 = other), and school location (0 = urban, 1 = rural/suburban). None of the findings were statistically significant at p < .001.

91
Table 25 Summary of Regression Analyses Investigating the Influence of Time in ESL Classroom on the Accuracy of Teacher Ratings of ELL Students’ Interpersonal Skills (Unweighted n = 65) Variable
B
SE B
β
t
Step 1
R2 = .077
Time in ESL Classroom
.03 .03 .14 1.02
SES
.24 .11 .28 2.08
Teacher Level of Education
.11 .23 .06 .48
Teacher ESL Training
.09 .20 .06 .46
Mother’s National Origin
-.01 .03 -.03 -.23
School Location
.01 .20 .01 .04
Step 2
R2Δ =.047
Time in ESL Classroom
.04 .03 .18 1.30
SES
.26 .11 .31 2.30
Teacher Level of Education
.03 .23 .02 .14
Teacher ESL Training
-.01 .21 -.01 -.05
Mother’s National Origin
-.02 .03 -.07 -.54
School Location
.06 .20 .04 .31
Teacher Ratings
-.28 .16 -.24 -1.73
Note. R2Δ = R2 change. The covariates were dummy coded as follows: time in ESL classroom (0 = 60 minutes or less, 1 = more than 60 minutes), teacher level of education (0 = Bachelor’s degree or less, 1 = Master’s degree or higher), teacher ESL training (0 = no ESL training classes, 1 = one or more ESL training class), mother’s national origin (0 = United States, 1 = other), and school location (0 = urban, 1 = rural/suburban). None of the findings were statistically significant at p < .001.

92
Table 26 Summary of Regression Analyses Investigating the Influence of Time in ESL Classroom on the Accuracy of Teacher Ratings of ELL Students’ Reading Skills (Weighted n = 25) Variable
B
SE B
β
t
Step 1
R2 = .205
Time in ESL Classroom
-.22 .49 -.10 -.44
SES
-1.24 2.26 -.13 -.55
Teacher Level of Education
2.40 4.11 .13 .58
Teacher ESL Training
.02 3.79 .01 .01
Mother’s National Origin
-.63 .50 -.28 -1.26
School Location
5.86 3.78 .36 1.55
Step 2
R2Δ =.010
Time in ESL Classroom
-.24 .50 -.11 -.47
SES
-1.21 2.31 -.13 -.52
Teacher Level of Education
2.34 4.21 .13 .56
Teacher ESL Training
.56 4.06 .03 .14
Mother’s National Origin
-.64 .52 -.28 -1.25
School Location
5.97 3.88 .37 1.54
Teacher Ratings
.81 1.81 .11 .45
Note. R2Δ = R2 change. The covariates were dummy coded as follows: time in ESL classroom (0 = 60 minutes or less, 1 = more than 60 minutes), teacher level of education (0 = Bachelor’s degree or less, 1 = Master’s degree or higher), teacher ESL training (0 = no ESL training classes, 1 = one or more ESL training class), mother’s national origin (0 = United States, 1 = other), and school location (0 = urban, 1 = rural/suburban). None of the findings were statistically significant at p < .001.
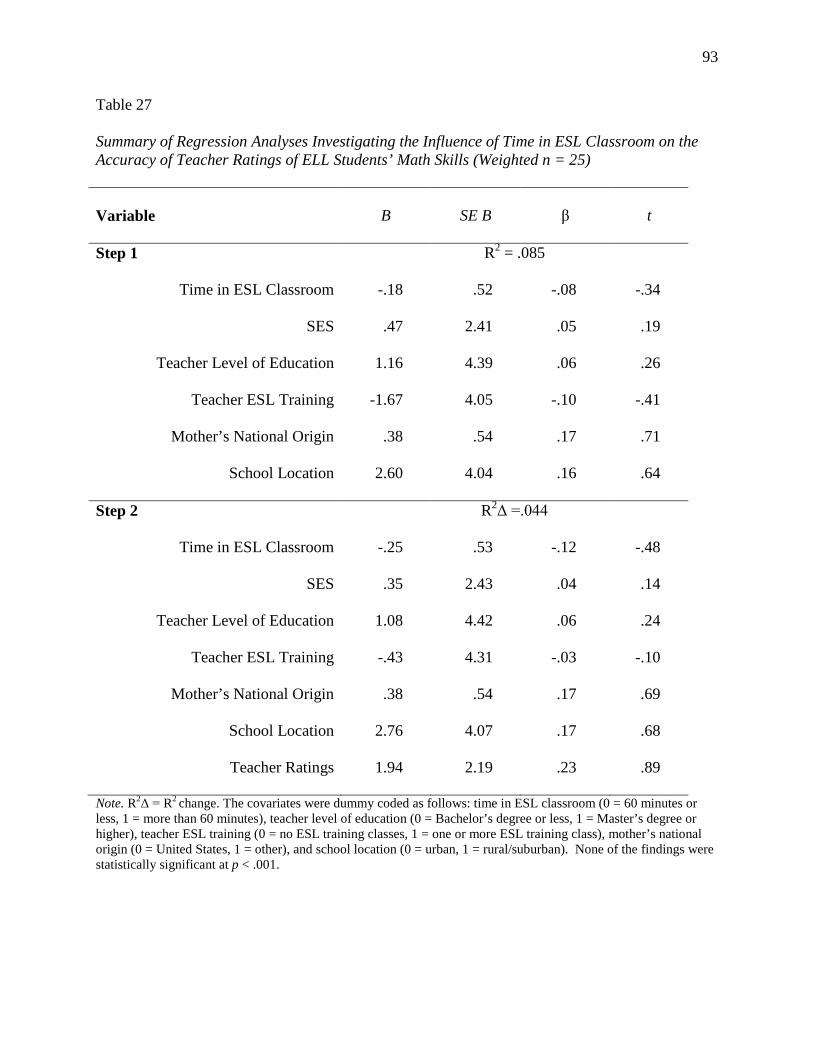
93
Table 27 Summary of Regression Analyses Investigating the Influence of Time in ESL Classroom on the Accuracy of Teacher Ratings of ELL Students’ Math Skills (Weighted n = 25) Variable
B
SE B
β
t
Step 1
R2 = .085
Time in ESL Classroom
-.18 .52 -.08 -.34
SES
.47 2.41 .05 .19
Teacher Level of Education
1.16 4.39 .06 .26
Teacher ESL Training
-1.67 4.05 -.10 -.41
Mother’s National Origin
.38 .54 .17 .71
School Location
2.60 4.04 .16 .64
Step 2
R2Δ =.044
Time in ESL Classroom
-.25 .53 -.12 -.48
SES
.35 2.43 .04 .14
Teacher Level of Education
1.08 4.42 .06 .24
Teacher ESL Training
-.43 4.31 -.03 -.10
Mother’s National Origin
.38 .54 .17 .69
School Location
2.76 4.07 .17 .68
Teacher Ratings
1.94 2.19 .23 .89
Note. R2Δ = R2 change. The covariates were dummy coded as follows: time in ESL classroom (0 = 60 minutes or less, 1 = more than 60 minutes), teacher level of education (0 = Bachelor’s degree or less, 1 = Master’s degree or higher), teacher ESL training (0 = no ESL training classes, 1 = one or more ESL training class), mother’s national origin (0 = United States, 1 = other), and school location (0 = urban, 1 = rural/suburban). None of the findings were statistically significant at p < .001.

94
Table 28 Summary of Regression Analyses Investigating the Influence of Time in ESL Classroom on the Accuracy of Teacher Ratings of ELL Students’ Interpersonal Skills (Weighted n = 25) Variable
B
SE B
β
t
Step 1
R2 = .149
Time in ESL Classroom
.06 .05 .30 1.29
SES
.25 .23 .27 1.11
Teacher Level of Education
.08 .41 .05 .20
Teacher ESL Training
-.01 .38 -.01 -.02
Mother’s National Origin
.01 .05 .02 .10
School Location
-.11 .38 -.07 -.28
Step 2
R2Δ =.047
Time in ESL Classroom
.07 .05 .35 1.46
SES
.27 .23 .29 1.20
Teacher Level of Education
.02 .42 .01 .06
Teacher ESL Training
-.11 .40 -.07 -.28
Mother’s National Origin
-.01 .05 -.01 -.05
School Location
-.07 .38 -.04 -.18
Teacher Ratings
-.29 .30 -.24 -.95
Note. R2Δ = R2 change. The covariates were dummy coded as follows: time in ESL classroom (0 = 60 minutes or less, 1 = more than 60 minutes), teacher level of education (0 = Bachelor’s degree or less, 1 = Master’s degree or higher), teacher ESL training (0 = no ESL training classes, 1 = one or more ESL training class), mother’s national origin (0 = United States, 1 = other), and school location (0 = urban, 1 = rural/suburban). None of the findings were statistically significant at p < .001.

95
standard errors, t values, and the proportion of variance accounted for (R2 and R2 change) are
presented in the tables for the five covariates, the combined language/race variable, teacher
ratings, and the interactions between the combined language/race variable and teacher ratings for
all three outcome variables.
96
DISCUSSION
The purpose of the current study was to investigate whether teacher judgments differed
for ELL and non-ELL students on academic abilities, specifically reading and mathematics, and
interpersonal competence. It was hypothesized that teachers would judge ELL students as
having weaker academic and interpersonal skills than their non-ELL counterparts, regardless of
the latter’s racial/ethnic background. Additionally, it was hypothesized that teacher perceptions
would be more predictive of the academic performance and interpersonal self-ratings for non-
ELL versus ELL students. These hypotheses were partially supported. In the sections that
follow, the meaning of each set of findings will be examined by hypothesis, with a consideration
of both the unweighted and weighted findings. The discussion will also focus on additional
analyses regarding the effect that specific demographic variables (SES, mother’s national origin,
and location of school) might have had on teacher ratings. Limitations of the study will be noted
as well as the implications for practice and future research.
Language Status and Teacher Perceptions
For the first hypothesis teachers were expected to judge Spanish-speaking ELL Hispanic
students as having weaker academic and interpersonal skills than their English-speaking non-
ELL Hispanic counterparts. Teachers’ level of education and training in ESL were included in
the analyses as potential covariates and language status (ELL versus non-ELL) was entered as
the predictor variable. The findings did not support the hypothesis. Regardless of teachers’ level
of education and training in ESL, the language status of Hispanic students was not found to be a
predictor of teacher ratings of reading, math, or interpersonal skills.
In contrast to what was hypothesized, these results suggest that teachers do not rate
students’ academic and social skills differently based on their English language ability. As noted

97
in previous studies (e.g., Demaray & Elliott, 1998), differences in teacher judgments may be
more strongly related to actual student ability and performance, rather than preconceived notions
about students based on language status. Or it may not be the actual language spoken that
influences teacher judgments, but rather how it is spoken (e.g., grammar) or whether a student is
speaking in a vernacular versus using more formal language (McClendon, 2010). Research has
also been conducted on code-switching (i.e., alternating between two languages in the context of
one conversation), suggesting that this practice is generally perceived negatively, particularly by
monolingual speakers and majority cultural groups, in terms of understandability, attractiveness,
and correctness (Hidalgo, 1988). Historically, code-switching has been viewed negatively in
schools as well; it has been seen as a sign of limited language proficiency (Cheng & Butler,
1989) and considered detrimental to students’ development of English and academic skills in
English (Aitchison, 1991; Hughes, Shaunessy, Brice, Ratliff, & McHatton, 2006). Thus,
teachers’ academic and interpersonal ratings of students may be more affected by students who
speak informally, using vernacular English or code-switching between languages, as opposed to
students who simply speak limited English.
Additionally, while some teacher characteristics were investigated as covariates in the
current study (level of education and ESL training), there may be other differences between
teachers (e.g., experience working with ELL students, teacher race/ethnicity, languages spoken)
which influence their ratings of students, particularly those of different language and
racial/ethnic backgrounds. Research conducted on the effect of the race/ethnicity of teachers’
perceptions of students has found mixed results. For example, some studies (e.g., Bates & Glick,
2013; Saft & Pianta, 2001) have shown that racial/ethnic congruence between teachers and
students were consistently related to teachers’ perceptions and positive relationships with

98
students. Other studies (Beady & Hansell, 1981; Mashburn, Hamre, Downer, & Pianta, 2006;
Pigott & Cowen, 2000) have revealed that teachers of non-Caucasian backgrounds tended to rate
children more positively in terms of competencies, expectations, and behavior, regardless of the
students’ race/ethnicity or racial/ethnic match with the teacher. Dominguez de Ramirez and
Shapiro (2005) have suggested that teacher perceptions of students, particularly in regards to
deviance from behavioral norms, may be partially mediated by teachers’ cultural values more
than race/ethnicity.
It may also be that more apparent attributes of students have more of an effect on teacher
judgments. For example, previous researchers (e.g., Dusek & Joseph, 1983, Hoge & Coladarci,
1989; Tenenbaum & Ruck, 2007) have posited that teachers may rate students differently based
on race/ethnicity, skin color, physical attractiveness, or student behavior. One of these variables,
race/ethnicity, was investigated more closely in the second hypothesis.
Language Status and Teacher Perceptions across Racial/Ethnic Groups
The second hypothesis was that teachers were expected to judge ELL students to have
weaker academic and interpersonal skills than their non-ELL counterparts of Hispanic, African
American, and Caucasian backgrounds. Teachers’ level of education and ESL training were
again considered as potential covariates and a combined language/race variable, divided into four
groups (ELL Hispanic, non-ELL Hispanic, non-ELL African American, and non-ELL
Caucasian), was entered as the predictor with three resulting contrasts ([a] ELL Hispanic versus
all three non-ELL groups, [b] non-ELL Caucasian versus the other two non-ELL groups [African
American and Hispanic], and [c] non-ELL Hispanic versus non-ELL African American). This
hypothesis was also not supported; teacher ratings of ELL students were not found to be different
from their ratings of non-ELL students regardless of the ethnic/racial background of the non-

99
ELL students. While teacher ratings were not different across the ELL and non-ELL students,
results from the other contrasts revealed differences between the non-ELL groups based on
race/ethnicity. Specifically, teachers rated non-ELL African American students as having
weaker reading and social skills than non-ELL Hispanic students.
While the second hypothesis was not supported, concurrent findings suggest that teacher
ratings may be influenced by race/ethnicity more so than language status. The potential role of a
student’s race/ethnicity on teacher expectations aligns with existing research. A review of
relevant literature suggests that teachers may have more negative perceptions of and lower
expectations for ethnic “minority” students (e.g., Jussim & Eccles, 1995; Rist, 1970; Rubie-
Davies, Hattie, & Hamilton, 2006) or even students with more “ethnic-sounding” names (e.g.,
Anderson-Clark, Green, & Henley, 2008). However, much of the existing literature suggests that
African American and Hispanic students are rated similarly by teachers (in a more negative
manner) whereas European American and Asian American students are judged more favorably
(e.g., Dusek & Joseph, 1983; Tenenbaum & Ruck, 2007). In contrast, teachers in the current
study rated Hispanic students more favorably than African American students, but no differences
were found between Caucasian students and the other racial/ethnic groups. That is, there were
differences in the way that teachers rated Hispanic and African American students, but together
as a group, the African American and Hispanic students were not rated significantly differently
than Caucasian students.
There are several possible explanations for this finding. It may be that teachers are
becoming more aware of their biases and preconceived notions based on race/ethnicity, and that
gradually, different racial/ethnic groups have become less stigmatized over time. Or, there may
be differences based on perceptions of race (e.g., African American) versus ethnicity (e.g.,

100
Hispanic). Future research could further tease out this distinction between race and ethnicity,
and how individuals primarily identify themselves. The Hispanic students in the current study
may have been rated more similarly to the Caucasian students based on fewer differences in
characteristics, such as skin color/tone or other facets of appearance as compared to the African
American students. Hispanic students may have even been misperceived as Caucasian in some
cases. It may be that it is not race/ethnicity in itself that is influencing teacher judgments, but
other corresponding characteristics such as skin color (Elmore, 2010; Smith, 1977), physical
appearance (Dare, 1992; Song, 1998), or cultural differences (Dominguez de Ramirez & Shapiro,
2005; Narvaez, 2013).
A growing body of research has been conducted that has investigated phenotype or skin
color, with some studies (e.g., Elmore, 2010; Fergus, 2009) providing evidence for
discrimination based on phenotype or skin color. These findings indicated that those with lighter
skin are treated more favorably than those with darker skin, regardless of race/ethnicity (Elmore,
2010; Fergus, 2009). While the data used in the current study did not contain details about
students’ skin color or phenotype, it may be these physical or outward characteristics influenced
teacher perceptions more so than language status.
Additional Analyses
Based on preliminary findings that the ELL and non-ELL groups were systematically
different in regards to socioeconomic status (SES), parents’ national origin, and school location,
additional analyses were conducted to investigate the potential relationship of these demographic
variables to teacher judgments of ELL and non-ELL students. Results revealed that SES,
national origin, and school location were not related to teachers’ academic and interpersonal
judgments, either alone or in conjunction with language status.

101
While previous research (e.g., Bennett, Gottesman, Rock, & Cerullo, 1993; Dusek &
Joseph, 1983; Hoge & Coladarci, 1989) suggests that there may be moderating variables, which
influence teacher expectations/judgments, these findings are inconsistent. For example, Dusek
and Joseph found through meta-analysis that SES was only sometimes related to teacher
expectations. As a result, the authors indicated that the mixed findings may be indicative of the
location of the analyses, within or across classrooms/schools or the influence of other factors
(students’ age or grade level) on teacher expectations. The results of the current study add to
these inconsistent findings as none of the variables investigated in the additional analyses (SES,
parents’ national origin, and school location) directly influenced teacher judgments of students’
academic and interpersonal skills. Teachers may be less aware of these particular variables or
there may be other factors that hold more significance, such as students’ actual
ability/achievement (e.g., Hecht & Greenfield, 2002; Hoge and Coladarci, 1989) or student
behavior (e.g., Bennett, Gottesman, Rock, & Cerullo, 1993; Dusek & Joseph, 1983). Factors like
SES or school location may not be significant predictors of teacher judgments. However, SES or
school location may be related to other factors that are directly or indirectly related to teacher
ratings, such as students’ actual achievement, parent involvement, and exposure to/opportunities
for learning outside of school.
Teacher Ratings as Predictors of Student Performance
The third hypothesis was that teachers’ ratings would be more predictive of the academic
performance and interpersonal self-ratings of non-ELL versus ELL students. The findings
partially supported this hypothesis. Five covariates (SES, teachers’ highest level of education,
teachers’ ESL training, mother’s national origin, and school location) were entered in the first
step; the combined race/language variable (with three contrasts) used to test the second

102
hypothesis and teacher ratings were entered into the second step. The interaction between
teacher ratings and each race/language contrast was entered into the third step. Students’ actual
reading and math scores and their self-ratings of interpersonal skills were the outcome variables.
As predicted, teachers’ ratings were more predictive of the academic (reading and mathematics)
skills of non-ELL students; however, there was no relationship found between teachers’ ratings
of students’ interpersonal skills and students’ own ratings of their interpersonal skills for either
the ELL or non-ELL sample.
In all of the analyses (unweighted and weighted), SES was the only covariate that was
found to be related to students’ performance in reading and math. That is, students from a higher
SES category were found to have higher math and reading scores. Above and beyond SES,
race/ethnicity and language status were also found to be significant predictors of student
performance for the unweighted data only. Specifically, non-ELL Caucasian students had higher
reading and math scores than their non-ELL Hispanic and African American counterparts. For
math only, non-ELL Hispanic students had higher scores than non-ELL African American
students. In regard to language status, non-ELL students demonstrated stronger reading and
math performance than ELL students.
For both the unweighted and weighted analyses teacher ratings were found to predict
students’ reading and math performance on the direct assessments. Analyses revealed an
interaction effect; teachers consistently rated non-ELL students more accurately than their ELL
counterparts on both reading and math skills. No relationships were found for interpersonal
skills.
Most of the existing literature indicates moderate to strong correspondence between
teachers’ academic judgments and students’ actual academic performance (e.g., Demaray &

103
Elliott, 1998; Hoge & Coladarci, 1989), but some research (e.g., Dusek & Joseph, 1983) has
suggested that the accuracy of teachers’ academic ratings may be influenced by various factors,
including race/ethnicity. The current findings suggest that language status may be an additional
factor that may affect the accuracy of teacher judgments of students’ academic skills as teachers
generally rated non-ELL students more accurately than ELL students. This difference may be
because mainstream teachers are better equipped to make academic judgments about non-ELL
students. Previous research (e.g., Williams, Whitehead, & Miller, 1972) indicates that
mainstream teachers may confuse ELL students’ language differences with academic or
cognitive deficits. Or it may be that ELL students’ true abilities are masked by their English
language proficiency; they may have limited means to express what they know and can do.
Limitations
Several limitations should be noted in the current study. First, the study was conducted
using archival data, which were collected over ten years ago and may not be representative of
current trends of teachers’ perceptions or students’ performance. Additionally, for the purposes
of the ECLS-K study from which the data for the current study were taken, ELL students were
oversampled, purposefully selected in numbers that were disproportionate to their actual
representation in the population. As such, the data needed to be weighted to obtain results that
were applicable beyond just the present sample. While the overall sample in this study actually
consisted of 260 students (including 65 ELL students), these numbers were reduced to 95 (24
ELL students) when the data were weighted to be more representative of the population.
Furthermore, the use of weighted or unweighted data resulted in some inconsistency in findings
and thus made it difficult to draw reliable conclusions. While weighting the data allows for the
findings to be generalized beyond the sample to the population (National Center for Education

104
Statistics, 2004) this statistical technique reduced the current sample size and thus decreased the
power of the statistical analyses (Cohen, 1992).
There are also some limitations in regard to the ECLS-K measures selected for use in the
study. Limited psychometric information was available for the direct assessments of reading and
math, Oral Language Development Scale (OLDS), Academic Rating Scale (ARS), Social Rating
Scale (SRS), and Self-Description Questionnaire (SDQ). These measures were collections of
items derived for the purposes of the ECLS-K, and thus, had not been established as
psychometrically sound scales outside of the ECLS-K study. This lack of psychometric research
limits both the internal and external validity of the obtained scores.
Another limitation of the current study is that the sample was restricted in range on
parents’ national origin, which made in-depth analyses in this area not viable. Specifically, a
majority of the sampled participants were from the United States, with the second largest group
coming from Mexico. Some participants’ parents did originate from other countries and regions
besides U.S. and Mexico, but the sizes of these subsamples were too small to conduct any
meaningful comparisons.
There was also a lack of access to certain information from ECLS-K or the unavailability
of information. Some information had been collected but was restricted from public access, and
other information had not been collected for the ECLS-K study. For example, data on parents’
national origin were available for public use, but the same data on the children’s national origin
had restricted access. Information on teacher race/ethnicity was collected, but also had restricted
access and thus was not investigated in the current study. Additional information that may have
been particularly relevant to the current study, such as status of citizenship, length of time in the

105
United States, and length of time speaking English, were not collected as part of the ECLS-K
study.
Implications for Practice and Future Research
The results of the current study reinforce the importance of teacher training to work with
students from diverse backgrounds. While teachers have been found to be generally accurate in
their academic ratings of students, the current study supports previous findings (e.g., Dusek &
Joseph, 1983), which suggest that accuracy of judgment may decrease when other factors, such
as race/ethnicity and language, are present. As such, it is important for teachers to develop
awareness and knowledge of the diversity of the students they teach. Additionally, given the
finding that teachers’ academic and interpersonal judgments may be influenced by students’
race/ethnicity, it is critical that teachers become aware of their potential biases and find ways to
minimize these unfair preconceptions when working with students.
The current study has important implications for school psychologists and other related
service providers in the schools as well. School psychologists should take teachers’ potential
biases into account when collecting teacher ratings of students as part of conducting
comprehensive psychoeducational evaluations. Particular caution should be used when
interpreting and making conclusions about teachers’ academic and behavioral ratings of students
from diverse backgrounds, including, but not limited to, race/ethnicity and language status. The
findings of the current study also highlight the potential role of the school psychologist in
providing in-service trainings to teachers for working with and fairly assessing ELL and
racially/ethnically diverse students, including recognizing and addressing potential biases.
The findings of the current study also provide direction for expansion and future research
on investigating the potential influences on teacher judgments and expectations of students.

106
Future studies could consider more specific differences between national origin, skin
color/appearance, U.S. citizenship, length of time in the United States, and length of time
speaking English. Additional research could also be conducted that further examines students’
degree or level of English language proficiency and the operationalization and measurement of
proficiency. A larger sample size and data from more established and psychometrically sound
rating scales/measures would help to eliminate some of the current study’s limitations of external
and internal validity. Other potentially influential variables that could be addressed in future
studies are other teacher characteristics (e.g., race/ethnicity, languages spoken) and student
characteristics (e.g., student behavior, skin color, physical attractiveness).
Conclusion
The purpose of the current study was to investigate teacher judgments of the academic
and interpersonal competence of students based on language status, specifically Spanish-
speaking students versus non-ELL (i.e., non-Spanish-speaking) students. The findings did not
support the hypothesis that teachers would rate non-ELL students (regardless of race/ethnicity)
as having stronger academic and interpersonal skills than their Spanish-speaking counterparts.
Instead, the results suggested that race/ethnicity may be more of an influential factor when
teachers make academic and interpersonal judgments. Non-ELL African American students in
particular were rated as having weaker reading and interpersonal skills than their non-ELL
Hispanic counterparts. This finding supports previous research (e.g., Hodson et al., 2002;
Jussim, 1989; Jussim & Eccles, 1995; Kovel, 1970; Rist, 1970) that teachers may have pre-
existing biases towards students of different races or ethnicities. The third hypothesis that
teachers’ academic and interpersonal judgments would be more accurate for non-ELL versus
ELL students was supported by the current results. Teachers may generally be more accurate

107
about non-ELL students’ academic and social functioning than ELL students. Thus, teachers and
other school service providers may need more training to work with, fairly assess, and make
better judgments about ELL students’ academic capabilities.

108
REFERENCES
Aitchison, J. (1991). Language change: Progress or decay? Cambridge, UK: Cambridge
University Press.
Alva, S. A. (1991). Academic invulnerability among Mexican American students: The
importance of protective resources and appraisals. Hispanic Journal of Behavioral
Sciences, 12, 18-34. doi:10.1177/07399863910131002
Alvidrez, J., & Weinstein, R. S. (1999). Early teacher perceptions and later student
academic achievement. Journal of Educational Psychology, 91, 731-746.
doi:10.1037/0022-0663.91.4.731
Anderson-Clark, T. N., Green, R. J., & Henley, T. B. (2008). The relationship between
first names and teacher expectations for achievement motivation. Journal of
Language and Social Psychology, 27, 94-99. doi:10.1177/0261927X07309514
Atkins-Burnett, S., Meisels, S. J., & Correnti, R. (2000). Analysis to develop third-
grade indirect cognitive assessments and socioemotional measures. In Early Childhood
Longitudinal Study, Kindergarten Class of 1998-99 (ECLS-K) spring 2000 field test
report. (Prepared under contract to the U.S. Department of Education, National Center
for Education Statistics.) Rockville, MD: Westat.
Babad, E. (2009). The social psychology of the classroom. New York, NY: Routledge.
Bates, L. A., & Glick, J. A. (2013). Does it matter if teachers and school match the student?
Racial and ethnic disparities in problem behaviors. Social Science, 42, 1180-1190.
Beady, C. H., & Hansell, S. (1981). Teacher race and expectations for student achievement.
American Educational Research Journal, 18, 191-206.

109
Bennett, R. E., Gottesman, R. L., Rock, D. A., & Cerullo, F. M. (1993). Influence of
behavior perceptions and gender on teachers’ judgments of students’ academic
skill. Journal of Educational Psychology, 85, 347-356. doi:10.1037/0022-0663.85.2.347
Blease, D. (1983). Teacher expectations and the self-fulfilling prophecy. Educational
Studies, 9, 123-129. doi:10.1080/0305569830090206
Bowerman, B. L., & O’Connell, R. T. (1990). Linear statistical models: An applied
approach (2nd ed.). Belmont, CA: Duxbury.
Brophy, J. E. (1983). Research on the self-fulfilling prophecy and teacher expectations.
Journal of Educational Psychology, 75, 631-661. doi:10.1037/0022-0663.75.5.631
Byrnes, D. A., & Kiger, G. (1994). Language attitudes of teachers scale (LATS).
Educational and Psychological Measurement, 54, 227-231.
doi:10.1177/0013164494054001029
Byrnes, D. A., Kiger, G., & Manning, M. L. (1997). Teachers’ attitudes about language
diversity. Teaching and Teacher Education, 13, 637-644. doi:10.1016/S0742-
051X(97)80006-6
Cairns, R. B., Leung, M. C., Gest, S. D., & Cairns, B. D. (1995). A brief method for
assessing social development: Structure, reliability, stability, and developmental validity
of the Interpersonal Competence Scale. Behavioral Research and Therapy, 33, 725-736.
doi:10.1016/0005-7967(95)00004-H
Cheng, L. R., & Butler, K. (1989). Code switching: A natural phenomenon versus language
deficiency. World Englishes, 8, 293-309.

110
Chiu, L. (1997). Development and validation of the School Achievement Motivation
Rating Scale. Educational and Psychological Measurement, 57, 292-305.
doi:10.1177/0013164497057002008
Clair, N. (1993). Beliefs, self-reported practices, and professional development needs of
three classroom teachers with language-minority students. Unpublished doctoral
dissertation. Teachers College, Columbia University. (ERIC Document Reproduction
Service No. ED 365 166).
Cohen, J. (1977). Statistical power analysis for the behavioral sciences. New York: Academic
Press.
Cohen, J. (1992). A power primer. Psychological Bulletin, 112, 155-159.
Cohen, J., Cohen, P., West, S. G., & Aiken, L. S. (2003). Applied multiple
regression/correlation analysis for the behavioral sciences (3rd ed.). Mahwah, NJ:
Erlbaum.
Cummins, J. (1979). Cognitive-academic language proficiency, linguistic interdependence,
optimal age, and some other matters. Working Papers in Bilingualism, 19, 197-205.
Retrieved from http://www.eric.ed.gov
Cummins, J. (1981). The role of primary language development in promoting educational
success for language minority students. In California State Department of Education
(Ed.), Schooling and language minority students: A theoretical framework (pp. 3-49).
Los Angeles, CA: Evaluation, Dissemination, and Assessment Center, California State
University.
Cummins, J. (2001). Negotiating identities: Education for empowerment in a diverse society (2nd
ed.). Ontario, CA: California Association for Bilingual Education.

111
Dare, G. J. (1992). The effect of pupil appearance on teacher expectations. Early Child
Development and Care, 80, 97-101.
DeAvila, A. & Duncan, S. (1990). Language Assessment Scales. Monterey, CA: CTB Macmillan
McGraw-Hill.
De Avila, E. A., & Duncan, S. E. (2000). PreLAS 2000 technical manual, English
forms C and D. Monterey, CA: CTB/McGraw-Hill.
Demaray, M. K., & Elliott, S. N. (1998). Teachers’ judgments of students’ academic
functioning: A comparison of actual and predicted performances. School Psychology
Quarterly, 13, 8-24. doi:10.1037/h0088969
Dominguez de Ramirez, R., & Shapiro, E. S. (2005). Effects of student ethnicity on judgments of
ADHD symptoms among Hispanic and White teachers. School Psychology Quarterly, 20,
268-287.
Dovidio, J. F., Gaertner, S. L., Kawakami, K., & Hodson, G. (2002). Why can’t we just
get along? Interpersonal biases and interracial distrust. Cultural Diversity and Ethnic
Minority Psychology, 8, 88-102. doi:10.1037//1099-9809.8.2.88
Duncan, S. E., & De Avila, E. (1998). PreLAS 2000. Monterey, CA: CTB/McGraw-Hill.
Dunn, L. M., & Dunn, L. M. (1981). Peabody Picture Vocabulary Test-Revised (PPVT-
R). Circle Pines, MN: American Guidance Services.
Dusek, J. B., & Joseph, G. (1983). The bases of teacher expectancies: A meta-analysis.
Journal of Educational Psychology, 75, 327-346. doi:10.1037/0022-0663.75.3.327
112
Eckert, T. L., Dunn, E. K., Codding, R. S., Begeny, J. C., & Kleinmann, A. E. (2006).
Assessment of mathematics and reading performance: An examination of the
correspondence between direct assessment of student performance and teacher report.
Psychology in the Schools, 43, 247-265. doi:10.1002/pits.20147
Edl, H. M., Jones, M. H., & Estell, D. B. (2008). Ethnicity and English proficiency:
Teacher perceptions of academic and interpersonal competence in European American
and Latino students. School Psychology Review, 37, 38-45.
Elmore, T. G. (2010). Colorism in the classroom: An exploration of adolescents’ skin tone, skin
tone preferences, perceptions of skin tone stigma and identity. Dissertation Abstracts
International: Section A. Humanities and Social Sciences, 71 (1), 81.
Fergus, E. (2009). Understanding Latino students’ schooling experiences: The relevance of skin
color among Mexican and Puerto Rican high school students. Teachers College Record,
111, 339-375.
Field, A. (2000). Discovering statistics using SPSS for Windows. London, England: Sage.
Genesee, F., Lindholm-Leary, K., Sanders, W. M., & Christian, D. (2006). Educating
English language learners: A synthesis of research evidence. New York: Cambridge
University Press.
Gill, S., & Reynolds, A. J. (1999). Educational expectations and school achievement of
urban African American children. Journal of School Psychology, 37, 403-424.
doi:10.1016/S0022-4405(99)00027-8
Ginsburg, H. P., & Baroody, A. J. (1990). The Test of Early Mathematics (TEMA-2).
Austin, TX: PROED.

113
Gottlieb, M. (2006). Assessing English language learners: Bridges from language
proficiency to academic achievement. Thousand Oaks, CA: Corwin Press.
Gottesman, R. L., Doino-Ingersoll, J. A., & Cerullo, F. M. (1990). Einstein Assessment of
School-Related Skills. Cleveland, OH: Modern Curriculum Press.
Gresham, F. M., & Elliott, S. N. (1990). The Social Skills Rating System. Circle Pines,
MN: American Guidance Service.
Hecht, S. A., & Greenfield, D. B. (2002). Explaining the predictive accuracy of teacher
judgments of their students’ reading achievement: The role of gender, classroom
behavior, and emergent literacy skills in a longitudinal sample of children exposed to
poverty. Reading and Writing: An Interdisciplinary Journal, 15, 789-809.
doi:10.1023/A:1020985701556
Helwig, R., Anderson, L., & Tindal, G. (2001). Influence of elementary student gender
on teachers’ perceptions of mathematics achievement. The Journal of Educational
Research, 95, 93-102. Retrieved from http://www.heldref.org/pubs/jer/about.html
Hodson, G., Dovidio, J. F., & Gaertner, S. L. (2010). The aversive form of racism. In J.
Chin (Ed.), The psychology of prejudice and discrimination: A revised and condensed
edition. Praeger perspectives: Race and ethnicity in psychology (pp. 1-13). Santa
Barbara, CA: Praeger/ABC-CLIO.
Hidalgo, M. (1988). Perceptions of Spanish-English code-switching in Juarez, Mexico (Research
Paper Series No. 20). Albuquerque, NM: University of New Mexico Press.
Hoge, R. D., & Coladarci, T. (1989). Teacher-based judgments of academic achievement:
A review of literature. Review of Educational Research, 59, 297-313.
doi:10.2307/1170184

114
Hoover, H., Hieronymus, A., Frisbie, D., & Dunbar, S. (1993). Iowa Test of Basic Skills.
Chicago, IL: Riverside.
Hughes, C. E., Shaunessy, E. S., Brice, A. R., Ratliff, M. A., & McHatton, P. A. (2006). Code
switching among bilingual and limited English proficient students: Possible indicators of
giftedness. Journal for the Education of the Gifted, 30, 7-28.
Huttenlocher, J., & Levine, S. C. (1990). The Primary Test of Cognitive Skills (PTCS).
New York: CTB/McGraw Hill.
Jussim, L. (1989). Teacher expectations: Self-fulfilling prophecies, perceptual biases, and
accuracy. Journal of Personality and Social Psychology, 57, 469-480.
doi:10.1037/0022-3514.57.3.469
Jussim, L., & Eccles, J. S. (1992). Teacher expectations II: Construction and reflection of
student achievement. Journal of Personality and Social Psychology, 63, 947-961.
doi:10.1037/0022-3514.63.6.947
Jussim, L., Eccles, J., & Madon, S. J. (1996). Social perception, social stereotypes, and
teacher expectations: Accuracy and the quest for the powerful self-fulfilling prophecy. In
M. Zanna (Ed.), Advances in experimental social psychology, Vol. 28 (pp. 281-388). San
Diego, CA: Academic Press.
Jussim, L., & Harber, K. D. (2005). Teacher expectations and self-fulfilling prophecies:
Knowns and unknowns, resolved and unresolved controversies. Personality and Social
Psychology Review, 9, 131-155. doi:10.1207/s15327957pspr0902_3
Kagan, S. L., & Neuman, M. J. (1998). Lessons from three decades of transition research.
The Elementary School Journal, 98, 365–379.

115
Kaufman, A. S., & Kaufman, N. L. (1985). Kaufman Test of Educational Achievement–
Brief Form. Circle Pines, MN: American Guidance Service.
Kovel, J. (1970). White racism: A psychohistory. New York, NY: Pantheon.
Krashen, S. D. (2003). Explorations in language acquisition. Portsmouth, NH:
Heinemann.
Lumsden, L. (1997). Expectations for students. (ERIC Digest, No. 116) Eugene, OR:
ERIC Clearinghouse on Educational Management. (ERIC Document Reproduction
Service No. ED 409609).
Madon, S. J., Jussim, L., & Eccles, J. (1997). In search of the powerful self-fulfilling
prophecy. Journal of Personality and Social Psychology, 72, 791-809. doi:10.1037/0022-
3514.72.4.791
Markwardt, F. C., Jr. (1989). Peabody Individual Achievement Test-Revised (PIAT-R).
Circle Pines, MN: American Guidance Services.
Marsh, H. W. (1990). Self-Description Questionnaire. Campbelltown, New South Wales,
Australia: University of Western Sydney, Macarthur.
Mashburn, A. J., Hamre, B. K., Downer, J. T., & Pianta, R. C. (2006). Teacher and classroom
characteristics associated with teachers’ ratings of prekindergarteners’ relationships and
behaviors. Journal of Psychoeducational Assessment, 24, 367-380.
doi: 10.1177/0734282906290594
McClendon, G. O. (2010). Illinois secondary school principals’ perceptions and expectations
concerning students who use African American vernacular English in an academic
setting. Dissertation Abstracts International: Section A. Humanities and Social Sciences,
71 (6), 1961.

116
Merton, R. K. (1968). Social theory and social structure. New York: Free Press.
Montero, M., & McVicker, P. (2006). The impact of experience and coursework:
Perceptions of second language learners in the mainstream classroom. Radical Pedagogy,
8, (np).
Montgomery, D. (1997). Identification of an English proficiency measure for the Early
Childhood Longitudinal Study. Palo Alto, CA: American Institutes for Research.
Narvaez, R. C. (2013). Intergroup differences between Hispanic students and European
American teachers in urban schools. Dissertation Abstracts International: Section A.
Humanities and Social Sciences, 74.
National Center for Education Statistics. (2007). The condition of education 2007 (NCES
2007064). Washington, DC: U. S. Department of Education.
No Child Left Behind Act of 2001, 20 U.S.C. § 6301 et seq. (2002).
Penfield, J. (1987). ESL: The regular classroom teacher’s perspective. TESOL Quarterly,
21, 21-39. Retrieved from http://www.tesol.org
Pigott, R. L., & Cowen, E. L. (2000). Teacher race, child race, racial congruence, and teacher
ratings of children’s school adjustment. Journal of School Psychology, 38, 177-196.
Rasch, G. (1960). Probabilistic models for some intelligence and attainment tests.
Copenhagen: Danmarks Paedagogiske Institute.
Raudenbush, S. W. (1984). Magnitude of teacher expectancy effects on pupil IQ as a
function of the credibility of expectancy induction: A synthesis of findings from
18 experiments. Journal of Educational Psychology, 76, 85-97. doi:10.1037/0022-
0663.76.1.85

117
Reeves, J. R. (2002). Secondary teachers’ attitudes and perceptions of the inclusion of
ESL students in mainstream classes. (Doctoral dissertation, University of Tennessee,
2002). Dissertation Abstracts International, 63, 8.
Reeves, J. R. (2006). Secondary teacher attitudes toward including English-language
learners in mainstream classrooms. The Journal of Educational Research, 99, 131-142.
doi:10.3200/JOER.99.3.131-143
Reid, D. K., Hresko, W. P., & Hammill, D. D. (1981). Test of Early Reading Ability
(TERA-2). Austin, TX: PRO-ED.
Rist, R. C. (1970). Student social class and teacher expectations: The self-fulfilling
prophecy in ghetto education. Harvard Educational Review, 40, 266-301. Retrieved from
http://www.hepg.org/her
Rosenthal, R. (1963). On the social psychology of the psychological experiment: The
experimenter’s hypothesis as unintended determinant of experimental results. American
Scientist, 51, 268-283. Retrieved from http://www.americanscientist.org
Rosenthal, R. (1966). Experimenter effects in behavioral research. New York, NY:
Appleton-Century-Crofts.
Rosenthal, R., & Jacobson, L. (1968). Pygmalion in the classroom. New York: Holt,
Rinehart, &Winston.
Rubie-Davies, C., Hattie, J., & Hamilton, R. (2006). Expecting the best for students:
Teacher expectations and academic outcomes. British Journal of Educational
Psychology, 76, 429-444. doi:10.1348/000709905X53589
118
Rueda, R., & Garcia, E. (1996). Teachers’ perspectives on literacy assessment and
instruction with language-minority children: A comparative study. The Elementary
School Journal, 96, 311-332. doi:10.1086/461830
Saft, E. W., & Pianta, R. C. (2001). Teachers’ perceptions of their relationships with students:
Effects of child age, gender, and ethnicity of teachers and children. School Psychology
Quarterly, 16, 125-141.
Schrank, F., Fletcher, T.V., & Alvarado, C. G. (1996). Comparative validity of three
English language oral proficiency tests. The Bilingual Research Journal, 20, 55-68.
Smith, M. L. (1980). Teacher expectations. Evaluation in Education, 4, 53-55.
Smith, Y. L. (1977). The relationship of skin color and teacher perception of pupil behavior in
the classroom. Dissertation Abstracts International, 37 (9), 5669-5670.
Song, G. (1998). A study of the influential factors of school teacher’s expectation.
Psychological Science (China), 21, 83-84, 86.
Stouffer, S. (1949). The American soldier: Volume 1. Adjustment during army life.
Princeton, NJ: Princeton University Press.
Tenenbaum, H. R., & Ruck, M. D. (2007). Are teachers’ expectations different for racial
minority than for European American students? A meta-analysis. Journal of Educational
Psychology, 99, 253-273. doi: 10.1037/0022-0663.99.2.253,
Thomas, W.P. & Collier, V.P. (1997). School effectiveness for language minority
students (NCELA Report No. 9). Retrieved from National Clearinghouse for English
Language Acquisition website: http://www.ncela.gwu.edu/rcd/bibliography/BE020890/

119
Tompkins, R. C., & Boor, M. (1980). Effects of students’ physical attractiveness and
name popularity on student teachers’ perceptions of social and academic attributes.
Journal of Psychology: Interdisciplinary and Applied, 106, 37-42. doi:
10.1080/00223980. 1980.9915168
U.S. Department of Education, National Center for Education Statistics (2002). Early
Childhood Longitudinal Study - Kindergarten Class of 1998-99 (ECLS-K) psychometric
report for kindergarten through first grade (NCES 2002-05). Washington, DC: Author.
U.S. Department of Education, National Center for Education Statistics (2004). Early
Childhood Longitudinal Study - Kindergarten Class of 1998-99 (ECLS-K) user's manual
for the ECLS-K public-use data file and electronic code book (NCES 2004-001).
Washington, DC: Author.
U.S. Department of Education, National Center for Education Statistics (2005). Early
Childhood Longitudinal Study - Kindergarten Class of 1998-99 (ECLS-K) psychometric
report for the third grade (NCES 2005-062). Washington, DC: Author.
Van der Oord, S., Van der Meulen, E. M., Prins, P. G. M., Oosterlaan, J., Buitelaar, J. K.,
Emmelkamp, P. M. G. (2005). A psychometric evaluation of the social skills
rating system in children with attention deficit hyperactivity disorder. Behaviour
Research and Therapy, 43, 733-746. doi: 10.1016/j.brat.2004.06.004
Vollmer, G. (2000). Praise and stigma: Teachers’ constructions of the ‘typical’ ESL
student. Journal of Intercultural Studies, 21, 53-66. Retrieved from
http://www.tandf.co.uk/ journals/titles/07256868.asp

120
Williams, F., Whitehead, J. L., & Miller, L. (1972). Relations between language attitudes
and teacher expectancy. American Educational Research Journal, 9, 263-277.
doi:10.2307/1161687
Woodcock, R. W. (1991). Woodcock Language Proficiency Battery Revised. Chicago, IL:
Riverside.
Woodcock, R. W., & Bonner, M. (1989). The Woodcock-Johnson Tests of Achievement-
Revised. Itasca, IL: Riverside.
Woodcock, R.W., McGrew, K.S., & Werder, J.K. (1996). Woodcock-McGrew-Werder
Mini-Battery of Achievement. Itasca, IL: Riverside.
Wolfe, C. T., & Spencer, S. J. (1996). Stereotypes and prejudice: Their overt and subtle
influence in the classroom. The American Behavioral Scientist, 40, 176-185.
doi:10.1177/0002764296040002008
Youngs, C. S., & Youngs, G. A., Jr. (2001). Predictors of mainstream teachers’ attitudes
toward ESL students. TESOL Quarterly, 35, 97-120. doi:10.2307/3587861

Curriculum Vita
Miranda E. Freberg EDUCATION Ph.D. School Psychology, The Pennsylvania State University, University Park, PA, 2014
Specialization in Culture and Language Education M.Ed. School Psychology, The Pennsylvania State University, University Park, PA 2007 B.S. Psychology, Magna Cum Laude, Colby College, Waterville, ME 2000 Boston University London Internship Program, 1999 PROFESSIONAL CREDENTIAL Certified School Psychologist – Pennsylvania Department of Education PROFESSIONAL EXPERIENCE School Psychologist, ASPIRA, Inc., Olney Charter High School, Philadelphia, PA (2013 – present) School Psychologist, ASPIRA, Inc., Antonia Pantoja Bilingual Community Charter School, Philadelphia, PA (2011- 2013) School Psychologist, CORA Services, Philadelphia, PA (2009-2011) School Psychology Intern, CORA Services, Philadelphia, PA (2008-2009) Specialization in Culture and Language Education Practicum Student, State College School District, State College, PA (2007-2008) Student Supervisor, The Pennsylvania State University CEDAR Clinic, University Park (2007-2008) School Psychology Student Clinician, The Pennsylvania State University CEDAR Clinic, University Park (2005-2008) Graduate Teaching Assistant, Department of Human Development and Family Studies, The Pennsylvania State University, University Park, PA (2005-2006) Youth Minister, St. Thomas Episcopal Church, Lancaster, PA (2002-2004) Therapeutic Support Staff, Philhaven Behavioral Healthcare Services, Mt. Gretna, PA (2001-2004) Paraeducator, Life Skills Support, Lancaster-Lebanon Intermediate Unit 13, Lancaster, PA (2000) AFFILIATIONS American Psychological Association – Division 16 National Association of School Psychologists Association of School Psychologists of Pennsylvania School Psychology Student Group, The Pennsylvania State University, Founding Member Charter Committee (Chair), Outreach Committee Psi Chi Honor Society PUBLICATIONS AND PRESENTATIONS Reid, E. E., Goffreda, C. T., Culler, E. D., McGinnis, A. M., Miller, A. R., Reid, M. A., Freberg., M. E., Meyer, E.
L., & Hahn, K. R. (2009, February). Construct validity of the WJ-III Cognitive among adjudicated adolescents. Poster presentation at the annual convention of the National Association of School Psychologists, Boston, MA.
Freberg, M. E., Vandiver, B. J., Watkins, M. W., & Canivez, G. L. (2008). Factor score variability and the validity of the WISC-III FSIQ in predicting later academic achievement. Applied Neuropsychology, 15, 131-139.
Freberg, M. E., Vandiver, B. J., Watkins, M. W. & Canivez, G. L. (2008, February). Significant Factor Score Variability and the Validity of the WISC-III FSIQ. Poster presentation at the annual convention of the National Association of School Psychologists, New Orleans, LA.