Embed Size (px)
Citation preview

English Housing SurveyHousing Stock Report 2009

The United Kingdom Statistics Authority has designated these statistics as National Statistics, in accordance with the Statistics and Registration Service Act 2007 and signifying compliance with the Code of Practice for Official Statistics.
Designation can be broadly interpreted to mean that the statistics:
• meet identified user needs;
• are well explained and readily accessible;
• are produced according to sound methods, and
• are managed impartially and objectively in the public interest.
Once statistics have been designated as National Statistics it is a statutory requirement that the Code of Practice shall continue to be observed.

English Housing SurveyHousing Stock Report 2009
July 2011Department for Communities and Local Government

Department for Communities and Local GovernmentEland HouseBressenden PlaceLondon SW1E 5DUTelephone: 030 3444 0000Website: www.communities.gov.uk
© Crown Copyright, 2011
Copyright in the typographical arrangement rests with the Crown.
This publication, excluding logos, may be reproduced free of charge in any format or medium for research, private study or for internal circulation within an organisation. This is subject to it being reproduced accurately and not used in a misleading context. The material must be acknowledged as Crown copyright and the title of the publication specified.
You may re-use this information (not including logos) free of charge in any format or medium, under the terms of the Open Government Licence. To view this licence, visit http://www.nationalarchives.gov.uk/doc/open-government-licence/ or write to the Information Policy Team, The National Archives, Kew, London TW9 4DU, or e-mail: [email protected].
If you require this publication in an alternative format please email [email protected]
DCLG PublicationsTel: 030 0123 1124Fax: 030 0123 1125
Email: [email protected] via the website: www.communities.gov.uk
July 2011
ISBN: 978-1-4098-3019-1

| 3
Contents
Acknowledgements 5
Introduction 6
Chapter 1 Report summary 8
Chapter 2 Stock profile and occupancy 11
Chapter 3 Amenities and services 22
Chapter 4 Dwelling condition 31
Chapter 5 Dwelling safety 40
Chapter 6 Energy performance 49
Chapter 7 Energy improvement potential 59
Appendix: Sampling errors 71
Glossary of key definitions and terms 74

Acknowledgements | 5
AcknowledgementsThe English Housing Survey (EHS) is dependent on a number of people and organisations involved in the survey’s design, management, data collection, processing and analysis. The Department for Communities and Local Government would like to thank in particular:
The Office for National Statistics (ONS) who manage the EHS on behalf of the Department. ONS undertake the household interviews and the subsequent data validation and creation of derived analytical measures. It also has responsibilities for the sampling and weighting of the data sets and for the running of the Market Value Survey. ONS are also involved in the production of tables and analytical reports.
Miller Mitchell Burley Lane (MMBL) who undertake the visual inspection of the properties working in partnership with ONS. MMBL employ and manage a large field force of professional surveyors who work in close co-operation with the ONS interviewers to maximise response rates and deliver high quality data.
The Building Research Establishment (BRE) which is the development partner of the Department for the EHS. BRE helps develop the physical survey questionnaire and surveyor training materials, and delivers the surveyor training sessions. The BRE have also had responsibility for developing and implementing a new automated data collection and validation process for the physical survey. It is involved in analysing the data and developing and running models to create the key measures and analytical variables for the survey, and reporting the findings.
The Valuation Office Agency (VOA) who provide market valuations for a sub-sample of the EHS properties and information on the local area and housing market.
The interviewers and surveyors who collect information from households and carry out the visual inspection.
The households who take part in the survey.
The Department’s staff who manage and work on the survey.

6 | English Housing Survey Housing Stock Report 2009
Introduction
1. In April 2008 the English House Condition Survey was integrated with the Survey of English Housing to form the English Housing Survey (EHS). This 2009 report provides the second detailed Housing Stock Report from the survey. Headline results for 2009 were published in the English Housing Survey Headline Report 2009-10 in February 2011.
2. In parallel to this report, an EHS Household Report has also been published which presents results about household characteristics and circumstances.
3. Chapter 1 of this report provides an overview of the 2009 survey findings, covering each of the chapters. Chapter 2 focuses on stock and occupancy, and looks at the types of dwellings key groups of households live in. Amenities and services, including WC provision, parking and security are addressed in Chapter 3. Dwelling condition is tackled in chapter 4, including the incidence of faults to key building elements, repair costs and problems with damp and mould growth. Chapter 5 examines issues relating to the safety of the dwelling with particular focus on those related to accidents and to fire. The final two chapters cover the energy performance of dwellings. Chapter 6 looks at the uptake of heating and insulation measures in the housing stock and its current performance in terms of energy efficiency and the carbon emissions (CO2) associated with heating, lighting and ventilating the home. Chapter 7 focuses on cost effective improvements that could be carried out and the impact these could make for energy efficiency and carbon emissions.
4. The 2009 Summary Statistics Tables for the key measures of condition and energy performance have been published alongside the report in a separate volume. Detailed Annex Tables providing underpinning data for the figures and text of the chapters can also be found on the EHS website alongside this report. There are references to these Annex Tables throughout the text of the report.
5. This 2009 report is a slimmed down more focused report than that published in 20081 which provided broader and more detailed analyses. In some chapters the previous year’s report is referred to where 2009 trends and patterns have not changed significantly from 2008.
6. As with the previous English House Condition Survey (EHCS), the EHS has three component surveys: a household interview, followed by a physical inspection and a market value survey of a sub sample of the properties. Methodological and technical details are available in the Technical Advice Notes on the EHS website.
7. Results for the EHS Housing Stock Report are presented for ‘2009’ and are based on survey fieldwork carried out between April 2008 and March 2010
1 http://www.communities.gov.uk/publications/corporate/statistics/ehs2008stockreport

Introduction | 7
(a mid-point of April 2009). The sample comprises of 16,150 occupied or vacant dwellings where a physical inspection was carried out. This is referred to as the ‘dwelling sample’ throughout the report. There are 15,512 cases where as well as a physical inspection, an interview with the household was also secured. This is referred to as the ‘household sub-sample’.
8. Each estimate from the survey (as with all sample surveys) has a margin of error associated with it arising from sampling and design effects and from measurement error. Details of standard errors and confidence intervals for key variables are provided in an appendix. Caution needs to be exercised in interpreting some details, as differences may not always be statistically significant. Text draws attention only to differences that are significantly different at the 95% confidence interval.
9. Information on the English Housing Survey can be accessed via this link http//www.communities.gov.uk/housing/housingresearch/housingsurveys/ Information and past reports on the Survey of English Housing and the English House Condition Survey can also be accessed via this link. The dataset will be made available to users via the UK Data Archive, http://www.data-archive.ac.uk/
10. If you have any queries about this report or would like any further information please contact [email protected]
11. Responsible Statistician: Meg Green, Deputy Director. Contact via [email protected]

8 | English Housing Survey Housing Stock Report 2009
Chapter 1 Report summary
1.1 In 2009, there were 22.3 million dwellings in England and around 1 million of these dwellings were vacant at time of survey. Some 15.0 million (67%) were owner occupied, about one in six (16%) were privately rented and the remaining 17% was split fairly evenly between local authorities and housing associations.
1.2 England has one of the oldest housing stocks in Europe and in 2009, 38% (8.8 million) of all dwellings had been built before 1945; over half of these (4.8 million) were built before 1919. The social sector contained a much lower proportion of stock built before 1945 than the private sector: 19% of local authority and 18% of housing association stock was built before 1945 compared to 39% of owner occupied and 53% of private rented stock.
1.3 Only around 19% of the stock was flats; most of these were purpose built low rise flats. The most common types of dwellings were terraced houses (29%) and semi-detached houses (26%). Detached houses were much more likely to be found in the owner occupied sector (23%) than in other sectors. Less than 1% of dwellings in the social sector were detached houses.
1.4 There have been a number of improvements in condition and performance in recent years although some aspects have improved more than others and not all groups of dwellings or households have benefitted to the same extent.
1.5 Looking first at amenities, the percentage of dwellings with a second WC increased from 31% to 41% between 1996 and 2009 and most of this increase was in the private sector. However, in 2009 there were still over a third (35%) of households with five or more people who had just one WC which was located in the bathroom. The proportion of dwellings with secure windows and doors increased significantly from 53% in 2001 to 74% in 2009. This increase was most pronounced for private rented dwellings (from 37% to 63%) and those owned by local authorities (43% to 73%). The proportion of dwellings with garages or other off street parking increased from 61% in 1996 to 66% in 2009. However, in 2009 over a third (36%) of dwellings in city centres were reliant on inadequate street parking and 11% had no parking provision whatsoever.
1.6 Without adequate ongoing maintenance, repair and replacement work dwellings will fall progressively further into disrepair over time. However there has been a significant reduction in the amount of disrepair since 2001 with the average basic2 repair cost falling by around 37% from £19/m² to £12/m² (both at 2001 prices). The largest reduction was evident in the private rented sector
2 Basic repairs include urgent work required in the short term to tackle problems presenting a risk to health, safety, security or further significant deterioration plus any additional work that will become necessary within the next five years. Costs are standardised for regions and tenures.
Chapter 1 Report Summary | 9
where costs fell by 50%; although this sector still had much higher average repair costs than other tenures in 2009.
1.7 In 2009, some 20% (4.2 million) households lived in homes with substantial disrepair (with basic repair costs over £20/m² at 2009 prices). This proportion was higher for certain groups including single person households (23%), those in poverty (26%) and those from ethnic minority groups (27%). The “same” groups sometimes faced very different levels of disrepair in the private and social sectors. Single person households, those in poverty and households over 60 years of age were much more likely to live in homes with substantial disrepair in the private sector than the social rented sector whereas the reverse was true for households containing five or more people, and households with any children under five years of age.
1.8 The percentage of dwellings with damp problems reduced slightly from 10% in 2001 to 8% in 2009. Again, the most noticeable improvements were evident in the private rented sector although private rented dwellings continued to have more problems with damp compared to dwellings in other tenures. The level of such problems has remained relatively constant for social rented dwellings over the same period.
1.9 In 2009 the incidence of damp problems was greatest among private renters as a whole (15%), but particularly for households in poverty (22%) and those from ethnic minorities (21%) within this sector. Some 10% of social renters had damp problems in their home but this rose to 17% for those containing four or more people..
1.10 The overall improvement in damp problems is very modest because the percentage of homes with serious condensation and mould growth has not reduced. While household behaviours can play a part (e.g. in not ventilating the kitchen or bathroom adequately), dwelling and occupancy factors have a critical role to play in this. It is difficult for any household – but particularly a large household – to avoid such problems developing if they live in a home that is cramped or overcrowded and has inadequate insulation and provision for heating and ventilation.
1.11 In 2009, 12% of dwellings were assessed to have a Category 1 Housing Health and Safety Rating System (HHSRS) hazard relating to one of the four categories of falls. In many cases these were the result of disrepair (e.g. broken or missing handrails to stairs or cracked paving) rather than design and as such were often relatively inexpensive to remedy. For example around half of the dwellings with Category 1 hazards related to falls on stairs and falls on level surfaces could have the risks reduced to an acceptable level by carrying out works costing less than £500.
1.12 Electrical Safety has improved significantly since 2001 – especially for rented dwellings in both the private and social sectors. The percentage of private rented dwellings with Residual Current Devices (RCDs) present increased from 35% in 2001 to 61% in 2009. However, in 2009 less than half (44%) of

10 | English Housing Survey Housing Stock Report 2009
households lived in homes with fully modern wiring3. However, this varied from 41% for owner occupiers to 60% for housing association tenants and was particularly low for certain groups of owner occupiers: households containing one or more people aged 60 or over (34%) and those who had lived in their home for at least 20 years (27%).
1.13 The average energy efficiency (SAP4) rating for the whole stock has increased steadily over time from 42 in 1996 to 53 in 2009. Improvement was evident in all tenures, especially for local authority and private rented dwellings where the average SAP rating rose by 14 points (from 46 to 60 and from 38 to 52 respectively). However in 2009 there were still 3.3 million dwellings in the lowest Energy Efficiency Rating (EER) bands F and G (where the SAP rating is less than 39) and the average annual CO2 emissions for a dwelling in England were 6.0 tonnes per year5. Some 14% of households still live in a home in EER bands F and G and this proportion is even higher for households containing one or more people aged 60 or over (18%). Older people are generally more at risk of health problems arising from a cold home than younger people.
1.14 While improvement activity, especially in the social sector, has achieved a great deal over the last decade, there remains considerable potential for further improvement in energy efficiency and reduction of carbon emissions by carrying out cost effective measures such as cavity wall and loft insulation and upgrading central heating boilers to condensing types. If (low and higher) cost effective measures detailed in the Energy Performance Certificate were carried out to all 19.3 million dwellings that would benefit from them (at an average cost of just over £1,400 per improved dwelling), the average SAP rating would increase from 53 to 63 and the average carbon emissions could be reduced from 6.0 to 4.6 tonnes/year. However, there would remain a ‘hard core’ of dwellings that could not be improved to a reasonable standard by these measures alone (e.g. because such dwellings do not have cavity walls or have no connection to mains gas supply). Further measures such as solid wall insulation and solar water heating offer the potential to achieve greater efficiency but these measures may not always be affordable, acceptable or straightforward to implement in practice.
3 Defined as dwellings were all of the following conditions were met for all wiring present: wiring is PVC coated; earthing is modern; consumer units are modern; Residual Current Devices (RCDs) are present (in consumer unit or separate); and Miniature Circuit Breakers (MCBs) are present.
4 The Standard Assessment Procedure (SAP) is the Government’s recommended method for assessing the energy efficiency of dwellings (on a scale of 1 to 100, the latter being the most efficient) which is also used in the Energy Performance Certificate. SAP ratings employ standard assumptions for the occupancy and the heating, lighting and ventilation of each dwelling to enable comparisons to me made between dwellings and before and after improvement activity. These assumptions are also employed to determine the carbon emissions associated with the dwelling’s use. See the Glossary for more details on the approach used.
5 The Energy Efficiency Rating (EER) of the Energy Performance Certificate groups SAP ratings into seven bands (A to G) with A the most and G the least efficient. See the Glossary for details.

Chapter 2 Stock profile and occupancy | 11
Chapter 2 Stock profile and occupancy
2.1 This chapter examines the overall profile of the housing stock by age, dwelling type and tenure. It also examines how far certain groups of households are concentrated in particular groups of stock in the different tenures. For more details about dwelling size, construction and materials and vacant dwellings see the 2008 report.
Key findings
• In 2009, there were 22.3 million dwellings in England. Some 15.0 million (67%) were owner occupied, about one in six (16%) were privately rented and the remaining 17% was split fairly evenly between local authorities and housing associations.
• Overall, there were 8.8 million (38%) dwellings in England that had been built before 1945; over half of these (4.8 million) were built before 1919.
• Around 19% of the dwelling stock was flats; most of these were purpose built low rise flats. The most common types of dwellings were terraced houses (29%) and semi-detached houses (26%).
• Almost half (47%) of local authority stock and over a third of housing association (36%) stock comprised purpose built flats, compared to 24% of private rented and 7% of owner occupied stock.
• Households containing at least one child aged under five were more likely to live in terraced or semi-detached houses than other households (67% compared with 53%) and less likely to live in flats (16% compared with 19%) and much less likely to occupy bungalows (1% compared with 10%).
• Households that included one or more people with a disability or long term illness were twice as likely to live in bungalows than other households (15% compared with 7%) although they were equally likely to live in flats (18% compared with 19%). Some 41% of this group in the social rented sector lived in flats compared with 31% in the private rented sector and 7% in the owner occupied sector.

12 | English Housing Survey Housing Stock Report 2009
Housing stock profile
2.2 In 2009, there were 22.3 million dwellings in England, around 1 million of which were vacant at the time of the survey. The majority of vacant dwellings (85%) were privately owned.
2.3 In the stock as a whole, some 15.0 million dwellings (67%) were owner occupied, about one in six (16%) were privately rented and the remaining 17% was split fairly evenly between local authorities and housing associations, Figure 2.1.
Figure 2.1: Number of dwellings by tenure, 2009
0.0
2.0
4.0
6.0
8.0
10.0
12.0
14.0
16.0
owner occupied private rented local authority housing association
mill
ions
of
dwel
lings
Base: all dwellingsSource: English Housing Survey 2009, dwelling sample
2.4 However, the age and dwelling type profiles of the stock varied by tenure (more detailed information on dwelling age, type and size can be found in the 2009 EHS Summary Statistics). The owner occupied sector contained by far the largest proportion of detached houses (23%) and a fairly high proportion of homes built before 1919 (21%). In the private rented sector around two-fifths of homes had been built before 1919 but there was also a relatively high proportion (14%) built after 1990. The local authority and housing association stocks contained the largest proportions of purpose built flats (47% and 36% respectively). The housing association stock had the highest proportion of dwellings built after 1990 (19%) (Figure 2.2).
2.5 Figure 2.3 shows the age profile of the overall stock and of the different tenures. The social sector contained a much lower proportion of stock built before 1945 than the owner occupied or private rented stock: 19% of local authority and 18% of housing association stock was built before 1945 compared to 39% of owner occupied and 53% of private rented stock. Almost three quarters (74%) of local authority stock had been built between 1945 and 1980.

Chapter 2 Stock profile and occupancy | 13
Figure 2.2: Percentage of dwellings in each tenure group with selected characteristics, 2009
0
10
20
30
40
50
built before1919
built after1990
detachedhouses
purposebuilt flats
converted flats
selected age groups selected types
% w
ithin
ten
ure
grou
p
owner occupied private rented local authority housing association
Base: all dwellingsNote: underpinning data are presented in Annex Table 2.1Source: English Housing Survey 2009, dwelling sample
Figure 2.3: Percentage of dwellings by age band by tenure, 2009
0 10 20 30 40 50 60 70 80 90 100
owner occupied
private rented
local authority
housing association
all tenures
percentage of dwellings
pre 1919 1919-44 1945-64 1965-80 1981-90 post 1990
Base: all dwellingsNote: underpinning data are presented in Annex Table 2.2Source: English Housing Survey 2009, dwelling sample
2.6 Within each tenure, at least a quarter of the stock comprised terraced houses, with the highest proportion (34%) in the private rented sector and the lowest (25%) in the local authority sector. Detached houses were much more likely to be found in the owner occupied sector – almost a quarter (23%) of owner occupied dwellings were detached houses compared with less than 1% in the social sector, Figure 2.4.

14 | English Housing Survey Housing Stock Report 2009
2.7 The rented sectors contained much higher proportions of flats than the owner occupied sector. Converted flats were most likely to be found in the private rented sector (15%). Around one in six (15%) of private rented dwellings were converted flats compared with less than 5% in the other sectors. Purpose built flats were far more common in the social than the private sector. Almost half (47%) of local authority stock and over a third (36%) of housing association stock comprised purpose built flats, compared to 24% of private rented and 7% of owner occupied stock.
Figure 2.4: Percentage of dwellings by type by tenure, 2009
0 10 20 30 40 50 60 70 80 90 100percentage of dwellings
terraced house semi-detached house detached house
bungalow converted flat purpose built flat
owner occupied
private rented
local authority
housing association
all tenures
Base: all dwellingsNote: underpinning data are presented in Annex Table 2.3Source: English Housing Survey 2009, dwelling sample
The housing of key vulnerable or disadvantaged households
2.8 This section examines what type of dwellings ‘key’ groups of households live in, both across the stock as a whole and in the main tenures6. The household groups chosen are those that are either more likely to be vulnerable to poor housing conditions in terms of health impacts (households that include people aged 60 years or more, children under five, or people with a disability or long term health problem), or more likely to be constrained in their housing choices either as a result of limited income (households in relative poverty) or pressures and cultural factors related to ethnicity (ethnic minority households).
6 Local authority and housing association stock have been combined in this section because of limitations in the sample size when looking at detailed tabulations.

Chapter 2 Stock profile and occupancy | 15
2.9 The detailed definition of each of these household groups is provided in the Glossary. The purpose of looking at the types of housing these key groups tend to occupy is to provide a broader context for understanding why they are more or less likely to live in homes with problems related to the provision of amenities, condition, safety and energy performance that are described in later chapters.
Households with very young children
2.10 Across all tenures, households containing at least one child aged under five were more likely to live in terraced or semi-detached houses than other households (67% compared with 53%). They were less likely to live in flats (16% compared with 19%) and much less likely to occupy bungalows (1% compared with 10%). However, there were noticeable differences by tenure, reflecting the overall dwelling type profiles of the different tenures. In the owner occupied sector only 5% of households with children under five lived in flats compared with 25% of such households who rented privately and 36% who rented from a social landlord, Figure 2.5.
Figure 2.5: Percentage of households with and without under fives in different dwelling types by tenure, 2009
0 10 20 30 40 50percentage of households
60 70 80 90 100
nounder 5s
withunder 5s
nounder 5s
withunder 5s
nounder 5s
withunder 5s
nounder 5s
withunder 5s
owne
roc
cupi
edpr
ivat
ere
nted
soci
alre
nted
all
tenu
res
small terraced house medium/large terraced housedetached house bungalowpurpose built flat, low rise purpose built flat, high rise
semi-detached houseconverted flat
Base: all householdsNote: underpinning data are presented in Annex Table 2.4Source: English Housing Survey 2009, household sub-sample
2.11 Overall, 23% of households with under fives lived in a dwelling built before 1919 compared with 21% of other households. Again there was considerable

16 | English Housing Survey Housing Stock Report 2009
variation by tenure – just 7% of those with under fives who rented from social landlords lived in a pre 1919 dwelling compared with 25% of owner occupiers and 32% of private renters. However, those with under fives in the private rented sector were actually less likely to live in pre 1919 homes than other households renting privately (32% compared with 40%) whereas the reverse was true for owner occupiers.
2.12 In the owner occupied and social rented sectors, households with children under five were more likely to live in newer homes than other households, but the reverse was true in the private rented sector, Figure 2.6. Around 12% of all households with under fives lived in the newest homes (built after 1990) but in the owner occupied sector the proportion was 19%.
Figure 2.6: Percentage of households with and without under fives by dwelling age by tenure, 2009
nounder 5s
withunder 5s
nounder 5s
withunder 5s
nounder 5s
withunder 5s
nounder 5s
withunder 5s
owne
roc
cupi
edpr
ivat
ere
nted
soci
alre
nted
all
tenu
res
0 10 20 30 40 50percentage of households
60 70 80 90 100
pre 1919 1919-44 1945-64 1965-80 1981-90 post 1990
Base: all householdsNote: underpinning data are presented in Annex Table 2.5Source: English Housing Survey 2009, household sub-sample
Households with older people
2.13 Households containing at least one person aged 60 or over were almost five times more likely to live in bungalows than other households (19% compared with 4%) and this was most pronounced in the social rented sector (23% compared to 3%). Households with older people were also less likely to live in flats (15% compared with 21%) although this varied by tenure, reflecting the overall dwelling type profiles of the different tenures. In the owner occupied sector only 7% of households with people aged 60 or over lived in flats compared with 25% of such households who rented privately and 44% who rented from a social landlord, Figure 2.7.

Chapter 2 Stock profile and occupancy | 17
Figure 2.7: Percentage of households with and without people aged 60 or over by dwelling type by tenure, 2009
owne
roc
cupi
edpr
ivat
ere
nted
soci
alre
nted
all
tenu
res
0 10 20 30 40 50percentage of households
60 70 80 90 100
no 60+
with 60+
no 60+
with 60+
no 60+
with 60+
no 60+
with 60+
small terraced house medium/large terraced housedetached house bungalowpurpose built flat, low rise purpose built flat, high rise
semi-detached houseconverted flat
Base: all householdsNote: underpinning data are presented in Annex Table 2.6Source: English Housing Survey 2009, household sub-sample
2.14 Households containing older people were generally less likely to live in pre 1919 dwellings than other households (16% compared with 24%) and also less likely to live in the newest homes built after 1990 (8% compared with 15%).
Households containing people with a disability or long term illness
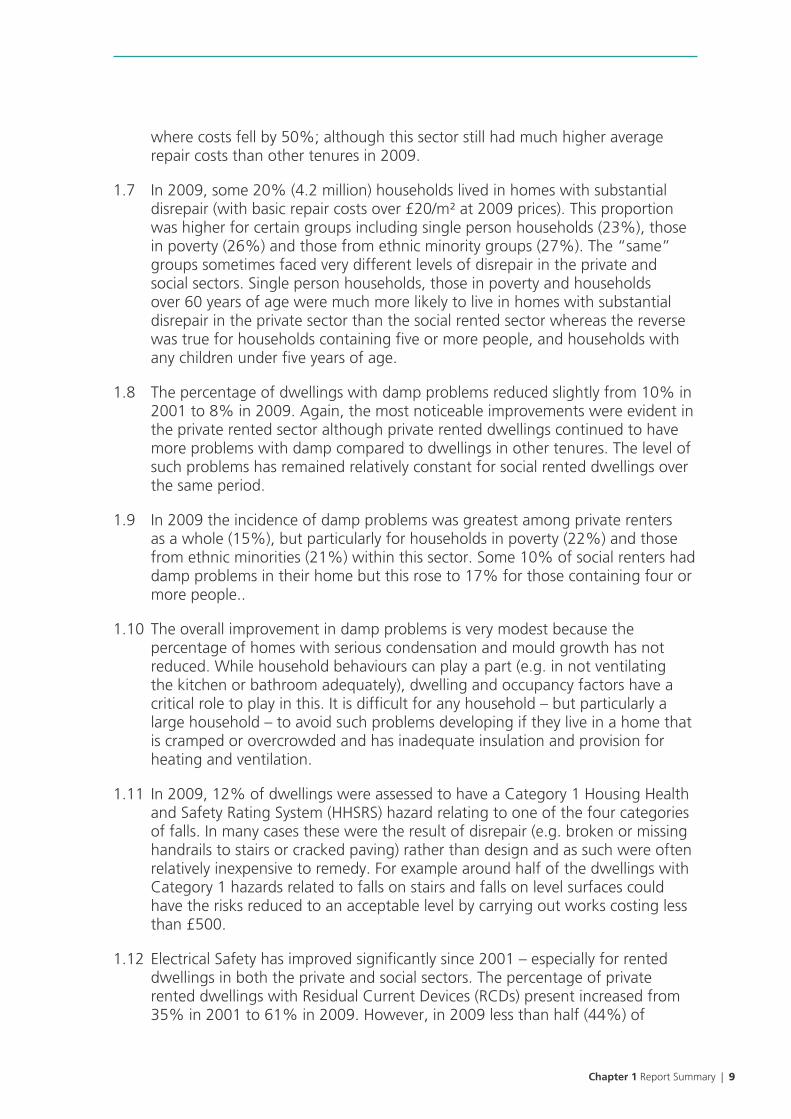
2.15 Households that included one or more people with a disability or long term illness (see Glossary) were twice as likely to live in bungalows than other households (15% compared with 7%) although they were equally likely to live in flats (18% compared with 19%). Again there were large tenure differences; some 41% of this group in the social rented sector lived in flats compared with 31% in the private rented sector and 7% in the owner occupied sector. Half (50%) of this group in the owner occupied sector lived in detached or semi-detached houses compared with just 18% in the social rented sector.
2.16 Although households with disabled/long-term ill members were less likely to live in pre 1919 homes than other groups overall (17% compared with 23%), this was partly because a relatively high proportion of this group (23%) lived in the social rented sector which has a far lower percentage of homes dating from this period. Looking within the three tenures, there were no noticeable differences in the age profile of homes occupied by this group and other households.
18 | English Housing Survey Housing Stock Report 2009
Figure 2.8: Percentage of households with and without people with a disability or long term illness by dwelling type by tenure, 2009
owne
roc
cupi
edpr
ivat
ere
nted
soci
alre
nted
all
tenu
res
0 10 20 30 40 50percentage of households
60 70 80 90 100
withdisabled/ill
nodisabled/ill
withdisabled/ill
nodisabled/ill
withdisabled/ill
nodisabled/ill
withdisabled/ill
nodisabled/ill
small terraced house medium/large terraced housedetached house bungalowpurpose built flat, low rise purpose built flat, high rise
semi-detached houseconverted flat
Base: all householdsNote: underpinning data are presented in Annex Table 2.7Source: English Housing Survey 2009, household sub-sample
Households in poverty
2.17 Households in poverty are defined as households whose equivalised income is less than 60% of the median value (see Glossary for further details). Households in poverty were much more likely to live in flats than other households (28% compared with 16%). However, this arose largely because a high proportion of this group lived in social rented dwellings (33%). If we look within each tenure, then there was virtually no difference between the percentage of households in poverty and not in poverty who lived in flats. Those in poverty were less likely to live in semi-detached or detached houses and more likely to live in terraced houses; although both of these trends really only applied in the owner occupied and private rented sectors. For example, in the private rented sector 40% of those in poverty lived in terraced houses compared with 31% of other households.
2.18 Overall, there was very little difference in the age profile of dwellings occupied by those in poverty and other households. However, there were some differences in the private rented sector where 42% of households in poverty lived in a home built before 1919 compared with 37% of other households. In this sector, 11% of those in poverty lived in the newest homes (built after 1990) compared with 16% of other households.

Chapter 2 Stock profile and occupancy | 19
Figure 2.9: Percentage of households by whether in poverty by dwelling type by tenure, 2009
owne
roc
cupi
edpr
ivat
ere
nted
soci
alre
nted
all
tenu
res
0 10 20 30 40 50percentage of households
60 70 80 90 100
not inpoverty
in poverty
not inpoverty
in poverty
not inpoverty
in poverty
not inpoverty
in poverty
small terraced house medium/large terraced housedetached house bungalowpurpose built flat, low rise purpose built flat, high rise
semi-detached houseconverted flat
Base: all householdsNote: underpinning data are presented in Annex Table 2.8Source: English Housing Survey 2009, household sub-sample
Figure 2.10: Percentage of households by whether in poverty by dwelling age by tenure, 2009
owne
roc
cupi
edpr
ivat
ere
nted
soci
alre
nted
all
tenu
res
0 10 20 30 40 50percentage of households
60 70 80 90 100
not inpoverty
in poverty
not inpoverty
in poverty
not inpoverty
in poverty
not inpoverty
in poverty
pre 1919 1919-44 1945-64 1965-80 1981-90 post 1990
Base: all householdsNote: underpinning data are presented in Annex Table 2.9Source: English Housing Survey 2009, household sub-sample

20 | English Housing Survey Housing Stock Report 2009
Ethnic minority households
2.19 Ethnic minority households7 were much more likely to live in flats or terraced houses and much less likely to live in detached or semi-detached houses; especially in the owner occupied and social rented sectors. This is partly because, until very recently, ethnic minority households were more likely to live in urban areas where these types of dwelling are more common. In the owner occupied sector, 17% of those from ethnic minorities lived in flats and 46% lived in terraced houses compared with 8% and 27% respectively for other owner occupiers. In the social rented sector, one in six (16%) of ethnic minority households lived in high rise flats compared with 4% of other households.
Figure 2.11: Percentage of households by ethnicity of HRP by dwelling type by tenure, 2009
owne
roc
cupi
edpr
ivat
ere
nted
soci
alre
nted
all
tenu
res
0 10 20 30 40 50percentage of households
60 70 80 90 100
white
ethnicminority
white
ethnicminority
white
ethnicminority
white
ethnicminority
small terraced house medium/large terraced housedetached house bungalowpurpose built flat, low rise purpose built flat, high rise
semi-detached houseconverted flat
Base: all householdsNote: underpinning data are presented in Annex Table 2.10Source: English Housing Survey 2009, household sub-sample
2.20 Ethnic minority households were also more likely than other households to occupy older homes and, as with dwelling type, these differentials were most pronounced in the owner occupied and social rented sectors. This is again partly due to these households being historically concentrated in more urban areas. Looking first at owner occupiers, 56% of those from ethnic minorities lived in homes built before 1945 compared with 38% of other households. In the social rented sector, one in four (25%) of ethnic minority households lived in a dwelling built before 1945 compared with one in six (17%) of other
7 Ethnic identity relates to the Household Reference Person only and not the household as a whole.

Chapter 2 Stock profile and occupancy | 21
households. The difference was less marked in the private rented sector, 54% of ethnic minority households lived in these older homes compared to 52% of other households.
Figure 2.12: Percentage of households by ethnicity of HRP by dwelling age by tenure, 2009
owne
roc
cupi
edpr
ivat
ere
nted
soci
alre
nted
all
tenu
res
0 10 20 30 40 50percentage of households
60 70 80 90 100
white
ethnicminority
white
ethnicminority
white
ethnicminority
white
ethnicminority
pre 1919 1919-44 1945-64 1965-80 1981-90 post 1990
Base: all householdsNote: underpinning data are presented in Annex Table 2.11Source: English Housing Survey 2009, household sub-sample

22 | English Housing Survey Housing Stock Report 2009
Chapter 3 Amenities and services
3.1 This chapter examines key services and amenities present in 2009 and how these have changed over time. It focuses on WC provision, mains gas, parking, and security. The EHS Housing Stock Report 2008 contains more detail about the size, age and location of kitchens and bathrooms – none of these are likely to have changed significantly by 2009.
3.2 Additional 2009 findings relating to services and amenities can be found in the Summary Statistics Tables, SST2.1-2.12.
Key findings
• Between 1996 and 2009 the proportion of dwellings with a second WC increased from 31% to 41% and most of this increase was in the private sector. However, in 2009 there were still over a third (35%) of households with five or more people who had just one WC which was located in the bathroom.
• In 2009 86% of dwellings had a mains gas supply. Dwellings in rural areas and flats were less likely to have mains gas (62% and 71% respectively) than average meaning that households living in these homes were more likely to be reliant on more expensive fuels for heating and hot water.
• The proportion of dwellings with secure windows and doors increased significantly from 53% in 2001 to 74% in 2009. This increase was most pronounced for private rented dwellings (from 37% to 63%) and those owned by local authorities (43% to 73%).
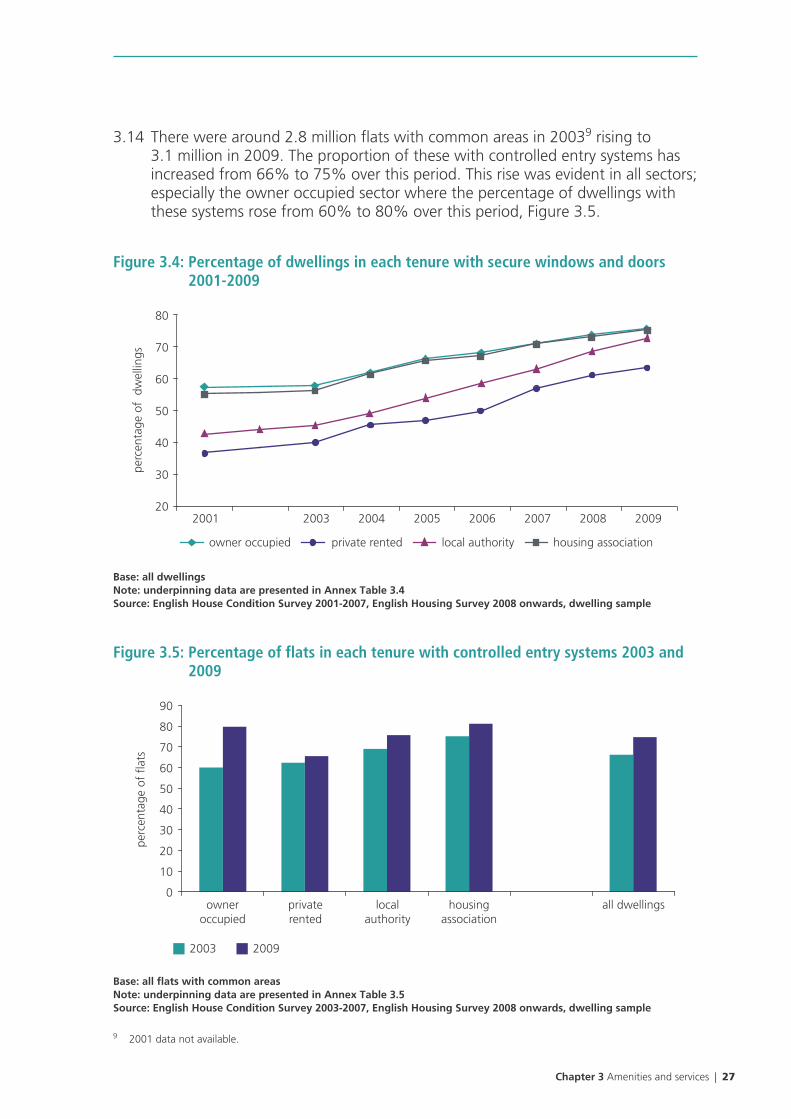
• The proportion of flats with common areas with controlled entry systems increased from 66% in 2003 to 75% in 2009. This increase was evident in all tenures but particularly in the owner occupied sector where the percentage of flats with these systems rose from 60% to 80% over the same period.
• The proportion of dwellings with garages or other off street parking increased from 61% in 1996 to 66% in 2009. However, in 2009 over a third (36%) of dwellings in city centres were reliant on inadequate street parking and 11% had no parking provision whatsoever.

Chapter 3 Amenities and services | 23
WC provision
3.3 The number, type and arrangement of WC facilities in dwellings are important to ensure adequate personal hygiene, especially for larger households or those who share these amenities with other households. Across the stock as a whole, 52% of dwellings had a single WC that was located in the bathroom, 7% had a single WC that was located in a separate room and 41% had more than one WC. These proportions varied considerably by tenure, with some 68% of social sector dwellings and 66% of private rented dwellings having a single WC in the bathroom compared with around 45% of those that were owner occupied. Half (50%) of owner occupied dwellings had a second WC compared with just 15% in the local authority sector, Annex Table 3.1
3.4 Certain household groups had better provision than others. Households from ethnic minorities, those in poverty or containing one or more people with a disability or long term illness were all less likely to have a second WC and more likely to have their only WC in the main bathroom than average, Summary Statistics Table SST2.3. This is largely because a higher proportion of such households lived in rented homes.
3.5 Generally speaking, the larger the household, the better the WC provision. However over a third (35%) of households with five or more people had just one WC which was located in the bathroom, Figure 3.1.
Figure 3.1: Type of WC provision by household size, 2009
0 10 20 30 40 50 60 70 80 90 100
all households
5 or more people
4
3
2
1 person
percentage of households
household has one WC in bathroom
household has one WC not in bathroom
household has 2nd WC
Base: all households Note: underpinning data are presented in Annex Table 3.2Source: English Housing Survey 2009, household sub-sample

24 | English Housing Survey Housing Stock Report 2009
3.6 The proportion of dwellings with a second WC increased from just under one third (31%) in 1996 to 41% by 2009, Figure 3.2. This increase was most pronounced for private rented dwellings – from 20% to 28% over this period. Within the social sector, the proportion of local authority dwellings with second WCs remained virtually unchanged over this period, whilst the proportion increased from 17% to 21% in the housing association sector. This is partly because the housing association sector contains a much higher proportion of newer dwellings that were built to higher standards of provision.
Figure 3.2: Percentage of dwellings in each tenure with second WCs 1996-2009
0
10
20
30
40
50
60
owneroccupied
private rented local authority housingassociation
all dwellings
perc
enta
ge o
f dw
ellin
gs
1996 2009
Base: all dwellings Note: underpinning data are presented in Annex Table 3.3Source: English House Condition Survey 1996 and English Housing Survey 2009, dwelling sample
Mains services
3.7 Although the number of dwellings with mains gas increased from around 17.6 million in 1996 to 19.2 million in 2009, the proportion with mains gas across the whole stock has remained fairly steady at around 86% since 1996.
3.8 In 2009, dwellings located in rural areas and flats were less likely to have mains gas than average, meaning that households living in these homes were more likely to be reliant on more expensive fuels for heating and hot water, Summary Statistics Tables SST2.4 and SST2.5. Just 62% of homes in rural areas had mains gas compared with 87% in city and urban centres and 93% in suburban areas, Figure 3.3.

Chapter 3 Amenities and services | 25
Figure 3.3: Percentage of dwellings in each type of area with mains gas, 2009
0
10
20
30
40
50
60
70
80
90
100
city and otherurban centres
suburbanresidential areas
rural areas all dwellings
perc
enta
ge o
f dw
ellin
gs
Base: all dwellings Note: underpinning data are presented in Summary Statistics Table SST2.5Source: English Housing Survey 2009, dwelling sample
3.9 In 2009, just 79% of privately rented dwellings had a mains gas supply, compared to 88% of the owner occupied stock, Table 3.1.
Table 3.1: Percentage of dwellings in each tenure with mains gas, 2009
all dwellings
mains gas no mains gas all dwellings
thousands of dwellingsowner occupied 13,196 1,767 14,963private rented 2,836 752 3,588local authority 1,566 246 1,812housing association 1,641 330 1,972
all tenures 19,239 3,095 22,335
percentagesowner occupied 88.2 11.8 100.0private rented 79.0 21.0 100.0local authority 86.4 13.6 100.0housing association 83.2 16.8 100.0
all tenures 86.1 13.9 100.0
Source: English Housing Survey 2009, dwelling sample

26 | English Housing Survey Housing Stock Report 2009
Security
3.10 In 2009, some 74% of dwellings had secure windows and doors (see Glossary), 29% had a burglar alarm and 75% of flats had controlled entry systems8. Generally speaking, the provision of secure windows and doors was lowest for dwellings built before 1919, converted flats and dwellings in rural areas, Summary Statistics Tables SST2.10 and SST2.11.
3.11 Private rented dwellings were much less likely to have secure windows and doors than those in other tenures. This was not simply because this sector contained the highest proportion of pre 1919 dwellings. Private rented dwellings in virtually all dwelling age bands performed worse than those in other tenures in this respect, Table 3.2.
Table 3.2: Percentage of dwellings with secure windows and doors by tenure and dwelling age, 2009
all dwellings
pre 1919 1919-1944 1945-64 1965-80 post 1980 all ages
thousands of dwellingsowner occupied 1,823 1,973 2,311 2,478 2,755 11,340 private rented 731 260 271 371 642 2,274 social rented 140 313 917 851 584 2,805
all tenures 2,694 2,546 3,498 3,700 3,981 16,419
percentage of dwellingsowner occupied 58.6 71.0 80.3 83.0 85.9 75.8private rented 51.2 56.5 67.2 71.4 82.6 63.4social rented 55.1 69.6 74.9 75.6 80.0 74.1
all tenures 56.2 69.0 77.7 79.9 84.4 73.5
Source: English Housing Survey 2009, dwelling sample
3.12 The presence of secure windows and doors showed less variation by household characteristics although those in poverty were less likely to have this feature and were also less likely to have a burglar alarm than average, Summary Statistics Tables SST2.12.
3.13 The proportion of dwellings with secure windows and doors has increased significantly over time from 53% in 2001 to 74% in 2009. This improvement was evident in all tenures but was most pronounced in the private rented and local authority sectors. The proportion of private rented dwellings with secure windows and doors increased from 37% to 63% and that for local authority dwellings from 43% to 73% over this period, Figure 3.4.
8 Controlled entry systems usually consist of a control panel located at the side of a communal entrance door with a speaker, numbered buttons and, in some instances, a TV camera. Each flat in the block is connected to the control panel giving each resident the ability to identify and speak to any visitors before allowing them entry.
Chapter 3 Amenities and services | 27
3.14 There were around 2.8 million flats with common areas in 20039 rising to 3.1 million in 2009. The proportion of these with controlled entry systems has increased from 66% to 75% over this period. This rise was evident in all sectors; especially the owner occupied sector where the percentage of dwellings with these systems rose from 60% to 80% over this period, Figure 3.5.
Figure 3.4: Percentage of dwellings in each tenure with secure windows and doors 2001-2009
20
30
40
50
60
70
80
2001 2003 2004 2005 2006 2007 2008 2009
perc
enta
ge o
f d
wel
lings
owner occupied private rented local authority housing association
Base: all dwellings Note: underpinning data are presented in Annex Table 3.4Source: English House Condition Survey 2001-2007, English Housing Survey 2008 onwards, dwelling sample
Figure 3.5: Percentage of flats in each tenure with controlled entry systems 2003 and 2009
0
10
20
30
40
50
perc
enta
ge o
f fla
ts
60
70
80
90
owneroccupied
privaterented
localauthority
housingassociation
all dwellings
2003 2009
Base: all flats with common areasNote: underpinning data are presented in Annex Table 3.5Source: English House Condition Survey 2003-2007, English Housing Survey 2008 onwards, dwelling sample
9 2001 data not available.

28 | English Housing Survey Housing Stock Report 2009
Parking provision
3.15 In 2009, 40% of dwellings had use of a garage, around a quarter (26%) had other off street parking, just under one-third (32%) relied on street parking, and 2% of homes had no parking provision whatsoever. The type of parking provision varied considerably with the age, type, size and location of the dwelling, Summary Statistics Tables SST2.4 and SST2.5. It also varied considerably by tenure – over half (54%) of owner occupied and one in five (21%) of private rented dwellings had access to a garage compared with just 6% of those owned by social landlords, Figure 3.6.
Figure 3.6: Parking provision by tenure, 2009
0 20 40
percentage of dwellings
60 80 100
all dwellings
housing association
local authority
private rented
owner occupied
inadequate street parking adequate street parking garageother off street parking no parking provision
Base: all dwellings Note: underpinning data are presented in Summary Statistics Table SST2.4Source: English Housing Survey 2009, dwelling sample
3.16 Homes in rural and suburban areas were far more likely to have a garage than those located elsewhere. Some 60% of dwellings in rural residential areas and 55% in village centres had access to a garage compared with just 7% in city centres and 16% in other urban centres, Figure 3.7. Over a third (36%) of dwellings in city centres were reliant on inadequate street parking and 11% had no parking provision at all.

Chapter 3 Amenities and services | 29
Figure 3.7: Parking provision by area, 2009
0 20 40 60 80 100
all dwellings
rural
village centre
rural residential
suburban residential
other urban centre
city centre
inadequate street parking adequate street parkinggarage other off street parkingno parking provision
percentage of dwellings
Base: all dwellings Note: underpinning data are presented in Summary Statistics Table SST2.5Source: English Housing Survey 2009, dwelling sample
3.17 Households containing one or more people aged 60 or over were more likely to have a garage or other off street parking facilities than households containing only people aged under 60 (73% compared with 64%). Households containing one or more people with a long term illness or disability were slightly more likely to have to rely on street parking (35%) compared to others (30%). However, reliance on street parking was even higher for households from ethnic minorities (52%) and households in poverty (43%), Summary Statistics Table SST2.6.
3.18 The proportion of dwellings with private parking provision increased steadily from 61% in 1996 to 65% in 2003 but did not rise between 2003 and 2009.The increase was almost solely due to the rise in other off street parking rather than in garages. The percentage of dwellings with garages remained fairly steady between 1996 and 2009 at around 41-43%. In contrast the proportion of dwellings with other off street parking (e.g. drives, car ports and designated parking spaces) rose from 17% in 1996 to 26% in 2009. This is linked to trends over time in increasing numbers of private front plots being covered with hard landscaping10. Over the same period the proportion of dwellings relying on street parking fell from 38% to 32%, Figure 3.8.
10 English Housing Survey Housing Stock Report 2008, Figure 3.6, page 54.

30 | English Housing Survey Housing Stock Report 2009
Figure 3.8: Percentage of dwellings with different types of parking provision 1996-2009
0
5
10
15
20
25
30
35
40
45
50
1996 2001 2003 2004 2005 2006 2007 2008 2009
perc
enta
ge o
f dw
ellin
gs
street parking garage other off street parking no parking provision
Base: all dwellings Note: underpinning data are presented in Annex Table 3.6Source: English House Condition Survey 1996-2007, English Housing Survey 2008 onwards, dwelling sample
Chapter 4 Dwelling condition | 31
Chapter 4 Dwelling condition
4.1 This chapter examines the incidence and nature of disrepair and dampness within the stock highlighting which households are most likely to live in homes with these problems. It also explores how these have changed over time in the different tenures. The EHS Housing Stock Report 2008 contains more detailed analyses of structural faults and problems in common and shared areas of blocks of flats – none of these are likely to have changed significantly by 2009.
4.2 Additional 2009 findings relating to dwelling condition can be found in the Summary Statistics Tables, SST5.1-5.6.
4.3 Decent Homes is not covered in this chapter but key figures are provided in 2009 Headline Report and in the Summary Statistics Tables, SST3.1-3.4.
Key findings
• There have been significant reductions in the amount of disrepair since 2001 with the average basic repair cost falling by roughly 37% from £19/m² to £12/m² (both at 2001 prices). The largest reductions were evident in the private rented sector where costs fell by 50%; although this sector still had much higher average repair costs than other tenures in 2009.
• In 2009, some 20% (4.2 million) households lived in homes with substantial disrepair (costs over £20/m² or at least £1,800 for the average sized dwelling at 2009 prices). Overall privately renting households were much more likely to live in such homes (32% compared to 17% for owner occupiers and 19% for social renters).
• The likelihood of private renters living in dwellings in substantial disrepair increased markedly the longer they had been resident in their current home (from 27% for those resident for less than one year to 54% of those resident for 20 years or more).
• Around 1.8 million or 8% of dwellings had damp problems in 2009. However, the incidence of these problems was lower in owner occupied stock (6%) and much higher for private rented dwellings and local authority dwellings (15% and 12% respectively).
• While 8% of households lived in dwellings with damp problems this was notably higher for households containing five or more people (11%), households in poverty (12%) multi-person households (14%) and ethnic minority households (15%).

32 | English Housing Survey Housing Stock Report 2009
Disrepair to dwellings
4.4 Just over half (55%) of dwellings had faults to one or more elements making up the exterior fabric of the building in 2009. The exterior elements most commonly affected were wall finish, 23% (pointing, rendering, cladding etc.) and windows 18%. Faults to the interior fabric and other items (such as heating systems, fences, common areas etc.) were less common (29% and 41% respectively).
4.5 The incidence of these different types of faults varied by tenure. Private rented dwellings were far more likely to have faults to the exterior fabric, whilst local authority dwellings were more likely to have faults relating to the interior fabric, Annex Table 4.1.
4.6 The incidence of all types of faults decreased between 1996 and 2009, Figure 4.1; especially faults relating to the interior. These were present in around half of dwellings (49%) in 1996 but this had reduced to 29% by 2009.
Figure 4.1: Incidence of types of faults, 1996 and 2009
0
10
20
30
40
50
60
70
80
exterior fabric Interior fabric other faults
perc
enta
ge o
f dw
ellin
gs
1996 2009
Base: all dwellingsNotes:1) exterior faults include structural faults2) any interior faults includes ceilings, walls, doors and floors.3) other key faults include boundary walls, fences, kitchen and bathroom faults, services and heating4) underpinning data are presented in Annex Table 4.2Source: English House Condition Survey 1996, English Housing Survey 2009, dwelling sample
4.7 The incidence of faults to the exterior fabric reduced in all tenures over this period. These reductions were most evident in the owner occupied sector (from 72% in 1996 to 53% in 2009), Figure 4.2.

Chapter 4 Dwelling condition | 33
Figure 4.2: Incidence of types of faults to exterior fabric by tenure 1996 and 2009
1996 2009
0
10
20
30
40
50
60
70
80
90
owner occupied private rented local authority housing association
perc
enta
ge o
f dw
ellin
gs
Base: all dwellingsNotes: 1) exterior faults include key elements and structural faults2) underpinning data are presented in Annex Table 4.3Source: English House Condition Survey 1996, English Housing Survey 2009, dwelling sample
4.8 The incidence of faults to the internal fabric reduced most noticeably for private rented (62% to 37%) and owner occupied dwellings (46% to 25%), Figure 4.3.
Figure 4.3: Incidence of types of faults to interior fabric by tenure, 1996 and 2009
1996 2009
0
10
20
30
40
50
60
70
owner occupied private rented local authority housing association
perc
enta
ge o
f dw
ellin
gs
Base: all dwellingsNotes: 1) interior faults includes ceilings, walls, doors and floors 2) underpinning data are presented in Annex Table 4.4Source: English House Condition Survey 1996, English Housing Survey 2009, dwelling sample
Households and disrepair
4.9 The incidence of faults provides a good indication of where the main problems with disrepair occur. However it does not indicate the scale or severity of these problems. This and the following section use repair costs to indicate the scale of

34 | English Housing Survey Housing Stock Report 2009
disrepair in the housing stock. Average standardised basic repair costs11 enable the amount of disrepair in the stock to be compared across tenures and areas.
4.10 In 2009, some 20% (4.2 million) of households lived in homes where a substantial level of disrepair was present (costing £20/m2 or more which equates to at least £1,800 for the average sized dwelling at 2009 prices). Overall privately renting households were much more likely to live in such homes (32% compared to 17% for owner occupiers and 19% for social renters). However the likelihood of private renters living in dwellings in substantial disrepair also increased markedly the longer they had been resident in their current home (from 27% for those resident for less than one year to 54% of those resident 20 years or more), Figure 4.4. Among households that had recently moved, social renters were the least likely to live in homes with a substantial level of disrepair (14%) and there was little difference between social renters and owner occupiers in terms of the percentage of long term residents living in such homes (around 20% in both sectors for households that had been resident 20 years or more).
Figure 4.4: Percentage of households living in dwellings with repairs over £20/m2 by length of residence and tenure, 2009
0
10
20
30
40
50
60
less than1 year
one years two years 3-4 years 5-9 years 10-19 years 20+ years
perc
enta
ge o
f ho
useh
olds
owner occupied private rented social rented
Base: all householdsNote: underpinning data are presented in Annex Table 4.5Source: English Housing Survey 2009, household sub-sample
11 Basic repair costs include any urgent repairs plus additional visible work to be carried out in the medium term. The costs are standardised meaning dwellings of different sizes, in different tenures and in different areas can be compared on the same basis. For more details see the EHS technical note at http://www.communities.gov.uk/documents/housing/pdf/1799094.pdf

Chapter 4 Dwelling condition | 35
4.11 The likelihood of living in a home in substantial disrepair was also higher than average for particular groups, including one person households (23%), those in poverty (26%) and those from ethnic minority groups (27%). However such household groups could face very different levels of disrepair depending on the housing sector they lived in. All groups were more likely to live in homes with a substantial level of disrepair if they were privately renting. But this was particularly the case for households in poverty and for those that include people with a long term illness or disability or people aged 60 years or more: for these groups the incidence of substantial disrepair was around twice that of their peers living in the owner occupied and social sectors, see Annex Tables 4.6 and 4.7. Within the social sector, households with older people were among the least likely to live in homes in substantial disrepair whereas larger households (five or more people), ethnic minority households and those with children under five, were more likely to live in such homes.
Repair costs over time by tenure
4.12 The EHS Housing Stock Report 2008 contains details about the ages, types and locations of dwellings in relation to disrepair costs over time – none of these features are likely to have changed significantly by 2009. This section examines how the level of disrepair has changed since 2001 by tenure. As in the 2008 report, this section uses the basic standardised costs (£/m2) converted to 2001 prices using the Building Cost Information Service (BCIS) National Index. As some of the year on year change in the level of disrepair arises from random fluctuations related to sampling and measurement errors, the section focuses on overall changes and trends from 2001 onwards rather than annual differences.
4.13 Since 2001, the average basic repair cost fell by roughly 37% from £19/m² to £12/m² indicating significant overall improvements in the way dwellings have been maintained on a day to day basis. There were, however, notable variations by tenure. The largest reductions were evident in the private rented sector where costs fell by 50% from £40/m² to £20/m². We need to bear in mind, however, that costs in this sector have always been, and still are, significantly higher than those in other tenures. Costs fell the least dramatically (by 24%) within the housing association sector for two main reasons. Firstly, the tenure was in a better condition to start with as it contained a relatively high proportion of newer dwellings which generally require fewer repairs than older properties and secondly because many properties now in this sector were formerly in the local authority sector where disrepair is more prevalent.

36 | English Housing Survey Housing Stock Report 2009
Figure 4.5: Average basic standardised repair costs by tenure (at 2001 prices), 2001-2009
0
5
10
15
20
25
30
35
40
45
2001 2003 2004 2005 2006 2007 2008 2009
owner occupied private rented local authorityhousing association all dwellings
Base: all dwellingsNote: underpinning data are presented in Annex Table 4.8Source: English House Condition Survey 2001-2007, English Housing Survey 2008 onwards, dwelling sample
Dampness and mould
4.14 Untreated damp conditions and mould growth in the home can have a significant impact on both the occupants’ health and the fabric of the dwelling. Damp conditions increase the risk of the development of respiratory problems and can also lead to rapid deterioration of the dwelling, creating further problems and so add to the costs of repair. The EHS Housing Stock Report 2008 contains further details about the ages, types and locations of dwelling in relation to dampness and mould – none of these are likely to have changed significantly by 2009.
4.15 This section examines the incidence of three types of dampness: rising, penetrating and serious condensation. Full definitions of these terms appear in the Glossary.
4.16 In 2009, around 1.8 million or 8% of dwellings had damp problems. However, the incidence of these problems was lower in owner occupied stock (6%) and much higher for private rented dwellings and local authority dwellings (15% and 12% respectively).The Summary Statistics Tables (SST5.1-5.3) provide further details on the prevalence of each type of damp by tenure and the incidence of any type of dampness by dwelling characteristics.
4.17 Penetrating damp (caused by leaks) was the most common type of damp found in dwellings. The problems were most commonly associated with defects to external walls, windows or doors, downpipes and guttering, Annex Table 4.9.

Chapter 4 Dwelling condition | 37
4.18 Overall around 8% of households lived in a home that had some damp problems, although this was notably higher for households containing 5 or more people (11%), households in poverty (12%) multi person households (14%) and ethnic minority households (15%), Summary Statistics Table SST5.3.
4.19 For some of these groups, the likelihood of living in a home with damp problems varied substantially by tenure. While the incidence of damp problems was generally greatest among private renters, it was those in poverty and those from ethnic minorities who were particularly likely to live in such dwellings within this tenure group, Figure 4.6. While private rented households with anyone aged 60 years or more were a little less likely to have such problems than was average for this sector, they were nevertheless more than twice as likely to do so as their peers in the other housing sectors. Social renting households containing four or more people (predominantly couples with children) were substantially more likely to have damp problems than smaller households in the sector, reflecting the relatively high incidence of serious problems arising from condensation within social housing.
Figure 4.6: Percentage of households living in dwellings with any damp problems by household size and by specific household groups, 2009
0 5 10 15 20 25
one person
two
three
four
five or more
with 60+
under 5s
disabled/ill
in poverty
ethnic minority
all households
hous
ehol
d si
zeke
y ho
useh
old
grou
p
percentage of households
owner occupied private rented social rented
Base: all householdsNote: underpinning data are presented in Annex Tables 4.10 and 4.11Source: English Housing Survey 2009, household sub-sample
38 | English Housing Survey Housing Stock Report 2009
4.20 Damp problems were more common within the private and social rented sectors for households who had been resident for two or more years compared with more recent movers, see Annex Table 4.12. However there was no significant increase for households that owned their homes.
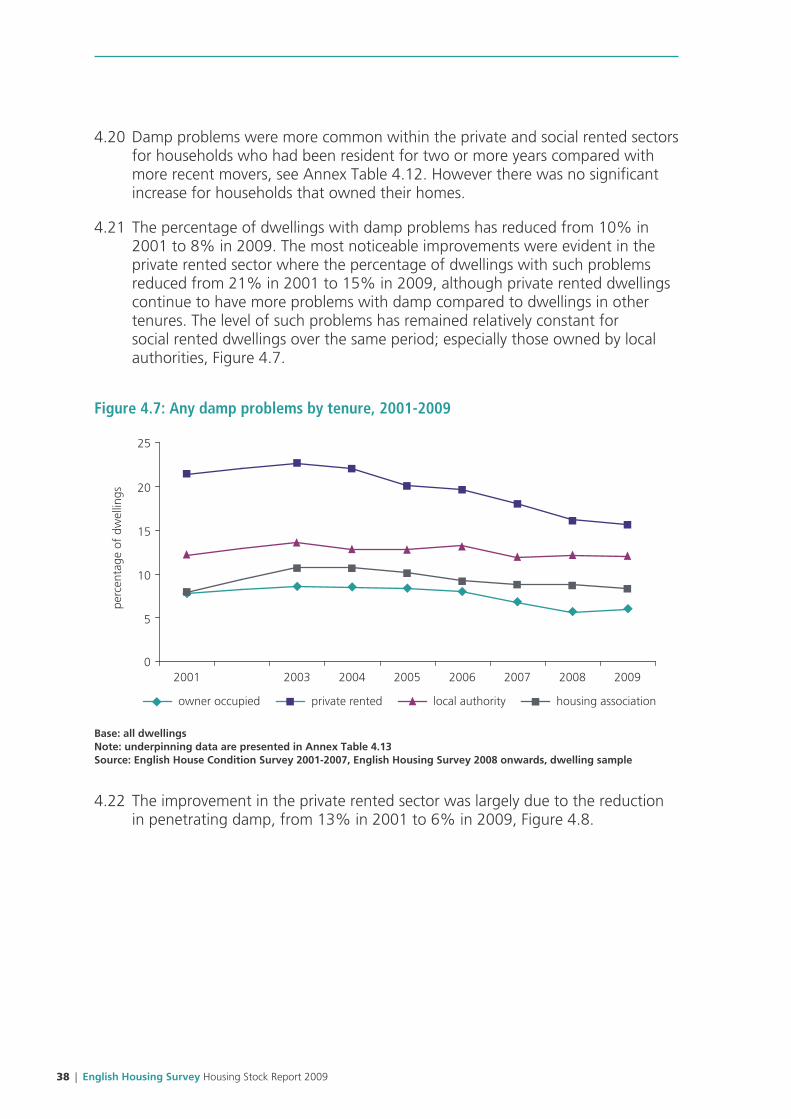
4.21 The percentage of dwellings with damp problems has reduced from 10% in 2001 to 8% in 2009. The most noticeable improvements were evident in the private rented sector where the percentage of dwellings with such problems reduced from 21% in 2001 to 15% in 2009, although private rented dwellings continue to have more problems with damp compared to dwellings in other tenures. The level of such problems has remained relatively constant for social rented dwellings over the same period; especially those owned by local authorities, Figure 4.7.
Figure 4.7: Any damp problems by tenure, 2001-2009
0
5
10
15
20
25
2001 2003 2004 2005 2006 2007 2008 2009
perc
enta
ge o
f dw
ellin
gs
owner occupied private rented local authority housing association
Base: all dwellingsNote: underpinning data are presented in Annex Table 4.13Source: English House Condition Survey 2001-2007, English Housing Survey 2008 onwards, dwelling sample
4.22 The improvement in the private rented sector was largely due to the reduction in penetrating damp, from 13% in 2001 to 6% in 2009, Figure 4.8.

Chapter 4 Dwelling condition | 39
Figure 4.8: Incidence of penetrating damp by tenure, 2001 and 2009
2001 2009
0
2
4
6
8
10
12
14
owner occupied private rented local authority housingassociation
all dwellings
perc
enta
ge o
f dw
ellin
gs
Base: all dwellingsNote: underpinning data are presented in Annex Table 4.14Source: English House Condition Survey 2001, English Housing Survey 2009, dwelling sample

40 | English Housing Survey Housing Stock Report 2009
Chapter 5 Dwelling safety
5.1 This chapter examines risks to health and safety present in dwellings in 2009 with particular focus on those related to accidents and fire that are covered by the Housing Health and Safety Rating System (HHSRS). The HHSRS is a risk-based assessment that identifies hazards in dwellings and evaluates their potential effects on the health and safety of occupants and visitors (see Glossary for further details). The EHS assesses 26 out of the 29 hazards covered by the HHSRS. The 2008 EHS report examines how the incidence of HHSRS hazards varies by key dwelling, area and household characteristics and the overall trends and patterns found then are unlikely to have changed significantly.
5.2 Additional 2009 findings relating to the dwelling safety can be found in the Summary Statistics Tables, SST2.10-2.12 and SST4.1-4.3.
Key findings
• In 2009, 1 in 8 (12%) of dwellings were assessed to have a Category 1 HHSRS hazard relating to one of the four categories of falls. In many cases these were the result of disrepair (e.g. broken or missing handrails to stairs or cracked paving) rather than design and as such were often relatively inexpensive to remedy.
• Terraced houses, converted flats and dwellings built before 1919 were far more likely to have any Category 1 hazards relating to falls than other dwellings. Terraced houses and converted flats had a significantly higher incidence of falls associated with steps and stairs whereas dwellings built before 1919 performed relatively poorly for all types of falls.
• Overall, around 390,000 dwellings (2%) had Category 1 hazards pertaining to fire or to hot surfaces. The average cost to deal with all Category 1 fire hazards was £2,556 and the equivalent costs for hot surfaces was £2,354, however a substantial minority could be addressed more cheaply.
• Electrical safety has improved significantly since 2001 – especially for rented dwellings in both the private and social sectors. The percentage of private rented dwellings with Residual Current Devices (RCDs) increased from 35% in 2001 to 61% in 2009.
• Despite improvements in electrical safety since 2001, less than half (44%) of households lived in homes with fully modern wiring in 2009. This was particularly low for certain groups of owner occupiers:
Chapter 5 Dwelling safety | 41
households containing one or more people aged 60 or over (34%) and those who had lived in their home for at least 20 years (27%).
Housing Health and Safety Rating System (HHSRS)
5.3 Almost 5 million dwellings (21%) had one or more Category 1 hazards in 2009. The most common types of Category 1 hazards were related to falls, affecting around 1 in 8 (12%) of dwellings, followed by excess cold (8%). Other Category 1 hazards were far less common; just 2% of dwellings had Category 1 hazards relating to fire or hot surfaces, and 3% of dwellings had one or more of the remaining 19 Category 1 hazards covered by the survey. This chapter focuses on hazards related to accidents and focuses on falls, fire, hot surfaces and electrical safety.
5.4 The likelihood of different household types living in dwellings with Category 1 hazards and different types of hazards is provided in the Summary Statistics Tables. Over a quarter (28%) of private rented households lived in such homes, as did households (in all tenures) resident in their home for over 30 years. The type of hazards present also varied for different groups of households. Households containing people aged 60 or over were more likely to live in homes with excess cold hazards (10%) but less likely to live in homes with falls hazards (11%) than average.
Falls in the home
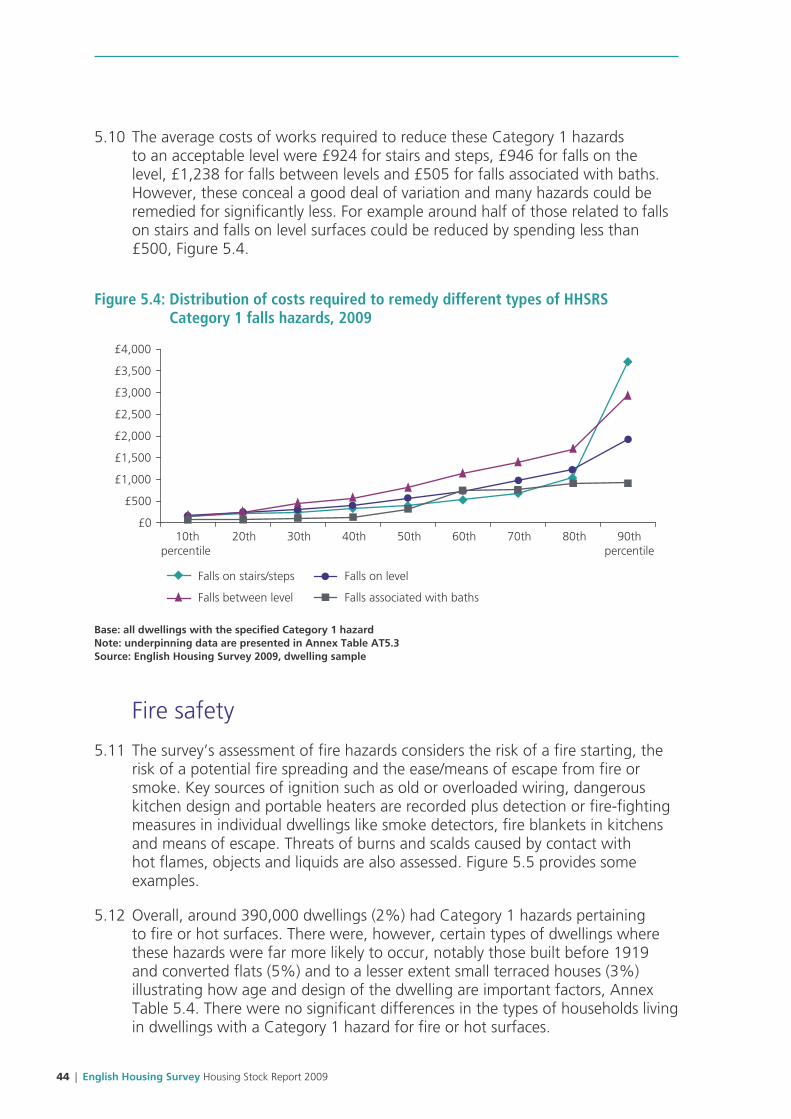
5.5 Category 1 falls hazards were most commonly associated with falling on stairs or steps (9% of the housing stock) but 3% of dwellings also had Category 1 hazards associated with falls on the level, 2% with falls between levels and 1% with falls associated with baths, Annex Table 5.1.
5.6 Terraced houses, converted flats and dwellings built before 1919 were far more likely to have any Category 1 hazards relating to falls than average, Summary Statistics Table SST4.1. Terraced houses and converted flats had a significantly higher incidence of falls associated with steps and stairs whereas dwellings built before 1919 performed relatively poorly for all types of falls, Annex Table 5.1. Terraced houses, converted flats and older dwellings are more likely to have falls hazards relating to stairs owing to dwelling design, for example, very steep or winding staircases and low balustrades or balustrades with large gaps in the rails which are most hazardous for young children (see examples below).

42 | English Housing Survey Housing Stock Report 2009
Figure 5.1: Examples of Category 1 falls hazards due to design
Risk from fall on the stairs: steep, narrow winding with no handrail.
Risk of falls between levels: large gaps in balustrade and insufficient area of platform part way up.
Risk of falls associated with baths: insufficient space to get in and out of the bath.
Figure 5.2: Example of Category 1 falls hazards due to disrepair/neglect
Risk from falls on the level: broken and uneven paving.
5.7 The oldest households (those containing one or more people aged 75 or over) were less likely to live in homes with any Category 1 falls hazards than households where all occupants were aged under 60 (9% compared with 13%). However, there were no notable differences between other vulnerable households such as those in relative poverty or with long term sickness and other households, Summary Statistics Table SST4.3.
5.8 The types of remedial works required to reduce these hazards to an acceptable level varied considerably. For all types of Category 1 falls hazards (except those on the level) the vast majority of dwellings required installation or redesign work only. These jobs ranged from the simple installation of safety features (handrails, window safety catches) to more complex and expensive work such as redesigning internal/external staircases. In contrast, the majority of dwellings with Category 1 falls on the level hazards required repair works only; particularly repairs to external paths, Figure 5.3.

Chapter 5 Dwelling safety | 43
Figure 5.3: Number of dwellings with HHSRS Category 1 falls hazards requiring different types of work, 2009
repair only redesign/installation only repair and redesign/installation
0
200
400
600
800
1,000
1,200
1,400
1,600
1,800
2,000
stairs and steps on level between levels associated with baths
num
ber
of d
wel
lings
(000
s)
Base: all dwellingsNote: underpinning data are presented in Annex Table AT5.2Source: English Housing Survey 2009, dwelling sample
5.9 Most of the works required to reduce Category 1 falls hazards to an acceptable level were relatively minor such as installing handrails and balustrades, repairing paths and steps and installing additional lighting, Table 5.1.
Table 5.1: Most common types of remedial work required to deal with HHSRS Category 1 falls hazards (percentage of all dwellings with the hazard present), 2009
Falling on stairs/stepsFalling on level surfaces Falling between levels
Falls associated with baths
Install handrail (69%) Repair paths/external surfaces (67%)
Installing new guarding/balustrading (69%)
Provide grabrail (70%)
Instal balustrade (24%) Remove trip steps (25%) Install window safety catches (17%)
Repair/replace bath (33%)
Repair, replace or provide additional lighting (16%)
Repair, replace or provide additional lighting (16%)
Repair, replace, existing guarding/balustrading (17%)
Remove obstacles (12%)
Replace or repair external steps (15%)
Redesign external pathways (12%)
Repairs to plot (5%) Rearrange bathroom (11%)
Redesign internal, common or external staircase (12%)
Remove obstacles (11%)
Base: dwellings with Category 1 falls hazards presentSource: English Housing Survey 2009, dwelling sample
44 | English Housing Survey Housing Stock Report 2009
5.10 The average costs of works required to reduce these Category 1 hazards to an acceptable level were £924 for stairs and steps, £946 for falls on the level, £1,238 for falls between levels and £505 for falls associated with baths. However, these conceal a good deal of variation and many hazards could be remedied for significantly less. For example around half of those related to falls on stairs and falls on level surfaces could be reduced by spending less than £500, Figure 5.4.
Figure 5.4: Distribution of costs required to remedy different types of HHSRS Category 1 falls hazards, 2009
£0
£500
£1,000
£1,500
£2,000
£2,500
£3,000
£3,500
£4,000
10thpercentile
20th 30th 40th 50th 60th 70th 80th 90thpercentile
Falls on stairs/steps Falls on level
Falls between level Falls associated with baths
Base: all dwellings with the specified Category 1 hazardNote: underpinning data are presented in Annex Table AT5.3Source: English Housing Survey 2009, dwelling sample
Fire safety
5.11 The survey’s assessment of fire hazards considers the risk of a fire starting, the risk of a potential fire spreading and the ease/means of escape from fire or smoke. Key sources of ignition such as old or overloaded wiring, dangerous kitchen design and portable heaters are recorded plus detection or fire-fighting measures in individual dwellings like smoke detectors, fire blankets in kitchens and means of escape. Threats of burns and scalds caused by contact with hot flames, objects and liquids are also assessed. Figure 5.5 provides some examples.
5.12 Overall, around 390,000 dwellings (2%) had Category 1 hazards pertaining to fire or hot surfaces. There were, however, certain types of dwellings where these hazards were far more likely to occur, notably those built before 1919 and converted flats (5%) and to a lesser extent small terraced houses (3%) illustrating how age and design of the dwelling are important factors, Annex Table 5.4. There were no significant differences in the types of households living in dwellings with a Category 1 hazard for fire or hot surfaces.

Chapter 5 Dwelling safety | 45
Figure 5.5: Examples of Category 1 fire or hot surfaces hazards due to design
Fire hazard – old wiring: increases the risk of a fire starting (and electrocution).
Fire hazard – open fireplace: with no barrier to prevent hot coal and ashes falling onto the carpet.
Hot surface hazard: cooker is sited far too close to the door.
5.13 The types of work required to reduce these types of hazards to an acceptable level were highly variable12. The most common jobs required to help deal with Category 1 fire hazards were installing smoke detectors, providing suitable openable windows and providing self-closing doors. Those most commonly needed to address Category 1 flames or hot surfaces hazards were relocating the cooker and re-fitting, and extending or re-siting the kitchen.
5.14 As might be expected, flats typically required different types of work than houses and bungalows to reduce Category 1 fire hazards to an acceptable level, such as installation of fire precaution works to common areas and improvements to means of escape, Table 5.2.
Table 5.2: Most common types of work required to deal with HHSRS Category 1 fire or hot surfaces hazards (percentage of dwellings in the group with the hazard present), 2009
Fire
Houses Flats Hot surfaces
Smoke detector (65%) Smoke detector (73%) Relocate cooker (62%)
Provide suitable openable windows (50%)
Self closing fire doors (48%) Redesign kitchen (36%)
Upgrade stairway to protected route (21%)
Provide suitable openable windows (33%)
Remove obstacles (10%)
Install non fire resistant/smoke permeable tiles (18%)
Upgrade stairway to protected route (27%)
Repair/replace electrical systems (17%) Repair/replace electrical systems (12%)
Base: dwellings with Category 1 fire or hot surfaces hazards presentSource: English Housing Survey 2009, dwelling sample
12 It is important to note that the work specified and associated costs relate just to those required under HHSRS to reduce the Category 1 hazard to an acceptable level. It does not include any other works to further enhance safety or to comply with other requirements or standards.
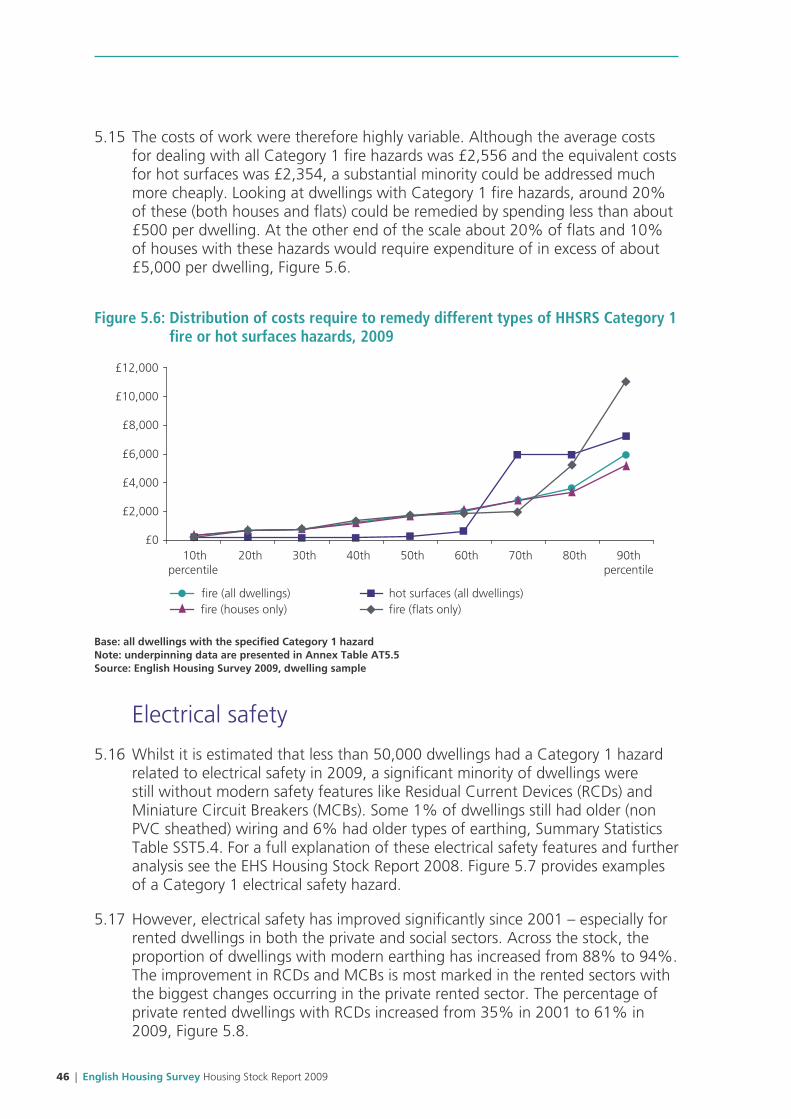
46 | English Housing Survey Housing Stock Report 2009
5.15 The costs of work were therefore highly variable. Although the average costs for dealing with all Category 1 fire hazards was £2,556 and the equivalent costs for hot surfaces was £2,354, a substantial minority could be addressed much more cheaply. Looking at dwellings with Category 1 fire hazards, around 20% of these (both houses and flats) could be remedied by spending less than about £500 per dwelling. At the other end of the scale about 20% of flats and 10% of houses with these hazards would require expenditure of in excess of about £5,000 per dwelling, Figure 5.6.
Figure 5.6: Distribution of costs require to remedy different types of HHSRS Category 1 fire or hot surfaces hazards, 2009
£0
£2,000
£4,000
£6,000
£8,000
£10,000
£12,000
10thpercentile
20th 30th 40th 50th 60th 70th 80th 90thpercentile
fire (all dwellings) hot surfaces (all dwellings)fire (houses only) fire (flats only)
Base: all dwellings with the specified Category 1 hazardNote: underpinning data are presented in Annex Table AT5.5Source: English Housing Survey 2009, dwelling sample
Electrical safety
5.16 Whilst it is estimated that less than 50,000 dwellings had a Category 1 hazard related to electrical safety in 2009, a significant minority of dwellings were still without modern safety features like Residual Current Devices (RCDs) and Miniature Circuit Breakers (MCBs). Some 1% of dwellings still had older (non PVC sheathed) wiring and 6% had older types of earthing, Summary Statistics Table SST5.4. For a full explanation of these electrical safety features and further analysis see the EHS Housing Stock Report 2008. Figure 5.7 provides examples of a Category 1 electrical safety hazard.
5.17 However, electrical safety has improved significantly since 2001 – especially for rented dwellings in both the private and social sectors. Across the stock, the proportion of dwellings with modern earthing has increased from 88% to 94%. The improvement in RCDs and MCBs is most marked in the rented sectors with the biggest changes occurring in the private rented sector. The percentage of private rented dwellings with RCDs increased from 35% in 2001 to 61% in 2009, Figure 5.8.
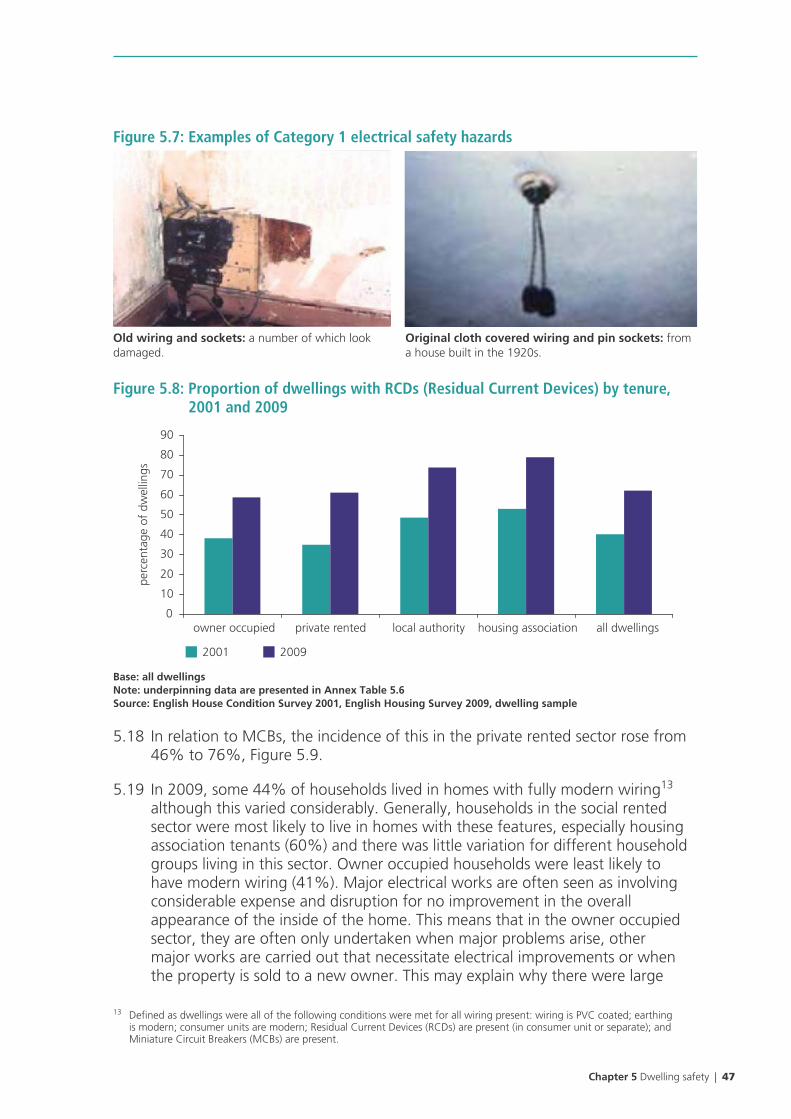
Chapter 5 Dwelling safety | 47
Figure 5.7: Examples of Category 1 electrical safety hazards
Old wiring and sockets: a number of which look damaged.
Original cloth covered wiring and pin sockets: from a house built in the 1920s.
Figure 5.8: Proportion of dwellings with RCDs (Residual Current Devices) by tenure, 2001 and 2009
0
10
20
30
40
50
60
70
80
90
owner occupied private rented local authority housing association all dwellings
perc
enta
ge o
f dw
ellin
gs
2001 2009
Base: all dwellingsNote: underpinning data are presented in Annex Table 5.6Source: English House Condition Survey 2001, English Housing Survey 2009, dwelling sample
5.18 In relation to MCBs, the incidence of this in the private rented sector rose from 46% to 76%, Figure 5.9.
5.19 In 2009, some 44% of households lived in homes with fully modern wiring13 although this varied considerably. Generally, households in the social rented sector were most likely to live in homes with these features, especially housing association tenants (60%) and there was little variation for different household groups living in this sector. Owner occupied households were least likely to have modern wiring (41%). Major electrical works are often seen as involving considerable expense and disruption for no improvement in the overall appearance of the inside of the home. This means that in the owner occupied sector, they are often only undertaken when major problems arise, other major works are carried out that necessitate electrical improvements or when the property is sold to a new owner. This may explain why there were large
13 Defined as dwellings were all of the following conditions were met for all wiring present: wiring is PVC coated; earthing is modern; consumer units are modern; Residual Current Devices (RCDs) are present (in consumer unit or separate); and Miniature Circuit Breakers (MCBs) are present.

48 | English Housing Survey Housing Stock Report 2009
variations for different groups in this sector and why by far the lowest incidence of modern wiring in this sector was for long term residents (27%). Table 5.3.
Figure 5.9: Proportion of dwellings with MCBs (Miniature Circuit Breakers) by tenure, 2001 and 2009
2001 2009
0
10
20
30
40
50
60
70
80
90
100
owner occupied private rented local authority housing association all dwellings
perc
enta
ge o
f dw
ellin
gs
Base: all dwellingsNote: underpinning data are presented in Annex Table 5.7Source: English House Condition Survey 2001, English Housing Survey 2009, dwelling sample
Table 5.3: Proportion of each household group having fully modern wiring1 by tenure, 2009
all households
owner occupied
private rented
local authority
housing association
all tenures
thousands of householdswith under 5s 793 269 150 179 1,391 with 60+ 2,002 164 347 423 2,936 with disabled/ill 1,441 272 450 553 2,718 in poverty 696 265 327 325 1,612 ethnic minority 358 243 155 143 899 single person household 1,281 390 378 456 2,505 long term resident (20 years or more) 1,290 51 209 177 1,727
all households 5,921 1,477 963 1,152 9,513
percentages of all householdswith under 5s 50.4 44.3 53.4 64.4 50.8with 60+ 33.7 41.1 53.7 57.4 38.0with disabled/ill 37.0 41.3 54.0 59.3 43.0in poverty 34.5 43.3 55.4 60.5 42.9ethnic minority 41.0 44.3 46.4 57.3 44.8single person household 35.2 42.3 56.7 58.3 41.7long term resident (20 years or more) 27.3 33.8 52.9 56.6 30.9
all households 40.6 44.9 54.2 60.4 44.2
Note: 1 Fully modern wiring is defined as dwellings where all of the following conditions were met: all wiring is PVC coated; all earthing is modern; consumer units are modern; Residual Current Devices (RCDs) are present (in consumer unit or separate); and Miniature Circuit Breakers (MCBs) are presentSource: English Housing Survey 2009, household sub-sample

Chapter 6 Energy performance | 49
Chapter 6 Energy performance
6.1 This chapter assesses the performance of the housing stock in terms of its energy efficiency and carbon dioxide emissions. The EHS Housing Stock Report 2008 contains more detailed information about how these relate to dwelling characteristics and the overall trends and patterns are unlikely to have changed significantly by 2009. Additional 2009 findings relating to energy performance, heating and insulation can be found in the Summary Statistics Tables, SST 6.1-7.4.
6.2 The key measures used throughout this chapter are the energy efficiency (SAP) rating14 and carbon dioxide (CO2) emissions. See the Glossary for more details.
Key findings
• The energy efficiency (SAP) rating for the housing stock increased steadily from 42 points in 1996 to 53 in 2009. Based on the SAP methodology’s standard assumptions regarding occupancy and heating of the stock, mean CO2 emissions per dwelling were 6.0 tonnes/year.
• Some 15% of all dwellings were in the lowest Energy Performance Certificate Energy Efficiency Rating Bands F and G (SAP less than 39). However, whilst 19% of private rented and 16% of owner occupied dwellings were in Bands F or G, only 6% of all social rented dwellings were similarly banded.
• By 2009, half of all dwellings with cavity walls had cavity wall insulation. Solid wall insulation was far less common: only 2% of dwellings with non-cavity walls had external insulation, and almost half of these were in the social rented sector.
• Only 41% of dwellings with lofts had at least 150mm of loft insulation in 2009, however this was a substantial increase from just 25% in 2003.
• In 2009, around a quarter (24%) of all dwellings had either a condensing or condensing combination boiler compared to only 2% in 2003. Some 29% of all boilers were less than three years old although the same proportion of boilers were at least 12 years old.
14 The SAP rating is a measure of the overall energy efficiency of the dwelling. The scale goes from 1 (very poor energy efficiency) to 100 (completely efficient with zero energy costs).

50 | English Housing Survey Housing Stock Report 2009
• Some 2% of dwellings had some form of solar panel system (either photovoltaic panels for micro generation of electricity or solar water heating panels) in 2009.
Energy performance 2009
6.3 In 2009, the mean SAP rating for the whole stock was 53 although this varied considerably for different types of stock. The most energy efficient dwellings were those owned by housing associations (62 SAP points), local authorities (60), dwellings built after 1990 (67) and purpose built flats (63). Conversely, mean SAP ratings were much lower for older dwellings built before 1919 (44), dwellings in rural areas (46), converted flats (46) and detached houses (48). Mean SAP ratings showed less variation by household characteristics. See Summary Statistics Tables SST7.1-7.4 for a full breakdown of energy performance by different types of dwellings, areas and households.
6.4 The Energy Performance Certificate Energy Efficiency Rating (EER) Bands group dwellings from the most energy efficient (Band A) to least efficient (Band G), see Glossary for how these relate to SAP ratings. Some 15% of all dwellings were in the least energy efficient Bands F and G (SAP less than 39). However, whilst 19% of private rented and 16% of owner occupied dwellings were in Bands F or G, only 6% of all social rented dwellings were in these EER Bands, Summary Statistics Table SST7.1.
6.5 Overall, some 14% of households lived in homes in Energy Efficiency Rating (EER) Bands F or G but this proportion was much lower for households containing any children less than five years old (11%) and much higher for households containing one or more people aged 60 or over (18%), Table 6.1.
Table 6.1: Number and percentage of key household groups living in homes in EER Bands F or G, 2009
all households
number (000s) percentage
with 60+ 1,409 18.2
with under 5s 289 10.5
with disabled/ill 912 14.5
in poverty 567 15.1
ethnic minority 173 8.6
all households 3,102 14.4
Source: English Housing Survey 2009, household sub-sample

Chapter 6 Energy performance | 51
6.6 The mean SAP rating for the whole stock increased steadily over time from 42 in 1996 to 53 in 2009. Improvement was evident in all tenures, especially for local authority and private rented dwellings where the mean SAP rating rose by 14 points (from 46 to 60 and from 38 to 52 respectively), Figure 6.1.
Figure 6.1: Mean energy efficiency (SAP) rating by tenure, 1996-2009
30
35
40
45
50
55
60
65
1996 2001 2003 2004 2005 2006 2007 2008 2009
SAP
ratin
g
owner occupied
private rented
local authority
housing association
all tenures
F
E
D
EER Band
Base: all dwellingsNote: underpinning data are presented in Annex Table 6.1Source: English House Condition Survey 1996-2007, English Housing Survey 2008 onwards, dwelling sample
6.7 Of the groups of dwellings with typically low mean SAP ratings, detached dwellings showed the greatest increase (from an mean SAP of 37 in 1996 to 48 in 2009), Figure 6.2. This improvement is partly explained by the higher proportion of newly built dwellings in this group. For dwellings built before 1919, the increase was more modest (from 36 to 44), largely because these dwellings are amongst the most expensive and problematic to improve (see Chapter 7). The mean SAP rating for converted flats showed considerable fluctuation because these are a highly variable group of dwellings and the sample size is relatively small.
6.8 All key household groups saw improvements in mean SAP over this period, especially families with one or more children aged under five (from 43 in 1996 to 56 in 2009), Figure 6.3.

52 | English Housing Survey Housing Stock Report 2009
Figure 6.2: Mean energy efficiency (SAP) rating by problematic dwelling groups, 1996-2009
30
35
40
45
50
55
60
65
1996 2001 2003 2004 2005 2006 2007 2008 2009
SAP
ratin
g
pre-1919 converted flats detached rural all dwellings
F
E
D
EER Band
Base: all dwellingsNote: underpinning data are presented in Annex Table 6.2Source: English House Condition Survey 1996-2007, English Housing Survey 2008 onwards, dwelling sample
6.9 The calculation of carbon dioxide (CO2) emissions is based on similar factors to SAP but emissions are calculated for the whole dwelling (rather than per m2 of floor area as for SAP). This means that larger dwellings tend to emit more CO2 per year. In 2009, the mean CO2 emitted per dwelling was 6.0 tonnes/year across the stock. This varied from a mean of 3.1 tonnes/year for dwellings with a floor area of less than 50m2 to 9.9 tonnes/year for dwellings with a floor area greater than 110m2, Summary Statistics Table SST7.1.
Figure 6.3: Mean energy efficiency (SAP) rating by key household groups, 1996-2009
30
35
40
45
50
55
60
65
1996 2001 2003 2004 2005 2006 2007 2008 2009
SAP
ratin
g
with 60+ with under 5s with disabled/illin poverty ethnic minority all households
F
E
D
EER Band
Base: all households in groupNote: underpinning data are presented in Annex Table 6.3Source: English House Condition Survey 1996-2007, English Housing Survey 2008 onwards, household sub-sample

Chapter 6 Energy performance | 53
6.10 The highest mean emissions were for dwellings in rural areas (8.6 tonnes), those built before 1919 (8.2 tonnes) and owner occupied dwellings (6.7 tonnes). Mean emissions were substantially lower for housing association dwellings (3.7 tonnes), dwellings built after 1990 (3.9 tonnes) and purpose built flats (3.2 tonnes), Summary Statistics Tables SST7.1 and SST7.2.
Improvement measures 1996-2009
6.11 This section examines trends in the take up of energy improvement measures such as replacing boilers and adding loft and cavity wall insulation.
6.12 Most dwellings built since 1990 with cavity walls had cavity wall insulation fitted as part of the original construction in order to comply with Building Regulations. Older dwellings with cavity walls that typically date from around 1930 onwards (although older examples exist) were built with open cavities although some of these have had insulation added over the years. Overall, the number of cavity wall dwellings with insulation increased from around 2.9 million in 1996 to nearly 7.7 million in 2009. By 2009, half of all dwellings with cavity walls had cavity wall insulation, Figure 6.4.
Figure 6.4: Number of dwellings with cavity walls and cavity wall insulation, 1996-2009
0
2,000
4,000
6,000
8,000
10,000
12,000
14,000
16,000
18,000
1996 2001 2003 2004 2005 2006 2007 2008 2009
num
ber
of d
wel
lings
(000
s)
with insulated cavity wall with un-insulated cavity wall
Base: all dwellings with cavity wallsNote: underpinning data are presented in Annex Table 6.4Source: English House Condition Survey 1996-2007, English Housing Survey 2008 onwards, dwelling sample
6.13 The increase in cavity wall insulation was most evident for social rented dwellings, Figure 6.5. The percentage of local authority cavity wall dwellings with insulation rose from 22% in 1996 to 59% in 2009 and the equivalent rise for housing association dwellings was from 24% to 57%. Over this period the private rented sector has consistently had the lowest proportion of cavity walls insulated, however this rose from 12% in 1996 to 34% in 2009.

54 | English Housing Survey Housing Stock Report 2009
Figure 6.5: Percentage of dwellings with insulated cavity walls by tenure, 1996-2009
0
10
20
30
40
50
60
70
1996 2001 2003 2004 2005 2006 2007 2008 2009
perc
enta
ge o
f gr
oup
owner occupied private rented local authorityhousing association all tenures
Base: all dwellings with cavity wallsNote: underpinning data are presented in Annex Table 6.5Source: English House Condition Survey 1996-2007, English Housing Survey 2008 onwards, dwelling sample
6.14 Where dwellings do not have cavity walls, external or internal wall insulation can be installed to improve energy efficiency where the thermal properties of the external walls are poor. However, both of these methods are much more expensive than installing cavity wall insulation and other measures to improve the efficiency of the heating and/or reduce heat loss through the fabric may be more appropriate. Installing external insulation may also alter the physical appearance of the building and may not be permitted in some areas or buildings due to planning restrictions, e.g. in conservation areas, or may not be seen as acceptable to building owners. Installing internal insulation is disruptive because it involves moving and refitting electrical sockets, radiators etc. and redecoration.
6.15 Given such constraints it is not surprising that in 2009, only 2% of dwellings with non-cavity walls had external insulation15 and just 1% had internal wall insulation. Almost half (46%) of the dwellings with solid wall insulation were in the social rented sector. Overall, some 12% of social rented dwellings with non-cavity walls had either external or internal insulation fitted compared with just 2% of such dwellings in the private sector, Annex Table 6.6.
6.16 To comply with current Building Regulations, new dwellings normally require around 270mm of loft insulation. In 2009, only 41% of dwellings with lofts had at least 150mm of loft insulation although this varied considerably by tenure from 28% of private rented dwellings to 52% of housing association dwellings, Annex Table 6.7. Overall, the proportion of dwellings with lofts which had at least 150mm of insulation increased from 25% in 2003 to 41% in 2009, Figure 6.6.
15 Dwellings are only classed as having ‘non-cavity’ walls where at least 50% of the external wall area is of this type. They are only classed as ‘insulated’ where at least 50% of this non-cavity wall area is insulated.

Chapter 6 Energy performance | 55
Figure 6.6: Percentage of dwellings with given loft insulation levels, 2003-2009
0
10
20
30
40
50
60
70
80
90
100
2003 2004 2005 2006 2007 2008 2009
perc
enta
ge o
f gr
oup
none less than 100mm 100-149mm 150mm or more
Base: all dwellings with a loftNote: underpinning data are presented in Annex Table 6.8Source: English House Condition Survey 2003-2007, English Housing Survey 2008 onwards, dwelling sample
6.17 From 2006, Building Regulations have required that all windows in new dwellings and any that are replaced in older dwellings are double glazed. Although relatively cost inefficient as an energy improvement measure, double glazing has been very popular from the 1990s and the proportion of dwellings with full double glazing increased substantially from 30% in 1996 to 73% in 2009, Figure 6.7.
Figure 6.7: Percentage of dwellings with given levels of double glazing, 1996-2009
0
10
20
30
40
50
60
70
80
90
100
1996 2001 2003 2004 2005 2006 2007 2008 2009
perc
enta
ge o
f dw
ellin
gs
no double glazing up to half double glazed
more than half double glazed full double glazing
Base: all dwellingsNote: underpinning data are presented in Annex Table 6.9Source: English House Condition Survey 1996-2007, English Housing Survey 2008 onwards, dwelling sample

56 | English Housing Survey Housing Stock Report 2009
6.18 Recent changes to Building Regulations made it mandatory for replacement boilers to be of the more efficient condensing types (where feasible). In 2009, around a quarter (24%) of all dwellings had either a condensing or condensing-combination boiler compared to only 2% in 2003, Figure 6.8. The increase has been largely due to the large number of condensing-combination boilers installed – these provide hot water instantaneously and tend to be installed in smaller houses and flats in preference to standard boilers (with a hot water cylinder) at least partly to reduce future maintenance or replacement of hot water cylinders and associated piping.
Figure 6.8: Percentage of dwellings with given boiler types, 1996-2009
0
10
20
30
40
50
60
70
80
90
100
1996 2001 2003 2004 2005 2006 2007 2008 2009
perc
enta
ge o
f dw
ellin
gs
standard boiler (floor or wall) back boiler (to fire or stove)combination boiler condensing boilercondensing-combination boiler no boiler
Base: all dwellingsNote: underpinning data are presented in Annex Table 6.10Source: English House Condition Survey 1996-2007, English Housing Survey 2008 onwards, dwelling sample
6.19 In 2009, 29% of all boilers were less than three years old and the same proportion of boilers were at least 12 years old. This compares with 22% and 39% respectively in 2003. Newer boilers were more likely to be condensing and/or combination boilers, whilst around three-quarters of back boilers were at least 12 years old, Annex Table 6.11. Focusing on the remaining standard boilers, private sector dwellings tended to have older boilers than those in the social sector, Figure 6.9. Of the private rented and owner occupied dwellings with standard boilers, some 57% and 53% respectively had a boiler that was at least 12 years old compared with 36% of housing association dwellings with standard boilers.
6.20 Whilst there has been a steady increase in central heating provision to 89% of all dwellings in 2009 (Summary Statistics Table SST6.1), not all of these systems are modern or with suitable controls. The key components for heating control are a programmable timer, a room thermostat and thermostatic radiator valves (TRVs) to control individual radiators. The proportion of boiler systems which used all three key components rose from 3.9 million (21% of centrally heated dwellings) in 2003 to 7.7 million (43%) in 2009, Figure 6.10. These

Chapter 6 Energy performance | 57
improvements have been more marked in the social sector. Some 260,000 dwellings used a more efficient zone control system, typically found in larger dwellings.
Figure 6.9: Age of standard boiler by tenure, 2009
0
10
20
30
40
50
60
70
80
90
100
owneroccupied
privaterented
localauthority
housingassociation
all tenures
perc
enta
ge o
f gr
oup
less than 3 years 3-12 years more than 12 years
Base: all dwellings with a standard boilerNote: underpinning data are presented in Annex Table 6.12Source: English Housing Survey 2009, dwelling sample
Figure 6.10: Number and percentage of dwellings with all three key heating control components1 for central heating by tenure, 2003-2009
0
5
10
15
20
25
30
35
40
45
50
2003 2004 2005 2006 2007 2008 2009
perc
enta
ge o
f te
nure
0
1,000
2,000
3,000
4,000
5,000
6,000
7,000
8,000
9,000
total number (000s)
% of private % of social total number of dwellings (000s)
Base: all dwellings with central heatingNote: underpinning data are presented in Annex Table 6.131 The three key components for heating control are a programmable timer, a room thermostat and thermostatic
radiator valves (TRVs) to control individual radiators.Source: English House Condition Survey 2003-2007, English Housing Survey 2008 onwards, dwelling sample

58 | English Housing Survey Housing Stock Report 2009
6.21 With the increasing take up of combination boilers, the number of dwellings with hot water cylinders has decreased over time – from 16.7 million in 1996 to 15.1 million in 2003 and 12.5 million in 2009. The proportion of these hot water cylinders with 15-29mm factory installed foam (or equivalent) insulation increased rapidly from 6% in 2003 to 40% in 2009, Figure 6.11. This is likely to be due to the increase in factory installed foam in recent years which tends to be 25 mm thick (but equivalent to a much greater thickness of loose jacket foam insulation). However, in consequence the proportion of hot water cylinders with higher levels of insulation (the equivalent of 29mm or more of factory installed) actually declined over this period.
Figure 6.11: Percentage of dwellings with given levels of factory installed (or equivalent) hot water cylinder insulation, 2003-2009
0
10
20
30
40
50
60
70
80
90
100
2003 2004 2005 2006 2007 2008 2009
perc
enta
ge o
f gr
oup
none equivalent to less than 15mm foam
equivalent to 15-29mm foam equivalent to 29mm or more of foam
Base: all dwellings with a hot water cylinderNote: underpinning data are presented in Annex Table 6.14Source: English House Condition Survey 2003-2007, English Housing Survey 2008 onwards, dwelling sample
6.22 As awareness of energy efficiency and low carbon measures improves, more households and landlords are fitting renewable technologies such as solar water heating, photovoltaic panels or wind turbines to their dwellings. In terms of initial outlay, these are quite high cost measures. Initial estimates from the survey suggest that 470,000 dwellings (2%) had some form of solar panel system (either photovoltaic panels for micro generation of electricity or solar water heating panels) in 2009.

Chapter 7 Energy improvement potential | 59
Chapter 7 Energy improvement potential
7.1 This chapter examines the potential for installing cost effective measures to the stock to improve its energy efficiency and reduce carbon emissions highlighting which groups of dwellings have the greatest potential to benefit from each measure. It also examines how far carrying out these improvements would improve the stock and what these would cost. Finally it discusses other measures that could be installed to further improve the stock and presents some case studies of dwellings where there are additional complexities and constraints.
Key findings
• In total 19.3 million dwellings (86% of the housing stock) could benefit from at least one of the cost effective improvements recommended through the Energy Performance Certificate (EPC).
• The measure that could benefit the largest number of dwellings was replacing the existing conventional central heating boiler with a condensing unit (13.4 million).
• Generally, private rented dwellings were the most likely to be able to benefit from lower cost improvement measures. The oldest stock was not necessarily the most likely to benefit from cost effective measures because many of these older dwellings have been improved over the years.
• The average cost of carrying out cost effective improvements would be around £1,400 per improved dwelling.
• If all cost effective improvement measures were installed, the mean energy efficiency (SAP) rating for the stock as a whole would rise by 10 points to 63.
• On the basis of this energy efficiency rating methodology, the improvement would equate to a potential 22% reduction in heating, lighting and ventilation costs of average fuel bills for households (at constant prices), CO2 emissions falling on average by 1.4 tonnes/year across the whole stock and a total saving of 32 million tonnes/year of CO2 (or 24% of total emissions accounted for by the housing stock).
• If all cost effective improvement measures were installed, the percentage of dwellings in EPC Energy Efficiency Rating Bands A to C would more than double to almost 40% of the housing stock and the percentage in the least efficient Bands E to G would fall by more than half to 18%.

60 | English Housing Survey Housing Stock Report 2009
Improvement measures
7.2 The cost effective improvement measures considered in this section are based on the lower and higher cost recommendations covered by the Energy Performance Certificate (EPC). These individual measures are described in more detail in the Glossary.
7.3 Some 19.3 million dwellings (86% of the housing stock) could benefit from at least one of the cost effective improvements listed in Table 7.1. Some 13.0 million (58%) dwellings could benefit from one or more of the lower cost measures and 16.5 million (73%) could benefit from one or more of the higher cost measures. The measure that could benefit the greatest number of dwellings was replacing the existing conventional central heating boiler with a condensing unit (13.4 million). Large numbers of dwellings could also benefit from the lower cost measures such as installing or increasing the amount of loft insulation (8.0 million) and installing cavity wall insulation (6.2 million).
Table 7.1: EPC recommended energy efficiency measures, 2009
all dwellings
size of applicable group (000s)
number of dwellings that would benefit from
the measure (000s)
percentage of applicable
group
lower cost measures (less than £500)loft insulation 19,737 8,002 40.5 cavity wall insulation 15,441 6,152 39.8 hot water cylinder insulation 12,522 3,931 31.4 any lower cost measure 22,335 13,042 58.4
higher cost measures (more than £500)heating controls 19,627 6,563 33.4 boiler upgrade 19,431 13,415 69.0 storage heater upgrade 2,358 1,627 69.0 hot water cylinder thermostat 12,522 1,134 9.1 replacement warm air system 196 133 68.0 install biomass system 528 124 23.5 any higher cost measure 22,335 16,466 73.7
any lower or higher cost measure 22,335 19,255 86.2
mean cost of measures per improved dwelling (£)
– £1,413 –
total cost of measures (£billion) – £27.20 –
Note: improvement costs at 2009 pricesSource: English Housing Survey 2009, dwelling sample
7.4 In 2009, some 2.4 million dwellings without mains gas used storage radiators or other non-central, electric heating systems and around 69% of these could benefit from replacing these with more modern slim-line storage heaters. Around 130,000 dwellings could benefit from upgrading their existing warm

Chapter 7 Energy improvement potential | 61
air heating system and 120,000 from replacing their solid fuel boiler with a HETAS16 approved biomass boiler. Around 31% of the 12.5 million dwellings with hot water cylinders could be improved by upgrading the cylinder insulation and around 9% by fitting a cylinder thermostat.
7.5 Generally, private rented dwellings were proportionately the most likely to be able to benefit from low cost measures17. Around 48% of all private rented dwellings with lofts and 51% of those with cavity walls could benefit from insulating these components, Figure 7.1. The owner occupied sector had the greatest potential for upgrading boilers and heating controls (71% and 37% respectively), largely because it had the highest proportion of dwellings with older central heating systems. Social sector dwellings were generally less likely to be able to benefit, mainly because many of these works had been carried out over the past 10 years through the Decent Homes programme and other energy improvement initiatives. However, housing association dwellings were more likely to be able to benefit from upgrading storage heaters and local authority dwellings from providing insulation or thermostats to hot water cylinders than the applicable dwellings in other tenures.
Figure 7.1: Percentage of applicable groups that would benefit from EPC recommended energy efficiency measures by tenure, 2009
0
10
20
30
40
50
60
70
80
90
loftinsulation
cavity wallinsulation
hot watercylinder
insulation
heatingcontrols
boilerupgrade
storageheater
upgrade
hot watercylinder
thermostat
lower cost measures higher cost measures
perc
enta
ge o
f ap
plic
able
gro
up
owner occupied private rented local authority housing association
Base: all applicable dwellings in each improvement categoryNote: underpinning data are presented in Annex Table 7.1Source: English Housing Survey 2009, dwelling sample
16 The official body of solid fuel domestic heating appliances, fuels and services.17 The cost effective measures of replacement warm air system and installing biomass system have been omitted from detailed
(post) improvement analysis due to the small number of dwellings that would benefit.

62 | English Housing Survey Housing Stock Report 2009
7.6 The oldest stock was not necessarily the most likely to be able to benefit from the cost effective improvement measures considered here because many of these older dwellings have been improved over the years, Figure 7.2. For example, very few dwellings built before 1919 would have originally been built with loft insulation, but for that reason are more likely to have had a sufficient amount retrospectively fitted. Those built between 1945 and 1980 had the greatest potential for hot water cylinder upgrades and heating controls. Generally, there was far less potential to improve dwellings built after 1990, largely because the requirements for energy efficiency in the Building Regulations have improved in the last 20 years18.
Figure 7.2: Percentage of applicable groups that would benefit from EPC recommended energy efficiency measures by dwelling age, 2009
0
10
20
30
40
50
60
70
80
90
100
loftinsulation
cavity wallinsulation
hot watercylinder
insulation
heatingcontrols
boilerupgrade
storageheater
upgrade
hot watercylinder
thermostat
lower cost measures higher cost measures
perc
enta
ge o
f ap
plic
able
gro
up
pre- 1919 1919-44 1945-64 1965-80 1981-90 post 1990
Base: all applicable dwellings in each improvement categoryNote: underpinning data are presented in Annex Table 7.2Source: English Housing Survey 2009, dwelling sample
7.7 The potential for installing the different measures also varied by dwelling type. Overall, houses were more likely to be able to benefit from improvements to heating controls and boiler upgrades whereas flats were more likely to be able to benefit from storage heater upgrades, Figure 7.3. End terraces were the house type that was least likely to benefit from new or additional loft insulation, and purpose built flats were most likely to benefit from hot water cylinder insulation.
18 It is perhaps surprising that the newest dwellings with storage heaters were more likely than older stock to benefit from having these upgraded. However the EPC recommended upgrade for storage heaters is to a very modern type, and while older dwellings will be more likely to have had their original heaters replaced, more recently built properties will be more likely to have functionally adequate, but not optimised, storage heaters present.

Chapter 7 Energy improvement potential | 63
Figure 7.3: Percentage of applicable groups that would benefit from EPC recommended energy efficiency measures by dwelling type, 2009
0
10
20
30
40
50
60
70
80
90
100
lofttinsulation
cavity wallinsulation
hot watercylinder
insulation
heatingcontrols
boilerupgrade
storageheater
upgrade
hot watercylinder
thermostat
lower cost measures higher cost measures
perc
enta
ge o
f ap
plic
able
gro
up
end terrace mid terrace semi detached detachedbungalow converted flat purpose built flat, low rise purpose built flat, high rise
Base: all applicable dwellings in each improvement categoryNote: underpinning data are presented in Annex Table 7.3Source: English Housing Survey 2009, dwelling sample
7.8 Dwellings in generally rural areas were more likely to be able to benefit from (additional) loft insulation, improved heating controls and boiler upgrades and less likely to benefit from cavity wall insulation and from installing insulation or thermostats to hot water cylinders than those in generally urban locations, Annex Table 7.4.
7.9 Households in the key household groups were, on average, less likely to benefit from the cost effective measures, although the differences were not substantial, Annex Table 7.5.
Post-improvement performance
7.10 If all of the cost effective improvement measures19 were installed, the mean SAP rating for the stock would rise by 10 points to 63, Table 7.2. Under the standard occupancy and heating patterns used by SAP to assess stock performance, this could result in: a potential 22% reduction in heating, lighting and ventilation costs of average fuel bills for all households (from £588 to £458 at 2005 standard energy prices); CO2 emissions falling on average by 1.4 tonnes/year across the whole stock (from 6.0 to 4.6 tonnes/year); and a total saving of
19 Replacing warm air system has been included in the post-improvement Energy Efficiency Rating/CO2 emissions but, due to modelling complexity, installation of a biomass boiler has not. Given the relatively small number of dwellings that could benefit from a HETAS approved biomass boiler this will not have any significant effect on the overall indicators of post-improvement performance used in this section.

64 | English Housing Survey Housing Stock Report 2009
32 million tonnes/year of CO2 (or 24% of total emissions accounted for by the housing stock).
Table 7.2: Potential improvements in energy efficiency (SAP) ratings, CO2 emissions and fuel costs by tenure, 2009
all dwellings
current post-improvement difference
SAP (rating)
CO2 emissions
(tonnes/year)
energy cost
(£/year)SAP
(rating)
CO2 emissions
(tonnes/year)
energy cost
(£/year)
SAP increase (rating)
CO2 emissions
(tonnes/year)
energy cost
saving (£/year)
owner occupied 51.3 6.7 647 62.3 5.0 500 11.0 1.7 147 private rented 51.9 5.5 551 61.8 4.3 433 9.9 1.2 119 local authority 59.6 4.0 402 67.7 3.1 325 8.1 0.8 77 housing association
62.4 3.7 380 69.4 3.0 312 7.0 0.7 68
all dwellings 53.1 6.0 588 63.3 4.6 458 10.3 1.4 130
Note: energy costs at standard 2005 pricesSource: English Housing Survey 2009, dwelling sample
Energy efficiency (SAP) and CO2 emissions
7.11 From 1996 to 2009 there were substantial improvements in energy efficiency with the percentage of dwellings in the most efficient Bands A to C increasing from 2% to 14% and the proportion in the least efficient Bands E to G reducing from 81% to 49%, Figure 7.4. Applying the full range of cost effective EPC measures would bring about a similar level of improvement to the 2009 position, increasing the percentage of dwellings in Bands A to C to almost 40% and reducing the percentage in the least efficient Bands E to G to 18%. Some 65% of housing association dwellings would be in Bands A to C and the proportion of owner occupied dwellings in the most inefficient Bands E to G would fall from 55% to just 19% of the sector.
7.12 If the cost effective EPC recommended measures were implemented, CO2 emissions could reduce by a quarter (25%) in the owner occupied sector compared with 19% for housing association dwellings. In absolute terms, the potential gain from the owner occupied sector would be more than twice that of the housing association sector (1.7 tonnes/year/dwelling compared with 0.7 tonnes/year/dwelling), Table 7.2. Across the stock as a whole the proportion of dwellings notionally emitting less than three tonnes/year of CO2 would double (from 14% to 27%) while the proportion emitting seven or more tonnes/year would reduce from 26% to just 12%, Figure 7.5. The majority (60%) of housing association dwellings and around one in six (17%) of those in the owner occupied sector would emit less than three tonnes/year.

Chapter 7 Energy improvement potential | 65
Figure 7.4: Percentage of dwellings in each Energy Efficiency Rating Band by tenure – 1996, current and post-improvement performance, 2009
0 10 20 30 40 50 60 70 80 90 100
1996current
post-improvement
1996current
post-improvement
1996current
post-improvement
1996current
post-improvement
1996current
post-improvement
owne
roc
cupi
edpr
ivat
ere
nted
loca
lau
thor
ityho
usin
gas
soci
atio
nal
ldw
ellin
gs
percentage of group
A or B C D E F G
Base: all dwellingsNote: underpinning data are presented in Annex Table 7.6Source: English Housing Condition Survey 1996, English Housing Survey 2009, dwelling sample
Figure 7.5: Percentage of dwellings with given levels of carbon dioxide (CO2) emissions (tonnes/year) by tenure – current and post-improvement performance, 2009
owne
roc
cupi
edpr
ivat
ere
nted
loca
lau
thor
ityho
usin
gas
socia
tion
alldw
elling
s
0 10 20 30 40 50 60 70 80 90 100
current
post-improvement
current
post-improvement
current
post-improvement
current
post-improvement
current
post-improvement
percentage of group
less than 3 3 up to 5 5 up to 7 7 up to 10 10 or more
Base: all dwellingsNote: underpinning data are presented in Annex Table 7.7Source: English Housing Survey 2009, dwelling sample

66 | English Housing Survey Housing Stock Report 2009
7.13 In general, houses could improve more than purpose built flats with detached and semi-detached houses seeing an increase in mean SAP rating of 12 points and a 26% reduction in CO2 emissions, Annex Table 7.8. Converted flats would also see significant improvements with the average SAP rating increasing by 9 points. High rise flats would improve least (an increase of 7 SAP points and reduction of 0.4 tonnes of CO2) largely because a relatively small proportion of these flats have the potential to install many of the cost effective measures (many do not have lofts, cavity walls or individual boiler driven central heating systems).
7.14 Similar potential increases in SAP ratings would be seen in all dwelling age bands up to 1980. Carrying out the cost effective upgrades identified in the previous section could, on average, improve the energy efficiency of this older stock by 10 to 12 SAP points and reduce CO2 emissions of dwellings built between 1919 and 1980 by 26-28%, Annex Table 7.8. As might be expected, the improvement to post-1990 dwellings would be much more modest, on average an increase of 5 SAP points and a 15% reduction in CO2 emissions.
7.15 Dwellings in generally rural areas would see their mean SAP rating increase by up to12 points compared with increases of 9 points and 10 points in city and other urban centres and suburban areas respectively, although the mean SAP rating for dwellings in isolated rural areas and village centres would still be well below that for the stock as a whole (45 and 56 compared with a stock average of 63), Annex Table 7.8. However, because dwellings in more rural areas tend to be larger, there would be substantial reductions in CO2 emissions (a reduction of 3.4 tonnes/year in isolated rural areas compared with 0.8 tonnes/year in city centre dwellings).
Costs of improvement works
7.16 At 2009 prices, the mean cost across the whole stock of carrying out the cost effective improvements would be around £1,400 per improved dwelling. Some 30% of these dwellings could be improved by spending less than £1,200 whereas at the other end of the scale, 10% of these dwellings would require works costing in excess of £2,170, Annex Table 7.9.
7.17 On average, the most expensive dwellings to improve using the cost effective measures were those in the owner occupied sector (£1,470), detached houses (£1,690) and dwellings in rural areas (ranging from over £1,500 for village centres to over £2,000 for dwellings in isolated rural areas), Annex Tables 7.1-7.4.
Other improvements and case studies
7.18 Even after installing all of the cost effective measures, some parts of the stock would still have a relatively poor level of energy efficiency, these include
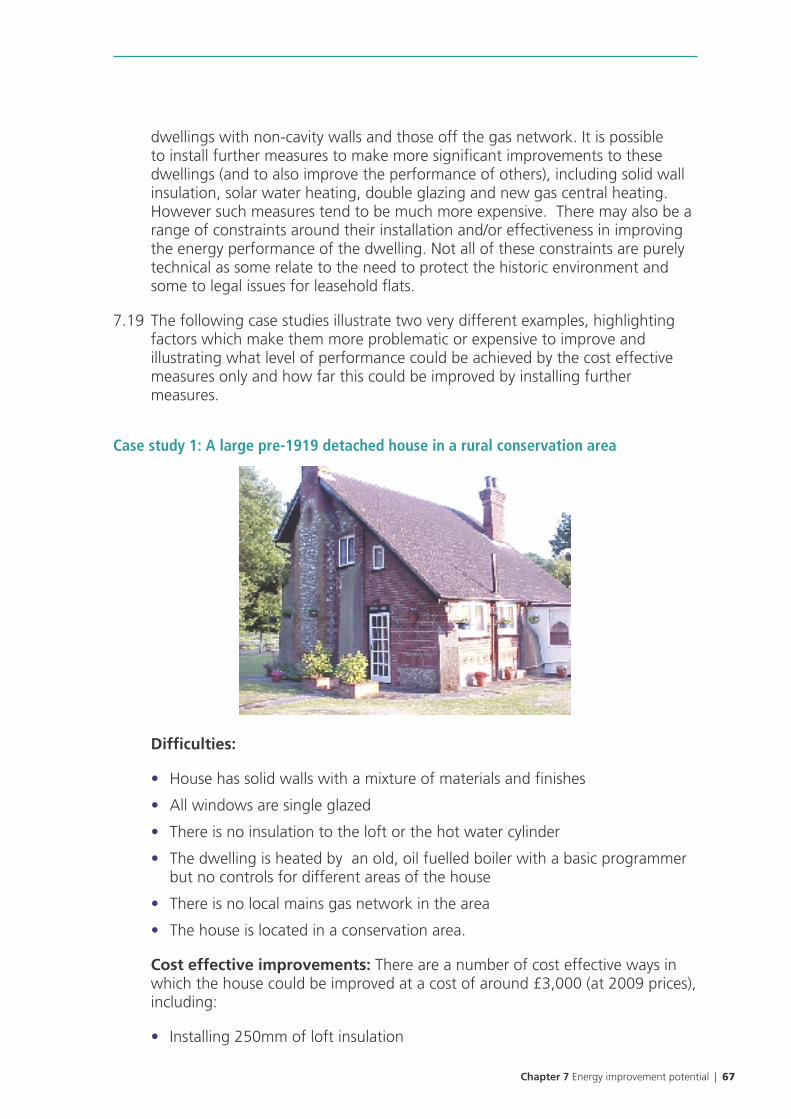
Chapter 7 Energy improvement potential | 67
dwellings with non-cavity walls and those off the gas network. It is possible to install further measures to make more significant improvements to these dwellings (and to also improve the performance of others), including solid wall insulation, solar water heating, double glazing and new gas central heating. However such measures tend to be much more expensive. There may also be a range of constraints around their installation and/or effectiveness in improving the energy performance of the dwelling. Not all of these constraints are purely technical as some relate to the need to protect the historic environment and some to legal issues for leasehold flats.
7.19 The following case studies illustrate two very different examples, highlighting factors which make them more problematic or expensive to improve and illustrating what level of performance could be achieved by the cost effective measures only and how far this could be improved by installing further measures.
Case study 1: A large pre-1919 detached house in a rural conservation area
Difficulties:
• House has solid walls with a mixture of materials and finishes
• All windows are single glazed
• There is no insulation to the loft or the hot water cylinder
• The dwelling is heated by an old, oil fuelled boiler with a basic programmer but no controls for different areas of the house
• There is no local mains gas network in the area
• The house is located in a conservation area.
Cost effective improvements: There are a number of cost effective ways in which the house could be improved at a cost of around £3,000 (at 2009 prices), including:
• Installing 250mm of loft insulation

68 | English Housing Survey Housing Stock Report 2009
• Fitting a 160mm thick jacket to the hot water cylinder
• Space heating – replacing the old boiler with an efficient condensing boiler still fuelled by oil, installing a thermostat in the main living area and fitting TRVs to all radiators.
Case study 1: Current and post-improvement performance
SAP rating (EER Band)
CO2 emissions (tonnes/year)
energy costs at standard 2005 prices (£/year)
current performance 20 (G) 36.1 3,034
post-improvement performance 43 (E) 21.9 1,913
These improvements would raise the SAP rating to a level that is higher than that currently attained by an average pre-1919 detached house. The CO2 emissions and annual costs would still be high due to the dwelling size, but significantly less than before measures had been applied.
Additional improvements
The dwelling is in a conservation area which means that it is not feasible to install external wall insulation. The need to protect the historic environment may also preclude other measures such as replacing the windows with double glazed units or using solar panels to provide some of the energy for hot water. The energy performance of the walls could be enhanced by using internal wall insulation. However, on a whole-house level this could only realistically be applied as part of a major internal refurbishment of the dwelling. Alternatively it could be applied on a room-per-room basis, perhaps as a DIY installation, when rooms were being redecorated20.
Case study 2: A 1960s socially rented purpose built flat in a low rise block
20 For smaller dwellings the loss of internal space may be considered an issue by the owner.

Chapter 7 Energy improvement potential | 69
Difficulties:
• The flat is of concrete frame construction with cavity wall sections between the concrete pillars rather than full cavity construction
• All windows are single glazed
• There is no gas supply to the block
• The only form of space heating is electric room heaters
• There is no insulation to the hot water cylinder
• The flat already has problems with dampness that are caused by condensation
• Although the block is owned by the local authority over half of the flats have been sold under the Right to Buy.
Relying on electricity for heating coupled with the single glazed windows gives a low SAP rating, particularly for a purpose built flat. The expense of electric heating leads to relatively high costs, and CO2 emissions are above average for the age, type and size of dwelling.
Cost effective improvements: Cost effective measures which could be applied to this flat, at a cost of around £1,200 (at 2009 prices), include:
• Installing cavity wall insulation to the cavity sections within the concrete frame. However, the council would have to consult with the leasehold owners about this work who, because they are a majority, could possibly veto it. If the work does go ahead, the council would have to bill the leaseholders to obtain payment for their share of the work.
• Installing modern slim-line storage heaters
• Fitting a 160mm thick jacket fitted to the cylinder.
Case study 2: Current and post-improvement performance
SAP rating (EER Band)
CO2 emissions (tonnes/year)
energy costs at standard 2005 prices (£/year)
current performance 31 (F) 3.8 546
post-improvement performance 63 (D) 2.8 288
Making these improvements would significantly raise the SAP rating, whilst at constant prices annual energy costs would be almost halved. However, although the recommended treatment of the walls using cavity wall insulation will contribute to the improved energy performance, the effect will not be as positive as would insulating a full cavity wall. Also, the concrete frame itself would still be uninsulated and will act as a ‘cold bridge’ that could lead to condensation and mould growth in these areas.

70 | English Housing Survey Housing Stock Report 2009
Additional improvements:
Some improvements could be made through the installation of double glazing. The local authority could also consider overcladding the block (external wall insulation) although this would be expensive and still require the consent of, and financial contribution from, the leaseholders.

Appendix Sampling errors | 71
Appendix: Sampling errors
Sources of error in surveys
Like all estimates based on samples, the results of the EHS are subject to various possible sources of error. The total error in a survey estimate is the difference between the estimate derived from the data collected and the (unknown) true value for the population. The total error can be divided into two main types: systematic error and random error.
Systematic error, or bias, covers those sources of error which will not average to zero over repeats of the survey. Bias may occur, for example, if certain sections of the population are omitted from the sampling frame, if non-respondents to the survey have different characteristics to respondents, or if interviewers systematically influence responses in one way or another. When carrying out a survey, substantial efforts are put into the avoidance of systematic errors but it is possible that some may still occur.
The most important component of random error is sampling error, which is the error that arises because the estimate is based on a sample survey rather than a full census of the population. The results obtained for any single sample may, by chance, differ from the true values for the population but the difference would be expected to average to zero over a number of repeats of the survey. The amount of variation depends on the size of the sample and the sample design and weighting method.
A measure of the impact of the variation introduced by the sample design and the weighting is the design factor (deft). This is evaluated relative to the error that would have been produced had the survey been carried out using a simple random sample21. A deft greater than one shows that the design and weighting have increased the variability of the estimate and increased the measure of the standard error relative to the reference. Since the 2009 EHS effectively is a simple random sample the deft arises solely from the weighting adjustments.
Random error may also arise from other sources, such as variation in the informant’s interpretation of the questions, or interviewer variation. Efforts are made to minimise these effects through interviewer training and through pilot work.
21 Technically, the deft is the estimate of the standard error produced under the complex design divided by the standard error under an equally weighted simple random sample.

72 | English Housing Survey Housing Stock Report 2009
Confidence intervals
Although the estimate produced from a sample survey will rarely be identical to the population value, statistical theory allows us to measure the accuracy of any survey result. The standard error can be estimated from the values obtained for the sample and this allows calculation of confidence intervals which give an indication of the range in which the true population value is likely to fall.
Tables A1 and A2 provide standard errors and 95% confidence intervals around selected key survey estimates.
Table A1: Sampling errors using weighted data: percentages, 2009
characteristicunweighted
base percentage
standard error
(percentage)
design factor (deft)
95% confidence interval (including the
impact of the deft)
lower upper
tenure 16,150 owner occupied 66.99 0.41 1.04 66.20 67.79private rented 16.06 0.29 0.98 15.49 16.64local authority 8.11 0.20 0.72 7.72 8.51housing association 8.83 0.20 0.70 8.43 9.23
dwelling type 16,150 end terrace 10.27 0.27 1.13 9.73 10.80mid terrace 18.61 0.35 1.13 17.93 19.29semi detached 25.64 0.39 1.15 24.87 26.41detached 17.01 0.33 1.19 16.36 17.66bungalow 9.19 0.24 1.05 8.71 9.67converted flat 4.03 0.19 1.35 3.65 4.41purpose built flat, low rise
13.59 0.29 1.02 13.02 14.17
purpose built flat, high rise
1.66 0.11 0.99 1.45 1.88
dwelling age 16,150 pre 1919 21.47 0.38 1.23 20.72 22.211919-44 16.52 0.33 1.16 15.86 17.171945-64 20.17 0.35 1.08 19.48 20.861965-80 20.74 0.36 1.10 20.03 21.441981-90 8.87 0.26 1.14 8.37 9.37post 1990 12.24 0.29 1.16 11.67 12.82
decent homes owner occupied 8,397 decent 70.75 0.54 1.10 69.68 71.81non-decent 29.25 0.54 1.10 28.19 30.32private rented 2,798 decent 59.17 1.03 1.11 57.14 61.19non-decent 40.83 1.03 1.11 38.81 42.86local authority 2,325 decent 72.90 1.07 1.17 70.80 75.00non-decent 27.10 1.07 1.17 25.00 29.20
continued

Appendix Sampling errors | 73
characteristicunweighted
base percentage
standard error
(percentage)
design factor (deft)
95% confidence interval (including the
impact of the deft)
lower upper
housing association 2,630 decent 80.30 0.87 1.14 78.59 82.01non-decent 19.70 0.87 1.14 17.99 21.41all 16,150 decent 69.91 0.42 1.17 69.09 70.72non-decent 30.09 0.42 1.17 29.28 30.91
energy efficiency rating band (EHCS SAP 2005)owner occupied 8,397 A to C 9.10 0.35 1.13 8.42 9.78D and E 74.91 0.52 1.10 73.90 75.92F and G 15.99 0.43 1.09 15.14 16.84private rented 2,798 A to C 15.84 0.79 1.17 14.29 17.40D and E 65.16 1.00 1.12 63.19 67.12F and G 19.00 0.81 1.08 17.42 20.58local authority 2,325A to C 25.80 1.04 1.14 23.76 27.83D and E 66.96 1.14 1.17 64.73 69.19F and G 7.24 0.70 1.37 5.87 8.62housing association 2,630 A to C 35.39 1.03 1.11 33.36 37.42D and E 59.02 1.06 1.11 56.94 61.11F and G 5.59 0.51 1.17 4.58 6.60all 16,150 A to C 13.86 0.30 1.02 13.27 14.44D and E 71.30 0.41 1.12 70.50 72.09F and G 14.85 0.32 1.22 14.21 15.48
Table A2: Sampling errors using weighted data: mean SAP, 2009
characteristicunweighted
basemean
SAPstandard
error (mean)design
factor (deft)
95% confidence interval (including the
impact of the deft)
lower upper
Energy efficiency (SAP05) ratingowner occupied 8,397 51.30 0.17 1.11 50.96 51.63private rented 2,798 51.94 0.36 1.10 51.24 52.64local authority 2,325 59.60 0.33 1.24 58.95 60.26housing association 2,630 62.43 0.27 1.11 61.89 62.97
all tenures 16,150 53.06 0.13 1.14 52.79 53.32

74 | English Housing Survey Housing Stock Report 2009
Glossary of key definitions and terms
Age
This is the date of construction of the oldest part of the building.
Area type
city or other urban centre: includes:
city centre: the area around the core of a large city.
other urban centre: the area around towns and small cities, and also older urban areas which have been swallowed up by a metropolis.
suburban residential: the outer area of a town or city; characterised by large planned housing estates.
rural: includes:
rural residential: a suburban area of a village, often meeting the housing needs of people who work in nearby towns and cities.
village centre: the traditional village or the old heart of a village which has been suburbanised.
rural: an area which is predominantly rural e.g. mainly agricultural land with isolated dwellings or small hamlets.
Basic repair costs
Basic repairs include urgent work required in the short term to tackle problems presenting a risk to health, safety, security or further significant deterioration plus any additional work that will become necessary within the next five years. Costs are standardised for regions and tenures.
Bedroom standard
The ‘Bedroom standard’ is used as an indicator of occupation density. A standard number of bedrooms is calculated for each household in accordance with its age/sex/marital status composition and the relationship of the members to one another. A separate bedroom is allowed for each married or cohabiting couple, any other person aged 21 or over, each pair of adolescents aged 10-20 of the same sex, and each pair of children under 10. Any unpaired person aged 10-20 is notionally paired, if possible, with a child under 10 of the same sex, or, if that is not possible, he or she is counted as requiring a separate bedroom, as is any unpaired child under 10. This notional standard number of bedrooms is then compared with the actual number
Glossary | 75
of bedrooms (including bed-sitters) available for the sole use of the household, and differences are tabulated. Bedrooms converted to other uses are not counted as available unless they have been denoted as bedrooms by the informants; bedrooms not actually in use are counted unless uninhabitable.
Carbon dioxide (CO2) emissions
The total carbon dioxide emissions from space heating, water heating, ventilation and lighting, less the emissions saved by energy generation as derived from SAP calculations and assumptions. These are measured in tonnes/year. Unlike the EIR the CO2 emissions presented are not adjusted for floor area and represent emissions from the whole dwelling. The highest and lowest emitting performers have also been grouped with cut-off points set at 3 tonnes per year for the low emitters and 10 tonnes per year for the highest. CO2 emissions for each dwelling are based on a standard occupancy and a standard heating regime.
Damp and mould growth
Damp and mould in dwellings fall into three main categories:
rising damp: where the surveyor has noted the presence of rising damp in at least one of the rooms surveyed during the physical survey. Rising damp occurs when water from the ground rises up into the walls or floors because damp proof courses in walls or damp proof membranes in floors are either not present or faulty.
penetrating damp: where the surveyor has noted the presence of penetrating damp in at least one of the rooms surveyed during the physical survey. Penetrating damp is caused by leaks from faulty components of the external fabric e.g. roof covering, gutters etc. or leaks from internal plumbing e.g. water pipes, radiators etc.
condensation or mould: caused by water vapour generated by activities like cooking and bathing condensing on cold surfaces like windows and walls. Virtually all dwellings have some level of condensation occurring. Only serious levels of condensation or mould are considered as a problem in this report.
Decent Homes
A Decent Home is one that meets all of the following four criteria:
a) meets the statutory minimum standard for housing. From April 2006 the Fitness Standard was replaced by the Housing Health and Safety Rating System (HHSRS).
b) it is in a reasonable state of repair (assessed from the age and condition of a range of building components including walls, roofs, windows, doors, chimneys, electrics and heating systems).
c) it has reasonably modern facilities and services (assessed according to the age, size and layout/location of the kitchen, bathroom and WC and any common areas for blocks of flats, and to noise insulation).

76 | English Housing Survey Housing Stock Report 2009
d) it provides a reasonable degree of thermal comfort (adequate heating and effective thermal insulation).
The detailed definition for each of these criteria is included in A Decent Home: Definition and guidance for implementation, Communities and Local Government, June 2006: http://www.communities.gov.uk/publications/housing/decenthome
Deprived local areas
These are Lower Layer Super Output Areas (LSOAs) scored and ranked by the 2007 Index of Multiple Deprivation (IMD).
LSOAs are a statistical geography providing uniformity of size. There are 32,482 in England and on average each contains around 625 dwellings.
These ranked areas have been placed into ten groups of equal numbers of areas, from the 10% most deprived areas on the Index, to the 10% least deprived.
Double glazing
This covers factory made sealed window units only. It does not include windows with secondary glazing or external doors with double or secondary glazing (other than double glazed patio doors which are surveyed as representing two windows).
Dwelling
A dwelling is a self-contained unit of accommodation (normally a house or flat) where all the rooms and amenities (i.e. kitchen, bath/shower room and WC) are for the exclusive use of the household(s) occupying them. In rare cases, amenities may be located outside the front door but provided they are for the exclusive use of the occupants, the accommodation is still classed as a dwelling.
For the most part a dwelling will be occupied by one household. However, it may contain none (vacant dwelling) or may contain more than one (House in Multiple occupation or HMO).
Dwelling type
Dwellings are classified, on the basis of the surveyors’ inspection, into the following categories:
terraced house
a) size
small terraced house: a house with a total floor area of less than 70m2 forming part of a block where at least one house is attached to two or more other houses.
medium/large terraced house: a house with a total floor area of 70m2 or more forming part of a block where at least one house is attached to two or more other houses.

Glossary | 77
b) attachment
end terraced house: a house attached to one other house only in a block where at least one house is attached to two or more other houses.
mid-terraced house: a house attached to two other houses in a block.
semi-detached house: a house that is attached to just one other in a block of two.
detached house: a house where none of the habitable structure is joined to another building (other than garages, outhouses etc.).
bungalow: a house with all of the habitable accommodation on one floor. This excludes chalet bungalows and bungalows with habitable loft conversions, which are treated as houses.
converted flat: a flat resulting from the conversion of a house or former non-residential building. Includes buildings converted into a flat plus commercial premises (typically corner shops).
purpose built flat, low rise: a flat in a purpose built block less than six storeys high. Includes cases where there is only one flat with independent access in a building which is also used for non-domestic purposes.
purpose built flat, high rise: a flat in a purpose built block of at least six storeys high.
Electrical safety
Miniature circuit breakers (MCBs) provide the most modern form of electrical current overload protection. These have replaced cartridge fuses and the original wire fuses (these simply melt when overheated) which formed the earliest form of protection.
Residual current devices (RCDs) are designed to break an electrical current very easily by detecting any abnormality in the circuit, for example, through someone touching a live wire. They are normally located in the consumer unit but a separate RCD may exist to protect an additional circuit, for example an electrical circuit used in the garden.
Energy cost
This represents the total energy cost from space heating, water heating, ventilation and lighting, less the costs saved by energy generation as derived from SAP calculations and assumptions. This is measured in £/year using constant prices based on average fuel prices for 2005 (which input into the 2005 Standard Assessment Procedure) and do not reflect subsequent changes in fuel prices. Energy costs for each dwelling are based on a standard occupancy and a standard heating regime.

78 | English Housing Survey Housing Stock Report 2009
Energy Performance Certificate
The Energy Performance Certificate (EPC) provides a range of indicators based on current performance, whether the property would benefit in terms of improved performance from a range of low cost and higher cost measures, and the likely performance arising from the application of those measures. The EPC assessment is based on a simplified form of the energy efficiency Standard Assessment Procedure (SAP) known as Reduced Data SAP (RDSAP).
The EHCS currently provides the following EPC based indicators but using the survey’s own approach to SAP:
current performance:
• energy efficiency rating (EER) and bands
• environmental impact rating (EIR) and bands
• primary energy use (kWh/m2/year)
• energy cost (£/year), but unlike the EPC these are based on 2005 constant Prices
• CO2 (carbon dioxide) emissions (tonnes/year).
improvement measures: as part of the EPC, certain improvement measures are suggested, which would improve the energy efficiency of the dwelling. These include improvements to both heating and insulation measures.
a) higher cost measures (more than £500):
• upgrade to central heating controls, for boiler driven systems, typically to a stage where a room thermostat, a central programmer and thermostatic radiator valves (TRV’s) have been installed (although the range of upgraded controls can vary depending on the heating system);
• upgrading to a class A condensing boiler using the same fuel (mains gas, LPG or fuel oil), where a non-communal boiler is in place (this improvement measure is most appropriate when the existing central heating boiler needs repair or replacement);
• upgrading existing storage radiators (or other electric heating) to more modern, fan-assisted storage heaters;
• installation of a hot water cylinder thermostat where a storage cylinder is in use but no thermostat exists;
• replacement warm-air unit with a fan-assisted flue, where the original warm-air heating unit is pre-1998;
• installation of a manual feed biomass boiler or wood pellet stove where an independent, non-biomass solid fuel system exists. This measure was assessed to identify the number of dwellings that would benefit from this measure but was not included in the post improvement energy efficiency rating or carbon dioxide emissions (reported in section 4) due a combination of the small amount of dwellings that would benefit and modelling complexity.
Glossary | 79
b) lower cost measures (less than £500):
• installation or upgrade of loft insulation which is less than 250mm, where the dwelling is not a mid- or ground-floor flat and where the loft does not constitute a full conversion to a habitable room;
• installation of cavity wall insulation, where the wall is of cavity construction;
• installation or upgrade of hot water cylinder insulation to a level matching a 160mm jacket. Recommended where the current level is less than 25mm of spray foam or less than a 100mm jacket.
The survey is not able to include the following improvements: draft proofing and low energy lighting. Other more expensive measures that are not included are: solar water heating; double or secondary glazing; solid wall insulation; complete change of heating system to class A condensing boiler (including fuel switching); solar photovoltaics (PV) panels.
Cost of energy efficiency improvement measures: the cumulative cost of implementing the measures that have been recommended for each dwelling are calculated by applying standard costs on a per unit area basis for loft and cavity wall insulation and a single unit cost for other measures.
Energy efficiency rating
The measure of energy efficiency used is the energy cost rating as determined by the Government’s Standard Assessment Procedure (SAP), used to monitor the energy efficiency of dwellings. This is based on a dwelling’s energy costs per m2 of floor area for standard occupancy of a dwelling and a standard heating regime and is calculated from the survey using a simplified form of the SAP. The energy costs take into account the costs of space and water heating, ventilation and lighting, less cost savings from energy generation technologies. They do not take into account variation in geographical location. The rating is expressed on a scale of 1-100 where a dwelling with a rating of 1 has poor energy efficiency (high costs) and a dwelling with a rating of 100 represents zero net energy cost per year.
The detailed methodology for calculating the Government’s SAP to monitor the energy efficiency of dwellings was comprehensively updated in 2005 to reflect developments in the energy efficiency technologies and knowledge of dwelling energy performance. The rating scale was also revised to run between 1 and 100 under the 2005 methodology (under the previous 2001 methodology the scale ran between 1 and 120). Therefore, a SAP rating using the 2001 method is not directly comparable to one calculated under the 2005 methodology, and it would be incorrect to do so. All SAP statistics used in reporting from 2005 are based on the SAP 2005 methodology and this includes time series data from 1996 to the current reporting period (i.e. the SAP 2005 methodology has been retrospectively applied to 1996 and subsequent survey data to provide consistent results in the 2005 and following reports).

80 | English Housing Survey Housing Stock Report 2009
Energy Efficiency Rating (EER) Bands
The energy efficiency rating is also presented in an A-G banding system for an Energy Performance Certificate, where Band A rating represents low energy costs (i.e. the most efficient band) and Band G rating represents high energy costs (the least efficient band). The break points in SAP used for the EER Bands are:
• Band A (92–100)
• Band B (81–91)
• Band C (69–80)
• Band D (55–68)
• Band E (39–54)
• Band F (21–38)
• Band G (1–20).
Environmental Impact Rating (EIR)
Based on the Energy Performance Certificate the EIR is a measure of a dwelling’s impact on the environment in terms of CO2 emissions/m2 of floor area. The emissions take into account space heating, water heating, ventilation and lighting, less the emissions saved by energy generation technologies. The rating is expressed on a scale of 1-100 where a dwelling with a rating of 1 has high CO2 emissions and a dwelling with a rating of 100 represents zero net emissions per year.
The EIR rating is also expressed in an A-G banding system for Energy Performance Certificates where an A rating represents low carbon emissions and a G rating represents high carbon emissions. The EER and the EIR use common break points for their Bands (see above).
Energy use (primary)
The energy use relates to the primary energy used. This takes into account distribution losses and energy used to produce fuels along with the energy actually used in the dwelling (as derived from SAP calculations and assumptions). This is measured in kWh/m2 per year. Energy use for each dwelling is based on a standard occupancy and a standard heating regime.
Excess cold (HHSRS Category 1 hazard)
Households living in homes with a threat to health arising from sub-optimal indoor temperatures. The assessment is based on the most vulnerable group who, for this hazard, are those aged 65 years or more (the assessment does not require a person of this age to be an occupant). The EHS does not measure achieved temperatures in the home and therefore this hazard is based on dwellings with an energy efficiency rating of less than 35 based on the SAP 2001 methodology. Under the SAP 2005 methodology the comparable threshold was recalculated to be 31.49 and the latter is used in providing statistics for the HHSRS Category 1 hazard.

Glossary | 81
Heating system
a) main space heating type:
central heating system: most commonly a system with a gas fired boiler and radiators which distribute heat throughout the dwelling (but also included in this definition are warm air systems, electric ceiling/underfloor and communal heating). It is generally considered to be a cost effective and relatively efficient method of heating a dwelling.
storage heaters: predominately used in dwellings that have an off-peak electricity tariff. Storage heaters use off-peak electricity to store heat in clay bricks or a ceramic material, this heat is then released throughout the day. However, storage heating can prove expensive if too much on peak electricity is used during the day.
room heaters: this category includes all other types of heater such as fixed gas, fixed electric or portable electric heaters, this type of heating is generally considered to be the least cost effective of the main systems and produces more carbon dioxide emissions per kWh.
b) heating fuel:
gas: mains gas is relatively inexpensive and produces lower emissions per unit of energy than most other commonly used fuels. Liquefied Petroleum Gas and bottled gas are still associated with slightly higher costs and emissions.
electricity: standard rate electricity has the highest costs and CO2 emissions associated with main fuels, but is used in dwellings without a viable alternative or a back-up to mains gas. An off-peak tariff such as Economy 7, is cheaper than bottled gas but with the same emissions as standard electricity.
oil: in terms of both costs and emissions, oil lies between main gas and electricity.
solid fuel: these are similar costs to oil with the exception of processed wood which can be more expensive than off-peak electricity. Fuels included are coal and anthracite, with CO2 emissions above those of gas and oil; wood, which has the lowest emissions of the main fuels; and smokeless fuel, whose emissions are close to those of electricity. By law, areas (usually towns or cities) are designated as smoke control areas where solid fuels emitting smoke are illegal.
c) water heating system:
combined: provides heat to supply hot water for the dwelling.
separate: dwellings which have electrical space heating systems often use electric immersion heaters to heat water. Other dwellings may be fitted within instantaneous water heaters, such as electric showers.
d) boiler type:
standard: provides hot water or warm air for space heating with the former also providing hot water via a separate storage cylinder.

82 | English Housing Survey Housing Stock Report 2009
back: located behind a room heater and feeds hot water to a separate storage cylinder. They are generally less efficient than other boiler types.
combination: provides hot water or warm air for space heating and can provide hot water on demand negating the need for a storage cylinder, therefore requiring less room.
condensing: standard and combination boilers can also be condensing. A condensing boiler uses a larger, or dual, heat exchanger to obtain more heat from burning fuel than an ordinary boiler, and is generally the most efficient boiler type.
Household
A household is defined as one person living alone or a group of people, who may or may not be related, living in the same dwelling who share at least one living or sitting room and/or have a regular arrangement to share at least one meal a day. Shared houses where the occupants have a joint tenancy or where they came together as a group to rent the house and would themselves fill any vacancies rather than expecting the landlord to do this are also classed as a single household; even though they may not share a sitting room or a meal per day.
Household reference person (HRP)
This is the person in whose name the dwelling is owned or rented or who is otherwise responsible for the accommodation. In the case of joint owners and tenants, the person with the highest income is taken as the HRP. Where incomes are equal, the older is taken as the HRP. This procedure increases the likelihood that the HRP better characterises the household’s social and economic position.
Household groups
Key household groups include:
disability or long term illness: a household where at least one person in the household has a long-term illness or disability. The respondent assesses this and long-term is defined as anything that has troubled the person, or is likely to affect them, over a period of time.
ethnic minorities: where the respondent defines their ethnicity as something other than white.
in poverty: a household with income below 60% of the equivalised median household income (calculated before any housing costs are deducted).
older people 60+: a household that includes at least one person aged 60 or over.
very young children: a household that includes at least one child aged under 5.
Other household groups include:
children (0-15): a household that includes at least one person under 16 years of age.

Glossary | 83
lone parents: a household comprising a lone parent with at least one dependent child (i.e. a person under 16 years of age, or aged 16 to 18, single and in full-time education).
workless: a household containing at least one person of working age (between 16 and current state retirement age) where nobody is in employment (full or part-time).
Housing Health and Safety Rating System (HHSRS):
The Housing Health and Safety Rating System (HHSRS) is a risk assessment tool used to assess potential risks to the health and safety of occupants, visitors, neighbours and passers by in residential properties in England and Wales. It replaced the Fitness Standard in April 2006.
The purpose of the HHSRS assessment is not to set a standard but to generate objective information in order to determine and inform enforcement decisions. There are 29 categories of hazard, each of which is separately rated, based on the risk to the potential occupant who is most vulnerable to that hazard. For example, for falls on stairs and falls on the level, the most vulnerable group is persons over 60 years, and for falls between levels it is children under five years old. The individual hazard scores are grouped into 10 bands where the highest bands (A–C representing scores of 1000 or more) are considered to pose Category 1 hazards. Local authorities have a duty to act where Category 1 hazards are present local authorities may take into account the vulnerability of the actual occupant in determining the best course of action. For the purposes of the Decent Homes standard, dwellings posing a Category 1hazard are non-decent on its criterion that a dwelling must meet the statutory minimum requirements.
The EHS is not able to replicate the HHSRS assessment in full as part of a large scale survey. Its assessment employs a mix of hazards that are directly assessed by surveyors in the field and others that are indirectly assessed from detailed related information collected. For 2006 and 2007, the survey (the then English House Condition Survey) produced estimates based on 15 of the 29 hazards. From 2008, the survey is able to provide a more comprehensive assessment based on 26 of the 29 hazards –see Annex Table 10 of the EHS Headline Report 2008–09 for a list of the hazards covered. Estimates of Decent Homes will continue to be based on 15 hazards to maintain consistency with Decent Homes reporting since 2006 and to avoid a break in the time series.
Income/equivalised income
Household incomes have been ‘equivalised’, that is adjusted (using the modified OECD scale) to reflect the number of people in a household. This allows the comparison of incomes for households with different sizes and compositions. The EHS variables are modelled to produce a Before Housing Cost (BHC) income measure for the purpose of equivalisation. The BHC income variable includes: Household Reference Person and partner’s income from benefits and private sources (including income from savings), income from other household members, housing benefit, winter fuel payment and the deduction of net council tax payment.

84 | English Housing Survey Housing Stock Report 2009
Key household groups
See ‘household groups’.
Regional areas
northern regions: includes the following regions: North East, North West, and Yorkshire and the Humber.
south east regions: includes the following regions: London and South East.
rest of England: includes the following regions: East Midlands, West Midlands, South West and East of England.
SAP
The energy cost rating as determined by Government’s Standard Assessment Procedure (SAP) and is used to monitor the energy efficiency of dwellings. It is an index based on calculated annual space and water heating costs for a standard heating regime and is expressed on a scale of 1 (highly inefficient) to 100 (highly efficient with 100 representing zero energy cost).
Secure windows and doors
The main entrance door to the dwelling and any accessible windows need to be assessed by surveyors as either highly secure or fairly highly secure
Main entrance door
High; good quality door that is double glazed or contains no glazing. It should have a strong frame, and auto deadlocking rim lock in the top one-third of the door plus a mortice lock in the lower third of the door.
Fairly high; as above but with either a standard Yale lock instead of the auto deadlocking rim lock or the locks not set apart.
Accessible windows
High; double glazed windows with key locks
Fairly high; double glazed windows without key locks
Serious condensation or mould
See ‘damp and mould growth’
Size
The total usable internal floor area of the dwelling as measured by the surveyor, rounded to the nearest square metre. It excludes integral garages, balconies, stores accessed from the outside only and the area under partition walls. Dwellings are also grouped into the following five categories:

Glossary | 85
• less than 50m2
• 50 to 69m2
• 70 to 89m2
• 90 to 109m2
• 110m2 or more.
Substantial disrepair
Standardised basic repair costs of more than £20/m2 .
Tenure
Four categories are used for most reporting purposes, and for some analyses these four tenure categories are collapsed into two groups:
private sector: includes:
owner-occupied: includes all households who own their own dwellings outright or buying them with a mortgage/loan; also includes shared-ownership schemes.
private rented: includes all households living in privately owned property which they do not own. Includes households living rent free, or in tied dwellings and tenants of housing associations that are not registered.
social rented: includes:
local authority: includes Arms Length Management Organisations (ALMOs) and Housing Action Trusts.
housing association: mostly Registered Social Landlords (RSLs), Local Housing Companies, co-operatives and charitable trusts.
Vacant dwellings
The assessment of whether or not a dwelling is vacant is made at the time of the interviewer’s visit. Clarification of vacancy is sought from neighbours. Surveyors are required to gain access to vacant dwellings and undertake full inspections.
Workless
See ‘Household Groups’.

ISBN 978-1-4098-3019-1 9 7 8 1 4 0 9 8 3 0 1 9 1
ISBN 978-1-4098-3019-1