Embed Size (px)
Citation preview

1
English county populations in the
later eighteenth century
Tony Wrigley
Cambridge Group for the History of Population and Social
Structure, Department of Geography, University of Cambridge.
An ESRC Funded Project
Male Occupational Change and Economic Growth 1750-1851
Grant Holders
Leigh Shaw-Taylor and Tony Wrigley
Cartography
Max Satchell

2
English county populations in the later eighteenth century1 Although much attention has been given in recent years to tracing the history of
national population trends, regional and local growth rates have been comparatively
neglected. This does not reflect disinterest but either the apparent lack of suitable
data on which to base any revisions to existing estimates, or a failure to devise a better
method of making use of existing data. This essay represents an attempt to provide
new and more trustworthy estimates of English county populations for the period
1761-1801.2
John Rickman, who directed the taking of the first four censuses, was
interested in attempting to trace the past history of the population of Britain no less
than in recording the contemporary situation. His work has long remained the starting
point for those interested in this topic; indeed, it has frequently simply been
reproduced either in its original form or with slight modification. Perhaps the most
widely quoted set of estimates in recent decades has been that published by Deane and
Cole almost half a century ago.3 Their county totals mirror those of Rickman, except
that they argued that his estimates for Devon and Middlesex were not credible and
substituted their own, and that they constrained the county totals to match national
population totals which differed from those of Rickman.4 The absolute county totals
therefore differ from those of Rickman, but if a rank order of counties is drawn up
reflecting the relative population growth rates between 1751 and 1801 to be found in
the two series, the order of counties in the two lists is identical apart from the placing
of Middlesex.5
Rickman based his estimates on the annual totals of baptisms, burials, and
marriages secured as part of the census exercise. These returns, usually referred to as
the PRA (Parish Register Abstracts) were the product of enquiries made of all
Anglican incumbents. In 1801 he had asked for returns of the annual totals of
baptisms, burials, and marriages not only for the immediate past but for a scattering of
years earlier in the eighteenth century. These returns settled the argument about
whether the population of the country was largely stationary as Malthus and others
believed or whether it was increasing.6 It was abundantly clear that there was rapid
growth and in 1802 Rickman published estimates of the scale and timing of growth of

3
the national population and of the counties in the eighteenth century.7 In each of the
next three censuses he required returns for the preceding decade, producing thereby
continuous annual totals for all three series from 1780 onwards. He had long been
interested in attempting to reconstruct population totals for the whole period of
parochial registration. He was very conscious of the fact that the 1801 returns were
defective in that many parishes had been missed, and in any case he had no returns for
any period before 1700. In the 1830s, therefore, he planned a more ambitious and
better grounded exercise. In 1836 he asked incumbents for annual totals of baptisms,
burials, and marriages for three-year periods centring on 1570, 1600, 1630, 1670,
1700, and 1750. He hoped that this exercise would enable him to make authoritative
estimates of the size of the population at these dates. As one element in the 1831
PRA returns he had asked for information about the date from which the registers
survived in each parish and he was therefore able to approach only those incumbents
who possessed registers suitable for his purpose. His method in making use of the
new returns was to assume that baptism, burial, and marriage rates had been constant
in each county throughout the whole pre-census period; to make separate estimates of
population totals at each date based on the three types of event and on this
assumption; and to derive best estimates of the population total for each county at
each date by averaging the three resulting totals.8 This last step involved assuming
that the parishes included in the survey had housed the same proportion of the whole
population of each county in the past as they did in 1801. National totals were then
obtained by summing the totals for each county.9
There were many potential sources of error in Rickman’s procedures, of which
he was well aware. A prolonged constancy in the baptism, burial, and marriage rates
was most unlikely. Even if the rates had been constant, registration coverage was not.
In particular the spread of nonconformity in the eighteenth century meant that many
baptisms were not recorded in Anglican registers. Other deficiencies exaggerated the
problem substantially.10 The same was true of burials though the marked
deterioration began at a later date.11 In the seventeenth and early eighteenth centuries
marriage registration was at times very seriously defective.12 The mere fact that the
population estimates derived from the three series often differed substantially implied
that the assumptions underlying Rickman’s method were unsound. Further, although
estimates based on events over a three-year period were less liable to distortion from

4
shocks and random fluctuations than those based on a single year, a serious epidemic
or a severe harvest failure might easily result in a misleading estimate even if the
basic method had been sound. Yet Rickman’s county estimates, for all their
deficiencies, have been very widely used in the absence of any method or body of
data which might be expected to produce more reliable results. One reason, indeed,
for their continued use is that his method produced county totals as well as national
totals whereas most later research has concentrated simply on the estimation of
national totals.
Reliable county population totals are valuable for many purposes, especially in
a period of unusually rapid population growth, such as the later eighteenth century. In
this essay their value will be illustrated by considering their significance in the
context of the changing occupational structure of England in the later eighteenth
century.
I
The type of economic growth taking place in England in the later eighteenth century
implies that its occupational structure was changing in sympathy. Agriculture
remained by far the largest single industry but its relative importance was declining
steadily while many secondary and tertiary occupations expanded rapidly. Adult male
employment in agriculture grew only slightly in the first half of the nineteenth century
and there is little reason to suppose that matters were greatly different in the preceding
half-century.13 Since many of the occupations in which numbers were rising rapidly
were highly concentrated in limited areas, county population growth rates might be
expected to differ substantially as a result. Change in the national occupational
structure will arise from some combination of structural change in given areas and the
rates of growth of population in those localities compared with other areas. The
relative importance of these two factors remains to be established for England in the
later eighteenth century, and this essay is intended to help to set the scene in that
connection. It is possible at one extreme to imagine a situation in which occupational
structure changed everywhere in a roughly similar fashion so that differences in
population growth rates in different parts of the country would make little difference
to the national picture. At the other extreme it is possible for there to be major

5
changes in the national occupational structure even though in each component area it
remained unchanged, provided that the occupational structure in the component areas
differed and that they experienced markedly different population growth rates.
Table 1 illustrates the possible scale of change due to differential rates of
growth. It is artificially simple. An imaginary population is divided between those
who make a living from agriculture and those who depend on other sources of
income. In ‘rural’ counties 70 per cent of the population depend on agriculture, 30
per cent on other activities, while the comparable figures in the ‘non-rural’ counties
are 20 and 80 per cent respectively. At the beginning of the period 70 per cent of the
population live in ‘rural’ counties and only 30 per cent in ‘non-rural’ counties which
implies that in the country as a whole 55 per cent of population depends on
agriculture while the remaining 45 per cent are outside the agricultural sector. Fifty
years later the population has risen by 35 per cent overall but the population in the
‘rural’ counties has risen only from 70 to 75 while that in the ‘non-rural’ counties has
doubled from 30 to 60. As a result, in the country as a whole the share of the
agricultural population falls to 48 per cent of the total, while the ‘other’ figure rises to
52 per cent. A further 50 years elapses: the ‘rural’ population again increases
modestly from 75 to 80, the ‘non-rural’ population again doubles from 60 to 120, and
the overall pattern changes further, with only 40 per cent of the population making a
living from agriculture and 60 per cent from secondary and tertiary occupations.
There has been no change in the occupational structure of the population either in the
‘rural’ or the ‘non-rural’ areas. Differential growth rates alone account for the
changing balance between agriculture and other occupations.
While table 1 fails, of course, to do justice to the complexity of change in any
historical economy, it makes it clear that the issue of differential growth rates is
important if effective use is to be made of many of the available sources which throw
light on occupational structure in the past because they often enable the percentage
distribution of occupations to be assessed but not the absolute numbers involved. For
example, Anglican baptism registers sometimes consistently record the occupation of
the father of a child at baptism. Where this is the case the relative size of different
occupations can be specified, but, though it may be clear that, say, 2 per cent of men
were shopkeepers or grocers c. 1780 rising to 4 per cent 50 years later, the size of the

6
adult male population at the two dates and therefore the totals involved may be
unknown. To the degree that there was a markedly different pattern of population
growth between those English counties which were, and remained, primarily
agricultural and those counties in which the bulk of the population from an early date
were dependent on manufacturing or service employment, little change in local
occupational patterns may mask important changes in the national picture.14
II
It was opportune to reconsider county population trends in the later eighteenth century
because the Cambridge Group for the History of Population and Social Structure is
undertaking an ESRC-funded research project into the changing occupational
structure of England in the period 1750-1850, 15 and much of the available source
material is drawn from sources which enable the relative importance of different
occupations in a given period to be assessed but not the size of the occupied
population. For the second half of the period the census provides information about
population size and therefore growth trends in different parts of the country, and thus
resolves the problem, but for the first half any estimates of population size and trends
must remain largely dependent on Rickman unless new estimates are made.
The opportunity to generate improved county estimates arises from a fact with
which Rickman himself was familiar and which is indeed reflected in his instructions
to incumbents at the time of the first census. In 1801 he asked for totals of baptisms
and burials for the years 1700, 1710, and every subsequent tenth year to 1770 and for
all years from 1780 to 1800, but required marriage totals only for each year from 1754
onwards, and none for earlier years, knowing that from 1754 marriage registration
was virtually complete whereas earlier it was seriously defective. Hardwicke’s Act of
175316 made it impossible to contract a valid marriage in England unless celebrated in
an Anglican parish church according to the Prayer Book and recorded in the parish
register in a prescribed form. The only groups exempted from the provisions of the
Act were Jews, Quakers, and members of the royal family. From 1754 onwards
marriage registration therefore was in principle fully reliable, in stark contrast with
baptism and burial registration. The number of births and deaths substantially

7
exceeded the number of baptisms and burials recorded in the Anglican registers and
coverage deteriorated markedly in the later decades of the century.
In certain circumstances, therefore, the use of marriage data may offer a more
reliable and exact guide to population trends than estimates based on all three types of
events recorded in parish registers in the manner of Rickman. If, for example, the
annual total of marriages were known with precision for each county, and if, further,
it were safe to assume that the marriage rate had remained essentially unchanged in
the half-century preceding the 1801 census, it would be a straightforward matter to
calculate county population totals covering the whole period following the inception
of Hardwicke’s Act. The difficulty that there were substantial fluctuations in
marriage totals from year to year could be overcome, or at least greatly reduced, by
basing estimates of earlier population totals on the average frequency of marriages
over a block of years centring on a convenient ‘census’ date.
This possibility was not overlooked in the past. In his observations on the
results of the first census, Rickman wrote:
A great variation in the annual amounts of marriages is caused by the circumstances of the times, and especially by the price of provisions; so that no safe inference concerning the increase or diminution of population can be drawn from the comparison of any single years with each other; but the average amount of the marriages for five years together, or for a longer period, is the best of evidence on the subject, because the register of marriages may be deemed perfectly correct.17
Rickman repeated this observation in the prefaces to each of the subsequent censuses
which he directed. Again, Deane and Cole produced estimates of county totals for
1781 using two different methods, one of which was based on 11-year averages of
marriage totals centring on 1801 and 1781. They noted that the estimate based on
marriage data alone ‘represents the closest approximation to the truth’.18
The use of marriage totals from the PRA as a basis for inferring population
trends, however, is not as straightforward as might appear at first sight. Several of the
problems stem from the nature of the 1801 census and its defects. The Act which
made provision for the census specified that Justices of the Peace should require the

8
overseers of the poor within their jurisdictions to appear before them no sooner than
10 April nor later than 30 April 1801 in order to present returns made under the Act
for the parishes for which they were responsible.19 Yet the census (both the
enumeration abstracts and the PRA) was ordered to be printed on 21 December of the
same year. The whole work of assembling and collating the returns, therefore, was
accomplished in no more than eight months, though there was no previous experience
to call upon. It is little wonder that the census volumes are neither internally
consistent nor complete. In the case of the PRA, county totals do not always equal the
sum of the hundred totals and, similarly, the printed national totals sometimes differ
substantially from the sum of the county figures.20 This imposes a significant burden
of comparison and revision before the best use can be made of marriage data. A more
serious problem is posed by the fact that returns for several hundred parishes are
missing. It is essential to attempt to identify the parishes which were missed and to
compensate for them. In order both to make clear the necessity for such corrections,
to describe how they were attempted, and to deal with other sources of potential error,
it is convenient next to describe the strategy adopted in generating the new estimates
to be presented.
III
In principle the method employed might appear simple. County population totals are
to be estimated for the ‘census’ years 1761, 1771, 1781, and 1791. In order to
produce these totals, thirteen-year averages of marriage totals are calculated centring
on each of the ‘census’ years and for 1801 (for example, the marriages for 1755-67
providing an average for 1761, and so on). The ratio of the average centred on 1761
to the average for 1801 will then establish the relative size of the population of the
county in question. Thus if, for example, the population total in 1801 were known to
be 50,000 and the ratio were 0.7 the implied population in 1761 would be 35,000. But
credible estimates cannot be produced so simply. They can only be produced if
several initial problems are recognised and solved.
A first difficulty with the method lies in its implicit assumption that the crude
marriage rate did not change over time which is not capable of demonstration in the
absence of censuses before 1801. Suppose that the crude marriage rate were falling in

9
the later eighteenth century, then the population in 1761 would be overstated using
this method since a given population would have contracted more marriages per head
at the earlier date than at the later one. Assuming a constant rate would exaggerate
the true population total and cause the population growth rate to be underestimated. If
the crude marriage rate were rising, of course, the opposite would be the case. This
difficulty, however, is not insuperable since the equivalent of census population totals
exist as a result of the use of the technique of inverse projection in conjunction with
the estimates of annual totals of births and deaths produced by an earlier research
project of the Cambridge Group (marriage data were not used in the inverse
projection exercise).21 The sum of the county population totals for any date before
1801 can therefore be constrained to match those produced by inverse projection, thus
counteracting any distortion produced by assuming constant crude marriage rates.
Although a general change in the level of the crude marriage rate can be controlled by
using inverse projection totals, however, changes in the relative level of the rate
between different counties might still present a problem. The issue of the stability of
the relative levels of county crude marriage rates over time cannot be addressed
directly in the later eighteenth century in the absence of county population totals not
themselves derived from marriage data (which would involve circularity of
argument). Their stability relative to each other, however, can be tested during the
early decades of the nineteenth century since the successive censuses provide both
county population totals and marriage totals from the PRA. The rates for 1801, 1811,
and 1821 are set out in table 2. They are based on the average number of marriages
over 13-year periods centred on the dates in question. The national population totals
at each date were taken to be those obtained by inverse projection.22 They are higher
than the census totals. The early censuses undercounted children and omitted men
serving in the army and navy. Rates based upon them are therefore too high.
Moreover, the scale of the undercount varied between censuses.23 County totals at
each census date were increased in the same ratio as the national total to preserve
internal consistency.
The national rates in 1811 and 1821 were almost identical (8.23 and 8.20 per
1,000 respectively) though the rate in 1801 was somewhat higher at 8.58. The
simplest way in which to test the stability of relative level of the county marriage rates

10
is to produce a rank ordering of the counties for each of the three dates and then test
the extent of change from one date to the next. For example, Westmorland was
ranked ninth in 1801 (ordering from the lowest rate to the highest), sixth in 1811, and
fourth in 1821. It therefore moved three places between 1801 and 1811 and two
places during the next decade. The average change in rank number among the 41
counties in the decade 1801-11 was 3.54; in the next decade 5.17, but for reasons
discussed in the next paragraph, the latter was distorted by the special circumstances
of four counties, Devon, Hampshire, Kent, and the East Riding of Yorkshire. If these
four are excluded from the calculation, the average falls to 4.51. A higher figure in
the second decade is to be expected because rates changed less in this decade than in
its predecessor so that small absolute changes could result in a relatively marked
change in ranking. If the same comparison of ranking is made over 20 years from
1801 to 1821, and again excluding the four ‘rogue’ counties, the average change in
ranking is 4.86, little different from the figure for the 1811-21 decade, suggesting that
change was not usually cumulative but had a substantial random component. In a few
cases the overall change between 1801 and 1821 was marked; the rankings of Essex,
Worcestershire, Leicestershire, and Sussex changed by 15, 12, 11, and 10 over the
two decades, but generally the changes were minor, in 10 cases the ranking in 1821
was the same as in 1801 or had changed by only 1 place. Changes in the relative
positions of the counties, therefore, though not trivial, were for the most part limited
on the evidence afforded by the rates in the early nineteenth century.
Consider next the four ‘rogue’ counties. In each case the crude marriage rate
in 1801 was far higher than in 1821. In three cases this was clearly a ‘wartime’ effect.
These were Devon, Hampshire, and Kent, where the rates for 1801 and 1821 were
respectively; 9.2 and 7.9 per 1,000; 9.8 and 8.0; and 9.0 and 7.6. In each case it is
demonstrable that the aberrantly high rate at the earlier date was linked to exceptional
activity in those ports which were major naval bases, such as Deptford, Woolwich,
Chatham and Sheerness in the case of Kent; Portsmouth in the case of Hampshire; and
Plymouth in the case of Devon. In Plymouth, for example, the average annual
number of marriages rose from 461 in the 13-year period centring on 1791 to 869 in
the period centring on 1801. The comparable totals for Devon as a whole were 2,646
and 3,226. Thus of the rise for the county as a whole (580) over three-quarters (438)
was accounted for by a wartime boom in Plymouth. Broadly similar considerations

11
apply in the other two cases. Almost one half of the rise in the total of marriages over
the same period in Hampshire, for example, occurred in Portsmouth. The crude
marriage rate for the period centring on 1801 was 16.4 per l,000 in Plymouth; 18.0 per
1,000 in Portsmouth. These are exceptionally high figures. The East Riding of
Yorkshire displays a similar pattern to that found in the ‘naval’ counties, though the
reason is less clear in this case. In all four cases comparison of their rates in 1801
with the rates in neighbouring counties underlines the improbability that the high rates
were other than a temporary phenomenon.
It is plain that assuming that the marriage rate found in 1801 in these four
counties also held good for the preceding 40 years would result in a severe
overstatement of the rate of growth over the period since assuming a high marriage
rate must depress the size of the population to which it refers. In order to avoid this it
was assumed that the prevailing rate over the period prior to 1801 should be based on
the rate relating to 1821 and therefore on marriage frequencies over the period 1815-
27. The 1821 rate was increased in each case by 0.38 per 1,000, the amount by which
the national rate in 1801 exceeded the rate in 1821 (8.58 compared with 8.20). For
example, the Hampshire marriage rate in 1821 was 8.00 per 1,000, which becomes
8.38 after adjustment. Using this rate rather than the 1801 rate (9.76) means that the
population of Hampshire at each census date from 1761 to 1791 is 16.5 per cent
higher than if the original 1801 rate had been used (9.76/8.38 = 1.1647).
This procedure is not an ideal solution since there were earlier wars with
comparable, if smaller, effects on naval bases and marriage totals, but it reduces the
distortions which would otherwise arise.24
The four counties, however, cannot be treated in isolation. The excess of
marriages occurring in these counties at the turn of the century would have taken
place elsewhere in England but for the distortions produced by wartime conditions.
Just as it is appropriate to base the calculation of the populations of the four counties
at earlier ‘censuses’ on a lowered crude marriage rate, it is also appropriate to raise
the marriage rates in the other 37 counties marginally when estimating their
populations over the four preceding decades. The scale of the adjustment should be
such as to produce the same national population totals as would have resulted if the

12
1801 rates had been used for every county. This implies that the rates in the other 37
counties should be increased sufficiently to reduce their populations at each ‘census’
from 1761 to 1791 by 1.89 per cent, thereby exactly offsetting the increase in the
populations of the four counties at these dates brought about by the substantial
reductions in their crude marriage rates just described.
Two further preliminary operations need to be described. First, it was
essential to try to identify the scale of omissions from the 1801 PRA for each county.
At first blush it is not clear that this is necessary. If the population of a county in
1801 is known and its size at earlier dates is to be estimated from marriage totals for
the relevant periods, keyed to the 1801 population total, it might be thought that it is
only necessary that the proportion of the population covered should not change, and
not that coverage should be complete. As an example, the ratio of 500 to 250 is the
same as that between 400 and 200. If 100 per cent of the population is covered
(yielding totals of events of 500 and 250 respectively for, say, 1801 and 1761) the
estimated population in 1761 will be exactly the same as if 20 per cent of the
population was not covered at each date (yielding totals of 400 and 200). But it must
not be forgotten that the process involves comparing marriage totals for two 13-year
periods. In the example given the two periods would be 1755-67 and 1795-1807.
The 1795-1807 period includes data taken from the 1811 PRA for the years 1801-7
inclusive. There were few if any parishes missed in the PRA returns of the second
census. In a county where there had previously been a substantial number of missing
parishes, adding uncorrected totals for the years 1795-1800 to the totals taken from
the 1811 census would cause the increase in marriages between the 1785-97 period
and the 1795-1807 period to be overestimated since the second group would include a
period of fuller coverage. Hence the growth in population from 1791 to 1801 would
be overstated. Account must therefore be taken of ‘missing’ parishes in the1801
PRA.
Assessing the necessary corrections is a laborious process. The 1801 PRA
listed the parishes in each hundred from which a return had been obtained and which
had been incorporated in the hundred totals at the time that the text was sent to the
printer. This suggests a straightforward solution --- to compare the list of parishes
from which a return had been obtained with a list of the parishes in the hundred in

13
question, calculate the size of the missing population as a fraction of the total for the
hundred, and inflate the PRA marriage totals appropriately. Thus, if in a given
hundred 5 parishes were missing from the returns, containing 8 per cent of the total
population of the hundred in 1801, the total of marriages for the whole period 1754-
1800 would need to be increased by 8.70 per cent (100/92 x 100 = 108.70).25
Unfortunately no such simple solution is feasible because of the shortcomings
of the 1801 census. The listing of parishes from which a return had been secured
proved frequently at fault and the situation was worsened rather than improved when
Rickman made an initial attempt to correct matters by a follow-up exercise. The
range and severity of the problems involved has been discussed in detail elsewhere
and need not be rehearsed again here.26 In the current exercise the number of parishes
(or more accurately registering units) identified as missing but having marriage
registers was 575. A similar exercise undertaken for the Population history of
England resulted in a total of 632 parishes,27 a higher figure, but much of the
difference arises from the restriction of the present exercise to parishes in which a
marriage register was maintained during the later eighteenth century (there were many
chapelries which maintained registers of baptisms and burials but where no marriages
were celebreated). Rickman, who was keenly interested in trying to establish how
many places had been missed in the 1801 PRA returns and the follow-up exercise,
made a further enquiries in 1811. It is reasonable to conclude that his final total of
missed parishes in England was 713.28 Precision is beyond reach in this matter. Yet
it is essential to make the attempt if marriage totals are to be used as a basis for
estimating population totals and trends. Accordingly, the populations of the parishes
identified as missing were expressed as percentages of the populations of the
hundreds to which they belonged, and the marriage totals were increased
proportionately.
The second preliminary operation can be described very briefly. The
substantial inconsistencies between the published national totals of marriages and the
totals obtained by cumulating the county totals is mirrored by similar inconsistencies
between the published county totals and the sum of the totals for their component
hundreds.29 In some instances the reasons for an inconsistency may be clear, in others
there is room for doubt. The principle followed in this exercise was to start with the

14
published totals for individual hundreds, build county totals from them, and use the
cumulation of these county totals to produce national totals. Totals built up in this
way were privileged over published county and national totals unless there was a
compelling reason to do otherwise.
One further complication should be mentioned. It stems from the fact that its
constituent parishes do not always ‘nest’ neatly into a given hundred. Some parishes
were divided between different hundreds (which occasionally also meant different
counties). The PRA take no account of this fact, reporting all parishes as if they
belonged in their entirety only to particular hundreds. Initially the same was true of
the census proper. In 1801 there is no indication that a parish might figure in more
than one hundred. In 1811 the fact of a division is indicated but the population totals
are not divided between the hundreds in question. In 1821 and thereafter both the fact
of a division and the totals involved are normally recorded. Given these deficiencies
in early census practice, it is difficult if not impossible to correct for this source of
distortion in any exact and straightforward way. However, the problem affects only a
limited number of hundreds and it is demonstrable that the scale of any distortion in
hundred totals is usually too slight to be of consequence, both because divided
parishes were normally placed by the PRA in the hundred in which most of the
population were living, and because in some cases there were offsetting inaccuracies,
a parish wholly allocated in hundred X where it should be divided between X and Y
being roughly matched by a comparable parish in Y which should be partially
allocated to X. The existence of this complication, therefore, does not significantly
affect the general accuracy of the estimates, and no corrections were attempted.30
Combining a crude marriage rate with a county marriage total yields an
estimated population total for each ‘census’ date. For example, the total number of
marriages in Bedfordshire in 1755-67 was 5,804, or an annual average total of 446,
centring on 1761. Since the crude marriage rate in the county in 1801 (based on
marriages 1795-1807) was 8.52 per 1,000 (table 2), the implied total in 1761, after
adjustment to offset the special treatment of the four counties whose marriage rates
were aberrantly high in 1801, is 51,361.31 Similar calculations for each county enable
a national total to be built up. The national totals for 1761 to 1791 produced in this
fashion were as follows: 6,140,431; 6,652,561; 7,212,091; and 7,852,555. The

15
comparable totals from inverse projection were: 6,310,338; 6,623,358; 7,206,139; and
7,845,678. Expressing the former series as a percentage of the latter demonstrates
very close agreement except in 1761 (the percentages are 97.31, 100.44, 100.08, and
100.09). A lower figure for 1761 is to be expected. It is very probably due to the fact
that, as the footnotes published in the PRA in 1801 make clear, coverage was
defective in a significant number of parishes in the early years of the new regime.32
Final county population totals were obtained using the ratios between the two sets of
national totals. The Bedfordshire total for 1761 of 51,361 derived from marriage data,
for example, is increased in the ratio 6,310,338/6,140,431 to produce a final figure of
52,782.
The very close agreement between the two sets of national totals listed in the
last paragraph implies, of course, that the crude marriage rate varied surprisingly little
in England over the 40-year period in question. It is worth noting that this conclusion
is strongly underwritten by earlier work carried out at the Cambridge Group,
summarised in table 3. Marriage totals had been abstracted from a total of 404
English parishes. The totals were re-weighted to offset the fact that they were not a
random sample before being inflated to produce ‘national’ totals. Since estimates
were made for each year, it is a straightforward matter to produce estimated national
rates based on events recorded over the same 13-year periods as were used when
making PRA-based calculations. The rates are remarkably stable and, as will be clear
from the ratios in the final column, they are uncannily close to the national PRA-
based rate for 1801 (8.58 per 1,000: table 2). Since it is most improbable that such
close agreement between the two series of totals and rates could have arisen by
chance this comparison tends to confirm the accuracy both of the PRA-based totals
and those derived from the 404 parish sample.33
IV
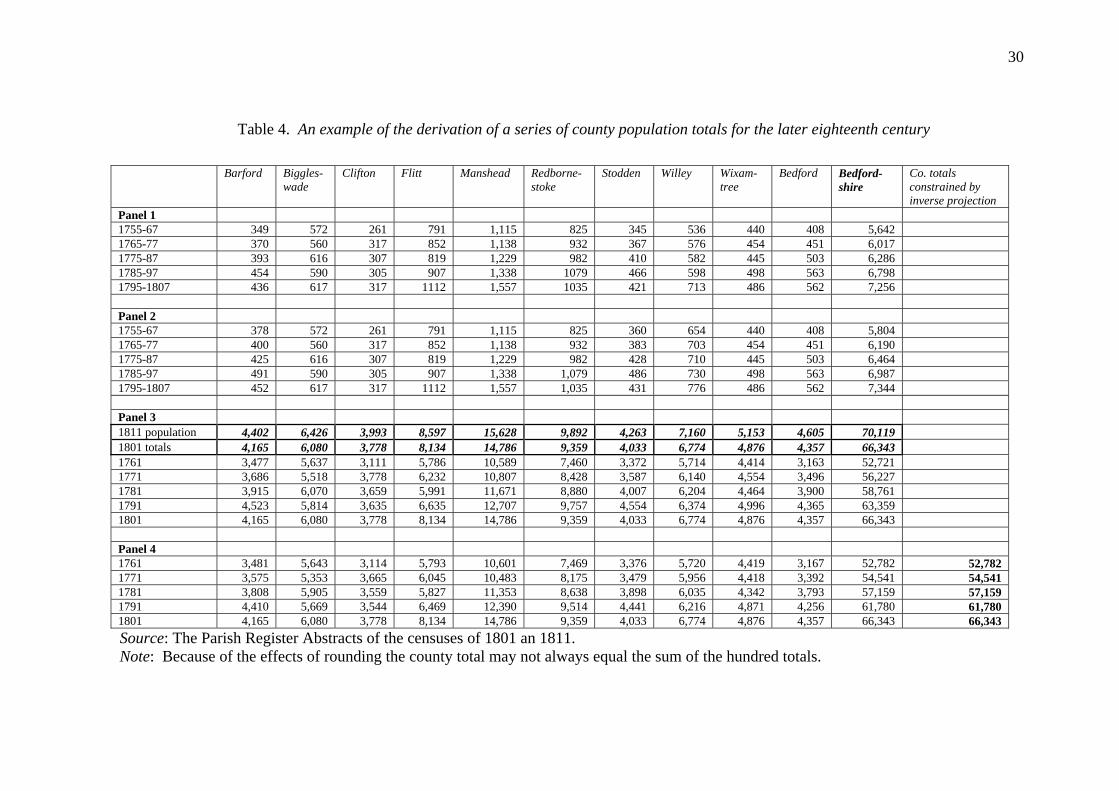
It may be helpful to give an illustration of the successive steps involved in generating
county marriage data and estimating county, and hundredal population totals. Table 4
shows marriage totals for the successive 13-year periods centring on ‘census’ dates
for each of the hundreds within Bedfordshire. The top panel gives the ‘raw’ totals.
The second panel shows the totals after making adjustments to reflect the proportion

16
of the population of the hundred which lived in parishes for which no PRA return was
included in the 1801 census. In most cases no change was necessary because all the
parishes made returns, but the totals for Barford, Stodden, and Willey are increased
in the second panel, in the case of Willey substantially. Willey’s original totals were
raised by just over 22 per cent, reflecting the proportion of the population of the
hundred living in parishes from which no return was obtained. The county marriage
totals in panel 2 were those which were used in estimating the population of the
county at each ‘census’ date.34
In the third panel the process is taken a step further. The population of
Bedfordshire in 1801 is recorded in the census as 63,393. This total is unsatisfactory
because of the undercount of young children and the exclusion of men in the armed
forces.35 The national population total for 1801 published in the census was
8,285,852 whereas the inverse projection figure was 8,658,265. Therefore the census
total for Bedfordshire was increased by the ratio between the latter total and the
former, resulting in a revised total of 66,343 in 1801. The top line of panel 3 lists the
population of each hundred in 1811 (given the deficiencies of the first census, it
seemed prudent to take the hundredal totals from the 1811 census rather than the 1801
census to measure the relative size of each hundred). The size of each hundred at
each earlier ‘census’ date is taken to be captured by the ratio of the marriage total at
that date relative to the total in 1801. Thus the annual average marriage total for
Barford in 1761 was 378, in 1801 452, while the population in 1801 was 4,165.
Therefore, the population in 1761 is taken as 378/452 x 4,165 = 3,477. Hundredal
totals are cumulated to produce the county totals shown in the penultimate column.
This mirrors the assumption made when calculating county totals that the marriage
rate in any given hundred is unlikely to have varied greatly over the period, even
though in some instances there clearly were substantial difference in the marriage rate
between hundreds in the same county.
The fourth and final panel completes the process. In the final column the
county totals produced by inverse projection are shown. In the case of Bedfordshire
they do not differ greatly from the totals in panel 3, but it is important that the final
hundredal totals should sum to the final county total and therefore the panel 3 totals
are constrained to produce this result. Thus, the panel 3 total for Barford in 1771 is
17
3,686, and the ratio between the panel county total and the final county total for that
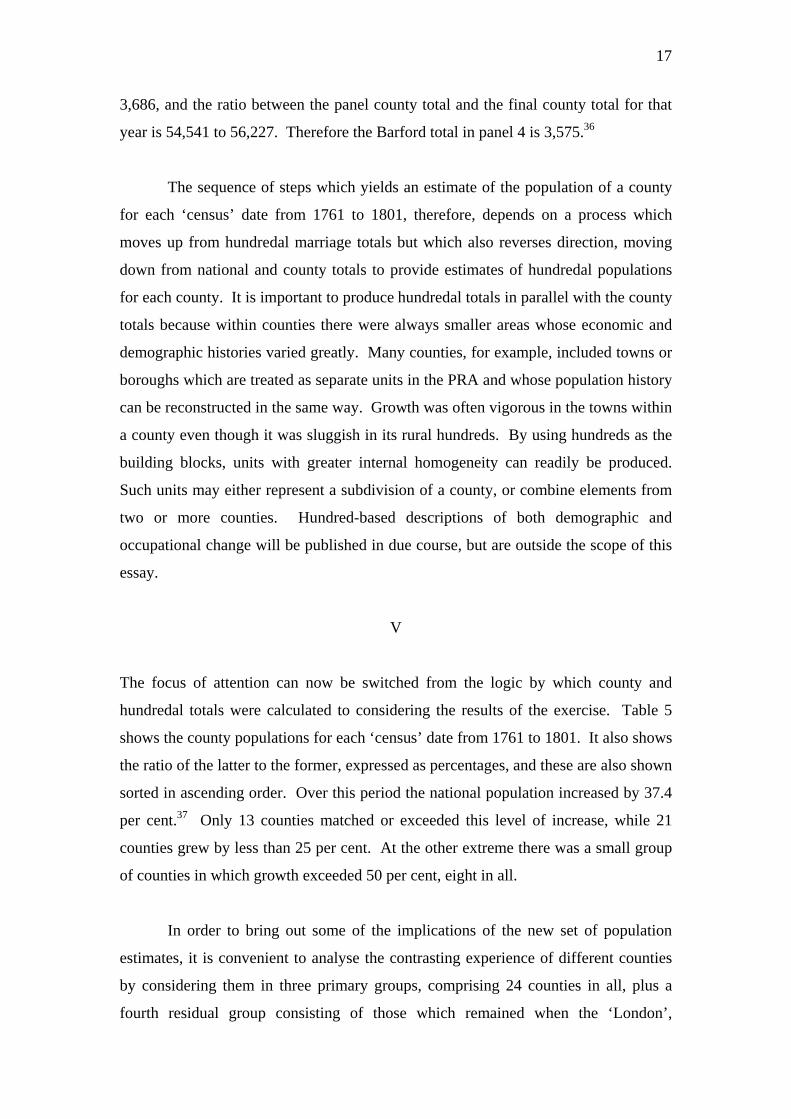
year is 54,541 to 56,227. Therefore the Barford total in panel 4 is 3,575.36
The sequence of steps which yields an estimate of the population of a county
for each ‘census’ date from 1761 to 1801, therefore, depends on a process which
moves up from hundredal marriage totals but which also reverses direction, moving
down from national and county totals to provide estimates of hundredal populations
for each county. It is important to produce hundredal totals in parallel with the county
totals because within counties there were always smaller areas whose economic and
demographic histories varied greatly. Many counties, for example, included towns or
boroughs which are treated as separate units in the PRA and whose population history
can be reconstructed in the same way. Growth was often vigorous in the towns within
a county even though it was sluggish in its rural hundreds. By using hundreds as the
building blocks, units with greater internal homogeneity can readily be produced.
Such units may either represent a subdivision of a county, or combine elements from
two or more counties. Hundred-based descriptions of both demographic and
occupational change will be published in due course, but are outside the scope of this
essay.
V
The focus of attention can now be switched from the logic by which county and
hundredal totals were calculated to considering the results of the exercise. Table 5
shows the county populations for each ‘census’ date from 1761 to 1801. It also shows
the ratio of the latter to the former, expressed as percentages, and these are also shown
sorted in ascending order. Over this period the national population increased by 37.4
per cent.37 Only 13 counties matched or exceeded this level of increase, while 21
counties grew by less than 25 per cent. At the other extreme there was a small group
of counties in which growth exceeded 50 per cent, eight in all.
In order to bring out some of the implications of the new set of population
estimates, it is convenient to analyse the contrasting experience of different counties
by considering them in three primary groups, comprising 24 counties in all, plus a
fourth residual group consisting of those which remained when the ‘London’,

18
‘industrial’, and ‘agricultural’ groups had been identified. Details are set out in table
6 which is paralleled by figure 1, presenting the data in map form.
The first group consists of three counties in which growth was rapid because
of the dominant influence of the expansion of London. The second group includes the
bulk of the areas in which manufacturing industry was growing fastest, the textile
districts and other centres of industrial expansion in Lancashire, the West Riding,
Cheshire, and Derbyshire; the Staffordshire potteries; the framework knitting and lace
manufacturing areas in Nottinghamshire, and the complex of metal working,
engineering, and smallwares manufacture in Birmingham and the Black Country
which caused rapid growth in Warwickshire. The third group consists of a massive
wedge of land stretching from Lincolnshire and Essex in the east to Wiltshire in the
west, including much of the best agricultural land in the country and covering 29 per
cent of its surface area. Each group presents a marked contrast with the national
average. Whereas population in England as a whole grew by 37.4 per cent between
1761 and 1801, in the London group of counties the comparable figure was 51.7 per
cent; in the industrial group 74.0 per cent; in the dominantly agricultural group 15.0
per cent. At the beginning of the period 15.3 per cent of the national population lived
in the London group; 20.8 per cent in the industrial group; 26.9 per cent in the
agricultural group. At the end of the period the comparable figures were 16.8, 26.3
and 22.5 per cent. There were therefore marked changes in the relative size of the
three groups, a feature which is brought out more vividly by considering the shares of
each group in the overall growth of population in England as a whole. The London
group accounted for 21.1 per cent of the total national increase; for the industrial
group the comparable figure was 41.0 per cent; for the agricultural group 10.8 per
cent. Not far short of two-thirds of the whole increase over the period, therefore, took
place in the first two groups (62.1 per cent), a dramatic exemplification of the extent
to which growth was concentrated in a comparatively small group of counties in
which agriculture did not figure prominently. Indeed it was also concentrated within
these two groups; 39.4 per cent of the total national increase took place in just three
counties: Lancashire (17.0 per cent); the West Riding of Yorkshire (9.8 per cent); and
Middlesex (12.6 per cent).

19
It is equally striking that the belt of agricultural counties claimed such a
modest portion of the total increase. Indeed, there is a sense in which their share is
overstated. If the populations of the towns and boroughs for which the PRA provided
separate returns in 1801 are subtracted from the populations of this group, their
growth rate falls from 15.0 per cent to 13.0 per cent (in the towns and boroughs within
these counties the increase was 31.6 per cent). A growth of 15.0 per cent over a 40-
year period implies an annual growth rate of only 0.35 per cent per annum. It is worth
noting that these rates were not only low by comparison with much of the rest of the
country, but were also modest when compared with many agricultural areas on the
continent at the same period. At a time when the population of England as a whole
was rising faster than that of most other European countries; when some parts of the
country were experiencing a strikingly rapid expansion based on secondary and
tertiary employments; and when English agriculture was characterised both by high
yields per acre and high output per man, the size of the population supported by
agricultural employment changed little; an illustration, perhaps, of the difference
between a market-orientated, capitalist agriculture and peasant economies where
subsistence sometimes remained an important objective and sons might be retained on
a family holding even though the marginal family member produced less than he
consumed?38
The contrast in growth rates between the three groups is far too great for any
but a small part of it to be attributable to differences in rates of natural increase. The
available evidence suggests only modest differences in nuptiality and marital fertility
in different kinds of parish. Mortality differentials were greater, but since, in general,
mortality was greater where population densities were high, as in urban or industrial
settings, rates of natural increase were frequently higher in rural than in urban or
industrial parishes.39 The bulk of the difference in growth rates between different
areas must be largely attributable to net migration flows.
How great a contrast is there between the new estimates and earlier
calculations? This issue may be approached by comparing the growth patterns arising
from the work of Deane and Cole with those produced by the present exercise. There
is an initial difficulty in that, since the marriage returns are available only from 1754,
they cannot be used to generate estimated county populations for 1751, but Deane and

20
Cole provided no estimates for 1761, the opening date in the tables above. The
problem can be overcome, however, in a rough-and-ready way by assuming that
growth in each county in the decade 1751-61 took place at the same pace as in 1761-
71 and then constraining the resulting county totals to sum to the 1751 national
population total obtained by inverse projection. This ensures that the overall rise in
numbers is plausible while preserving the differential growth rates of the counties.
Ratios representing the population increases over the half-century preceding the first
census are shown in table 7 together with those based on the table published by Deane
and Cole. The latter is shown in two versions. In column 4 the ratios shown are taken
directly from their table.40 In the next column they have been slightly reduced.
Deane and Cole’s estimates imply a rise in national population of 50.2 per cent
between 1751 and 1801.41 The comparable rise in the inverse projection estimates is
46.4 per cent. To make the ratio increases taken from the two series directly
comparable, therefore, it seemed sensible to reduce the percentage increases by
464/502. Thus the increase of 15.5 per cent for Devon shown in column 4 is reduced
to 14.3 per cent in column 5.
The rank order of the two series in table 7 differs substantially, sometimes, it
would appear, inexplicably. Deane and Cole have Rutland increasing by 40 per cent,
for example, where the present exercise suggests 6 per cent. Or again, Hampshire
achieves a growth close to two-thirds in Deane and Cole, a marked contrast with the
26 per cent in the new list (due, chiefly, of course, to the assumption made about the
prevailing crude marriage rate before 1801 described above: the same point explains
the contrast in the position of Kent on the two lists).42 Northumberland comes second
on the Deane and Cole list with very modest growth whereas the county occupies a
position roughly half-way down the new list. This list of contrasts could be
considerably extended.
There is a general difference between the two lists which helps to explain
some of the individual contrasts. Perhaps because of the averaging effect produced by
the method of estimation employed by Rickman (that is, basing estimates on baptism
and burial as well as marriage totals), there are more counties experiencing very
limited growth during the half-century in the new list, and at the other end of the
distribution, Lancashire’s growth, spectacular even in Deane and Cole’s estimation,

21
rises still further, approaching a tripling in the half-century period. A clue to the
nature of the inaccuracies or inconsistencies in the estimates of Deane and Cole may
be found in a consideration of the percentages of the adult male population engaged in
agriculture. This can be measured with confidence for the first time in the 1831
census. Although the absolute county percentages in agriculture declined between the
later eighteenth century and 1831 it is likely that their rank ordering remained fairly
stable. Counties which were heavily agricultural early on remained so well into the
new century, and similarly those where agriculture was comparatively unimportant in
1831, as in the ‘industrial’ and ‘London’ groups of counties, were not heavily
agricultural 70 years earlier.
Table 8 sets out data from the 1831 census which enables variations in the
prominence of agricultural employment within the male labour force to be
appreciated. The ten counties with the lowest growth rates between 1751 and 1801 in
the new estimates (table 7) had an average of 50.6 per cent of adult males engaged in
agriculture in 1831, the ten next lowest in growth rates had an average of 45.0 per
cent, the next ten 39.3 per cent, and the final eleven 24.4 per cent; the comparable
percentages in the Deane and Cole list were 43.5, 49.1, 37.8, and 28.5. The former set
shows a regular decline; in the latter there is a substantial rise between the first and
second figures. The first represents what might be expected on general grounds. The
second does not. It is highly improbable that the countries comprising the second
group in the Deane and Cole set were both substantially more heavily agricultural in
occupational structure in 1831 and yet grew faster than the first group in their set
where agriculture was less dominant.43
VI
This brief review of some of the salient characteristics of population change in the
later eighteenth century clears the decks for a reconsideration of the interaction
between differential population growth rates and change in occupational structure
which was discussed in general terms above and illustrated in table 1. The new
estimates of county growth rates enable the same issues to be examined in the context
of late eighteenth-century England. Table 9 mirrors the grouping of county data in
table 6. In the London group 12.6 per cent of adult males were engaged in

22
agriculture; in the industrial group 19.7 per cent. In marked contrast in the
agricultural group 52.2 per cent of adult males were so employed, while in the rest of
England the comparable percentage was 37.5. All the percentages would in all
probability have been higher in the later eighteenth century. Suppose, as an
illustration of possibilities, that throughout the period 1761 to 1801 the percentage in
agriculture in the London group had been 17.0; in the industrial group 25.0; and in the
agricultural group 65.0; or, alternatively, since it would produce the same result, that
these were the average percentages during this period. To complete the picture, of
course, account must be taken of the balance of the population. Assume that in this
residual group of counties 45 per cent were in agriculture.
On the assumptions just described, as may be seen in table 10, the percentage
of the adult male labour force engaged in agriculture would have fallen by 2.4 per
cent between 1761 and 1801, from 42.0 to 39.6 per cent, while those engaged in non-
agricultural occupations would have risen similarly from 58.0 to 60.4 per cent. Over
a period as long as a century, therefore, occupational change produced by differential
population growth rates in counties with contrasting occupational structures of the
sort experienced in England in the later eighteenth century could well have reduced
the percentage employed in agriculture by, say, 5 per cent with a matching rise in the
percentage in secondary and tertiary occupations; and all this without any changes in
the corresponding percentages in individual counties. It is of interest to note,
incidentally, that the national agricultural percentage in 1801 in table 10 closely
resembles that inferred from the data in the early censuses.44 Information about
differential population growth rates, when combined with information about changes
in the occupational structure of individual counties, will make it possible to establish
the relative importance of compositional change and local change in altering the
national occupational structure.
No other industry approached the size of agriculture within the labour force
which made agriculture an obvious subject for an illustrative exercise of the sort just
undertaken, but mutatis mutandis comparable exercises related to other industries
would show that substantial change might arise from differential population growth
rates alone. The potential importance of compositional change varied greatly
depending on whether occupational structure was or was not uniform between

23
regions. Within tertiary employments, for example, it is to be expected that in the
retailing sector many occupations employed a broadly similar percentage of the
workforce and expanded at similar rates in all parts of the country, so that differential
local population growth rates would have had little influence on national trends. But
the same was not true for all kinds of tertiary employment. To take a rather trivial
illustration, it is conceivable that the proportion of men who made a living as
barristers did not change significantly or rose only modestly in London, but because
London was growing more rapidly than the national population as a whole (and
barristers were heavily concentrated in the capital), the proportion of adult males
practising as barristers nationally might still rise significantly. Or again, in the
secondary sector, occupations such as carpenter or tailor were very widespread
throughout the country and any differences in their occupational percentages by
region were muted. Differential regional growth rates would make little difference to
national patterns in these circumstances. In contrast, textile employment percentages
varied greatly from county to county, so that contrasting population growth rates
might have a powerful influence on national changes. For example, consider an
illustrative exercise like that shown in table 1. Assume that at the beginning of a
period lasting a century 80 per cent of the population lived in counties in which 5 per
cent of the labour force worked in textiles, while 20 per cent lived in counties in
which 50 per cent of the labour force was similarly employed. In the textile counties
population doubled every 50 years whereas in the other counties growth was much
slower, with a 5 per cent growth in each period of half a century. As in the earlier
exercise, assume no change in the percentages employed in textile manufacture in
either group of counties. On these assumptions the national percentage engaged in the
textile industry would rise from 14 per cent at the beginning of the period to 19.6 per
cent after 50 years and 26.5 per cent after a century, a near doubling from the initial
level, though there was no change in textile occupational percentage in any county.
VII
There were both changes in occupational structure and differences in population
growth rates in all localities so that the contributions which each sub-division within
the country made to the national whole was affected by both factors. Analytically,
however, they are distinct and establishing their relative importance, both generally

24
and in individual industries, will be an important element in the current research
project designed to identify changes in the occupational structure of England in the
period 1750-1850. Where contrasts in local population growth rates were as marked
as was the case in England in the later eighteenth century, the possibility that in some
industries they may have accounted for the bulk of any change in their relative
importance in the national occupational structure clearly exists. To take the most
extreme example, in 1761 Lancashire housed only 4.8 per cent of the population of
England, yet over the next 40 years 17.0 per cent of the national growth in population
took place in this single county (table 6). Almost as striking is the fact that the
agricultural counties housed 26.9 per cent of the national population in 1761 yet
accounted for only 10.8 per cent of population growth down to 1801. Lancashire,
with 18 per cent of the population of the 14 agricultural counties in 1761 enjoyed a
rise in numbers 60 per cent greater than that in the agricultural block.
Nor should it be overlooked that, because the county was seldom a uniform
unit, still more striking contrasts can easily be produced by using hundreds as the
units of analysis rather than counties. Lack of space prevents any extensive
demonstration of this point, but it is readily illustrated. Middlesex, for example, was a
small county in area which housed the bulk of the population of London yet it
included four hundreds, Edmonton, Elthorne, Gore, and Spelthorpe whose
populations were almost stationary in the later eighteenth century. Their combined
population rose from 48,502 to 50,510 between 1761 and 1801, or by only 4.1 per
cent. Or again, the population in all parts of Lancashire was growing quickly in this
period, but not equally quickly. The star performer was the hundred of Salford (here
taken to include the town of Manchester). Its population grew from 96,516 to
301,251 between 1761 and 1801, or by 212 per cent, equivalent to an annual growth
rate approaching 3 per cent. The rest of the county also grew rapidly, by 95 per cent,
but by comparison with Salford its progress was almost staid. At the other extreme, it
is possible to assemble groups of contiguous agricultural hundreds covering
substantial areas in which the population was falling rather than rising over the same
40-year period. The extent of the contrast between the swiftest and slowest growing
parts of the country is much more vivid when using hundredal data than when using
county data.

25
VIII
The new estimates of county population totals shown in table 5 will, I hope, come to
be regarded as an improvement on their predecessors but each total should be
regarded at best as lying towards the centre of the range of plausible possibilities
rather than exact. Further work may identify good reason to modify some of the
estimates. In one case it is immediately clear that the new estimates must be wrong.
It concerns the hundred of Islandshire and its neighbours situated on or close to the
Scottish border in north-east England. Anomalously, Islandshire was part of the
county of Durham but far removed from the main county. At its nearest point it was
50 miles from the rest of Durham. It shared a common border with Scotland and
included, for example, Holy Island. Using the same method of population estimation
used for all other hundreds, Islandshire would appear to have experienced very severe
population decline in the later eighteenth century to the point that its population in
1801 was only 42 per cent of the 1761 total. Neighbouring hundreds bordering
Scotland also appeared to suffer from sharply declining populations. The
Northumberland hundreds of Glendale and Bamborough, and the town of Berwick-
on-Tweed resembled Islandshire though their population declines were less extreme
(in 1801 their populations were 59, 69, and 65 per cent respectively of their 1761
levels). That the apparent falls are spurious becomes plain when the crude marriage
rates for the hundreds are considered. The rates for Islandshire, Glendale,
Bamborough, and Berwick-on-Tweed, calculated from the average number of
marriages in 1795-1807 and related to the populations in 1801 were 1.3, 2.6, 3.7, and
2.8 per 1,000 respectively. It would appear that the proximity of Scotland encouraged
an increasing number of couples to move north of the border to contract their
marriages. The populations of these hundreds in 1761 are greatly exaggerated when
using the algorithm for estimating late eighteenth-century populations which in
general produces convincing results.45 Because the populations involved were
relatively small their impact on the related county totals is limited, but in considering
the growth rates for the counties over this period (Durham 30.4 per cent;
Northumberland 22.7 per cent), the near certainty that the true figures were somewhat
higher should be borne in mind. Fortunately, such aberrations appear to have been
very rare.

26
Since the purpose of this essay was to present the new estimates of county
populations in the later eighteenth century and to illustrate one of their uses for
economic history, I have not moved outside the time frame which they set. It is,
however, an artificial restriction. The census provides population data both for the
county and the hundred down to 1841. The published population totals at all levels
from the country to the hundred stand in need of adjustment to offset the effects of
under-registration and service in the army and navy but consistent series covering the
whole period 1761 to 1841 can be generated without difficulty.46 Long runs of data
always offer possibilities which are more restricted when runs are short. For example,
they will allow the question of the impact of differential county growth rates on
occupational structure to be pursued more effectively, covering the whole period
conventionally equated with the industrial revolution. There is scope for much further
work in this vein.

27
Table 1. An illustration of the possible effect of differential growth rates on overall occupational structure
Total
populationOccupational split: agricultural/other
Agricultural population
Other population
At time x ‘Rural’ counties 70 70/30 49 21 ‘Non-rural’ counties 30 20/80 6 24 Total 100 55 45 At time x + 50 ‘Rural’ counties 75 70/30 52.5 22.5 ‘Non-rural’ counties 60 20/80 12 48 Total 135 64.5 70.5 At time x + 100 ‘Rural’ counties 80 70/30 56 24 ‘Non-rural’ counties 120 20/80 24 96 Total 200 80 120 Percentage distribution: agricultural/other
Time x 55 45 Time x + 50 48 52 Time x + 100 40 60

28
Table 2. County crude marriage rates in 1801, 1811, and 1821
CMR 1801 CMR 1811 CMR 1821 Bedfordshire 8.52 8.01 8.11 Berkshire 7.02 7.04 7.14 Buckinghamshire 7.84 7.54 7.32 Cambridgeshire 8.46 8.28 8.44 Cheshire 8.19 7.81 8.38 Cornwall 7.70 7.18 7.38 Cumberland 7.18 7.35 6.25 Derbyshire 7.59 7.08 7.45 Devon 9.18 8.98 7.87 Dorset 7.48 7.07 7.08 Durham 8.22 7.57 7.80 Essex 8.04 7.42 6.82 Gloucestershire 8.49 8.70 9.24 Hampshire 9.76 9.69 8.00 Herefordshire 6.02 6.46 6.21 Hertfordshire 6.54 5.96 5.83 Huntingdonshire 8.64 7.87 7.89 Kent 9.00 8.46 7.57 Lancashire 9.91 8.97 9.37 Leicestershire 8.07 7.82 8.43 Lincolnshire 8.36 8.00 7.64 Middlesex 10.98 10.48 10.28 Norfolk 7.86 7.71 7.86 Northamptonshire 7.58 7.71 7.80 Northumberland 7.11 6.99 6.95 Nottinghamshire 9.39 8.12 8.94 Oxfordshire 7.34 7.04 7.12 Rutland 6.85 6.85 7.29 Shropshire 7.29 6.53 7.11 Somerset 7.71 7.49 7.26 Staffordshire 8.70 8.28 8.71 Suffolk 8.12 7.67 7.49 Surrey 8.05 7.63 7.92 Sussex 8.17 7.66 7.29 Warwickshire 8.76 8.81 9.11 Westmorland 7.22 7.03 6.79 Wiltshire 7.22 7.22 7.29 Worcestershire 7.60 7.52 7.90 Yorkshire, ER 10.24 8.81 8.17 Yorkshire, NR 7.22 7.75 6.87 Yorkshire, WR 8.46 8.39 8.61 England 8.58 8.23 8.20 Source: Marriage totals were taken from Parish Register Abstracts of the censuses of 1801, 1811, and 1821. The national totals were taken to be the sum of the totals for the individual counties. For population totals see accompanying text.

29
Table 3. Crude marriage rates based on totals taken from a sample of 404 English parishes.
(1) (2) (3) (4)
Average annual total of
marriages
Population Crude marriage rate
per 1,000
Ratio of rate in col. 3 to 8.58 1
1755-67 54,246 6,310,338 8.60 1.0021765-77 57,669 6,623,358 8.71 1.0151775-87 61,794 7,206,139 8.58 0.9991785-97 67,246 7,845,678 8.57 0.9991795-1807 73,697 8,671,439 8.50 0.991
Sources: Marriages. Wrigley and Schofield, Population history of England, tab. A2.3, pp. 496-502: Population totals. Wrigley et al., English population history, tab. A9.1, pp. 614-5. Note: 1. The national rate in 1801 was 8.58 per 1,000 (see tab. 2). For comment see associated text.
30
Table 4. An example of the derivation of a series of county population totals for the later eighteenth century
Barford Biggles-
wade Clifton Flitt Manshead Redborne-
stoke Stodden Willey Wixam-
tree Bedford Bedford-
shire Co. totals constrained by inverse projection
Panel 1 1755-67 349 572 261 791 1,115 825 345 536 440 408 5,642 1765-77 370 560 317 852 1,138 932 367 576 454 451 6,017 1775-87 393 616 307 819 1,229 982 410 582 445 503 6,286 1785-97 454 590 305 907 1,338 1079 466 598 498 563 6,798 1795-1807 436 617 317 1112 1,557 1035 421 713 486 562 7,256 Panel 2 1755-67 378 572 261 791 1,115 825 360 654 440 408 5,804 1765-77 400 560 317 852 1,138 932 383 703 454 451 6,190 1775-87 425 616 307 819 1,229 982 428 710 445 503 6,464 1785-97 491 590 305 907 1,338 1,079 486 730 498 563 6,987 1795-1807 452 617 317 1112 1,557 1,035 431 776 486 562 7,344 Panel 3 1811 population 4,402 6,426 3,993 8,597 15,628 9,892 4,263 7,160 5,153 4,605 70,119 1801 totals 4,165 6,080 3,778 8,134 14,786 9,359 4,033 6,774 4,876 4,357 66,343 1761 3,477 5,637 3,111 5,786 10,589 7,460 3,372 5,714 4,414 3,163 52,721 1771 3,686 5,518 3,778 6,232 10,807 8,428 3,587 6,140 4,554 3,496 56,227 1781 3,915 6,070 3,659 5,991 11,671 8,880 4,007 6,204 4,464 3,900 58,761 1791 4,523 5,814 3,635 6,635 12,707 9,757 4,554 6,374 4,996 4,365 63,359 1801 4,165 6,080 3,778 8,134 14,786 9,359 4,033 6,774 4,876 4,357 66,343 Panel 4 1761 3,481 5,643 3,114 5,793 10,601 7,469 3,376 5,720 4,419 3,167 52,782 52,782 1771 3,575 5,353 3,665 6,045 10,483 8,175 3,479 5,956 4,418 3,392 54,541 54,541 1781 3,808 5,905 3,559 5,827 11,353 8,638 3,898 6,035 4,342 3,793 57,159 57,159 1791 4,410 5,669 3,544 6,469 12,390 9,514 4,441 6,216 4,871 4,256 61,780 61,780 1801 4,165 6,080 3,778 8,134 14,786 9,359 4,033 6,774 4,876 4,357 66,343 66,343 Source: The Parish Register Abstracts of the censuses of 1801 an 1811. Note: Because of the effects of rounding the county total may not always equal the sum of the hundred totals.

31
Table 5. Population growth in the English counties 1761-1801
County 1761 1771 1781 1791 1801 Ratio 1801/1761
Counties in rank order
Ratio 1801/1761
Bedfordshire 52782 54541 57159 61780 66343 125.7 Wiltshire 101.6 Berkshire 101046 101153 106379 109742 114297 113.1 Hertfordshire 106.2 Buckinghamshire 96658 95707 101143 104688 112444 116.3 Rutland 108.6 Cambridgeshire 78022 80284 83298 89950 93504 119.8 Northamptonshire 109.7 Cheshire 140794 158156 169632 182906 200674 142.5 Huntingdonshire 111.7 Cornwall 132554 140765 159311 176215 197030 148.6 Berkshire 113.1 Cumberland 88800 96346 104215 110225 122685 138.2 Herefordshire 113.6 Derbyshire 114039 122899 134063 148630 168641 147.9 Norfolk 113.8 Devon 306546 285833 333558 336521 358963 117.1 Buckinghamshire 116.3 Dorset 100103 97936 104424 108420 120685 120.6 Devon 117.1 Durham 128875 129926 139140 150083 167823 130.2 Westmorland 117.5 Essex 200719 201748 208791 214086 236974 118.1 Yorkshire, NR 117.7 Gloucestershire 215751 216616 231057 244726 262481 121.7 Essex 118.1 Hampshire 178366 168634 207957 213202 229878 128.9 Oxfordshire 119.7 Herefordshire 82145 84270 89452 91348 93342 113.6 Cambridgeshire 119.8 Hertfordshire 96124 97673 96140 96181 102118 106.2 Lincolnshire 120.2 Huntingdonshire 35186 34397 37464 38540 39316 111.7 Dorset 120.6 Kent 236314 234024 260881 295916 321939 136.2 Worcestershire 120.7 Lancashire 303312 355591 432027 536244 704037 232.1 Gloucestershire 121.7 Leicestershire 104315 104593 112710 123615 136134 130.5 Northumberland 122.6 Lincolnshire 181634 188176 194048 204456 218262 120.2 Suffolk 124.8 Middlesex 558988 637458 676861 764942 856201 153.2 Somerset 125.3 Norfolk 251435 259197 256951 266778 286092 113.8 Bedfordshire 125.7 Northamptonshire 125648 129153 134539 134650 137888 109.7 Hampshire 128.9 Northumberland 134119 138105 144623 145969 164412 122.6 Shropshire 129.3 Nottinghamshire 93652 100505 111868 132808 146881 156.8 Durham 130.2 Oxfordshire 95869 99197 102207 104768 114721 119.7 Leicestershire 130.5 Rutland 15767 15102 15750 16589 17117 108.6 Kent 136.2 Shropshire 135705 141136 149041 157014 175440 129.3 Cumberland 138.2 Somerset 228612 235103 252341 270407 286489 125.3 Yorkshire, ER 139.0 Staffordshire 157680 173096 192154 215998 250282 158.7 Cheshire 142.5 Suffolk 176499 183486 195121 199971 220224 124.8 Derbyshire 147.9 Surrey 167147 180272 201452 237489 281563 168.5 Cornwall 148.6 Sussex 103237 109464 125945 140503 166725 161.5 Middlesex 153.2 Warwickshire 142014 155874 180293 215190 217878 153.4 Warwickshire 153.4 Westmorland 37073 38574 38240 41518 43554 117.5 Nottinghamshire 156.8 Wiltshire 190751 189439 196885 200623 193721 101.6 Staffordshire 158.7 Worcestershire 120851 128612 129619 137368 145817 120.7 Sussex 161.5 Yorkshire, ER 104966 114270 123852 143164 145922 139.0 Yorkshire, WR 164.9 Yorkshire, NR 138284 148428 157980 156272 162743 117.7 Surrey 168.5 Yorkshire, WR 357957 397619 457564 526182 590197 164.9 Lancashire 232.1 England 6,310,338 6,623,358 7,206,139 7,845,678 8,671,439 137.4 Note: For the derivation of the county totals see accompanying text.

32
Table 6. Differential growth rates in three county groups
Percentage of English total Population
1761 Population
1801 Increase
1761-1801
Percentage increase
Population 1761
Population 1801
Population increase
1761-1801 Kent 236314 321939 85625 36.2 3.7 3.7 3.6 Middlesex 558988 856201 297213 53.2 8.9 9.9 12.6 Surrey 167147 281563 114416 68.5 2.6 3.2 4.8 London group 962449 1459704 497255 51.7 15.3 16.8 21.1 Cheshire 140794 200674 59880 42.5 2.2 2.3 2.5 Derbyshire 114039 168641 54602 47.9 1.8 1.9 2.3 Lancashire 303312 704037 400725 132.1 4.8 8.1 17.0 Nottinghamshire 93652 146881 53229 56.8 1.5 1.7 2.3 Staffordshire 157680 250282 92602 58.7 2.5 2.9 3.9 Warwickshire 142014 217878 75864 53.4 2.3 2.5 3.2 Yorkshire, WR 357957 590197 232240 64.9 5.7 6.8 9.8 Industrial group 1309448 2278591 969143 74.0 20.8 26.3 41.0 Bedfordshire 52782 66343 13561 25.7 0.8 0.8 0.6 Berkshire 101046 114297 13252 13.1 1.6 1.3 0.6 Buckinghamshire 96658 112444 15786 16.3 1.5 1.3 0.7 Cambridgeshire 78022 93504 15481 19.8 1.2 1.1 0.7 Essex 200719 236974 36256 18.1 3.2 2.7 1.5 Hertfordshire 96124 102118 5994 6.2 1.5 1.2 0.3 Huntingdonshire 35186 39316 4130 11.7 0.6 0.5 0.2 Lincolnshire 181634 218262 36629 20.2 2.9 2.5 1.6 Norfolk 251435 286092 34658 13.8 4.0 3.3 1.5 Northamptonshire 125648 137888 12240 9.7 2.0 1.6 0.5 Oxfordshire 95869 114721 18852 19.7 1.5 1.3 0.8 Rutland 15767 17117 1350 8.6 0.2 0.2 0.1 Suffolk 176499 220224 43724 24.8 2.8 2.5 1.9 Wiltshire 190751 193721 2970 1.6 3.0 2.2 0.1 Agricultural group 1698139 1953023 254884 15.0 26.9 22.5 10.8 Rest of England 2340303 2980122 639819 27.3 37.1 34.4 27.1 England 6310338 8671439 2361101 37.4 100.0 100.0 100.0 Source: see tab. 4.

33
Table 7. The new estimates of growth ratios 1751-1801 compared with those of Deane and Cole (growth ratios measured by expressing the population of each county
in 1801 as a percentage of its population in 1751)
New estimates Deane and Cole (1)
County (2)
Growth ratio
1801/1751
(3) County
(4) Growth ratio
1801/1751(original)
(5) Growth ratio
1801/1751(adjusted)
Wiltshire 102.4 Devon 115.5 114.3Rutland 105.6 Northumberland 116.6 115.3Hertfordshire 109.7 Bedfordshire 118.1 116.7Huntingdonshire 110.9 Westmorland 119.5 117.9Devon 113.2 Wiltshire 121.5 119.8Northamptonshire 114.6 Northamptonshire 121.6 119.9Berkshire 115.0 Oxfordshire 126.8 124.7Buckinghamshire 117.0 Cambridgeshire 126.9 124.8Herefordshire 118.5 Somerset 126.9 124.9Norfolk 119.1 Durham 127.2 125.1Dorset 119.9 Gloucestershire 127.5 125.4Essex 120.5 Norfolk 127.5 125.4Gloucestershire 124.1 Huntingdonshire 128.1 125.9Westmorland 124.3 Essex 129.5 127.2Cambridgeshire 125.2 Herefordshire 130.7 128.3Oxfordshire 125.7 Berkshire 131.1 128.7Hampshire 126.3 Hertfordshire 131.7 129.2Lincolnshire 126.5 Dorset 134.7 132.0Northumberland 128.1 Buckinghamshire 135.7 132.9Yorkshire, NR 128.2 Suffolk 136.1 133.3Worcestershire 130.4 Shropshire 137.2 134.3Somerset 130.9 Lincolnshire 140.4 137.3Suffolk 131.8 Middlesex 143.1 139.7Bedfordshire 131.9 Rutland 143.7 140.3Leicestershire 132.9 Leicestershire 146.5 142.9Durham 133.4 Cornwall 147.3 143.6Shropshire 136.6 Cumberland 149.2 145.4Kent 139.8 Worcestershire 150.1 146.3Cumberland 152.3 Yorkshire, NR 151.8 147.8Yorkshire, ER 156.8 Derbyshire 165.1 160.0Cornwall 160.3 Hampshire 169.0 163.6Derbyshire 162.0 Nottinghamshire 170.4 164.9Cheshire 162.7 Warwickshire 172.2 166.6Nottinghamshire 170.9 Sussex 174.3 168.5Warwickshire 171.1 Staffordshire 175.6 169.7Sussex 173.9 Cheshire 183.8 177.3Staffordshire 176.9 Kent 188.2 181.4Middlesex 177.5 Yorkshire, ER 189.8 182.8Surrey 184.5 Yorkshire, WR 192.5 185.3Yorkshire, WR 186.1 Surrey 208.1 199.7Lancashire 276.4 Lancashire 218.5 209.3

34
Table 8. Males aged 20 and over engaged in agriculture in England in 1831
Males Twenty Years of
Age
Agriculture: Occupiers employing
labour
Agriculture: Occupiers not
employing labour
Labourers employed in agriculture
Total in agriculture
Percentage in agriculture
Bedfordshire 22,568 1,330 474 11,588 13,392 59.3 Berkshire 37,084 1,711 458 14,802 16,971 45.8 Buckinghamshire 35,504 2,152 453 16,743 19,348 54.5 Cambridgeshire 35,715 2,421 1,266 15,698 19,385 54.3 Cheshire 78,930 4,374 4,059 15,094 23,527 29.8 Cornwall 69,737 4,608 3,613 16,243 24,464 35.1 Cumberland 40,614 3,617 2,839 9,010 15,466 38.1 Derbyshire 58,178 3,320 4,257 10,593 18,170 31.2 Devon 116,188 9,328 3,356 35,311 47,995 41.3 Dorset 37,861 2,243 967 14,056 17,266 45.6 Durham 59,045 2,229 1,544 7,556 11,329 19.2 Essex 79,023 4,561 888 38,234 43,683 55.3 Gloucestershire 94,234 3,675 1,846 20,927 26,448 28.1 Hampshire 74,711 2,774 1,234 24,675 28,683 38.4 Herefordshire 29,342 2,505 1,679 12,213 16,397 55.9 Hertfordshire 34,910 1,518 399 14,700 16,617 47.6 Huntingdonshire 13,001 857 397 5,967 7,221 55.5 Kent 115,655 4,361 2,152 36,113 42,626 36.9 Lancashire 313,099 6,658 9,714 20,949 37,321 11.9 Leicestershire 49,812 2,656 2,045 10,642 15,343 30.8 Lincolnshire 79,535 6,901 6,204 32,167 45,272 56.9 Middlesex 358,521 1,050 490 11,376 12,916 3.6 Norfolk 93,498 5,229 2,718 37,466 45,413 48.6 Northamptonshire 43,793 3,015 1,117 17,775 21,907 50.0 Northumberland 53,203 2,376 1,261 10,441 14,078 26.5 Nottinghamshire 56,582 2,643 2,414 11,799 16,856 29.8 Oxfordshire 39,018 2,054 458 15,998 18,510 47.4 Rutland 4,940 ,429 424 1,910 2,763 55.9 Shropshire 56,474 3,832 2,139 17,296 23,267 41.2 Somerset 95,556 6,032 3,731 28,107 37,870 39.6 Staffordshire 101,632 3,781 3,649 16,812 24,242 23.9 Suffolk 71,376 4,526 1,121 33,040 38,687 54.2 Surrey 119,565 1,873 727 16,761 19,361 16.2 Sussex 67,076 3,160 1,330 26,124 30,614 45.6 Warwickshire 83,239 2,838 1,142 15,644 19,624 23.6 Westmorland 14,020 1,435 1,685 3,474 6,594 47.0 Wiltshire 58,039 3,387 1,239 24,708 29,334 50.5 Worcestershire 52,796 2,636 1,260 14,590 18,486 35.0 Yorkshire, E. Riding 49,914 3,671 1,914 13,911 19,496 39.1 Yorkshire, N. Riding 47,396 4,950 4,334 14,646 23,930 50.5 Yorkshire,W. Riding 231,666 7,096 10,636 24,502 42,234 18.2 England 3,173,050 139,812 93,633 739,661 973,106 30.7 Source: 1831 census, Enumeration Abstract.
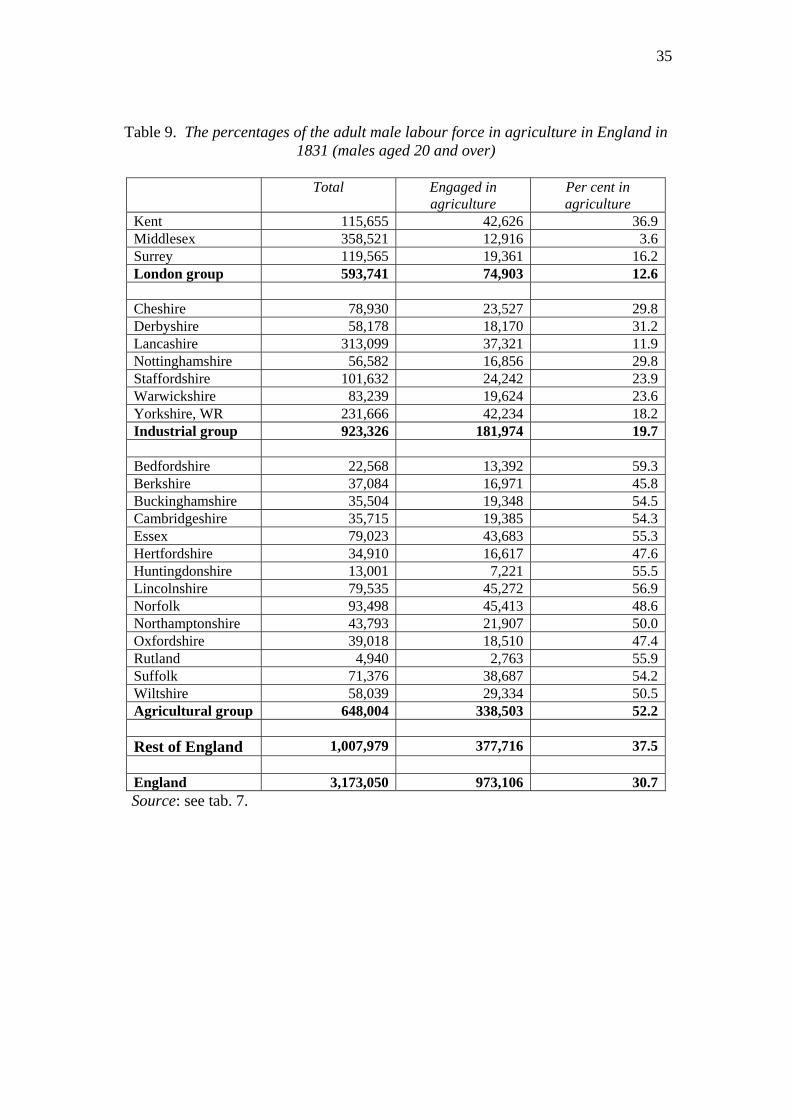
35
Table 9. The percentages of the adult male labour force in agriculture in England in 1831 (males aged 20 and over)
Total Engaged in
agriculture Per cent in agriculture
Kent 115,655 42,626 36.9Middlesex 358,521 12,916 3.6Surrey 119,565 19,361 16.2London group 593,741 74,903 12.6 Cheshire 78,930 23,527 29.8Derbyshire 58,178 18,170 31.2Lancashire 313,099 37,321 11.9Nottinghamshire 56,582 16,856 29.8Staffordshire 101,632 24,242 23.9Warwickshire 83,239 19,624 23.6Yorkshire, WR 231,666 42,234 18.2Industrial group 923,326 181,974 19.7 Bedfordshire 22,568 13,392 59.3Berkshire 37,084 16,971 45.8Buckinghamshire 35,504 19,348 54.5Cambridgeshire 35,715 19,385 54.3Essex 79,023 43,683 55.3Hertfordshire 34,910 16,617 47.6Huntingdonshire 13,001 7,221 55.5Lincolnshire 79,535 45,272 56.9Norfolk 93,498 45,413 48.6Northamptonshire 43,793 21,907 50.0Oxfordshire 39,018 18,510 47.4Rutland 4,940 2,763 55.9Suffolk 71,376 38,687 54.2Wiltshire 58,039 29,334 50.5Agricultural group 648,004 338,503 52.2 Rest of England 1,007,979 377,716 37.5 England 3,173,050 973,106 30.7Source: see tab. 7.

36
Table 10. Illustration of the possible effect of differential growth rates on the share of agriculture in the occupational structure of England in the later eighteenth century Percentage
in agriculture in 1831 (adult male labour force)
Assumed percentage in later eighteenth century
Percentage of total population in 1761
Percentage of total population in 1801
Agricultural population in 1761 (percentage of adult male labour force: col. 2 x col. 3)
Agricultural population in 1801 (percentage of adult male labour force: col. 2 x col. 4)
London group
12.6 17.0 15.3 16.8 2.6 2.9
Industrial group
19.7 25.0 20.8 26.3 5.2 6.6
Agricultural group
52.2 65.0 26.9 22.5 17.5 14.6
Rest of England
37.5 45.0 37.1 34.4 16.7 15.5
England 42.0 39.6

37
Figure 1. Differential growth rates in three county groups
1 . The work underlying this essay was made possible by an ESRC grant (RES-000-23-0131), entitled ‘Male occupational change and economic growth in England 1750-1851’. An earlier draft was greatly improved by the comments made by Peter Kitson and Leigh Shaw-Taylor. 2 . In the early censuses England was taken to include Monmouth, but in this essay all data referring to England exclude Monmouth. England therefore consists of 39 counties, or 41 if the three Ridings of Yorkshire are treated as equivalent to counties, as in this essay.

38
3 . Deane and Cole, British economic growth, tab. 24, p. 103 and associated text. 4 . Deane and Cole preferred Brownlee’s estimates of national totals. A discussion of the methods employed and the assumptions made by scholars such as Finlaison, Farr, Griffith, and Brownlee, all of whom produced estimates of population growth in the eighteenth century, may be found in Wrigley and Schofield, Population history of England, app. 5. It should be noted that all these scholars depended on the returns secured by Rickman but corrected his data in different ways. 5 . It might be expected that Deane and Cole’s revision of Devon would also have changed the rank order of counties, but Devon was the slowest growing country in both county series and therefore left the rank ordering of counties unaffected. 6 . The nature and the notable duration of the controversy are discussed in Glass, Numbering the people, and well illustrated in his two companion volumes, The population controversy and The development of population statistics. 7 . Rickman, Observations on the results of the Population Act, 41 Geo. III. 8 . There is a fuller account of Rickman’s procedures in Wrigley and Schofield, Population history of England, pp. 572-4. 9. A summary of Rickman’s methods and results, including the text of the letter which he sent to selected incumbents in 1836 may be found in 1841Census, Preface, pp. 34-7. It maybe of interest to note that Rickman himself had died in 1840. His executors passed on the documents containing his calculations to the Home Office. Edmund Phipps and Thomad Vardon, acting on behalf of the first Registrar General, Thomas Henry Lister, who had also died very recently, published the table in the census and briefly described Rickman’s method of calculation. Their text suggests some reserve about Rickman’s results. They wrote: ‘We may, at a future, period, enter into a consideration of the merits of the calculation, deeming it sufficient for the present to state that there is reason for supposing the estimate hereby arrived at to be an approximation to the truth’: ibid., p. 35. 10 . Ibid., tab. 4.6, p. 101. 11 . Wrigley and Schofield, Population history of England, pp. 89-96. 12 . Wrigley and Schofield, Population history of England, app. 4. 13 . There is a discussion of trends in adult male agricultural employment in the early nineteenth century in Wrigley, ‘Men on the land and men in the countryside’. See esp. tab. 11.12, p. 332. 14 . An example of the importance of this consideration may be found in Woods’s intriguing discussion of mortality trends in nineteenth-century England. For much of the century expectation of life at birth changed very little in England as a whole, but Woods showed that mortality might improve significantly in each type of settlement --- rural, small town, large city, metropolis, etc. --- but because there was much more rapid growth of population in the least healthy settlement types, local improvement would not be mirrored nationally. Woods, ‘The effects of population redistribution on the level of mortality’. 15 . See n. 1 above for details of the grant. 16 . 26 George II, cap. 33. 17 . Rickman, Observations on the results of the Population Act, 41 Geo. III, p. 4. 18 . Deane and Cole, British economic growth, p. 102. 19 . 41 George III, cap. 15. An act for the taking an account of the population of Great Britain, and of the increase or diminution thereof. 20 . The accuracy of the printed county totals compared with the sum of the constituent hundreds varied greatly. In some counties there were only occasional inconsistencies. In Buckinghamshire, for example, there were discrepancies in six years between 1754 and 1800 (1754, 1759, 1767, 1768, 1770, and 1798). In Derbyshire in contrast the sum of the hundred totals failed to match the printed county total in every year except 1755-63 and 1771. Occasionally, the discrepancy was very large indeed, usually because of a misprint. The printed total for Devon in 1792, for example, is 1,619 while the sum of the hundred totals is 2,619. There are comparable problems when the national total is compared with the sum of the printed county totals. Disagreement between the two figures was uncommon before 1766 (other than in 1761). From 1767 to 1781 in each year the national total fell short of the sum of the county totals by a figure in the range between 1,000 and 1,500, except for 1780 (2,288). There was then a further period of generally good agreement, broken by a few major errors, probably attributable to poor proofing. In 1790 the printed total exceeded the sum of the county totals by 4,000; while in 1797 it fell short of the latter by 2,000. In the PRAs printed in subsequent censuses the agreement was always very close, indeed in most years there was exact agreement. 21 . The population totals in question may be found in Wrigley, et al., English population history, tab. A9.1, pp. 614-5. 22 . See n. 21.
39
23 . Wrigley and Schofield, Population history of England, tab. A6.7, p. 595. 24 . The effects of earlier wars are clearly visible. In Portsmouth, for example, the number of marriages in the 8-year period 1756-63 was 3,772. In the 8 following years this total fell to 2,063. The earlier wars also caused distortions in the estimated populations in the Devon and Kent because other naval bases were affected in the same way as Portsmouth. It is significant that in tab. 5 in all three counties the population in 1771 is smaller than in 1761, a pattern rarely found in other counties. The ‘true’ totals should probably be lower in 1761 and higher in 1771. 25 . Provided, of course, that all the parishes in question maintained marriage registers. 26 . See Wrigley and Schofield, Population history of England, app. 7, ‘Rickman’s parish register returns of 1801 and 1841’. 27 . Wrigley and Schofield, Population history of England, tab. A7.10, p. 621. 28 . Ibid., p. 601. 29 . See n. 20 above. 30 . It should be borne in mind that this problem also affects the comparison of hundred totals over time. For example, where a hundred included one or more parishes which overlapped into another hundred, its population in 1821 will not be exactly comparable to its population in 1811. 31 . 446 x (1,000 /8.52) x 0.9811 = 51,361. See p. above for explanation of the final adjustment figure. 32 . The footnotes refer to a total of more than 230 parishes in which returns were defective. In the great majority of cases the dates of the period of defective registration show that the problem was confined to the early years of registration. 33 . The comparison also provides new and important evidence that the re-weighting of the parishes in the 404 sample on which the reconstruction of national population trends in the Population history of England was based captures the national pattern accurately. 34 . As, for example, the total for 1755-67, 5,804, quoted above p. 35 . It is of interest to note that when the work which gave rise to the Population history of England was in train, an estimate of the impact of these factors was made. It suggested that the published national total in the 1801 census should be increased by 4.49 per cent, or from 8,285,852 to 8,658,265 (Wrigley and Schofield, Population history of England, tab. A6.7, p. 595). The subsequent inverse projection exercise produced a gratifying similar total for 1801, 8,671,439 (Wrigley, et al., English population history, tab. A9.1, pp. 614-5). The two exercises were, of course, independent of each other. 36 . 3,686 x 54,541/56,227 = 3,575. 37 . From 6,310,338 to 8,671,439; see tab. 5. 38 . This issue is far too complex to be pursued here, but would repay further examination. Population growth accelerated generally in Europe in the second half of the eighteenth century. There were nevertheless substantial tracts in which growth was slight or absent. This was probably true of much of western France, for example. But there were many agricultural areas in which growth was more rapid than in the group of 14 agricultural counties in central southern England, both in the heartland of Europe and towards its periphery. The Belgian provinces afford several examples of this, for example, and at a time when the urban proportion was falling rather than rising. In Norway, a country with only a tiny urban population, all four dioceses were growing briskly in the second half of the eighteenth century. Such examples could be multiplied. Comparisons across space raise as many questions as similar comparisons over time. Population estimates are usually subject to wide error margins; the dates for which estimates are available seldom coincide; and rural populations did not make their livings exclusively from agriculture. In some cases rapid growth came from a low base because of previous devastation by war. Yet a systematic investigation of the topic might reveal much of interest about the relative strength of the influences leading to the release of labour from the land or its retention, and about the extent of the contrast between England and other countries. Dupâquier, ‘La peuplade’, fig. 15, p. 80; Klep, ‘Population estimates of Belgium by province’, tab. 15, p. 505; Drake, Population and society in Norway, Statistical appendix, tab. 1, pp. 164-5. See also Bairoch, ‘Une nouvelle distribution des populations’ which shows how widespread was the fall in the urban percentage throughout continental Europe in the second half of the eighteenth century, even though total populations were rising rapidly. 39 . Evidence bearing on this issue may be found in Wrigley et al., English population history, pp. 182-94 (nuptiality); pp. 268-79 (mortality); and pp. 501-7 (fertility). 40 . Deane and Cole, British economic growth, tab. 24, p. 103. 41 . In making this calculation to preserve comparability between the two sets of estimates Wales and Monmouth were deleted from the original list of Deane and Cole.

40
42 . See p. above. 43 . Much more could be said about the reasons why Rickman’s method of estimating county totals was likely to produce inaccurate results, and therefore also to affect totals derived from his work, but it would be out of place to engage in a lengthy discussion in this essay. 44 . Wrigley, ‘Men on the land and men in the countryside’, tab. 11.12, p. 332. 45 . Other hundreds in Northumberland and Cumberland also bordered on Scotland. In Northumberland Coquetdale and Tindale both had rather low crude marriage rates (5.9 and 6.2 per 1,000 in the period centred on 1801), lower than in hundreds such as Morpeth and Castle which had no common border with Scotland, If, however, there was marriage ‘leakage’ across the border in these hundreds it appears to have been present throughout the period 1761 to 1801 since there was population growth in both hundreds, substantial in Tindale, modest in Coquetdale. In Cumberland Eskdale hundred had a land border with Scotland while Cumberland hundred faced Scotland across the Solway Firth. In both hundreds the crude marriage rate was lower than elsewhere in the county (the rates were 6.1 and 5.7 per 1,000 respectively in the period centred on 1801, when in the rest of the county the rate was 7.6), but in both hundreds, as in Coquetdale and Tindale, escape across the border appears to have been a constant rather than an increasing phenomenon since in both hundreds population growth was brisk between 1761 and 1801 in the new estimates. 46 . It would, of course, be equally, or perhaps even more valuable to extend the county series further backward in time, but, if feasible at all, it would involve vastly more effort than the present exercise. Coverage was less good in all three series (baptisms, burials, and marriages). Correction for under-registration would be problematic, and it would be necessary to collect new data for substantial periods of time from large numbers of parishes in order to estimate county totals.