Embed Size (px)
Citation preview

English and Welsh Civil and
Social Justice Panel Survey:
Wave 2
Nigel Balmer
Summary Findings of Wave 2 of the English and
Welsh Civil and Social Justice Panel Survey

© Legal Services Commission 2013
All rights reserved. No part of this publication may be reproduced, stored in a
retrieval system, or transmitted, in any form or by any means, electronic, mechanical,
photocopying, recording or otherwise, except as permitted by the UK Copyright,
Designs and Patents Act 1988, without prior permission of the copyright holder.

Contents
Executive Summary i
PART A
Section 1 Introduction to the Survey 1
Section 2 The Incidence of Civil Justice Problems 9
Section 3 The Impact of Civil Justice Problems 33
Section 4 People‟s Understanding of Civil Justice Problems 37
Section 5 Problem Resolution Strategies 42
Section 6 The Outcome of Problems 56
Section 7 Attitudes to the Justice System 59
Section 8 The Experience of Those Eligible for Legal Aid 63

i
Executive Summary
The ability of people to protect their legal rights and hold others to their legal
responsibilities is a prerequisite of the rule of law and underpins social justice. The
English and Welsh Civil and Social Justice Panel Survey (CSJPS), which replaced the
English and Welsh Civil and Social Justice Survey (CSJS) in 2010, provides the only
large-scale representative overview of the public‟s experience of civil justice issues
and successes in seeking justice when addressing them.
This overview report describes summary findings from the second wave of the
English and Welsh Civil and Social Justice Panel Survey. Full technical details are set
out in The English and Welsh Civil and Social Justice Panel Survey – Wave Two
Technical Report1, which also sets out the full wave 2 questionnaire.
2 The aim of this
report is to present headline findings from wave 2 of the CSJPS. Analysis is in no way
exhaustive and only touches upon some of the analyses made possible by the
longitudinal panel format3.
Introduction to the Survey
The English and Welsh Civil and Social Justice Panel Survey (CSJPS) collects
data relating to people‟s experiences of civil justice (or „justiciable‟) problems and the
strategies they used to resolve them. The survey is a substantial development of the
Legal Services Research Centre‟s (LSRC) English and Welsh Civil and Social Justice
Survey (CSJS), which was first conducted in 2001, then again in 2004, and on a
continuous basis between 2006 and 2009. Respondents to the first two waves of the
CSJPS were asked about the experience of problems in each of 15 distinct civil justice
problem categories: consumer; employment; neighbours; owned housing; rented
housing; money; debt; welfare benefits; divorce; problems ancillary to relationship
breakdown; domestic violence; education; care proceedings; personal injury, and
1 Cleary, A and Huskinson, T. (2012) The English and Welsh Civil and Social Justice Panel Survey –
Wave 2 Technical Report, London: Legal Services Commission. 2 Note, that analyses in this report are unweighted, though a number of weights (for non-response) are
available in the CSJPS datasets. 3 For readers interested in carrying out analysis of either the CSJS or CSJPS, arrangements are being
made to make data and associated resources publicly available through the UK Data Archive (go to
http://data-archive.ac.uk/). It is expected that data will be accessible in spring 2013.

ii
clinical negligence. Wave 1 interviews were conducted between June and October
2010, with wave 2 interviews following after eighteen months. For up to three
problems (selected at random, if more than three problems had been experienced),
respondents were asked about disputants, problem resolution strategies, advisers
consulted, formal dispute resolution processes, how and when problems concluded,
the causes and consequences of problems, understanding of rights, and regrets. For
one (random) problem, respondents were also asked for detailed information about the
steps they had taken to resolve it. Extensive demographic and household details were
also collected. Problems ongoing at the time of the wave 1 interview were also
revisited at wave 2, with further details set out in the technical report and
questionnaire.
There were 3,911 adult respondents interviewed at wave 2, aged 16 years and
above. 2,604 of these had been interviewed at wave 1. Of the remainder, 148 were
resident in a household surveyed at wave 1, but not interviewed until wave 2, 96 were
new residents in a household surveyed at wave 1 and 1,063 were new respondents
from new households. The survey was broadly representative of the adult residential
household population of England and Wales, which comprises around 98 per cent of
the total population.
Summary of Findings
Thirty-two per cent of wave 2 CSJPS survey respondents reported having experienced
a civil justice problem. This was similar to the thirty-three per cent observed in wave
1 and is in line with findings from earlier surveys. Again, problems were far from
being randomly distributed across the survey population. For example, those more
vulnerable to social exclusion tended to report more problems than others. In addition,
the proportion of those in vulnerable groups increased as the number of problems
reported increased. For example, lone parents, those on benefits, victims of crime, and
particularly those with a long term limiting illness/disability or mental health
problems reported suffering from multiple problems more often than others.
As with wave 1, one-third of problems were attributed to one or more of a
variety of causes, with loss of income, money problems and ill-health among the most
common. At least one adverse consequence followed from around half of problems.
iii
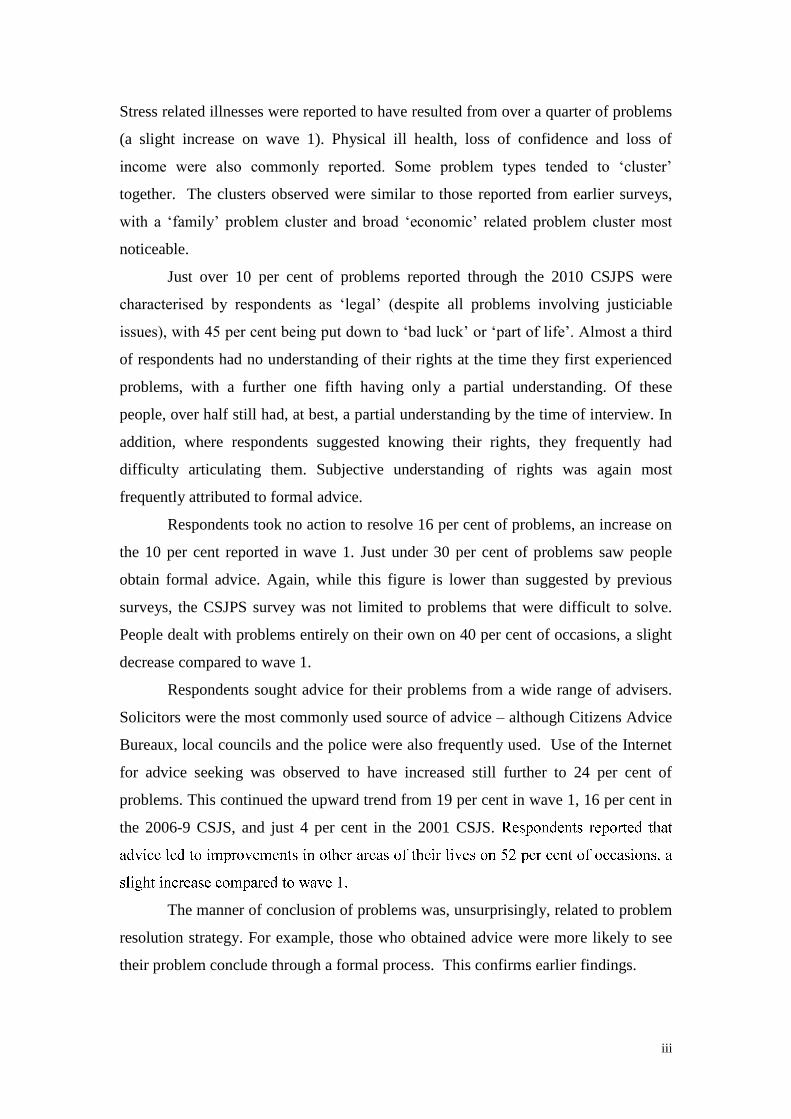
Stress related illnesses were reported to have resulted from over a quarter of problems
(a slight increase on wave 1). Physical ill health, loss of confidence and loss of
income were also commonly reported. Some problem types tended to „cluster‟
together. The clusters observed were similar to those reported from earlier surveys,
with a „family‟ problem cluster and broad „economic‟ related problem cluster most
noticeable.
Just over 10 per cent of problems reported through the 2010 CSJPS were
characterised by respondents as „legal‟ (despite all problems involving justiciable
issues), with 45 per cent being put down to „bad luck‟ or „part of life‟. Almost a third
of respondents had no understanding of their rights at the time they first experienced
problems, with a further one fifth having only a partial understanding. Of these
people, over half still had, at best, a partial understanding by the time of interview. In
addition, where respondents suggested knowing their rights, they frequently had
difficulty articulating them. Subjective understanding of rights was again most
frequently attributed to formal advice.
Respondents took no action to resolve 16 per cent of problems, an increase on
the 10 per cent reported in wave 1. Just under 30 per cent of problems saw people
obtain formal advice. Again, while this figure is lower than suggested by previous
surveys, the CSJPS survey was not limited to problems that were difficult to solve.
People dealt with problems entirely on their own on 40 per cent of occasions, a slight
decrease compared to wave 1.
Respondents sought advice for their problems from a wide range of advisers.
Solicitors were the most commonly used source of advice – although Citizens Advice
Bureaux, local councils and the police were also frequently used. Use of the Internet
for advice seeking was observed to have increased still further to 24 per cent of
problems. This continued the upward trend from 19 per cent in wave 1, 16 per cent in
the 2006-9 CSJS, and just 4 per cent in the 2001 CSJS.
The manner of conclusion of problems was, unsurprisingly, related to problem
resolution strategy. For example, those who obtained advice were more likely to see
their problem conclude through a formal process. This confirms earlier findings.

iv
Attitude to the justice system questions were not updated at wave 2. However,
at wave 1, only a small minority of respondents disagreed with the propositions that
courts are an important way for people to enforce their rights, or that they would
receive a fair hearing in court. There was some evidence that people who experience
more problems have less favourable views of the justice system. Those people who
used solicitors were more likely to regard them as affordable to people on low
incomes.
Respondents eligible for legal aid were more likely to report civil justice
problems and typically had a greater number of problems. Problems associated with
poverty were particularly pronounced. Unlike wave 1, inaction when faced with a
problem was no more common for wave 2 eligible respondents when compared to
ineligible respondents. However, eligible respondents did show a decreased rate of
handling problems alone and slight increase in the use of informal help to solve
problems when compared to ineligible respondents. Eligible respondents were also far
more likely to report negative consequences stemming from their problems.

1
1
Introduction to the Survey
We live in a „law-thick‟4 world, where the ability of people to make use of the law to
protect their legal rights and hold others to their legal responsibilities underpins the
rule of law, ensures social justice and helps address the problems of social exclusion.5
The English and Welsh Civil and Social Justice Panel Survey (CSJPS)
provides the only up-to-date and large-scale representative overview of the public‟s
experience of civil justice issues and successes in seeking justice when addressing
them.6 This overview report describes some summary findings from wave 2 of the
CSJPS. Full technical details are set out in the CSJPS wave 2 technical report7. The
aim of this report is to present headline findings from wave 2 of the CSJPS. Analysis
is in no way exhaustive and only touches upon some of the analyses made possible by
the longitudinal panel format. Researchers are invited to make use of CSJS and
CSJPS datasets, which are due to be made publicly available in due course8.
The English and Welsh Civil and Social Justice Panel Survey
The LSRC‟s English and Welsh Civil and Social Justice Panel Survey (CSJPS),
which replaced the English and Welsh Civil and Social Justice Survey (CSJS) in
2010, provides detailed information on the nature, pattern and impact of people‟s
4 Hadfield, G.K. (2010) Higher Demand, Lower Supply? A Comparative Assessment of the Legal
Landscape for Ordinary Americans. 31(1) Fordham Urban Law Journal:129-156. 5 Pleasence, P. (2006) Causes of Action: Civil Law and Social Justice, Norwich: TSO. See, also, Lord
Chancellor‟s Department (1998) Modernising Justice, London: HMSO (Cmd. 4155); Lord
Chancellor‟s Department and Law Centres Federation (2001) Legal and Advice Services: A Pathway
out of Social Exclusion, London: Lord Chancellor‟s Department; Department for Constitutional Affairs
and Law Centres Federation (2004) Legal and Advice Services: A Pathway to Regeneration, London:
Department for Constitutional Affairs; Department for Constitutional Affairs (2006) DCA
Departmental Report, Norwich: HMSO; Legal Services Commission (2007) Corporate Plan 2007/8-
2009/10, London: Legal Services Commission. 6 In England and Wales. For details of surveys conducted elsewhere in the world, see Pleasence, P.,
Balmer, N.J., and Sandefur, R.L. (2013) Paths to Justice: A Past, Present and Future Roadmap. 7 Cleary, A and Huskinson, T. (2012) The English and Welsh Civil and Social Justice Panel Survey –
Wave 2 Technical Report, London: Legal Services Commission. 8 For readers interested in carrying out analysis of either the CSJS or CSJPS, arrangements are being
made to make data and associated resources publicly available through the UK Data Archive (go to
http://data-archive.ac.uk/). It is expected that data will be accessible in spring 2013.

2
experience of civil justice (or „justiciable‟9) issues. It also represents the primary
source of general data on the strategies that users, and potential users, of law and legal
services employ in order to resolve their civil justice problems. The survey constitutes
a key method by which government is able to inform itself about the overall need for,
provision and quality of individual-oriented legal services. It is central to the
empirical base upon which access to justice, and broader civil justice policy, develops.
The CSJS was first conducted in 2001, then again in 2004 and, from 2006 to
2009, on a continuous basis; meaning that fieldwork was conducted every month of
every year. From 2010 the survey moved to a longitudinal format, with a panel of
respondents interviewed, for the first time, between June and October. The panel
survey allows unconcluded problems to be followed up, providing better insight into
the development of problem resolution behaviour over time, more accurate ordering
of life events, and the accumulation of more extensive demographic data. Set against
this, the panel survey introduces the possibility of conditioning effects and involves a
smaller sample size. The second wave of interviews took place in Winter 2011.
In terms of detail, the CSJPS is the most extensive survey of its kind so far
undertaken worldwide. The survey has its distant origins in surveys of „legal need‟
undertaken during the recession in the United States‟ in the 1930s.10
Its more recent
origins, though, are in the Paths to Justice surveys, carried out in England and
Scotland in the late 1990s11
and, of course, the cross-sectional CSJS. However, the
CSJPS represents a substantial departure from the cross-sectional CSJS in content,
structure and conduct. The questionnaire (written by Pascoe Pleasence and Nigel
Balmer) is available in the survey technical report.
All respondents to the first wave of the CSJPS completed a general interview,
in which they were asked if they had experienced „a problem‟ in the preceding 18
months in each of 15 distinct civil justice problem categories: consumer; employment;
neighbours; owned housing; rented housing; money; debt; welfare benefits; divorce;
9 „A matter experienced by a respondent which raised legal issues, whether or not it was recognised by
the respondent as being “legal” and whether or not any action taken by the respondent to deal with the
[matter] involved the use of any part of the civil justice system‟: H. Genn (1999) Paths to Justice: What
People Do and Think About Going to Law, Oxford: Hart Publishing, p.12. 10
C. Clark and E. Corstvet (1938) The Lawyer and the Public: An A.A.L.S. Survey, 47 Yale Law
Journal, p.1972. For a history, see P. Pleasence et al. (2001), above, n.19, pp.7-27, and Kritzer, H.M
(2009) Empirical Legal Studies Before 1940: A Bibliographic Essay. 6(4) Journal of Empirical Legal
Studies, pp.925-968. 11
H. Genn (1999) Paths to Justice: What People Think and Do About Going to Law, Oxford: Hart; H.
Genn and A. Paterson (2001) Paths to Justice Scotland: What People in Scotland Think and Do About
Going to Law, Oxford: Hart.

3
problems ancillary to relationship breakdown; domestic violence; education; care
proceedings; personal injury, and clinical negligence. To assist recall and to allow
some assessment of the relative incidence of the different types of problem falling
within these categories, respondents were presented with „show cards‟ setting out
detailed lists of constituent problems, and respondents were asked to indicate which of
them, if any, matched their own problems. So, for example, constituent problems
relating to employment included unfavourable changes being made to terms and
conditions of employment, the work environment being unsatisfactory or dangerous,
and being sacked or made redundant. Problems relating to rented housing included
difficulties in getting a landlord to make repairs, difficulties in obtaining repayment of
a deposit and eviction. Full details are set out in the technical report.
Respondents to the survey were also asked whether they had been a victim of
crime during the survey reference period, or whether they had had any contact with
the police in the previous 12 months.
For up to three problems12
(selected at random, if more than three problems
had been experienced), respondents were asked about problem resolution strategies,
advisers consulted, formal dispute resolution processes, how and when problems
concluded, the causes and consequences of problems and understanding of rights. All
respondents were also asked for an extensive range of details about themselves and
the household in which they resided.
If respondents reported at least one problem in the general interview, they
progressed to a follow-up interview, which addressed, in depth, the strategy adopted
to resolve a single (random) problem.
All interviews were conducted face-to-face in respondents‟ own homes and
were arranged and conducted by Ipsos MORI. 3,911 adults were included in the
survey (at wave 2), drawn from a random selection of 3,335 residential household
addresses across 194 postcode sectors of England and Wales. Sixty-one per cent of
adult household members (16 years of age or over) were interviewed. The household
response rate was 88 per cent, and the cumulative eligible adult response rate was 54
per cent. This compares to response rates of 52 per cent, 57 per cent and 58 per cent in
2001, 2004 and 2006-9 respectively. Of 3,806 completed interviews 111 were
completed by proxy (3 per cent), a reduction from the 12 per cent in the 2006-08
12
Identifying one or more problem subcategory within the problem categories identified in Table 1
would count as a single problem.

4
CSJS. Detailed information on composition of the sample and response rates is set out
in the technical report.
There were 3,911 adult respondents interviewed at wave 2, aged 16 years and
above. 2,604 of these had been interviewed at wave 1. Of the remainder, 148 were
resident in a household surveyed at wave 1, but not interviewed until wave 2, 96 were
new residents in a household surveyed at wave 1 and 1,063 were new respondents
from new households. The survey was broadly representative of the adult residential
household population of England and Wales, which comprises around 98 per cent of
the total population.
Limitations of The Civil And Social Justice Panel Survey Sample Frame
As the Civil and Social Justice Survey draws on a sample of residential addresses
taken from the small user Postcode Address File (PAF) – as is standard in large scale
national probability sample surveys – some sections of the population fall outside its
sample frame. In total these populations account for around 2 per cent of the overall
population. However, some of these populations are particularly vulnerable in their
nature and can be expected to experience civil justice in a different way to the general
population. While the experience of people who share many of the characteristics of
such „out of sample‟ populations will be captured by the CSJPS, and will cast good
light on what the experience of „out of sample‟ populations is likely to be like, it is
important to bear this limitation of the survey in mind when considering its findings.
The two largest population groups that fall outside of the survey‟s sample
frame are elderly people in residential care and students living in education
establishments, such as halls of residence. The 2001 Census recorded that more than
320,000 people over the age of 60 were living on communal medical and care
establishments, as were a further 70,000 people under the age of 60. Of these, around
15,000 people would have been patients involuntarily detained in hospitals under the
Mental Health Act 1983 and other legislation. The 2001 Census also recorded that
more than 200,000 students were living in communal establishments. As Edwards and
Fontana have described, the experience of civil justice problems of groups such as

5
older people in care are likely to be quite different from people in the general
population.13
Two other large population groups living within communal establishments
falling outside the survey‟s sample frame are prisoners and military personnel living
in defence establishments. Around the time of the fieldwork for the first phase of the
CSJPS, just over 85,000 people were detained in prisons in England and Wales. 14
The
2001 Census also recorded just under 50,000 military personnel living in defence
establishments.15
Again, the experience of prisoners and military personnel living in
defence establishments is likely to be different from the general population. Both
populations are relatively young, and the prison population in particular, is
characteristic of core socially excluded groups.
There are around 55,000 people living in local authority provided temporary
accommodation in England and Wales.16
In England, a further 500 people are
reported by the Government to sleep rough on the streets, although there are problems
in counting „non-visible‟ rough sleepers.17
Although people in temporary
accommodation often fall outside the Civil and Social Justice Survey sample frame, in
this instance we have a better idea of their experience of civil justice problems, as a
result of the Legal Services Research Centre‟s 2001 survey of people living in
temporary accommodation18
. Those people not living in hostels, refuges or bed and
breakfast accommodation live in self-contained private sector or social housing and
will generally fall into the survey sample frame.
In addition to the above, there are also around 2,000 bed spaces in immigration
detention centres.
A large non-communal establishment population falling outside of the Civil
and Social Justice Survey‟s sample frame are Gypsies/travellers. It is believed that the
majority of Gypsies/travellers live in conventional housing (contained within the
13
Edwards, S. and Fontana, A. (2004) The Legal Information Needs of Older People, Sydney: Law and
Justice Foundation of New South Wales. 14
HM Prison Service (2010) Population Bulletin – Weekly 4 July 2010. London: Ministry of Justice. 15
Bajekal, M., Wheller, L and Dix, D. (2006) Estimating Residents and Staff in Communal
Establishments from the 2001 Census, London: Office for National Statistics. 16
Department of Communities and Local Government (2010) Statistical Release: Statutory
Homelessness, 4th
Quarter 2009, England. London: DCLG; Statistics for Wales (2010) Homelessness,
July to September 2009, Cardiff: Welsh Assembly Government. 17
Department of Communities and Local Government (2007) Rough Sleeping England, Total Street
Count 2009. London: DCLG. A small number of people will also sleep rough in Wales. 18
Pleasence, P., Buck, A., Balmer, N.J., O‟Grady, A., Genn, H., and Smith, M. (2004) Causes of
Action: Civil Law and Social Justice. Norwich: TSO.

6
CSJPS sample frame). However, of the approximately 300,000 Gypsies/travellers
living in England and Wales19
between 90,000 and 140,000 are thought to live in
caravans.20
Population estimates concerning Gypsies/Travellers are recognised as
being deficient and prone to error.21
In addition, there are an unquantifiable number of „hidden‟ members of the
population, such as some immigrants, without an appropriate visa, who live in non-
standard accommodation in England and Wales.
As well as population groups that fall outside the survey sample frame, there
are those people who live in accommodation within the sample frame, but who choose
not to participate in the survey. Also, there are other populations that, by virtue of
their size relative to the population as a whole, are difficult to study through the
survey. For example, well under one per of the population of England and Wales live
in sparsely populated rural areas.22
Similarly, while 12.5 per cent of people in the
2001 Census were Black or Minority Ethnic (BME), this figure masks tremendous
ethnic diversity within the 12.5 per cent. Thus, although the Civil and Social Justice
Panel Survey covers a sizeable number of BME respondents, important patterns of
experience can be missed if they relate to small and specific BME populations.23
Finally, while provision is made for the CSJPS to be conducted in Welsh in
Wales, not all languages spoken within England and Wales can be catered for. A
small number of people each year (less than 1 per cent) cannot be interviewed as a
result.
Structure of the Report
19
R. Morris & L. Clements (2002) At What Cost? The economics of Gypsy and Traveller
encampments. Bristol: Policy Press. 20
Niner, P.M. (2002) The Provision and Condition of Local Authority Gypsy/Traveller Sites in
England. London: Office of the Deputy Prime Minister; Niner, P. (2006) The accommodation needs of
Gypsy-Travellers in Wales. Cardiff: National Assembly for Wales 21
Niner, P.M. (2004) Counting Gypsies & Travellers: A Review of the Gypsy Caravan Count System.
London: Office of the Deputy Prime Minister. 22
2001 Census. 23
O'Grady, A., Balmer, N.J., Carter, B., Pleasence, P., Buck, A. and Genn, H. (2005) Institutional
Racism and Civil Justice, 28(4) Ethnic and Racial Studies, 620-628.
7
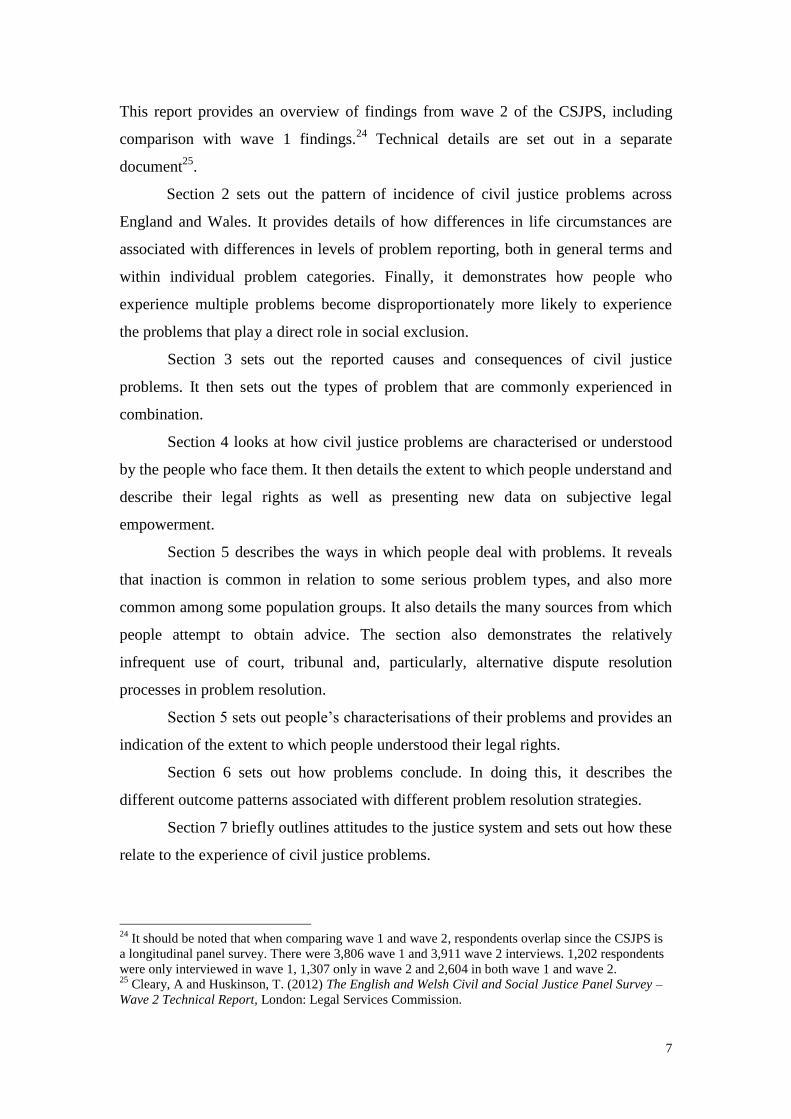
This report provides an overview of findings from wave 2 of the CSJPS, including
comparison with wave 1 findings.24
Technical details are set out in a separate
document25
.
Section 2 sets out the pattern of incidence of civil justice problems across
England and Wales. It provides details of how differences in life circumstances are
associated with differences in levels of problem reporting, both in general terms and
within individual problem categories. Finally, it demonstrates how people who
experience multiple problems become disproportionately more likely to experience
the problems that play a direct role in social exclusion.
Section 3 sets out the reported causes and consequences of civil justice
problems. It then sets out the types of problem that are commonly experienced in
combination.
Section 4 looks at how civil justice problems are characterised or understood
by the people who face them. It then details the extent to which people understand and
describe their legal rights as well as presenting new data on subjective legal
empowerment.
Section 5 describes the ways in which people deal with problems. It reveals
that inaction is common in relation to some serious problem types, and also more
common among some population groups. It also details the many sources from which
people attempt to obtain advice. The section also demonstrates the relatively
infrequent use of court, tribunal and, particularly, alternative dispute resolution
processes in problem resolution.
Section 5 sets out people‟s characterisations of their problems and provides an
indication of the extent to which people understood their legal rights.
Section 6 sets out how problems conclude. In doing this, it describes the
different outcome patterns associated with different problem resolution strategies.
Section 7 briefly outlines attitudes to the justice system and sets out how these
relate to the experience of civil justice problems.
24
It should be noted that when comparing wave 1 and wave 2, respondents overlap since the CSJPS is
a longitudinal panel survey. There were 3,806 wave 1 and 3,911 wave 2 interviews. 1,202 respondents
were only interviewed in wave 1, 1,307 only in wave 2 and 2,604 in both wave 1 and wave 2. 25
Cleary, A and Huskinson, T. (2012) The English and Welsh Civil and Social Justice Panel Survey –
Wave 2 Technical Report, London: Legal Services Commission.

8
Section 8 provides an overview of the experience of civil justice problems on
the basis of legal aid eligibility.
Comparisons between wave 1 and wave 2 results are made throughout the
report.

9
2
The Incidence of Civil Justice Problems
This section sets out the pattern of experience of civil justice problems across England
and Wales. It provides a detailed account of the different rates of problem incidence
associated with differently constituted population groups, both in general terms and
within individual problem categories. It then describes the distribution of civil justice
problems among those who reported having experienced multiple problems.
The Incidence of Civil Justice Problems
Thirty-two per cent of wave two respondents (1,265 of 3,911) reported having
experienced one or more civil justice problem over the past eighteen months26
. This
was broadly in line with previous findings from the CSJS/CSJPS (e.g. 33 per cent in
wave one of the CSJPS, 36 per cent in the 2006-9 and 33 per cent in the 2004
CSJS)27
. As with the surveys carried out in England and Wales in previous years, and
elsewhere in the world, certain problems were reported much more prevalent than
others. Table 1 shows incidence of each of the broad problem types in the survey,
contrasting wave 1 and wave 2. As can be seen in Table 1, percentages of respondents
reporting each problem type was broadly comparable28
between wave 1 and wave 2.
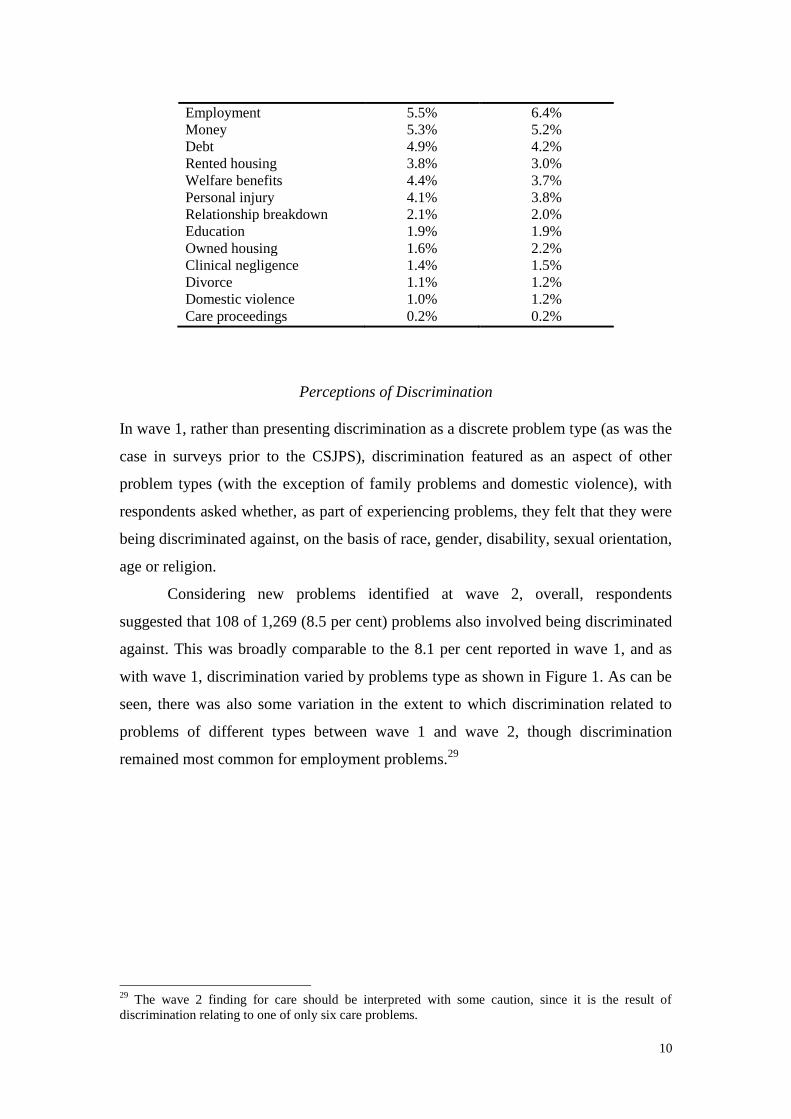
Table 1. Prevalence of civil justice problems of different types in wave 1 and wave 2.
Wave 1
(n = 3,806)
Wave 2
(n = 3,911)
Problem type % respondents % respondents
Neighbours 9.4% 8.4%
Consumer 8.9% 8.2%
26
Including new problems reported at wave 2, as well as problems „fed forward‟ from wave 1. 27
Despite the apparent consistency in problem experience over time, caution should be taken when
comparing findings from the CSJPS with earlier, pre-panel surveys due to changes in methodology.
Indeed, one would have expected a lower rate of problem experience in this latest survey due to the
comparably shorter reference period compared to the CSJS (both waves 1 and 2 of the CSJPS explored
problems experienced in the 18 months preceding the interview where as the CSJS used a three and a
half year reference period). One possible reason for the higher than expected rate of problem
experience may, in part, be a result changes to the survey questionnaire with regards to problem
identification and characterisation, with pre-panel survey respondents being asked about problems that
„were difficult to solve‟, a phrase removed from the CSJPS. 28
Though it should be noted that this report does not involve formal statistical analysis.
10
Employment 5.5% 6.4%
Money 5.3% 5.2%
Debt 4.9% 4.2%
Rented housing 3.8% 3.0%
Welfare benefits 4.4% 3.7%
Personal injury 4.1% 3.8%
Relationship breakdown 2.1% 2.0%
Education 1.9% 1.9%
Owned housing 1.6% 2.2%
Clinical negligence 1.4% 1.5%
Divorce 1.1% 1.2%
Domestic violence 1.0% 1.2%
Care proceedings 0.2% 0.2%
Perceptions of Discrimination
In wave 1, rather than presenting discrimination as a discrete problem type (as was the
case in surveys prior to the CSJPS), discrimination featured as an aspect of other
problem types (with the exception of family problems and domestic violence), with
respondents asked whether, as part of experiencing problems, they felt that they were
being discriminated against, on the basis of race, gender, disability, sexual orientation,
age or religion.
Considering new problems identified at wave 2, overall, respondents
suggested that 108 of 1,269 (8.5 per cent) problems also involved being discriminated
against. This was broadly comparable to the 8.1 per cent reported in wave 1, and as
with wave 1, discrimination varied by problems type as shown in Figure 1. As can be
seen, there was also some variation in the extent to which discrimination related to
problems of different types between wave 1 and wave 2, though discrimination
remained most common for employment problems.29
29
The wave 2 finding for care should be interpreted with some caution, since it is the result of
discrimination relating to one of only six care problems.

11
0 5 10 15 20 25
Employment
Clinical negligence
Rented housing
Education
Neighbours
Personal injury
Benefits
Consumer
Money
Debt
Owned housing
Care
% problems
Wave 1
Wave 2
Figure 1. Percentage of problems of each type where respondents felt they were also
discriminated against in wave 1 and wave 2 (new problems)
Considering all new wave 2 problems, as with wave 1, age discrimination was most
common (47 of 1,296; 3.7 per cent) followed by discrimination on the basis of
disability (29 of 1,296; 2.3 per cent), gender (23 of 1,296; 1.8 per cent), race (14 of
1,296; 1.1 per cent), sexual orientation (2 of 1,296; 0.2 per cent) and religion (3 of
1,296; 0.2 per cent).
The Distribution of Justiciable Problems
Although around one-third of wave 2 survey respondents reported one or more
justiciable problems, the experience of problems was far from randomly distributed
across the survey populations. As with wave 1 and previous surveys, certain
population groups reported certain types of problem more often.
The general incidence of problems among differently constituted population
groups is set out in Table 2. As was observed in wave 1 and previously,30
people
vulnerable to social exclusion (e.g. lone parents, those on benefits, those who have a
long-term illness or disability and victims of crime) were more likely to report
30
Pleasence, P. (2006) Causes of Action: Civil Law and Social Justice, Norwich: TSO, Chapter 2.

12
problems than other groups. The association between consumer problems and
affluence also results in higher income respondents reporting problems more
frequently.
The incidence of problems of different types among differently constituted
population groups is set out in Tables 3 to 17.

13
Table 2. General Problem Incidence by Respondent Characteristics (wave 2)
1458 67.3% 707 32.7%
1188 68.0% 558 32.0%
2282 66.9% 1130 33.1%
46 68.7% 21 31.3%
138 78.4% 38 21.6%
60 69.8% 26 30.2%
82 68.3% 38 31.7%
927 73.1% 341 26.9%
779 66.9% 385 33.1%
529 59.8% 356 40.2%
221 62.1% 135 37.9%
609 69.6% 266 30.4%
2037 67.1% 999 32.9%
380 62.9% 224 37.1%
1101 73.2% 403 26.8%
68 41.2% 97 58.8%
891 70.5% 372 29.5%
51 45.9% 60 54.1%
155 58.7% 109 41.3%
1096 76.1% 344 23.9%
754 63.3% 437 36.7%
381 62.2% 232 37.8%
205 54.5% 171 45.5%
201 71.5% 80 28.5%
1987 68.7% 907 31.3%
659 64.8% 358 35.2%
2386 72.0% 929 28.0%
260 43.6% 336 56.4%
843 76.4% 261 23.6%
1803 64.2% 1004 35.8%
2502 68.6% 1146 31.4%
144 54.8% 119 45.2%
248 67.9% 117 32.1%
308 64.6% 169 35.4%
339 55.4% 273 44.6%
644 61.8% 398 38.2%
722 75.8% 230 24.2%
371 83.9% 71 16.1%
811 68.6% 371 31.4%
1336 65.2% 713 34.8%
94 59.5% 64 40.5%
405 77.6% 117 22.4%
31
Own or have regular use of motorised transport.

14
Table 3. Incidence of Consumer Problems by Respondent Characteristics (wave 2)
2005 92.6% 160 7.4%
1586 90.8% 160 9.2%
3126 91.6% 286 8.4%
62 92.5% 5 7.5%
164 93.2% 12 6.8%
81 94.2% 5 5.8%
115 95.8% 5 4.2%
1156 91.2% 112 8.8%
1067 91.7% 97 8.3%
807 91.2% 78 8.8%
336 94.4% 20 5.6%
836 95.5% 39 4.5%
2755 90.7% 281 9.3%
544 90.1% 60 9.9%
1374 91.4% 130 8.6%
153 92.7% 12 7.3%
1187 94.0% 76 6.0%
101 91.0% 10 9.0%
232 87.9% 32 12.1%
1318 91.5% 122 8.5%
1059 88.9% 132 11.1%
585 95.4% 28 4.6%
354 94.1% 22 5.9%
265 94.3% 16 5.7%
2659 91.9% 235 8.1%
932 91.6% 85 8.4%
3058 92.2% 257 7.8%
533 89.4% 63 10.6%
1055 95.6% 49 4.4%
2536 90.3% 271 9.7%
3343 91.6% 305 8.4%
248 94.3% 15 5.7%
345 94.5% 20 5.5%
440 92.2% 37 7.8%
551 90.0% 61 10.0%
929 89.2% 113 10.8%
888 93.3% 64 6.7%
417 94.3% 25 5.7%
1117 94.5% 65 5.5%
1852 90.4% 197 9.6%
135 85.4% 23 14.6%
487 93.3% 35 6.7%

15
Table 4. Incidence of Employment Problems by Respondent Characteristics (wave 2)
2028 93.7% 137 6.3%
1634 93.6% 112 6.4%
3192 93.6% 220 6.4%
63 94.0% 4 6.0%
165 93.8% 11 6.3%
82 95.3% 4 4.7%
113 94.2% 7 5.8%
1204 95.0% 64 5.0%
1075 92.4% 89 7.6%
819 92.5% 66 7.5%
332 93.3% 24 6.7%
842 96.2% 33 3.8%
2820 92.9% 216 7.1%
550 91.1% 54 8.9%
1421 94.5% 83 5.5%
153 92.7% 12 7.3%
1203 95.2% 60 4.8%
100 90.1% 11 9.9%
235 89.0% 29 11.0%
1395 96.9% 45 3.1%
1067 89.6% 124 10.4%
581 94.8% 32 5.2%
347 92.3% 29 7.7%
262 93.2% 19 6.8%
2705 93.5% 189 6.5%
957 94.1% 60 5.9%
3147 94.9% 168 5.1%
515 86.4% 81 13.6%
1079 97.7% 25 2.3%
2583 92.0% 224 8.0%
3416 93.6% 232 6.4%
246 93.5% 17 6.5%
340 93.2% 25 6.8%
437 91.6% 40 8.4%
557 91.0% 55 9.0%
933 89.5% 109 10.5%
935 98.2% 17 1.8%
442 100.0% 0 0.0%
1127 95.3% 55 4.7%
1886 92.0% 163 8.0%
146 92.4% 12 7.6%
503 96.4% 19 3.6%

16
Table 5. Incidence of Neighbours Problems by Respondent Characteristics (wave 2)
1958 90.4% 207 9.6%
1623 93.0% 123 7.0%
3116 91.3% 296 8.7%
61 91.0% 6 9.0%
169 96.0% 7 4.0%
79 91.9% 7 8.1%
107 89.2% 13 10.8%
1207 95.2% 61 4.8%
1074 92.3% 90 7.7%
770 87.0% 115 13.0%
304 85.4% 52 14.6%
788 90.1% 87 9.9%
2793 92.0% 243 8.0%
556 92.1% 48 7.9%
1404 93.4% 100 6.6%
134 81.2% 31 18.8%
1158 91.7% 105 8.3%
92 82.9% 19 17.1%
237 89.8% 27 10.2%
1364 94.7% 76 5.3%
1092 91.7% 99 8.3%
517 84.3% 96 15.7%
333 88.6% 43 11.4%
265 94.3% 16 5.7%
2676 92.5% 218 7.5%
905 89.0% 112 11.0%
3089 93.2% 226 6.8%
492 82.6% 104 17.4%
1032 93.5% 72 6.5%
2549 90.8% 258 9.2%
3358 92.1% 290 7.9%
223 84.8% 40 15.2%
328 89.9% 37 10.1%
436 91.4% 41 8.6%
541 88.4% 71 11.6%
944 90.6% 98 9.4%
888 93.3% 64 6.7%
427 96.6% 15 3.4%
1064 90.0% 118 10.0%
1877 91.6% 172 8.4%
148 93.7% 10 6.3%
492 94.3% 30 5.7%

17
Table 6. Incidence of Owned Housing Problems by Respondent Characteristics (wave 2)
2122 98.0% 43 2.0%
1704 97.6% 42 2.4%
3330 97.6% 82 2.4%
67 100.0% 0 0.0%
176 100.0% 0 0.0%
86 100.0% 0 0.0%
119 99.2% 1 .8%
1239 97.7% 29 2.3%
1131 97.2% 33 2.8%
874 98.8% 11 1.2%
346 97.2% 10 2.8%
869 99.3% 6 .7%
2957 97.4% 79 2.6%
585 96.9% 19 3.1%
1468 97.6% 36 2.4%
161 97.6% 4 2.4%
1247 98.7% 16 1.3%
109 98.2% 2 1.8%
256 97.0% 8 3.0%
1408 97.8% 32 2.2%
1147 96.3% 44 3.7%
610 99.5% 3 .5%
370 98.4% 6 1.6%
281 100.0% 0 0.0%
2827 97.7% 67 2.3%
999 98.2% 18 1.8%
3249 98.0% 66 2.0%
577 96.8% 19 3.2%
1091 98.8% 13 1.2%
2735 97.4% 72 2.6%
3568 97.8% 80 2.2%
258 98.1% 5 1.9%
362 99.2% 3 .8%
469 98.3% 8 1.7%
592 96.7% 20 3.3%
1015 97.4% 27 2.6%
931 97.8% 21 2.2%
436 98.6% 6 1.4%
1172 99.2% 10 .8%
1995 97.4% 54 2.6%
141 89.2% 17 10.8%
518 99.2% 4 .8%

18
Table 7. Incidence of Rented Housing Problems by Respondent Characteristics (wave 2)
2089 96.5% 76 3.5%
1705 97.7% 41 2.3%
3317 97.2% 95 2.8%
62 92.5% 5 7.5%
174 98.9% 2 1.1%
78 90.7% 8 9.3%
114 95.0% 6 5.0%
1259 99.3% 9 .7%
1138 97.8% 26 2.2%
844 95.4% 41 4.6%
320 89.9% 36 10.1%
824 94.2% 51 5.8%
2970 97.8% 66 2.2%
587 97.2% 17 2.8%
1492 99.2% 12 .8%
147 89.1% 18 10.9%
1220 96.6% 43 3.4%
100 90.1% 11 9.9%
248 93.9% 16 6.1%
1437 99.8% 3 .2%
1185 99.5% 6 .5%
551 89.9% 62 10.1%
332 88.3% 44 11.7%
279 99.3% 2 .7%
2824 97.6% 70 2.4%
970 95.4% 47 4.6%
3246 97.9% 69 2.1%
548 91.9% 48 8.1%
1072 97.1% 32 2.9%
2722 97.0% 85 3.0%
3561 97.6% 87 2.4%
233 88.6% 30 11.4%
340 93.2% 25 6.8%
453 95.0% 24 5.0%
585 95.6% 27 4.4%
1012 97.1% 30 2.9%
945 99.3% 7 .7%
439 99.3% 3 .7%
1131 95.7% 51 4.3%
1991 97.2% 58 2.8%
158 100.0% 0 0.0%
514 98.5% 8 1.5%

19
Table 8. Incidence of Money Problems by Respondent Characteristics (wave 2)
2062 95.2% 103 4.8%
1647 94.3% 99 5.7%
3234 94.8% 178 5.2%
63 94.0% 4 6.0%
171 97.2% 5 2.8%
78 90.7% 8 9.3%
115 95.8% 5 4.2%
1210 95.4% 58 4.6%
1101 94.6% 63 5.4%
828 93.6% 57 6.4%
338 94.9% 18 5.1%
847 96.8% 28 3.2%
2862 94.3% 174 5.7%
578 95.7% 26 4.3%
1430 95.1% 74 4.9%
155 93.9% 10 6.1%
1200 95.0% 63 5.0%
100 90.1% 11 9.9%
246 93.2% 18 6.8%
1380 95.8% 60 4.2%
1113 93.5% 78 6.5%
588 95.9% 25 4.1%
348 92.6% 28 7.4%
271 96.4% 10 3.6%
2752 95.1% 142 4.9%
957 94.1% 60 5.9%
3175 95.8% 140 4.2%
534 89.6% 62 10.4%
1070 96.9% 34 3.1%
2639 94.0% 168 6.0%
3464 95.0% 184 5.0%
245 93.2% 18 6.8%
352 96.4% 13 3.6%
453 95.0% 24 5.0%
573 93.6% 39 6.4%
972 93.3% 70 6.7%
901 94.6% 51 5.4%
438 99.1% 4 .9%
1130 95.6% 52 4.4%
1931 94.2% 118 5.8%
143 90.5% 15 9.5%
505 96.7% 17 3.3%

20
Table 9. Incidence of Debt Problems by Respondent Characteristics (wave 2)
2082 96.2% 83 3.8%
1663 95.2% 83 4.8%
3264 95.7% 148 4.3%
64 95.5% 3 4.5%
171 97.2% 5 2.8%
83 96.5% 3 3.5%
115 95.8% 5 4.2%
1242 97.9% 26 2.1%
1111 95.4% 53 4.6%
821 92.8% 64 7.2%
337 94.7% 19 5.3%
818 93.5% 57 6.5%
2927 96.4% 109 3.6%
586 97.0% 18 3.0%
1466 97.5% 38 2.5%
141 85.5% 24 14.5%
1202 95.2% 61 4.8%
96 86.5% 15 13.5%
254 96.2% 10 3.8%
1425 99.0% 15 1.0%
1149 96.5% 42 3.5%
550 89.7% 63 10.3%
343 91.2% 33 8.8%
268 95.4% 13 4.6%
2788 96.3% 106 3.7%
957 94.1% 60 5.9%
3219 97.1% 96 2.9%
526 88.3% 70 11.7%
1059 95.9% 45 4.1%
2686 95.7% 121 4.3%
3519 96.5% 129 3.5%
226 85.9% 37 14.1%
347 95.1% 18 4.9%
453 95.0% 24 5.0%
571 93.3% 41 6.7%
979 94.0% 63 6.0%
933 98.0% 19 2.0%
442 100.0% 0 0.0%
1109 93.8% 73 6.2%
1968 96.0% 81 4.0%
155 98.1% 3 1.9%
513 98.3% 9 1.7%

21
Table 10. Incidence of Welfare Benefits Problems by Respondent Characteristics (wave 2)
2089 96.5% 76 3.5%
1677 96.0% 69 4.0%
3285 96.3% 127 3.7%
64 95.5% 3 4.5%
175 99.4% 1 .6%
79 91.9% 7 8.1%
114 95.0% 6 5.0%
1234 97.3% 34 2.7%
1126 96.7% 38 3.3%
842 95.1% 43 4.9%
336 94.4% 20 5.6%
839 95.9% 36 4.1%
2927 96.4% 109 3.6%
579 95.9% 25 4.1%
1474 98.0% 30 2.0%
150 90.9% 15 9.1%
1213 96.0% 50 4.0%
99 89.2% 12 10.8%
251 95.1% 13 4.9%
1413 98.1% 27 1.9%
1153 96.8% 38 3.2%
573 93.5% 40 6.5%
347 92.3% 29 7.7%
270 96.1% 11 3.9%
2812 97.2% 82 2.8%
954 93.8% 63 6.2%
3222 97.2% 93 2.8%
544 91.3% 52 8.7%
1077 97.6% 27 2.4%
2689 95.8% 118 4.2%
3528 96.7% 120 3.3%
238 90.5% 25 9.5%
345 94.5% 20 5.5%
455 95.4% 22 4.6%
580 94.8% 32 5.2%
996 95.6% 46 4.4%
933 98.0% 19 2.0%
438 99.1% 4 .9%
1126 95.3% 56 4.7%
1976 96.4% 73 3.6%
156 98.7% 2 1.3%
508 97.3% 14 2.7%

22
Table 11. Incidence of Education Problems by Respondent Characteristics (wave 2)
2114 97.6% 51 2.4%
1723 98.7% 23 1.3%
3343 98.0% 69 2.0%
66 98.5% 1 1.5%
175 99.4% 1 .6%
85 98.8% 1 1.2%
119 99.2% 1 .8%
1249 98.5% 19 1.5%
1143 98.2% 21 1.8%
857 96.8% 28 3.2%
351 98.6% 5 1.4%
865 98.9% 10 1.1%
2972 97.9% 64 2.1%
563 93.2% 41 6.8%
1501 99.8% 3 .2%
148 89.7% 17 10.3%
1259 99.7% 4 .3%
106 95.5% 5 4.5%
260 98.5% 4 1.5%
1432 99.4% 8 .6%
1159 97.3% 32 2.7%
592 96.6% 21 3.4%
363 96.5% 13 3.5%
281 100.0% 0 0.0%
2843 98.2% 51 1.8%
994 97.7% 23 2.3%
3264 98.5% 51 1.5%
573 96.1% 23 3.9%
1087 98.5% 17 1.5%
2750 98.0% 57 2.0%
3583 98.2% 65 1.8%
254 96.6% 9 3.4%
363 99.5% 2 .5%
461 96.6% 16 3.4%
573 93.6% 39 6.4%
1026 98.5% 16 1.5%
951 99.9% 1 .1%
442 100.0% 0 0.0%
1160 98.1% 22 1.9%
2008 98.0% 41 2.0%
151 95.6% 7 4.4%
518 99.2% 4 .8%

23
Table 12. Incidence of Personal Injury by Respondent Characteristics (wave 2)
2083 96.2% 82 3.8%
1679 96.2% 67 3.8%
3277 96.0% 135 4.0%
65 97.0% 2 3.0%
176 100.0% 0 0.0%
84 97.7% 2 2.3%
114 95.0% 6 5.0%
1234 97.3% 34 2.7%
1117 96.0% 47 4.0%
840 94.9% 45 5.1%
346 97.2% 10 2.8%
845 96.6% 30 3.4%
2917 96.1% 119 3.9%
586 97.0% 18 3.0%
1455 96.7% 49 3.3%
157 95.2% 8 4.8%
1208 95.6% 55 4.4%
104 93.7% 7 6.3%
252 95.5% 12 4.5%
1383 96.0% 57 4.0%
1146 96.2% 45 3.8%
599 97.7% 14 2.3%
356 94.7% 20 5.3%
268 95.4% 13 4.6%
2797 96.6% 97 3.4%
965 94.9% 52 5.1%
3217 97.0% 98 3.0%
545 91.4% 51 8.6%
1071 97.0% 33 3.0%
2691 95.9% 116 4.1%
3506 96.1% 142 3.9%
256 97.3% 7 2.7%
353 96.7% 12 3.3%
458 96.0% 19 4.0%
584 95.4% 28 4.6%
1000 96.0% 42 4.0%
916 96.2% 36 3.8%
430 97.3% 12 2.7%
1141 96.5% 41 3.5%
1962 95.8% 87 4.2%
153 96.8% 5 3.2%
506 96.9% 16 3.1%

24
Table 13. Incidence of Clinical Negligence by Respondent Characteristics (wave 2)
2129 98.3% 36 1.7%
1722 98.6% 24 1.4%
3358 98.4% 54 1.6%
66 98.5% 1 1.5%
176 100.0% 0 0.0%
85 98.8% 1 1.2%
117 97.5% 3 2.5%
1258 99.2% 10 .8%
1148 98.6% 16 1.4%
868 98.1% 17 1.9%
343 96.3% 13 3.7%
851 97.3% 24 2.7%
3000 98.8% 36 1.2%
595 98.5% 9 1.5%
1491 99.1% 13 .9%
163 98.8% 2 1.2%
1231 97.5% 32 2.5%
109 98.2% 2 1.8%
262 99.2% 2 .8%
1430 99.3% 10 .7%
1175 98.7% 16 1.3%
595 97.1% 18 2.9%
366 97.3% 10 2.7%
275 97.9% 6 2.1%
2865 99.0% 29 1.0%
986 97.0% 31 3.0%
3281 99.0% 34 1.0%
570 95.6% 26 4.4%
1094 99.1% 10 .9%
2757 98.2% 50 1.8%
3598 98.6% 50 1.4%
253 96.2% 10 3.8%
354 97.0% 11 3.0%
472 99.0% 5 1.0%
596 97.4% 16 2.6%
1028 98.7% 14 1.3%
941 98.8% 11 1.2%
439 99.3% 3 .7%
1158 98.0% 24 2.0%
2016 98.4% 33 1.6%
156 98.7% 2 1.3%
521 99.8% 1 .2%

25
Table 14. Incidence of Divorce Problems by Respondent Characteristics (wave 2)
2134 98.6% 31 1.4%
1731 99.1% 15 .9%
3375 98.9% 37 1.1%
66 98.5% 1 1.5%
175 99.4% 1 .6%
85 98.8% 1 1.2%
116 96.7% 4 3.3%
1258 99.2% 10 .8%
1153 99.1% 11 .9%
868 98.1% 17 1.9%
351 98.6% 5 1.4%
864 98.7% 11 1.3%
3001 98.8% 35 1.2%
602 99.7% 2 .3%
1498 99.6% 6 .4%
154 93.3% 11 6.7%
1248 98.8% 15 1.2%
108 97.3% 3 2.7%
255 96.6% 9 3.4%
1434 99.6% 6 .4%
1170 98.2% 21 1.8%
609 99.3% 4 .7%
362 96.3% 14 3.7%
280 99.6% 1 .4%
2858 98.8% 36 1.2%
1007 99.0% 10 1.0%
3286 99.1% 29 .9%
579 97.1% 17 2.9%
1094 99.1% 10 .9%
2771 98.7% 36 1.3%
3613 99.0% 35 1.0%
252 95.8% 11 4.2%
362 99.2% 3 .8%
470 98.5% 7 1.5%
599 97.9% 13 2.1%
1028 98.7% 14 1.3%
943 99.1% 9 .9%
442 100.0% 0 0.0%
1172 99.2% 10 .8%
2018 98.5% 31 1.5%
156 98.7% 2 1.3%
519 99.4% 3 .6%

26
Table 15. Incidence of Relationship Breakdown Problems by Respondent Characteristics
(wave 2)
2110 97.5% 55 2.5%
1723 98.7% 23 1.3%
3343 98.0% 69 2.0%
67 100.0% 0 0.0%
173 98.3% 3 1.7%
85 98.8% 1 1.2%
117 97.5% 3 2.5%
1252 98.7% 16 1.3%
1139 97.9% 25 2.1%
861 97.3% 24 2.7%
346 97.2% 10 2.8%
846 96.7% 29 3.3%
2987 98.4% 49 1.6%
601 99.5% 3 .5%
1497 99.5% 7 .5%
135 81.8% 30 18.2%
1239 98.1% 24 1.9%
103 92.8% 8 7.2%
258 97.7% 6 2.3%
1431 99.4% 9 .6%
1169 98.2% 22 1.8%
595 97.1% 18 2.9%
353 93.9% 23 6.1%
275 97.9% 6 2.1%
2842 98.2% 52 1.8%
991 97.4% 26 2.6%
3268 98.6% 47 1.4%
565 94.8% 31 5.2%
1088 98.6% 16 1.4%
2745 97.8% 62 2.2%
3599 98.7% 49 1.3%
234 89.0% 29 11.0%
360 98.6% 5 1.4%
463 97.1% 14 2.9%
584 95.4% 28 4.6%
1024 98.3% 18 1.7%
945 99.3% 7 .7%
438 99.1% 4 .9%
1151 97.4% 31 2.6%
2004 97.8% 45 2.2%
157 99.4% 1 .6%
521 99.8% 1 .2%

27
Table 16. Incidence of Domestic Violence by Respondent Characteristics (wave 2)
2135 98.6% 30 1.4%
1728 99.0% 18 1.0%
3374 98.9% 38 1.1%
66 98.5% 1 1.5%
174 98.9% 2 1.1%
85 98.8% 1 1.2%
115 95.8% 5 4.2%
1258 99.2% 10 .8%
1153 99.1% 11 .9%
866 97.9% 19 2.1%
349 98.0% 7 2.0%
862 98.5% 13 1.5%
3001 98.8% 35 1.2%
600 99.3% 4 .7%
1498 99.6% 6 .4%
151 91.5% 14 8.5%
1247 98.7% 16 1.3%
109 98.2% 2 1.8%
258 97.7% 6 2.3%
1432 99.4% 8 .6%
1178 98.9% 13 1.1%
601 98.0% 12 2.0%
365 97.1% 11 2.9%
277 98.6% 4 1.4%
2861 98.9% 33 1.1%
1002 98.5% 15 1.5%
3296 99.4% 19 .6%
567 95.1% 29 4.9%
1093 99.0% 11 1.0%
2770 98.7% 37 1.3%
3613 99.0% 35 1.0%
250 95.1% 13 4.9%
360 98.6% 5 1.4%
468 98.1% 9 1.9%
596 97.4% 16 2.6%
1033 99.1% 9 .9%
947 99.5% 5 .5%
439 99.3% 3 .7%
1160 98.1% 22 1.9%
2027 98.9% 22 1.1%
156 98.7% 2 1.3%
520 99.6% 2 .4%

28
Table 17. Incidence of Care Proceedings Problems by Respondent Characteristics (wave 2)
2159 99.7% 6 .3%
1744 99.9% 2 .1%
3405 99.8% 7 .2%
67 100.0% 0 0.0%
176 100.0% 0 0.0%
86 100.0% 0 0.0%
120 100.0% 0 0.0%
1267 99.9% 1 .1%
1161 99.7% 3 .3%
883 99.8% 2 .2%
355 99.7% 1 .3%
874 99.9% 1 .1%
3029 99.8% 7 .2%
604 100.0% 0 0.0%
1503 99.9% 1 .1%
162 98.2% 3 1.8%
1261 99.8% 2 .2%
110 99.1% 1 .9%
263 99.6% 1 .4%
1439 99.9% 1 .1%
1188 99.7% 3 .3%
612 99.8% 1 .2%
374 99.5% 2 .5%
280 99.6% 1 .4%
2891 99.9% 3 .1%
1012 99.5% 5 .5%
3313 99.9% 2 .1%
590 99.0% 6 1.0%
1103 99.9% 1 .1%
2800 99.8% 7 .2%
3642 99.8% 6 .2%
261 99.2% 2 .8%
364 99.7% 1 .3%
476 99.8% 1 .2%
608 99.3% 4 .7%
1041 99.9% 1 .1%
951 99.9% 1 .1%
442 100.0% 0 0.0%
1180 99.8% 2 .2%
2043 99.7% 6 .3%
158 100.0% 0 0.0%
522 100.0% 0 0.0%

29
The Experience of Multiple Justiciable Problems
Figure 2 sets out the number of problems reported (across all problem types) by
respondents in both wave 1 and wave 2. As can be seen, number of problems reported
was broadly comparable between waves.
0
10
20
30
40
50
60
1 2 3 4 5 6 or more
% r
esp
ondents
Number of problems
Wave 1
Wave 2
Figure 2. Number of Problems Reported in wave 1 and wave 2
As illustrated above, certain population groups are more vulnerable than others to
justiciable problems. It has been shown that problems can also act to bring about or
reinforce characteristics of vulnerability (such as unemployment, relationship
breakdown and illness).32
Thus, as Figure 3 shows, the proportion of respondents in
vulnerable groups increases as the number of problems reported increases. For
instance, while 2.8 per cent of those reporting no problems in the 2010 wave 1 survey
were lone parents, this percentage rose to 5.4 per cent of those reporting one problem
and 20.4 per cent of those reporting five or more problems. Likewise, whereas 25.5
per cent of those reporting no problems were ill or disabled, this rose to 46.9 per cent
for those who reported five or more problems (in wave 2).
32
Pleasence, P. (2006) Causes of Action: Civil Law and Social Justice, Norwich: TSO.

30
Figure 3. Proportion of Vulnerable Respondents by Number of Problems (wave 2)
As with individual problems, experience of multiple problems do not affect people
uniformly across the population. Certain population groups experience multiple
problems more often than others. This is depicted in Table 18.
Table 18 illustrates that those vulnerable groups such as lone parents, those
renting publicly, ill or disabled respondents, those with mental health problems and
those in receipt of benefits all tended to report more problems.
0
10
20
30
40
50
60
None 1 2 3 4 5 or more
% r
esp
on
den
ts
Number of problems
Illness/disability
Mental health issues
Lone parent
Unemployed/IS benefits
Victim of crime

31
Number of problems
1 2 3 4+
N % N % N % N %
Gender Female 392 61.3% 129 20.2% 57 8.9% 61 9.5%
Male 318 62.1% 116 22.7% 39 7.6% 39 7.6%
Ethnicity White British 634 61.9% 220 21.5% 86 8.4% 85 8.3%
White other 12 57.1% 4 19.0% 2 9.5% 3 14.3%
Asian 25 67.6% 10 27.0% 0 0.0% 2 5.4%
Black 12 52.2% 3 13.0% 2 8.7% 6 26.1%
Mixed/other 19 57.6% 7 21.2% 5 15.2% 2 6.1%
Housing type Detached 221 70.2% 58 18.4% 20 6.3% 16 5.1%
Semi 208 58.9% 91 25.8% 29 8.2% 25 7.1%
Terrace 190 58.6% 71 21.9% 27 8.3% 36 11.1%
Flat 65 55.6% 20 17.1% 15 12.8% 17 14.5%
Use of transport No transport 137 60.4% 42 18.5% 25 11.0% 23 10.1%
Transport 573 62.0% 203 22.0% 71 7.7% 77 8.3%
Family type Married couple, children 130 60.2% 52 24.1% 17 7.9% 17 7.9%
Married couple, no children 259 69.1% 75 20.0% 24 6.4% 17 4.5%
Lone parent 38 43.2% 24 27.3% 6 6.8% 20 22.7%
Single, no children 187 60.5% 65 21.0% 32 10.4% 25 8.1%
Cohabiting, children 30 52.6% 9 15.8% 7 12.3% 11 19.3%
Cohabiting, no children 66 62.3% 20 18.9% 10 9.4% 10 9.4%
Tenure Own 228 74.8% 52 17.0% 17 5.6% 8 2.6%
Mortgage 248 60.3% 100 24.3% 33 8.0% 30 7.3%
Public sector rent 107 52.2% 43 21.0% 19 9.3% 36 17.6%
Private sector rent 75 48.4% 37 23.9% 22 14.2% 21 13.5%
Table 18 – Problem Incidence by Demographics (wave 2)
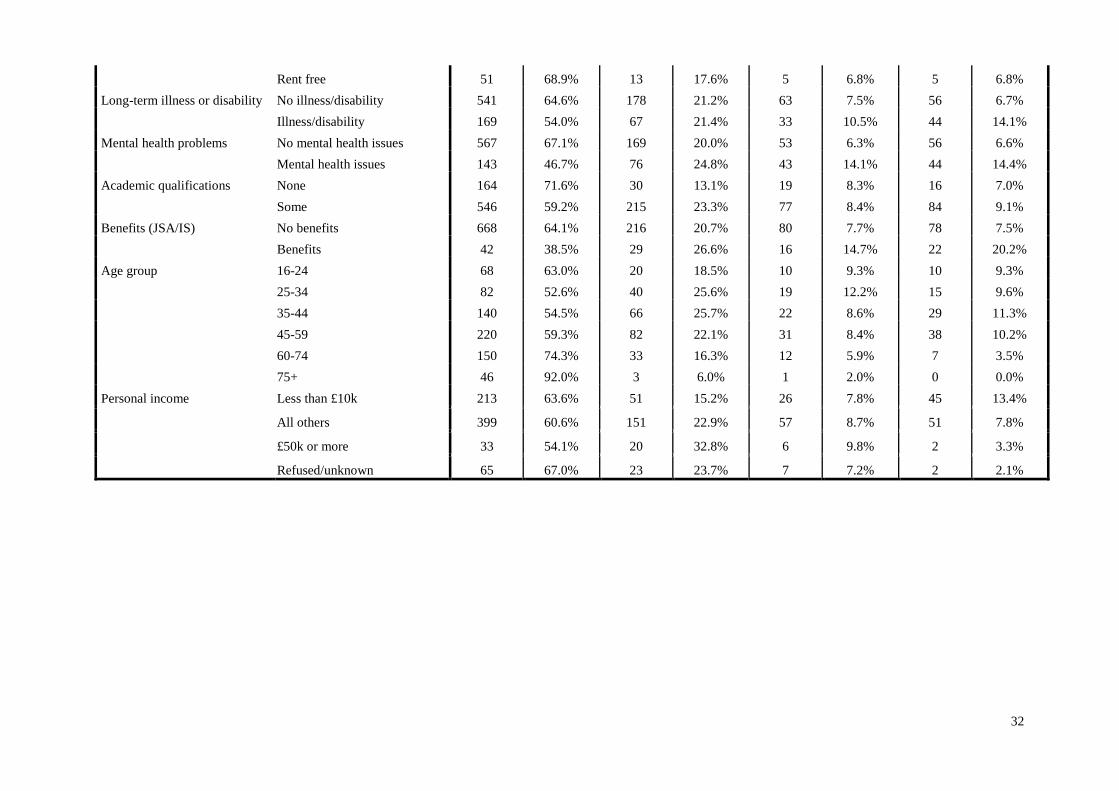
32
Rent free 51 68.9% 13 17.6% 5 6.8% 5 6.8%
Long-term illness or disability No illness/disability 541 64.6% 178 21.2% 63 7.5% 56 6.7%
Illness/disability 169 54.0% 67 21.4% 33 10.5% 44 14.1%
Mental health problems No mental health issues 567 67.1% 169 20.0% 53 6.3% 56 6.6%
Mental health issues 143 46.7% 76 24.8% 43 14.1% 44 14.4%
Academic qualifications None 164 71.6% 30 13.1% 19 8.3% 16 7.0%
Some 546 59.2% 215 23.3% 77 8.4% 84 9.1%
Benefits (JSA/IS) No benefits 668 64.1% 216 20.7% 80 7.7% 78 7.5%
Benefits 42 38.5% 29 26.6% 16 14.7% 22 20.2%
Age group 16-24 68 63.0% 20 18.5% 10 9.3% 10 9.3%
25-34 82 52.6% 40 25.6% 19 12.2% 15 9.6%
35-44 140 54.5% 66 25.7% 22 8.6% 29 11.3%
45-59 220 59.3% 82 22.1% 31 8.4% 38 10.2%
60-74 150 74.3% 33 16.3% 12 5.9% 7 3.5%
75+ 46 92.0% 3 6.0% 1 2.0% 0 0.0%
Personal income Less than £10k 213 63.6% 51 15.2% 26 7.8% 45 13.4%
All others 399 60.6% 151 22.9% 57 8.7% 51 7.8%
£50k or more 33 54.1% 20 32.8% 6 9.8% 2 3.3%
Refused/unknown 65 67.0% 23 23.7% 7 7.2% 2 2.1%

33
3
The Causes and Consequences of Civil Justice
Problems

34
The Broad Impact of Civil Justice Problems
Justiciable problems can bring about a range of social, economic and health problems.
Table 20 and 21 set out the percentage of problems for which respondents to the Civil
and Social Justice Panel Survey reported having experienced a range of adverse
consequences in both wave 1 and wave 2.
Just over half of wave 2 problems (50.1 per cent of 1,769 problems) were
reported to have led to at least one adverse consequence. This was a similar figure to
wave 1 (49.6 per cent of 1,760 problems). These consequences were split into those
related to health and wellbeing (Table 20) – which followed on from 42.5 per cent of
problems in wave 2 (39.4 per cent in wave 1) – and those relating to changes in
circumstances (Table 21) – which followed on from 23.8 per cent of problems (26.1
per cent in wave 1). As can be seen, over a quarter of problems were reported to have
led to stress related illness in wave 2, with physical ill-health, loss of confidence and
loss of income also being frequently reported to follow from problems.

35
Certain problems appear to typically result in adverse consequences. Table 22 shows,
for example, that problems concerning domestic violence, relationship breakdown,
personal injury, divorce and a small number of care problems led to adverse
consequences on more than 70 per cent of occasions. On the other hand, only 21 per
cent of respondents reported adverse consequences as a result of their consumer
problems.
Table 22. Adverse consequences following from wave 2 problems of different types
Consequence
Health and wellbeing Change in
circumstances
Any
Problem type N % problems N % problems N % problems
Consumer 51 18.6% 15 5.5% 57 20.8%
Employment 120 47.8% 120 47.8% 170 67.7%
Neighbours 122 48.2% 23 9.1% 123 48.6%
Owned housing 18 25.4% 8 11.3% 21 29.6%
Rented housing 49 40.8% 22 18.3% 60 50.0%
Debt 75 46.6% 33 20.5% 81 50.3%
Money 48 27.4% 34 19.4% 64 36.6%
Benefits 49 42.6% 38 33.0% 63 54.8%
Education 28 45.9% 12 19.7% 29 47.5%
Personal injury 54 75.0% 20 27.8% 56 77.8%
Clinical negligence 40 76.9% 9 17.3% 40 76.9%
Divorce 30 52.6% 34 59.6% 44 77.2%
Relationship breakdown 37 56.1% 32 48.5% 45 68.2%
Domestic violence 23 67.6% 16 47.1% 26 76.5%
Care 7 100.0% 5 71.4% 7 100.0%
Problem Clusters
Certain justiciable problems have a tendency to co-occur, or „cluster‟ together. This
means that when one problem type occurs, other problems are more likely to be of
particular types. This does not mean that problems have to cause or be caused by one

36
another. They may, for instance, both be caused by a third factor (e.g., poor health).
However, it is useful to understand which problems tend to co-occur.
As in wave 1, hierarchical cluster analysis was used to establish general and
underlying connections between different problem types. Average between groups
linkage was employed as the clustering method.
The results of the hierarchical cluster analyses are summarised in a
dendrogram, set out in Figure 4. Dendrograms illustrate the complete clustering
procedure and the divisions made at each stage of analysis. The closer the „forks‟ or
„branches‟ are to the left side of the dendrogram, the stronger the association between
problem types. The illustrated associations, or „clusters‟ are similar to clusters set out
in wave 1 and in previous research.33
Figure 4. Dendrogram of problems clusters (wave 2)
„Family‟ Cluster
33
Pleasence, P. (2006) Causes of Action: Civil Law and Social Justice, TSO: Norwich.

37
As has also been shown elsewhere,34
family problems (comprised of domestic
violence, divorce and relationship breakdown problems) cluster together strongly. As
Table 23 shows, 38 per cent of those who reported suffering from domestic violence
in the 2010 survey also reported problems ancillary to relationship breakdown, and 27
per cent reported a divorce. Likewise, 24 per cent of those who reported problems
ancillary to relationship breakdown also reported a divorce, and 23 per cent suffered
from domestic violence.
„Economic‟ Cluster
Wave 2 also re-confirmed the existence of a second cluster incorporating problems
linking to economic activity: money, debt, welfare benefits, housing, neighbours and
employment problems. For example, as Table 23 shows, 28 per cent of those who
reported having debt problems also had money problems, 24 per cent had neighbours
problems, 21 per cent employment problems and 21 per cent rented housing
problems.
Degree of Problem Overlap
Table 23 also sets out the degree of overlap between the experiences of different wave
2 problem types. Percentages represent the percentage of problems of the types
indicated in the left column of the table that were accompanied by the types indicated
by each column (e.g., 29.1 per cent of those with rented housing problems also had
debt problems).
34
Ibid.

36
Table 23. Degree of Overlap of Problem Types (wave 2) Consumer Employment Neighbours Owned Housing Rented Housing Money Debt Welfare Benefits
Problem type N Row % N Row % N Row % N Row % N Row % N Row % N Row % N Row %
Consumer - - 40 12.5% 50 15.6% 22 6.9% 14 4.4% 35 10.9% 23 7.2% 29 9.1%
Employment 40 16.1% - - 49 19.7% 17 6.8% 19 7.6% 36 14.5% 35 14.1% 27 10.8%
Neighbours 50 15.2% 49 14.8% - - 14 4.2% 43 13.0% 44 13.3% 40 12.1% 33 10.0%
Owned Housing 22 25.9% 17 20.0% 14 16.5% - - 6 7.1% 20 23.5% 17 20.0% 8 9.4%
Rented Housing 14 12.0% 19 16.2% 43 36.8% 6 5.1% - - 21 17.9% 34 29.1% 22 18.8%
Money 35 17.3% 36 17.8% 44 21.8% 20 9.9% 21 10.4% - - 46 22.8% 29 14.4%
Debt 23 13.9% 35 21.1% 40 24.1% 17 10.2% 34 20.5% 46 27.7% - - 31 18.7%
Welfare Benefits 29 20.0% 27 18.6% 33 22.8% 8 5.5% 22 15.2% 29 20.0% 31 21.4% - -
Education 14 18.9% 17 23.0% 22 29.7% 10 13.5% 11 14.9% 9 12.2% 15 20.3% 18 24.3%
Personal Injury 22 14.8% 29 19.5% 32 21.5% 9 6.0% 8 5.4% 20 13.4% 20 13.4% 14 9.4%
Clinical Negligence 9 15.0% 12 20.0% 14 23.3% 4 6.7% 12 20.0% 10 16.7% 9 15.0% 12 20.0%
Divorce 7 15.2% 9 19.6% 5 10.9% 4 8.7% 4 8.7% 12 26.1% 10 21.7% 6 13.0%
Relationship Breakdown 11 14.1% 8 10.3% 19 24.4% 6 7.7% 11 14.1% 16 20.5% 21 26.9% 14 17.9%
Violence 14 29.2% 7 14.6% 15 31.3% 4 8.3% 8 16.7% 17 35.4% 14 29.2% 11 22.9%
Care 3 37.5% 4 50.0% 5 62.5% 4 50.0% 3 37.5% 3 37.5% 5 62.5% 5 62.5%
Education Personal Injury Clinical Negligence Divorce Relationship Breakdown Violence Care
Problem type N Row % N Row % N Row % N Row % N Row % N Row % N Row %
Consumer 14 4.4% 22 6.9% 9 2.8% 7 2.2% 11 3.4% 14 4.4% 3 .9%
Employment 17 6.8% 29 11.6% 12 4.8% 9 3.6% 8 3.2% 7 2.8% 4 1.6%
Neighbours 22 6.7% 32 9.7% 14 4.2% 5 1.5% 19 5.8% 15 4.5% 5 1.5%
Owned Housing 10 11.8% 9 10.6% 4 4.7% 4 4.7% 6 7.1% 4 4.7% 4 4.7%
Rented Housing 11 9.4% 8 6.8% 12 10.3% 4 3.4% 11 9.4% 8 6.8% 3 2.6%
Money 9 4.5% 20 9.9% 10 5.0% 12 5.9% 16 7.9% 17 8.4% 3 1.5%
Debt 15 9.0% 20 12.0% 9 5.4% 10 6.0% 21 12.7% 14 8.4% 5 3.0%
Welfare Benefits 18 12.4% 14 9.7% 12 8.3% 6 4.1% 14 9.7% 11 7.6% 5 3.4%
Education - - 9 12.2% 3 4.1% 6 8.1% 11 14.9% 9 12.2% 4 5.4%
Personal Injury 9 6.0% - - 7 4.7% 5 3.4% 8 5.4% 9 6.0% 4 2.7%
Clinical Negligence 3 5.0% 7 11.7% - - 4 6.7% 6 10.0% 7 11.7% 3 5.0%
Divorce 6 13.0% 5 10.9% 4 8.7% - - 19 41.3% 13 28.3% 4 8.7%
Relationship Breakdown 11 14.1% 8 10.3% 6 7.7% 19 24.4% - - 18 23.1% 4 5.1%
Violence 9 18.8% 9 18.8% 7 14.6% 13 27.1% 18 37.5% - - 3 6.3%
Care 4 50.0% 4 50.0% 3 37.5% 4 50.0% 4 50.0% 3 37.5% - -

37
4
People‟s Understanding of Civil Justice
Problems
This section describes how people characterise civil justice problems, and then sets
out the extent to which people understand their legal rights in relation to the problems
that they face.
Characterisation of Problems
Respondents were asked to characterise the problems they faced, as shown in Table
24, including both new problems identified at wave 2 and problems „fed forward‟
from wave 1. As with wave 1, characterising problems as being „legal‟ was rare, and
the most common response was again that problems were simply „bad luck‟ or „part
of life‟.
Table 24. Characterisation of civil justice problems
Wave 1 Wave 2
Characterisation N % problems N % problems
Bad luck / part of life 757 43.0% 793 44.8%
Moral 188 10.7% 275 15.5%
Private (i.e. not something to involve others with) 107 6.1% 127 7.2%
Criminal 113 6.4% 121 6.8%
Legal 168 9.5% 192 10.9%
Social 187 10.6% 210 11.9%
Bureaucratic 292 16.6% 315 17.8%
Family / community (i.e. something to be dealt
with within the family/community)
83 4.7% 120 6.8%
In addition, respondents were also asked characterisation questions for problems „fed
forward‟ from wave 1 to wave 2. Of 386 wave 1 problems „fed forward‟ to wave 2, 52
(14 per cent) were characterised as „legal‟ at wave 1. By wave 2, this had dropped
slightly to 45 (12 per cent). Of the 52 problems originally characterised as „legal‟,
only 13 (25 per cent) remained so by wave 2. Conversely, of those not originally
characterised as „legal‟, 32 (9.6 per cent) were characterised as „legal‟ by wave 2.
More generally, while there was considerable movement in the way in which

38
individual problems were characterised between waves, the overall pattern
highlighted in Table 24 also applied to „fed forward‟ problems (though there was
some increase in the tendency to characterise problems as bad luck, private or a
family/community matter).
Understanding of rights and legal empowerment
Respondents were asked about the extent to which they felt they knew their legal
rights when their problem started. For new problems identified at wave 2, respondents
felt they had a complete understanding of their rights for 347 of 1,382 problems (25.1
per cent), mostly understood their rights for a further 301 (21.8 per cent), partly for
267 (19.3 per cent) and not at all for 425 (30.8 per cent). A further 42 said that they
did not know (3.0 per cent). These percentages were broadly comparable to those of
wave 1.
As with wave 1, where respondents said that they did not understand their
rights, only partly understood their rights, or did not know whether they understood
their rights, they were also asked whether they now knew their legal position (at the
time of interview). Of 731 newly identified problems, 94 (12.9 per cent) suggested
that they now knew their rights completely, 167 (22.8 per cent) that they mostly knew
their rights, 216 (29.5 per cent) that they partly knew their rights, 217 (29.7 per cent)
that they did not know their rights at all and 37 (5.1 per cent) that they did not know.
Of course, many of these problems will have started close to the interview date,
leaving little opportunity to develop an understanding of legal rights.
The longitudinal panel format also allows examination of changes in perceived
knowledge of rights for problems „fed forward‟ from wave 1 to wave 2. For „fed
forward‟ problems, regardless of whether or not respondents suggested that they knew
their rights at wave 1 (initially or at the time of interview) they were again asked
about the extent to which they knew their rights at wave 2. Overall, respondents
suggested knowledge of their rights had remained the same for 144 of 386 problems
(37.3 per cent), improved for 148 (38.3 per cent) and worsened for 94 (24.4 per cent).
Evidently respondents can lose as well as gain (perceived) knowledge of rights.

39
For the 1056 problems where individuals claimed to know their legal position/rights
„completely‟, „mostly‟, or „partly‟ at either the outset of the problem or later during
the course of the problem, individuals were asked to briefly explain their legal
position/legal rights.
Verbatim responses highlighted a disjuncture between an individual‟s belief
that they knew their rights/legal position and their ability to articulate this. This was
most often that case in respect of education, neighbours and benefits problems where
many individuals responded that they “(didn‟t) know” when asked to articulate their
rights. Individuals who claimed to know their rights/legal position, but who when
asked, went on to describe the situation they faced or outcome that occurred, were
most often facing employment, owned housing, debt, money, personal injury, and
community care problems. Those who appeared to be capable of articulating their
legal position/rights most clearly were those with consumer rights and domestic
violence problems. There were however a number of erroneous beliefs in respect of
consumer problems. In particular, individuals often believed they had a right where
35
There were also some differences in sources of knowledge for problems fed forward from wave 1 to
wave 2, with fed-forward problems having a higher percentage obtaining knowledge from
friends/family/colleagues (33.9%) or advisers (38.2%). Conversely, the Internet, leaflet/booklets/books
and previous experience were less prominent. This may reflect fed forward problems having lasted
longer and therefore, be more likely to tend towards formal or informal advice.

40
none existed, confused the existing legislation, or falsely interpreted certain
(irrelevant) legislation as protecting their rights.
Despite being asked about their legal rights, respondents often gave responses
which aligned more closely with common sense or social convention. Hence,
responses such as “ I had the right to stand up for myself”, “I could voice (an)
opinion and they had to act on (it)”, and another who, in respect of a neighbours
dispute, claimed to have a right “to sleep at night” appeared indicative of a „common
sense‟ or „ethical‟ interpretation of the situation, rather than a legal one.
There was a degree of pessimism about the legal system evident, with a
number of people claiming that they “had no rights”. Others stated their legal
position/rights purely in terms of fault, including those who claimed their legal
position/rights were that they were “wholly innocent”, “always in the right”, “…
definitely the other drivers fault”, “the shop was at fault”, “the dentist was in the
wrong” and so on.
Overall, analysis of verbatim responses highlighted that individuals often
struggled to articulate their rights and relied on common sense or fairness based
interpretations in favour of actual knowledge of the law. Many tended to explain the
problem itself rather than their legal position relative to it and in some cases
overestimated the protection the law afforded.
New questions were added to wave 2 of the CSJPS which aimed to assess
whether respondents would be confident of a fair solution if they faced conflicts or
problems in a number of broad areas. These included conflicts with an employer,
family member and a neighbour, as well as land disputes, business disputes and being
a victim of crime.36
Responses to the questions are shown in Figure 5. As can be seen,
lack of confidence of a fair solution was uncommon, while „don‟t know‟ responses
were more common for business and land disputes. Respondents were most confident
of a fair solution for conflicts with family members.
36
These „subjective legal empowerment‟ questions were developed with the help of Robert Porter at
Tilburg University.

41
0% 50% 100%
Conflict with employer
Conflict with family member
Conflict with a neighbour
Land dispute
Business dispute
Victim of crime
Respondents
Don't know
Very unlikely
Unlikely
Neither unlikely nor likely
Likely
Very Likely
Figure 5. Whether respondents would be confident of getting a fair solution when
facing conflicts/problems (wave 2)

42
5
Problem Resolution Strategies
This section sets out the ways in which people deal with justicable problems. It
examines the action taken by respondents and the use of advice services that are
associated with different population groups and different problem types.
How People Respond to Justiciable Problems
As in wave 1, and in a change from previous surveys, the CSJPS introduced a single
question to summarise respondents‟ problem solving behaviour when faced with
problems. Broad strategy when faced with problems is shown in Figure 6 for wave 1
and wave 2 (with „fed forward‟ problems also included in wave 237
).
Figure 6. Broad problem solving strategy adopted by respondents for problems in
wave 1 and wave 2
37
Where problems were „fed forward‟ from wave 1 to wave 2, respondents were asked to review the
strategy they presented at wave 1 and alter it if appropriate.
27.9
29.4
14.8
14.9
46.6
40
10.6
15.7
0% 20% 40% 60% 80% 100%
Wave 1
Wave 2
Problems
Formal help
Informal help only
Handled alone
Did nothing

43
As shown in Figure 6, there was a higher percentage doing nothing in response to
problems in wave 2, and a lower percentage handling problems alone. Percentages
obtaining informal help and formal advice/representation were broadly comparable
between waves.
Of those who sought help from family/friends in wave 2 (for 444 problems),
262 (59.0 per cent) solely used the help of family/friends and 96 (21.6 per cent) used
the help of family/friends and a formal adviser. 53 of 444 (11.0 per cent) suggested
that family/friends were sorting/had sorted the problem out for them (rather than
simply helping them), while 33 (7.4 per cent) suggested that family/friends and a
formal adviser were sorting the problem out for them.
Of those who used a formal adviser in wave 2 (for 657 problems), 341 (51.9
per cent) solely used the help of a formal adviser, 96 (14.6 per cent) the help of a
formal adviser and family/friends, 187 (28.5 per cent) suggested that a formal adviser
was sorting/ had sorted the problem out for them and 33 (5.0 per cent) that a formal
adviser and family/friends were sorting the problem out for them.
As in wave 1, direct comparison of these figures with those from earlier
surveys is complicated by the fact that the CSJPS included problems that were not
„difficult to solve‟. This is likely to account for the rise in the proportion of people
reporting that they dealt with problems on their own.
Table 26 sets out the different broad responses to wave 2 civil justice problems
for various population groups, with variation in strategy by problem type shown in
Table 27.

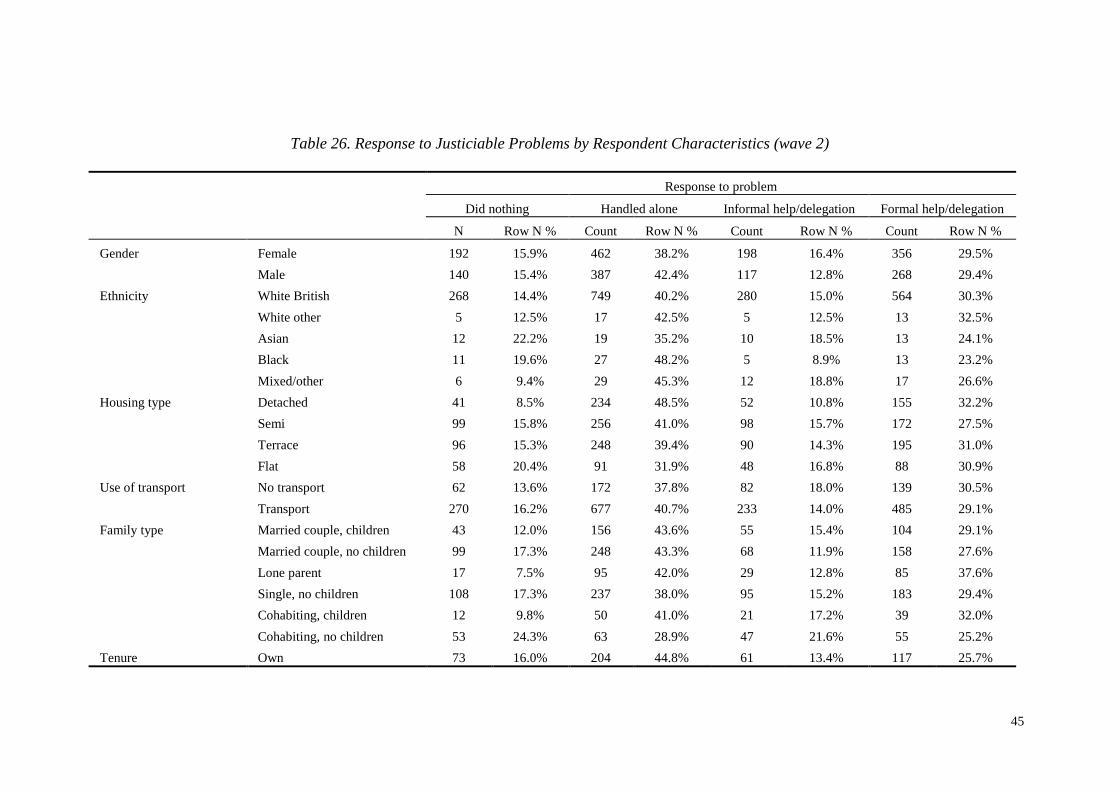
45
Table 26. Response to Justiciable Problems by Respondent Characteristics (wave 2)
Response to problem
Did nothing Handled alone Informal help/delegation Formal help/delegation
N Row N % Count Row N % Count Row N % Count Row N %
Gender Female 192 15.9% 462 38.2% 198 16.4% 356 29.5%
Male 140 15.4% 387 42.4% 117 12.8% 268 29.4%
Ethnicity White British 268 14.4% 749 40.2% 280 15.0% 564 30.3%
White other 5 12.5% 17 42.5% 5 12.5% 13 32.5%
Asian 12 22.2% 19 35.2% 10 18.5% 13 24.1%
Black 11 19.6% 27 48.2% 5 8.9% 13 23.2%
Mixed/other 6 9.4% 29 45.3% 12 18.8% 17 26.6%
Housing type Detached 41 8.5% 234 48.5% 52 10.8% 155 32.2%
Semi 99 15.8% 256 41.0% 98 15.7% 172 27.5%
Terrace 96 15.3% 248 39.4% 90 14.3% 195 31.0%
Flat 58 20.4% 91 31.9% 48 16.8% 88 30.9%
Use of transport No transport 62 13.6% 172 37.8% 82 18.0% 139 30.5%
Transport 270 16.2% 677 40.7% 233 14.0% 485 29.1%
Family type Married couple, children 43 12.0% 156 43.6% 55 15.4% 104 29.1%
Married couple, no children 99 17.3% 248 43.3% 68 11.9% 158 27.6%
Lone parent 17 7.5% 95 42.0% 29 12.8% 85 37.6%
Single, no children 108 17.3% 237 38.0% 95 15.2% 183 29.4%
Cohabiting, children 12 9.8% 50 41.0% 21 17.2% 39 32.0%
Cohabiting, no children 53 24.3% 63 28.9% 47 21.6% 55 25.2%
Tenure Own 73 16.0% 204 44.8% 61 13.4% 117 25.7%
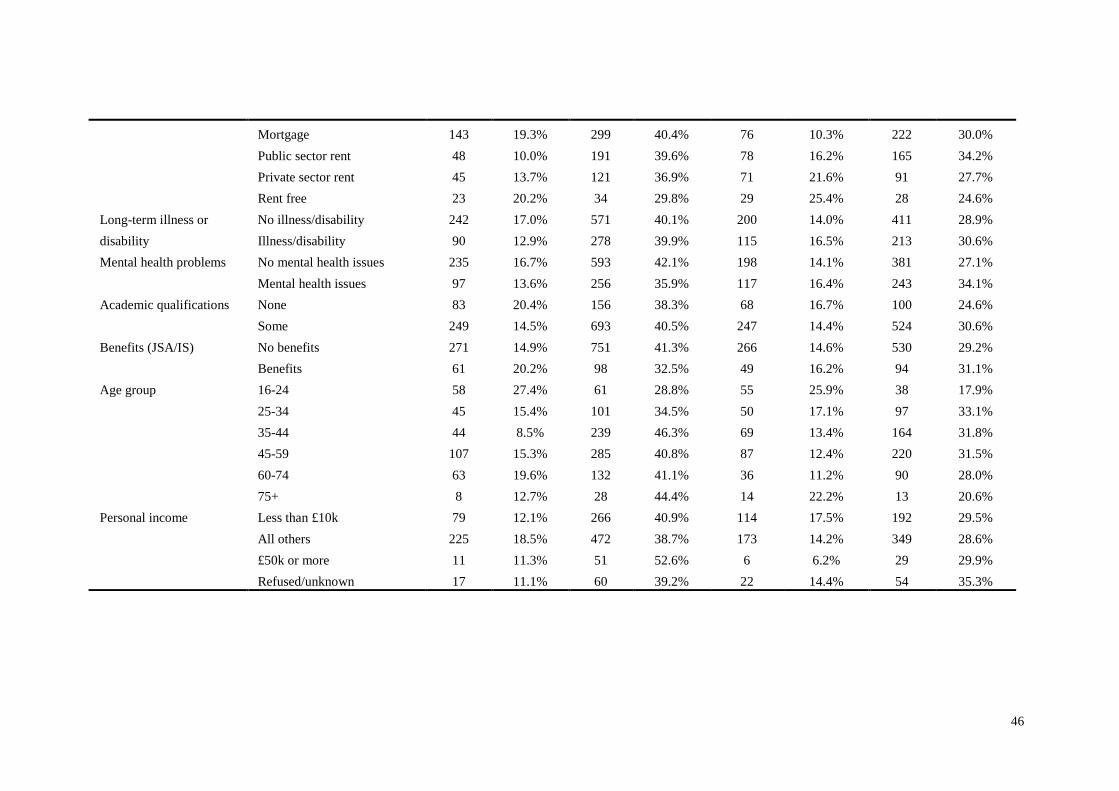
46
Mortgage 143 19.3% 299 40.4% 76 10.3% 222 30.0%
Public sector rent 48 10.0% 191 39.6% 78 16.2% 165 34.2%
Private sector rent 45 13.7% 121 36.9% 71 21.6% 91 27.7%
Rent free 23 20.2% 34 29.8% 29 25.4% 28 24.6%
Long-term illness or
disability
No illness/disability 242 17.0% 571 40.1% 200 14.0% 411 28.9%
Illness/disability 90 12.9% 278 39.9% 115 16.5% 213 30.6%
Mental health problems No mental health issues 235 16.7% 593 42.1% 198 14.1% 381 27.1%
Mental health issues 97 13.6% 256 35.9% 117 16.4% 243 34.1%
Academic qualifications None 83 20.4% 156 38.3% 68 16.7% 100 24.6%
Some 249 14.5% 693 40.5% 247 14.4% 524 30.6%
Benefits (JSA/IS) No benefits 271 14.9% 751 41.3% 266 14.6% 530 29.2%
Benefits 61 20.2% 98 32.5% 49 16.2% 94 31.1%
Age group 16-24 58 27.4% 61 28.8% 55 25.9% 38 17.9%
25-34 45 15.4% 101 34.5% 50 17.1% 97 33.1%
35-44 44 8.5% 239 46.3% 69 13.4% 164 31.8%
45-59 107 15.3% 285 40.8% 87 12.4% 220 31.5%
60-74 63 19.6% 132 41.1% 36 11.2% 90 28.0%
75+ 8 12.7% 28 44.4% 14 22.2% 13 20.6%
Personal income Less than £10k 79 12.1% 266 40.9% 114 17.5% 192 29.5%
All others 225 18.5% 472 38.7% 173 14.2% 349 28.6%
£50k or more 11 11.3% 51 52.6% 6 6.2% 29 29.9%
Refused/unknown 17 11.1% 60 39.2% 22 14.4% 54 35.3%

47
Table 27. Broad response to wave 2 problems by type of problem
Problem type Broad response to problems
Did nothing Handled alone Handled with
informal help
Obtained advice
N % N % N % N %
Consumer 25 7.4% 217 64.4% 54 16.0% 41 12.2%
Employment 69 25.3% 73 26.7% 23 8.4% 108 39.6%
Neighbours 64 22.2% 91 31.6% 37 12.8% 96 33.3%
Owned housing 12 14.1% 27 31.8% 3 3.5% 43 50.6%
Rented housing 21 15.2% 50 36.2% 42 30.4% 25 18.1%
Debt 15 7.8% 81 42.2% 39 20.3% 57 29.7%
Money 28 13.5% 100 48.1% 29 13.9% 51 24.5%
Benefits 14 9.7% 73 50.3% 29 20.0% 29 20.0%
Education 8 9.3% 37 43.0% 19 22.1% 22 25.6%
Personal injury 15 17.6% 17 20.0% 8 9.4% 45 52.9%
Clinical negligence 19 27.9% 26 38.2% 7 10.3% 16 23.5%
Divorce 9 12.5% 24 33.3% 7 9.7% 32 44.4%
Relationship breakdown 12 14.6% 21 25.6% 12 14.6% 37 45.1%
Violence 15 30.0% 11 22.0% 5 10.0% 19 38.0%
Care 6 54.5% 1 9.1% 1 9.1% 3 27.3%
As is evident from Table 27, and as observed in all previous surveys, strategy adopted
by respondents varied significantly by problem type. There were high rates of inaction
for a number of problem types, including domestic violence, clinical negligence,
employment and neighbours problems (as well as for a small number of problems
concerning care). Handling problems alone was particularly common for consumer
issues, while handling problems with the help of friends or family was particularly
common for rented housing, education, welfare benefits and debt problems. Finally,
obtaining formal advice was particularly common for personal injury and owned
housing problems, and far less common for rented housing and consumer issues.
As with previous research conducted by Pleasence, Balmer and Reimers38
, the
way in which problems were characterised was also a key driver of strategy. In wave
2, for example, where respondents felt that the problem was a „moral‟ one, there were
low levels of inaction (7.1 per cent) and high levels of formal help (38.3 per cent).
The same was true where respondents suggested that the problem was „criminal‟ (7.1
38
Pleasence, P., Balmer, N.J. and Reimers, S. (2010) Horses for Courses? Advice Seeking and the
Stratification of Legal Services, in The Future of Legal Services, Emerging Thinking, London: Legal
Service Board.
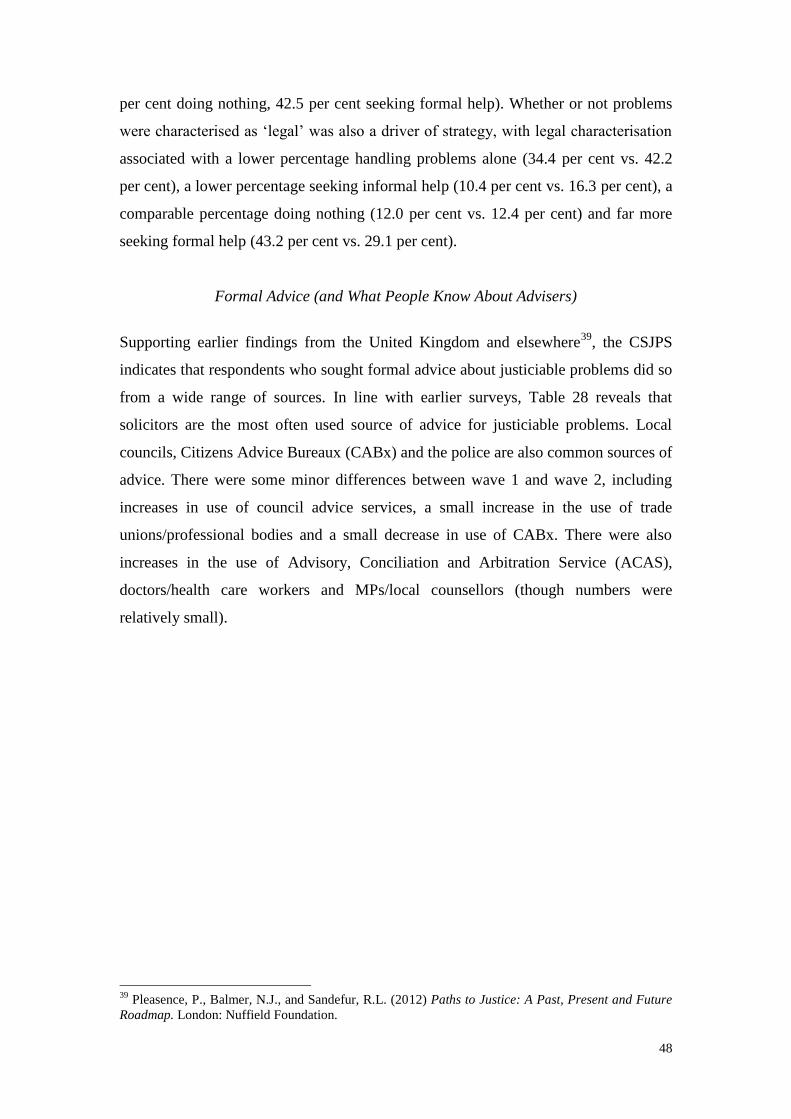
48
per cent doing nothing, 42.5 per cent seeking formal help). Whether or not problems
were characterised as „legal‟ was also a driver of strategy, with legal characterisation
associated with a lower percentage handling problems alone (34.4 per cent vs. 42.2
per cent), a lower percentage seeking informal help (10.4 per cent vs. 16.3 per cent), a
comparable percentage doing nothing (12.0 per cent vs. 12.4 per cent) and far more
seeking formal help (43.2 per cent vs. 29.1 per cent).
Formal Advice (and What People Know About Advisers)
Supporting earlier findings from the United Kingdom and elsewhere39
, the CSJPS
indicates that respondents who sought formal advice about justiciable problems did so
from a wide range of sources. In line with earlier surveys, Table 28 reveals that
solicitors are the most often used source of advice for justiciable problems. Local
councils, Citizens Advice Bureaux (CABx) and the police are also common sources of
advice. There were some minor differences between wave 1 and wave 2, including
increases in use of council advice services, a small increase in the use of trade
unions/professional bodies and a small decrease in use of CABx. There were also
increases in the use of Advisory, Conciliation and Arbitration Service (ACAS),
doctors/health care workers and MPs/local counsellors (though numbers were
relatively small).
39
Pleasence, P., Balmer, N.J., and Sandefur, R.L. (2012) Paths to Justice: A Past, Present and Future
Roadmap. London: Nuffield Foundation.

49
Table 28. Sources of Advice in wave 1 and 2
Wave 1 Wave 2
N % problems N % problems
Local council
General enquiries at your local council 24 4.6 15 2.7
A council advice service 17 3.2 36 6.5
Trading standards 14 2.7 8 1.4
Other council department 30 5.7 36 6.5
Advice agency
Citizens Advice Bureau 83 15.8 67 12.0
Law Centre 9 1.7 8 1.4
Other independent advice agency 24 4.6 32 5.7
Trade union/professional body
Trade union/professional body 50 9.5 69 12.4
Lawyer
Solicitor 124 23.7 132 23.7
Barrister 10 1.9 12 2.2
Other person or organisation
Community group 7 1.3 2 0.4
Insurance company legal advice service 14 2.7 15 2.7
Police 43 8.2 47 8.4
Your employer 15 2.9 16 2.9
Doctor or other health worker 23 4.4 35 6.3
ACAS 8 1.5 17 3.0
Jobcentre 6 1.1 3 0.5
Social worker 13 2.5 10 1.8
MP or local councillor 8 1.5 19 3.4
Other person or organisation 114 21.8 121 21.7
Regardless of whether or not they reported problems, respondents were asked
which of a range of advisers they felt they knew something about. Responses are
summarised in Table 29 for both wave 1 and wave 2. In wave 2, further questions
were also added to determine the types of problem respondents‟ thought advisers
covered, as well as the areas where they thought legal aid would be available.
Responses are set out in Table 30.
Table 29. Whether respondents felt they knew something about advisers in wave 1 and
wave 2
Wave 1 Wave 2
N % respondents N % respondents
Shelter 2146 58.1% 1293 66.4%
Citizens Advice 3316 89.7% 1763 91.2%
Consumer Direct 960 26.0% 538 27.8%
Community Legal Advice 748 20.2% 497 25.7%
National Debtline 1547 41.9% 830 42.9%

50
Solicitors 3243 87.8% 1701 88.0%
Law Centres 1237 33.5% 755 39.1%
Financial Services Ombudsman 1564 42.3% 922 47.7%
Local Government Ombudsman 1120 30.3% 700 36.2%
Local council 3206 86.8% 1771 91.6%
Table 30. Problem areas in which wave 2 respondents thought organisations provided
advice or information (percentage of respondents)
Organisation C
on
sum
er
Em
plo
ym
ent
Neig
hb
ours
Ho
usin
g
Mo
ney
/deb
t
Welfare
ben
efits
PI/C
linical
neg
ligen
ce
Div
orce/
Rela. b
‟do
wn
Do
mestic
Vio
lence
Do
n't k
no
w
Shelter 1.8 6.2 7.4 75.3 15.6 26.5 1.7 9.9 21.8 18.3
Citizens Advice 65.2 57.6 55.3 61.9 71.3 66.4 46.1 48.3 47.6 10.6
Community Legal Advice 21.6 17.8 35.2 32.2 23.3 25.8 18.2 16.9 18.1 44.7
Solicitors 42.7 50.0 50.9 39.9 43.0 27.4 73.6 80.8 53.6 8.4
Law Centres 33.2 33.7 32.6 26.5 33.0 23.1 48.2 49.7 36.5 32.2
Ombudsman or Regulator 39.9 19.0 9.1 15.3 32.3 16.9 16.3 6.3 4.9 41.3
Local Council 18.2 9.3 65.4 78.9 11.9 41.1 4.9 4.5 13.2 9.6
Trade Union 5.0 74.0 1.6 3.2 13.9 17.0 29.5 2.3 1.8 21.9
Legal expenses insurance
advice line
12.1 7.9 3.6 5.9 28.3 8.8 20.7 9.1 3.9 55.4
MP 25.2 28.8 33.0 54.4 13.4 35.3 11.6 7.7 11.4 32.5
GP 1.5 5.1 2.8 9.7 3.3 16.6 63.7 18.3 44.3 20.6
Police 4.0 2.2 73.7 5.0 2.4 2.4 21.8 7.3 79.5 9.7
Legal Aid 22.0 27.2 19.2 20.5 33.2 22.1 43.2 43.8 29.4 28.1
Mode of Contact
Table 31 reveals how respondents initially contacted their adviser, along with
the predominant methods used to obtain advice in both wave 1 and wave 2. As in
2004 and 2006-9, the telephone was marginally the most common means of
establishing contact, though percentages of telephone and face-to-face first contact
were almost identical at wave 2.
Table 31. Method of first contact and predominant method of contact for first advisers
Wave 1 Wave 2
First contact Predominant
method
First contact Predominant
method
Method of contact N % N % N % N %
In person 229 43.1 265 49.3 223 42.6 252 48.9
Email/Internet 26 4.9 38 7.1 31 5.9 54 10.5
Telephone 247 46.5 209 38.9 224 42.7 177 34.4
Post 6 1.1 21 3.9 15 2.9 22 4.3

51
Through someone else 23 4.3 11 2.0 31 5.9 10 1.9
Respondents used the Internet to help to sort out their problems for 418 of 1,769 wave
2 problems (23.6 per cent). This represented an increase compared to 328 of 1,760
problems (18.6 per cent) in wave 1 and continued the upward trend observed in the
2001, 2004 and 2006-9 surveys (4 per cent, 10 per cent and 16 per cent, respectively).
Respondents used a leaflet, booklet or book to help to sort out 110 of 1,769 wave 2
problems (6.2 per cent). This was comparable to use in wave 1 (113 of 1,760
problems, 6.4 per cent).
Satisfaction with and improvements in life attributable to advice
As with wave 1, the majority of respondents who obtained advice were satisfied with
the first adviser used. One hundred and fifty-three of 533 respondents (28.7 per cent)
suggested that they were extremely satisfied with their first advisers, 162 (30.4 per
cent) very satisfied, 107 (20.1 per cent) somewhat satisfied, 38 (7.1 per cent)
somewhat dissatisfied, 19 (3.6 per cent) very dissatisfied and 40 (7.5 per cent)
extremely dissatisfied. The remaining 14 (2.6 per cent) said that they did not know.
Overall, findings were very similar to those of wave 1, where 150 of 537 respondents
(27.9 per cent) suggested that they were extremely satisfied with their first advisers,
171 (31.8 per cent) very satisfied, 127 (23.6 per cent) somewhat satisfied, 22 (4.1 per
cent) somewhat dissatisfied, 24 (4.5 per cent) very dissatisfied and 32 (6.0 per cent)
extremely dissatisfied. Table 32 shows satisfaction with advice received from first
advisers by adviser type (wave 2). It should be noted, however, that numbers were
small for the majority of adviser types and should be interpreted with caution.


53
Table 32. Satisfaction with advice received from first advisers by adviser type (wave 2)
How satisfied the respondent was with the help they received from first adviser
Don't know Extremely
satisfied
Very
satisfied
Somewhat
satisfied
Somewhat
dissatisfied
Very
dissatisfied
Extremely
dissatisfied
General Enquiries at your local council 0 7 4 6 2 1 3
0.0% 30.4% 17.4% 26.1% 8.7% 4.3% 13.0%
A council advice service 0 7 7 3 3 2 3
0.0% 28.0% 28.0% 12.0% 12.0% 8.0% 12.0%
Trading Standards 0 2 1 1 0 3 1
0.0% 25.0% 12.5% 12.5% 0.0% 37.5% 12.5%
Other Council Department 1 8 4 10 4 2 5
2.9% 23.5% 11.8% 29.4% 11.8% 5.9% 14.7%
Citizens Advice Bureau 0 14 26 9 1 1 0
0.0% 27.5% 51.0% 17.6% 2.0% 2.0% 0.0%
Law Centre 0 1 2 0 0 0 0
0.0% 33.3% 66.7% 0.0% 0.0% 0.0% 0.0%
Trade Union/Professional Body 3 9 17 17 3 3 3
5.5% 16.4% 30.9% 30.9% 5.5% 5.5% 5.5%
Solicitor 0 18 26 14 6 1 5
0.0% 25.7% 37.1% 20.0% 8.6% 1.4% 7.1%
Barrister 0 1 0 0 0 0 0
0.0% 100.0% 0.0% 0.0% 0.0% 0.0% 0.0%
Community group 0 2 1 0 0 0 0
0.0% 66.7% 33.3% 0.0% 0.0% 0.0% 0.0%
Insurance company legal advice service 1 3 1 2 0 0 0
14.3% 42.9% 14.3% 28.6% 0.0% 0.0% 0.0%
Police 1 10 11 9 3 2 7

54
2.3% 23.3% 25.6% 20.9% 7.0% 4.7% 16.3%
your employer 0 5 4 4 3 0 1
0.0% 29.4% 23.5% 23.5% 17.6% 0.0% 5.9%
Doctor or other health worker 0 9 5 3 4 1 0
0.0% 40.9% 22.7% 13.6% 18.2% 4.5% 0.0%
ACAS 0 1 1 2 2 0 1
0.0% 14.3% 14.3% 28.6% 28.6% 0.0% 14.3%
Jobcentre 1 0 1 1 0 0 1
25.0% 0.0% 25.0% 25.0% 0.0% 0.0% 25.0%
Social worker 0 2 0 0 0 0 0
0.0% 100.0% 0.0% 0.0% 0.0% 0.0% 0.0%
MP or local councillor 0 2 0 0 0 0 2
0.0% 50.0% 0.0% 0.0% 0.0% 0.0% 50.0%
Other advice agency 1 8 5 5 2 0 0
4.8% 38.1% 23.8% 23.8% 9.5% 0.0% 0.0%
Other person or organisation 6 44 46 21 5 3 8
4.5% 33.1% 34.6% 15.8% 3.8% 2.3% 6.0%

55

56
6
The Outcomes of Problems
This section describes the different outcomes associated with different resolution
strategies and problem types. It points to general evidence that problems conclude
more effectively where people act to resolve them.
How Problems Conclude
Of 1,734 civil justice problems reported in wave 2 of the CSJPS, respondents
considered 979 (56.2 per cent) to be over, 81 (4.7 per cent) most likely over and 587
(33.7 per cent) ongoing. It was „too early to say‟ whether 87 (5.0 per cent) were over,
with respondents in the remaining 7 (0.4 per cent) cases saying they did not know.
These percentages were almost identical to those reported for wave 1 problems, where
respondents considered 963 (56.0 per cent) to be over, 82 (4.8 per cent) most likely
over, 587 (34.1 per cent) to be ongoing. 69 (4.0 per cent) „too early to say‟ and did not
know for 18 (1.0 per cent). Problems fed forward from wave 1 to wave 2, not
surprisingly had a slightly higher percentage „now over‟ (63.9 per cent) and a slightly
lower percentage ongoing (25.2 per cent).40
Of 1,031 concluded problems in wave 2, 79 (7.7 per cent) were resolved
through a court or tribunal, 50 (4.8 per cent) through some other process, 413 (40.1
per cent) by agreement, 88 (8.5 per cent) were resolved independently, 218 (21.1 per
cent) resolved themselves, with respondents giving up for the remaining 183 (17.7 per
cent). Figures were broadly comparable to wave 1, where of 1,002 concluded
problems, 52 (5.2 per cent) were resolved through a court or tribunal, 53 (5.3 per cent)
through some other process, 414 (41.3 per cent) by agreement, 87 (8.7 per cent) were
resolved independently, 199 (19.9 per cent) resolved themselves, with respondents
giving up for the remaining 197 (19.7 per cent). Figures 7 and 8 show how problems
were concluded by the broad strategy adopted by respondents in both wave 1 and
wave 2. As can be seen, courts, tribunals and other processes were most common
outcomes where advice was obtained, with agreement fairly consistent whether advice
40
6.0% were „most likely now over‟, 4.4% „too early to say‟ and 0.5% „don‟t know‟.

57
was obtained, the problem was handled with informal help or handled alone. In
contrast, those who did nothing reported far lower levels of agreement and high levels
of giving up. Findings were comparable between wave 1 (Figure 7) and wave 2
(Figure 8).
Figure 7. Problem Outcome by Resolution Strategy Adopted (wave 1)
Figure 8. Problem Outcome by Resolution Strategy Adopted (wave 2)
0% 50% 100%
Did nothing
Handled alone
Handled with
informal help
Obtained advice
Concluded problems
Court/tribunal
Other process
Agreement
Resolved independently
Problem resolved itself
Gave up
0% 50% 100%
Did nothing
Handled alone
Handled with
informal help
Obtained advice
Concluded problems
Court/tribunal
Other process
Agreement
Resolved independently
Problem resolved itself
Gave up

58
Figure 9 shows problem outcome by problem type for wave 2 problems. As can be
seen, concluding by court or tribunal was most common for divorce and relationship
breakdown problems. Other processes were most common in personal injury and
neighbours problems, while divorce and debt problems had particularly high rates of
agreement. Giving up was common for employment, clinical negligence, education
and personal injury problems.
Figure 9. Problem Outcome by Problem Type (wave 2)
0% 50% 100%
Consumer
Employment
Neighbours
Owned housing
Rented housing
Debt
Money
Benefits
Education
Personal injury
Clinical negligence
Divorce
Relationship breakdown
Violence
Concluded problems
Court/tribunal
Other process
Agreement
Resolved independently
Problem resolved itself
Gave up

59
7
Attitudes to the Justice System
This section outlines attitudes to the justice system reported by respondents to the
2010 CSJPS, and sets out how these relate to the number of problems experienced. It
suggests that „civic exclusion‟, an institutional aspect of social exclusion relating to
dissatisfaction with institutional legal processes, may be more common among those
respondents who report multiple problems and those respondents who have been to
court in relation to their problems. This section uses wave 1 findings only (repeating
findings from the wave 1 report), since the „attitudes to the justice system questions‟
were only retained for part of wave 2.41
Attitudes to the Justice System
All respondents to the 2010 CSJPS were asked the extent to which they agreed with
the following statements:
1. “If you went to a court with a problem, you would be confident of getting a fair hearing”
2. “Lawyers are not affordable for people on low incomes”
3. “Courts are an important way for ordinary people to enforce their rights”
4. " You should follow laws even when you believe it would be better not to"
5. “People should resolve their problems within their family or community, not by using lawyers or
courts”
Responses to the questions were on a five point scale, with overall findings shown in
Table 34. As can be seen, a good majority of respondents agreed that the courts are an
important way for ordinary people to enforce their rights (76.4 per cent) and that they
could expect a fair hearing in court (68.2 per cent). However, only a minority saw
lawyers as being affordable. Tying in with the finding, set out in Section 4, that
people tend not to regard justiciable problems as being „legal‟, the 2010 CSJPS
indicated that over 60 per cent of people agreed with the proposition that problems
should be resolved within families or the community, not by using lawyers or courts.
41
Wave 2 interviews took longer than anticipated and „attitudes to the justice‟ system questions were
removed to reduce interview time.

60
Table 34. Attitudes to the Civil Justice System
17 4.1% 15 3.6% 10 2.4% 11 2.7% 8 1.9%
45 10.9% 89 21.6% 48 11.7% 70 17.0% 75 18.2%
215 52.2% 169 41.0% 272 66.0% 254 61.7% 197 47.8%
88 21.4% 49 11.9% 51 12.4% 39 9.5% 85 20.6%
40 9.7% 79 19.2% 27 6.6% 34 8.3% 47 11.4%
7 1.7% 11 2.7% 4 1.0% 3 0.7% 0 0.0%
Table 35 explores whether responses to questions on attitudes to the justice system
were related to the number of problems reported by respondents. For the question
whether or not respondents would be confident of a fair hearing in court, the
percentage of respondents giving positive responses generally fell as the number of
problems increased. This was also broadly the case for the extent to which they felt
courts are an important way for ordinary people to enforce their rights. There was also
less support for problem resolution within families or the community among those
people experiencing multiple problems. There was relatively little evidence of
changes in positive responses as number of problems increased for questions
regarding the affordability of lawyers and whether people should follow laws even
when they believe it would be better not to.
Table 35 Positive statements made about the justice system by number of problems

61
Table 36 compares the responses of those respondents who had contact with a court or
tribunal and those who did not. Only those who experienced problems are included.
Those who had contact with courts or tribunals were somewhat more likely to agree
that they constitute an important way for ordinary people to enforce their rights,
though this was not reflected in their attitude towards whether they would receive a
fair hearing at court.
Table 36. Attitudes of respondents with civil justice problems, by contact with courts
or tribunals
Table 37 presents similar information, this time split by whether or not respondents
had obtained advice from a solicitor. It is noticeable that those who had used solicitors
were less likely than other groups to regard solicitors as unaffordable for people on
low incomes.

62
Table 37. Attitudes of respondents with civil justice problems, use of solicitor

63
8
The Experience of
Those Eligible for Legal Aid
This section sets out the pattern of experience of civil justice problems reported by
survey respondents who were likely to be eligible for legal aid. It details the general
incidence of problems among this population group, the experience of multiple
problems, and the consequences of these problems. This section also describes
problem resolution strategies, including how respondents seek advice and information
for their rights based problems (in person, over the telephone, on the internet etc.).
The outcomes of respondents‟ problems strategies are then outlined.
For the purpose of our analysis we created a legal aid proxy, derived from
means tested benefits status and income. All people on means tested benefits42
(15 per
cent) were included as eligible, plus those people with both a personal income less
than £10,000 and household income less than £25,000. The legal aid proxy we used
will not have directly equated to actual eligibility as, for example, it did not account
for capital. However, it represented a reasonably comprehensible and transparent
alternative. We also employ a composite income/legal aid eligibility variable by
dividing non-eligible respondents into 4 groups based on personal income levels
(<£15,000, £15,000-£24,999, £25,000-£39,999 and >£40,000).
Incidence of Problems Among those Eligible for Legal Aid
As in wave 1, overall, legal aid eligible respondents had a higher percentage with one
or more civil justice problem (364 of 928, 36.4 per cent) than ineligible respondents
(873 of 2,680, 32.6 per cent). Also as in wave 1, there were marked differences in
42
Unemployment related benefits, national insurance credits, income support, council tax benefit and
housing benefit.

64
types of problem reported by eligible and ineligible respondents (shown in Table 38).
Ineligible respondents were more likely to report consumer, employment and money
problems. In contrast, respondents eligible for legal aid were far more likely to report
problems associated with debt, rented housing, welfare benefits, relationship
breakdown, domestic violence and neighbours.
Table 38. Incidence of civil justice problems by eligibility for legal aid
Problem type Eligibility for Legal Aid
Ineligible Eligible
N % N %
Consumer 242 9.0% 62 6.7%
Employment 196 7.3% 47 5.1%
Neighbours 210 7.8% 108 11.6%
Owned housing 74 2.8% 9 1.0%
Rented housing 54 2.0% 59 6.4%
Money 152 5.7% 44 4.7%
Debt 85 3.2% 78 8.4%
Welfare benefits 83 3.1% 58 6.3%
Education 49 1.8% 22 2.4%
Personal injury 104 3.9% 34 3.7%
Clinical negligence 40 1.5% 19 2.0%
Divorce 28 1.0% 17 1.8%
Relationship breakdown 36 1.3% 41 4.4%
Domestic violence 26 1.0% 20 2.2%
Care proceedings 3 .1% 5 .5%
Figure 10 shows number of problems reported split by legal aid eligibility for
those reporting one or more problem (wave 2). As with wave 1, of those reporting
problems, legal aid eligible respondents were less likely to have a single problem
compared to ineligible respondents, and more likely to have larger numbers of
problems (and twice as likely to have five or more).
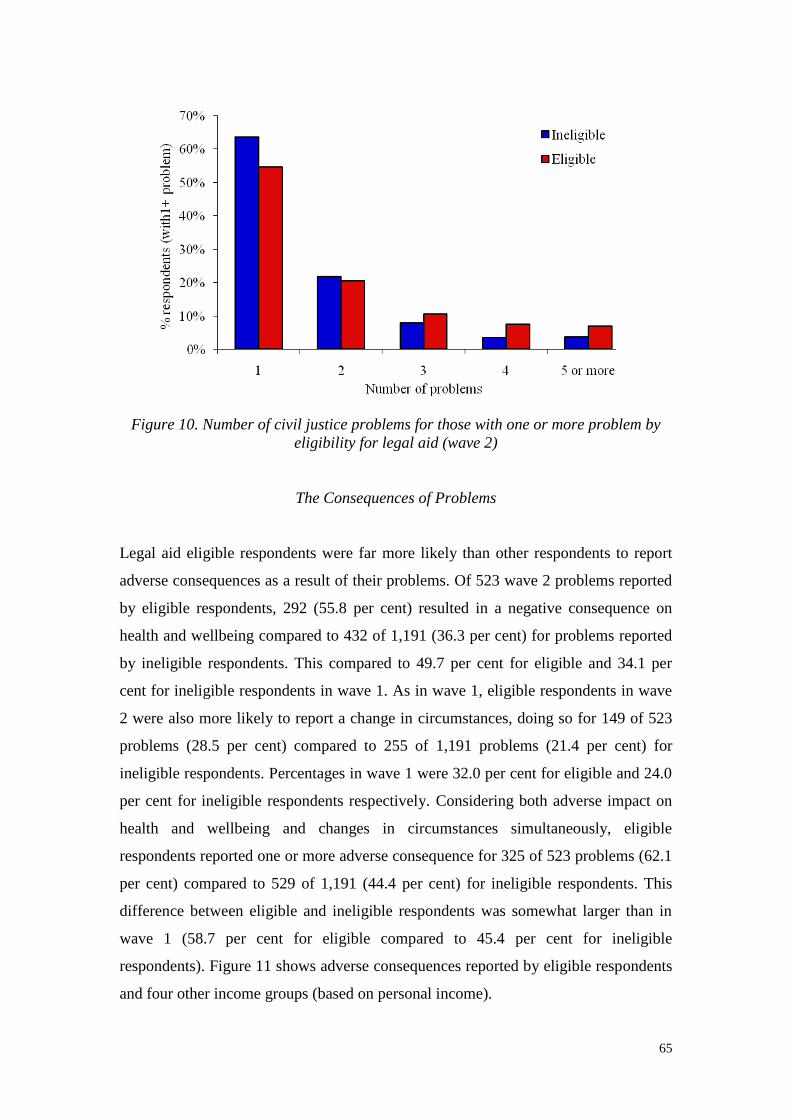
65
Figure 10. Number of civil justice problems for those with one or more problem by
eligibility for legal aid (wave 2)
The Consequences of Problems
Legal aid eligible respondents were far more likely than other respondents to report
adverse consequences as a result of their problems. Of 523 wave 2 problems reported
by eligible respondents, 292 (55.8 per cent) resulted in a negative consequence on
health and wellbeing compared to 432 of 1,191 (36.3 per cent) for problems reported
by ineligible respondents. This compared to 49.7 per cent for eligible and 34.1 per
cent for ineligible respondents in wave 1. As in wave 1, eligible respondents in wave
2 were also more likely to report a change in circumstances, doing so for 149 of 523
problems (28.5 per cent) compared to 255 of 1,191 problems (21.4 per cent) for
ineligible respondents. Percentages in wave 1 were 32.0 per cent for eligible and 24.0
per cent for ineligible respondents respectively. Considering both adverse impact on
health and wellbeing and changes in circumstances simultaneously, eligible
respondents reported one or more adverse consequence for 325 of 523 problems (62.1
per cent) compared to 529 of 1,191 (44.4 per cent) for ineligible respondents. This
difference between eligible and ineligible respondents was somewhat larger than in
wave 1 (58.7 per cent for eligible compared to 45.4 per cent for ineligible
respondents). Figure 11 shows adverse consequences reported by eligible respondents
and four other income groups (based on personal income).

66
0
10
20
30
40
50
60
70
Eligible <£15k £15k -£25k
£25k-£40k
£40k+
% r
esp
ondents
Any adverseconsequence
Health/wellbeingsuffered
Change incircumstances
Figure 11. Adverse consequences reported as a result of civil justice problems for
eligible respondents and with increasing personal income
Table 39 shows the specific adverse consequences on health and wellbeing reported,
split by eligibility for legal aid (for both wave 1 and wave 2). Table 40 presents
similar information for changes in circumstances.
74 7.3% 58 9.8% 95 8.0% 55 10.5%
171 16.9% 191 32.3% 250 21.0% 201 38.4%
20 2.0% 39 6.6% 35 2.9% 42 8.0%
10 1.0% 7 1.2% 17 1.4% 9 1.7%
2 0.2% 1 0.2% 1 0.1% 5 1.0%
64 6.3% 41 6.9% 79 6.6% 44 8.4%
25 2.5% 16 2.7% 20 1.7% 14 2.7%
58 5.7% 21 3.6% 50 4.2% 19 3.6%
120 11.8% 78 13.2% 159 13.4% 109 20.8%
84 8.3% 65 11.0% 118 9.9% 72 13.8%

67
20 2.0% 24 4.1% 17 1.4 12 2.3
43 4.2% 49 8.3% 57 4.8 46 8.8
51 5.0% 32 5.4% 49 4.1 34 6.5
9 0.9% 9 1.5% 4 0.3 6 1.1
42 4.1% 13 2.2% 35 2.9 18 3.4
33 3.3% 28 4.7% 39 3.3 31 5.9
146 14.4% 104 17.6% 162 13.6 85 16.3
9 0.9% 9 1.5% 9 0.8 7 1.3
Response to Justiciable Problems by Eligibility for Legal Aid
Table 41 shows response to civil justice problems by whether or not respondents were
eligible for legal aid. Wave 2 findings differed somewhat from those of wave 1. There
was no longer a discrepancy in inaction between ineligible and eligible respondents,
though the percentage doing nothing was higher for both groups than in wave 1.
Meanwhile, the percentage handling problems with informal help was slightly higher
for eligible respondents.
Table 41. Response to problem by legal aid eligibility (wave 1 and wave 2)
Response to problem
Eligibility for legal aid Did
nothing
Handled
alone
Handled with
informal help
Obtained
advice
Wave 1 Ineligible 102 561 172 332
8.7% 48.1% 14.7% 28.4%
Eligible 89 299 107 219
12.5% 41.9% 15.0% 30.7%
Wave 2 Ineligible 224 585 186 407
16.0% 41.7% 13.3% 29.0%
Eligible 101 242 118 197
15.3% 36.8% 17.9% 29.9%
As can be seen from Table 42, and as in wave 1, legal aid eligible respondents
who did seek advice were more likely than respondents in general to use face-to-face
advice as the predominant mode of contact from first advisers. Eligible respondents
were also less likely to use email/Internet. While rates of telephone advice were
broadly comparable by eligibility in wave 2, findings again showed that problems

68
reported by legal aid eligible respondents were more likely to tend towards face-to-
face provision.
Table 42. Method of first contact and predominant methods of contact for first
advisers by eligibility for legal aid (wave 2)
Ineligible Eligible
First contact Predominant
methods
First contact Predominant
methods
Method of contact N % N % N % N %
In person 141 39.7% 162 46.3% 74 50.0% 85 58.6%
Email/Internet 25 7.0% 45 12.9% 3 2.0% 5 3.4%
Telephone 152 42.8% 118 33.7% 62 41.9% 48 33.1%
Post 11 3.1% 17 4.9% 4 2.7% 5 3.4%
Through someone else 26 7.3% 8 2.3% 5 3.4% 2 1.4%
Problem Outcomes by Eligibility for Legal Aid
Table 43 shows problem outcome by whether or not respondents were eligible for
legal aid in both wave 1 and wave 2. Overall, broad outcomes were comparable
between eligible and ineligible respondents. However, in wave 2, eligible respondents
were somewhat less likely to resolve problems independently, while conclusion by
court or tribunal was higher in general for wave 2 and particularly high for ineligible
respondents. Figures 12 (wave 1) and 13 (wave 2) illustrate problem outcome by
response to problems for legal aid eligible respondents only. Comparable figures for
all respondents can be found in Figure 7 (wave 1) and Figure 8 (wave 2). Again,
courts, tribunals and other processes were most common outcomes where advice was
obtained, with agreement fairly consistent whether advice was obtained, the problem
was handled with informal help or handled alone. As previously, those who did
nothing, who were more common among eligible respondents, reported far lower
levels of agreement and high levels of giving up.
Table 43. Problem outcome by eligibility for legal aid
Wave 1 Wave 2
Legal aid eligibility Legal aid eligibility
How problem concluded Ineligible Eligible Ineligible Eligible
Court/tribunal 28 19 54 24

69
4.7% 5.9% 7.3% 8.9%
Other process 31 17 33 15
5.2% 5.3% 4.5% 5.6%
Agreement 259 119 294 113
43.7% 37.2% 39.9% 42.0%
Resolved independently 55 26 66 17
9.3% 8.1% 9.0% 6.3%
Problem resolved itself 110 72 156 56
18.5% 22.5% 21.2% 20.8%
Gave up 110 67 133 44
18.5% 20.9% 18.1% 16.4%
Figure 12. Outcome by response to problems (legal aid eligible respondents only -
wave 1)
0% 50% 100%
Did nothing
Handled alone
Handled with
informal help
Obtained advice
Concluded problems
Court/tribunal
Other process
Agreement
Resolved independently
Problem resolved itself
Gave up

70
0% 50% 100%
Did nothing
Handled alone
Handled withinformal help
Obtainedadvice
Concluded problems
Court/tribunal
Other process
Agreement
ResolvedindependentlyProblem resolveditself
Figure 13. Outcome by response to problems (legal aid eligible respondents only –
wave 2)