Embed Size (px)
Citation preview
University of Massachusetts Amherst University of Massachusetts Amherst
ScholarWorks@UMass Amherst ScholarWorks@UMass Amherst
Doctoral Dissertations Dissertations and Theses
October 2019
ENGINEERING OF AN ANTIBODY-CONJUGATED NANOGEL ENGINEERING OF AN ANTIBODY-CONJUGATED NANOGEL
PLATFORM FOR TARGETED DRUG DELIVERY TO T PLATFORM FOR TARGETED DRUG DELIVERY TO T
LYMPHOCYTES LYMPHOCYTES
Mine Canakci University of Massachusetts Amherst
Follow this and additional works at: https://scholarworks.umass.edu/dissertations_2
Part of the Biology Commons, and the Biotechnology Commons
Recommended Citation Recommended Citation Canakci, Mine, "ENGINEERING OF AN ANTIBODY-CONJUGATED NANOGEL PLATFORM FOR TARGETED DRUG DELIVERY TO T LYMPHOCYTES" (2019). Doctoral Dissertations. 1698. https://doi.org/10.7275/femp-f280 https://scholarworks.umass.edu/dissertations_2/1698
This Open Access Dissertation is brought to you for free and open access by the Dissertations and Theses at ScholarWorks@UMass Amherst. It has been accepted for inclusion in Doctoral Dissertations by an authorized administrator of ScholarWorks@UMass Amherst. For more information, please contact [email protected].
University of Massachusetts Amherst University of Massachusetts Amherst
ScholarWorks@UMass Amherst ScholarWorks@UMass Amherst
Doctoral Dissertations Dissertations and Theses
2019
ENGINEERING OF AN ANTIBODY-CONJUGATED NANOGEL ENGINEERING OF AN ANTIBODY-CONJUGATED NANOGEL
PLATFORM FOR TARGETED DRUG DELIVERY TO T PLATFORM FOR TARGETED DRUG DELIVERY TO T
LYMPHOCYTES LYMPHOCYTES
Mine Canakci
Follow this and additional works at: https://scholarworks.umass.edu/dissertations_2
Part of the Biology Commons, and the Biotechnology Commons
ENGINEERING OF AN ANTIBODY-CONJUGATED
NANOGEL PLATFORM FOR TARGETED DRUG
DELIVERY TO T LYMPHOCYTES
A Dissertation Presented
by
MINE OZDEN CANAKCI
Submitted to the Graduate School of the
University of Massachusetts Amherst in partial fulfillment
of the requirements for the degree of
DOCTOR OF PHILOSOPHY
September 2019
Program in Molecular and Cell Biology

© Copyright by Mine Ozden Canakci 2019
All Rights Reserved
ENGINEERING OF AN ANTIBODY-CONJUGATED NANOGEL PLATFORM
FOR TARGETED DRUG DELIVERY TO T LYMPHOCYTES
A Dissertation Presented
by
Mine Ozden Canakci
Approved as to style and content by:
____________________________________
Barbara A. Osborne, Co-chair
____________________________________
Sankaran Thayumanavan, Co-chair
____________________________________
Lisa M. Minter, Member
____________________________________
Scott C. Garman, Member
__________________________________ Scott C. Garman, Director
Program in Molecular and Cell Biology

DEDICATION
To my grandmother, Emine Saglam.
ACKNOWLEDGMENTS
I would like to thank my advisors Dr. Barbara A. Osborne and Dr. S.
Thayumanavan for providing me their guidance, wisdom and encouragement during
this long journey. I am extremely privileged and lucky to have two great mentors.
Their support and confidence in me meant everything.
I have many thanks to Osborne and Thayumanavan lab members. Gals of the
Osborne Lab: Becky Lawlor, Sudarvili Shanthalingam, Ankita Mitra and Jyothi
Vijayaraghavan. Thank you so much for your help and friendship. I was an honor to
work with you. I would also like to thank Khushboo Singh for being my side-kick for
the last two years.
Of course this journey would not been possible without my family. Thank you
mom and dad, for coming all the way from Turkey to feed me. I would also like to
thank my younger brother Utku Cem for visiting me almost every summer and my
aunt Mev and her son MJ. I am extremely lucky to have a family so close by, only two
hours away. Thank you so much for all your support and encouragement. MJ was only
two years old when I first arrived at Amherst, now he is almost ten. He wants to work
in nanotechonology when he grows up. I would like to say I inspired him but I
honestly think Ironman had more to do with that.
I would like to thank my friends Esra Esenlik and Onur Oztas for inviting me
to their dinner table every time I craved for Turkish cuisine. I would also like to my
colleagues Oyuntuya Munkhbat and Ilker Ozay for their support and friendship.
v
vi
ABSTRACT
ENGINEERING OF AN ANTIBODY-CONJUGATED NANOGEL PLATFORM
FOR TARGETED DRUG DELIVERY TO T LYMPHOCYTES
SEPTEMBER 2019
MINE OZDEN CANAKCI, B.S., BOGAZICI UNIVERISTY (ISTANBUL, TURKEY)
Ph.D., UNIVERSITY OF MASSACHUSETTS AMHERST
Directed by: Dr. Barbara A. Osborne and Dr. Sankaran Thayumanavan
In an ideal chemotherapy, cytotoxic drugs travel through the bloodstream,
reach cells all over the body and preferentially kill abnormal cells. Yet, the hydrophilic
or lipophilic property of the small-molecule drugs affects their ability to reach cells
from the bloodstream. So, only a small portion of the drug reaches to the diseased
tissue. A selective cell killing approach for cancer therapy gained momentum after the
realization that cancer cells carry unique set of molecular markers on their cell surface.
The development of antibody drug conjugates (ADC) revolutionized the targeted
approach for drug delivery. ADCs are composed of cytotoxic agents covalently linked
to a monoclonal antibody that can selectively bind to tumor-markers and deliver its
payload to tumor cells. So, off-target effect of the cytotoxic agents on the normal
tissue can be avoided. Currently there are four FDA approved ADCs on the market.
The number of ADCs in the clinical trials increases continuously even if some of them
fail in the efficacy studies. The reasons are cited as low payload capacity of the
monoclonal antibody as well as the limitations of the linker chemistry. Our goal in this
study is to enhance the antibody mediated targeted drug delivery approach by
vii
combining our knowledge in both immunology and polymer chemistry for the
treatment of T-cell acute lymphoblastic leukemia (T-ALL) in mouse models, we will
engineer anti-CD4 conjugated nanogels loaded with cytotoxic molecules that can: i)
selectively target CD4+ T lymphocytes in vitro and in vivo, and ii) eradicate both
liquid and solid T-ALL tumors in mouse.

viii
TABLE OF CONTENTS
Page
ACKNOWLEDGMENTS ...................................................................................................v
ABSTRACT ........................................................................................................................vi
LIST OF TABLES ..............................................................................................................xi
LIST OF FIGURES ...........................................................................................................xii
CHAPTER
1. GENERAL INTRODUCTION .............................................................................1
1.1 Brief history of chemotherapy ...................................................................... 1
1.2 Targeted therapy approach in cancer treatment ............................................ 3
1.3 Therapeutic application of antibodies ........................................................... 5
1.3.1 Monoclonal antibodies ....................................................................... 6
1.3.2 Antibody-drug conjugates .................................................................. 9
1.4 Nanoparticles as drug delivery vehicles ..................................................... 16
1.4.1 Advantages of the nanogel design ................................................... 19
1.5 Antibody conjugated nanoparticles............................................................. 21
2. DEVELOPMENT OF AN ANIMAL MODEL TO STUDY ANTI-CD4
CONJUGATED THERAPIES...........................................................................................23
2.1 Introduction ................................................................................................. 23
2.2 Results and Discussion ............................................................................... 25
2.2.1 Surface receptor analysis of mT-ALL cell lines .............................. 25
2.2.2 Transduction of mT-ALL cell lines with GLuc-IRES-mCD4 ......... 25
ix
2.2.3 Development of solid tumor on FVB/NJ mice with GLuc+ mT-ALL
cells ......................................................................................................... 27
2.2.4 Transduction of cell lines with mCD4-2A-effLUC ......................... 32
2.2.5 Development of solid tumor on FVB/NJ mice with effLuc+ mT-ALL
cells ........................................................................................................... 34
2.3 Conclusion .................................................................................................. 36
3. CONJUGATION OF ANTI-CD4 TO POLYMERIC NANOGEL .....................37
3.1 Introduction ................................................................................................. 37
3.2 Results and Discussion ............................................................................... 38
3.2.1 Conjugation of anti-CD4 to NG with a short linker ........................ 38
3.2.2 Conjugation of anti-CD4 to NG with a long linker ......................... 42
3.2.3 Selective cell uptake assay with anti-CD4PEG/NG-Rho ................... 46
3.2.4 Selective cell uptake assay with anti-CD4PEG/NG(DiI) ................... 48
3.2.5 Selective cell uptake assay with anti-CD4PEG/NG(Dox) ................. 51
3.2.6 Quantification of linker to antibody ratio by using NHS-PEG-PDS
polymer ..................................................................................................... 53
3.2.7 Targeted delivery of anti-CD4/NG(DiI) to CD4+ T cell in
splenocytes ................................................................................................ 57
3.2.8 Targeted delivery of anti-CD4/NG(DiO) to CD4high mT-ALL cells 58
3.2.9 Selective cell killing assay with anti-CD4/NG(DTX) ..................... 62
3.2.10 Preparation and purification of anti-CD4/NG-DM1 conjugate ..... 63
3.2.11 Selective cell killing assay with anti-CD4/NG-DM1 .................... 66
3.3 Conclusion .................................................................................................. 69
4. TARGETING CD4+ CELL IN VIVO WITH ANTI-CD4/NG CONJUGATES .......70
4.1 Introduction ................................................................................................. 70
4.2 Results and Discussion ............................................................................... 71
4.2.1 Tracking anti-CD4/NG(DiR) biodistribution in vivo ....................... 71

x
4.2.2 Treating mT-ALL tumors with anti-CD4/NG-DM1 ........................ 77
4.2.3 Studying anti-CD4/NG conjugate with organotypic tumor spheroids
in a 3D culture system............................................................................... 78
5. CONCLUSIONS AND FUTURE DIRECTIONS ..............................................82
6. MATERIALS AND METHODS ........................................................................84
6.1 Materials ..................................................................................................... 84
6.1.1 Mice ..................................................................................................... 84
6.1.2 Media ................................................................................................... 84
6.2 Methods ....................................................................................................... 84
6.2.1 mT-ALL cell culture conditions .......................................................... 84
6.2.2 mT-ALL cell surface staining .............................................................. 85
6.2.3 Retrovirus transfection of HEK293T ................................................... 86
6.2.4 Infection of mT-ALL cell lines ............................................................ 86
6.2.5 Synthesis of PEG:PDS random copolymer .......................................... 87
6.2.6 Preparation of nanogels ........................................................................ 87
6.2.7 Preparation of DM1 conjugated polymers ........................................... 88
6.2.8 Modification of anti-mCD4 with PEG linkers ..................................... 88
6.2.9 Splenocyte isolation from mouse ......................................................... 90
APPENDICES
A. 19F MRI of Polymer Nanogels Aided by Improved Segmental Mobility of
Embedded Fluorine Moieties .............................................................................................91
B. Polyamide Nanogels from Generally Recognized as Safe Components and Their
Toxicity in Mouse Preimplantation Embryos ....................................................................92
BIBLIOGRAPHY ..............................................................................................................92
xi
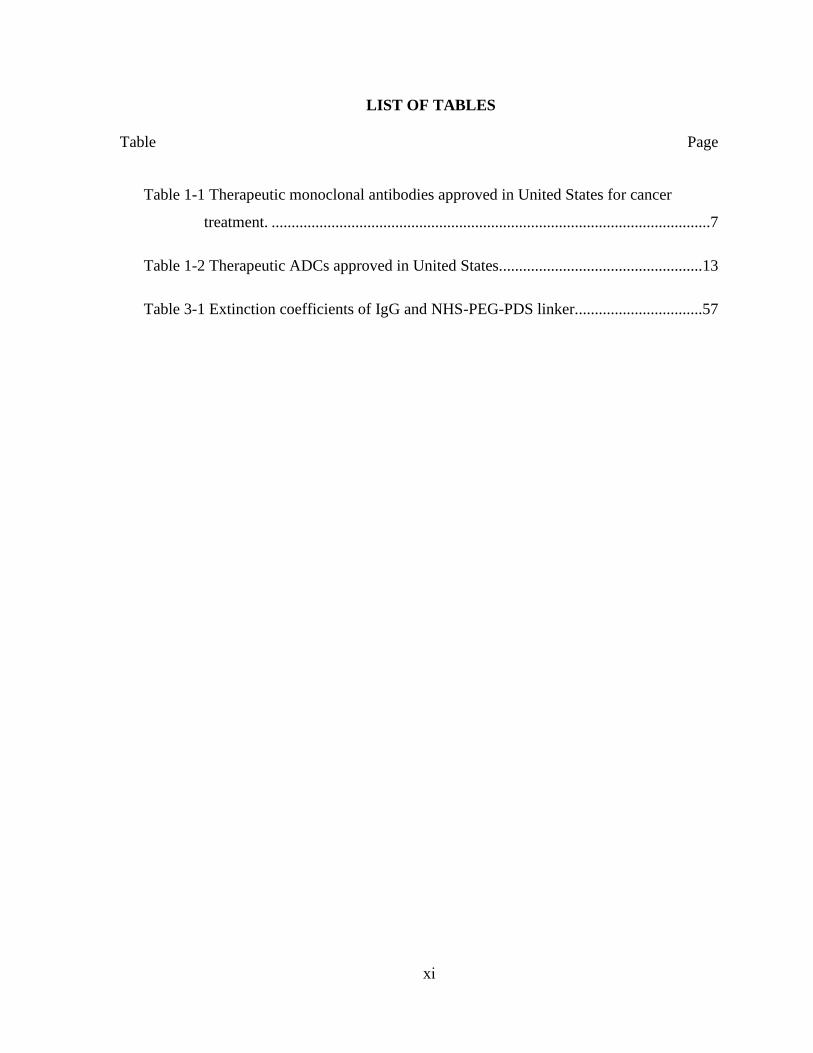
LIST OF TABLES
Table Page
Table 1-1 Therapeutic monoclonal antibodies approved in United States for cancer
treatment. ..............................................................................................................7
Table 1-2 Therapeutic ADCs approved in United States...................................................13
Table 3-1 Extinction coefficients of IgG and NHS-PEG-PDS linker. ...............................57
xii
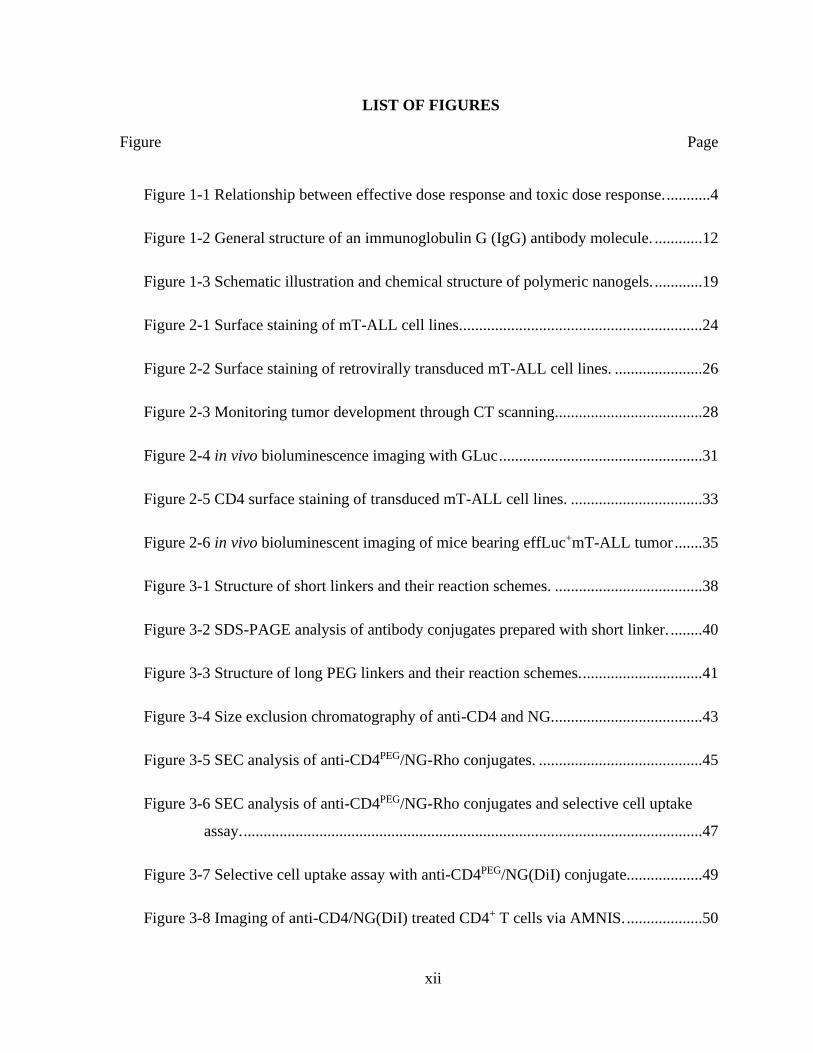
LIST OF FIGURES
Figure Page
Figure 1-1 Relationship between effective dose response and toxic dose response. ...........4
Figure 1-2 General structure of an immunoglobulin G (IgG) antibody molecule. ............12
Figure 1-3 Schematic illustration and chemical structure of polymeric nanogels. ............19
Figure 2-1 Surface staining of mT-ALL cell lines. ............................................................24
Figure 2-2 Surface staining of retrovirally transduced mT-ALL cell lines. ......................26
Figure 2-3 Monitoring tumor development through CT scanning.....................................28
Figure 2-4 in vivo bioluminescence imaging with GLuc ...................................................31
Figure 2-5 CD4 surface staining of transduced mT-ALL cell lines. .................................33
Figure 2-6 in vivo bioluminescent imaging of mice bearing effLuc+mT-ALL tumor .......35
Figure 3-1 Structure of short linkers and their reaction schemes. .....................................38
Figure 3-2 SDS-PAGE analysis of antibody conjugates prepared with short linker. ........40
Figure 3-3 Structure of long PEG linkers and their reaction schemes. ..............................41
Figure 3-4 Size exclusion chromatography of anti-CD4 and NG......................................43
Figure 3-5 SEC analysis of anti-CD4PEG/NG-Rho conjugates. .........................................45
Figure 3-6 SEC analysis of anti-CD4PEG/NG-Rho conjugates and selective cell uptake
assay. ...................................................................................................................47
Figure 3-7 Selective cell uptake assay with anti-CD4PEG/NG(DiI) conjugate...................49
Figure 3-8 Imaging of anti-CD4/NG(DiI) treated CD4+ T cells via AMNIS. ...................50
xiii
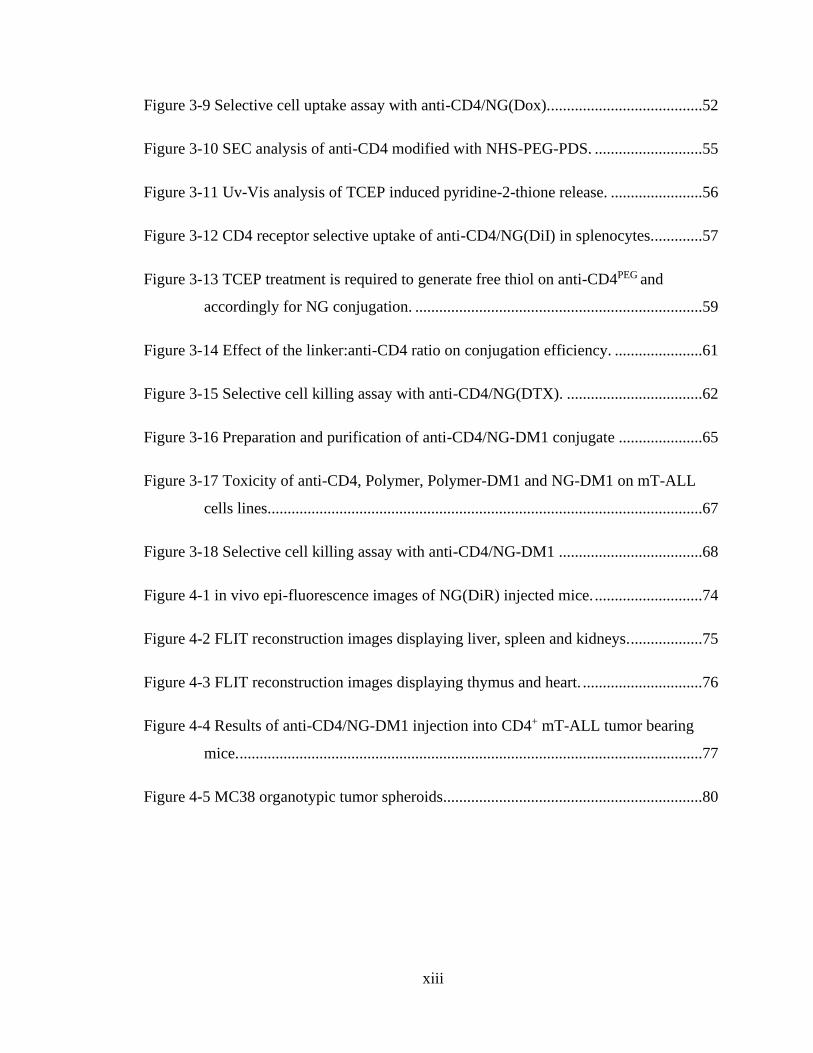
Figure 3-9 Selective cell uptake assay with anti-CD4/NG(Dox). ......................................52
Figure 3-10 SEC analysis of anti-CD4 modified with NHS-PEG-PDS. ...........................55
Figure 3-11 Uv-Vis analysis of TCEP induced pyridine-2-thione release. .......................56
Figure 3-12 CD4 receptor selective uptake of anti-CD4/NG(DiI) in splenocytes. ............57
Figure 3-13 TCEP treatment is required to generate free thiol on anti-CD4PEG and
accordingly for NG conjugation. ........................................................................59
Figure 3-14 Effect of the linker:anti-CD4 ratio on conjugation efficiency. ......................61
Figure 3-15 Selective cell killing assay with anti-CD4/NG(DTX). ..................................62
Figure 3-16 Preparation and purification of anti-CD4/NG-DM1 conjugate .....................65
Figure 3-17 Toxicity of anti-CD4, Polymer, Polymer-DM1 and NG-DM1 on mT-ALL
cells lines.............................................................................................................67
Figure 3-18 Selective cell killing assay with anti-CD4/NG-DM1 ....................................68
Figure 4-1 in vivo epi-fluorescence images of NG(DiR) injected mice. ...........................74
Figure 4-2 FLIT reconstruction images displaying liver, spleen and kidneys. ..................75
Figure 4-3 FLIT reconstruction images displaying thymus and heart. ..............................76
Figure 4-4 Results of anti-CD4/NG-DM1 injection into CD4+ mT-ALL tumor bearing
mice. ....................................................................................................................77
Figure 4-5 MC38 organotypic tumor spheroids.................................................................80
1
CHAPTER 1
GENERAL INTRODUCTION
1.1. Brief history of chemotherapy
Modern medicine starts with the discovery of penicillin, a small molecule drug
which is toxic to pathogenic bacteria but harmless to the human cell. Before penicillin,
bromine, mercury and arsenic-based products were used to treat infectious diseases
without substantial effect. These treatments as harmful to human cells as to pathogenic
microbes. Almost a century ago, Paul Ehrlich reasoned that the ideal therapeutic
approach to treat infections is the use of a chemical compound which targets and kills
the disease-causing organism selectively, sparing the host. He entitled this approach as
“chemotherapy” (Perry et al., 2012). So, the search for a “magic bullet” began after it
was conceptualized by him. The magic bullet concept remained as a theory until the
discovery of penicillin at the hands of Alexander Fleming (Fleming, 1929). Penicillin
selectively targets bacteria by affecting a unique feature present only in prokaryotic
organisms. During the last century, scientists took advantage of the distinct
mechanisms found in bacteria but absent in eukaryotes to generate a new class of
drugs called antibiotics, hence eliminating the most deadly disease which killed
millions of people throughout previous centuries.
Today, cancer has replaced infection in the feared disease list. Unlike
infection, cancer is caused by one’s own cells that gained ability to divide
uncontrollably and indefinitely through accumulated mutations. Unfortunately, the
magic bullet for cancer therapy is yet to be found, mainly because cancer cells differ

2
from the healthy cells in a subtle way—even capable of deceiving the immune system
which is otherwise effective at recognizing and destroying the abnormal cells—
making the drug development process challenging. Because the most apparent feature
of cancer cells is the rapid cell division cycle, the first treatment approach have been
the application of cytotoxic drugs blocking DNA synthesis as well as the replication
machineries. This modality—treatment of cancer using cytotoxic chemical agents—is
since called cancer chemotherapy. By the late 1980s, there were many cytotoxic drugs
identified or generated for this purpose. However, because chemotherapy alone is not
effective, it is often used in combination with radiation or surgery to achieve
synergistic anti-tumor effect (Perry et al., 2012; DeVita and Chu, 2008). Combination
chemotherapies gained significant approval as a contemporary approach, advanced the
clinical outcome and became the most common model for cancer therapy as it is still
in use today.
One of the first chemicals used for chemotherapy was the nitrogen mustard
against lymphomas (Gilman, 1963; Papac, 2001). Nitrogen mustard causes cell death
by alkylating the DNA and because lymphomas grow and divide more rapidly, they
are more prone to cell death by it. The idea behind this approach was “to destroy the
tumor before destroying the host” (Gilman, 1963) but the therapy was unsuccessful in
clinical trials. Although initial results indicated significant regression of tumor, it was
short lived. After patients displayed severe thrombocytopenia, the treatment had to be
stopped to allow bone marrow recovery. Unfortunately, tumor grew back during this
process. The second course of nitrogen mustard was less effective on tumor
suppression and the third course had very little effect (Gilman, 1963). This early study
3
asserts the challenges facing the chemotherapy or other types of cancer therapies.
Destroying the tumor before destroying the host is not a feasible approach. The magic
bullet of cancer therapy should be able to demonstrate its potent effect on the tumor
while sparing the host.
Most of the anticancer drugs in the market today are inefficient if the
administered dose is not near the maximum tolerated dose (MTD) (Chari et al., 2014;
Frei, 1992). Accordingly, in order to achieve a positive clinical outcome, dose of the
drug needs to be increased to a level at which damage to the normal tissue is
inevitable. This unintended toxicity of chemotherapy drugs is defined as the off-target
effect and it takes its toll on the cells with rapid proliferation cycles like the ones in the
gastrointestinal track and bone marrow (Perry et al., 2012). It is self-evident that
whether they are used alone or in combination, systemic toxicity of chemotherapy
could not be avoided and is a major burden. Because of these limitations, cancer
therapeutics are in dire need for new and better approaches to replace chemotherapy.
1.2. Targeted therapy approach in cancer treatment
Targeted therapy is one of those promising approaches with a potential to
replace chemotherapy in the future of cancer therapeutics. Its focus has been to
develop drugs in which the effective dosage is significantly lower than the MTD.
Briefly, the majority of chemotherapeutic small molecule drugs have a narrow
therapeutic window where the effective dosage overlaps with unacceptable toxicity
(Figure 1-1a). This limits the dose intensity—total amount of drug that is administered
in a certain time period—in the interest of avoiding systemic toxicity (Perry et al.,
2012). Targeted therapy aims to push the toxicity curve further away from the

4
effective dosage (Figure 1-1b) by increasing the potency of the drug or by improving
selectivity .
The most straightforward way to achieve a wide therapeutic window is to
increase the selectivity of the drug molecule. Throughout the years, in-depth research
of oncogenic pathways have revealed the distinction between the cancer and healthy
cells at a molecular level, thus identifying novel druggable targets that were unknown
before. A selective cell killing approach for cancer therapy gained momentum after the
realization that cancer cells carry unique set of molecular markers on their cell surface
as well as in the cytoplasm. Currently, among the notable technologies using this
approach are monoclonal antibodies and protein kinase inhibitors (Chari et al., 2014;
Sawyers, 2004; Singh et al., 2014; Zhang et al., 2009). Although my thesis research
focus is on the antibody mediated targeting, I would like to give a brief summary of
protein kinase inhibitors because they are an essential part of targeted therapies.
Figure 1-1 Relationship between effective dose response and toxic dose response.
(a) A hypothetical dose-response curve of a drug with narrow therapeutic index in
which the difference between effective and toxic dose is small.
(b) A hypothetical dose-response curve of a drug with wide therapeutic index.

5
Protein kinases emerged as a potential drug target because of their key role in
tumor cell proliferation and survival which are caused by either their overexpression
or mutation into constitutively active form (Sawyers, 2004; Zhang et al., 2009).
Consequently, instead of targeting the DNA machinery, new small-molecule agents
were designed to target particular tyrosine kinases as they are the critical regulators of
cancer cell proliferation. It is important to note that these agents were aimed to target
one specific kinase. The downside of this approach is the cancer cell’s ability to
evolve quickly to generate drug-resistant kinases. Furthermore, in clinical trials kinase
inhibitors exhibited unexpected toxicity due to incomplete pharmacological
examination of the kinase family proteins (Sawyers, 2004; Zhang et al., 2009).
1.3. Therapeutic application of antibodies
The function of antibody is to identify foreign invaders (viruses and bacteria)
by recognizing the antigens found on the surface of these invaders and tag them for
destruction. The functional domain of the antibody (Fc domain) binds to the Fc
receptor on the surface of phagocytes and informs them of the presence of invaders
which in turn activates the phagocytes. The immunological term for this function is
opsonization, originating from the Greek word opsōneîn that translates to “to prepare
for eating”. This is how a simple blood transfusion treated infectious diseases like
tetanus and diphtheria and awarded Nobel prices to Emil von Behring in 1901 and
Paul Ehrlich in 1902 (Dübel and Reichert, 2014). Because opsonization does not have
to be restricted to foreign invaders, for long it has been suggested that antibody
therapy could be applied to treat various other diseases by taking advantage of
oncogenic surface markers. In theory, malignant cells could be tagged with antibodies
6
for destruction through antibody-dependent cellular cytotoxicity (ADCC) and
complement-dependent cytotoxicity (CDC). The first roadblock was a manufacturing
issue. Unlike infection, cancer is a chronic disease and requires a long treatment
process. Therefore, the technology to produce large quantity of antibody for
therapeutic purposes were required. New opportunities aroused in 1970s after in vitro
production of monoclonal antibody in mouse cell culture was a success (Moldenhauer,
2014). However, unexpectedly, the application of murine-derived antibodies was
short-lived, for the research hit its second roadblock. Murine-derived antibodies
generated an immunogenic response in humans (Dübel and Reichert, 2014). As a
consequence, chimeric antibodies were constructed by replacing the most
immunogenic parts with human IgG sequences as well as improving the antigen
recognition domain to increase affinity (Dübel and Reichert, 2014; Saldanha, 2014).
So by the early 1990s, the technology for therapeutic antibodies was finally possible
and the next phase was the selection of an oncogenic target.
1.3.1. Monoclonal antibodies
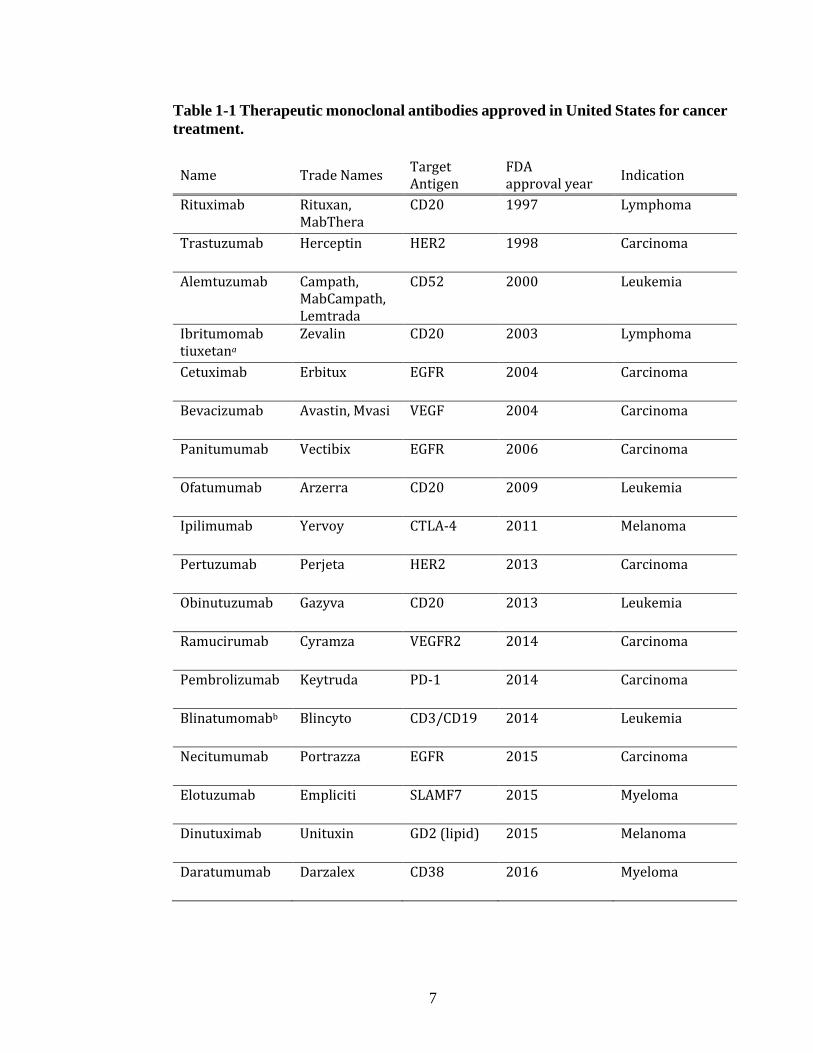
Since 1997, close to a hundred therapeutic antibodies entered the market with
one third of it targeting oncogenic antigens (Table 1-1) (Buss et al., 2012; Dübel and
Reichert, 2014; Scott et al., 2012). The most popular targets of therapeutic antibodies
are growth receptors (HER2, EGFR, VEGFR) for solid tumors whereas the B-
lymphocyte antigen CD20 is the choice for liquid tumors. The last couple of years, the
therapeutic antibody field was confronted with an unconventional oncogenic target
called PD-1 (Table 1-1). PD-1 is an acronym for programmed cell death protein-1 and
it is one of the surface receptors known to be suppressing the immune system and
7
Table 1-1 Therapeutic monoclonal antibodies approved in United States for cancer
treatment.
Name Trade Names Target Antigen
FDA approval year
Indication
Rituximab Rituxan, MabThera
CD20 1997 Lymphoma
Trastuzumab Herceptin HER2 1998 Carcinoma
Alemtuzumab Campath, MabCampath, Lemtrada
CD52 2000 Leukemia
Ibritumomab tiuxetana
Zevalin CD20 2003 Lymphoma
Cetuximab Erbitux EGFR 2004 Carcinoma
Bevacizumab Avastin, Mvasi VEGF 2004 Carcinoma
Panitumumab Vectibix EGFR 2006 Carcinoma
Ofatumumab Arzerra CD20 2009 Leukemia
Ipilimumab Yervoy CTLA-4 2011 Melanoma
Pertuzumab Perjeta HER2 2013 Carcinoma
Obinutuzumab Gazyva CD20 2013 Leukemia
Ramucirumab Cyramza VEGFR2 2014 Carcinoma
Pembrolizumab Keytruda PD-1 2014 Carcinoma
Blinatumomabb Blincyto CD3/CD19 2014 Leukemia
Necitumumab Portrazza EGFR 2015 Carcinoma
Elotuzumab Empliciti SLAMF7 2015 Myeloma
Dinutuximab Unituxin GD2 (lipid) 2015 Melanoma
Daratumumab Darzalex CD38 2016 Myeloma

8
promoting the self-tolerance. Cancer cells express PD-1 ligand protein (PD-L1) on
their surface to inhibit T cells in the tumor microenvironment and by doing so they
avoid destruction by the immune system. The inhibition of PD-1 and PD-L1
interaction by therapeutic antibody wakes the suppressed CD8 T lymphocytes so they
would recognize and attack the tumor (Dong et al., 2002; Topalian et al., 2012). These
antibodies are termed as immune checkpoint inhibitors in the literature.
Table 1-1 (Continued)
Name Trade Names Target
Antigen FDA
approval year Indication
Olaratumab Lartruvo PDGFR-α 2016 Sarcoma
Durvalumab Imfinzi PD-L1 2017 Carcinoma
Avelumab Bavencio PD-L1 2017 Carcinoma
Nivolumab Opdivo PD-1 2017 Carcinoma
Mogamulizumab Poteligeo CCR4 2018 Lymphoma
Moxetumomab Pasudotox
Lumoxiti CD22 2018 Leukemia
Cemiplimab Libtayo PD-1 2018 Carcinoma
Atezolizumab Tecentriq PD-L1 2019 Carcinoma
Abbreviations: CD, cluster of differentiation; HER, human epidermal growth factor receptor; EGFR, epidermal growth factor receptor; VEGF, vascular endothelial growth factor; VEGFR, vascular endothelial growth factor receptor; CTLA, cytotoxic T-lymphocyte-associated protein; PD-1, programmed cell death protein 1; PD-L1, programmed death-ligand 1; SLAMF, signaling lymphocyte activation molecule family protein; PDGFR-α, platelet-derived growth factor receptor α; CCR4, C-C chemokine receptor type 4
Note: Information current as of March 2019
a Radioimmunotherapy drug b bi-specific T-cell engager
9
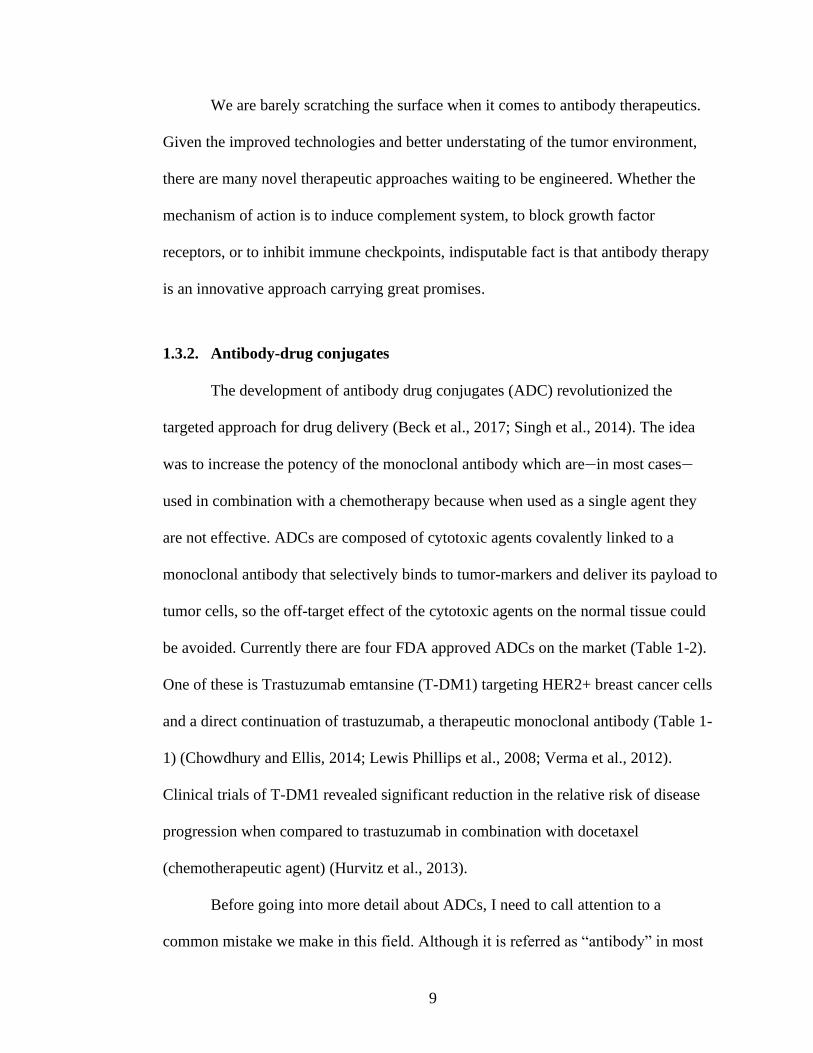
We are barely scratching the surface when it comes to antibody therapeutics.
Given the improved technologies and better understating of the tumor environment,
there are many novel therapeutic approaches waiting to be engineered. Whether the
mechanism of action is to induce complement system, to block growth factor
receptors, or to inhibit immune checkpoints, indisputable fact is that antibody therapy
is an innovative approach carrying great promises.
1.3.2. Antibody-drug conjugates
The development of antibody drug conjugates (ADC) revolutionized the
targeted approach for drug delivery (Beck et al., 2017; Singh et al., 2014). The idea
was to increase the potency of the monoclonal antibody which are—in most cases—
used in combination with a chemotherapy because when used as a single agent they
are not effective. ADCs are composed of cytotoxic agents covalently linked to a
monoclonal antibody that selectively binds to tumor-markers and deliver its payload to
tumor cells, so the off-target effect of the cytotoxic agents on the normal tissue could
be avoided. Currently there are four FDA approved ADCs on the market (Table 1-2).
One of these is Trastuzumab emtansine (T-DM1) targeting HER2+ breast cancer cells
and a direct continuation of trastuzumab, a therapeutic monoclonal antibody (Table 1-
1) (Chowdhury and Ellis, 2014; Lewis Phillips et al., 2008; Verma et al., 2012).
Clinical trials of T-DM1 revealed significant reduction in the relative risk of disease
progression when compared to trastuzumab in combination with docetaxel
(chemotherapeutic agent) (Hurvitz et al., 2013).
Before going into more detail about ADCs, I need to call attention to a
common mistake we make in this field. Although it is referred as “antibody” in most
10
of the literature as well as throughout this thesis, the correct nomenclature of these
molecules should be IgG. Antibody or immunoglobulin (Ig) refers to a much larger
class of proteins carrying antigen binding functions. Mammals carry 5 major
subclasses of antibodies in their genome; IgA, IgD, IgE, IgG, and IgM. ADCs employ
IgG subclass, particularly the IgG1 isotype because of its ability to initiate an immune
response.
The efficacy of the ADC depends on the following parameters; (i) drug to
antibody ratio, (ii) potency of the cytotoxic drug, (iii) stability of linker and drug
release mechanism, (iv) conjugation chemistry.
Drug to antibody ratio: The number of ADCs in the clinical trials increases
continuously even if some of them fail in the efficacy studies. The reasons are cited as
low payload capacity of the monoclonal antibody as well as the limitations of the
linker chemistry (Gordon et al., 2015; Jain et al., 2015; Singh et al., 2014). The drug to
antibody ratios (DARs) became the first focus point to increase the efficacy of ADCs.
Initial studies on the DAR resulted in an average of 3.5 where DARs ranging from 0 –
8 (Gordon et al., 2015; Hamblett et al., 2004). The link between DAR and its effect on
pharmacokinetics have been investigated. The results indicated that increasing DAR
higher than 3 had several disadvantages on the stability of ADCs since it increases the
hydrophobicity and decreases the serum half-life of the antibody (Hamblett et al.,
2004). Consequently, increasing the payload does not have any beneficiary effect on
the efficacy of ADCs.
Potency of the cytotoxic drug: The first generation of ADCs used
conventional chemotherapy drugs as payloads but because the number of drugs that

11
could be conjugated to antibody is limited, the potency was insufficient (Singh et al.,
2014). Therefore, the cytotoxic payload of the current generation of ADCs are derived
from highly potent anti-cancer agents like the enediyne, maytansine or auristatin class
of drugs. Calicheamicin is a member of enediyne class. It binds to DNA and cause
double-stranded DNA cleavage (Zein et al., 1988). Two of the ADCs on the market
(gemtuxumab ozogamicin and inotuzumab ozogamicin) are its conjugates (Table 1-2)
(Peipp and Gramatzki, 2014). Maytansine and auristatin, on the other hand, inhibit
microtubules. The commonly used derivatives of these molecules in ADC therapeutics
are DM1 and DM4 from the maytansine class, MMAE and MMAF from the auristatin
class (Doronina et al., 2003; Widdison et al., 2006). These molecules are demonstrated
to have IC50 ( 50% growth inhibition of cancer cells in vitro) values at picomolar
concentrations. However, their free drug forms failed to show potency in clinical trials
mostly because of low MTD (2 mg/m2 for maytansines, 0.4 mg/m2 for auristatins)
(Chabner et al., 1978; Perez et al., 2005; Singh et al., 2014).
Stability of linker and drug release mechanism: The covalent link between
the antibody and the cytotoxic agent determines the mode of the drug release. The
cytotoxic payload is expected to be delivered into the cytoplasm after ADC is taken up
by the cell. There are two modes of payload release mechanisms that have been
investigated: (i) with a cleavable linker—that is pH, redox or enzyme sensitive—the
cytotoxic payload could be released inside the cell upon internalization, (ii) with a
non-cleavable linker, the payload would be released when the ADC is degraded in the
lysozyme (Chalouni and Doll, 2018; Gordon et al., 2015; Perez et al., 2014). The
former comes with a stability problem since the cleavable linkers usually have higher

12
deconjugation rates in the serum. The latter’s disadvantage is the consequence of the
degradation process because after ADC is degraded, an amino acid-linker-cytotoxin
construct is released which in some cases lowers the potency of the cytotoxin. Because
of low DAR in ADCs, it is crucial to maintain the potency of the cytotoxin after
release. The linker engineering is a challenging problem and better designs are
required for the future generations of ADCs.
Conjugation chemistry: To understand the conjugation chemistry for
antibody conjugates, one first must understand antibody structure. Immunoglobulin G
(IgG) antibody is composed of two identical heavy (H) and two identical light (L)
chain polypeptides that are associated with each other through four interchain disulfide
Figure 1-2 General structure of an immunoglobulin G (IgG) antibody molecule.
(a) Surface modeling of the structure of an intact antibody (PDB ID: 1IGT) viewed by
UCSF Chimera program. Primary amine of the lysine residues are shown in green
color, disulfides are in red and glycan groups are in purple.
(b) Cartoon model of IgG structure.
13
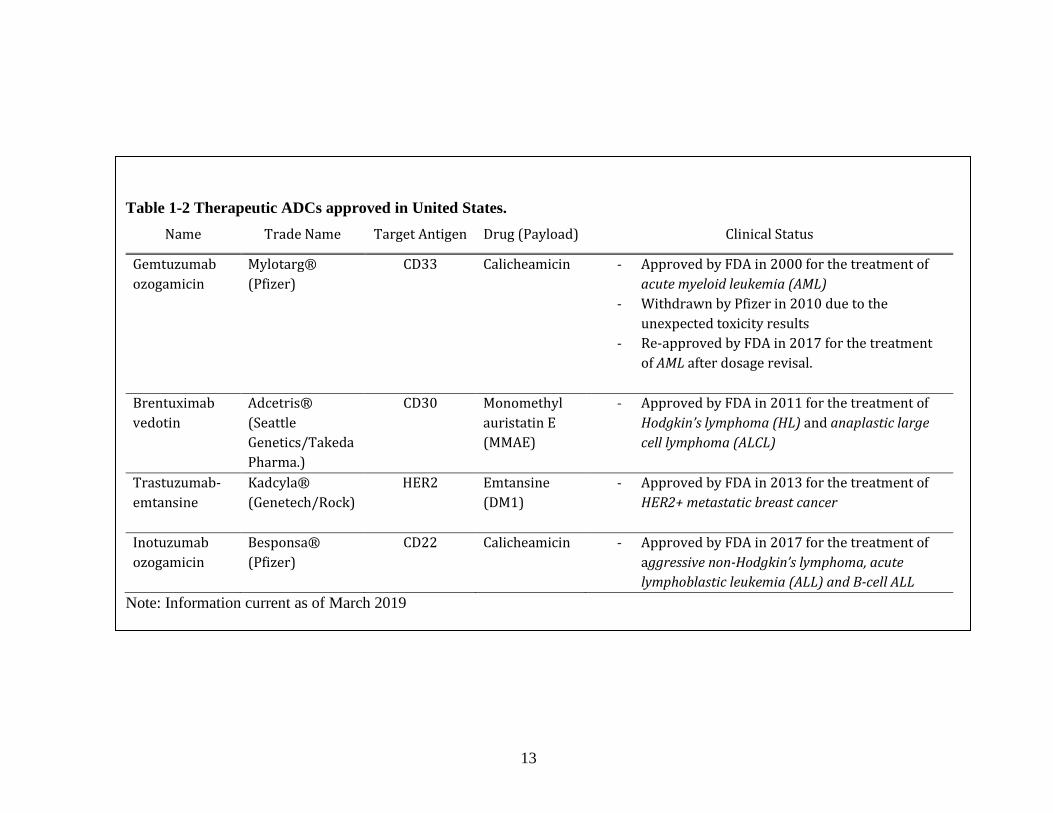
Table 1-2 Therapeutic ADCs approved in United States.
Name Trade Name Target Antigen Drug (Payload) Clinical Status
Gemtuzumab
ozogamicin
Mylotarg®
(Pfizer)
CD33 Calicheamicin - Approved by FDA in 2000 for the treatment of
acute myeloid leukemia (AML)
- Withdrawn by Pfizer in 2010 due to the
unexpected toxicity results
- Re-approved by FDA in 2017 for the treatment
of AML after dosage revisal.
Brentuximab
vedotin
Adcetris®
(Seattle
Genetics/Takeda
Pharma.)
CD30 Monomethyl
auristatin E
(MMAE)
- Approved by FDA in 2011 for the treatment of
Hodgkin’s lymphoma (HL) and anaplastic large
cell lymphoma (ALCL)
Trastuzumab-
emtansine
Kadcyla®
(Genetech/Rock)
HER2 Emtansine
(DM1)
- Approved by FDA in 2013 for the treatment of
HER2+ metastatic breast cancer
Inotuzumab
ozogamicin
Besponsa®
(Pfizer)
CD22 Calicheamicin - Approved by FDA in 2017 for the treatment of
aggressive non-Hodgkin’s lymphoma, acute
lymphoblastic leukemia (ALL) and B-cell ALL
Note: Information current as of March 2019

14
bonds (Figure 1-2). The H-chain consists of one variable and three constant
domains whereas the L-chain has one variable and one constant domain. Each of these
domains is the same size (110 amino acids long) and contains one intrachain disulfide
bond. The N-terminal variable domains of H- and L-chains form the antigen binding
site and give the antibody the ability to bind to two molecules of the same antigen
simultaneously. The antibody contains two antigen binding sites and one effector
domain. The antigen binding domain is called the Fab (antigen binding fragment) and
has the ability to bind antigen independent of the rest of the molecule. The Fc
(crystallizable fragment) carries out the effector function by interacting with Fc
receptors of several cells of the immune system. Antibodies also contain two
carbohydrate chains on the Fc region, which are important for Fc receptor recognition.
The Fab and Fc regions are connected by a hinge region, which gives this 150 kDa
molecule the requisite structural flexibility (Harris et al., 1997) (Figure 1-2). Because
of the reactivity of primary amines and thiols, lysine and cysteine residues are
commonly used as handles for protein modification. Lysine residues are randomly
distributed through the antibody and found in numbers of 80−90 per antibody. The
number of cysteines differs for each four subclasses of IgG. IgG1 is most commonly
used as a therapeutic agent and it has a total of 32 cysteine residues forming disulfide
bridges within the macromolecule. Twenty-four of these form intrachain disulfide
bonds and are, in general, considered to be stronger than the other 8 cysteines that
form interchain disulfide bonds, and two of these are located at the hinge region of the
antibody.
15
The majority of the current therapies use N-hydroxysuccinimide ester
(commonly referred as NHS ester) or maleimide type reactive groups targeting lysine
or cysteine residues, respectively (Hermanson, 2013a). The nucleophilic nature of the
primary amines on lysine residues makes them easy to target for NHS ester. The
random distribution of 80-90 lysines increases the chance of conjugation. For
example, the recommended molar ratio of commercially available NHS esters are 5 to
10 molar excess which yields 1 to 2 modification per antibody (Brun and Gauzy-Lazo,
2013). The desirable features of NHS ester is due to biologically stable nature of the
amide bond and ease of the conjugation method. One drawback of lysine conjugation
is the heterogeneity of the generated ADCs, in both stoichiometry and conjugation
site. However, so far technology for site-specific conjugation is made available only
for cysteine residues. Maleimide groups react with thiols to generate a thioether link
but because cysteine residues of antibody form disulfide bonds with each other,
additional steps are required to generate free thiols on the antibody (Gordon et al.,
2015; Hermanson, 2013b). This could be achieved either by using mild reducing
conditions that will break the disulfide bridges in the hinge region or by genetically
engineering free cysteine residues on antibody. Both approaches have been shown to
benefit the ADC technology due to the homogeneity of the product (Junutula et al.,
2008; Shen et al., 2012).
One vital roadblock facing the current ADC design is the effect of hydrophobic
drug molecules on the stability of antibody and this requires a new linker design (Beck
et al., 2017; Carter and Lazar, 2017; Lyon et al., 2015). The ADC must be stable in the
circulation so it could mimic the pharmacokinetic advantages of the naked antibody.
16
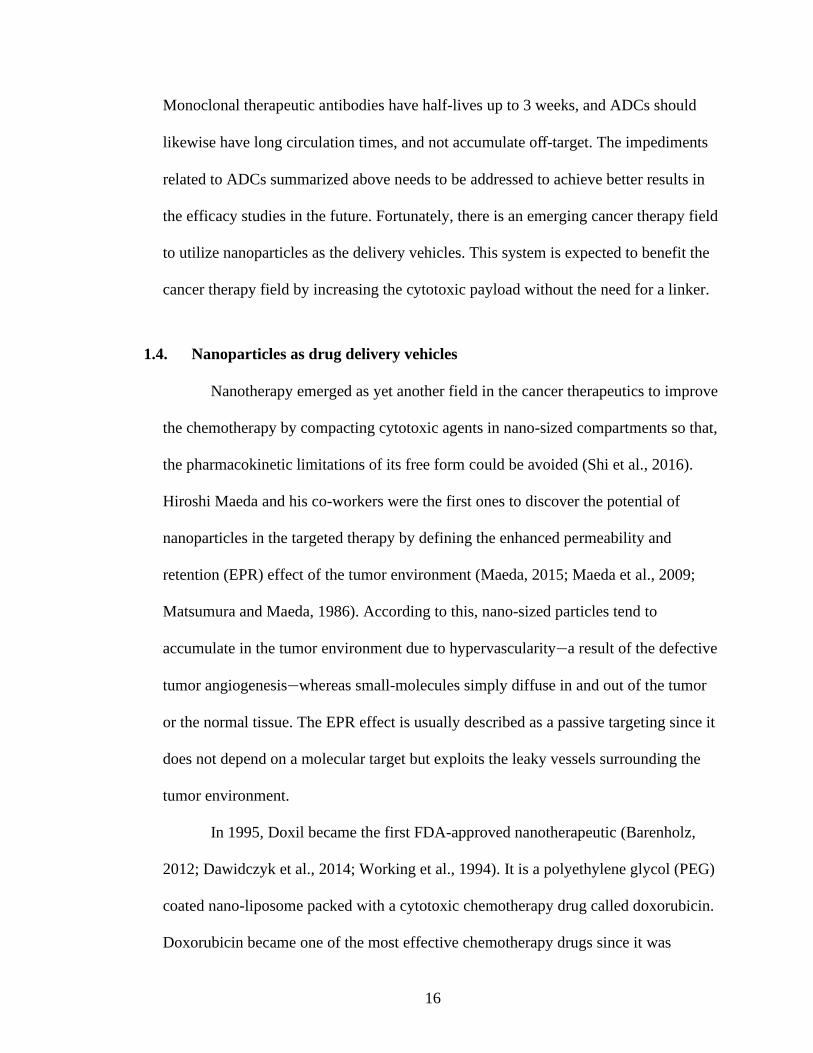
Monoclonal therapeutic antibodies have half-lives up to 3 weeks, and ADCs should
likewise have long circulation times, and not accumulate off-target. The impediments
related to ADCs summarized above needs to be addressed to achieve better results in
the efficacy studies in the future. Fortunately, there is an emerging cancer therapy field
to utilize nanoparticles as the delivery vehicles. This system is expected to benefit the
cancer therapy field by increasing the cytotoxic payload without the need for a linker.
1.4. Nanoparticles as drug delivery vehicles
Nanotherapy emerged as yet another field in the cancer therapeutics to improve
the chemotherapy by compacting cytotoxic agents in nano-sized compartments so that,
the pharmacokinetic limitations of its free form could be avoided (Shi et al., 2016).
Hiroshi Maeda and his co-workers were the first ones to discover the potential of
nanoparticles in the targeted therapy by defining the enhanced permeability and
retention (EPR) effect of the tumor environment (Maeda, 2015; Maeda et al., 2009;
Matsumura and Maeda, 1986). According to this, nano-sized particles tend to
accumulate in the tumor environment due to hypervascularity—a result of the defective
tumor angiogenesis—whereas small-molecules simply diffuse in and out of the tumor
or the normal tissue. The EPR effect is usually described as a passive targeting since it
does not depend on a molecular target but exploits the leaky vessels surrounding the
tumor environment.
In 1995, Doxil became the first FDA-approved nanotherapeutic (Barenholz,
2012; Dawidczyk et al., 2014; Working et al., 1994). It is a polyethylene glycol (PEG)
coated nano-liposome packed with a cytotoxic chemotherapy drug called doxorubicin.
Doxorubicin became one of the most effective chemotherapy drugs since it was
17
approved for cancer therapy in 1974. The mechanism of action is to block DNA
synthesis—like majority of conventional chemotherapy drugs—by inhibiting the
enzyme topoisomerase II. However, the usefulness of doxorubicin is restricted due to
a dangerous adverse effect of the drug on the cardiac tissue (Working et al., 1994).
Because the cardiotoxicity of doxorubicin is irreversible, scientists searched for
different formulation methods to increase the accumulation of drug in the tumor
environment. The result was the packaging of doxorubicin in nano-sized liposomes.
EPR-related pharmacokinetic of Doxil improved the clinical performance of
doxorubicin, hence establishing the superiority of nanoparticle based approaches on
the chemotherapy (Barenholz, 2012; Working et al., 1994). Moreover, liposomal
doxorubicin (Doxil) reduced the cardiotoxicity significantly. Another important lesson
learned from the development of this nanoparticle is the contribution of PEG on the
pharmacokinetics of Doxil. It has been shown that addition of PEG units on the
surface of the liposome reduced the immunogenicity and so increased the serum half-
life of the liposome (Duncan, 2006). In addition, the phagocytes of the immune system
are programmed to recognize the foreign antigens including nano-sized particles.
However, PEGylation has been shown to rescue nanoparticles from being engulfed
and hinder the protein adsorption (Harris and Chess, 2003; Jevševar et al., 2010).
Doxil opened the gates for nanotherapy, there are many following its footsteps.
New formulations of drug carriers now include a long list of molecules, from
polymeric nanoparticles to gold nanoparticles. Most of these products aim to improve
the pharmacokinetics of an existing drug—small molecule or peptide. For example,
PEGylation (conjugation of PEG to the therapeutic drug) since become a common
18
method to improve the serum circulation time (Duncan, 2006; Harris and Chess,
2003). The conjugation of hydrophobic drug molecules to hydrophilic polymers has
been carried out to improve pharmacokinetics of the drug. One of these hydrophilic
polymers is poly(N-(2-hydroxypropyl)methacrylamide (pHPMA) (Duncan, 2006).
Currently there are multiple variations of pHPMA drug conjugates in clinical trails.
But none of them have obtained approval from FDA thus far.
We are still at the very beginning of nanoparticle based therapies. Only limited
amount of study has been done with nanocarriers in vivo systems. We are yet to find
out the appropriate nanocarrier to facilitate drug delivery. Nevertheless,
nanotherapeutics have shown substantial growth over the few years. It is expanded
from simple and linear structures to more complex scaffolds that could respond to
external stimuli (Kakkar et al., 2017). The magic bullet is unattainable with
chemotherapy alone but may be achievable with complex drug delivery systems.
Nanotherapy may have the capacity and tools to evolve into such a system. My
research focuses on the formulation of a polymeric nanoparticle that has been a ctively
studied by Thayumanavan group over the years (Bickerton et al., 2012; González-Toro
et al., 2012; Gordon et al., 2018a; Liu and Thayumanavan, 2017; Ryu et al., 2010a,
2010b). Our goal is to adapt the current design into a targeted drug delivery platform.
19
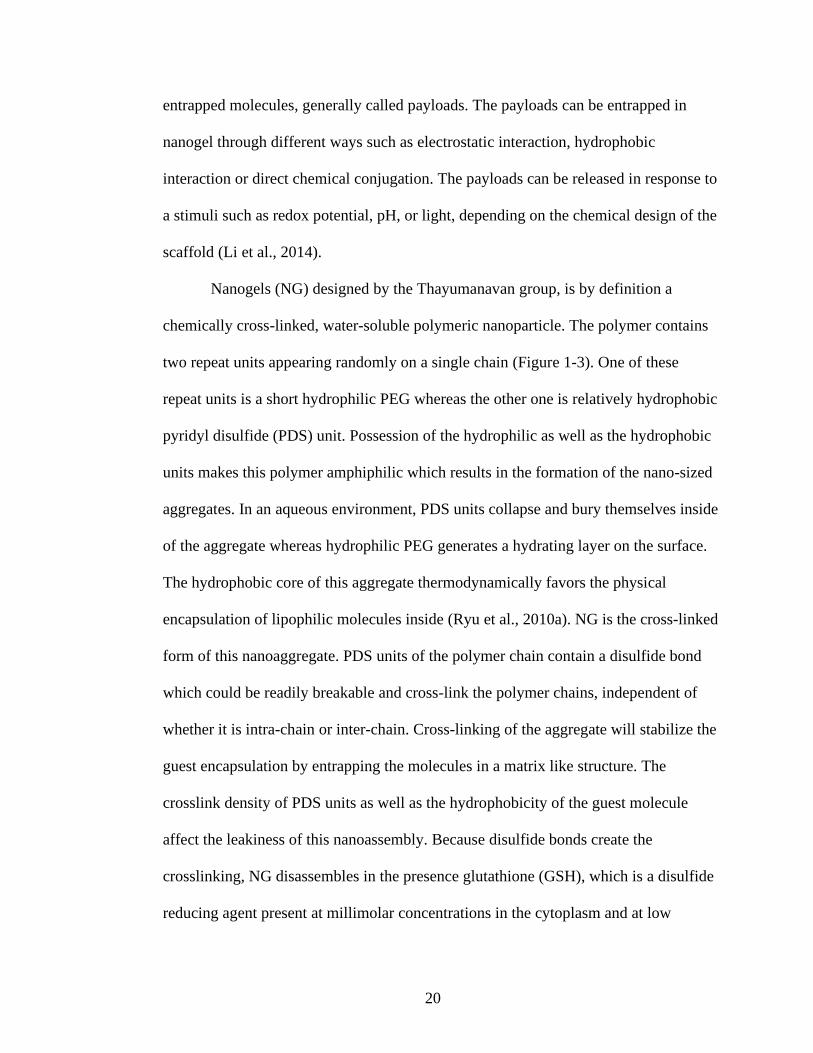
1.4.1. Advantages of the nanogel design
A nanogel is a type of polymeric nanoparticle that contains a crosslinked
hydrogel-like core. Its value as a biofunctional material has been studied extensively,
in the fields of sensing, diagnostics and drug delivery (Li et al., 2014). It could entrap
molecules physically or chemically inside its crosslinked core. Because of its nano-
size and colloidal stability, its in vivo applications are favored. One of its most
attractive quality is that versatile mechanism that can employed to release the
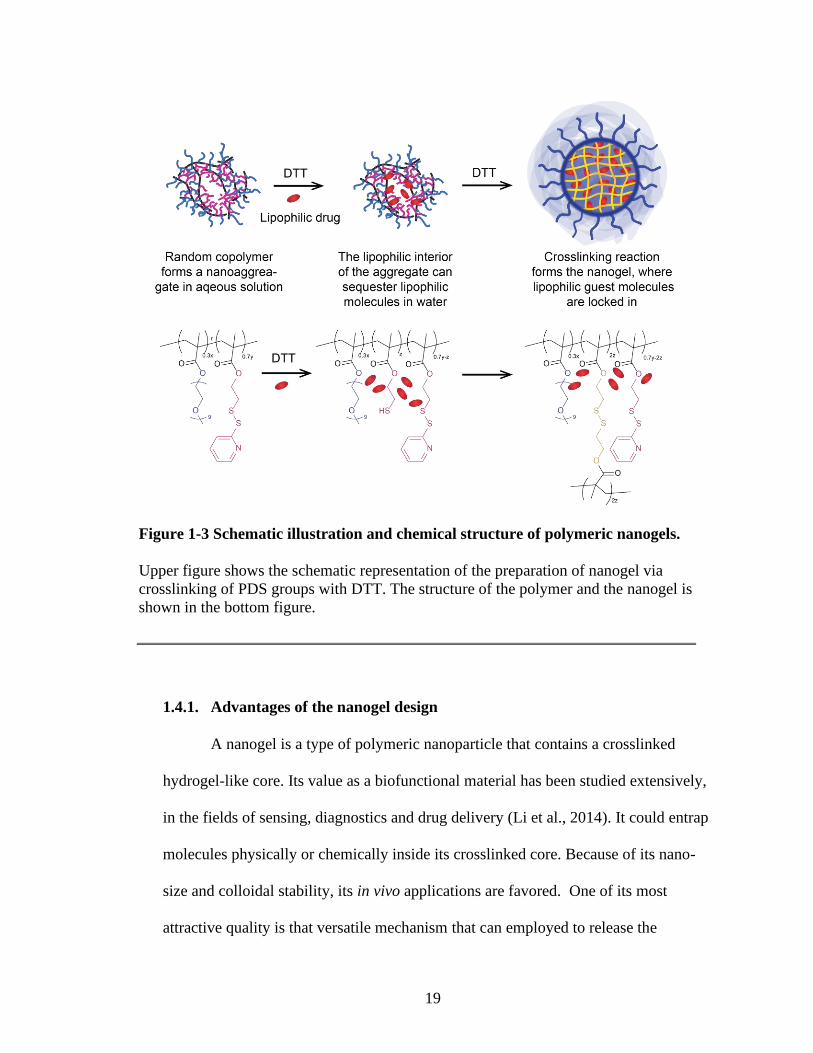
Figure 1-3 Schematic illustration and chemical structure of polymeric nanogels.
Upper figure shows the schematic representation of the preparation of nanogel via
crosslinking of PDS groups with DTT. The structure of the polymer and the nanogel is
shown in the bottom figure.
20
entrapped molecules, generally called payloads. The payloads can be entrapped in
nanogel through different ways such as electrostatic interaction, hydrophobic
interaction or direct chemical conjugation. The payloads can be released in response to
a stimuli such as redox potential, pH, or light, depending on the chemical design of the
scaffold (Li et al., 2014).
Nanogels (NG) designed by the Thayumanavan group, is by definition a
chemically cross-linked, water-soluble polymeric nanoparticle. The polymer contains
two repeat units appearing randomly on a single chain (Figure 1-3). One of these
repeat units is a short hydrophilic PEG whereas the other one is relatively hydrophobic
pyridyl disulfide (PDS) unit. Possession of the hydrophilic as well as the hydrophobic
units makes this polymer amphiphilic which results in the formation of the nano-sized
aggregates. In an aqueous environment, PDS units collapse and bury themselves inside
of the aggregate whereas hydrophilic PEG generates a hydrating layer on the surface.
The hydrophobic core of this aggregate thermodynamically favors the physical
encapsulation of lipophilic molecules inside (Ryu et al., 2010a). NG is the cross-linked
form of this nanoaggregate. PDS units of the polymer chain contain a disulfide bond
which could be readily breakable and cross-link the polymer chains, independent of
whether it is intra-chain or inter-chain. Cross-linking of the aggregate will stabilize the
guest encapsulation by entrapping the molecules in a matrix like structure. The
crosslink density of PDS units as well as the hydrophobicity of the guest molecule
affect the leakiness of this nanoassembly. Because disulfide bonds create the
crosslinking, NG disassembles in the presence glutathione (GSH), which is a disulfide
reducing agent present at millimolar concentrations in the cytoplasm and at low
21
micromolar concentrations in the extracellular environment. Thus, in the cytoplasm,
NG breaks open and releases the guest molecules (Ryu et al., 2010a).
The advantage of this nanogel design can be exploited with the ease of
formulation. The size of the particle is controlled by varying the salt concentration and
the temperature as well as changing the molecular weight of the polymer. By using
this system, we can easily tune the size of the NG from 5 nm to 200 nm. It is important
to achieve nanoparticles lower than 50 nm size since they have been shown to be able
to penetrate even the poorly permeable tumors. Therefore, NG, combined with its low
toxicity, shows great promise for the development of nanoparticle based therapies.
Moreover, PDS units on the NG are an excellent handle for surface modification
because they exhibit robust reactivity towards the attack of free thiol containing
molecules due to leaving character of pyridine-2-thione (Ryu et al., 2010a, 2010b).
1.5. Antibody conjugated nanoparticles
Nano-sized drug delivery system demonstrated the power of passive targeting
in cancer therapeutics. However, by introducing an active targeting unit would
improve the system even further. This could be achieved by decorating the
nanoparticles with biologically relevant ligands or with antibodies and thus generated
a more selective nanotherapeutic. Besides, this would be beneficial for ADC field as
well. Compared to ADCs, nanoparticles have superior payload capacity, simpler
design for drug conjugation and release. Additionally, the ADCs in clinical trials
proved to be less effective against solid tumors. This issue could be approached with
the passive targeting ability of nanoparticle. Benefits of ADC and nanoparticle
technologies are summarized in the following statements:
22
i. ADCs, on average contain 3-4 molecules per antibody, so for this therapy to be
effective cytotoxic drug should work in picomole concentrations whereas
nanoparticles have more flexibility and could carry hundreds of molecules if
needed.
ii. ADCs require sophisticated drug linker and cleavage strategies whereas for
nanoparticles the payload could be noncovalently encapsulated in the
hydrophobic core.
iii. Thanks to lock and key recognition of antibody, cytotoxic drug could be delivered
to the right target cell. In the case of nanoparticles the targeting effect is a passive
one where particles accumulate in the tumor are due to EPR effect.
iv. Because of their nature, ADCs have been effective against liquid tumors (blood
related tumor), whereas nanoparticles effective against solid tumors.
Overall, the magic bullet of cancer therapeutics might be very well a
combination of both of these therapies in which antibodies act as targeting missiles
and nanoparticles as the shell for the gunpowder. The extent of antibody-nanoparticle
conjugates reported in the literature for drug delivery applications are somewhat
limited. The conjugation methods vary depending on the functional group
incorporated on the nanoparticle. The goal of my project is to design a method to
conjugate antibody to NG without altering the polymer or nanogel synthesis as well as
to generate in vitro and in vivo assays to test the selectivity of antibody-NG
conjugates.
23
CHAPTER 2
DEVELOPMENT OF AN ANIMAL MODEL TO STUDY ANTI-CD4
CONJUGATED THERAPIES
2.1. Introduction
Acute lymphoblastic leukemia (ALL) is an aggressive form of leukemia that
requires intensive chemotherapy treatment. It was the fifth most common cause of
cancer deaths in men and the sixth in women in the US between 2005 and 2011
(http://www.leukemia-lymphoma.org). ALL originates in the bone marrow. Once the
marrow cell turns into a leukemic one, it surpasses the development of normal cells in
the bone marrow as a result of its rapid proliferation cycle. T cell originated ALL, also
called T-ALL, represents around 15% of pediatric and 25% of adult ALL cases
(Demarest et al., 2008).
In our research, we wanted to generate a mouse model which would
recapitulate T cell leukemia and enable us to study the effect of antibody conjugated
nanogels. For this reason, we decided to use a primary mouse tumor instead of the
more commonly used xenograft models. Xenotransplantation of human carcinoma cell
lines to mouse is possible only if the animals are immunodeficient. However, the
emphasis on cancer immunotherapy is growing every day and we know the significant
role immune system takes place in the tumor development. Therefore, using a
xenograft model would not be a rational approach. The objective of generating a
mouse tumor model was to recapitulate the phenotypic features of the disease
progression more efficiently by keeping the immune system intact, and thus mimic the
24
normal disease progression. In addition, using leukemic cell lines would allow us to
generate solid tumors as well as liquid one.
We collaborated with Justine Roderick from Prof. Michelle Kelliher’s group in
UMASS Medical School. They use Tal1/Lmo2 transgenic mouse in which tal1 and
lmo2 mis-expression results in the generation of spontaneous mutation in Notch1 and
subsequently in the development of T cell leukemia (Draheim et al., 2011; Kelliher et
al., 1996; Roderick et al., 2014; Tatarek et al., 2011).
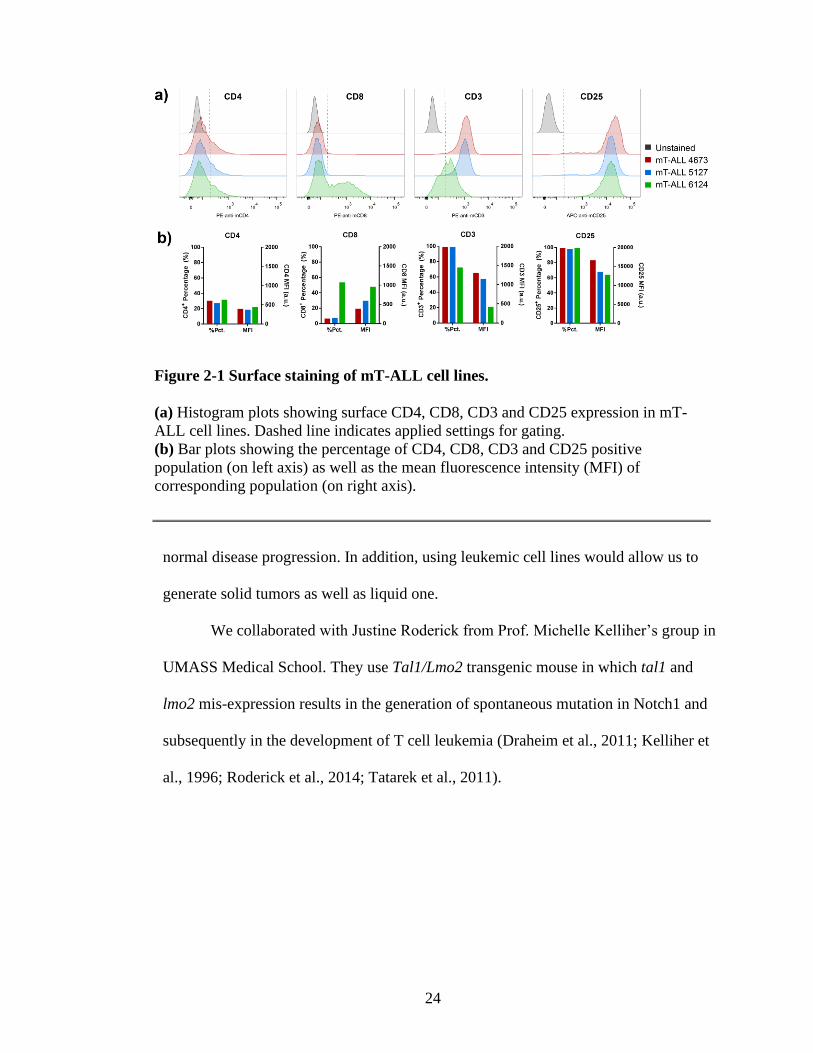
Figure 2-1 Surface staining of mT-ALL cell lines.
(a) Histogram plots showing surface CD4, CD8, CD3 and CD25 expression in mT-
ALL cell lines. Dashed line indicates applied settings for gating.
(b) Bar plots showing the percentage of CD4, CD8, CD3 and CD25 positive
population (on left axis) as well as the mean fluorescence intensity (MFI) of
corresponding population (on right axis).
25
2.2. Results and Discussion
2.2.1. Surface receptor analysis of mT-ALL cell lines
T-ALL cell phenotypes are divided into four groups: DN (double negative or
CD4-CD8- ), DP (double positive or CD4+CD8+ ), CD4SP ( CD4 single positive or
CD4+CD8- ) and CD8SP ( CD8 single positive or CD4-CD8+ ). The two of the cell
lines (4673 and 5127) we received from Kelliher group were CD4SP and one of them
(6124) was a mixture of CD4SP and CD8SP. These mouse T-ALL (mT-ALL) cell
lines were originally isolated from Tal1/Lmo2 transgenic mice (FVB/NJ background)
after the development of leukemia and adapted to in vitro culture (Draheim et al.,
2011; Tatarek et al., 2011).
The cell surface staining of mT-ALL cell lines 4673, 5127 and 6124 exhibited
inconsistent results in regard to CD4 expression levels (Figure 2-1). Only 20% of the
mT-ALL cells had CD4 positive population but with relatively low fluorescence
intensity (Figure 2-1b). Although the reason of this phenomenon is unknown, the
adaptation to in vitro cell culture conditions was assumed to be the cause. In addition,
these cell lines showed high levels of CD25 and CD3 expression. As expected, 50% of
the mT-ALL 6124 cell line was CD8 positive (Figure 2-1b).
2.2.2. Transduction of mT-ALL cell lines with GLuc-IRES-mCD4
To ensure these cells express the target antigen CD4 on their surface, I decided
to transduce the cell lines with a construct containing mouse CD4 gene. Furthermore,
a luciferase reporter gene was also included in the plasmid allowing localization of the
tumor and to be able to monitor its progression in vivo without a need to sacrifice the
26
animal. The mouse CD4 sequence was cloned from pBS mCD4 (Addgene #14613)
into pMIGRII vector after Gaussia luciferase (GLuc) gene and IRES (internal
ribosomal entry site) sequence. GLuc is a reporter protein derived from marine
copepod Gaussia princeps and it is over one thousand fold more sensitive than the
firefly luciferase, most common luciferase enzyme of the field (Tannous, 2009;
Tannous et al., 2005). Moreover, unlike luciferase, GLuc enzyme’s reaction has fast
kinetics and so in vivo imaging could be carried out within minutes after the substrate
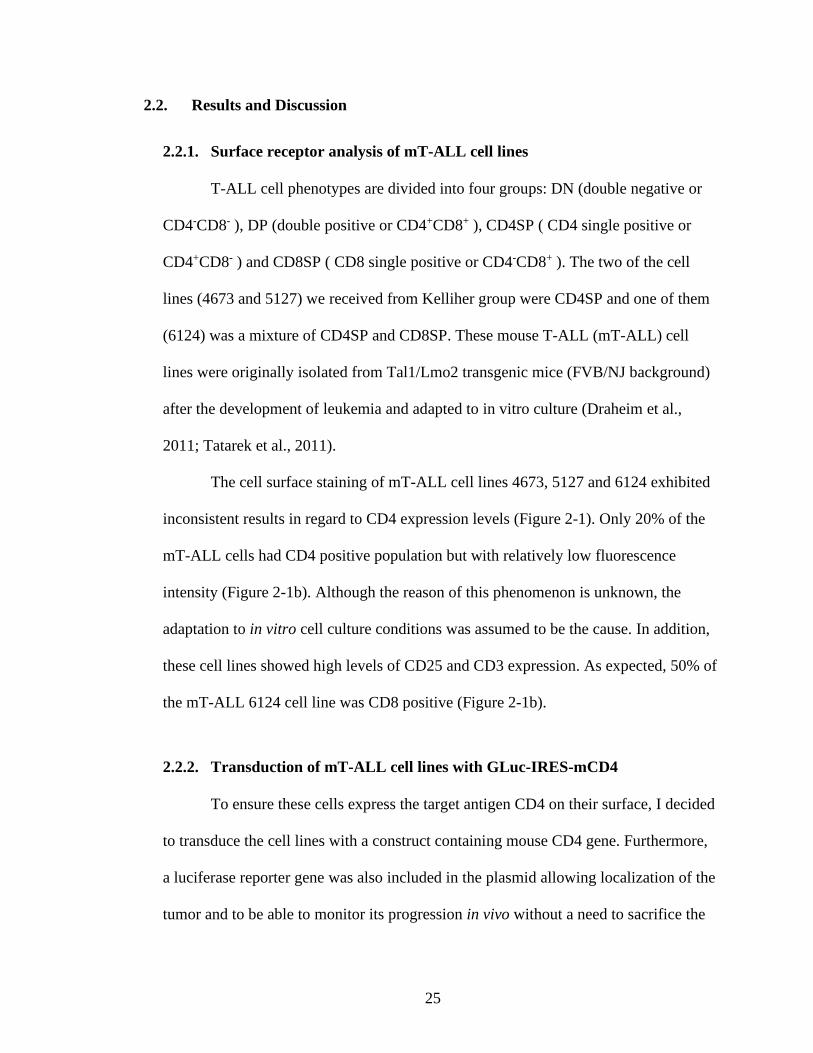
Figure 2-2 Surface staining of retrovirally transduced mT-ALL cell lines.
(a) Histogram plots showing surface CD4 expression of mT-ALL cell lines before and
after transduction. Dashed line indicates the applied gating settings.
(b) Bar plot of CD4 positive population (on the left) and MFI values of CD4 positive
population (on the right).
(c) in vitro luciferase assay of transduced cells verifying the expression of extGLuc
enzyme.

27
injection. On the other hand, firefly bioluminescence signal peaks 15-20 minutes after
its substrate administered into the mouse.
One major drawback is that GLuc is a secreted protein. Although this might
provide advantages in other fields, for in vivo tumor localization it creates a problem
by diluting the signal. Fortunately, Prof. Brentjens and his group generated a
genetically engineered version of GLuc—called extGLuc—by fusing the carboxy
terminus of the enzyme with a human CD8 transmembrane domain (amino acids 137–
212) (Santos et al., 2009). The ExtGLuc detains the bioluminescent signal on the cell
and thus makes a better reporter for in vivo imaging.
mT-ALL cells were infected with a retrovirus containing the extGLuc-IRES-
mCD4 construct. Retroviral transduction of the cell lines with 100% retroviral
supernatant was too toxic for the cell lines. But when retroviral supernatant was
diluted in the media with final concentration of 20% or 50%, a higher rate of cell
survival as well as good transduction efficiency was observed especially for m-TALL
4673 and 5127. Unfortunately, transduction of the cell line 6124 did not produce a cell
line with relatively high extGLuc or CD4 expression as can be seen by Figure 2-2 and
because this cell line also had CD8+ population, this cell line was discontinued for
further use. CD4 positive cell population of mT-ALL 4673 and 5127 were sorted by
flow cytometry to eliminate untransduced cells.
2.2.3. Development of solid tumor on FVB/NJ mice with GLuc+ mT-ALL cells
To generate a solid tumor, 1.5 – 2 x 10⁶ CD4+ GLuc+ mT-ALL cells were
injected into the flanks of 6 - 8 weeks of FVB/NJ mice subcutaneously. The animals
were irradiated with 500 rad 4 hours beforehand to ensure tumor growth. Irradiation
28
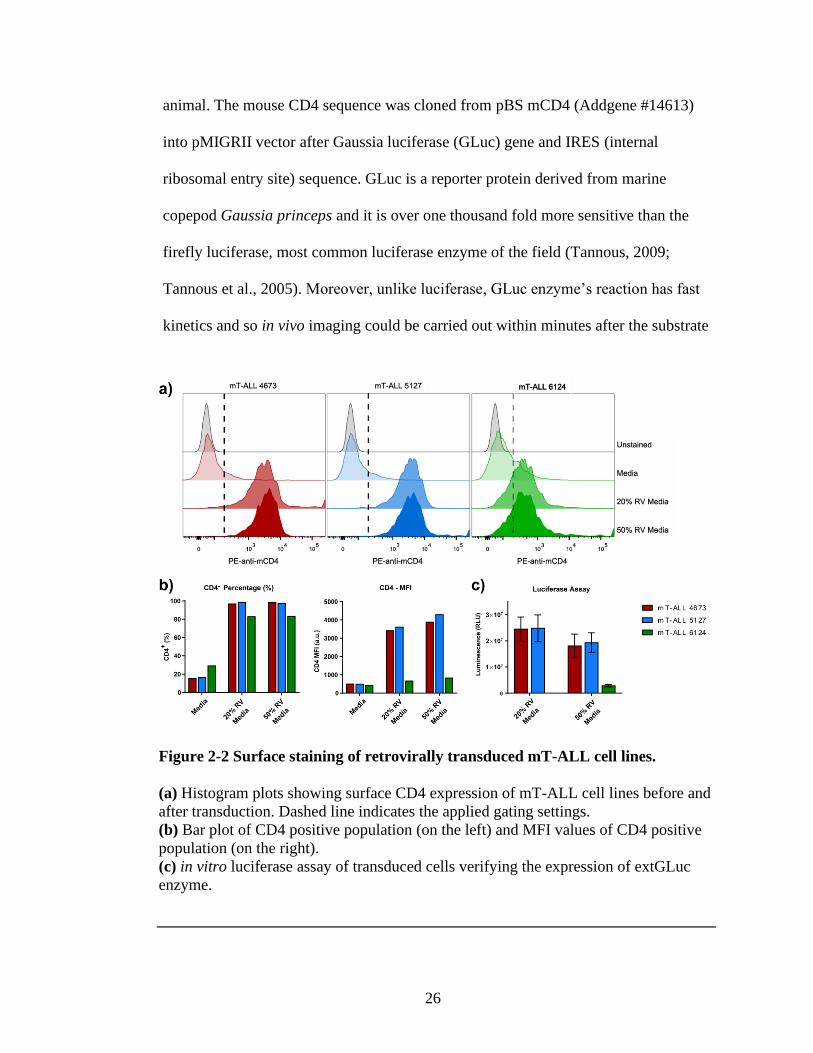
was necessary to weaken the immune system and allow the tumor growth. The tumor
growth were monitored through CT (computerized tomography) scans which also
allows us the measure the exact volume of the tumor (Figure 2-3a). A tumor bump
was visible by day 10 post-injection. Tumor growth also increased the overall body
weight of tumor bearing mice (Figure 2-3c). By day 28 some of the mice showed
enlarged lymph nodes (Mouse #2 from Figure 2-3a is an example). To understand
whether the tumor spread to other tissues or not, mice were sacrificed and the
Figure 2-3 Monitoring tumor development through CT scanning.
(a) CT scan images of two mice bearing CD4+GLuc+ mT-ALL tumors at days 6,12
and 28 post-injection.
(b) in vitro luciferase assay with 1x10⁶ cells harvested from mice shown in (a) at day
28. Error bars indicate SD of three replicates.
(c) Percentage of weight change observed after tumor inoculation. Each lines
represents on animal. n = 5 for control mice (black lines) and n = 8 for CD4+GLuc+
mT-ALL injected mice (gray lines).

29
following tissues were harvested from the animal: tumor, spleen, liver and lymph
nodes.
In vitro bioluminescence assay was performed with 1 x 10⁶ live cells in triplets
and EL4 cell line was used as a negative control (Figure 2-3b). The results showed the
metastasis of mT-ALL cells from the injection location to other organs. I was also able
to calculate the fraction of mT-ALL cells in the collected tissue by assuming that the
tumor tissue was consisting of sole mT-ALL cells. According to this calculation, mT-
ALL cells composed 4% and 1% of the splenocytes harvested from Mouse #1 and #2,
respectively. Furthermore, as expected lymph nodes showed high percentage of mT-
ALL, 8% for Mouse #1 and 150% for Mouse #2. The irrational 150% is due to high
percentage of death cells found in the tumor tissue. Nevertheless, the enlarged lymph
nodes of Mouse #2 was as expected an indicator of lymphoma.
For in vivo bioluminescence imaging, the GLuc substrate coelenterazine was
injected at the dose of 3 mg per kg of body weight. Unlike luciferin—firefly luciferase
substrate—coelenterazine is insoluble in water due to its hydrophobicity and requires
intravenous injection. Unfortunately, this created a problem for us because normally
the injection through the tail vein is difficult and the hydrophobic nature of the
substrate made it even more so. The majority of injected substrate stayed in the tail
vein or caused the vein to collapse. This resulted in inconsistent bioluminescent
reading because the percent substrate reaching the tumor tissue varied with every
injection. Although, this hampered my objective to monitor the tumor growth
quantitatively, it still provided useful information about the mT-ALL metastasis and
validated in vitro luciferase assay results (Figure 2-4). The mouse in the Figure 2-4
30
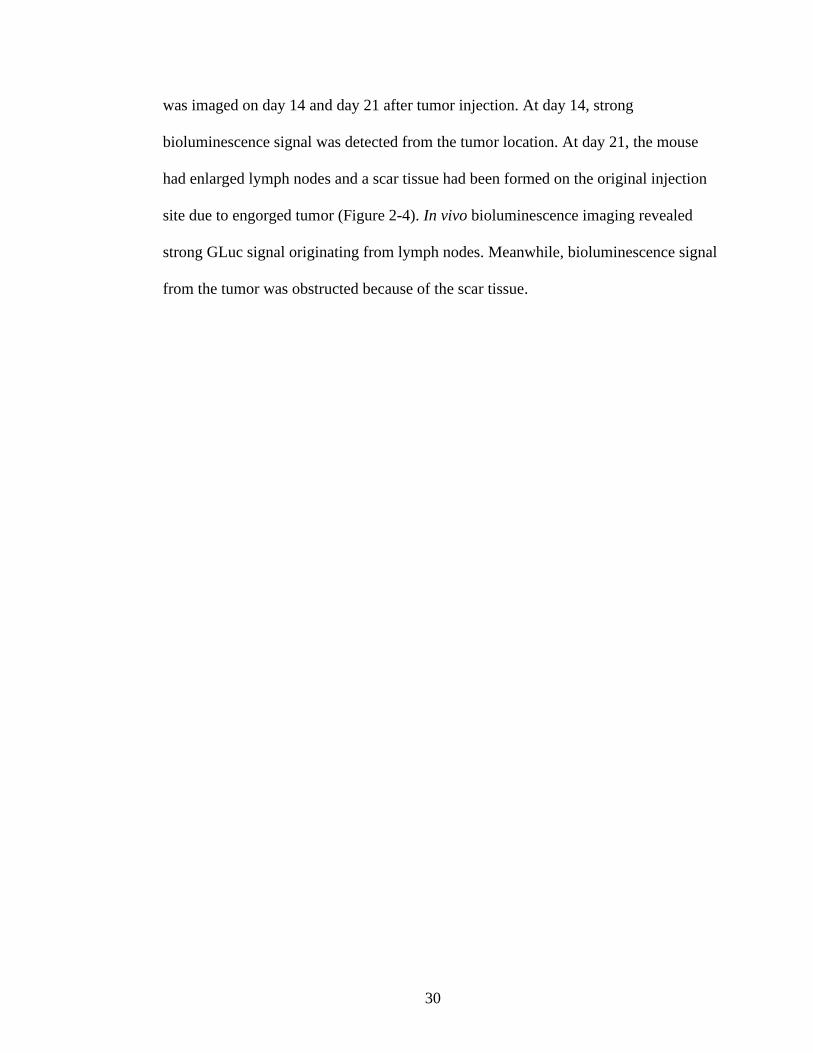
was imaged on day 14 and day 21 after tumor injection. At day 14, strong
bioluminescence signal was detected from the tumor location. At day 21, the mouse
had enlarged lymph nodes and a scar tissue had been formed on the original injection
site due to engorged tumor (Figure 2-4). In vivo bioluminescence imaging revealed
strong GLuc signal originating from lymph nodes. Meanwhile, bioluminescence signal
from the tumor was obstructed because of the scar tissue.
31
Figure 2-4 in vivo bioluminescence imaging with GLuc
In vivo bioluminescence images and CT scans of a mouse at day 14 and 21 post-
tumor injection. Bioluminescence images were taken 1 minute after the iv injection of
GLuc substrate.
32
2.2.4. Transduction of cell lines with mCD4-2A-effLUC
Unfortunately, for this study, the disadvantages of GLuc outweighed the
advantages mainly because of:
(i) relatively blue shift of luminescent emission of GLuc,
(ii) substrate solubility and injection issues,
(iii) short half-life of luminescent signal making imaging for multiple mice at
the same time not feasible.
Therefore, I decided to generate a new construct with enhanced firefly
luciferase (effLuc) because:
(i) its luminescent emission wavelength closer to IR,
(ii) its substrate is water soluble and could be administered through
intraperitoneal injection (i.p),
(iii) bioluminescence signal peaks after 15-20 minutes post-injection allowing
us to image 5 mice at a time.
In addition, the new construct is designed as mCD4-2A-effLUC to increase the
mCD4 expression. In the previous construct, mCD4 sequence was cloned downstream
of IRES sequence resulting in lower translation efficiency of mCD4 compared to
GLuc. Therefore, mCD4—without its stop codon—was cloned into pMIGRII vector
upstream of 2A-effLUC sequence. The 2A peptide (also known as self-cleaving
peptide) sequence was used instead of IRES to ensure stoichiometric translation
efficiency and also to shorten the insert size. This short peptide was first identified in
foot-and-mouth disease virus (FMDV) and it demonstrates a peculiar strategy to
facilitate a cleavage between two protein sequences (Kim et al., 2011; Szymczak-
33
Workman et al., 2012). The peptide contains the following sequence:
GSGEGRGSLLTCGDVEENPGP. The ribosome skips the synthesis of the glycyl-
prolyl peptide bond found at the C-terminus of 2A peptide separating the two peptide
sequence.
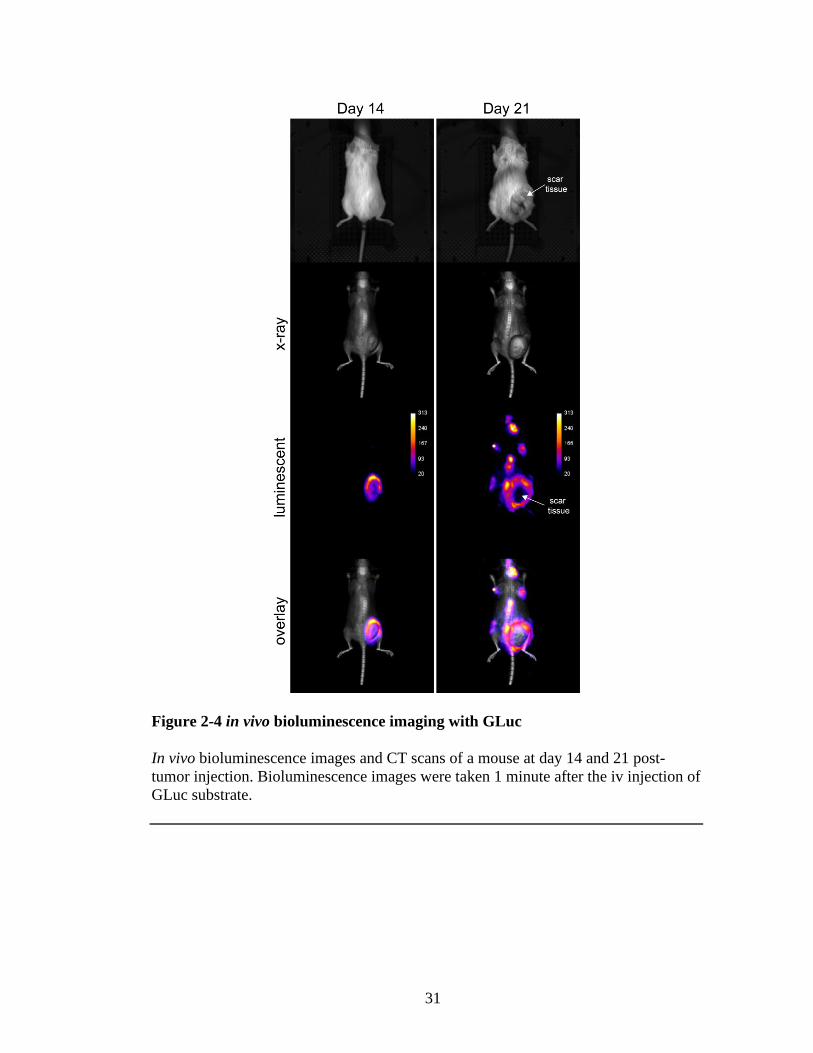
mT-ALL cells were infected with a retrovirus containing mCD4-2A-effLuc
construct. Retroviral transduction of the cell lines with was carried out in media
containing 20% or 50% of RV supernatant (Figure 2-5a). 48 hour after infection,
Figure 2-5 CD4 surface staining of transduced mT-ALL cell lines.
(a) Dot plot of the control and transduced mT-ALL cell lines with the gating and
percentage of live cell population (on the left). Histogram plots showing the
percentage of CD4high cells.
(b) Histogram plot comparison of the control (CD4low) and transduced (CD4high) mT-
ALL cell lines after cells had been sorted.
(c) Bar plot showing CD4+ cell percentage (on the left axis) and total MFI (on the right
axis).
34
untransduced control and infected cells were surface stained to detect CD4 expression.
Around 30% of infected cells showed significantly increased levels of CD4 on their
cell surface. This population was later sorted out by flow cytometry to eliminate
untransduced cells. After sorting, 99% of the population was CD4 positive with very
high MFI value (Figure 2-5b,c).
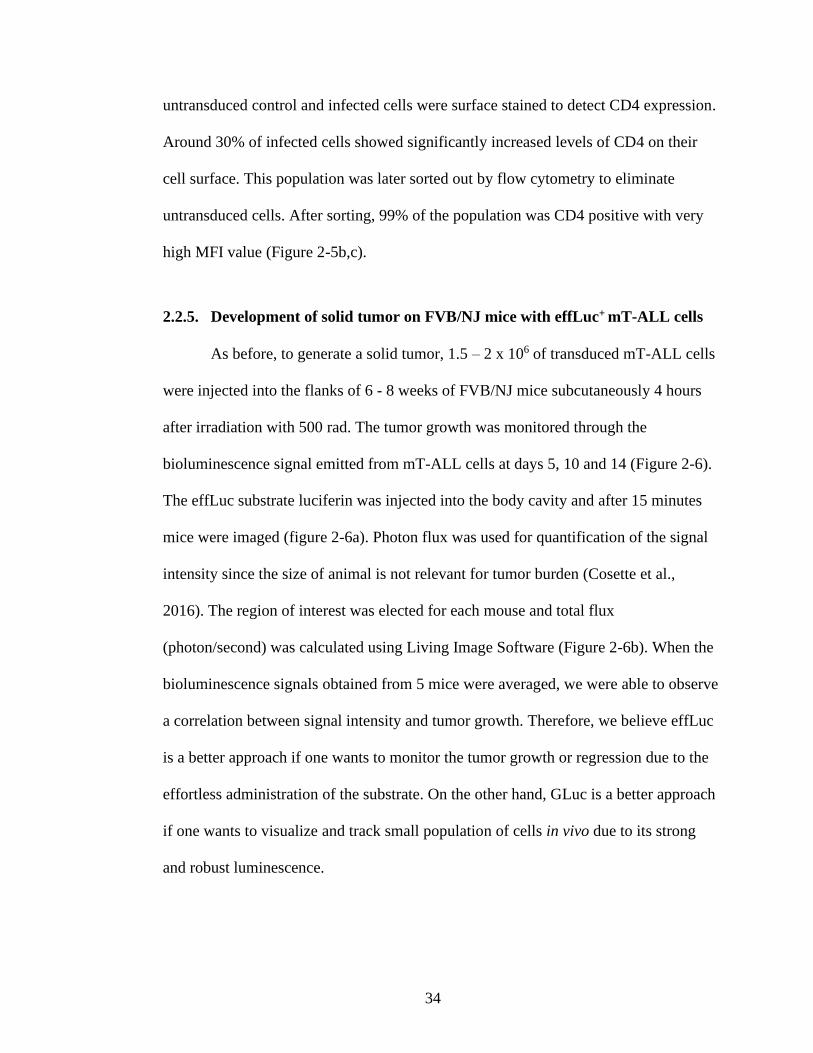
2.2.5. Development of solid tumor on FVB/NJ mice with effLuc+ mT-ALL cells
As before, to generate a solid tumor, 1.5 – 2 x 10⁶ of transduced mT-ALL cells
were injected into the flanks of 6 - 8 weeks of FVB/NJ mice subcutaneously 4 hours
after irradiation with 500 rad. The tumor growth was monitored through the
bioluminescence signal emitted from mT-ALL cells at days 5, 10 and 14 (Figure 2-6).
The effLuc substrate luciferin was injected into the body cavity and after 15 minutes
mice were imaged (figure 2-6a). Photon flux was used for quantification of the signal
intensity since the size of animal is not relevant for tumor burden (Cosette et al.,
2016). The region of interest was elected for each mouse and total flux
(photon/second) was calculated using Living Image Software (Figure 2-6b). When the
bioluminescence signals obtained from 5 mice were averaged, we were able to observe
a correlation between signal intensity and tumor growth. Therefore, we believe effLuc
is a better approach if one wants to monitor the tumor growth or regression due to the
effortless administration of the substrate. On the other hand, GLuc is a better approach
if one wants to visualize and track small population of cells in vivo due to its strong
and robust luminescence.
35
Figure 2-6 in vivo bioluminescent imaging of mice bearing effLuc+mT-ALL
tumor
(a) Bioluminescence images of 5 mice on day 5,10 and 15 post-tumor injection. Color
bar shows the radiance intensity.
(b) The average effLuc signal was shown as a line. Each dot represents one mouse.

36
2.3. Conclusion
We demonstrated that CD4+Luc+ mT-ALL cells could generate metastatic solid
tumors in immunocompetent mouse after their immune system was weakened by sub-
lethal irradiation. The development of these tumors can be monitored by using in vivo
bioluminescence imaging techniques thanks to the luciferase expression. Furthermore,
we demonstrated that the GLuc protein is more sensitive and can be used to detect the
spread of the tumor whereas.

37
CHAPTER 3
CONJUGATION OF ANTI-CD4 TO POLYMERIC NANOGEL
3.1. Introduction
Conjugation of proteins to nanoparticles is commonly achieved by decorating
the nanoparticle surface with an amine reactive group (NHS ester or maleimide as
discussed in Chapter 1.3.2) or using a biorthogonal click group. However for
amphiphilic polymer based nanoparticles this approach does not yield effective results.
The addition of amine reactive groups on the polymer effects the hydrophilic-
hydrophobic balance and affects the nanoaggregate size, surface charge and loading
capability. For example, introducing amine reactive groups on the PEG:PDS polymer
induced the formation of nanoclusters at physiological pH but revert back to original
state at lower pH (Raghupathi et al., 2014). This was achieved with a polymer
containing 20% amine groups. However, in our laboratory, we observed that addition
of even 1-2 % of amine groups affects the encapsulation efficiency of hydrophobic
molecules, signifying that the balance between hydrophobic PDS groups and
hydrophilic PEG groups is delicate.
Therefore, we decided to modify the antibody with a functional handle that
could be reacted to PDS groups on the nanogel. PDS groups are an excellent handle
for modification because they exhibit robust reactivity towards the attack of free thiol
due to leaving character of pyridine-2-thione. To achieve this I used different
conjugation methods and linkers. Moreover, splenocyte and mT-ALL cell based
assays were developed to test the conjugation efficiency.
38
3.2. Results and Discussion
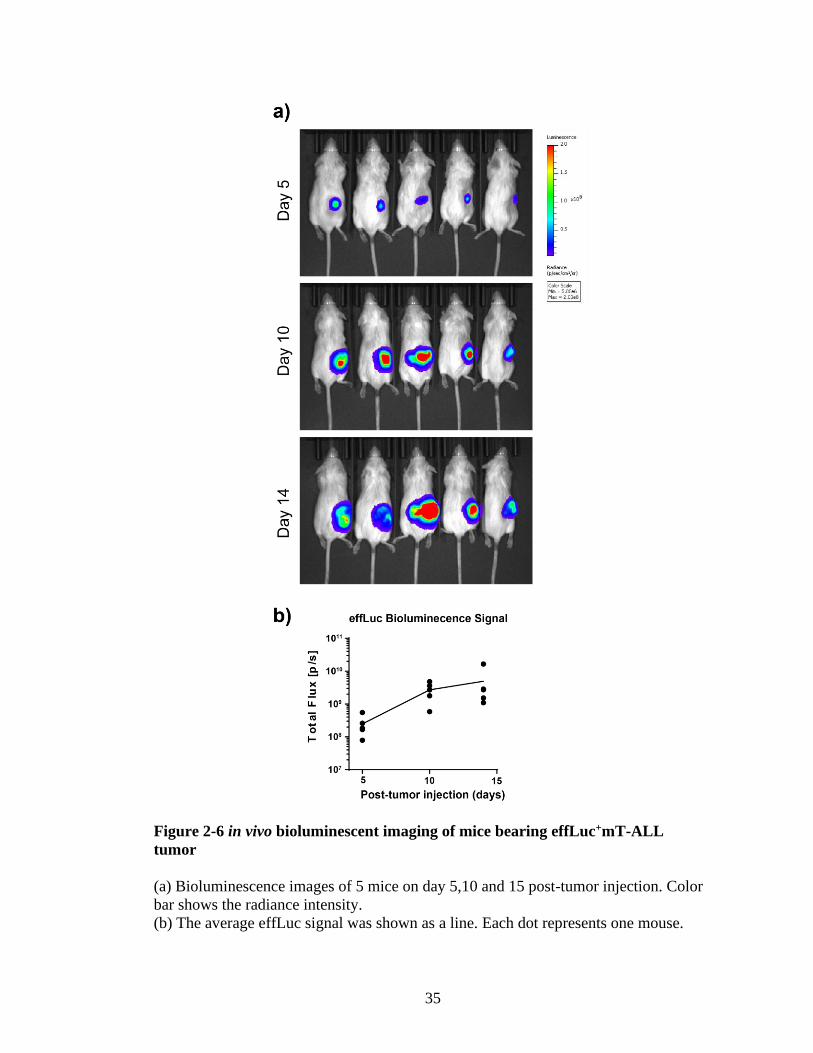
3.2.1. Conjugation of anti-CD4 to NG with a short linker
The first step of conjugating antibody to NG is to generate free thiol group on
the antibody, then free thiol could react with PDS groups on NG. To achieve this I
used commercially available linkers Traut’s reagent (Figure 3-1a) and NHS-PEG4-
SAT (Figure 3-1b). Both of them react with the primary amine on the lysine residue.
The formal linker forms a free thiol on the protein upon reaction. Therefore, it needs to
be reacted to NG immediately after protein modification otherwise thiols groups will
oxidize and lose their reactivity towards PDS groups on NG. The second linker
(Figure 3-1b) generates a protected thiol group and also has a PEG group with 4 repeat
unit. After protein modification, the protected group could be removed with
hydroxylamine (causes deacetylation) thus forming a free thiol at the end of PEG
linker.
Figure 3-1 Structure of short linkers and their reaction schemes.
(a) Primary amine's reaction with Traut's reagent (2-iminothiolane)
(b) Primary amine's reaction with NHS-PEG4-SAT (N-succinimidyl-S-acetyl ester).
39
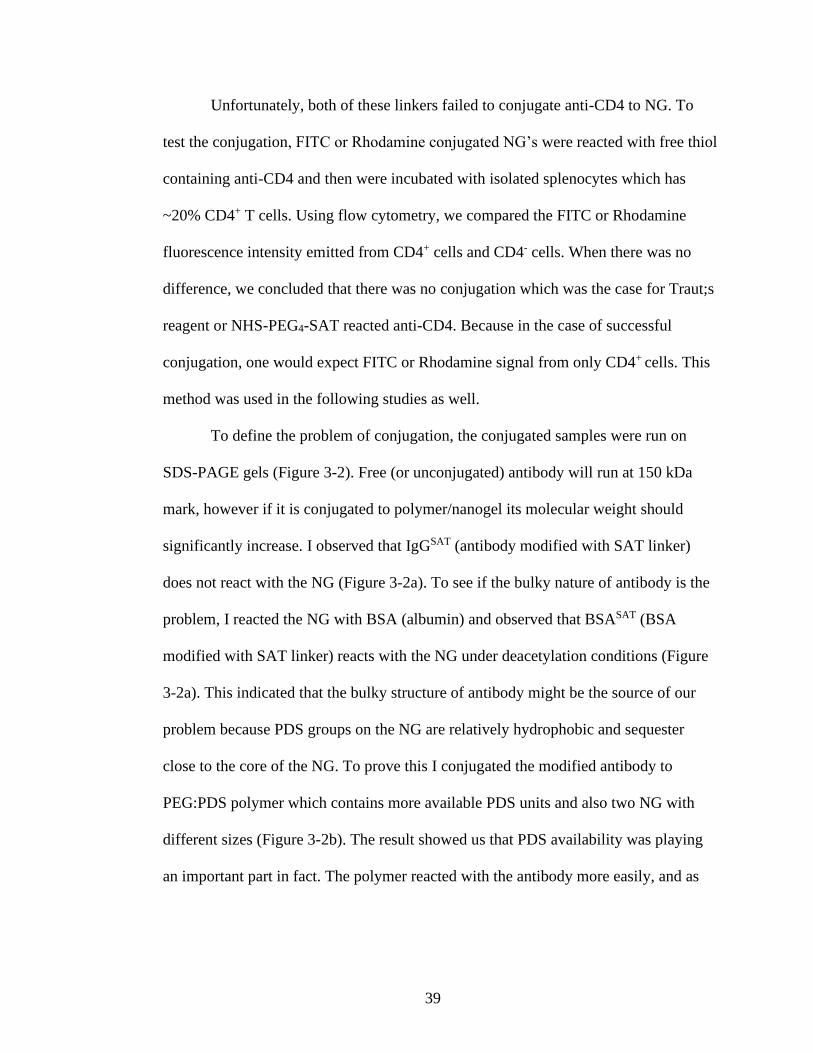
Unfortunately, both of these linkers failed to conjugate anti-CD4 to NG. To
test the conjugation, FITC or Rhodamine conjugated NG’s were reacted with free thiol
containing anti-CD4 and then were incubated with isolated splenocytes which has
~20% CD4+ T cells. Using flow cytometry, we compared the FITC or Rhodamine
fluorescence intensity emitted from CD4+ cells and CD4- cells. When there was no
difference, we concluded that there was no conjugation which was the case for Traut;s
reagent or NHS-PEG4-SAT reacted anti-CD4. Because in the case of successful
conjugation, one would expect FITC or Rhodamine signal from only CD4+ cells. This
method was used in the following studies as well.
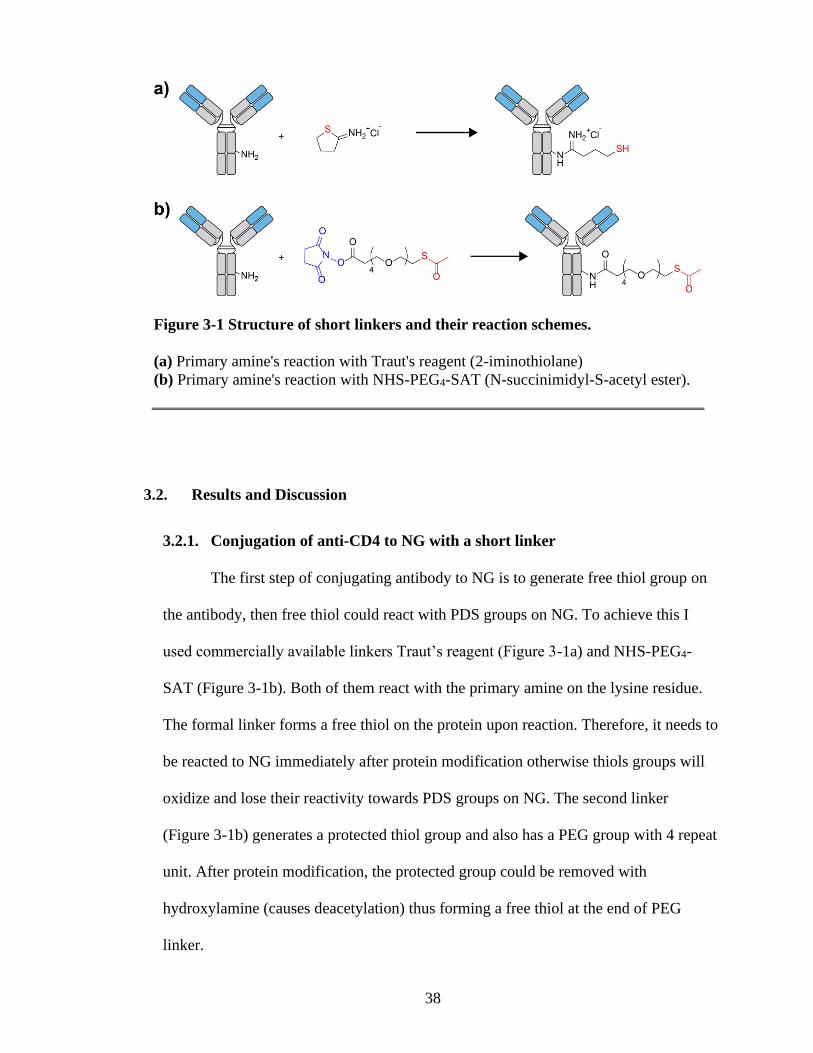
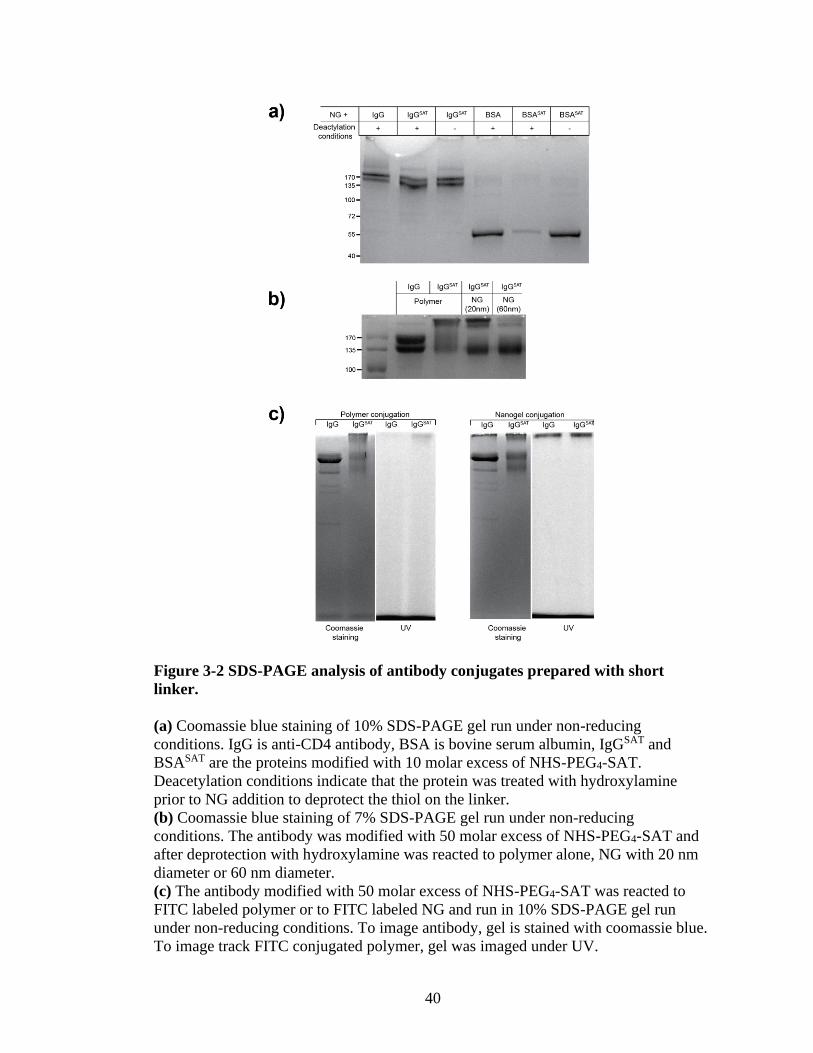
To define the problem of conjugation, the conjugated samples were run on
SDS-PAGE gels (Figure 3-2). Free (or unconjugated) antibody will run at 150 kDa
mark, however if it is conjugated to polymer/nanogel its molecular weight should
significantly increase. I observed that IgGSAT (antibody modified with SAT linker)
does not react with the NG (Figure 3-2a). To see if the bulky nature of antibody is the
problem, I reacted the NG with BSA (albumin) and observed that BSASAT (BSA
modified with SAT linker) reacts with the NG under deacetylation conditions (Figure
3-2a). This indicated that the bulky structure of antibody might be the source of our
problem because PDS groups on the NG are relatively hydrophobic and sequester
close to the core of the NG. To prove this I conjugated the modified antibody to
PEG:PDS polymer which contains more available PDS units and also two NG with
different sizes (Figure 3-2b). The result showed us that PDS availability was playing
an important part in fact. The polymer reacted with the antibody more easily, and as
40
the size of the NG increased (hence more dense hydrophobic core) conjugation
Figure 3-2 SDS-PAGE analysis of antibody conjugates prepared with short
linker.
(a) Coomassie blue staining of 10% SDS-PAGE gel run under non-reducing
conditions. IgG is anti-CD4 antibody, BSA is bovine serum albumin, IgGSAT and
BSASAT are the proteins modified with 10 molar excess of NHS-PEG4-SAT.
Deacetylation conditions indicate that the protein was treated with hydroxylamine
prior to NG addition to deprotect the thiol on the linker.
(b) Coomassie blue staining of 7% SDS-PAGE gel run under non-reducing
conditions. The antibody was modified with 50 molar excess of NHS-PEG4-SAT and
after deprotection with hydroxylamine was reacted to polymer alone, NG with 20 nm
diameter or 60 nm diameter.
(c) The antibody modified with 50 molar excess of NHS-PEG4-SAT was reacted to
FITC labeled polymer or to FITC labeled NG and run in 10% SDS-PAGE gel run
under non-reducing conditions. To image antibody, gel is stained with coomassie blue.
To image track FITC conjugated polymer, gel was imaged under UV.

41
efficiency decreased significantly.
One more gel experiment was carried out to see if the upper band really is an
indication of polymer-antibody aggregate. Because this polymer is labeled with FITC,
after staining with Coomassie blue, the gel was observed under UV light (Figure 3-
2c). Although majority of the FITC signal was found at the bottom of the gel, the
upper band predicted to be an antibody-polymer conjugate also showed FITC signal.
However, this approach was not feasible to detect antibody-NG conjugate because of
its larger molecular weight (as a result of multiple polymer chains crosslinking with
each other).
In the end, surface exposed PDS groups are not readily available on NG. In
addition to that, NG has a hydrophilic 9 repeat unit long PEG layer on its surface. All
of these factors make the antibody conjugation challenging with the current approach
Figure 3-3 Structure of long PEG linkers and their reaction schemes.
(a) Primary amine’s reaction with NPC-PEG(2kDa)-SAT. Amine reactive group
nitrophenol carbamate (NPC) is shown in blue and protected thiol group is shown in
red.
(b) Primary amine’s reaction with NHS-PEG(1kDa)-PDS. Amine reactive group of N-
succinimidyl is shown in blue and thiol protective pyridyl disulfide (PDS) group is
shown in red.

42
involving short linkers. Therefore, we decided to use a long linker, one that could
reach the core of the NG and ease the conjugation.
3.2.2. Conjugation of anti-CD4 to NG with a long linker
The structures and reaction schemes of the long linkers used for antibody
conjugation are shown in Figure 3-3. Both of the linkers are heterobifunctional PEG
derivatives. They contain an amine reactive unit on one hand and a protected thiol
group at the other end. The first linker is called NPC-PEG-SAT in short because it
contains the amine reactive nitrophenol carbamate group and S-acetyl group (Figure 3-
3a). I started my experiments using this linker but later I had to switch the linker for
reasons that will become apparant. The second linker is called NHS-PEG-PDS
because it contains amine reactive N-succinimidyl group and a PDS group (Figure 3-
3b).
Because the molecular weight of these linkers are around 1-2 kDa, the
modification increases the overall molecular weight of the antibody significantly. The
shift in the molecular weight was first analyzed through size exclusion
chromatography-multiple-angle light scattering (SEC-MALS). 100 µg of antibody
solution was loaded to an Agilent Bio SEC-5 (5 µm particle size, 300Å) column
equilibrated with PBS. Multi-angle static light scattering and differential refractive
index (RIU) were measured using Wyatt Technology/Agilent SEC-MALS. For
unmodified antibody, weight average molar mass was found to be 145 kDa (Figure 3-
4a). Unfortunately, the modified antibody was too polydisperse to yield accurate molar
mass. This was likely due to high linker load distribution as well as the polydispersity
of the linker itself. Nevertheless, we were able to analyze the antibody modification

43
and conjugation to a certain extent by using the variable wavelength detector modality
(Figure 3-4b and 3-4c).
As expected, the retention time of anti-CD4 decreased after it was modified
with NPC-PEG-SAT (Figure 3-4b). Moreover, the peak became wider either because
Figure 3-4 Size exclusion chromatography of anti-CD4 and NG.
(a) Size exclusion chromatography-multiple-angle light scattering (SEC-MALS) of
anti-CD4 antibody run through Agilent Bio SEC-5 (5 µm particle size, 300Å) column
in PBS buffer with 1 mL/min flow rate.
(b) SEC results of anti-CD4, anti-CD4PEG (anti-CD4 modified with 25 molar excess of
NPC-PEG-SAT) and NG-Rho (Rhodamine labeled NG). The samples were run
through Agilent Bio SEC-5 column in PBS buffer with 1 mL/min flow rate. The
wavelength detector was set at 214 nm.
(c) Comparison of SEC results of mixture and conjugate. Anti-CD4/NG-Rho
conjugate is shown in red. The mixture is shown in blue and contains anti-CD4PEG and
NG-Rho in unreactive conditions. Briefly, anti-CD4PEG was not treated with
hydroxylamine for deacetylation prior to NG-Rho addition, so the conjugation reaction
was not expected to take place.
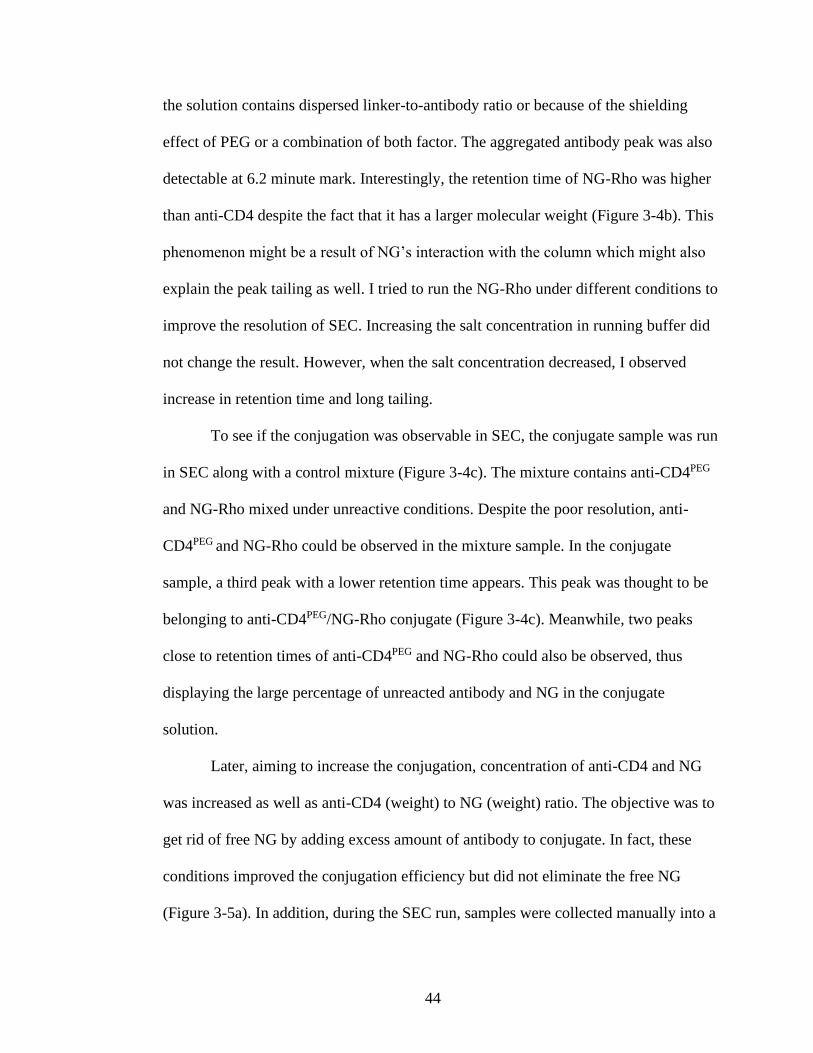
44
the solution contains dispersed linker-to-antibody ratio or because of the shielding
effect of PEG or a combination of both factor. The aggregated antibody peak was also
detectable at 6.2 minute mark. Interestingly, the retention time of NG-Rho was higher
than anti-CD4 despite the fact that it has a larger molecular weight (Figure 3-4b). This
phenomenon might be a result of NG’s interaction with the column which might also
explain the peak tailing as well. I tried to run the NG-Rho under different conditions to
improve the resolution of SEC. Increasing the salt concentration in running buffer did
not change the result. However, when the salt concentration decreased, I observed
increase in retention time and long tailing.
To see if the conjugation was observable in SEC, the conjugate sample was run
in SEC along with a control mixture (Figure 3-4c). The mixture contains anti-CD4PEG
and NG-Rho mixed under unreactive conditions. Despite the poor resolution, anti-
CD4PEG and NG-Rho could be observed in the mixture sample. In the conjugate
sample, a third peak with a lower retention time appears. This peak was thought to be
belonging to anti-CD4PEG/NG-Rho conjugate (Figure 3-4c). Meanwhile, two peaks
close to retention times of anti-CD4PEG and NG-Rho could also be observed, thus
displaying the large percentage of unreacted antibody and NG in the conjugate
solution.
Later, aiming to increase the conjugation, concentration of anti-CD4 and NG
was increased as well as anti-CD4 (weight) to NG (weight) ratio. The objective was to
get rid of free NG by adding excess amount of antibody to conjugate. In fact, these
conditions improved the conjugation efficiency but did not eliminate the free NG
(Figure 3-5a). In addition, during the SEC run, samples were collected manually into a
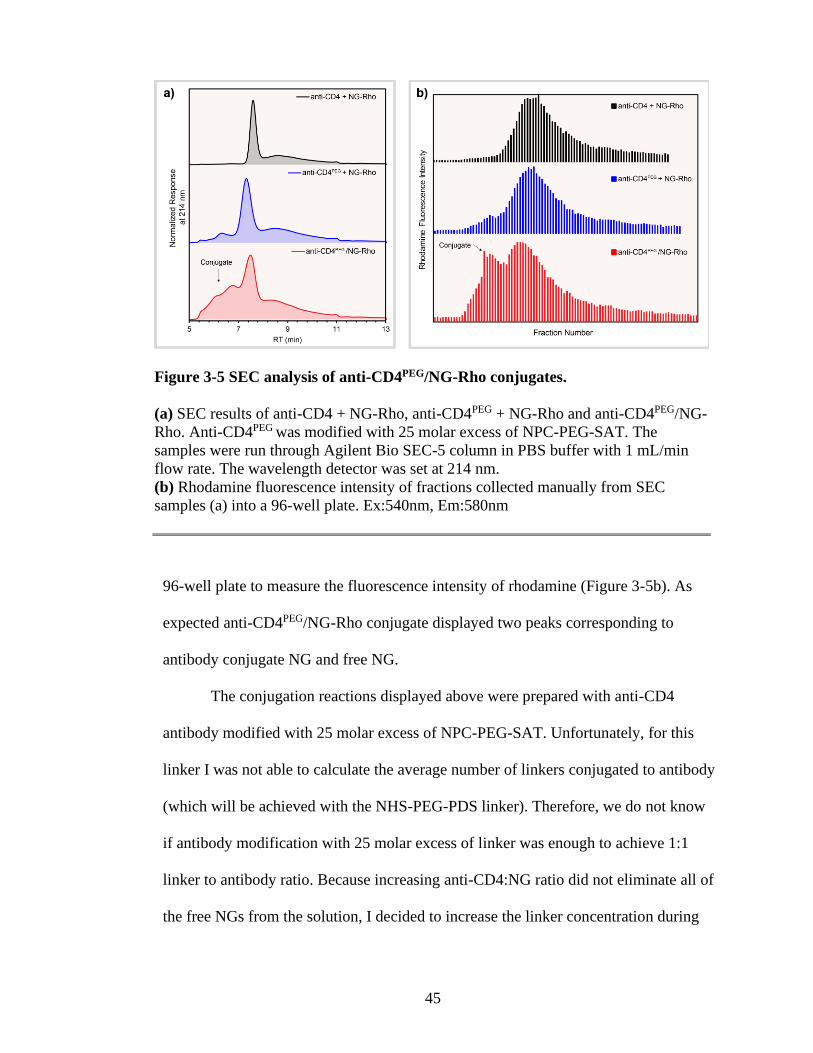
45
96-well plate to measure the fluorescence intensity of rhodamine (Figure 3-5b). As
expected anti-CD4PEG/NG-Rho conjugate displayed two peaks corresponding to
antibody conjugate NG and free NG.
The conjugation reactions displayed above were prepared with anti-CD4
antibody modified with 25 molar excess of NPC-PEG-SAT. Unfortunately, for this
linker I was not able to calculate the average number of linkers conjugated to antibody
(which will be achieved with the NHS-PEG-PDS linker). Therefore, we do not know
if antibody modification with 25 molar excess of linker was enough to achieve 1:1
linker to antibody ratio. Because increasing anti-CD4:NG ratio did not eliminate all of
the free NGs from the solution, I decided to increase the linker concentration during
Figure 3-5 SEC analysis of anti-CD4PEG/NG-Rho conjugates.
(a) SEC results of anti-CD4 + NG-Rho, anti-CD4PEG + NG-Rho and anti-CD4PEG/NG-
Rho. Anti-CD4PEG was modified with 25 molar excess of NPC-PEG-SAT. The
samples were run through Agilent Bio SEC-5 column in PBS buffer with 1 mL/min
flow rate. The wavelength detector was set at 214 nm.
(b) Rhodamine fluorescence intensity of fractions collected manually from SEC
samples (a) into a 96-well plate. Ex:540nm, Em:580nm
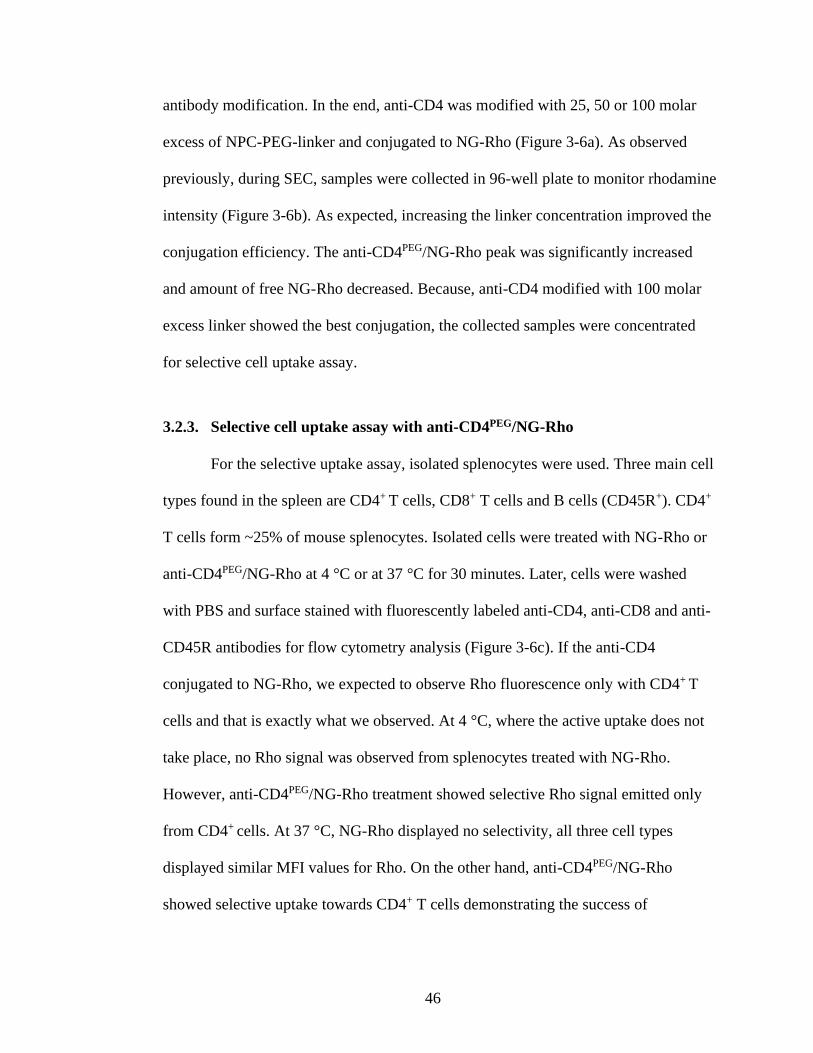
46
antibody modification. In the end, anti-CD4 was modified with 25, 50 or 100 molar
excess of NPC-PEG-linker and conjugated to NG-Rho (Figure 3-6a). As observed
previously, during SEC, samples were collected in 96-well plate to monitor rhodamine
intensity (Figure 3-6b). As expected, increasing the linker concentration improved the
conjugation efficiency. The anti-CD4PEG/NG-Rho peak was significantly increased
and amount of free NG-Rho decreased. Because, anti-CD4 modified with 100 molar
excess linker showed the best conjugation, the collected samples were concentrated
for selective cell uptake assay.
3.2.3. Selective cell uptake assay with anti-CD4PEG/NG-Rho
For the selective uptake assay, isolated splenocytes were used. Three main cell
types found in the spleen are CD4+ T cells, CD8+ T cells and B cells (CD45R+). CD4+
T cells form ~25% of mouse splenocytes. Isolated cells were treated with NG-Rho or
anti-CD4PEG/NG-Rho at 4 °C or at 37 °C for 30 minutes. Later, cells were washed
with PBS and surface stained with fluorescently labeled anti-CD4, anti-CD8 and anti-
CD45R antibodies for flow cytometry analysis (Figure 3-6c). If the anti-CD4
conjugated to NG-Rho, we expected to observe Rho fluorescence only with CD4+ T
cells and that is exactly what we observed. At 4 °C, where the active uptake does not
take place, no Rho signal was observed from splenocytes treated with NG-Rho.
However, anti-CD4PEG/NG-Rho treatment showed selective Rho signal emitted only
from CD4+ cells. At 37 °C, NG-Rho displayed no selectivity, all three cell types
displayed similar MFI values for Rho. On the other hand, anti-CD4PEG/NG-Rho
showed selective uptake towards CD4+ T cells demonstrating the success of

47
conjugation. However, the MFI values were low, probably due to low percentage of
Rho conjugated to NG.
Figure 3-6 SEC analysis of anti-CD4PEG/NG-Rho conjugates and selective cell
uptake assay.
(a) SEC analysis of conjugates prepared with 25, 50 or 100 molar excess of NPC-
PEG-SAT. The samples were run through Agilent Bio SEC-5 column in PBS buffer
with 1 mL/min flow rate. The wavelength detector was set at 214 nm.
(b) Rhodamine fluorescence intensity of fractions collected manually from SEC
samples (a) into a 96-well plate. Ex:540nm, Em:580nm
(c) Bar graph showing the rhodamine mean fluorescence intensity (MFI) of CD4+,
CD8+ or CD45R+ cells after they were incubated with NG-Rho or antiCD4PEG/NG-
Rho.
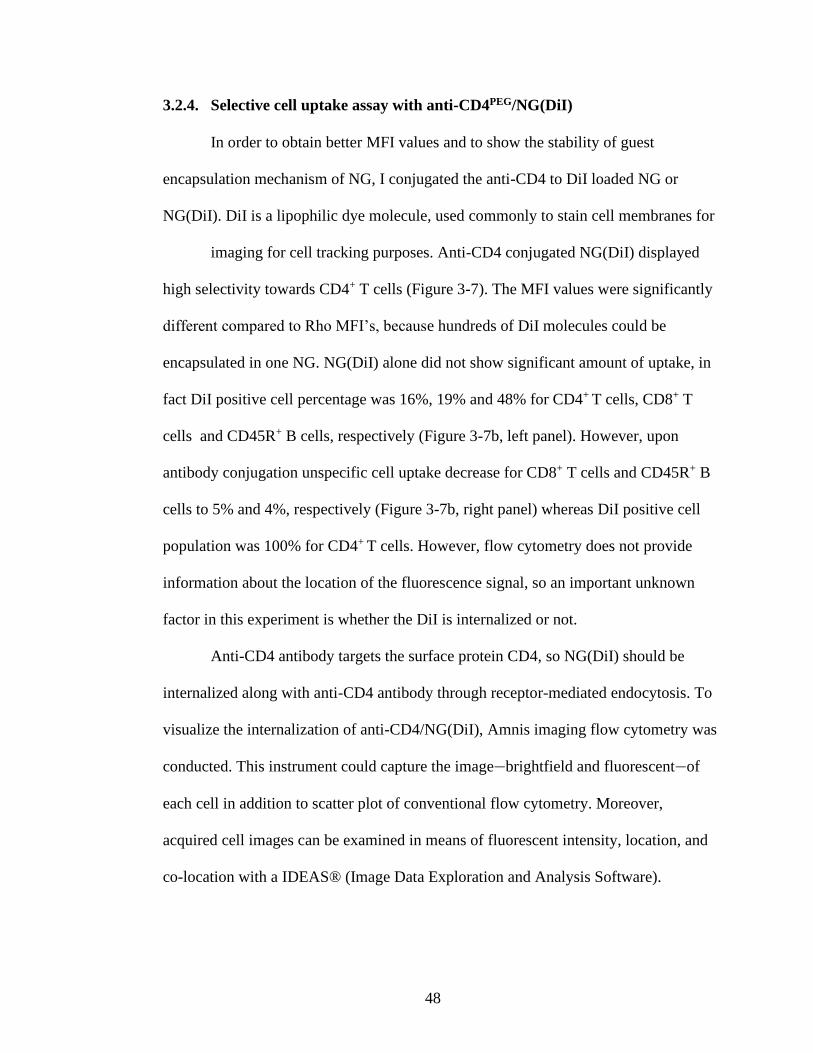
48
3.2.4. Selective cell uptake assay with anti-CD4PEG/NG(DiI)
In order to obtain better MFI values and to show the stability of guest
encapsulation mechanism of NG, I conjugated the anti-CD4 to DiI loaded NG or
NG(DiI). DiI is a lipophilic dye molecule, used commonly to stain cell membranes for
imaging for cell tracking purposes. Anti-CD4 conjugated NG(DiI) displayed
high selectivity towards CD4+ T cells (Figure 3-7). The MFI values were significantly
different compared to Rho MFI’s, because hundreds of DiI molecules could be
encapsulated in one NG. NG(DiI) alone did not show significant amount of uptake, in
fact DiI positive cell percentage was 16%, 19% and 48% for CD4+ T cells, CD8+ T
cells and CD45R+ B cells, respectively (Figure 3-7b, left panel). However, upon
antibody conjugation unspecific cell uptake decrease for CD8+ T cells and CD45R+ B
cells to 5% and 4%, respectively (Figure 3-7b, right panel) whereas DiI positive cell
population was 100% for CD4+ T cells. However, flow cytometry does not provide
information about the location of the fluorescence signal, so an important unknown
factor in this experiment is whether the DiI is internalized or not.
Anti-CD4 antibody targets the surface protein CD4, so NG(DiI) should be
internalized along with anti-CD4 antibody through receptor-mediated endocytosis. To
visualize the internalization of anti-CD4/NG(DiI), Amnis imaging flow cytometry was
conducted. This instrument could capture the image—brightfield and fluorescent—of
each cell in addition to scatter plot of conventional flow cytometry. Moreover,
acquired cell images can be examined in means of fluorescent intensity, location, and
co-location with a IDEAS® (Image Data Exploration and Analysis Software).
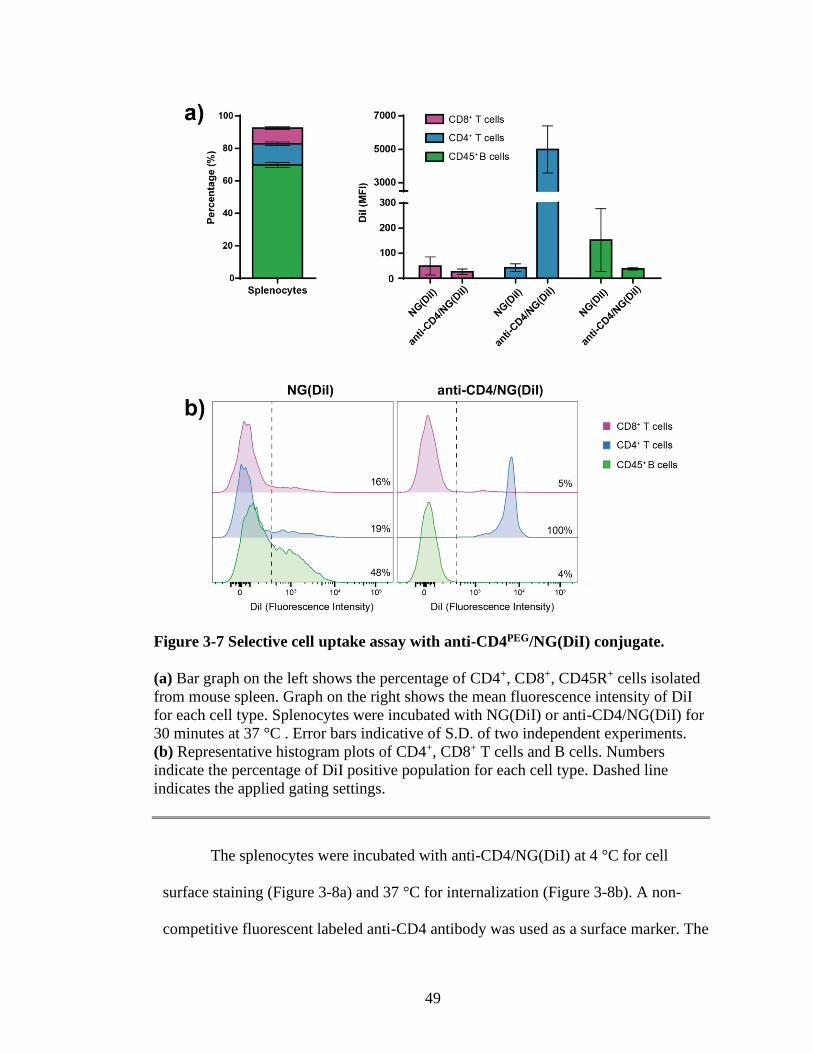
49
The splenocytes were incubated with anti-CD4/NG(DiI) at 4 °C for cell
surface staining (Figure 3-8a) and 37 °C for internalization (Figure 3-8b). A non-
competitive fluorescent labeled anti-CD4 antibody was used as a surface marker. The
Figure 3-7 Selective cell uptake assay with anti-CD4PEG/NG(DiI) conjugate.
(a) Bar graph on the left shows the percentage of CD4+, CD8+, CD45R+ cells isolated
from mouse spleen. Graph on the right shows the mean fluorescence intensity of DiI
for each cell type. Splenocytes were incubated with NG(DiI) or anti-CD4/NG(DiI) for
30 minutes at 37 °C . Error bars indicative of S.D. of two independent experiments.
(b) Representative histogram plots of CD4+, CD8+ T cells and B cells. Numbers
indicate the percentage of DiI positive population for each cell type. Dashed line
indicates the applied gating settings.
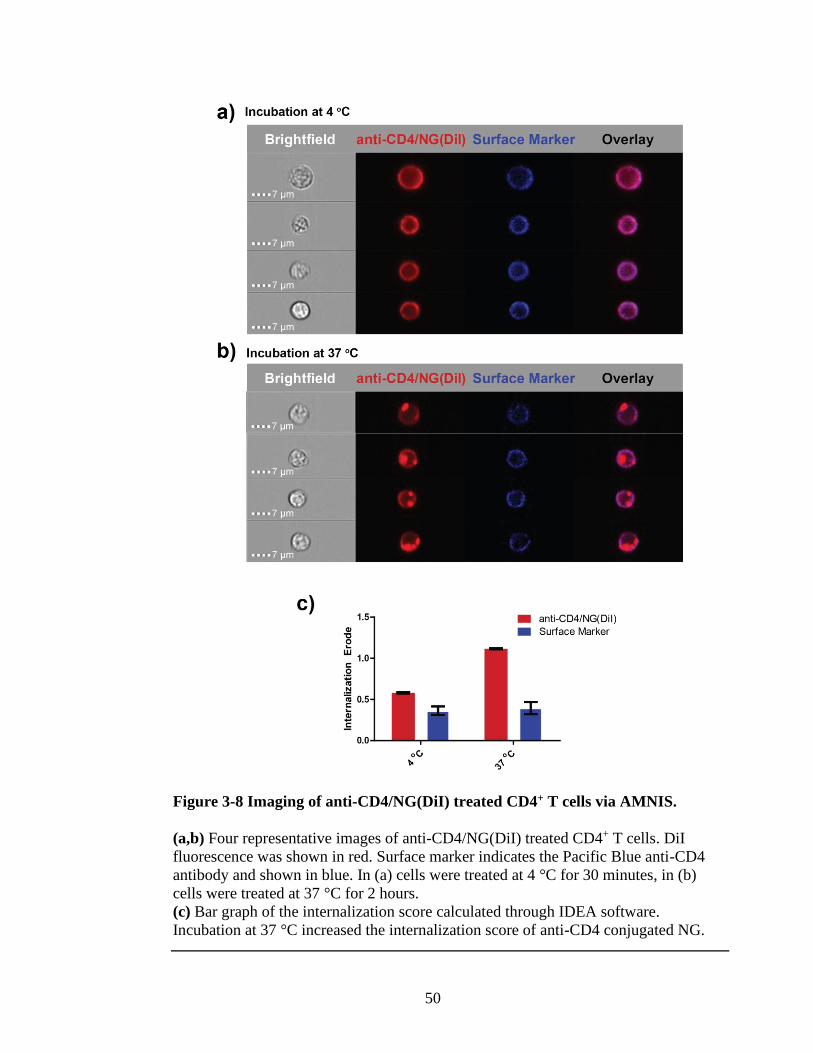
50
Figure 3-8 Imaging of anti-CD4/NG(DiI) treated CD4+ T cells via AMNIS.
(a,b) Four representative images of anti-CD4/NG(DiI) treated CD4+ T cells. DiI
fluorescence was shown in red. Surface marker indicates the Pacific Blue anti-CD4
antibody and shown in blue. In (a) cells were treated at 4 °C for 30 minutes, in (b)
cells were treated at 37 °C for 2 hours.
(c) Bar graph of the internalization score calculated through IDEA software.
Incubation at 37 °C increased the internalization score of anti-CD4 conjugated NG.

51
internalization score was calculated via IDEAS (Figure 3-8c). As we expected, DiI
fluorescence was localized on the surface when incubation took place at 4 °C due to
anti-CD4 binding to CD4 receptor on the cell surface. However, when incubation took
place at 37 °C, DiI was not only found at the cell surface but inside the cell as well.
Interestingly, the signal was concentrated in specific spots which might indicate
localization in an endosome or lysozyme.
3.2.5. Selective cell uptake assay with anti-CD4PEG/NG(Dox)
The studies described above was conducted with isolated splenocytes. Next, I
wanted to test if we can deliver these conjugates to mT-ALL cells selectively. To
achieve this, I used two cell lines described in Chapter 2. mT-ALL 4673 cell line was
used as a negative control because it has low expression of CD4+ receptor and thus
named as CD4low mT-ALL cells. Retrovirally transduced mT-ALL cells were used as
CD4high mT-ALL cells because they overexpress this protein under a viral promoter.
After modification with the linker, anti-CD4 was conjugated to NG(DiI) or
NG(Dox) which is doxorubicin (Dox) encapsulated NG. Dox is one of the most
effective chemotherapy drug. It blocks DNA synthesis by inhibiting the enzyme
topoisomerase II. Moreover, its intrinsic fluorescence serves as a valuable tool to
characterize doxorubicin concentration in encapsulation and also in cell uptake assays.
mT-ALL cells were incubated with these conjugates for 2 hours at 37 °C, then
fluorescence intensity of DiI or Dox was observed through flow cytometry (Figure 3-
9). As expected, DiI fluorescence intensity was substantially higher for CD4high mT-
ALL cells compared to CD4low cells. Moreover, 92% of CD4high mT-ALL cells were
DiI positive, this percentage dropped to 16% for CD4low cells. Unfortunately, same

52
could not be said for Dox fluorescence since both cell lines displayed similar MFI
values for Dox. The reason behind this phenomenon is related to the hydrophobicity of
the guest molecule. As I mentioned before, DiI is a lipophilic molecule meaning it
could dissolve in fat, oil or lipid thanks to the long hydrocarbon chains found in its
Figure 3-9 Selective cell uptake assay with anti-CD4/NG(Dox).
Histogram plots of CD4low and CD4high mT-ALL cells after they had been treated with
anti-CD4/NG(DiI) or anti-CD4/NG(Dox) for 2 hours at 37 °C. Numbers indicate the
percentage of DiI or Dox positive population for each cell line. Dashed line indicates
the applied gating settings. Bar plots show the mean fluorescence intensity (MFI) of
DiI or Dox.
Dox: Doxorubicin
53
structure. Although most of the chemotherapeutic drugs are relatively hydrophobic,
they are not as hydrophobic as the DiI dyes or its derivatives. Moreover, doxorubicin
is slightly less hydrophobic than other commonly used chemotherapeutics like
docetaxel, camptothecin and paclitaxel. Therefore, it is reasonable to suggest that Dox
encapsulation was not stable which caused Dox to leak out of NG.
To solve this problem, I tried different encapsulation methods for Dox such as
making Dox more hydrophobic or by dissolving polymer + Dox in an organic buffer
and dialyzing against water for two-three days. None of these methods improved the
system significantly. Meanwhile, the second batch of NPC-PEG-SAT linker showed
significantly lower conjugation efficiency for unknown reason. Therefore, the linker
was switched to a commercially available one: NHS-PEG-PDS.
3.2.6. Quantification of linker to antibody ratio by using NHS-PEG-PDS
polymer
Although first batch of synthesized NPC-PEG-SAT was an effective linker, the
synthesized second batch showed reduced conjugation efficiency. Moreover, we had
to use 100 molar excess of linker to achieve good conjugation, which increased the
antibody aggregate percentage after the modification. Therefore, I decided to use
NHS-PEG-PDS linker (Figure 3-3b) to conjugate antibody to NG. The advantages of
this linker could be summarized with the following bullet points:
• NPC (nitrophenol carbamate) is less reactive than NHS ester. So, higher pH
buffer (pH 9-10) was used to achieve successful modification in the case of
NPC linker whereas NHS ester reaction conditions were well characterized in
literature and requires a slightly more basic solution (pH 8.5).
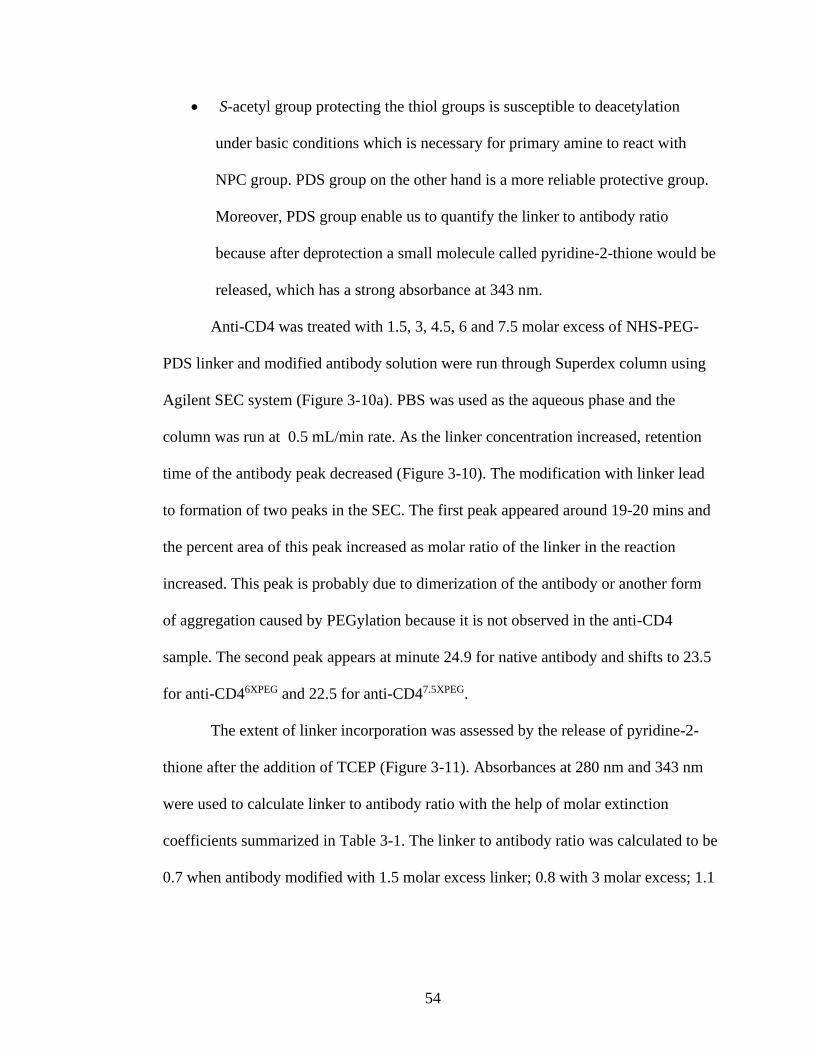
54
• S-acetyl group protecting the thiol groups is susceptible to deacetylation
under basic conditions which is necessary for primary amine to react with
NPC group. PDS group on the other hand is a more reliable protective group.
Moreover, PDS group enable us to quantify the linker to antibody ratio
because after deprotection a small molecule called pyridine-2-thione would be
released, which has a strong absorbance at 343 nm.
Anti-CD4 was treated with 1.5, 3, 4.5, 6 and 7.5 molar excess of NHS-PEG-
PDS linker and modified antibody solution were run through Superdex column using
Agilent SEC system (Figure 3-10a). PBS was used as the aqueous phase and the
column was run at 0.5 mL/min rate. As the linker concentration increased, retention
time of the antibody peak decreased (Figure 3-10). The modification with linker lead
to formation of two peaks in the SEC. The first peak appeared around 19-20 mins and
the percent area of this peak increased as molar ratio of the linker in the reaction
increased. This peak is probably due to dimerization of the antibody or another form
of aggregation caused by PEGylation because it is not observed in the anti-CD4
sample. The second peak appears at minute 24.9 for native antibody and shifts to 23.5
for anti-CD46XPEG and 22.5 for anti-CD47.5XPEG.
The extent of linker incorporation was assessed by the release of pyridine-2-
thione after the addition of TCEP (Figure 3-11). Absorbances at 280 nm and 343 nm
were used to calculate linker to antibody ratio with the help of molar extinction
coefficients summarized in Table 3-1. The linker to antibody ratio was calculated to be
0.7 when antibody modified with 1.5 molar excess linker; 0.8 with 3 molar excess; 1.1
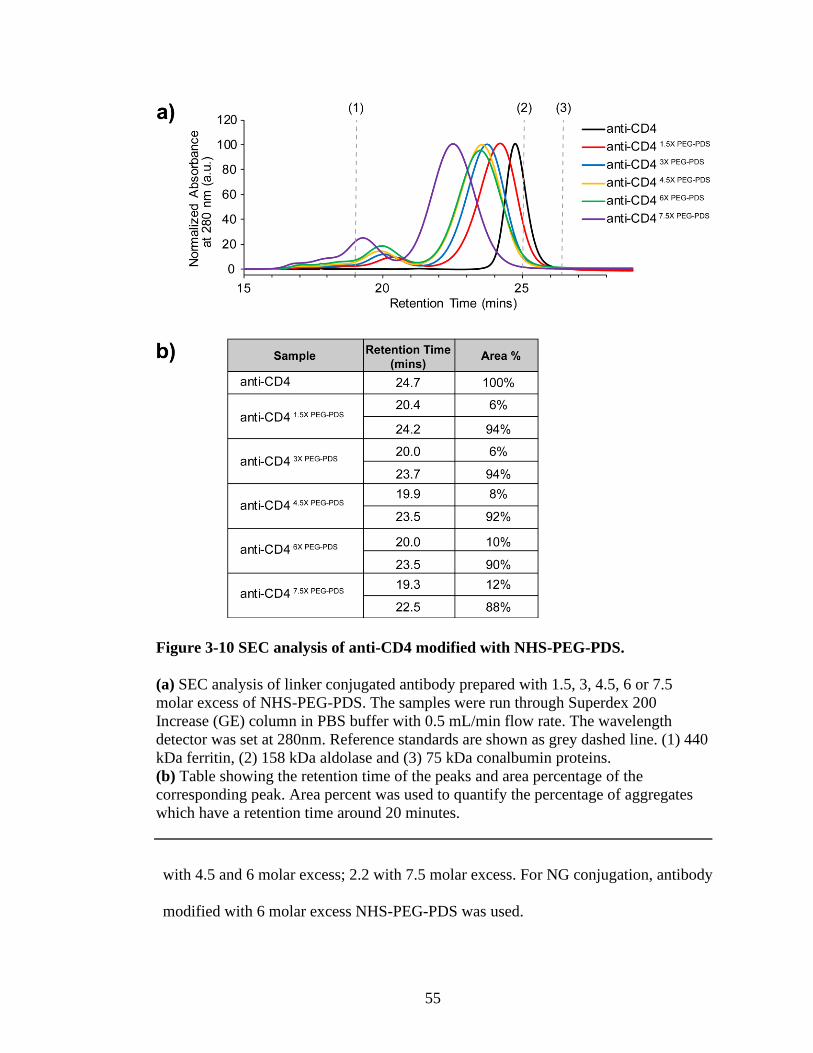
55
with 4.5 and 6 molar excess; 2.2 with 7.5 molar excess. For NG conjugation, antibody
modified with 6 molar excess NHS-PEG-PDS was used.
Figure 3-10 SEC analysis of anti-CD4 modified with NHS-PEG-PDS.
(a) SEC analysis of linker conjugated antibody prepared with 1.5, 3, 4.5, 6 or 7.5
molar excess of NHS-PEG-PDS. The samples were run through Superdex 200
Increase (GE) column in PBS buffer with 0.5 mL/min flow rate. The wavelength
detector was set at 280nm. Reference standards are shown as grey dashed line. (1) 440
kDa ferritin, (2) 158 kDa aldolase and (3) 75 kDa conalbumin proteins.
(b) Table showing the retention time of the peaks and area percentage of the
corresponding peak. Area percent was used to quantify the percentage of aggregates
which have a retention time around 20 minutes.
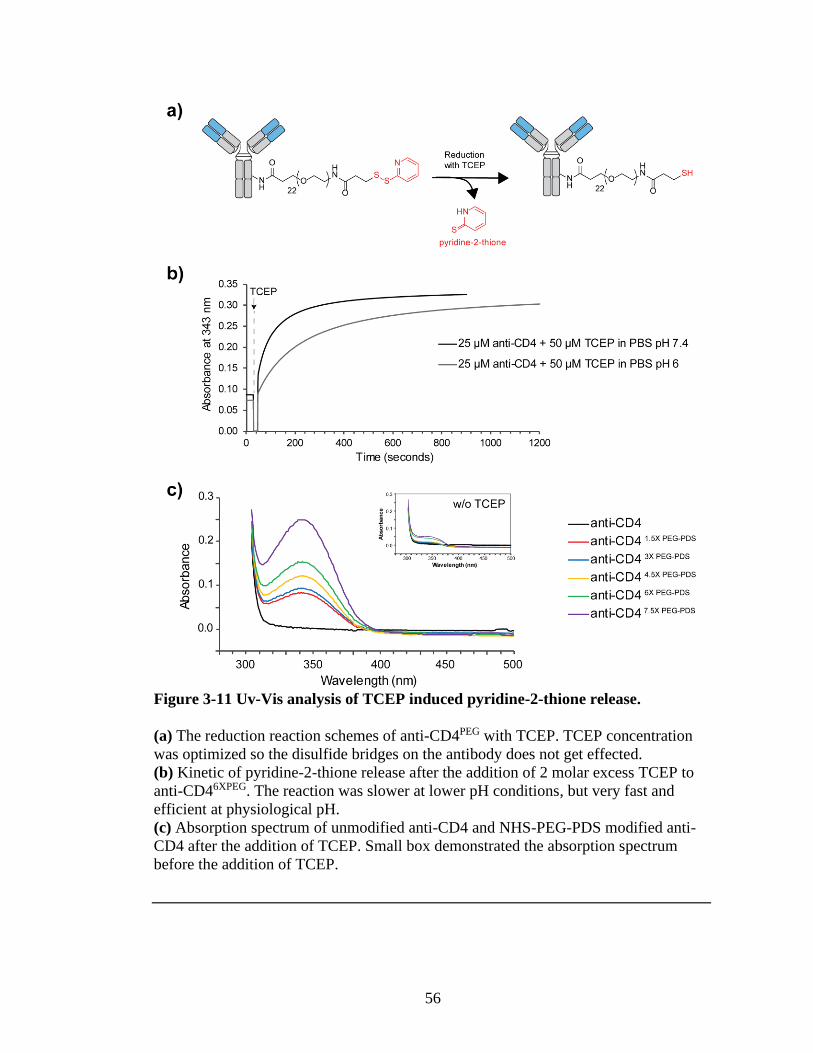
56
Figure 3-11 Uv-Vis analysis of TCEP induced pyridine-2-thione release.
(a) The reduction reaction schemes of anti-CD4PEG with TCEP. TCEP concentration
was optimized so the disulfide bridges on the antibody does not get effected.
(b) Kinetic of pyridine-2-thione release after the addition of 2 molar excess TCEP to
anti-CD46XPEG. The reaction was slower at lower pH conditions, but very fast and
efficient at physiological pH.
(c) Absorption spectrum of unmodified anti-CD4 and NHS-PEG-PDS modified anti-
CD4 after the addition of TCEP. Small box demonstrated the absorption spectrum
before the addition of TCEP.
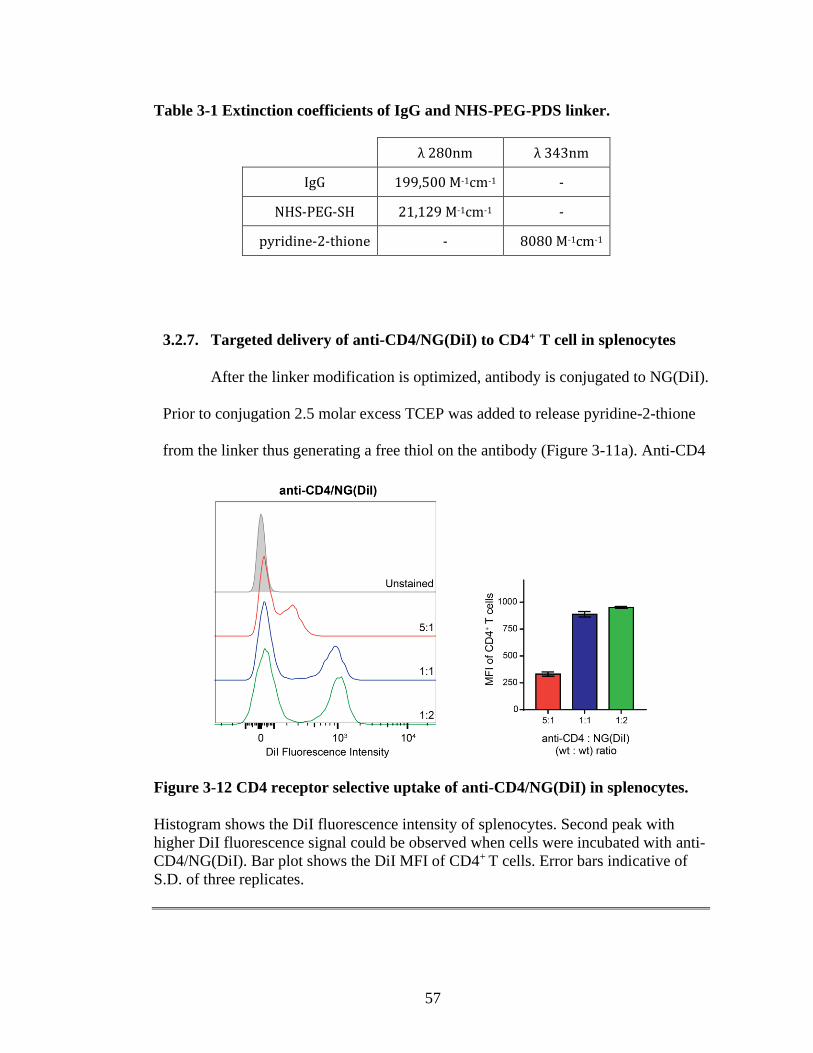
57
3.2.7. Targeted delivery of anti-CD4/NG(DiI) to CD4+ T cell in splenocytes
After the linker modification is optimized, antibody is conjugated to NG(DiI).
Prior to conjugation 2.5 molar excess TCEP was added to release pyridine-2-thione
from the linker thus generating a free thiol on the antibody (Figure 3-11a). Anti-CD4
Figure 3-12 CD4 receptor selective uptake of anti-CD4/NG(DiI) in splenocytes.
Histogram shows the DiI fluorescence intensity of splenocytes. Second peak with
higher DiI fluorescence signal could be observed when cells were incubated with anti-
CD4/NG(DiI). Bar plot shows the DiI MFI of CD4+ T cells. Error bars indicative of
S.D. of three replicates.
Table 3-1 Extinction coefficients of IgG and NHS-PEG-PDS linker.
λ 280nm λ 343nm
IgG 199,500 M-1cm-1 -
NHS-PEG-SH 21,129 M-1cm-1 -
pyridine-2-thione - 8080 M-1cm-1
58
and NG(DiI) conjugation was carried out at three different ratios to determine the
optimal conjugation conditions. Prepared anti-CD4/NG(DiI) conjugates were later
incubated with isolated splenocytes for 30 minutes at 4 °C (Figure 3-12). Analysis of
splenocytes with flow cytometry showed the selective uptake of DiI by CD4+ T cells.
In addition, 5:1 ratio of anti-CD4 (wt): NG (wt) displayed significantly lower MFI
values. On the other hand, the difference between MFI values of 1:1 and 1:2 ratios
were not significant, indicating that conjugation reaction reached saturation.
3.2.8. Targeted delivery of anti-CD4/NG(DiO) to CD4high mT-ALL cells
Next, we demonstrated that anti-CD4/NG conjugates prepared with NHS-PEG-
PDS linker could be used to deliver guest molecules into CD4high mT-ALL cells
selectively. To achieve this, DiO (a derivative of DiI) was encapsulated into the NG.
The anti-CD4 antibody was modified with 6 molar excess of NHS-PEG-PDS linker to
achieve 1:1 linker:antibody ratio. For the conjugation reaction, anti-CD4 was treated
with 2.5 molar excess TCEP prior to NG addition. I also prepared a negative control in
which modified antibody was mixed with NG without TCEP treatment. These two
samples were incubated with mT-ALL co-culture which consists of 50% CD4low and
50% CD4high mT-ALL cells (Figure 3-13). As expected, TCEP treatment was shown to
be necessary for successful NG conjugation. Without TCEP, neither cell types showed
significant DiO fluorescence when the incubation took place at 4 °C (Figure 3-13a and
3-13b) and when incubation took place at 37 °C , both cell types emitted similar levels
of DiO signal (Figure 3-13b) due to unspecific uptake or DiO leaking from NG. On
the other hand, TCEP treated anti-CD4 sample displayed selectivity towards CD4high
cells demonstrating the success of conjugation. At 4 °C, DiO fluorescence correlated

59
with anti-CD4 surface staining, meaning cells displaying high CD4 receptor had
stronger DiO fluorescence in comparison to cells displaying medium CD4 receptor
(Figure 3-13a). Moreover, at 37 °C DiO intensity of CD4low mT-ALL cells was at the
Figure 3-13 TCEP treatment is required to generate free thiol on anti-CD4PEG
and accordingly for NG conjugation.
Co-culture of CD4low and CD4high mT-ALL cells incubated with anti-CD46XPEG/
NG(DiO) prepared under unreactive (without TCEP) or reactive (with TCEP)
conditions.
(a) Flow cytometry dot plots showing CD4 surface receptor staining intensity (on x
asis) and DiO intensity (y-axis). Co-cultured mT-ALL cells were incubated with anti-
CD46XPEG/NG(DiO) samples at 4 °C for 30 minutes. Solid lines show the applied
gating settings.
(b) Bar plot shows the DiO mean fluorescence intensity of CD4low and CD4high mT-
ALL cells after they were treated with CD46XPEG/NG(DiO) samples at 4 °C for 30
minutes or at 37 °C for 3 hours. Error bars indicative of three replicates (S.D.)
APC-anti-CD4 antibody was used to stain CD4 surface receptors.
60
background level (similar to control), whereas DiO intensity of CD4high cells was
substantially higher (Figure 3-13b).
These data demonstrated that TCEP reduction was necessary to generate a free
thiol on modified antibody. However, we should not forget that antibody itself harbors
a number of disulfide bonds that could be reduced to free thiols following TCEP.
What if the NG conjugation happened through those thiols? Although I found this
unlikely due to the failure of short linkers previously, I set up an experiment to show
that without linker even under reducing conditions the conjugation to NG would not
take place.
Therefore, NG conjugation reactions were prepared by using unmodified anti-
CD4 or modified anti-CD4. In addition, modified antibody was prepared under four
different linker concentrations to show the correlation between average linker number
per antibody and conjugation efficiency (Figure 3-14). As expected, there was no
selectivity towards CD4high cells when cells were incubated with unmodified anti-CD4
reacted NG(DiO). CD4low cells displayed similar levels of DiO intensity independent
of the modification levels on anti-CD4. On the other hand, we observed that DiO
intensity on CD4high cells were correlated with the average linker number per
antibody. This data demonstrated that it is in fact the linker that reacts with NG under
these conditions.

61
Figure 3-14 Effect of the linker:anti-CD4 ratio on conjugation efficiency.
Co-culture of CD4low and CD4high mT-ALL cells incubated with anti-CD4/NG(DiO)
prepared at 37 °C for 3 hours. Histogram plots display DiO fluorescence intensity of
CD4low (in red) and CD4high (in blue) mT-ALL cells. Unstained control is shown in
grey color. Bar plot show the mean fluorescence intensity of DiO for each cell type.
Error bars indicate of three replicates (S.D.)
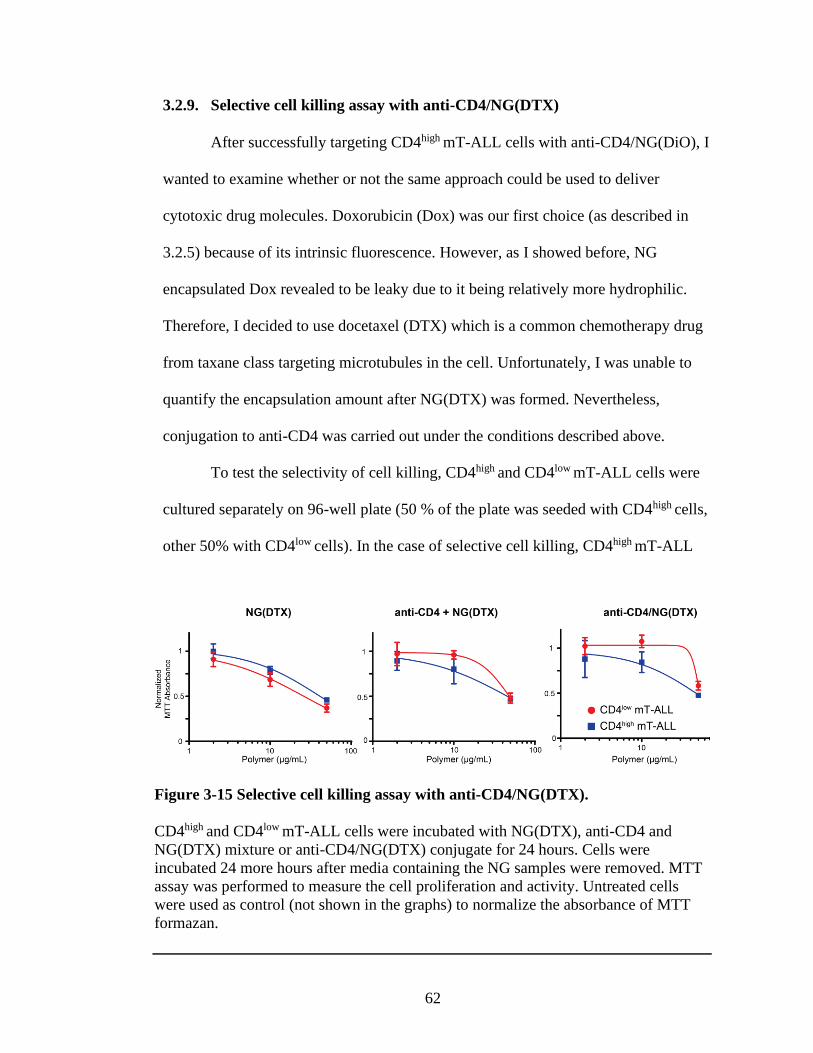
62
3.2.9. Selective cell killing assay with anti-CD4/NG(DTX)
After successfully targeting CD4high mT-ALL cells with anti-CD4/NG(DiO), I
wanted to examine whether or not the same approach could be used to deliver
cytotoxic drug molecules. Doxorubicin (Dox) was our first choice (as described in
3.2.5) because of its intrinsic fluorescence. However, as I showed before, NG
encapsulated Dox revealed to be leaky due to it being relatively more hydrophilic.
Therefore, I decided to use docetaxel (DTX) which is a common chemotherapy drug
from taxane class targeting microtubules in the cell. Unfortunately, I was unable to
quantify the encapsulation amount after NG(DTX) was formed. Nevertheless,
conjugation to anti-CD4 was carried out under the conditions described above.
To test the selectivity of cell killing, CD4high and CD4low mT-ALL cells were
cultured separately on 96-well plate (50 % of the plate was seeded with CD4high cells,
other 50% with CD4low cells). In the case of selective cell killing, CD4high mT-ALL
Figure 3-15 Selective cell killing assay with anti-CD4/NG(DTX).
CD4high and CD4low mT-ALL cells were incubated with NG(DTX), anti-CD4 and
NG(DTX) mixture or anti-CD4/NG(DTX) conjugate for 24 hours. Cells were
incubated 24 more hours after media containing the NG samples were removed. MTT
assay was performed to measure the cell proliferation and activity. Untreated cells
were used as control (not shown in the graphs) to normalize the absorbance of MTT
formazan.
63
cells should be more sensitive to anti-CD4/NG(DTX) compared to CD4low cells. Cells
were incubated with NG(DTX), anti-CD4 and NG(DTX) mixture or anti-
CD4/NG(DTX) conjugate for 24 hours. After the treatment, cells were washed and
cultured for another day in a fresh media. MTT assay, which depends on the reduction
of tetrazolium salt reduction to water insoluble formazan dyes, ws used to measure
cellular metabolism and viability.
As expected, NG(DTX) did not show any selectivity towards either cell line
(Figure 3-15). On the other hand, the mixture of anti-CD4 and NG(DTX) was slightly
more toxic for CD4high mT-ALL cells probably due to toxicity caused by anti-CD4
antibody. A similar phenomenon has been observed for anti-HER2 antibody as well
(Lewis Phillips et al., 2008). Unfortunately, the conjugate showed similar trend with
the mixture (Figure 3-15). Subsequently, I had to conclude that hydrophobic drug
delivery through encapsulation was not working. Therefore, instead of using physical
encapsulation, I decided to chemically incorporate the drug to polymer. Because by
doing so, we could rule out cargo leakage and also we could be able to purify the
conjugate through SEC column to remove unconjugated antibody and NG. The latter
was not possible for DTX encapsulated NG because of DTX leaking during its run in
the SEC column.
3.2.10. Preparation and purification of anti-CD4/NG-DM1 conjugate
DM1 is a microtubule inhibitor from maytansine drug class. It has been used in
ADC therapies (Hughes, 2010; Lewis Phillips et al., 2008; Widdison et al., 2006). It
contains a free thiol group and thus simplifies conjugation and linker chemistry
designs for ADCs. Luckily, we could also take advantage of this component and
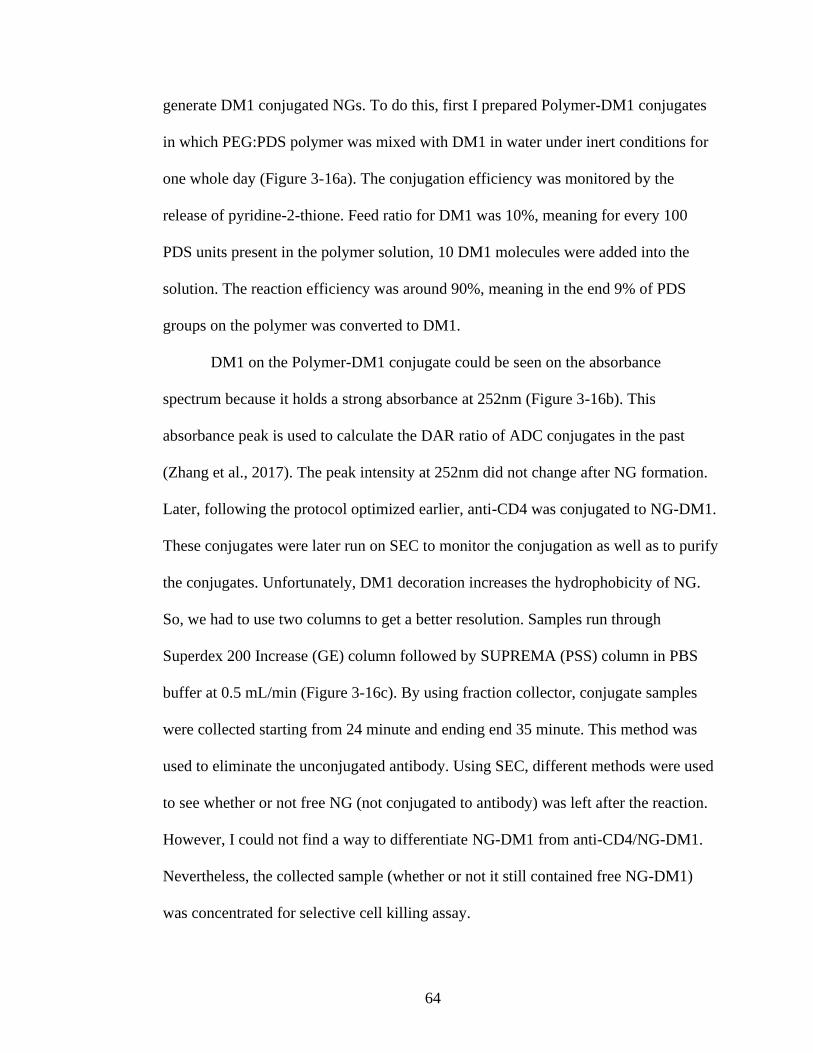
64
generate DM1 conjugated NGs. To do this, first I prepared Polymer-DM1 conjugates
in which PEG:PDS polymer was mixed with DM1 in water under inert conditions for
one whole day (Figure 3-16a). The conjugation efficiency was monitored by the
release of pyridine-2-thione. Feed ratio for DM1 was 10%, meaning for every 100
PDS units present in the polymer solution, 10 DM1 molecules were added into the
solution. The reaction efficiency was around 90%, meaning in the end 9% of PDS
groups on the polymer was converted to DM1.
DM1 on the Polymer-DM1 conjugate could be seen on the absorbance
spectrum because it holds a strong absorbance at 252nm (Figure 3-16b). This
absorbance peak is used to calculate the DAR ratio of ADC conjugates in the past
(Zhang et al., 2017). The peak intensity at 252nm did not change after NG formation.
Later, following the protocol optimized earlier, anti-CD4 was conjugated to NG-DM1.
These conjugates were later run on SEC to monitor the conjugation as well as to purify
the conjugates. Unfortunately, DM1 decoration increases the hydrophobicity of NG.
So, we had to use two columns to get a better resolution. Samples run through
Superdex 200 Increase (GE) column followed by SUPREMA (PSS) column in PBS
buffer at 0.5 mL/min (Figure 3-16c). By using fraction collector, conjugate samples
were collected starting from 24 minute and ending end 35 minute. This method was
used to eliminate the unconjugated antibody. Using SEC, different methods were used
to see whether or not free NG (not conjugated to antibody) was left after the reaction.
However, I could not find a way to differentiate NG-DM1 from anti-CD4/NG-DM1.
Nevertheless, the collected sample (whether or not it still contained free NG-DM1)
was concentrated for selective cell killing assay.

65
Figure 3-16 Preparation and purification of anti-CD4/NG-DM1 conjugate
(a) The structure of the Polymer (PEG:PDS), DM1 and Polymer-DM1.
(b) Absorbance spectrum of Polymer (in black), Polymer-DM1 (in red) and NG-DM1
(in blue). DM1 shoulder could be seen at 252nm.
(c) SEC analysis of control mixture and the conjugate. Samples run through Superdex
200 Increase (GE) column followed by SUPREMA (PSS) column in PBS buffer at 0.5
mL/min flow rate. The wavelength detector was set at 214nm.
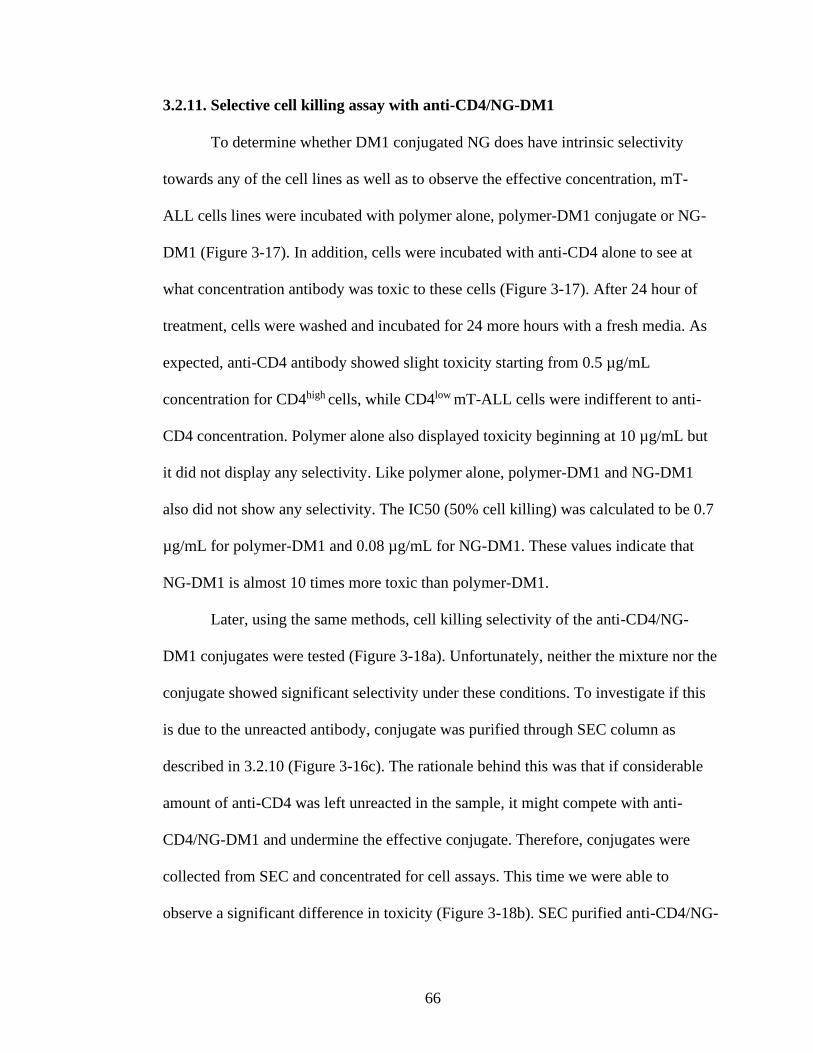
66
3.2.11. Selective cell killing assay with anti-CD4/NG-DM1
To determine whether DM1 conjugated NG does have intrinsic selectivity
towards any of the cell lines as well as to observe the effective concentration, mT-
ALL cells lines were incubated with polymer alone, polymer-DM1 conjugate or NG-
DM1 (Figure 3-17). In addition, cells were incubated with anti-CD4 alone to see at
what concentration antibody was toxic to these cells (Figure 3-17). After 24 hour of
treatment, cells were washed and incubated for 24 more hours with a fresh media. As
expected, anti-CD4 antibody showed slight toxicity starting from 0.5 µg/mL
concentration for CD4high cells, while CD4low mT-ALL cells were indifferent to anti-
CD4 concentration. Polymer alone also displayed toxicity beginning at 10 µg/mL but
it did not display any selectivity. Like polymer alone, polymer-DM1 and NG-DM1
also did not show any selectivity. The IC50 (50% cell killing) was calculated to be 0.7
µg/mL for polymer-DM1 and 0.08 µg/mL for NG-DM1. These values indicate that
NG-DM1 is almost 10 times more toxic than polymer-DM1.
Later, using the same methods, cell killing selectivity of the anti-CD4/NG-
DM1 conjugates were tested (Figure 3-18a). Unfortunately, neither the mixture nor the
conjugate showed significant selectivity under these conditions. To investigate if this
is due to the unreacted antibody, conjugate was purified through SEC column as
described in 3.2.10 (Figure 3-16c). The rationale behind this was that if considerable
amount of anti-CD4 was left unreacted in the sample, it might compete with anti-
CD4/NG-DM1 and undermine the effective conjugate. Therefore, conjugates were
collected from SEC and concentrated for cell assays. This time we were able to
observe a significant difference in toxicity (Figure 3-18b). SEC purified anti-CD4/NG-
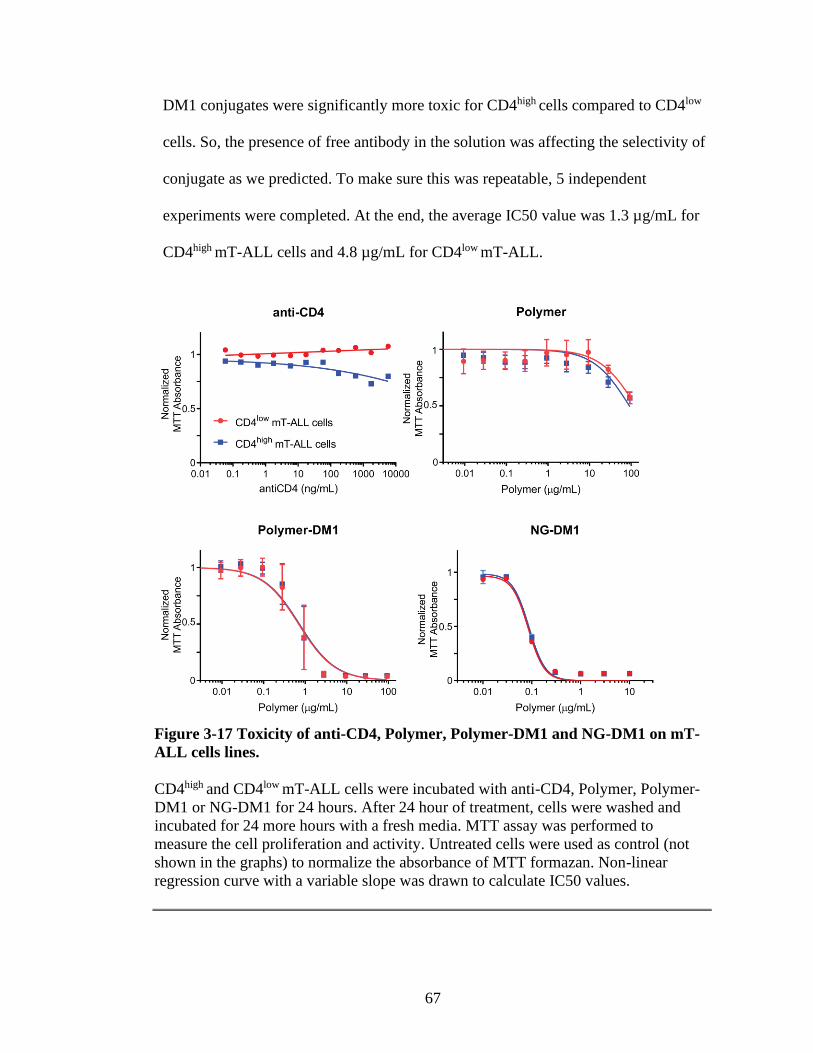
67
DM1 conjugates were significantly more toxic for CD4high cells compared to CD4low
cells. So, the presence of free antibody in the solution was affecting the selectivity of
conjugate as we predicted. To make sure this was repeatable, 5 independent
experiments were completed. At the end, the average IC50 value was 1.3 µg/mL for
CD4high mT-ALL cells and 4.8 µg/mL for CD4low mT-ALL.
Figure 3-17 Toxicity of anti-CD4, Polymer, Polymer-DM1 and NG-DM1 on mT-
ALL cells lines.
CD4high and CD4low mT-ALL cells were incubated with anti-CD4, Polymer, Polymer-
DM1 or NG-DM1 for 24 hours. After 24 hour of treatment, cells were washed and
incubated for 24 more hours with a fresh media. MTT assay was performed to
measure the cell proliferation and activity. Untreated cells were used as control (not
shown in the graphs) to normalize the absorbance of MTT formazan. Non-linear
regression curve with a variable slope was drawn to calculate IC50 values.
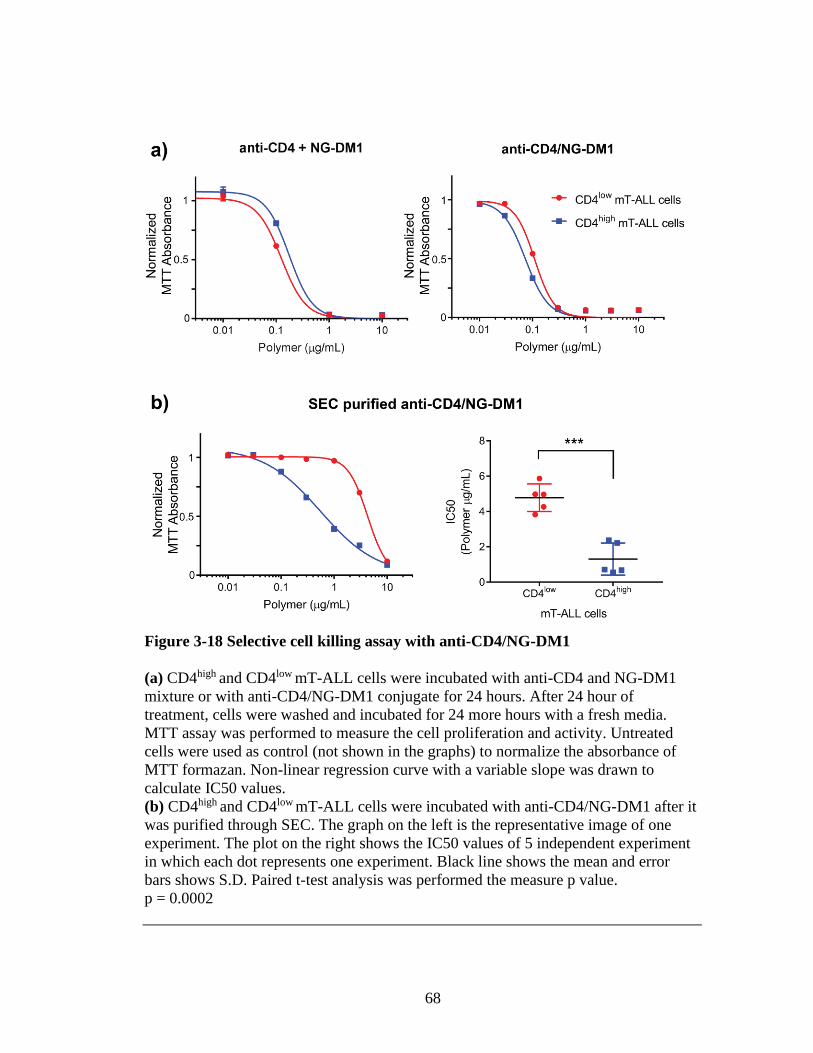
68
Figure 3-18 Selective cell killing assay with anti-CD4/NG-DM1
(a) CD4high and CD4low mT-ALL cells were incubated with anti-CD4 and NG-DM1
mixture or with anti-CD4/NG-DM1 conjugate for 24 hours. After 24 hour of
treatment, cells were washed and incubated for 24 more hours with a fresh media.
MTT assay was performed to measure the cell proliferation and activity. Untreated
cells were used as control (not shown in the graphs) to normalize the absorbance of
MTT formazan. Non-linear regression curve with a variable slope was drawn to
calculate IC50 values.
(b) CD4high and CD4low mT-ALL cells were incubated with anti-CD4/NG-DM1 after it
was purified through SEC. The graph on the left is the representative image of one
experiment. The plot on the right shows the IC50 values of 5 independent experiment
in which each dot represents one experiment. Black line shows the mean and error
bars shows S.D. Paired t-test analysis was performed the measure p value.
p = 0.0002
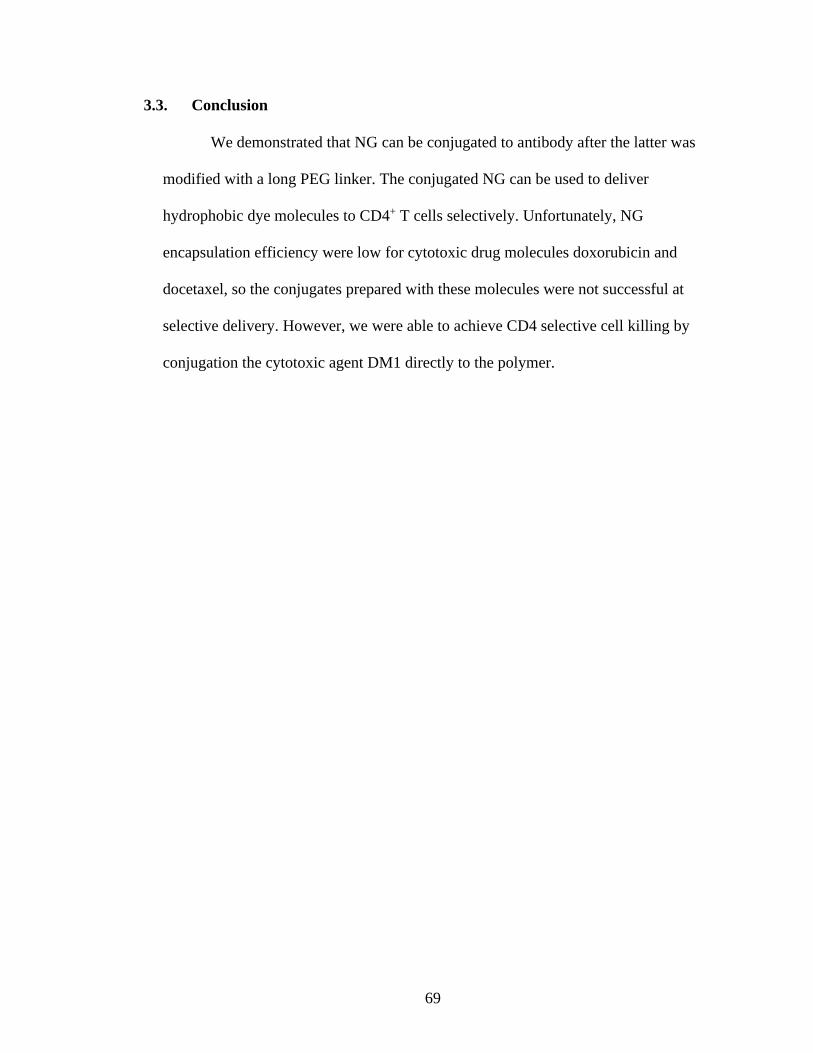
69
3.3. Conclusion
We demonstrated that NG can be conjugated to antibody after the latter was
modified with a long PEG linker. The conjugated NG can be used to deliver
hydrophobic dye molecules to CD4+ T cells selectively. Unfortunately, NG
encapsulation efficiency were low for cytotoxic drug molecules doxorubicin and
docetaxel, so the conjugates prepared with these molecules were not successful at
selective delivery. However, we were able to achieve CD4 selective cell killing by
conjugation the cytotoxic agent DM1 directly to the polymer.

70
CHAPTER 4
TARGETING CD4+ CELL IN VIVO WITH ANTI-CD4/NG CONJUGATES
4.1. Introduction
Upon intravenous administration, nanoparticles enter the circulation and are
distributed to the organs and tissues. This distribution largely depends on the shape,
size, surface charge and protein corona when there is no active ligand present on the
surface of the nanoparticle (Gordon et al., 2018a; Longmire et al., 2008). Small
molecules—less than 10 nm—are excreted through urinary track due to the glomerular
filtration in kidneys whereas large proteins (e.g. antibody) and nanoparticles larger
than 10 nm size are retained in the circulation. So, for nanoparticles renal clearance
can be avoided by size manipulation. On the other hand, avoiding the liver and spleen
is way more challenging because of reticuloendothelial and mononuclear phagocytic
systems (Hume, 2006; Soo Choi et al., 2007). These organs are equipped with
macrophages that can uptake macromolecules—like antibodies, viruses or
nanoparticles—and clear them from the circulation. To overcome this biological
barrier, PEGylation has been introduced to the nanoparticle therapies. PEGylation or
coating surface of the nanoparticle with PEG (poly-ethylene glycol) has shown to
decrease the interaction of nanoparticle with serum proteins by forming a hydrophilic
protective layer on its surface (Duncan, 2006; Harris and Chess, 2003; Owensiii and
Peppas, 2006).
The objective of this project is to evaluate the targeting ability of anti-CD4/NG
in in vivo conditions. Previously, in Chapter 3, we showed that these conjugates could
be used to deliver lipophilic dye molecules or cytotoxic drug DM1 to CD4+ T cells.

71
However, the in vitro cell culture system is simpler and more straightforward than in
vivo systems. In in vitro experimental conditions, we control the cell type and cell
density as well as the buffer, pH and temperature. On the other hand, the in vivo
system is far more complex. By conjugating anti-CD4 to NG, we aim limit the uptake
only to cells carrying CD4 receptor on their cell surface because ideally the uptake of
the nanogel should be mediated by the interaction between the antibody (anti-CD4) on
the NG and the antigen (CD4) on the cell. However, pharmacokinetics—the serum
stability, serum half-life and bioavailability—of this nanoparticle formulation are
unknown. Our objective here is to provide some answers to these unknowns, to
observe the benefits and drawbacks of the current antibody-nanogel conjugates.
4.2. Results and Discussion
4.2.1. Tracking anti-CD4/NG(DiR) biodistribution in vivo
CD4+ T cells can be found in the spleen, thymus and lymph nodes. These
organs also contain macrophages that can uptake NGs in a non-specific manner.
Because our NG has PEG units, this non-specific uptake may not be an issue. And to
investigate this, we decided to track the NG in in vivo conditions. DiR was chosen as
the guest molecule for its near-infrared excitation (750 nm), where tissue are
maximally transparent and stably encapsulated in NGs (Pastrana, 2013). Anti-CD4
was conjugated to NG(DiR) and the conjugate was purified and concentrated through
SEC (as described in Chapter 3). Finally, 100 µg of unconjugated or anti-CD4
conjugated NG(DiR) was injected to FVB/NJ mice intravenously through the tail vein
in 100 µL of sterile PBS. Epi-fluorescence images of animals were taken at 3 hour and
72
12 hour post-injection (Figure 4-1). In epi-fluorescence measurements, the position of
the animal is extremally important because at any given position, organs are not
exposed to the light source evenly. Therefore, the images were acquired at three
different positions; prone, supine and left recumbent position which places the spleen
directly under the light source.
Overall fluorescence intensity levels were similar at 3 hour post-injection for
unconjugated and conjugated NG. However, we did observe a strong signal
originating from the left flank of the mouse injected with conjugate that was missing
in the control. The signal was apparent in prone and recumbent position (indicated as
black dashed circle in Figure 4-1a) in which the spleen was exposed to the light
source. In 12 hour post-injection images, conjugate injected mouse displayed stronger
fluorescence signal overall and majority of the signal was coming from liver and/or
spleen. Although these results were illuminating, it did not exactly provide the desired
information. To pinpoint the fluorescence signal, we need to use Fluorescence
Imaging Topography (FLIT) which is a 3D trans-illuminating fluorescence imaging
technique. FLIT technique combines the CT scan with fluorescence images. However,
different from epi-illumination, the light source for excitation is placed opposite to the
camera for trans-illumination. The position of the light source is adjustable and
because it is closer to the animal it has better tissue penetration capability.
Figure 4-2 displays reconstituted FLIT images acquired when the light source
was placed encompass liver, spleen and kidneys. 24 hour post-injection, fluorescence
signal was located at the kidneys precisely (Figure 4-2b). On the other hand, 3 hour
post-injection showed localization at spleen for the conjugate and liver for the mixture.

73
This result correlated with the epi-fluorescence images and demonstrated that the
circulation time of these conjugates were less than 1 day.
Next, we wanted to see if the conjugate can accumulate in the thymus, a
primary lymph organ within T cell mature and develop into CD4+ helper T or CD8+
cytotoxic T cells. The trans-luminating area was placed to encompass upper mammary
regions to visualize thymus and heart. At 3 hour post-injection there was significant
amount of NG in the circulation so we detected a strong fluorescence signal located at
the heart (Figure 4-3b). Thymus is located very close to the heart, therefore
reconstituted 3D tomography images were difficult to interpret (Figure 4-3a). On the
other hand, appropriate sagittal and transaxial cross-sections presented a more clear
picture (Figure 4-3b). For the mixture injected animal, majority of the signal was
located the position of the heart whereas the signal from the conjugate injected animal
were originated from two or three different locations. These are predicted to be
thymus or lymph nodes in the upper thoraric duct (e.g. cervical lymph nodes).
IVIS images are a powerful source to visualize and track the nanoparticles in
vivo conditions without sacrificing the animal. However, the limitations of this
approach needs to be clarified. First of all, the DiR dye is physically entrapped in the
NG and not chemically linked to the polymer. The in vivo stability of the NG(DiR)
complex is unknown. It might leak after a certain time, so we do not know if the dye
we are visualizing is still in the NG or not. Secondly, we need to consider that the fur,
the diet of the animal and position of the light source affects the in vivo fluorescence
signal intensity. Overall, the images we obtained were informative on the circulation
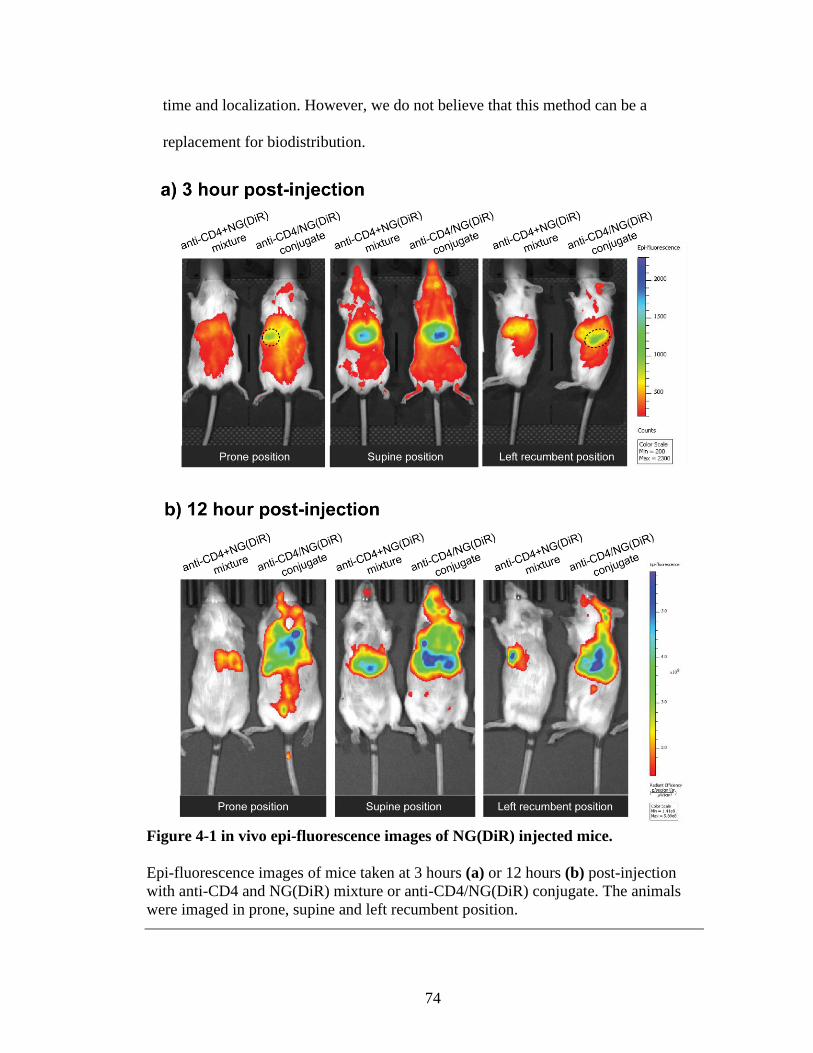
74
time and localization. However, we do not believe that this method can be a
replacement for biodistribution.
Figure 4-1 in vivo epi-fluorescence images of NG(DiR) injected mice.
Epi-fluorescence images of mice taken at 3 hours (a) or 12 hours (b) post-injection
with anti-CD4 and NG(DiR) mixture or anti-CD4/NG(DiR) conjugate. The animals
were imaged in prone, supine and left recumbent position.
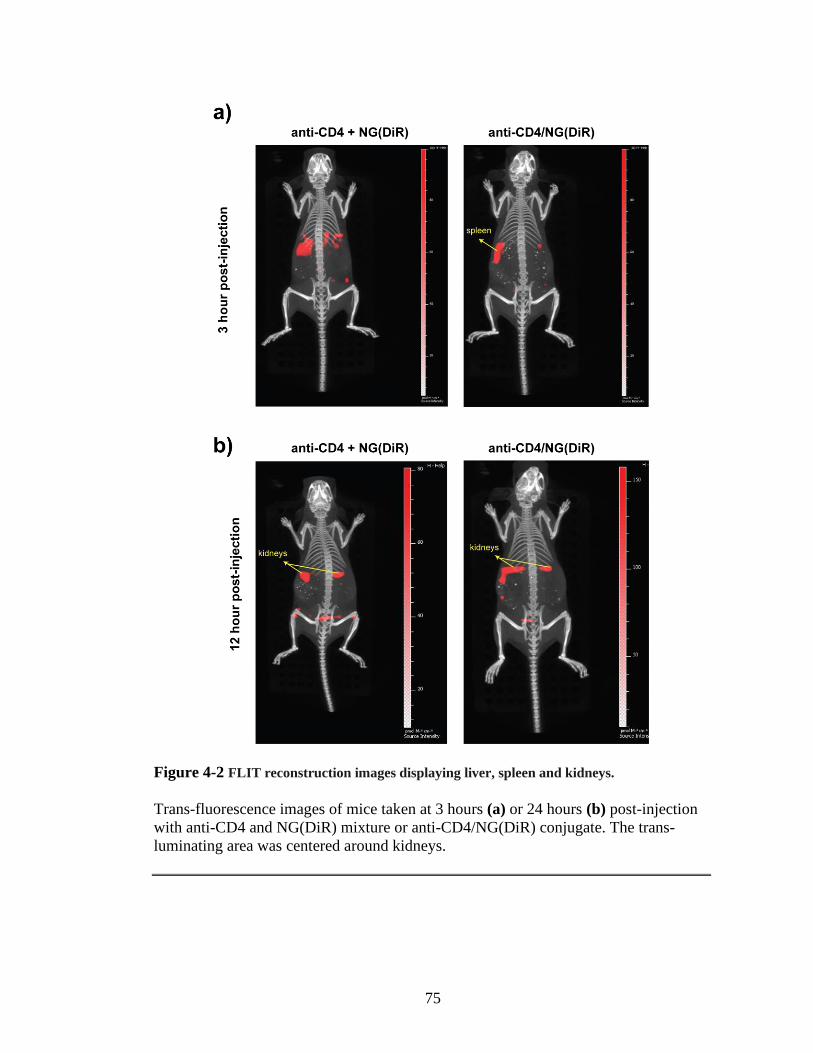
75
Figure 4-2 FLIT reconstruction images displaying liver, spleen and kidneys.
Trans-fluorescence images of mice taken at 3 hours (a) or 24 hours (b) post-injection
with anti-CD4 and NG(DiR) mixture or anti-CD4/NG(DiR) conjugate. The trans-
luminating area was centered around kidneys.

76
Figure 4-3 FLIT reconstruction images displaying thymus and heart.
Trans-fluorescence images of mice taken at 3 hours post-injection with anti-CD4 and
NG(DiR) mixture or anti-CD4/NG(DiR) conjugate. Images are represented as 3D
tomography (a) as well as appropriate sagittal and transaxial cross-sections (b).The
trans-luminating area was placed to encompass upper mammary regions to visualize
thymus and heart. “*” represents the predicted location of thymus.

77
4.2.2. Treating mT-ALL tumors with anti-CD4/NG-DM1
As described in Chapter 2, mT-ALL cells were transduced to overexpress CD4
and effLuc (enhanced firefly luciferase). And because these cells express the
luciferase enzyme (effLuc), the location as well as growth of mT-ALL tumors could
be monitored in vivo through bioluminescence (Figure 2-6).
CD4+effLuc+ mT-ALL cells were injected into the left flanks of 7 mice
subcutaneously 4 hours after they have been irradiated with 500 rad. Animals were
divided into 3 groups: PBS (n=2), anti-CD4 and NG-DM1 mixture (n=2) and anti-
Figure 4-4 Results of anti-CD4/NG-DM1 injection into CD4+ mT-ALL tumor
bearing mice.
(a) Schematic illustration of experimental design.
(b) Weight percent change of PBS (n=2), anti-CD4+NG-DM1 mixture (n=2) and anti-
CD4/NG-DM1 (n=3) injected mice overtime.
(c) Left graph shows the tumor volume measurements, right graph shows the
bioluminescence signal in total flux (photons/second). Each line represents on mouse.
x mark on the tumor volume graph indicates the death.
78
CD4/NG-DM1 (n=3). When the tumor sizes reached to 100 mm3 , the corresponding
samples were administered into the bloodstream through i.v. injection. Changes in the
tumor growth were monitored through tumor volume measurements as well as
bioluminescence (Figure 4-4a). Mice weight percent change was monitored to detect
the stress caused by the injected samples since significant weight drop is an indication
of systemic toxicity (Figure 4-4b). The injection were carried out on days 10,14 and
17 (three injection per week was our aim).
Unfortunately, we did not observe significant regression of mT-ALL tumors.
Actually, none of the mice survived after all three injections. There was no difference
between the mixture injected mice and the conjugate injected mice. Moreover, the
drop in the weight percent change compared to control PBS indicated that there was
significant amount of off-target toxicity caused by NG-DM1.
4.2.3. Studying anti-CD4/NG conjugate with organotypic tumor spheroids
So far, anti-CD4/NG-DM1 conjugate was studied in basic 2D cell culture
system and displayed targeting ability against CD4+ cells. On the other hand, in vivo
results were not as satisfying. To investigate the in vivo problem, we decided to study
the effectiveness of anti-CD4/NG conjugate in a more complex 3D cell culture system.
To achieve this, we generated murine-derived organotypic tumor spheroids that could
be cultured in collagen hydrogels (Aref et al., 2018; Jenkins et al., 2018). First, mT-
ALL cells were grown under various conditions so they would form spheroids.
Unfortunately, none of the spheroids formed from mT-ALL cells were viable. So, we
decided to work with a cell line that is known to form viable spheroids.
79
MC38 (mouse colon #38) is a mouse colon adenocarcinoma cell line and tends
to form spheroids depending on its growth conditions (Efremova et al., 2018;
Hirschhaeuser et al., 2010; Jenkins et al., 2018). MC38 cells were grown in hanging-
drop fashion and formed spheroids in 24-48 hours (Figure 4-5a). Later, they were
collected from the plate, counted and mixed with collagen gel solution on ice. The
spheroid-collagen mixture was then injected into the center gel region of 3D
microfluidic culture device and incubated at 37 °C for 30 minutes or until hydrogel
formed. The gel was later hydrated with media and placed in the incubator. At 24
hour, the spheroids were stained with AO/PI (acridine orange/propidium iodide) dyes
to assess cell viability. AO is a cell permeable nucleic acid binding dye and generate a
green fluorescence. PI is not cell permeable dye so it enters cells with damaged
membrane structure (necrotic, dying or dead cells). Like AO, PI also binds to nucleic
acid, but it generates a red fluorescence. Therefore, when cells are stained with both
AO and PI, live cells display only green fluorescence and dead cells only green. By
using AO/PI staining, we were able to image the live and dead cells in the spheroids
(Figure 4-5b). The analysis of obtained images displayed 90-95% viability for MC38
spheroids.
Because MC38 does not express CD4, we transduced this cell line with
pMIGRII-mCD4-2A-effLuc plasmid to express CD4 receptor on its cell surface. The
formed spheroids were imaged by confocal. CD4 receptor did not effect the spheroid
formation or the cell growth rate. We demonstrated in Chapter 3 that the conjugate
was successful at selective cell killing towards CD4highmT-ALL cells. So, to answer
the question of does anti-CD4/NG-DM1 show selective cell killing towards

80
CD4+MC38 cell line, we conducted the selective cell killing assay using MC38 cell
Figure 4-5 MC38 organotypic tumor spheroids
(a) MC38 spheroids formed after 5000 cells were incubated in 10 µL of hanging-drop
for 24 hours. Images were acquired with light microscopy, 10X.
(b) AO/PI staining of MC38 spheroids in hydrogel. The live cells were stained with
AO and display green fluorescence. The dead cells were stained with AO and PI
simultaneously and display red fluorescence due to the FRET between AO and PI.
Images were acquired by Nikon A1R Confocal Microscopy, 20X.
(c) MC38 and CD4+MC38 cells were incubated with NG-DM1 or with anti-CD4/NG-
DM1 conjugate for 24 hours. After 24 hour of treatment, cells were washed and
incubated for 24 more hours with a fresh media. MTT assay was performed to
measure the cell proliferation and activity. Untreated cells were used as control (not
shown in the graphs) to normalize the absorbance of MTT formazan. Non-linear
regression curve with a variable slope was drawn to calculate IC50 values.
81
lines. As expected the control NG-DM1 did not show any intrinsic selectivity (Figure
4-5c, left). Unfortunately, anti-CD4 conjugated NG-DM1 also did not show selectivity
towards CD4 expressing MC38 cell line (Figure 4-5c, right). This might be because
CD4 expression on the transduced MC38 cells are not high as they are on mT-ALL
cells. Another explanation is possible due to the internalization of CD4. Because CD4
is not normally expressed in MC38 cells, half-life of CD4 receptors on the surface
might be long, delaying the entry of NG inside the cell. Therefore, to induce CD4
internalization, MC38 cells were treated with anti-CD4/NG-DM1 in the presence or
absence of 100 ng/mL PMA (phorbol 12-myristate 13-acetate) for 6 hours (Laguette et
al., 2009). Unfortunately, even under thee conditions, the conjugate did not show
selectivity towards CD4 expressing MC38 cell line (data not shown).
82
CHAPTER 5
CONCLUSIONS AND FUTURE DIRECTIONS
Our studies showed that in vitro conditions, anti-CD4/NG conjugates were able
to deliver hydrophobic dye molecules to CD4 receptor displaying primary cells (e.g.
splenocytes) or leukemic cell lines (mT-ALL). Moreover, these conjugates were able
to kill CD4high displaying mT-ALL cells more efficiently than CD4low mT-ALL cells,
thus demonstrating selective cell killing ability of them. On the other hand, they failed
to target CD4+MC38 cells as CD4 expression of the MC38 cell surface did not effect
the IC50 value (Figure 4-5c). This might be because of lower CD4 receptor density on
transduced MC38 cells comparted to mT-ALL or because of impaired CD4
internalization in MC38 cells. In naïve T cells, CD4 receptor is thought to be
stabilized at the plasma membrane by its interaction with Lck tyrosine—a T cell
specific protein tyrosine kinase (Turner et al., 1990). CD4 receptor internalizes after
the phosphorylation of its cytoplasmic domain which reduces its interaction with Lck.
MC38 is not a lymphoid cell and lacks Lck. So, how does it maintains its CD4 is
unknown to us. However, to get around this problem we can utilize a chemical
stimulant PMA. PMA is known to increase CD4 internalization independent of Lck
(Laguette et al., 2009). This approach had been tried as described in Chapter 4-2-3.
But, that experiment unfortunately lacks a positive control, so further study with PMA
treatment might be needed to investigate why anti-CD4/NG-DM1 conjugate failed to
target CD4+MC38 cells.

83
As demonstrated in Chapter 4, in vivo administration of anti-CD4/NG(DiR)
conjugate resulted in accumulation of DiR in spleen and thymus region. This data was
acquired by IVIS which is a non-invasive biodistribution imaging technique.
Unfortunately, it is not as quantitative and does not provide the full picture. So, a more
quantitative method needs to be used in order to investigate the pharmacokinetic of
NG. The biodistribution of NG on each organ should be measured after the animal was
sacrificed and dissected.
Nanogels (NG) designed by the Thayumanavan group, shows great promise for
the development of nanoparticle based therapies (Gordon et al., 2018a, 2018b; Li and
Thayumanavan, 2014; Munkhbat et al., 2019; Ryu et al., 2010a; Ventura et al., 2015).
Here, we demonstrated that by conjugating an antibody to this chemically cross-
linked, water-soluble polymeric nanoparticle, we can deliver its cargo to target cells.
However, there are still aspects of this approach like pharmacokinetics—the serum
stability, serum half-life and bioavailability— that needs to be investigated.
84
CHAPTER 6
MATERIALS AND METHODS
6.1. Materials
6.1.1. Mice
All animals were housed in animal facilities as per the guidelines approved by
the Institutional Animal Care and Use Committee at the University of Massachusetts-
Amherst. C57BL/6J mice and FVB/NJ were purchased from the Jackson Laboratory
(Bar Harbor, ME).
6.1.2. Media
DMEM, RPMI-1640, sodium pyruvate, penicillin/streptomycin and L-
glutamine were obtained from HyCloneTM (Catalog Numbers: SH30243, SH30255,
SH30239, SV30010 and SH30034, respectively). Fetal bovine serum (FBS) was
bought from Peak Serum (Catalog Number: PS-FB3).
6.2. Methods
6.2.1. mT-ALL cell culture conditions
mT-ALL cells were grown in RPMI 1640 supplemented with 5% FBS, 100
units/mL of penicillin, 100 µg/mL of streptomycin and 2 mM of L-glutamine and
incubated in a humidified 37 °C, 5% CO2 incubator. mT-ALL cells were seeded on the
100 mm × 20 mm treated tissue-culture dishes as 5x10⁶ cells in 12 mL of complete
media. The seeding density is important for the proliferation of these cells. The cell
85
doubling time for mT-ALLs was calculated as 16-18 hours. Two day incubation of
5x10⁶ cells usually results in 30-35x106 cells per plate. At this density cells need to be
split again. To split the cells, cells were collected into a conical 15 mL tube and
centrifuge them at 213 x g (setting number 3 on IEC centrifuge) for 5 minutes.
Remove the supernatant and resuspend the cells in 1 mL of fresh complete media. To
prepare frozen mT-ALL cell stocks, cells were resuspended in appropriate volume of
cryoprotectant medium (40% RPMI + 50% FBS + 10% DMSO) to achieve cell
concentration of 5x10⁶ cells/mL. 1 mL of prepared cell suspension was aliquoted into
sterile cryogenic tubes and transferred to -80 °C. For long term storage, after one day
in -80 °C, cells were transferred to the liquid nitrogen vapor phase storage.
6.2.2. mT-ALL cell surface staining
mT-ALL cells were counted and cell suspension of 5x10⁶ cells per mL was
prepared. The cells were distributed into V-bottom 96-well plate as 100 µL per well.
The plate was spun down at 300 x g (setting number 3 on IEC centrifuge) at 4 °C for 5
minutes. The pellet of each sample/well were resuspended and incubated with Zombie
Violet dye (BioLegend, Cat. #77477) for 15 minutes in the dark at room temperature
in PBS at a ratio of 0.1 µL dye per 100 µL buffer. 100 µL of FACS buffer (PBS + 2%
FBS) was added to each well to quench the extra dye and the plate was spun down
again at the previously described conditions. Surface marker staining were performed
according to the manufacturer’s protocol in FACS buffer (PBS + 2% FBS). Cells were
washed in FACS buffer prior to analysis on a BD LSRFortessa with FACSDiva
software (BD Biosciences). Data were analyzed using FlowJo (Tree Star) Software.
86
6.2.3. Retrovirus transfection of HEK293T
HEK293T cells were seeded on 6-well plate one day prior to transfection at
50% confluence in 1 mL of DMEM/F12 media supplemented with 10% FBS, 100
units/mL of penicillin, 100 µg/mL of streptomycin and 2 mM of L-glutamine and
incubated in a humidified 37°C, 10% CO2 incubator. On the day of the transfection
confluency was around 80%. Each well of the 6-well plate were transfected with 2 µg
of plasmid (0.4 µg of mouse envelope + 0.8 µg of mouse gag-pol + 0.8 µg of MIGII
vector). 2 µg of plasmid cocktail was diluted in OPTI-MEM media to 0.1 mL and
mixed with 2 µL of X-treme GENE HP Transfection Reagent. This transfection
mixture was vortexed briefly and incubated at room temperature for 15 minutes then
added to the cells dropwise. One day after the transfection, media was replaced with 1
mL of fresh media. On the second day, now virus-containing media was collected
from the samples. This process continued for the third day as well. Retrovirus
containing media was filtered through 0.45 micron filter and kept at 4 °C for short-
term storage (maximum 3-4 days after collection).
6.2.4. Infection of mT-ALL cell lines
In 12-well plate, 1x10⁶ of mT-All cells were mixed with 8 µg of polybrene (0.8
µL of 10 mg/mL of stock) in 1 mL of diluted retrovirus supernatant at 1100 x g for 90
minutes at 30 °C. After centrifugation, plate was incubated at 37 °C incubator for 2
hours. Cells were removed from the well plate and transferred into 1.5 mL
microcentrifuge tube. Samples were centrifuged and cell pellet was resuspended in
fresh RPMI+5%FBS media. Infected cells were seeded on a new plate and incubated
in 37 °C incubator at 5% CO2.
87
6.2.5. Synthesis of PEG:PDS random copolymer
Random copolymer p(PEGMA-co-PDSMA) was synthesized by a reversible
addition fragmentation chain transfer (RAFT) polymerization of monomers
poly(ethylene glycol) methyl ether methacrylate (PEGMA) and pyridyl disulfide ethyl
methacrylate (PDSMA). After purification of the polymer, monomer ratio of
PEG:PDS were calculated to be 3:7 according to the NMR results.
6.2.6. Preparation of nanogels
Polymer micelles were prepared by dissolving the amphiphilic random
copolymer of PEG:PDS in distilled water at 10 mg/mL concentration. If the size of the
micelle was small (< 10 d.nm), sodium sulfate was added to the polymer solution with
a final concentration ranging from 5 – 50 mM until desired size formed. To prepare
nanogels, polymer micelles were chemically crosslinked with DTT (dithiothreitol),
thus locking the size of nanogel as well as entrapping the encapsulated guest
molecules. Crosslink percentage of the nanogel was controlled by adding 0.1 mole
equivalent of DTT. According to prior published data 20% crosslinking of PDS units
achieves a stable nanogel. Crosslinking reaction was monitored with the UV
absorption spectrometer by following the release of the byproduct, pyridine-2-thione,
at 343 nm. Crosslink density was calculated by using the molar extinction coefficient
of byproduct (8.08*103 M-1cm-1 at 343 nm). Size distribution of polymer
nanoparticles were measured with Malvern Nanozetasizer-ZS. All samples were
diluted to 0.1-0.5 mg/mL with distilled water and filtered through 0.22 micron syringe
filter prior to measurement. Hydrodynamic diameters provided are volume averages of
three measurements.

88
To track the nanogel in cell assays, DiI or DiO encapsulated nanogels were
used. For encapsulation, 1% wt feed of lipophilic indocarbocyanine dyes were
dissolved in acetone and added into the polymer solution with 2% (v/v). The solution
was stirred at room temperature for 6 hours to allow evaporation of acetone and
crosslinked with DTT at the desired crosslinking density. Non-encapsulated dye was
removed from the solution though 0.45 micron sized syringe filter.
6.2.7. Preparation of DM1 conjugated polymers
DM1 conjugated nanogel was synthesized by post-modification of PEG:PDS
polymer. DM1 was dissolved in DMSO to a final concentration of 100 mM and mixed
with polymer that was dissolved in distilled water at 10 mg/mL concentration. Feed
ratio of DM1 was equivalent to 10% of PDS units on the polymer. The solution was
stirred at room temperature for two day under inert conditions. DM1 conjugation was
assessed by the release of pyridine-2-thione and calculated to be 7-9%.
6.2.8. Modification of anti-mCD4 with PEG linkers
Antibody stock (BioXCell, rat anti-mouseCD4, clone GK1.5) was diluted in
the reaction buffer composed of 0.2 M Na2PO4 and 0.1 M NaCl at pH 8.5. Solution
was spinned down at 7500xg for 15 mins at 4 °C using Amicon-10 kDa cutoff
centrifugal filter unit to exchange the buffer as well as to concentrate the antibody in
the sodium phosphate buffer. This step is also essential to remove the preservatives
such as sodium azide in the stock solution, although according to the manufacturer the
antibody stock we used did not contain sodium azide.
89
After filter centrifugation, concentrate was collected from the filter and
antibody concentration was calculated by measuring the absorbance at 280 nm. ε of
IgG was taken as 199500 cm-1 M-1. When measurement was taken using Nanodrop,
path of light was taken as 0.05 cm. Molarity of IgG is calculated by taking molecular
weight of antibody as 150 kDa which was later shown to close since SEC-MALDI
measurements calculated the molecular weight as 145 kDa.
The linkers Traut’s reagent (Thermo Scientific, Catalog Number 26101),
SAT(PEG)4 (Thermo Scientific, 26099), NHS-PEG(1 kDA)-PDS (from Creative
PEGWorks, Catalog Number: PHB-994) were dissolved in DMSO to 20 mM
concentration and stored at -20 °C in small volumes to avoid multiple freeze and thaw
cycles. For antibody modification, 5-10 mg/mL of antibody solution was treated with
5 – 50 molar equivalent of linker in the sodium phosphate buffer (0.2 M Na2PO4 and
0.1 M NaCl at pH 8.5) and stirred at room temperature for 2 to 3 hour. Maximum 5%
(v/v) of DMSO was allowed in the final solution. To stop the reaction and quench the
unreacted NHS ester on the linker, 1% (v/v) of 1 M Tris-HCl (pH 7) was added into
the solution. Unreacted linker was removed from the antibody solution through
dialysis with 100 kDa membrane against PBS buffer (pH 6.5) overnight at 4 °C.
Average MW of the linker NHS-PEG(1 kDA)-PDS is calculated to be 1397
g/mol, sum of NHS ester, PEG and PDS MW’s which are ~140, ~1000 and ~257
g/mol, respectively. However, actual linker concentration was calculated by reducing
PDS groups on the linker and releasing pyridine-2-thione which absorbs at 343 nm
with ε of 8080 M-1cm-1 (Kavimandan et al., 2006; Ryu et al., 2010a). Reduction of 80
µg/mL linker in PBS buffer with excess TCEP yielded 12.3 µM of pyridine-2-thione
90
in oppose to 57.3 µM (80 µg/mL * 1397 g/mol). This showed that purity of the NHS-
PEG(1 kDa)-PDS linker was around 20% (12.3 µM / 57.3 µM). So, when preparing
the linker this purity ratio was taken into account.
6.2.9. Splenocyte isolation from mouse
Dissection stage was cleaned with 70% ethanol. Scissors and forceps were
dipped into 100% ethanol to sterilize. An incision was opened on the left side of
mouse’s abdomen and spleen was removed from the body cavity using forceps.
Removed spleen was placed in RDGs media composed of 45% RPMI, 45% DMEM,
10% FBS supplied with 2 mM sodium pyruvate, 2 mM L-glutamine, 100 units/mL of
penicillin and 100 µg/mL of streptomycin.
Inside the sterile hood, isolated spleen was placed on a cell strainer (40 µm)
and mashed gently using the plunger end of the syringe into 50 mL sterile conical
tube. Suspended cells were spun down at 800 x g for 5 minutes. Pellet was
resuspended in 2 mL of ACK (Ammonium-Chloride-Potassium) lysing buffer (155
mM of NH4Cl, 10 mM of KHCO3 and 0.1 mM EDTA) for the lysis of red blood cells
and centrifuged immediately. Pellet was resuspended in 5 mL RDGS media and kept
in ice.
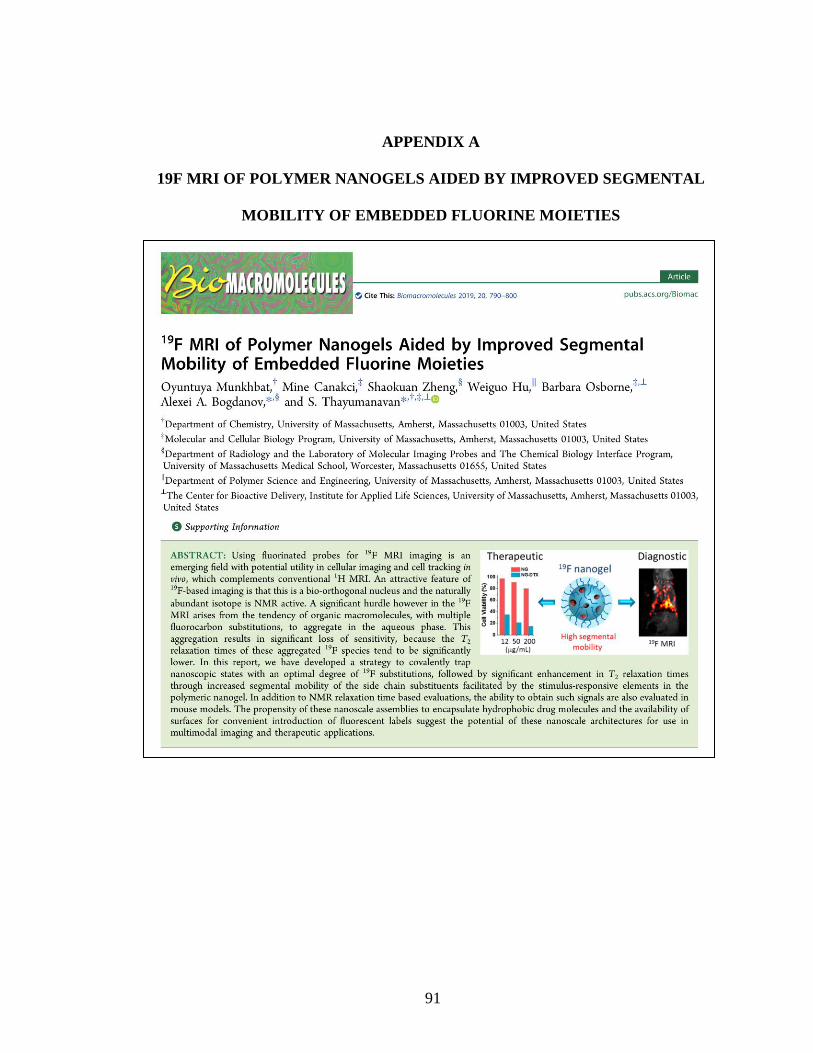
91
APPENDIX A
19F MRI OF POLYMER NANOGELS AIDED BY IMPROVED SEGMENTAL
MOBILITY OF EMBEDDED FLUORINE MOIETIES
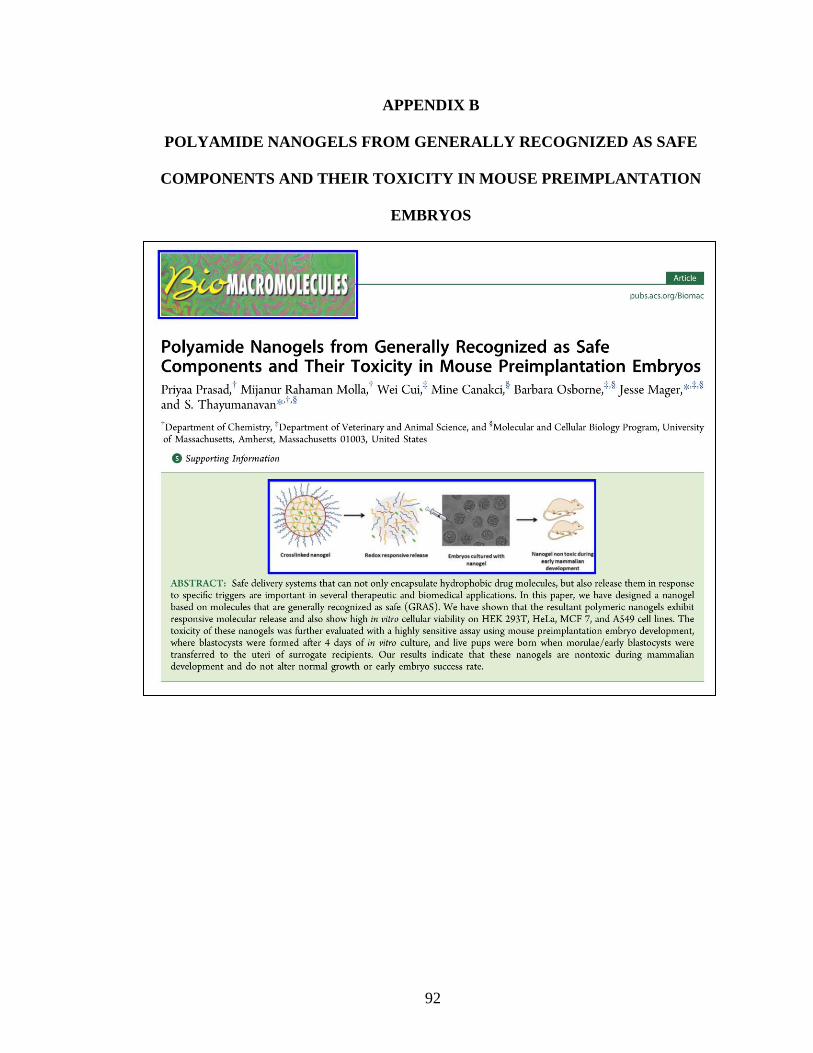
92
APPENDIX B
POLYAMIDE NANOGELS FROM GENERALLY RECOGNIZED AS SAFE
COMPONENTS AND THEIR TOXICITY IN MOUSE PREIMPLANTATION
EMBRYOS
93
BIBLIOGRAPHY
Barenholz, Y. (2012). Doxil - The first FDA-approved nano-drug: Lessons learned.
Journal of Controlled Release 160, 117–134.
Beck, A., Goetsch, L., Dumontet, C., and Corvaïa, N. (2017). Strategies and challenges
for the next generation of antibody–drug conjugates. Nature Reviews Drug
Discovery 16, 315–337.
Bickerton, S., Jiwpanich, S., and Thayumanavan, S. (2012). Interconnected Roles of
Scaffold Hydrophobicity, Drug Loading, and Encapsulation Stability in Polymeric
Nanocarriers. Mol. Pharmaceutics 9, 3569–3578.
Brun, M.-P., and Gauzy-Lazo, L. (2013). Protocols for Lysine Conjugation. In Antibody-
Drug Conjugates, L. Ducry, ed. (Totowa, NJ: Humana Press), pp. 173–187.
Buss, N.A., Henderson, S.J., McFarlane, M., Shenton, J.M., and de Haan, L. (2012).
Monoclonal antibody therapeutics: history and future. Current Opinion in
Pharmacology 12, 615–622.
Carter, P.J., and Lazar, G.A. (2017). Next generation antibody drugs: pursuit of the
“high-hanging fruit.” Nature Reviews Drug Discovery 17, 197–223.
Chabner, B.A., Levine, A.S., Johnson, B.L., and Young, R.C. (1978). Initial clinical trials
of maytansine, an antitumor plant alkaloid. Cancer Treat Rep 62, 429–433.
Chalouni, C., and Doll, S. (2018). Fate of Antibody-Drug Conjugates in Cancer Cells.
Journal of Experimental & Clinical Cancer Research 37.
Chari, R.V.J., Miller, M.L., and Widdison, W.C. (2014). Antibody-drug conjugates: An
emerging concept in cancer therapy. Angewandte Chemie - International Edition
53, 3796–3827.
Chowdhury, R., and Ellis, P. (2014). Trastuzumab (Herceptin®) and Ado-Trastuzumab
Emtansine (Kadcyla®): Treatments for HER2-Positive Breast Cancer. In
Handbook of Therapeutic Antibodies, S. Dübel, and J.M. Reichert, eds.
(Weinheim, Germany: Wiley-VCH Verlag GmbH & Co. KGaA), pp. 2041–2068.
94
Cosette, J., Ben Abdelwahed, R., Donnou-Triffault, S., Sautès-Fridman, C., Flaud, P., and
Fisson, S. (2016). Bioluminescence-Based Tumor Quantification Method for
Monitoring Tumor Progression and Treatment Effects in Mouse Lymphoma
Models. Journal of Visualized Experiments.
Dawidczyk, C.M., Kim, C., Park, J.H., Russell, L.M., Lee, K.H., Pomper, M.G., and
Searson, P.C. (2014). State-of-the-art in design rules for drug delivery platforms:
Lessons learned from FDA-approved nanomedicines. Journal of Controlled
Release 187, 133–144.
Demarest, R.M., Ratti, F., and Capobianco, A.J. (2008). It’s T-ALL about Notch.
Oncogene 27, 5082–5091.
DeVita, V.T., and Chu, E. (2008). A history of cancer chemotherapy. Cancer Research
68, 8643–8653.
Dong, H., Strome, S.E., Salomao, D.R., Tamura, H., Hirano, F., Flies, D.B., Roche, P.C.,
Lu, J., Zhu, G., Tamada, K., et al. (2002). Tumor-associated B7-H1 promotes T-
cell apoptosis: A potential mechanism of immune evasion. Nature Medicine 8,
793–800.
Doronina, S.O., Toki, B.E., Torgov, M.Y., Mendelsohn, B.A., Cerveny, C.G., Chace,
D.F., DeBlanc, R.L., Gearing, R.P., Bovee, T.D., Siegall, C.B., et al. (2003).
Development of potent monoclonal antibody auristatin conjugates for cancer
therapy. Nature Biotechnology 21, 778–784.
Draheim, K.M., Hermance, N., Yang, Y., Arous, E., Calvo, J., and Kelliher, M.A. (2011).
A DNA-binding mutant of TAL1 cooperates with LMO2 to cause T cell leukemia
in mice. Oncogene 30, 1252–1260.
Dübel, S., and Reichert, J.M. (2014). Therapeutic Antibodies - from Past to Future. In
Handbook of Therapeutic Antibodies, S. Dübel, and J.M. Reichert, eds.
(Weinheim, Germany: Wiley-VCH Verlag GmbH & Co. KGaA), pp. 1–14.
Duncan, R. (2006). Polymer conjugates as anticancer nanomedicines. Nature Reviews
Cancer 6, 688–701.

95
Efremova, M., Rieder, D., Klepsch, V., Charoentong, P., Finotello, F., Hackl, H.,
Hermann-Kleiter, N., Löwer, M., Baier, G., Krogsdam, A., et al. (2018).
Targeting immune checkpoints potentiates immunoediting and changes the
dynamics of tumor evolution. Nature Communications 9.
Fleming, A. (1929). On the antibacterial action of cultures of a penicillium, with special
reference to their use in the isolation of B. Influenzae. 13.
Frei, E. (1992). Combination Cancer Therapy: Presidential Address. Cancer Research 32,
2593–2607.
Gilman, A. (1963). The initial clinical trial of nitrogen mustard. The American Journal of
Surgery 105, 574–578.
González-Toro, D.C., Ryu, J.-H., Chacko, R.T., Zhuang, J., and Thayumanavan, S.
(2012). Concurrent Binding and Delivery of Proteins and Lipophilic Small
Molecules Using Polymeric Nanogels. J. Am. Chem. Soc. 134, 6964–6967.
Gordon, M.R., Canakci, M., Li, L., Zhuang, J., Osborne, B., and Thayumanavan, S.
(2015). Field Guide to Challenges and Opportunities in Antibody-Drug
Conjugates for Chemists. Bioconjugate Chemistry 26, 2198–2215.
Gordon, M.R., Zhuang, J., Ventura, J., Li, L., Raghupathi, K., and Thayumanavan, S.
(2018a). Biodistribution Analysis of NIR-Labeled Nanogels Using in Vivo FMT
Imaging in Triple Negative Human Mammary Carcinoma Models. Mol.
Pharmaceutics.
Gordon, M.R., Zhao, B., Anson, F., Fernandez, A., Singh, K., Homyak, C., Canakci, M.,
Vachet, R.W., and Thayumanavan, S. (2018b). Matrix Metalloproteinase-9-
Responsive Nanogels for Proximal Surface Conversion and Activated Cellular
Uptake. Biomacromolecules.
Hamblett, K.J., Senter, P.D., Chace, D.F., Sun, M.M.C., Lenox, J., Cerveny, C.G.,
Kissler, K.M., Bernhardt, S.X., Kopcha, A.K., Zabinski, R.F., et al. (2004).
Effects of Drug Loading on the Antitumor Activity of a Monoclonal Antibody
Drug Conjugate. Clin Cancer Res 10, 7063–7070.
Harris, J.M., and Chess, R.B. (2003). Effect of pegylation on pharmaceuticals. Nature
Reviews Drug Discovery 2, 214–221.
96
Harris, L.J., Larson, S.B., Hasel, K.W., and McPherson, A. (1997). Refined Structure of
an Intact IgG2a Monoclonal Antibody,. Biochemistry 36, 1581–1597.
Hermanson, G.T. (2013a). Antibody Modification and Conjugation. In Bioconjugate
Techniques, (Elsevier), pp. 867–920.
Hermanson, G.T. (2013b). The Reactions of Bioconjugation. In Bioconjugate
Techniques, (Elsevier), pp. 229–258.
Hirschhaeuser, F., Menne, H., Dittfeld, C., West, J., Mueller-Klieser, W., and Kunz-
Schughart, L.A. (2010). Multicellular tumor spheroids: An underestimated tool is
catching up again. Journal of Biotechnology 148, 3–15.
Hughes, B. (2010). Antibody–drug conjugates for cancer: poised to deliver? Nature
Reviews Drug Discovery 9, 665–667.
Hume, D.A. (2006). The mononuclear phagocyte system. Current Opinion in
Immunology 18, 49–53.
Hurvitz, S.A., Dirix, L., Kocsis, J., Bianchi, G.V., Lu, J., Vinholes, J., Guardino, E.,
Song, C., Tong, B., Ng, V., et al. (2013). Phase II Randomized Study of
Trastuzumab Emtansine Versus Trastuzumab Plus Docetaxel in Patients With
Human Epidermal Growth Factor Receptor 2–Positive Metastatic Breast Cancer.
Journal of Clinical Oncology 31, 1157–1163.
Jain, N., Smith, S.W., Ghone, S., and Tomczuk, B. (2015). Current ADC Linker
Chemistry. Pharmaceutical Research 32, 3526–3540.
Jenkins, R.W., Aref, A.R., Lizotte, P.H., Ivanova, E., Stinson, S., Zhou, C.W., Bowden,
M., Deng, J., Liu, H., Miao, D., et al. (2018). Ex Vivo Profiling of PD-1 Blockade
Using Organotypic Tumor Spheroids. Cancer Discovery 8, 196–215.
Jevševar, S., Kunstelj, M., and Porekar, V.G. (2010). PEGylation of therapeutic proteins.
Biotechnology Journal 5, 113–128.
Junutula, J.R., Raab, H., Clark, S., Bhakta, S., Leipold, D.D., Weir, S., Chen, Y.,
Simpson, M., Tsai, S.P., Dennis, M.S., et al. (2008). Site-specific conjugation of a
cytotoxic drug to an antibody improves the therapeutic index. Nature
Biotechnology 26, 925–932.

97
Kakkar, A., Traverso, G., Farokhzad, O.C., Weissleder, R., and Langer, R. (2017).
Evolution of macromolecular complexity in drug delivery systems. Nature
Reviews Chemistry 1, 0063.
Kavimandan, N.J., Losi, E., Wilson, J.J., Brodbelt, J.S., and Peppas, N.A. (2006).
Synthesis and Characterization of Insulin−Transferrin Conjugates. Bioconjugate
Chemistry 17, 1376–1384.
Kelliher, M.A., Seldin, D.C., and Leder, P. (1996). Tal-1 induces T cell acute
lymphoblastic leukemia accelerated by casein kinase IIalpha. The EMBO Journal
15, 5160–5166.
Kim, J.H., Lee, S.R., Li, L.H., Park, H.J., Park, J.H., Lee, K.Y., Kim, M.K., Shin, B.A.,
and Choi, S.Y. (2011). High cleavage efficiency of a 2A peptide derived from
porcine teschovirus-1 in human cell lines, zebrafish and mice. PLoS ONE 6, 1–8.
Laguette, N., Bregnard, C., Bouchet, J., Benmerah, A., Benichou, S., and
Basmaciogullari, S. (2009). Nef-Induced CD4 Endocytosis in Human
Immunodeficiency Virus Type 1 Host Cells: Role of p56lck Kinase. Journal of
Virology 83, 7117–7128.
Lewis Phillips, G.D., Li, G., Dugger, D.L., Crocker, L.M., Parsons, K.L., Mai, E.,
Blättler, W.A., Lambert, J.M., Chari, R.V.J., Lutz, R.J., et al. (2008). Targeting
HER2-positive breast cancer with trastuzumab-DM1, an antibody-cytotoxic drug
conjugate. Cancer Research 68, 9280–9290.
Li, L., and Thayumanavan, S. (2014). Environment-Dependent Guest Exchange in
Supramolecular Hosts. Langmuir 30, 12384–12390.
Li, L., Raghupathi, K., Song, C., Prasad, P., and Thayumanavan, S. (2014). Self-
assembly of random copolymers. Chem. Commun. 50, 13417–13432.
Liu, B., and Thayumanavan, S. (2017). Importance of Evaluating Dynamic Encapsulation
Stability of Amphiphilic Assemblies in Serum. Biomacromolecules 18, 4163–
4170.
Longmire, M., Choyke, P.L., and Kobayashi, H. (2008). Clearance properties of nano-
sized particles and molecules as imaging agents: considerations and caveats.
Nanomedicine 3, 703–717.
98
Lyon, R.P., Bovee, T.D., Doronina, S.O., Burke, P.J., Hunter, J.H., Neff-LaFord, H.D.,
Jonas, M., Anderson, M.E., Setter, J.R., and Senter, P.D. (2015). Reducing
hydrophobicity of homogeneous antibody-drug conjugates improves
pharmacokinetics and therapeutic index. Nature Biotechnology 33, 733–735.
Maeda, H. (2015). Toward a full understanding of the EPR effect in primary and
metastatic tumors as well as issues related to its heterogeneity. Advanced Drug
Delivery Reviews 91, 3–6.
Maeda, H., Bharate, G.Y., and Daruwalla, J. (2009). Polymeric drugs for efficient tumor-
targeted drug delivery based on EPR-effect. European Journal of Pharmaceutics
and Biopharmaceutics 71, 409–419.
Matsumura, Y., and Maeda, H.A. (1986). A new concept for macromolecular
therapeutics in cancer-chemotherapy - mechanism of tumoritropic acumulation of
proteins and the antitumor agent Smancs. Cancer Res 46, 6387–6392.
Moldenhauer, G. (2014). Selection Strategies for Monoclonal Antibodies. In Handbook
of Therapeutic Antibodies, S. Dübel, and J.M. Reichert, eds. (Weinheim,
Germany: Wiley-VCH Verlag GmbH & Co. KGaA), pp. 15–42.
Munkhbat, O., Canakci, M., Zheng, S., Hu, W., Osborne, B., Bogdanov, A.A., and
Thayumanavan, S. (2019). 19F MRI of Polymer Nanogels Aided by Improved
Segmental Mobility of Embedded Fluorine Moieties. Biomacromolecules 20,
790–800.
Owensiii, D., and Peppas, N. (2006). Opsonization, biodistribution, and pharmacokinetics
of polymeric nanoparticles. International Journal of Pharmaceutics 307, 93–102.
Papac, R.J. (2001). Origins of cancer therapy. Yale J Biol Med 74, 391–398.
Pastrana, E. (2013). Near-infrared probes. Nat Methods 10, 36–36.
Peipp, M., and Gramatzki, M. (2014). Calicheamicin Conjugates: Gemtuzumab
Ozogamicin (Mylotarg), Inotuzumab Ozogamicin. In Handbook of Therapeutic
Antibodies, S. Dübel, and J.M. Reichert, eds. (Weinheim, Germany: Wiley-VCH
Verlag GmbH & Co. KGaA), pp. 1545–1564.
99
Perez, E.A., Hillman, D.W., Fishkin, P.A., Krook, J.E., Tan, W.W., Kuriakose, P.A.,
Alberts, S.R., and Dakhil, S.R. (2005). Phase II trial of dolastatin-10 in patients
with advanced breast cancer. Investigational New Drugs 23, 257–261.
Perez, H.L., Cardarelli, P.M., Deshpande, S., Gangwar, S., Schroeder, G.M., Vite, G.D.,
and Borzilleri, R.M. (2014). Antibody–drug conjugates: current status and future
directions. Drug Discovery Today 19, 869–881.
Perry, M.C., Doll, D.C., and Freter, C.E. (2012). The chemotherapy source book.
(Philadelphia : Wolters Kluwer/Lippincott Williams & Wilkins, [2012]).
Raghupathi, K., Li, L., Ventura, J., Jennings, M., and Thayumanavan, S. (2014). pH
responsive soft nanoclusters with size and charge variation features. Polym.
Chem. 5, 1737–1742.
Roderick, J.E., Tesell, J., Shultz, L.D., Brehm, M.A., Greiner, D.L., Harris, M.H.,
Silverman, L.B., Sallan, S.E., Gutierrez, A., Look, A.T., et al. (2014). c-Myc
inhibition prevents leukemia initiation in mice and impairs the growth of relapsed
and induction failure pediatric T-ALL cells. Blood 123, 1040–1050.
Ryu, J.-H., Chacko, R.T., Jiwpanich, S., Bickerton, S., Babu, R.P., and Thayumanavan,
S. (2010a). Self-Cross-Linked Polymer Nanogels: A Versatile Nanoscopic Drug
Delivery Platform Supporting Info. Journal of the American Chemical Society 3,
2–10.
Ryu, J.H., Jiwpanich, S., Chacko, R., Bickerton, S., and Thayumanavan, S. (2010b).
Surface-functionalizable polymer nanogels with facile hydrophobic guest
encapsulation capabilities. Journal of the American Chemical Society 132, 8246–
8247.
Saldanha, J.W. (2014). Humanization Strategies. In Handbook of Therapeutic
Antibodies, S. Dübel, and J.M. Reichert, eds. (Weinheim, Germany: Wiley-VCH
Verlag GmbH & Co. KGaA), pp. 89–114.
Santos, E.B., Yeh, R., Lee, J., Nikhamin, Y., Punzalan, B., Punzalan, B., Perle, K.L.,
Larson, S.M., Sadelain, M., and Brentjens, R.J. (2009). Sensitive in vivo imaging
of T cells using a membrane-bound Gaussia princeps luciferase. Nature Medicine
15, 338–344.
Sawyers, C. (2004). Targeted cancer therapy. Nature 432, 294–297.

100
Scott, A.M., Wolchok, J.D., and Old, L.J. (2012). Antibody therapy of cancer. Nature
Reviews Cancer 12, 278–287.
Shen, B.-Q., Xu, K., Liu, L., Raab, H., Bhakta, S., Kenrick, M., Parsons-Reponte, K.L.,
Tien, J., Yu, S.-F., Mai, E., et al. (2012). Conjugation site modulates the in vivo
stability and therapeutic activity of antibody-drug conjugates. Nature
Biotechnology 30, 184–189.
Shi, J., Kantoff, P.W., Wooster, R., and Farokhzad, O.C. (2016). Cancer nanomedicine:
progress, challenges and opportunities. Nature Reviews Cancer 17, 20–37.
Singh, R., Lambert, J.M., and Chari, R.V.J. (2014). Antibody-Drug Conjugates: New
Frontier in Cancer Therapeutics. In Handbook of Therapeutic Antibodies, S.
Dübel, and J.M. Reichert, eds. (Weinheim, Germany: Wiley-VCH Verlag GmbH
& Co. KGaA), pp. 341–362.
Soo Choi, H., Liu, W., Misra, P., Tanaka, E., Zimmer, J.P., Itty Ipe, B., Bawendi, M.G.,
and Frangioni, J.V. (2007). Renal clearance of quantum dots. Nat Biotechnol 25,
1165–1170.
Szymczak-Workman, A.L., Vignali, K.M., and Vignali, D.A.A. (2012). Design and
construction of 2A peptide-linked multicistronic vectors. Cold Spring Harbor
Protocols 7, 199–204.
Tannous, B.A. (2009). Gaussia luciferase reporter assay for monitoring biological
processes in culture and in vivo. Nature Protocols 4, 582–591.
Tannous, B.A., Kim, D.-E., Fernandez, J.L., Weissleder, R., and Breakefield, X.O.
(2005). Codon-Optimized Gaussia Luciferase cDNA for Mammalian Gene
Expression in Culture and in Vivo. Molecular Therapy 11, 435–443.
Tatarek, J., Cullion, K., Ashworth, T., Gerstein, R., Aster, J.C., and Kelliher, M.A.
(2011). Notch1 inhibition targets the leukemia-initiating cells in a Tal1/Lmo2
mouse model of T-ALL. Blood 118, 1579–1590.
Topalian, S.L., Drake, C.G., and Pardoll, D.M. (2012). Targeting the PD-1/B7-H1(PD-
L1) pathway to activate anti-tumor immunity. Current Opinion in Immunology
24, 207–212.
101
Turner, J.M., Brodsky, M.H., Irving, B.A., Levin, S.D., FWlmutter, R.M., and Littman’t,
D.R. (1990). Interaction of the Unique N-Terminal Region of Tyrosine Kinase
p56’ck with Cytoplasm ic Domains of CD4 and CD8 Is Mediated by Cysteine
Motifs. Cell 60, 755–765.
Ventura, J., Eron, S.J., González-Toro, D.C., Raghupathi, K., Wang, F., Hardy, J.A., and
Thayumanavan, S. (2015). Reactive Self-Assembly of Polymers and Proteins to
Reversibly Silence a Killer Protein. Biomacromolecules 16, 3161–3171.
Verma, S., Miles, D., Gianni, L., Krop, I.E., Welslau, M., Baselga, J., Pegram, M., Oh,
D.-Y., Diéras, V., Guardino, E., et al. (2012). Trastuzumab Emtansine for HER2-
Positive Advanced Breast Cancer. New England Journal of Medicine 367, 1783–
1791.
Widdison, W.C., Wilhelm, S.D., Cavanagh, E.E., Whiteman, K.R., Leece, B.A., Kovtun,
Y., Goldmacher, V.S., Xie, H., Steeves, R.M., Lutz, R.J., et al. (2006).
Semisynthetic Maytansine Analogues for the Targeted Treatment of Cancer.
Journal of Medicinal Chemistry 49, 4392–4408.
Working, P.K., Newman, M.S., Huang, S.K., Mayhew, E., Vaage, J., and Lasic, D.D.
(1994). Pharmacokinetics, Biodistribution and Therapeutic Efficacy of
Doxorubicin Encapsulated in Stealth® Liposomes (Doxil®). Journal of Liposome
Research 4, 667–687.
Zein, N., Sinha, A.M., McGahren, W.J., and Ellestad, G.A. (1988). Calicheamicin
gamma 1I: an antitumor antibiotic that cleaves double-stranded DNA site
specifically. Science 240, 1198–1201.
Zhang, H., Wang, Y., Wu, Y., Jiang, X., Tao, Y., Yao, Y., Peng, Y., Chen, X., Fu, Y.,
Yu, L., et al. (2017). Therapeutic potential of an anti-HER2 single chain
antibody–DM1 conjugates for the treatment of HER2-positive cancer. Signal
Transduction and Targeted Therapy 2, 17015.
Zhang, J., Yang, P.L., and Gray, N.S. (2009). Targeting cancer with small molecule
kinase inhibitors. Nature Reviews Cancer 9, 28–39.