Embed Size (px)
Citation preview
A WATER RESOURCES TECHNICAL PUBLICATION
ENGINEERING MONOGRAPH
for Large
P /’ ---.
No. 7
0-w
Conduits
UNITED TES DEPARTMENT OF THE INTERIOR BUREAU OF RECLAMATION
A WATER RESOURCES TECHNICAL PUSLICATION
Engineering Monograph NO. 7
L Friction Factors for large Conduits
Flowing Full
Engineering and Research Center Denver, Colorada
United States Department of the Interior l
.
BUREAU OF RECLAMATION
r 1 As the Nation’s principal conservation agency, the Department of the Interior has responsibility for most of our nationally owned public lands and natural resources. This includes fostering the wisest use of our land and water resources, protecting our fish and wildlife, preserv- ing the environmental and cultural values of our national parks and historical places, and providing for the enjoyment of life through out- door recreation. The Department assesses our energy and mineral resources and works to assure that their development is in the best interests of all our people. The Department also has a major respon- sibility for American Indian reservation communities and for people who live in Island Territories under U.S. Administration. :.:
‘.
ENGINEERING MONOGRAPHS are published in limited editions for the technical staff of the Bureau of Reclamation and interested technical circles in government and private agencies. Their purpose is to record developments, in- novations, and progress in the engineering and scientific techniques and prac- tices that are employed in the planning, design, construction, and operation of Reclamation structures and equipment. Copies may be obt.ained from the Bu- reau of Reclamation, Denver Federal Cent&, Denver, Cola., and Washingbn, D.C.
First Printing: 1965 Revised Reprinting: 1977 Reprinted: 1986 Reprinted: 1992
.:
UNITED STATDS GOVERNMDNT PRISTING OFFICE
WASHINGTON : 1977
Bureau of Reclamation, Attention D-7923A, Denver Office, P.O. Box 25007, Denver Federal Center, Colorado, 80225
P F re ace r
THIS ENGINEERING MONOGRAPH, prepared in the Hydraulics Branch of the Bureau of Reclamation’s Division of Research in Denver, Colo., was fimt issued in 1951 under the authorship of J. N. Bradley and L. R. Thompson. Copies were prepared in limited editions by the OfFice of the Bureau’s Chief Engineer in Denver.
Subsequent to the first issuance of the mono- graph, new data from outside sources were obtained and included in a revised edition issued by the
Office of Chief Engineer in 1962. C. W. Thomas and R. B. Dexter obtained some of the new data through the cooperation of the Bureau’s Design and Construction Divisions. J. C. Schuster made the revisions under the supervision of A. J. Peterka and direction of H. M. Martin, Chief of the Hydraulics Branch.
Because of the continuing interest in the mono- graph, it is being printed in the present format for wider distribution.
iii
. .
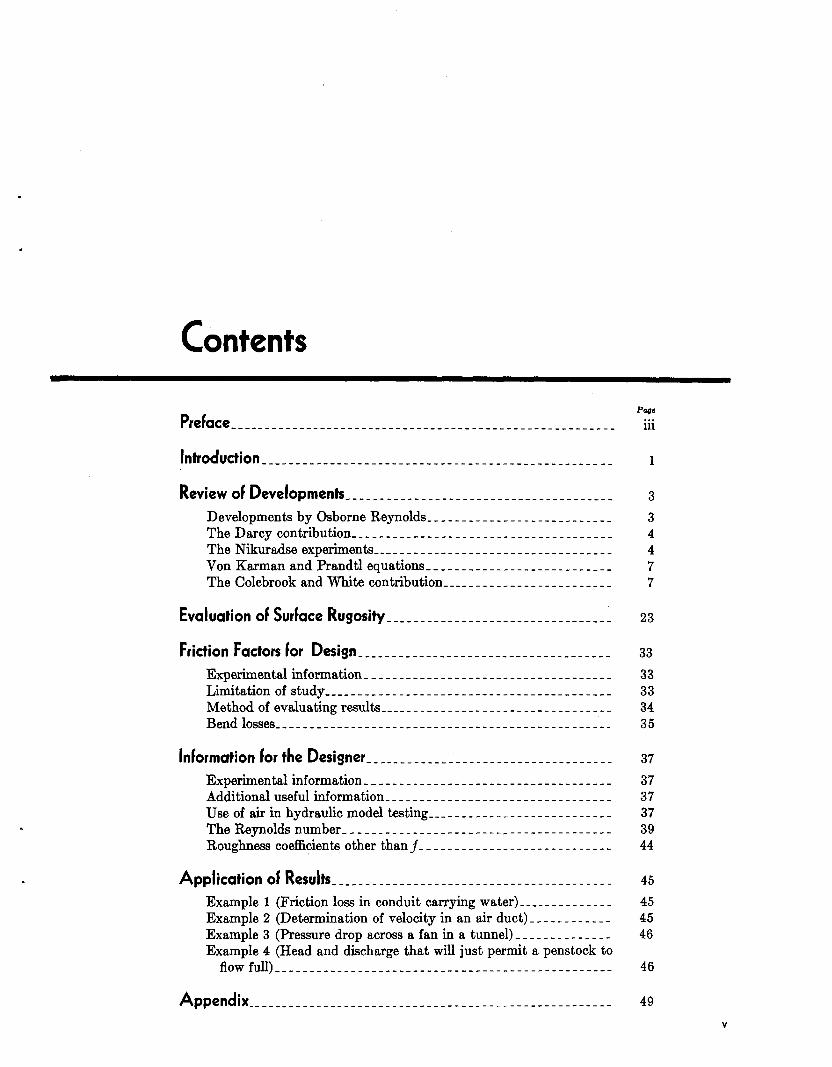
Contents
.
Introduction ________________ -___- ____________________________ __
Review of Developments- ___ __ ___ ___ __ __ _ _ ___ __ _ ____ __ __ _______ Developments by Osborne Reynolds- _ _ _ _ - _ _ - _ _ _ - - _ _ - _ _ _ _ _ _ _ _ _ _ The Darcy contribution-- _ ___ _ __ __ ____ __ __ _ _ __ _ _ __ _ __ _ __ _ - _ _ - The Nikuradse experiments ______________________ -___-- ______ - VonKarmanandPrandtlequations _________ --_--___--__-___-_ The Colebrook and White contribution ____ - _ _ _ _ _ _ _ _ _ _ _ _ _ _ _ _ _ _ _ -
Evaluation of Surface Rugosity ______ ______ __ __ _____ - __ __-__-__ -
Friction Factors for Design _____________________________________
Information for the Designer ____________________________________ Experimental information- - _ _ _ _ _ _ _ - _ _ _ _ - - - _ _ _ - _ _ _ _ _ _ _ _ _ _ _ _ _ _ _ Additionalusefulinformation ____ - ______ --__--__--- ____ - ______ Use of air in hydraulic model testing--- _ _ _ _ _ _ _ _ _ _ _ _ _ _ _ _ _ _ _ _ _ _ _ _ TheReynoldsnumber--------------- ________ - _______________ Roughness coefficients other than j- _ _ _ _ _ - - _ _ _ _ - _ _ _ _ _ _ _ _ _ _ _ _ _ _ _
Application of Results- __ _ _ _ _ _ _ _ _ _ _ _ _ _ _ _ _ _ _ _ _ _ _ _ _ _ _ _ - - - _ _ _ _ _ _ _ - Example 1 (Friction loss in conduit carrying water)-------------- Example 2 (Determination of velocity in an air duct) _-_ __ _ __ _ __ _ Example 3 (Pressure drop across a fan in a tunnel) _ _ _ _ _ _ _ _ _ _ _ _ _ _ Example 4 (Head and discharge that will just permit a penstock to
flowfull)___-____________________-_________--__L----------
Appendix________________________________---------------------
me . . . ill
1
23
33
33 33 34 35
37
37 37 37 39 44
45
45 45 46
46
49
V
vi CONTENTS
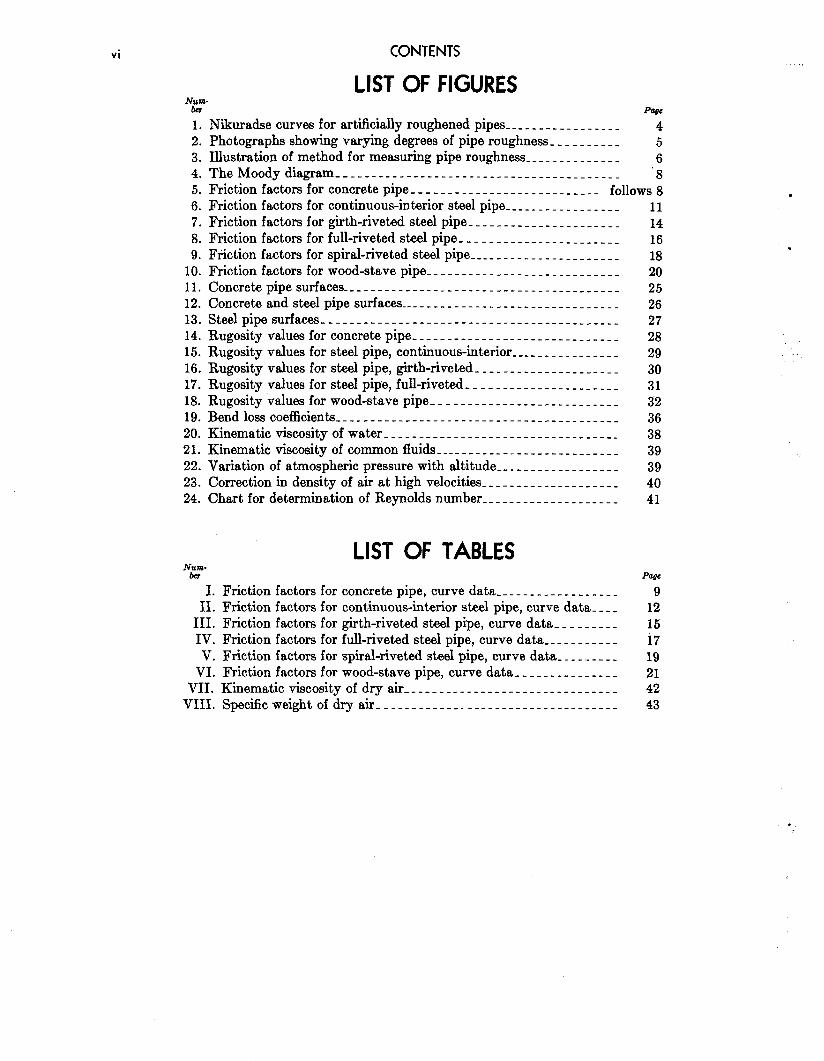
LIST OF FIGURES “r- PW
1. Nikuradse curves for artificially roughened pipes--- _ _ _ __ _ _ _ _ _ _ _ _ _ 4 2. Photographs showing varying degrees of pipe roughness- _ _ _ _ _ _ _ _ _ 5 3. Illustration of method for measuring pipe roughness- _ - _ _ _ _ _ _ _ _ _ _ 6 4. The Moody diagram _____________________________________ --__ ‘8 5. Friction factors for concrete pipe- _ _ _ _ _ _ _ _ _ _ _ _ _ _ _ _ _ _ _ - - _ _ _ _ - follows 8 6. Friction factors for continuous-interior steel pipe _____ _ __ _ _ _ _ _ _ _ _ _ 11 7. Friction factors for girth-riveted steel pipe- _ _ - _ __ _ _ __ _ _ _ _ _ ___ _ _ _ 14 8. Friction factors for full-riveted steel pipe- _ _ _ _ _ _ _ - _ _ _ _ _ _ _ _ _ _ _ _ _ _ 16 9. Friction factors for spiral-riveted steel pipe---- _ - _ _ _ _ _ _ _ _ _ _ _ _ _ __ _ 18
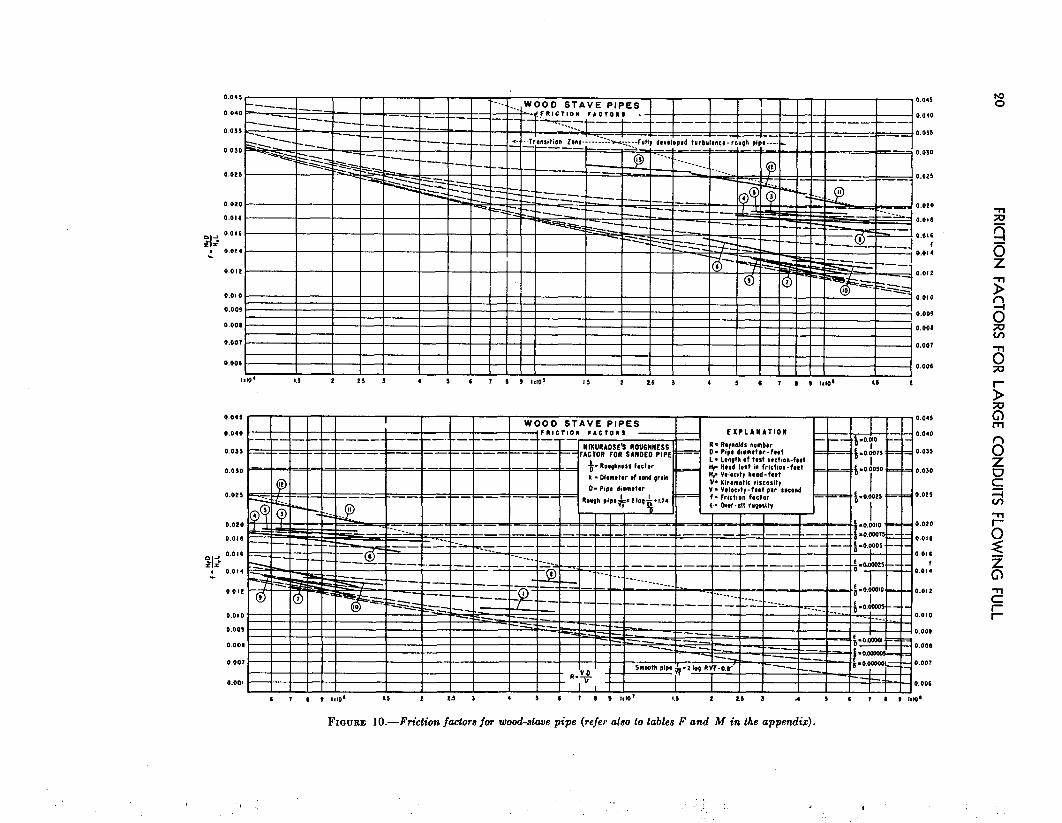
10. Friction factors for wood-stave pipe-- _ _ _ _ _ _ _ _ _ _ _ _ _ - _ _ - - _ _ _ _ _ _ _ _ 20 11. Concrete pipe surfaces- _ _ _ _ _ _ _ _ _ _ _ _ _ _ _ _ _ _ _ _ _ _ _ _ _ _ - _ _ - _ _ _ _ _ _ _ _ 25 12. Concrete and steel pipe surfaces--- _ _ _ _ _ _ _ _ _ _ _ _ _ _ _ _ _ _ _ _ _ - _ _ _ _ _ _ _ 26 13. Steel pipe surfaces- __________ ______________ __________________ 27 14. Rugosity values for concrete pipe- _ _ _ _ _ _ _ _ _ _ _ _ __ _ _ _ _ _ _ _ - _ _ _ _ _ _ _ 28 15. Rugosity values for steel pipe, continuous-interior ____ _ _ _ _ - _ _ _ _ _ _ _ 29 16. Rugosity values for steel pipe, girth-riveted- _ _ _ __ _ ___ __ _-_ _ __ - __ 30 17. Rugosity values for steel pipe, full-riveted- _ _ _ _ __ - - _ _ _ _ _ _ _ _ _ _ _ _ _ 31 18. Rugosity values for wood-stave pipe- _ _ _ _ ____ ____ _ _- _ _ _ __ _ _ _ _ _ _ 32 19. Bend loss coefficients-- _ _ _ _ _ _ _ - _ _ _ _ _ _ _ _ _ _ __ _ _ _ _ _ _ _ - _ _ - _ _ _ _ _ _ _ _ 36 20. Kinematic viscosity of water- _ _ _ _ _ _ _ _ _ _ _ _ _ _ _ _ _ _ _ _ _ _ _ - _ _ _ _ _ _ _ _ _ 38 21. Kinematic viscosity of common fluids- _ _ _ _ _ _ _ _ _ _ - _ _ _ _ _ _ _ _ _ _ _ _ _ _ _ 39 22. Variation of atmospheric pressure with altitude--- _ - - _ _ - _ _ _ _ _ _ _ _ _ 39 23. Correction in density of air at high velocities- _ - _ _ _ _ _ _ _ - _ _ _ _ _ _ _ _ _ 40 24. Chart for determination of Reynolds number-- _ _ _ _ _ _ - _ _ _ _ _ _ _ _ _ _ _ 41
LIST OF TABLES “it?- Pap
I. Friction factors for concrete pipe, curve data--- _ _ _ _ _- _ _ _ _ _ _ _ _ _ 9 II. Friction factors for continuous-interior steel pipe, curve data- _ _ _ 12
III. Friction factors for girth-riveted steel pipe, curve data- _ _ _ _ _ _ _ _ 15 IV. Friction factors for full-riveted steel pipe, curve data--- _ _ _ - _ _ - - i7 V. Friction factors for spiral-riveted steel pipe, curve data- - _ _ ._ _ _ _ _ 19
VI. Friction factors for wood-stave pipe, curve data- _ _ __ _ __ _ __ _ _ _ _ 21 VII. Kinematic viscosity of dry air- _ _ _ _ _ - _ _ _ _ _ _ _ _ _ _ _ _ _ _ _ _ _ _ _ _ _ _ _ _ 42
VIII. Specificweightof dry air----- _____ -_. __________ - __________ - 43
CONTENTS vii
A. B. C. D. E. F. G. H.
J J. K. I ii.
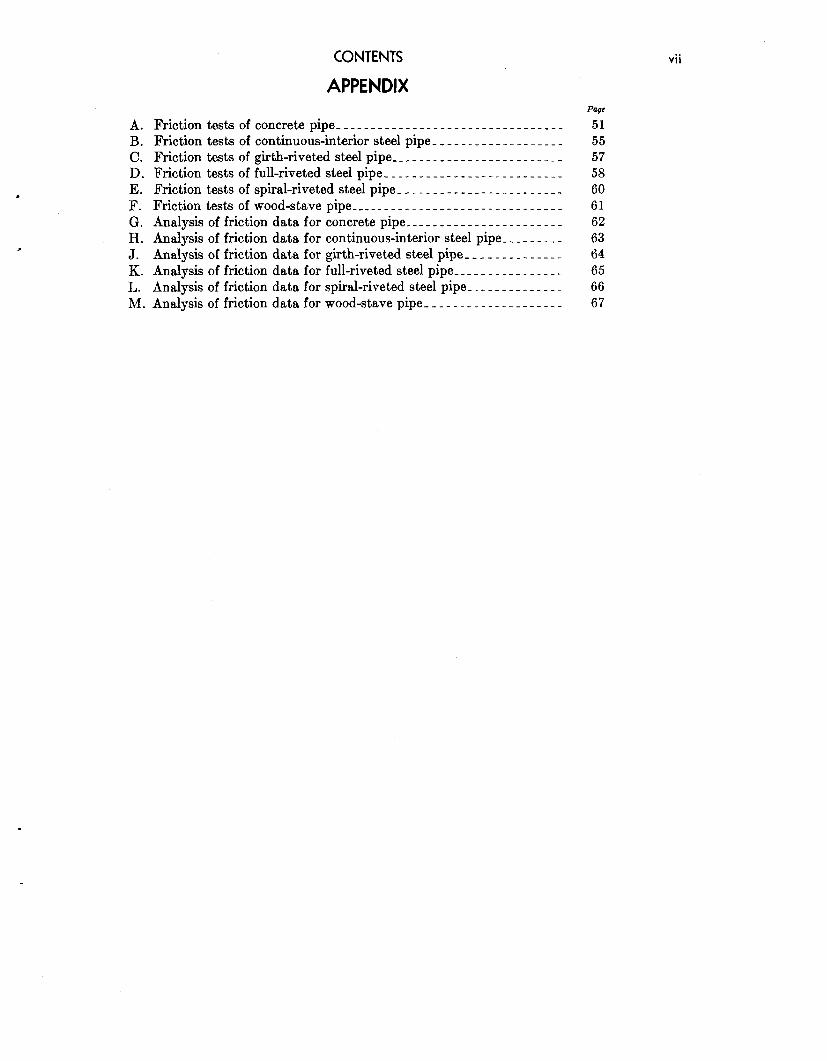
APPENDIX
Friction tests of concrete pipe---------- _______ -_- _____ -_-_-___ Friction tests of continuous-interior steel pipe__--___-_--__--___- Friction tests of girth-riveted steel pipeWmc _ _ _ _ _ _ _ _ - _ _ _ _ _ - _ - - - _ _ - Friction tests of full-riveted steel pipe- _ _ _ _ _ _ _ _ - _ _ _ _ - - _ _ _ _ _ _ _ _ _ _ E’riction tests of spiral-riveted steel pipe- _ _ _ _ _ _ - _ _ _ _ _ _ _ _ _ _ _ _ _ _ _ _ Friction tests of wood-stave pipe---- _ - _ _ - _ _ - - _ _ _ _ - _ _ _ - _ - _ _ _ - _ _ - Analysis of friction data for concrete pipe--- _ _ _ _ _ - - _ _ _ - - _ - _ _ - _ _ _ Analysis of friction data for continuous-interior steel pipe- _ _ _ - _ _ _ _ Analysis of friction data for girth-riveted steel pipe- _ _ _ _ _ _ _ _ _ _ _ _ _ Analysis of friction data for full-riveted steel pipe--------------..- Analysis of friction data for spiral-riveted steel pipe- _ _ _ - _ _ _ _ - _ _ - _ Analysis of friction data for wood-stave pipe- _ - _ _ _ _ _ _ _ _ _ _ - _ _ _ _ _ _
PW 51 55 57 58 60 61 62 63 64 65 66 67
Introduction
.
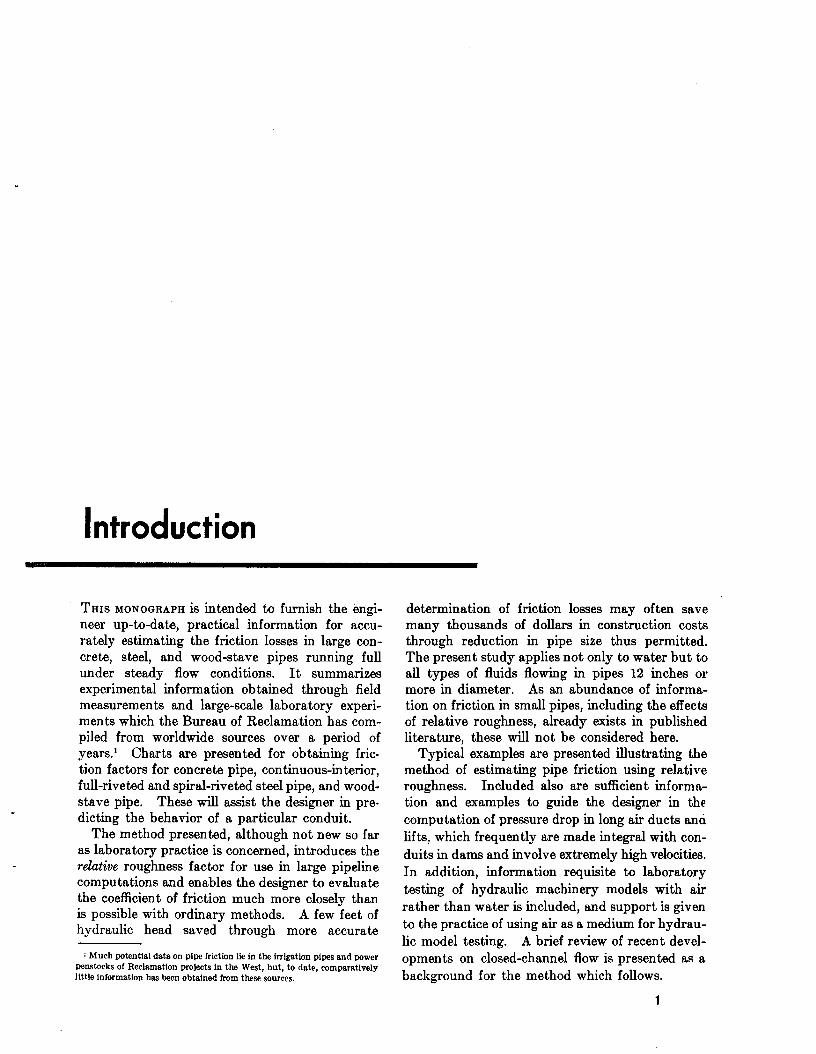
THIS MONOGRAPH is intended to furnish the engi- neer up-to-date, practical information for accu- rately estimating the friction losses in large con- crete, steel, and wood-stave pipes running full under steady flow conditions. It summarizes experimental information obtained through field measurements and large-scale laboratory experi- ments which the Bureau of Reclamation has com- piled from worldwide sources over a period of years.’ Charts are presented for obtaining fric- tion factors for concrete pipe, continuous-interior, full-riveted and spiral-riveted steel pipe, and wood- stave pipe. These will assist the designer in pre- dieting the behavior of a particular conduit.
r
The method presented, although not new so far as laboratory practice is concerned, introduces the relative roughness factor for use in large pipeline computations and enables the designer to evaluate the coefficient of friction much more closely than is possible with ordinary methods. A few feet of hydraulic head snved through more accurate
1 Much potential data on pipe friction lie in the irrigation pipes and power penstocks of Reclamation projects in the West, but, to date, comparatively little information has been ohtalned from these sources.
determination of friction losses may often save many thousands of dollars in construction costs through reduction in pipe size thus permitted. The present study applies not only to water but to all types of fluids flowing in pipes 12 inches or more in diameter. As an abundance of informa- tion on friction in small pipes, including the effects of relative roughness, already exists in published literature, these will not be considered here.
Typical examples are presented illustrating the method of estimating pipe friction using relative roughness. Included also are sufficient informa- tion and examples to guide the designer in the computation of pressure drop in long air ducts anti lifts, which frequently are made integral with con- duits in dams and involve extremely high velocities. In addition, information requisite to laboratory testing of hydraulic machinery models with air rather than water is included, and support is given to the practice of using air as a medium for hydrau- lic model testing. A brief review of recent devel- opments on closed-channel flow is presented as a background for the method which follows.
1

. .

Review of Developments
Developments by Osborne Reynolds
E NGINEERS
similitude means of
HAD long used the theory of in studying solid structures by
models, but it was not until the latter part of the 19th century that they began to extend the theory to flowing water as well. About this time, Osborne Reynolds,s in studying flow through pipes, derived the expression VDp/c( and called attention to its significance. Here, V is velocity of flow, D the diameter of the conduit, p the density of the fluid, and P the absolute co- efficient of viscosity (the kinematic viscosity Y is equal to P/P). The expression is dimensionless and is known as the Reynolds number, which will be referred to as R,. The Reynolds criterion led to a more rational basis for establishing dynamic similarity of fluid motion in closed conduits, as it made possible the correlation of the flow of gases and highly viscous liquids, such as oils and sirups, along with the more common fluid, water.
When laminar flow occurs in a smooth straight pipe, the resistance to that flow is produced by viscous shear of the particles of fluid moving in
2 Gibson, A. H., H~draulia and Its Applicaffons, fourth edition, p. 45, D. Van Nostrand, publisher.
parallel paths with different velocities. In addi- tion, particles moving along the pipe walls are subjected to viscous shear from other particles which adhere to the walls. The motion of each particle is translatory only and it is distinctive by the absence of eddies. Experiment indicates that with laminar flow the frictional resistance varies as the first power of the velocity, the second power of the pipe diameter, and directly as the length.
With turbulent flow, the velocity variation across the pipe is not a result of viscous shear alone but also depends on the degree and intensity of turbulence. The particles follow irregular paths which cross and recross one another, thus produc- ing large and small vortices and eddies which are formed, destroyed, then re-formed and destroyed, the process being repeated ad infinitum. Experi- ments show that frictional resistance for turbulent flow varies with approximately the second power of the velocity, the lirst power of the diameter, and directly as the length.
The Reynolds criterion or number serves to type these two modes of flow for which the charac- teristics are entirely different. Line A (see fig. 1)
3

4 FRICTION FACTORS FOR LARGE CONDUITS FLOWING FULL
obvious. The friction factor j
FIGURE l.-Variation of the resistance coejlcient with the Reynolds number for artij%ially roughened pipes (Niku- radee experimmk) .
represents laminar flow which, generally speaking, occurs when R, is less than 2,000. Turbulent flow. is evidenced by line C (for smooth pipes) and line D (for rough pipes) on the same figure. There is a rather extensive transition zone be- tween laminar and fully developed turbulent flow in which the resistance varies between the first and second power of both the velocity and the diameter. This accounts for the various ex- ponential formulas for pipe friction now in use. The importance of the contribution by Osborne Reynolds is borne out in the following pages.
The Darcy Contribution
In 1857, Darcy a proposed an empirical formula for frictional resistance in pipes which, as modified since by Weisbach and others, reads:
h,=jgg (1)
where h, is total friction loss, f is a coefficient denoting surface roughness, L is length of the conduit, D is diameter of the conduit, and V is velocity of flow.
Many empirical formulas for flow in pipes have been proposed by others, such as Bazin, Rehbock, Williams and Hazen, Weston, etc., some of which are still popular; but the Darcy expression appears to have best withstood the test of time. Upon inspection of expression (l), the reasons are quite
is dimensionless, and no fractional powers are involved. Also, upon subjecting expression (1) to dimensional analysis, Russell 4 shows that the friction factor can be expressed as
where C is a constant of proportionality, R, is the Reynolds number, and the exponent n is merely a number. Since p and or appear in the Reynolds number and also in the friction factorf, the Darcy expression holds for the flow of any liquid or gas. Moreover, nothing in the deriva- tion stipulates the type of flow, so the formula applies equally well for both laminar and turbulent flow. The value C contains a measure of the relative roughness of the conduit and a constant which is dependent on the system of units em- ployed. The friction factor j is thus a function of the Reynolds number and the relative roughness k/D, where k represents the average nonuniform roughness of the conduit and D is the diameter.
The Nikuradse Experiments
In 1932 and 1933 Nikuradse,6 6 working under the direction of Drs. Prandtl and von Karman, published the results of his now famous experi- ments on artificially roughened pipe. Rather small, smooth pipes of different diameters were coated with uniform sand grains and subjected to a wide range of velocities. The resistance to flow represented by the friction factorf was plotted with respect to the Reynolds number for various values of the relative roughness r,,/k, where T, represents the radius of the pipe and k the absolute uniform roughness or diameter of sand grains. (See fig. 1.)
Nikuradse used the criterion rJk in an attempt to type roughness. For example, for a given velocity and diameter, a rough pipe will produce more turbulence and consequently offer a greater resistance to the flow per unit length for a par- ticular fluid than a smooth one. On the other hand, should the velocity, the surface roughness, and the fluid remain the same but the diameter of the two pipes be different, the resistance offered
4 Russell, 0. E., Hydraulics, fifth edition, p. 181, Henry Holt, puhllshers. 1 Nikuradse, J., “Geatnnassigkeiten der turbulenten Stromung In Glattin
Rohren,” Forachung8heJf, 1932, p. 356. 6 Nikwadsc, J., ‘~$tromungsgesctze in rauhen Rohren.” ForrchuwrheJ~.
No. 361.1833. p. 13.
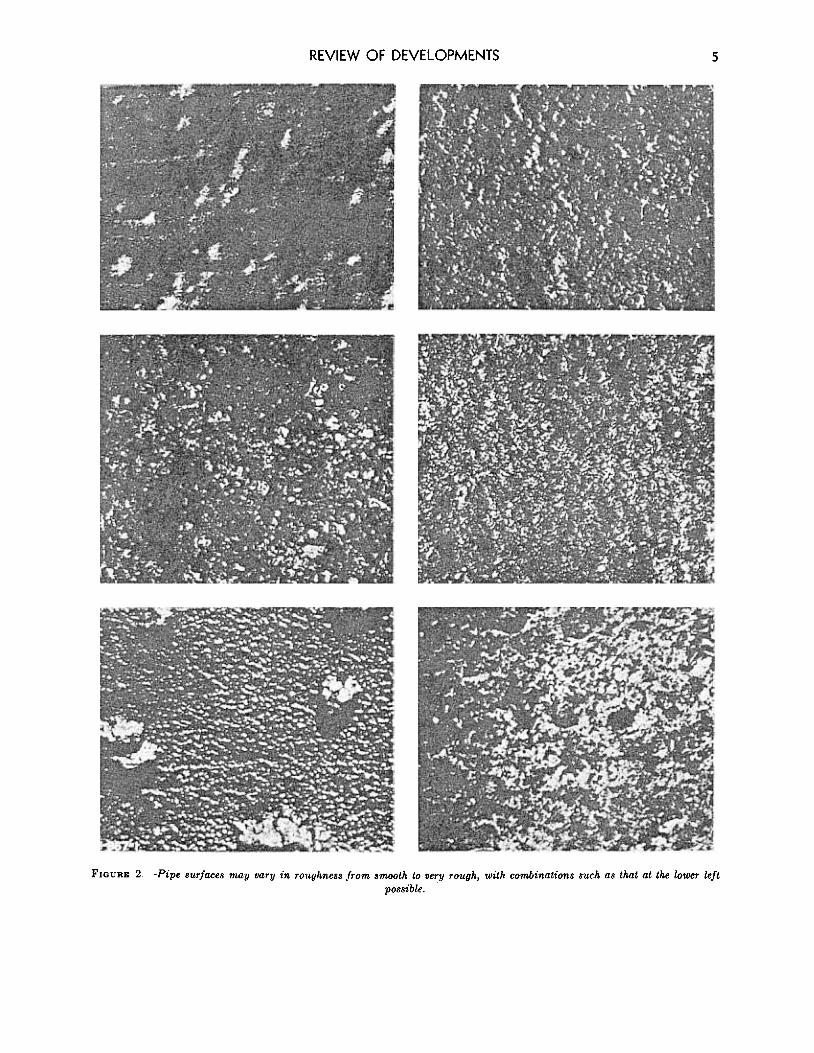
REVIEW OF DEVELOPMENTS 5
FIGURE 2 -Pipe surfaces may vary in roughness from smooth to very rough, with combinations such as that at the lower left
possible.
6 FRICTION FACTORS FOR LARGE CONDUITS FLOWING FULL
Jr ~.c~1 )))''.'.:.
~~
'~..-.:. -::
( ,~
f. .:.@0:.(
q ~ ~,.
IQ~
)~ , .S
~ b- ~ (jl .~
..~"'- ~ .-~ ..~ ..i9: '-"'W~ ..
'-. ~~~
,~~\?
=:;;r t# 000
~\\~-u..'--~ .
~1'..!1--
a.~""1..~.
..;-
..n 00. :~ ~.
--.", Q.~: ~CSJ
~..
%00 ..~
..~ /
'~~,
,
i.: ((
,\\-~
k,/"".. --
~
..~ 0..
Q'.(I
.,
-~i.
--.~
(I..
~
l~..,i
~~
~~. ..
~~"
"
(j.,
~,
~
~&
\
" i..J
titj ..
~~s: -
..
8
A
)1 1'\ "'"-;
~
~..
~(
., ~<;i'
~~'
~,.,?V;,I--.,JfJ/B
<.'J,, ~..
~f1J \~ ..-'I
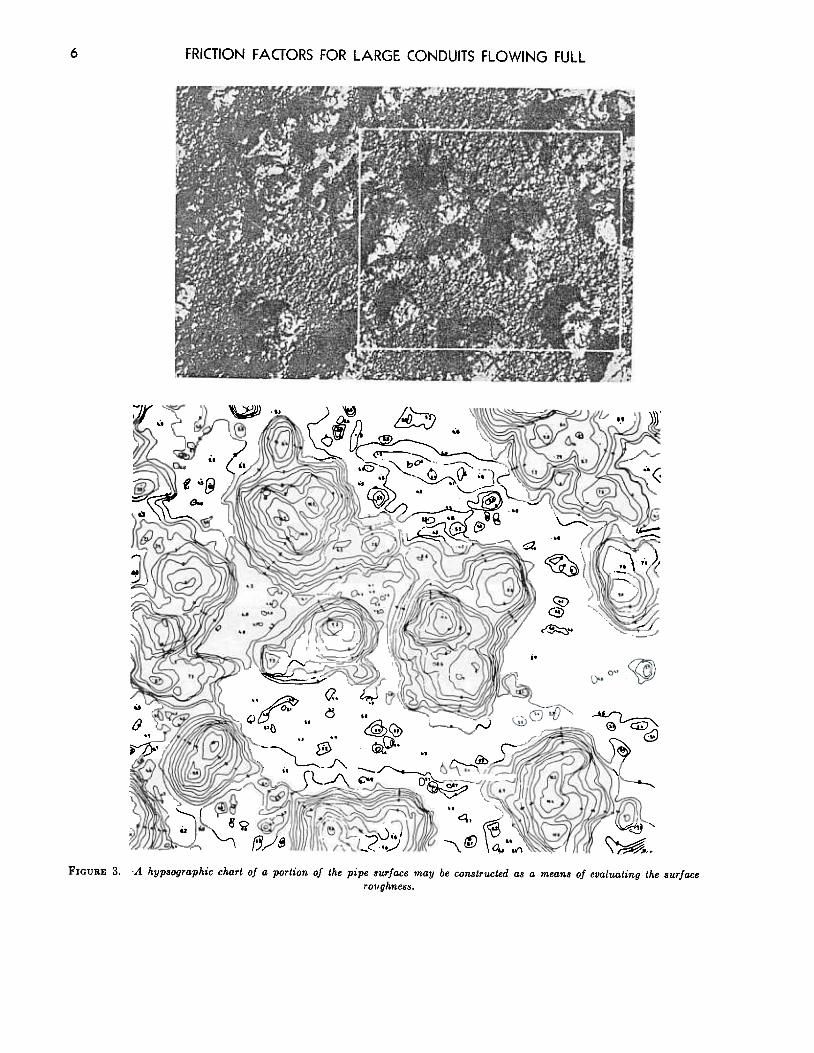
FIGURE 3. .A hypsographic chart of a portion of the pipe surface may be constructed as a means of evaluating the surface
roughness.
~..
!
~:;\\~
REVIEW OF DEVELOPMENTS 7
to the flow would decrease with an increase in pipe diameter. The criterion ro/k thus offers a means of grouping pipes having similar absolute uniform roughness for partially and fully developed turbulent flow. The straight line A on figure 1 represents laminar flow where f=64/R, for values of R, less than 2,000. Line C represents the results obtained for turbulent flow in smooth brass pipe. The lines denoted as D are for turbulent flow in pipes coated with uniform sand grains. The size of pipe and diameter of sand grain coating were varied in the experiments, and the results are plotted in terms of the relative roughness To/k.
Von Karman and Prandtl Equations
Concurrently with the Nikuradse experiments, von Karman and Prandtl developed a theoretical analysis for pipe flow with suitable formulas for smooth and rough pipe. Smooth pipes are de- fined as those having small irregularities when compared with the thickness of the boundary layer. Rough pipes are significant in that the irregularities of the walls are sufficient to break up the laminar boundary layer, with the result that completely turbulent flow is developed. The von Karman-Prandtl resistance equation for turbulent flow in smooth pipe is
-r-=2 log, R,&O.8 8
which would correspond to line C in figure 1. This constitutes merely one of a number of ex- pressions developed for smooth pipe flow. Other well-known investigators are Blasius,’ Ombeek, and Schiller and Herman. The results from all of these sources are in good agreement.
The von Karman-Prandtl equation for turbu- lent flow in rough pipes is
1=21og,,3+1.74. ti
Investigators von Mises, Lebeau, Hanocq, and others also developed formulas for rough pipe flow, although the agreement is not as satisfactory as for the former case.
The curves of Nikuradse consistently show a sharp drop followed by a reverse curve in the
7 Blasiw. II., “Das Aehnllchkeitsgesetz bei Reibungsvorgrmgen in Flussig- k&en,” Fmchung Ing Wu, no. 131.1913.
transition zone, B, between smooth and rough pipe flow. (See fig. 1.) The theoretical analysis of von Karman and Prandtl, based on the Nikuradse experiments with artificially roughened pipe, was not satisfactory over the entirety of the curves but showed disagreement in the transition zone with similar diagrams prepared by Piggott and others for commercial pipes8 This disagree- ment went unexplained until 1939, when Cole- brook and White developed a practical form of transit,ion to bridge the gap.B
The Colebrook and White Contribution
Colebrook and White showed that the deviation of experimental results stemmed from the fact that resistance to flow for uniform sand roughness is different from that for equivalent nonuniform roughness such as exists in commercial pipes. This was demonstrated by experimenting with nonuniform sand grains in artificially roughened pipes. It was found that the coarsest irregulari- ties of the nonuniform boundary disturbed the laminar sublayer considerably before the smaller irregularities became effective. A semiempirical formula proposed by Colebrook and White follows the trend of experimental results and is asymptotic to both the smooth pipe and rough pipe equations of Prandtl and von Karma,. This formula is
L-2 log,, ;= 1.74-2 logI, 47
As the above expression is rather complex for practical use, Rouse lo has plotted a chart utilizing this information. The factor f appears in both main coordinates, while values of R, are repre- sented by curved coordinates.
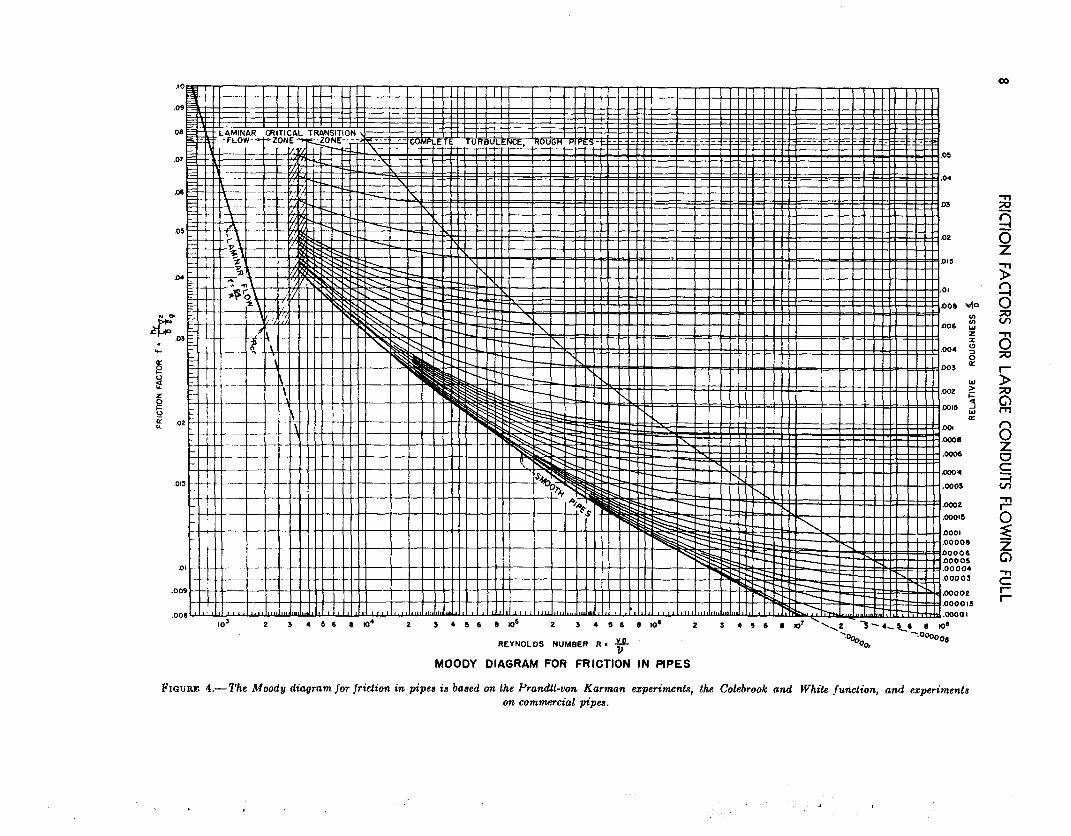
Moody” later constructed a chart of rectangular coordinates based on the Prandtl-von Karman experiments, the Colebrook and White function, and experiments on commercial pipes, which is included as figure 4. As the Moody chart is preferable from a practical standpoint, it has been superimposed on all of the experimental f versus R curves for large pipes. (See figs. 5 through 10 and tables I through VI.)
8 Piggott, R. J. S., “The Flow of Fluids in Closed Conduits,” A&.chanicoZ
Esginccrinq, August 1933. 9 Colebrook, C. F., and White. C. M.. Institute of Civil Engineers, Vol.
II, February to April 1939, p. 133. 10 Rouse, Hunter, Elemm(ary Mcchanicd oj Fluids, p. 211, John Wiley.
11 Moody, L. F., “Friction Factors for Pipe Flow,” !lYansodions. ASME,
November 1944.
IO’ 2 3 2 3 4 se 8 ws 2 3 4 56 8 10’ 2 3 4 3 6 8 W’ ‘1-2 - -3-4-5 6 I we -. REYNOLDS NUMBER R. =
‘i$oo, - - -,oGoo3
V MOODY DIAGRAM FOR FRICTION IN PIPES
FMDJRE 4.-The Moody diagram jar friction in pipes is based on lhe Prandtl-von Karman experiments, the Colebrook and While junction, and etperimnls on commercial pipes.

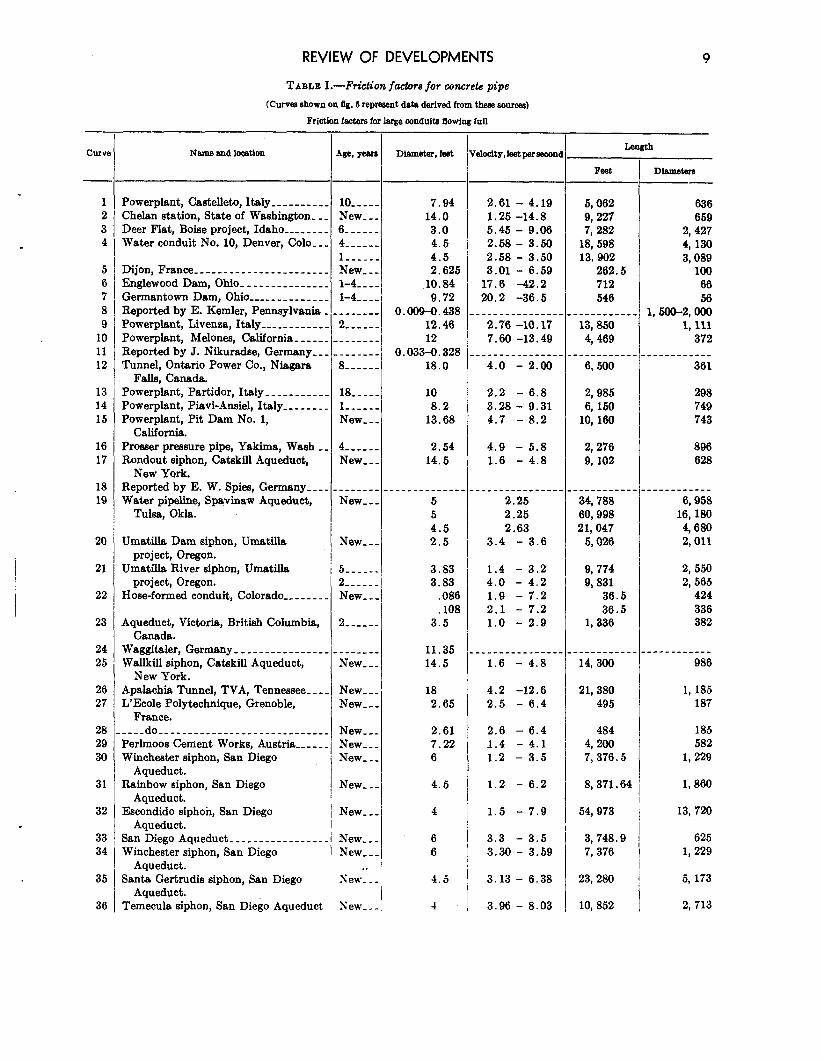
REVIEW OF DEVELOPMENTS 9
TABLE I .-Friction factors for concrete pipe
(Curves shown on Ag. 5 represent data derived from these sources)
Friction factors for large conduits flowing full
Curve Name and location
1 Powerplant, Castelleto, Italy _________ 2 Chelan station, State of Washington- _ 3 Deer Flat, Boise project, Idaho _______ 4 Water conduit No. 10, Denver, Cola--
5 6 7 8 9
10 11 12
Dijon, France ______________________ Englewood Dam, Ohio- _ ___ ________ _ Germantown Dam, Ohio _____________ Reported by E. Kemler, Pennsylvania Powerplant, Livenza, Italy--- _ _ _ _ _ _ _ _ Powerplant, Melones, California- _ _ __ Reported by J. Nikuradse, Germany-- Tunnel, Ontario Power Co., Niagara
Falls, Canada. 13 14 15
Powerplant, Partidor, Italy- _ ___ ___ __ Powerplant, Piavi-Ansiel, Italy-- _ _ _ _ _ Powerplant, Pit Dam No. 1,
California. 16 17
Prosser pressure pipe, Yakima, Wash _ Rondout siphon, Catskill Aqueduct,
New York. 18 19
Reported by E. W. Spies, Germany--- Water pipeline, Spavinaw Aqueduct,
Tulsa, Okla.
20
21
22
Umatilla Dam siphon, Umatilla project, Oregon.
Umatilla River siphon, Umatilla project, Oregon.
Hose-formed conduit, Colorado _____ _ _
23
24 25
Aqueduct, Victoria, British Columbia, Canada.
Waggitaler, Germany _ _ _ _ _ _ _ _ _ _ _ _ _ _ _ Wallkill siphon, Catskill Aqueduct,
New York. 26 27
Apalachia Tunnel, TVA, Tennessee- _ _ L’Ecole Polytechnique, Grenoble,
France. 28 29 30
----do__--_____--____----___-_-___ Perlmoos CeMent Works, Austria-- _ _ _ Winchester siphon, San Diego
Aqueduct. 31
32
33 34
35
36
Rainbow siphon, San Diego Aqueduct.
Escondido siphoh, San Diego Aqueduct.
San Diego Aqueduct ________________ Winchester siphon, San Diego
Aqueduct. Santa Gertrudia siphon, San Diego
Aqueduct. Temecula siphon, San Diego Aqueduct
-
--
-
- -
-- --
--
--
-/
lo----- 7.94 New--- 14.0 6s-m-e- 3.0 4------ 4.5 l------ 4.5 New--- 2.625 l-4---- l-4----’
10.84 9.72
------- O.OOQ-0.438 2 ------ 12.46 .------- 12 .------- 0.033-0.328 8-----s 18.0
18--s-- 10 l------ 8.2 New--- 13.68
4------ 2.54 New--- 14.5
New---
New---
5 5 4.5 2.5
___--____--__-. ----------. 2.25 34,788 2.25 60,998 2.63 21,047
3.4 - 3.6 5,026
______-_-__ 6,958
16, 180 4,680 2,011
5------ 2------j New---l
2------
3.83 1.4 - 3.2 9,774 2,550 3.83 4.0 - 4.2 9,831 2,565
.086 1.9 - 7.2 36.5 424
.108 2.1 - 7.2 36.5 336 3.5 1.0 - 2.9 1,336 382
_-_____ New---
New---’ New---
11.35 14.5
18 2.65
___--_____-_-_. 1.6 - 4.8
4.2 -12.6 2.5 - 6.4
-------- --_ ------e-v-- 14,300 986
21,380 1, 185 495 187
New--- 2.61 2.6 - 6.4 484 185 New--- 7.22 1.4 - 4.1 4, 200 582 New--- 6 1.2 - 3.5 7,376.5 1,229
New---
New---
hTew--- New, _ _
.* Sew-.-
I Sew--.
4.5 1.2 - 6.2 8,371.64 1,860
4 1.5 - 7.9 54,973 13, 720
6 3.3 - 3.5 3,748.Q 625 6 3.30 - 3.59 7,376 1,229
4.5 3.13 - 6.38 23,280 5, 173
4 3.96 - 8.03 10,852 2,713
-
v
--
-
I- ‘eholty, feet per 8wcni Length
Feet
2.61 - 4.19 5,062 1.25 -14.8 9,227 5.45 - 9.06 7,282 2.58 - 3.50 18,598 2.58 - 3.50 13.902 3.01 - 6.59 262.5
17.6 -42.2 712 20.2 -36.5 546
---------_----_ ---_____-_. 2.76 -10.17 13,850 7.60 -13.49 4,469
--------------. - ----- - ---. 4.0 - 2.00 6,500
2.2 - 6.8 2,985 3.28 - 9.31 6,150 4.7 - 8.2 10,160
4.9 - 5.8 2,276 1.6 - 4.8 9,102
-
--
. -
. -
DiWlWtW9 --
636 659
2,427 4, 130 3,089
100 66 56
1, 500-2,000 1,111
372 -------e--e
361
298 749 743
896 628

10 FRICTION FACTORS FOR LARGE CONDUITS FLOWING FULL
cum
37 38
39
40
41 42
43 44 45 46
47 48 49 50 51 52
53 54 55
56 57
58 59 60
-
B
--
-.
-,
1
-.
-.
-.
1 -.
1
I
i
-- --
f -
TABLE I.-Friction factors jot @oncrete pipe-Continued
(Curve-s ahown on f&. 6 rcprewnt data derived from these sources)
FrlctIon factors for large conduits flowing full
Name and Jo&Jon
-
--
-
*
--
DIam8t8r, fee4
-
1
--
-6th -- Feat
-
--
Rainbow siphon, San Diego Aqueduct- San Luis Rey siphon, San Diego
Aqueduct.
New- _ 4.5 1.86 - 6.37 8,371 1,860 New- _ 4 2.35 - 8.09 18,549 4,627
Escondido siphon, San Diego New-- 4 2.35 - 8.10 54,973 13,743 Aqueduct.
Poway Valley siphon, San Diego New_-. 4 2.35 - 8.08 11,297 2,824 Aqueduct.
Ekluttia Tunnel, Alaska _____________ 5-----. 9.04 .686- 9.271 22,805 2,523 Never&k Tunnel, New York Water 2-----. 8 6.450-15.373 1,360 170
Board. ----do,___---_--_-_---------------. 3-----. 8 6.129-15.198 1,360 170 --,-do----------------------------. 2-----. 10 4.133- 9.839 24,850 2,485 ----do----_---,-------------------, 3-----. 10 3.923- 9.927 24,850 2,485 East Delaware Tunnel, New York New- _ . 11.33 2.516-10.562 102,224 11,585
Water Board. Weber-Coulee siphon _____ -_ _ ________. [nverted siphon, San Diego Aqueduct-. .---do_---_--------------------,--. .---do_---------------------------. .---do_-_-_-___--__---_--__---_--_. Winchester siphon, San Diego
3-----. 14.67 3.943- 7.37 5,641 385 New--. 4 2.344- 8.238 4,476 1,119 New--- 5 1.502- 5.229 6,293 1,259 New--. 5 1.501- 5.278 8, 003 1,601 New--. 5 1.502- 5.278 30,754 6,151 EL----. 6 3.140- 3.350 7,376 1,229
Aqueduct. [nverted siphon, San Diego Aqueduct-. .-__do_--__-__----_---------------- Bersimis No. 1 Development, North
B------ 5------ New---
5.698- 5.868 18,510 4,113 5.698- 5.868 15,767 3, 504 6.3 -14.42 39,201 1,265
Quebec.
.
I
1
-
I’unnel No. 1, Niagara Water Supply- _ experimental pipe, St. Anthony Falls
Hydraulic Laboratory. .---do_-_-_------------------------ .-_-do_---_------------------------ Salt Lake Aqueduct, Utah ____ _______ _
New--- New---
4.5 4.5
31
45 3
3
z.75
8.39 -15.12 .453-21.181
245 ----------
New--- New--- 15-----
.413- 7.856 1.048- 8.778
7. 12
11,044 _---------_
__-________ ---___--___ 103,000
--
-- --
-
,---------- ,----_--me-
17,900 -
-
: :,.
:.
JOINT TYPE I o.ow S”t+ - -- - 8.11 and mgot-.- -- - --( 0.011
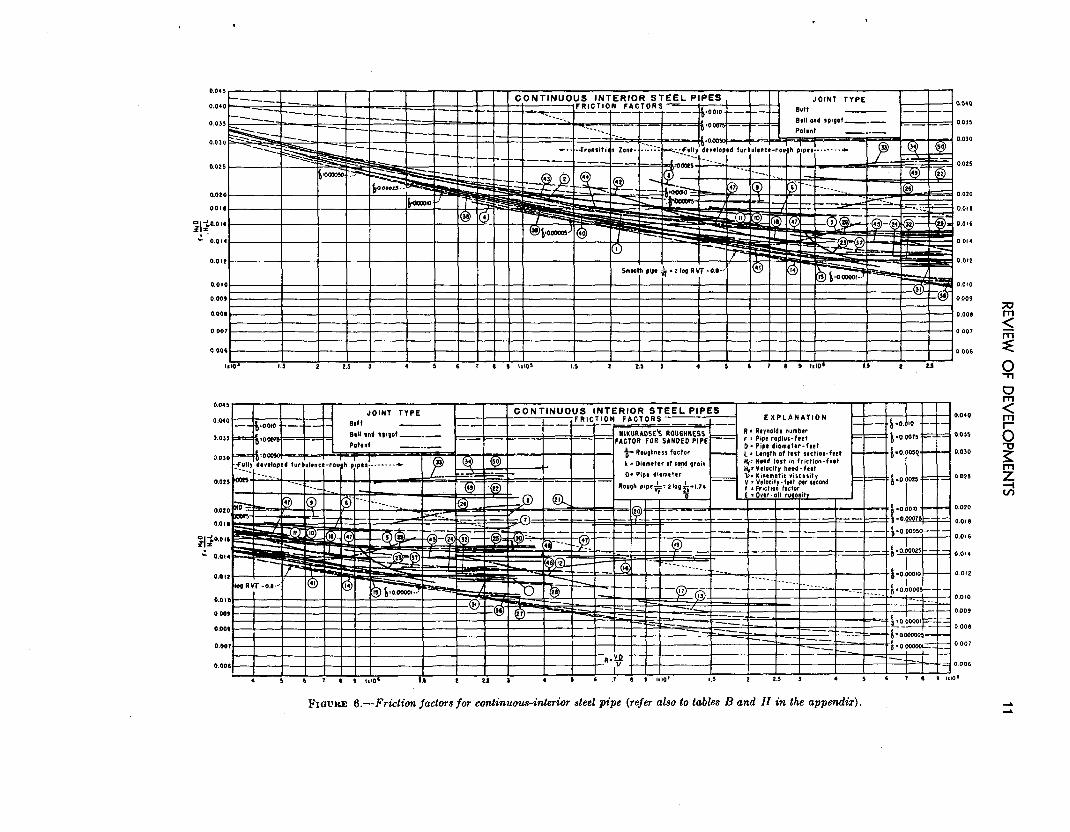
FIQURE &-Friction factors for continuous-interior steel pipe (refer also to tables B and H in the appendix).
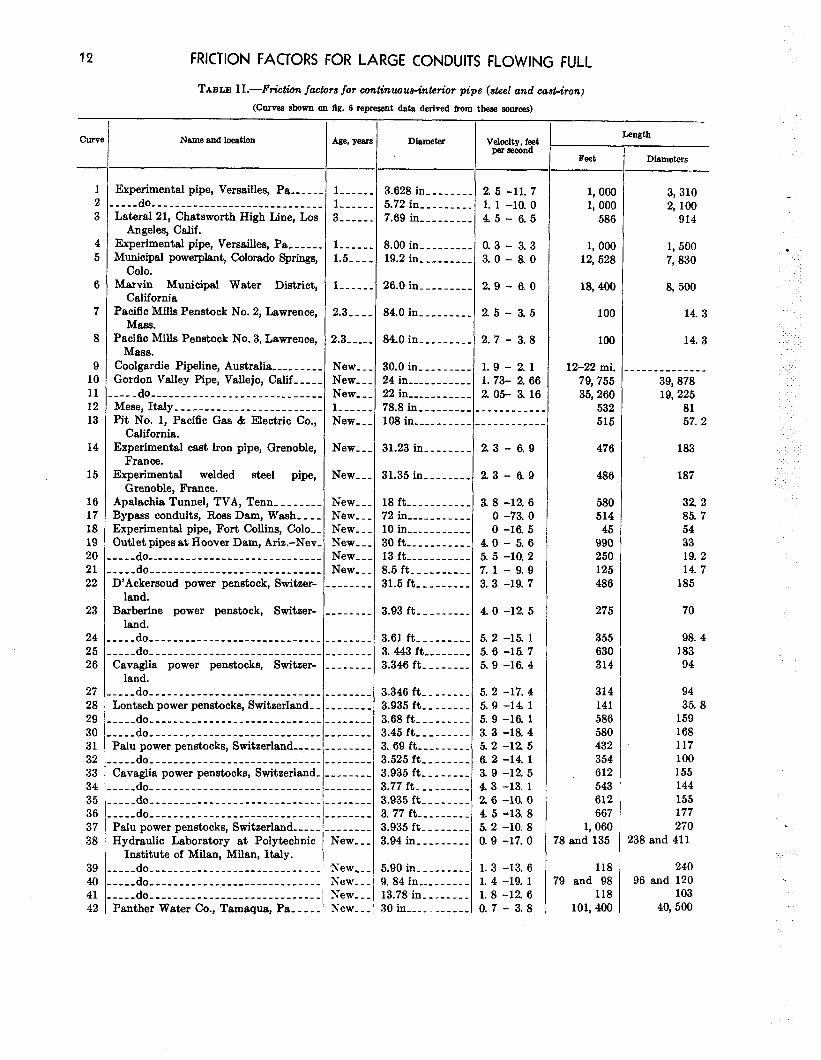
12 FRICTION FACTORS FOR LARGE CONDUITS FLOWING FULL
TABLE X-Friction factors for continuous-interior pipe (steel and castiron)
(CWV~S shown on fig. 6 represent data derived from these sourc&
Name and location
-
--
Age, year
--
1 2 3
Experimental pipe, Versailles, P4 ______ .----do-- ----------___--____________ Lateral 21, Chatsworth High Line, Los
Angeles, Calif. 4 5
Experimental pipe, Versailles, Pa- __ ___ l-----. Municipal powerplant, Colorado Springs, 1.5---.
Cola. 6 Marvin Municipal Water District, l-----.
California 7 Pacific Mills Penstock No. 2, Lawrence, 2.3-m-.
Mass. 8 Pacific Mills Penstock No. 3, Lawrence, 2.3s-_-.
Mass. 9
10 11 12 13
Coolgardie Pipeline, Australia ___- _____ Gordon Valley Pipe, Vallejo, Calif _____ v-v_ do--- ____--__________-_________ Mese, Italy- _______ ____________ _____ Pit No. 1, Pacific Gas & Electric Co.,
New--. New- _ New--. l-----. New--.
California. 14 Experimental cast iron pipe, Grenoble, New--.
15 France.
Experimental welded steel pipe, Grenoble, France.
New--.
16 Apalachia Tunnel, TVA, Term- _ _ _____ New--. 17 Bypass conduits, Ross Dam, Wash- _ _ _ New--. 18 Experimental pipe, Fort Collins, Cola-- New- _ _ 19 Outlet pipes at Hoover Dam, A&.-Nev- New--. 20 ----do------------------------------ New- _ _ 21 ----do-------,--------------------- New- _ _ 22 D’Ackersoud power penstock, Switzer- ------_
23 _----__
24 25 26
------- _ - - - - - _ ------_
27 28 29 30 31 32 33 34 35 36 37 38
land. Barberine power penstock, Switzer-
land. ----do----------------------------- ----do----------------------------- Cavaglia power penstocks, Switzer-
land. ----do----------------------------- Lontsch power penstocks, Switzerland- _ ----do----------------------------- ----do----------------------------- Palu power penstocks, Switzerland--- _ _ ----do----------------------------- Cavaglia power penstocks, Switzerland- ----do----------------------------- ----do----------------------------- ----do----------------------------- Palu power penstocks, Switzerland--- _ _ Hydraulic Laboratory at Polytechnic
Institute of Milan, Milan, Italy. ----do----------------------------- ----do------------------------L----- ----do----------------------------- Panther Water co., Tamaqua, Pa----.
m----e_ w----w_ _----__ ------_ - - - - - - _ ------- ------- _---___ _-----_ ------- ------- New---
!-
-,
39 40 41 42
New,-- XeW---
New--- ‘New---
Dfameter
-
--
Length
Feet Diameters
3.628 in- _ __ _ __, 5.72 in ________, 7.69 in ________.
2. 5 -11. 7 1. 1 -10. 0 45 - 6. 5
0. 3 - 3. 3 3. 0 - 8. 0
1, 000 1, ooa
586
-
--
I
I
,
3,310 2,100
914
8.00 in ________. 19.2 in ________.
1, 000 12,528
1,500 . 7,830
26.0 in ____ - ___. 2, 9 - 6. 0 18,400 8, 500
84.0 in _________ 2 5 - 3.5 100 14.3
84.0 in _________ 2. 7 - 3. 8 100 14. 3
30.0 in _____ -___ 24in ___________ 22in----_-----. 78.8 in _________ 108 in __________
1. 9 - 2. 1 12-22 mi. 1.73- 2. 66 79,755 2. 05- 3. 16 35,260 _--_______ 532 ----______ 515
------------- 39,878 .,.
19,225 81 57. 2
31.23 in ________ 2. 3 - 6. 9 476 183
31.35 in ________ 2. 3 - 6. 9 486 187 :.
18ft ___________ 72 in _____ _ ___ __ 10 in----------- 3oft -____--____ 13ft -____---___ 8.5 ft __________ 31.5 ft ___----__
3. 8 -12. 6 580 32. 2 0 -73. 0 514 85. 7 0 -16. 5 45 54
4.0 - 5.6 990 33 5. 5 -10. 2 250 19. 2 7. 1 - 9. 9 125 14. 7 3. 3 -19. 7 486 185
3.93 ft ___-_____ 4 0 -12.5 275 70
3.61 ft _________ 3. 443 ft -------- 3.346 ft ________
5. 2 -15. 1 355 98. 4 5. 6 -15. 7 630 183 5. 9 -16. 4 314 94
3.346 ft ________ 3.935 ftl- _ - ----_ 3.68 ft _________ 3.45 ft- __---- -- 3.69ft _________ 3.525 ft- _ _ _ _ _ _ _ 3.935 ft- -- - ---- 3.77 ft __------_ 3.935 ftl-- _-____ 3.77 ft -------- - 3.935 ft -------- 3.94 in _________
5. 2 -17. 4 5.9 -14. 1 5. 9 -16. 1 3. 3 -18. 4 5.2 -12 5 6. 2 -14. 1 3. 9 -12. 5 4 3 -13. 1 2. 6 -10. 0 4. 5 -13. 8 5. 2 -10. 8 0. 9 -17. 0
314 141 586 580 432 354 612 543 612 667
1,060 ‘8 and 135 i
94 35. 8
159 168 117 100 155 144 155 177 270
138 and 411 :
5.90 in _________ 3. 84 in _________ 13.78 in ________ 30in _____ L _____
1. 3 -13. 6 1. 4 -19. 1 1. 8 -12. 6 0. 7 - 3. 8
i 118 240
‘9 and 98 96 and 120 118 103
101,400 40,500
. .

REVIEW OF DEVELOPMENTS
TABLE II.-Friction /actors for continwrus-intenbr pipe (steel and cast-iron)-Continued Khrves shown on fig. 6 represent dab derived from these sources)
Curve Name and location Diameter Velocity, feet
per second Length
-- -- Feat Diameters
43 Laboratory test pipe-- _____________ __ New--- 6 and 8 in ______ ___-________ ____________ __________ ____ 44 ____~do____________----------------- New--- 8in--..-_----_______-------__-______-_________________ 45 i Portillon, France- _ _______ ___ ____ __-_ New---/ 46 1 Portillon, Lac Bleu, France- ____. __ 2------l 1
2.785 ft- _ _____ _ 5 -25 1, 550 556
47 / Teillet-Argenty, France _______________ ---I 34 _____ 2.785ft ________ 1 12 -29 1,550 556 6.56 it _________ 1 -12
48 ‘---_-do----------------------------- 34-v--- 1,325 202
9.84ft--------- 2 -11 1,405 143 49 -----do------.---------------------- 34----m 8.20ft-------_- 0.5-5 1,356 165 50 -----do----------------------------- 34----s 8.2Oft--------- 2 -7 1,320 161
0.045 I I I I IllI I I GIRTI RIVETED STEEL PIPFS 1 I I I I I I I o.“‘5
--- -- - -- - I I I I I
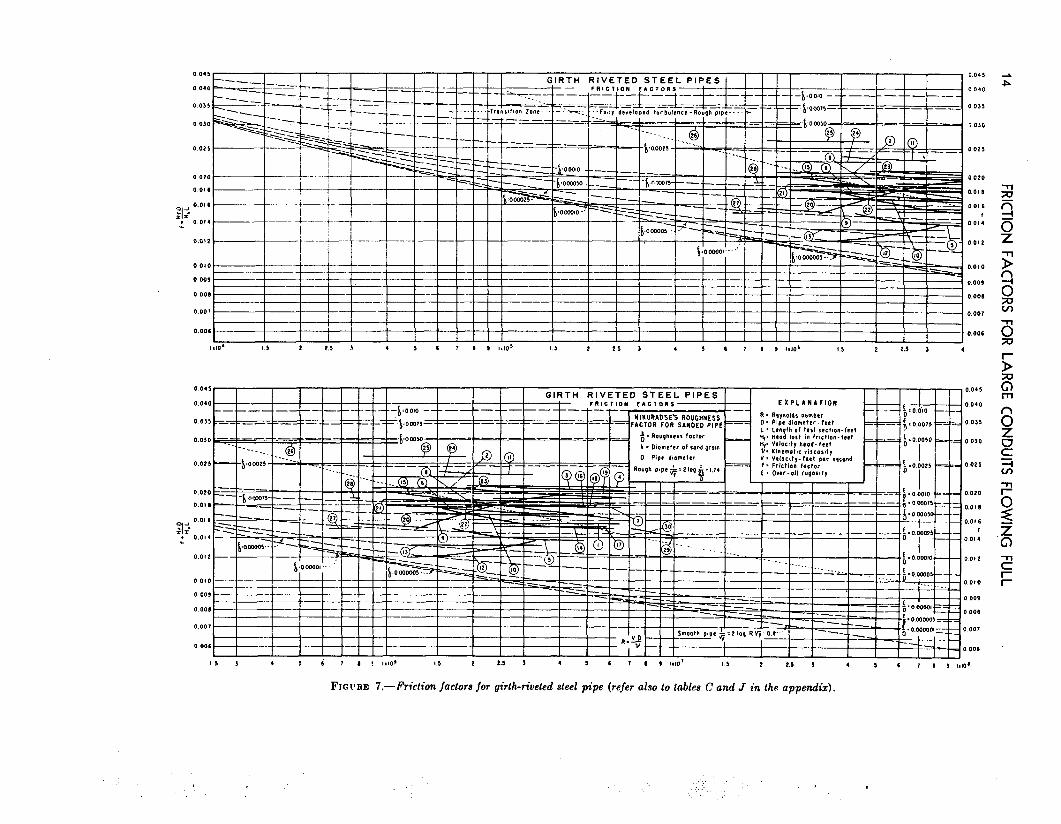
FIGVRE 7.-Friction faclors for @h-riveted steel pipe (refer also to fables C and J in the appendiz).

REVIEW OF DEVELOPMENTS 15
TABLE III.-Fsiction factors for girth-riveted steel pipe
(Curves shown on Bg. 7 represent data derived from these sources)
CUrVl Name and location Age, year
-
8
--
Diameter, feet Length
1 2 3
.4 5 6 7 8 9
10 11 12 13 14 15 16 17 18 19 20 21 22 23 24 25 26
Cogolo, Italy _____ _ _ _ _ __ _ _ _ _ _ _ _ __ _ _ _ _ __ _ __ _ Temu,Italy----_-_--_---_________________.
-----do------------------_--__________-- -_---dO----___---_-_----------------------
Di Ponte, Italy ______ _______ _______________ -----do---------------------____________-- -----do------_----______________________-- -----do-----------------------------------
Barbellino, Italy ____ _-_ _ _ _ _ _ _ _ __ _ _ _ _ _ _ _ _ _ _ _ -----do-------------------______________-- -_---do---------..-----------______________
Barberine, Switzerland- _ __ __ _ ___ __ _ _ __ _ ___ _ -----do--------------_---------------------
Rempen, Switzerland _____ _ _ __ _ __ __ __ _ _ _ _ _ _ _ -----do----------------------------------- Lava1 De Cere, France- _ _ _ _ _ _ _ __ ___ _ _ _ _ _ _ _ _
-----do----------------------------------- -----do,------------------____________-- .----do----------------------------------- Esterre, France ____ _ _ _ _ _ _ _ _ _ _ _ _ _ _ _ _ _ _ _ _ _ _ _ _ Luz-St-San Veur, France- _ _ _ __ _ __ _ _ _ _ _ _ _ _ _ _
.----do----------------------------------- Lamativie, France- _ __ _ _ _ _ _ _ _ _ _ _ _ _ _ _ _ _ _ _ _ _ _
.----do------------------------_____-_-_--
.----do-------------------------_ - _ - _ _ _ _ _ Rattlesnake Siphon Spring-Brook Water Sup-
ply, Wilkes-Barre, Pa.
3----- -----_ ------ --____ l----- l----- l----- l----- 3 de____ 2----- 2-----
6. 2-15. 3 4. 7-19.8 4. 7-15. 1 5. 7-18 6 3.3- a4 2 P 9.7 2 7-11. 2 3. 3-13. 6 2.5- 88 2. 7- 9. 5 7.6-14; 9
--____ ------ ----:----- ----_- ------ 15,--- 15---- 15---- 15---- 15---- 19---- 19---- 19---- 19---- 19---- 4-----
3. 215 2. 953 3. 609 3.281 4. 921 4. 593 4. 265 3. 871 4. 265 4. 101 1. 804 3. 61 3. 44 7. 22 6. 92 5. 74 5. 74 5. 74 5. 74 4.27 5. 26 4.59 5. 08 5. 08 5. 08 3
--------__ -__-_-____
7-14 7-14 7-14 7-14 3-6 3-6 4-8 3-6 3-6 3-5
1. 2- 4. 6
507. 57 157. 87 395. 18 133. 82 508 88 141.00 395.33 120. 49 812. 01 165. 00 464.23 101.07 847. 91 198.80 503. 89 130. 17 363. 73 85. 28 413.08 100.72 413. 08 228.98 354 98. 1 650 189 469 65 322 46. 5 764 133 797 139 833 145 870 151 813 190 772 147 850 185
1,148 226 1,148 226 1,148 226 1,273 425
27 Montreal Water Q Power Co ______ _ _ _ _ _ _ _ __ _ I-----. 3 3. o- 3.7 36,000 12,000 28 Springfield, Mass- __ ___ _ _ _ _ _ _ __ _ __ _ __ _ _ _ __ _ 17----. 3. 5 4. 1 39,053 11, 160 29 Penstock No. 1, Calif ______________________ New- _. 8 lb-20 240 30 30 .----do----------------------------_-___-- New--. 9 11-16 515 57
-
0.007 I I
0.00‘ I I
m 1.5 5 5.5 5 I 5 6 I5 5 1.10’ 1.5 * ‘*.I 3 4 5 ‘75 , lid 1.5 *
’ I I III I -- - 0.007 -
I NwyD 1 Smooth pipa+=5I*qR~-o.t~ r-4-J -0.00000, 0.007
0.00‘ I I Y I I I I I I I l- -- I I I I I
0.00‘
‘ I 5 , 1.M 1.5 * 5.5 5 4 5 6 I , , l.10’ 1.5 * 5.5 5 4 5 ‘7, 5 Id
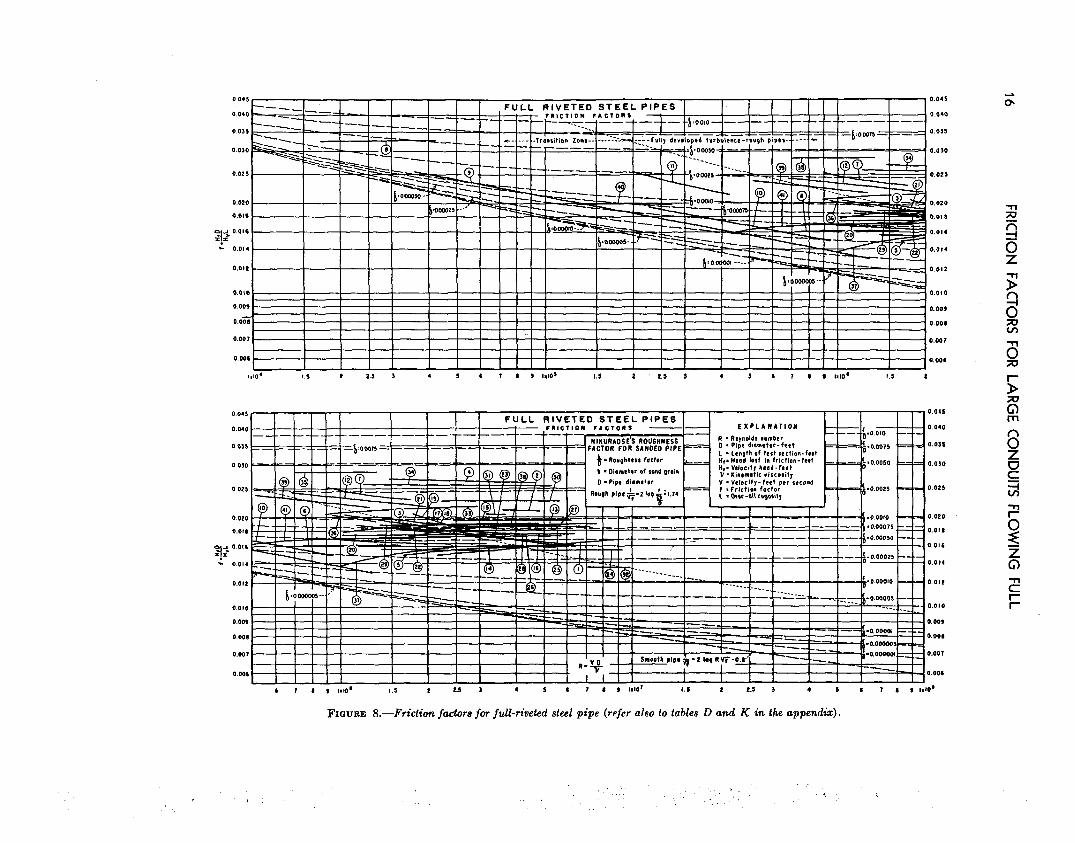
FIGURE 8.-Friction factors for full-riveted steel pipe (refer also to tables ll and K in the appendix).
..‘.. .I,
.; 1 . ..’
ClUVC Name and location
1
2 3 4 5 6 7 8 9
10 11
Farneta, Italy _____ ________________ ____ ____ __ -do- _ _________________________________ cogolo, Italy___---------------_----____------- Temu, Italy____---_____---_---------___--_ Barbellino, Italy ____ r___ ____ _ _-_ __ ___ _ __ ___ ____do-----___---__-_-------__---_-___--------- _---do----------------L-------------__------ Okanogan project, Washington ______________
l------ ------- 3------
-------
--____-------------_--------------------- Rochester, N.Y., conduit No. 2 from overflow
_------ 2------ New--- New--- 2.0----
5. 58 4. 26 3. 97 3. 12 4. 27 2. 62 2. 13
.323
.642 935
3: 167
5. 2 -16. 3 433.91 77.76 10.4 -13.9 644.72 151.34
2. 4 -10. 0 407. 17 102. 56 4.2 -17.8 508.60 163.01 2. 5 - 8. 8 570.89 133.69 3. 6 - 7. 1 570.89 217. 89 5. 4 -10. 7 363. 173 170. 50 0.6 - 1.3 494.5 1,530. 9 0. 6 -19. 7 365.3 568. 5 1. 3 -10. 5 365.5 390.90 0.6 - 1.3 46,339 14,632
No. 1 to Mount Hope Reservoir. 12 East Jersey Water Co., New Jersey-- ___ _ -_ _ _ New--- 3. 5 2. 1 - 5. 0 81, 139. 0 23,182. 5 13 Pacific Gas & Electric Co. penstock, Calif- _ _ _ New--- 6 2. 3 -11. 7 319.9 53. 32 14 -_--do-------_------_--------__----___-------- New--- 6 2. 3 -11. 7 583.4 97.23 15 Penstock, Pacifto Gas & Electric Co., Wii New--- 7 3. 4 - 8. 3 744.7 106.38
powerhouse, California. 16 -___do-__--_________-------_-------------- New--- 7 3. 4 - 8. 3 768.0 109. 71 17 ----do----------------------------------- New--- 7 3. 4 - 8. 3 1,070. 6 152. 85 18 Combined reaches of 15,16, and 17 __________ New- _ 7 3. 4 - 8. 3 2,683.3 383.32 19 Oak Grove No. 3 penstock, Portland Electric 0.8-0-e 9. 0 1. 99- 6. 97 33,920 3,769
Power Co., Portland, Greg. 20 21 22 23 24 25 26 27 28 29 30 31 32 33 34 35 36
Barberine, Switserland- _ _ ___ _ _ -:--- _ __ __ ___ Vernayas, Switzerland ______ ________ _ __ __ ___ -___do________---_-__--------------------- ----do----------------------------------- Champ S Drac, France-- __ __ _ _ _ _ ____ _ _ __ __ _ Ventavon,France------_------------------- ---_do_______________--------------------- --_-do------__--------------------------- -_--do----____------_--------------------- ----do----------------------------------- Bancairon, France-- ___ _______ ___ _ _ __ _ _ _ ___ Deadman siphon, Los Angeles, Calif- _ _ ______ Pit No. 1 penstock, California _______________ Holyoke, Mass __________ _ ____ _ __ _ __ _ __ __- _ Wise penstock, Pacific Gas & Electric Co---- _ Munroe penstock No. 2, Lawrence, Mass _____ Penstock, drum powerhouse, Pacific Gas dr
3. 94 4. 94 4. 78 4.64 9. 19 7. 55 7. 55 7. 55 7. 55 7. 55 5. 74
11. 00 10.75 8. 61 7. 00 6. 45 6. 00
------ ------. ------- ----- -- -----. -___--_ _____-- l------ 33----- 33----- 33----- 33----- 33----- 14----- 7------ New--- 5------ 2------ 22----- New---
_ _ - - - - - - - - - _ 2.0 -14.0 2. 5 -10. 0 2. 5 -10. 0 2. 5 -10. 0 2. 5 -10. 0 2. 5 -10. 0 7. 0 -17. 0 3. 2 - 3. 5 8. 0 -11. 0 0. 5 - 5. 4 2. 0 - 8. 0 1. 2 - 3. 3 2. 1 - 3. 0
275 69. 8 142 28. 7 600 125.5 197 42. 5
8,140 885 1,305 173 1,295 172 1,283 170 1,246 165 1,234 164
952 166 3,324 302
231 21 153 18
3,696 528 150 23 424 71
Electric Co., California. 37 Penstock, Halsey powerhouse, California _ _ _ _ _ New--- 6. 00 2. 3 -11. 7 584 97 38 ----do----------------------------------- New--- 6. 00 2. 3 -11. 7 320 533 39 Kearney Ext., New Jersey-- ______________-_ New--- 3. 50 2. 0 - 5. 0 81, 139 23,200 40 Conduit No. 2, Rochester, N.Y _____ _ _ _ __ _ _ __ 3------ 3.165 0.6 - 1.2 46,399 15,450 41 Pump lift, Lindsay-Strathmore, Caiif _____ - _ - - 2------ 3. 00 1.6 - 6.1 896 299
REVIEW OF DEVELOPMENTS
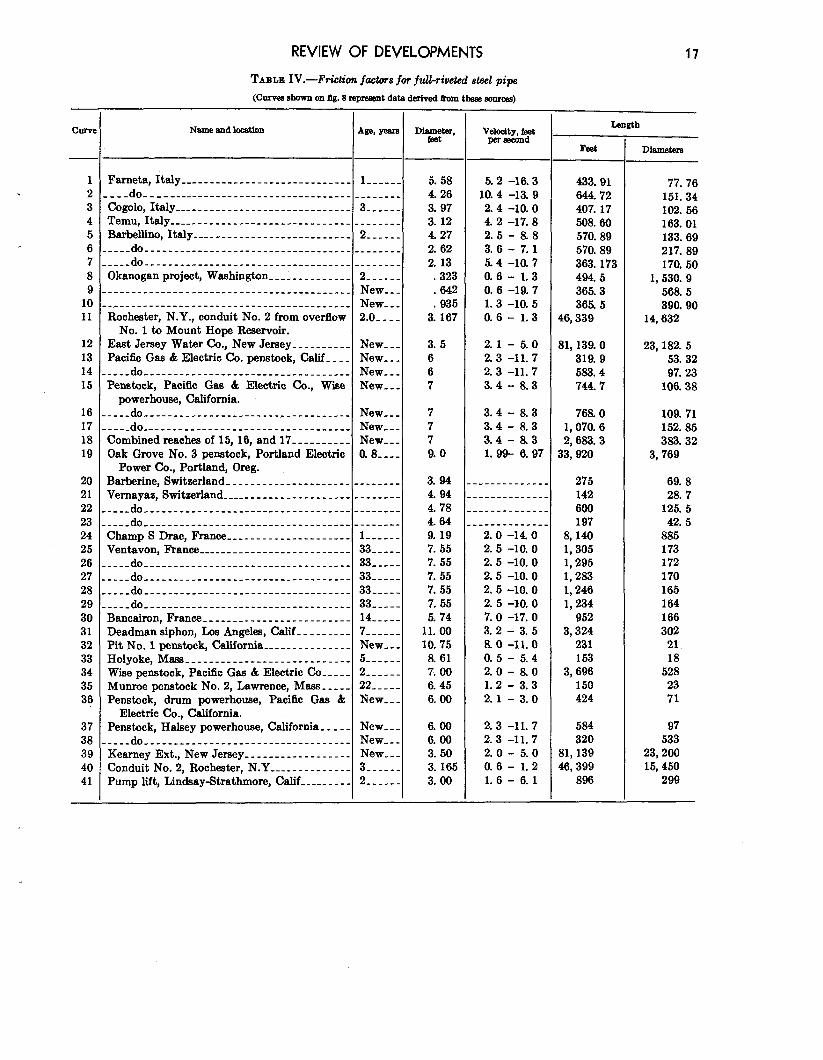
TABLE IV.-Fsictioa factors for full-riveted steel pipe
(Curvea shown on f@. 8 represent data derived from these mnrcm)
17
0.010
0.00,
o.oar
0.001
0.00
IIS ‘ t I
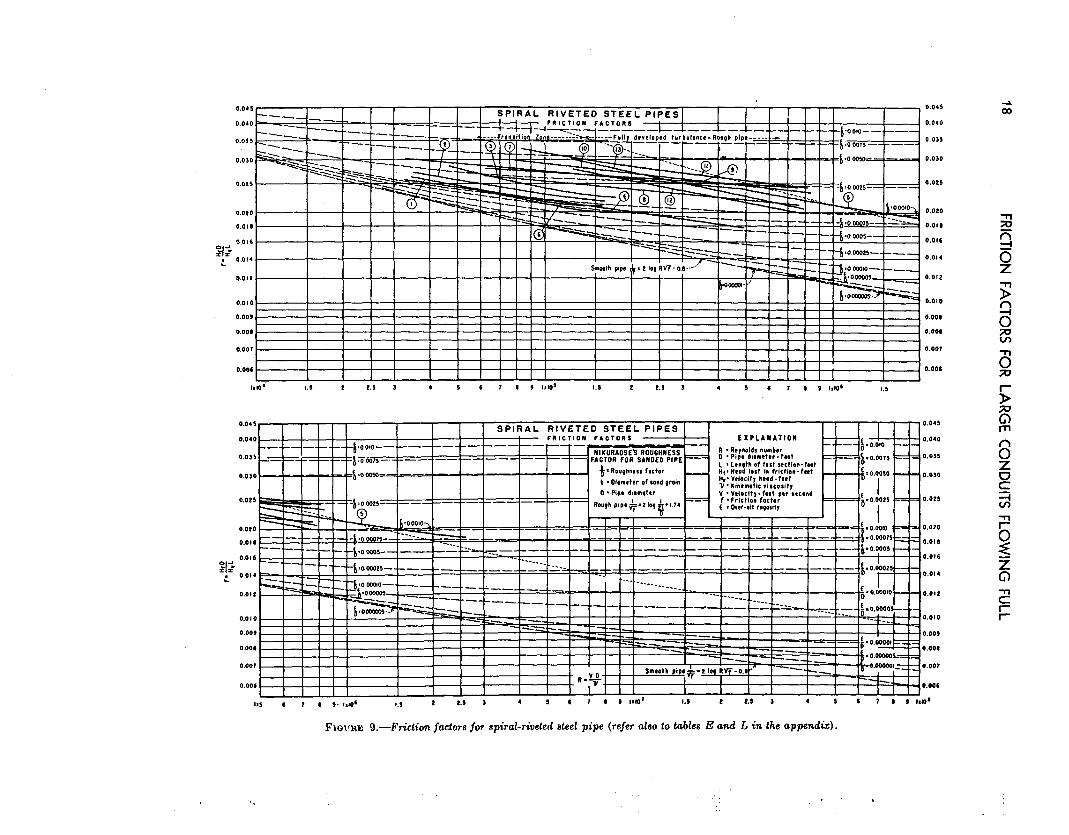
FIGVRE O.-Friction factors for spiral-heted steel pipe (refer also to tables E and L in the append&).
: :.
, ‘
REVIEW OF DEVELOPMENTS 19
ClUV0 Name and location Lge+ years Diameter,feal
7 8 9
10 11 12 13
Experimental pipe, Cornell University _____ __ _______ -___do--_--__--_------------------------------~ ____do-______-_____-_--------_------------------- Experimentalpipe------------------------------- -___do-________-___-_-_----------_---------------- Experimental pipe, Purdue Engineering Experiment
Station. ----do----------------------------------------- -___do--__--_--_-____--------------------------- ----do-------------_--------------------------- -___do--__-----__--_--------------------------~ .-_--do----------------------------------------- .-___do---_-----__--_---------------------------- ____do---_--_--__--_---------------------------
New---
l------ l------ New--- New--- New---
New--- New--- New--- New--- New--- New--- New---
0.340
340 : 495
495 : 495 .333
.333
.500
.500
.667
.667 833
1833
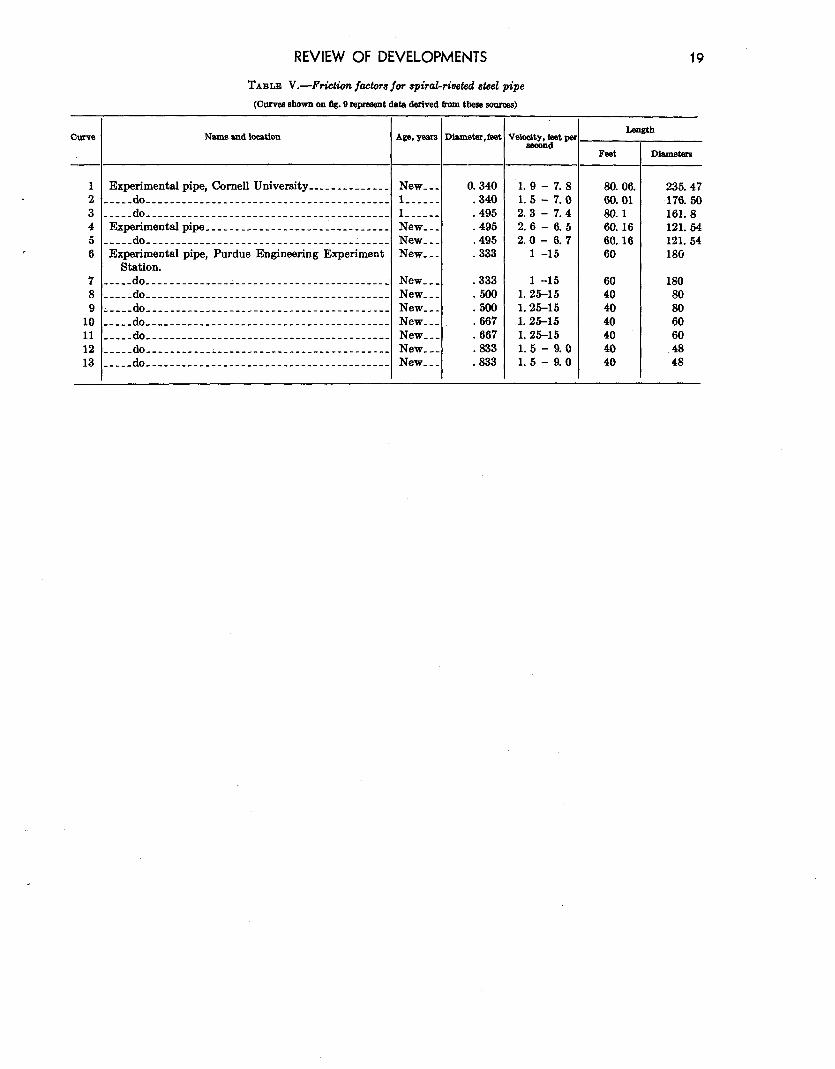
TABLE V.-F&&n factors for spizaZ-tioeted steel pipe
(Curves shown on 5g. 9 repread data derived from these sow& -
c-
1.9 - 7.8 80.06. 235.47 1. 5 - 7.0 60.01 176. 50 2. 3 - 7. 4 80.1 161.8 2. 6 - 6. 5 60.16 121.54 2. 0 - 6. 7 60.16 121. 54
1 -15 60 18Ci
1 -15 60 180 1.25-15 40 80 1.25-15 40 80 1.25-15 40 60 1.25-15 40 60 1. 5 - 9. 0 40 48 1.5 - 9.0 40 48
1 *
CllWe Name and location
1 Northwestern Electric Co., Washington- _ _ _ ____ ______ __ 2 Salmon River Power Co., New York _______ ____ ______ __ 3 Mohawk Hydro Electric Co., New York _______________ _ 4 Pioneer Electric Power Co., Ogden, Utah _______ ____ __ _. 5 .____do______________-_-------------------------------
. 6 Mabton pressure pipe, Sunnyside project, Washington---. 7 ~__-_do_____________-------------------------------~ 8 Seattle Water Works, Washington- __________ __________ 9 Mabton pressure pipe, Sunnyside project, Washington---.
10 Cowiche siphon, Washington--- _ _ _ __ __ _ __ _ _ __ _ _ _ __ _ _ __ 11 Seattle Water Works, Washington--- __________________ 12 Sunnyside project, Washington-- _ __ _ ___ _ _ _ _ __ _ _ _ _ _ _ _ __ 13 .____do__-_______-_____----__-----_----_----------
REVIEW OF DEVELOPMENTS
TABLE IX-Friction factors far wood-stave pipe
(Curves shown on 4.10 represent data derived from tbesa sources) -
Age, Jrears
_-
1 1 5 3 1 1. 5
.5 1 2. 5
.5 1 0 0
13. 5 12. 0
6. 5 6. 04 6. 04 4. 65 4. 65 4.52 4.06 4. 0 3. 71 2. 58 2. 58
7
--
-
Velocity, feet per second
3. 5-6. 1 5. 9-8. 2 0. 9-2. 6 1. 2-5. 3 0. 5-3. 6 1. 2-3. 9 1. 8-3. 1 2. 3-4. 7 2. 3-3. 6 3. l-4. 8 3.5-4.8 2.2-4.6 0.6-4.1
21
Length
Feet
2,379 2,169 2,650
22,672 2,710 2,848 2, 848 2,447 1,341
887 4,041 4,514 7,354
Diam&%W
176 181 407
3,760 448 613 613 540 330 222
1,090 1,750 2,850

-
Evaluation OF Surface Rugosity
LL OF the foregoing development represented A great strides in understanding and cor- relating the nature of pipe flow resistance.
However, a practical and satisfactory method for arriving at the value of the roughness for com- mercially manufactured pipe is still in the experi- mental stage. As a means of differentiation between the Nikuradse roughness and that found in commercially manufactured pipes, uniform sand grain roughness will be denoted as k, while non- uniform roughness such as found in commercial pipes will be referred to as rugosity and will be designated as E.
The determination of rugosity is very diEcult. The protuberances in pipes vary not only in size but in pattern of spacing, as the illustrations in figure 2 will attest. The surface may be uniformly fine grained, uniformly medium grained, or coarse grained, or it may be a combination of any or all of these types together with irregularly spaced large pits, protuberances, or rivet heads. As the combinations are innumerable, a versatile method is required to obtain even a semblance of uniform- ity in measurement.
A promising method for the determination of the value of s for large- and medium-sized conduite consists of making a small cast of one or more
representative portions of the surface. The cast can be made of a plastic, plaster of park, portland cement without sand, or other materials. The only equipment required is a small can of the matrix and a few small tools. The mold can be made in a matter of minutes and can be examined later as convenient.
A method of analyzing the surface of the cast, as practiced by a group of Swiss engineers,12 is partially illustrated in figure 3. The photograph shows the pipe surface and indicates the extent of the cast. The hypsographic chart on the same figure is actually a contour map of the protuber- ances and their spacing. The exact method for determining the average rugosity of the surface is not clear. The contouring, however, is done by photomicrometry resembling the method employed in aerial mapping.
A second method for analyzing the roughness of a pipe surface is being developed in the Hydraulic Laboratory of the University of Liege in Belgium with promising success.13 This method consists of passing a hollow feeler, or probe, over a repre-
l~“Pertes de Charge Dans les Conduites Forcees des Grand= Centrsles Hydm Electriques,” in Rcmc &ncralc de L’HydrauJiquc, No. 40, July- August 1947, p. 171.
~~“Cmtribution FJ L’Etude des Pertes de Charge Continues dans les Caiduftes Cimulaire~.” paper for doctor of science degree by Andre Jorissen, University of Liege, Belgium.
23
24 FRICTION FACTORS FOR LARGE CONDUITS FLOWING FULL
sentative section of the cast, or pipe surface. The probe is connected to a small pressure pump and an air-measuring device by means of a flexible hose. As the probe is firmly passed over the sur- face of the cast, or pipe, air flows from the pump through the hose and measuring device to the probe and back into the atmosphere through the granular pipe surface. The more granular the surface, the greater will be the flow of air for a given length of time. Thus, by maintaining a constant pressure on the measuring device, airflow volume is cali- brated against the overall rugosity c. It has been
announced that the experiments on small com- mercial smooth pipe using this method have been completed successfully. However, a great amount of experimentation and improvement in techniques
. will be necessary before a satisfactory method is devised for measuring directly the overall rugosity factors of rough pipes in general. Until that time, it will remain necessary to describe roughness of commercial and field-constructed pipe in words rather than by a numerical system and estimate the rugosity factors on the basis of charts such as those herein presented. (See figs. 14 through 18.)
25EVALUATION OF SURFACE RUGOSITY
Eo
.t.00
~
~~~~00~"..~
~"
~
~~"~
.~
~5~
6
1..~~.,
":!cc
~
j ..~~"~"~.~~Q~~;.,:Qt!5~~
~
~.~
~~~..~
~~
~
J
j..~~~~.,~
...~
~~c~~;,.
~~~~=
0::>
~
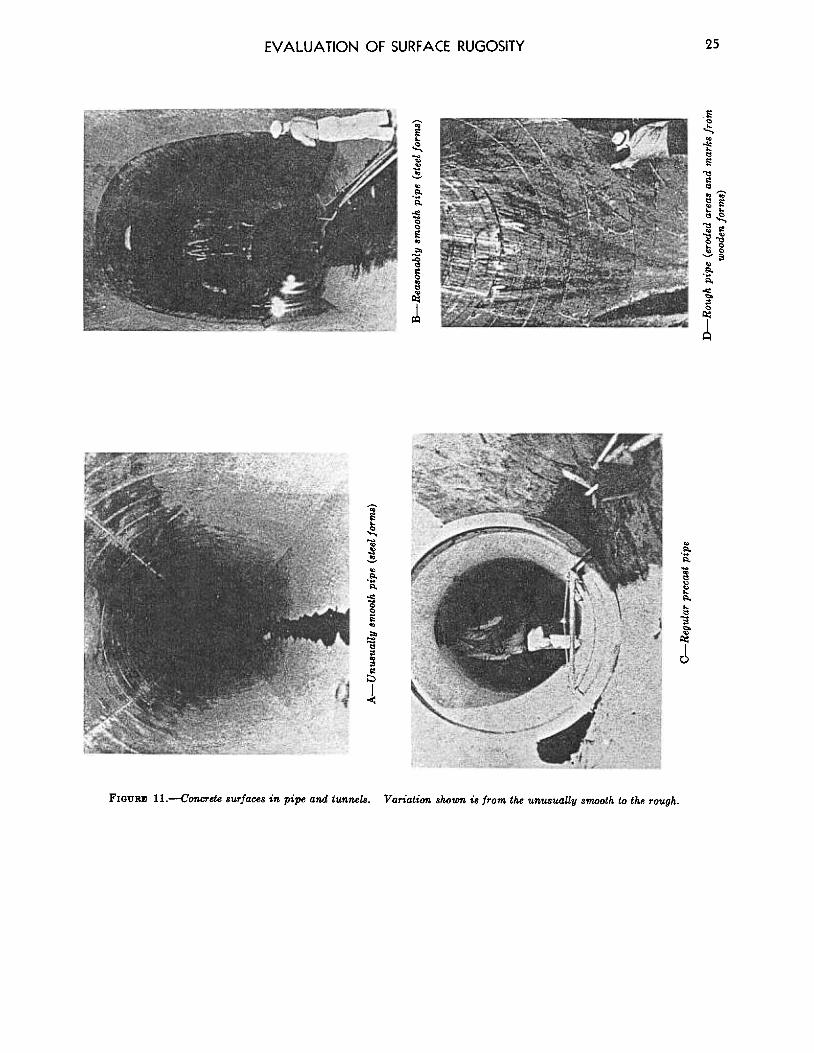
FIGURE 11.-Concrete surfaces in pipe and tunnels. Variation shown is from the unusually smooth to the rough.
26 FRIGION FAGORS FOR LARGE CONDUITS FLOWING FULL
~.~~"~...~
~"~~...""~
.~:.::
c""
~~"""
~E"ta
=£8
~.c""."
i
~
6
~
.0.'"'..""'
~.I:'0-
~..
!~"
~
!""'
.~
~]
~
~~"0
..."'
~...
J
~~..."
s."
~."~..~
l~
~l.~
~
~
~
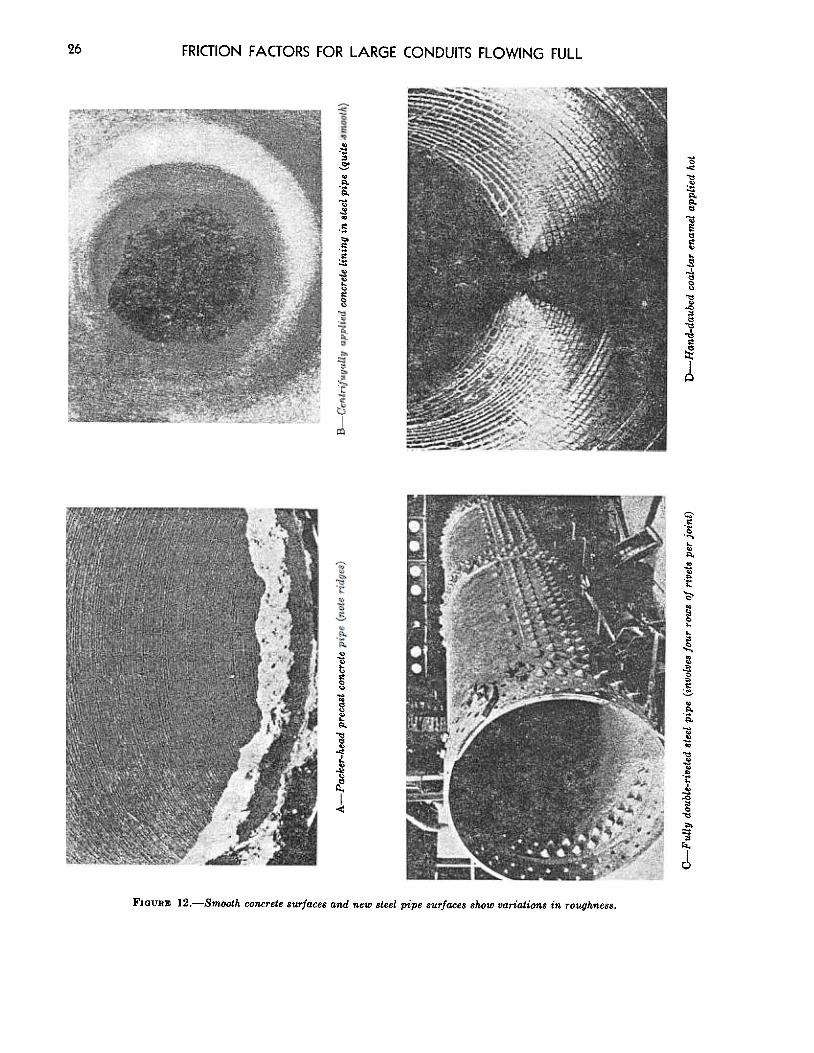
FIGURE 12.-Smooth concrete surfaces and new steel pipe surfaces show variations in roughness.
EVALUATION OF SURFACE RUGOSITY 27
"~
...~
~~~~...
]
~~~
~.g
]
~..0:~~
9..~
~
~
c<
<Q
~.,;0,...,
-=
]~~.,
~...~~~
~
&~.....~
~
~
'=';:
...
~"~
'c-oo~"C..~
;:...
~~~00tj
~C"
~00;$
~
J
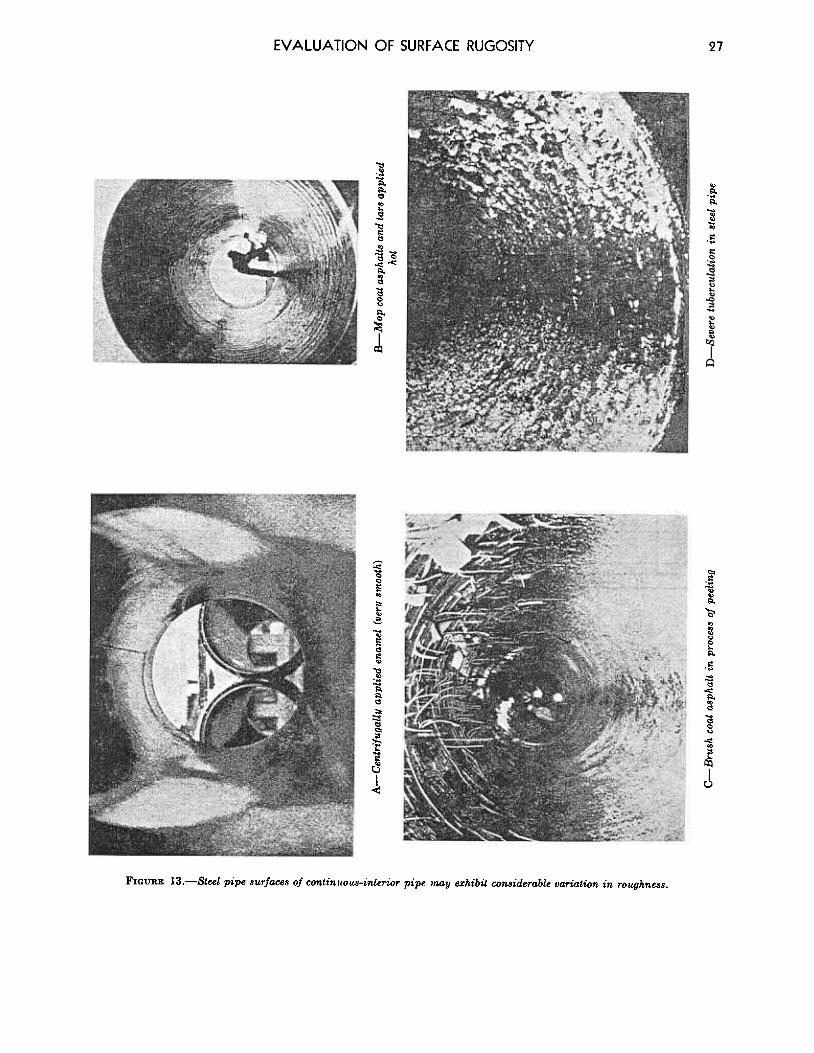
FIGURE 13.-Steel pipe surfaces of continuoU8-interior pipe lnay exhibit considerable lIariation in roughness.

28 FRICTION FACTORS FOR LARGE CONDUITS FLOWING FULL
RUGOSt?TY VALUES FOR
CONCRETE PIPE
0.010 3.0
9- LA
6 I.9
4 Unusually rough Rough wood form work
1.2
3 - L
Eroston of poor concrete 29
it! Poor olinement ot joinI
2-
2 . Rquqh .6 =
Eroded by shorp moteno s m tronsit. Marks
1
z w . visible from wooden forms. Spollina of lo&once. I., . Y
$ “~“““~*~~‘““~~od joints. ood flooted or brushed surface in
I
I Lentrlfugolly cost a30 5
1 concrete pipe 24 2 “I 6 : ’ I .- _. __-
I -
w .I8 2
P .
P : New or fairly new - Smooth concrete z
4 \L
.I2 k 0
Steel forms -Average workmanship. Noticeable air voids ‘on surface - Smooth ioints. --._
z 3 . .09 c’
z : t 8
8 2 : .06 s
2 mz
. New - Unusually smooth t
. Sieet forms -First class worckom”~%-Tp 0.00010 Smooth ioints . 0.030
6 . .024
6 - - ,016
0.00004 0.012
NOTE: FOR PRECAST PIPE SMOOTH JOINTS-NO CORRECTION AVERAGE JOINTS -INCREASE K BY 0.003 TO 0.005 MISALINED JOINTS --INCREASE K BY 0.006 TO 0.009
FIGUBE 14.-Rugoeity values for concrete pipe vary from 0.00006 to 0.0013 foot.

EVALUATION OF SURFACE RUGOSITY 29
RUGOSITY VALUES FOR STEEL PIPE
FEET MM 0.04,
3
2 l
Severe tuberculation ond incrustation
0.04
3
2
I -..- . . --I 0.010 :
6..
6.:
.
l 4
Generol iubercuiation 1-3 mm
- 0.010
e
6
4
I I
0.0010 : ! ’ 0.0010 6;: Light rust 6
6 ’ . . 4 . 3 !
I : 2 l
8
Hot osphalt dipped Centrifugally applied
concrete linings
. : New smooth pipe
0.00010 - . Centrifugally applied enamels 0.00010 6.. , 6 I 6 1 6
3.0
w
5 i a 2 w 0.3
0.03
.
4 4
3 * 3
2 2
0.00001 - 0.0000I 0.003
CONTINUOUS INTERIOR BUTT WELDED.
FIQURE IL-Rugosity values for continuous-interior, butt-welded steel pipe vary from 0.00003 to 0.08 foot.
30 FRICTION FACTORS FOR LARGE CONDUITS FLOWING FULL
RUGOSITY VALUES FOR
STEEL PIPE FEET MM
0.04 0.04 .
3- Severe tuberculotion 3
ond incrustation z- 2
m
0.010 *
6’
6-
4-f
3 i i
2- i
: o.oolo .
6-. .
6-
.-
3-
0.010
General tuberculotion 6 1-3 mm
v) 3 6
Heovy brush coot :2 ’ Rusted Asphalts and tars->- ‘-
E ’ - 3
: Hoi ospholt dipped
2 3
Brush coot graphite- i3 -- 0 - e 2
0 VI New smooth pipe z I
Cir$;fi,gsoIly opplied- : 2 8 Q
0.0010 3 6
In z I
6
00 .
3
2- 2
0.00010 - 0.000l0 0.03
6. 6
6. 6
1
.- 4
3- 3
e- 2
.
0.00001 0.00001 0.003
GIRTH RIVETED JOINTS 16 TO 30 FEET APART. LONGITUDINAL SEAMS WELDED.
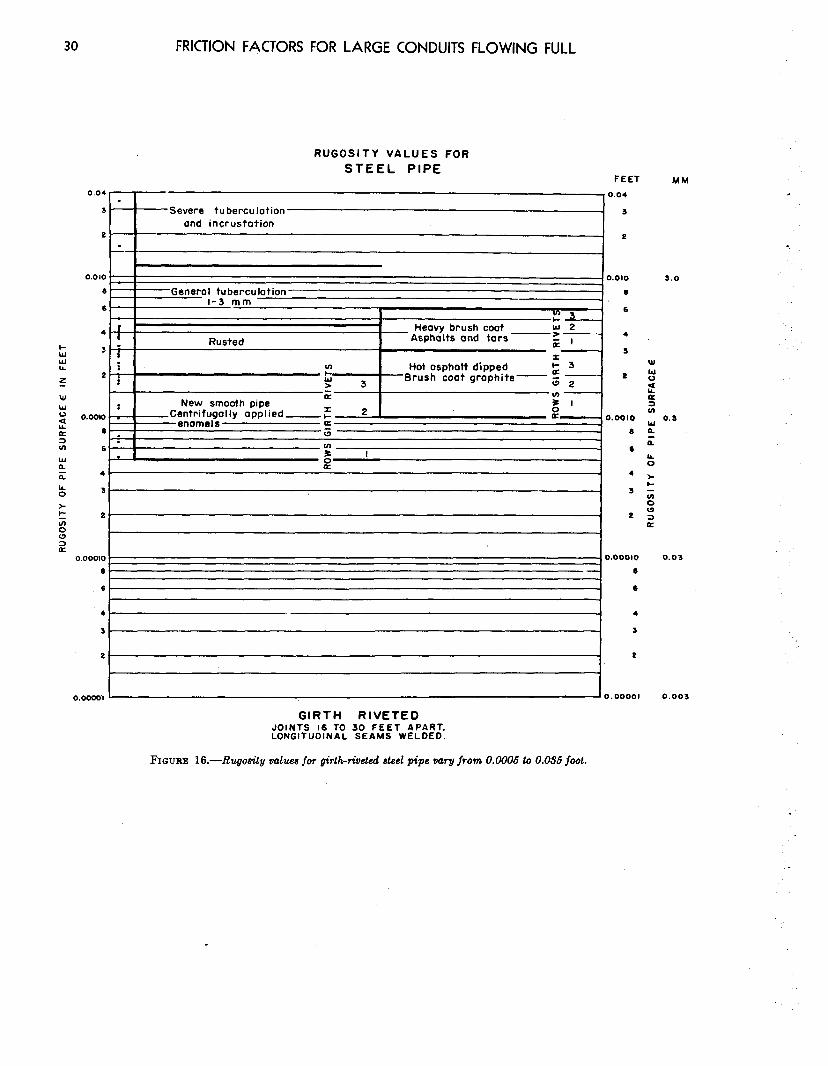
FIGURE 16.-Rugosity values for girth-riveted steel pipe vary from 0.0006 to 0.0% foot.

EVALUATION OF SURFACE RUGOSITY 31
RUGOSITY VALUES FOR
STEEL PIPE
0.04 -
3- .
e-.
. :
0.010 j a-
FEET
Severe tuberculotion 0.04
3 and incrustation
2 Triple riveted -- .- --.-- ._----_
Generol tuberculotion Double riveted 1-3 mm Single riveted
0.010
6 -3 Rows longitudinal rivets
j 4’. Foirly smooth
I
:i pipe surface
. I Row longitudinal rivets In 3
--- :
0 a
a ’ 0.0010 - 0.0010
6. 6
6. 6
4. 4
3 3
0.00010 + 0.000l0 --
6. -_---_- 6
6- 6 --- ---- ---- --- .--._ - .- - ___ ,__ _
4- ---- ~--- 4
3- -- 3
2- 2
MM
0.03
0.0ooo1 0.00001 0.003
FULLY RIVETED JOINTS 6 TO 8 FEET APART. LONGITUDINAL SEAMS RIVETED.
FIGURE 17 .-Rugosity valrtes jor full-riveted steel pipe vary from 0.001 to 0.03 foot.

32 FRICTION FACTORS FOR LARGE CONDUITS FLOWING FULL
RUGOSITY VALUES FOR WOOD STAVE ,PlPE
0.04
3
2
0.010
6
6
4
3 t- W
ii! 2
z w
: 0.0010 2 a 6 2 6
t 8 2
z a
0.00010
6
6
4
3
2
0.00001
3.0
. 2.4
I.6 , l . . . 1.2
_--- .-._ --- .-.. -..... -.- --.._. .- .9
Excessive g&th on walls. Rough,projecting staves at
‘1 0.30 $
.-.-_ Used -
m
Good condition .I6 aw
c .I2 . &
l
I
.09 z
New First class construction
g .06 (3
a
0.03
-
I 0.003
FIGURE lg.-Rugosity values for wood-stave pipe vary from 0.00011 to 0.008 foot.
Friction Factors for Design
Experimental Information
T HE PIPES for which charts of friction factors are presented include concrete pipe (fig. 5); continuous-interior steel pip8, which may be
butt-welded throughout or have bell-and-spigot or patented joints (fig. 6); girth-riveted steel pipe, which implies that the transverse joints are riveted and the longitudinal seams are welded (fig. 7); full-riveted steel pipe in which both girth and longitudinal joints are riveted (fig. 8); spird- riveted pipe (fig. 9); and wood-stave pipe (fig. 10). The friction factorf in the Darcy formula has been plotted against the Reynolds number R, to produce the curve8 in the above figures.
Each curve in figure8 5 through 10 is designated by a number. By referring to data in tables I through VI by curve number, information can be obtained as to location of the tests and the age, diameter, velocity, and length of the pipe in question. Additional information as to joints, seams, condition of the surface, paint, method of testing, and evaluation of the results with references to published papers and bulletins on the original work, is included for the various types of conduits in tables A through F of the appendix. Where information on a test was plentiful, all that pertained to the condition of the pipe was included.
Information on some of the tests was, however, meager.
For the sake of clarity, the actual test points were omitted from figures 5 through 10; thus, the curves shown thereon represent average values. In the majority of casts, the points did not fall directly on the curve as drawn but fell to both sides with considerable variation. As a great deal of time was involved in the collection and compilation of the test data which were obtained from many sources and found in various forms, a permanent record of this material was desirable.
,For those who may wish to investigate or experi- ment with these data, a complete record of the test point8 is included for each type of pipe tested in tables G through M of the appendix.
Limitation of Study
The study was made principally on large pipe- lines in which turbulent flow was well developed, with the values of Reynolds number ranging from approximately 1 million upwards. It can be observed from figures 5 through 10 that the greater portion of the test data collected falls within or approaches fully developed turbulent flow, for which the friction factor f approximates a constant VdU8:
33
34 FRICTION FACTORS FOR LARGE CONDUITS FLOWING FULL
Previous compilers of pipe friction data have, in general, limited their investigations to smaller pipes in which turbulence was not fully developed; thus, their compilations fall principally in the transition zone. This can probably be explained by the fact that, until recentiy, there has not been available a sufhcient amount of reliable experi- mental data on large pipelines to warrant a compilation. Incidentally, more data are re- quired for large pipes than small ones, as the experimental error appears to increase with pipe size.
The curves in figures 5 t&G@gh- 10 contain practically all experimental information avail- able on large pipes, but they are diEcult to use in this form as they represent many types of surface conditions and the accuracy of some of the data is questionable. Thus, it was advisable to devise a method for sorting out the questionable material and combining the remainder.
Method of Evaluating Results Superimposed on figures 5 through 10 is the
Moody diagram, the construction of which was described in the introduction. The diagram con- sists of curves indicated by dash lines, which represent constant values of the relative roughness or rugosity e/D. By means of the Moody diagram, it was possible. to read off values of c/D from the various experimental curves of figures 5 through 10. An average value of t was obtained for each cnrve by multiplying the e/D value by its respec- tive pipe diameter. Values of r obtained in this manner were then plotted for concrete pipe in figure 14; steel pipe in figures 15, 16, and 17; and wood-stave pipe in figure 18, with as detailed a word description of the pipe surface as it was possible to make from the available information. Each dot to the left of these charts represents one experiment. The photographs in figures 11, 12, and 13 were included to supplement the word description applied to the pipe surfaces throughout the text.
A comparison of figure 14 and figures 1516, and 17 indicates that continuous-interior steel pipe can be both smoother and rougher than concrete pipe. The practice of tabulating friction coeffi- cients with respect to the age of a pipe, such as is done with small commercial pipes, means nothing in the case of larger pipe where mainte- nance is possible. The friction factor for large pipes varies with the condition of the pipe surface,
which may change from year to year, depending upon whether the surface is repainted or s&owed to deteriorate. For example, the friction factor f for steel penstocks 34 years old was found to be comparable to that of new pipe.
In well-constructed concrete pipe, it was found that the friction factor f remained very much the same regardless of age, unless the water flowing through it carried appreciable amounts of abrasive material. In some cases, algae growth was re- ported to have little effect on the carrying capacity of concrete pipe, providing it was not sufhcient in amount to reduce the cross-sectional area of the conduit. In other instances such as the San Diego Aqueduct, a thin film of algae produced a lo- percent decrease in the carrying capacity of the conduit during the summer months. The water in this case carried fine sand which lodged in the algae deposits.
Figures 15, 16, and 17 show the progressive increase of the friction factor with increase in the number of rivets. Although the minimum value of Q increases with the number of rivets involved, the maximum value of c for full-riveted pipe is shown to be no higher than for poorly maintained and encrusted continuous-interior pipe.
The resistance to flow in the three types of con- struction differ in these respects : (1) The resistance to flow in new concrete pipe is entirely dependent on the condition of the finished surface and on the frequency and alinement of joints; (2) the re- sistance to flow in new continuous-interior steel pipe is principally dependent on the type and application of the protective coating employed; (3) for heavy riveted steel pipe in good condition, the obstruction offered to the flow by rivet heads predominates while the protective coating becomes of minor importance.
The values of c for spiral-riveted steel pipe are not shown in figures 15,16, and 17, as the inform& tion available is too meager to allow drawing any general conclusions and the experimental informa- tion available was on pipes less than 1 foot in diameter.
Values of t for wood-stave pipe are shown in figure 18. Again the available information is meager, but the pipelines tested were fairly large in diameter. These results are not considered conclusive.
Theoretically, the value of the friction factor f for any conduit lies between the smooth pipe
FRICTION FACTORS FOR DESIGN 35
curve and a constant value of approximataly 0.054 for entirely rough surfaces. If the irregularities in the walls of the conduit are sufl’icient to produce noticeable expansion and contraction losses, such as would be the case for unlined rock tunnels, the factor may be even greater than 0.054. For example, Hickox, Peterka, and Elder l4 obtained a value off =O.lO for the unlined portion of the Apalachia Tunnel. It is apparent that the friction factor for all types of rough surfaces tends to approach the values for smooth pipe as the diameter increases.
Special care is necessary in the determination of the pipe diameter, as the reduction in carrying capacity of a conduit due to tuberculation, especially in the smaller sizes, can be as much a function of reduction in diameter as it is a result of an increase in the value off. The reason that a small change in the diameter can produce a rather large change in the value off is thatf varies inversely as the fifth power of the diameter. Thus, if heavy incrustation is expected in a ,pipe installation, it may be better to compute the
‘diameter based on f=O.OM than to attempt to estimate the ultimate value of f based on the original diameter.
Bend Lossei Although much of the experimental pipe con-
tained bends of various degrees and number, the values of e in figures 14 through 18 have been adjusted, according to the best judgment of the authors, to exclude bend losses. No information of value has been found on bend losses in large pipelines, principally because long reaches of straight pipe must accompany a bend if reliable measurements are to be made.
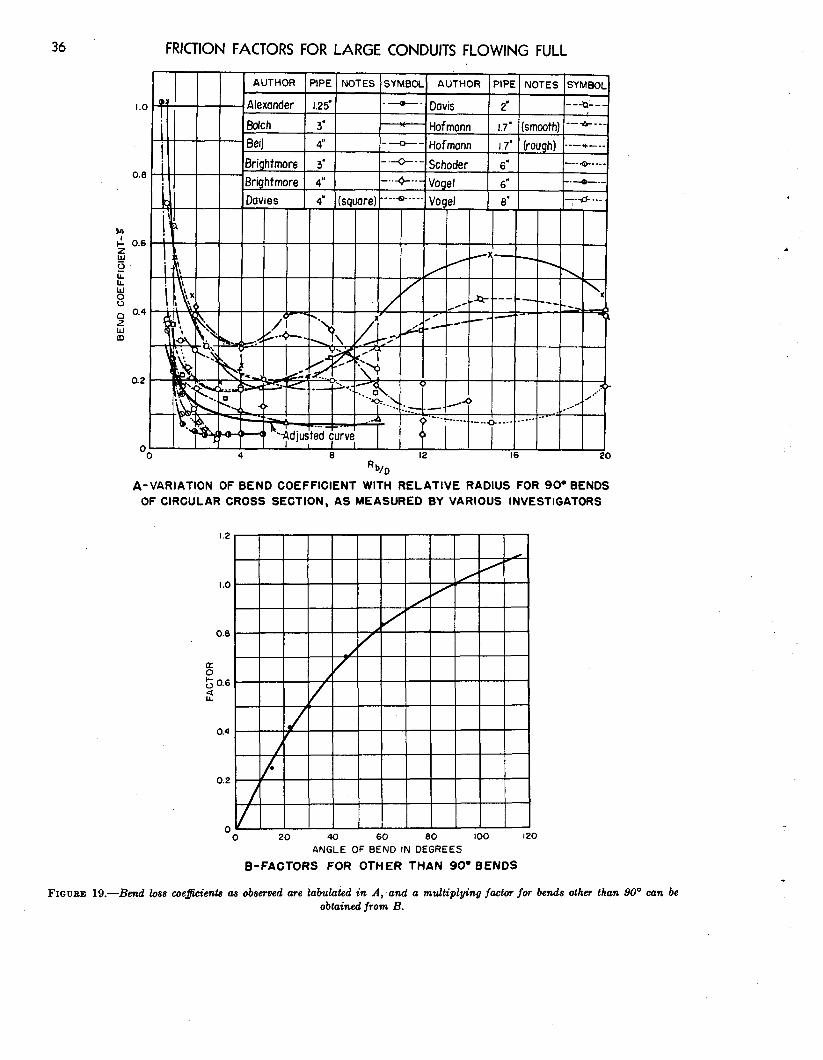
The best experimental information to date on pipe bends is shown in figure 19A, which was
compiled by Beij Is of the Bureau of Standards. It will be observed that the largest pipe tested in this group was 8 inches in diameter, and the experimental results are at considerable variance with one another. Generally speaking, it appears that the loss coefficient for 90’ bends is a minimum when the ratio of the radius of the bend to the diameter is between 3 and 6. As Rb/D (the ratio of the radius of the bend to the pipe diameter)
1’ Elder, R. A., “Friction Measurements in Apalachin Tmntl,” Transar- Lions, ASCE, Vol. 123,1958, p. 1249.
1’ Beij. K. H.,“Preeeure Loesee for Fluid Flow in 9W Pipe Bends,” Jmund of Remmh, National Bureau of Standards, Vol. 21, July 1938.
increases, the bend coefficient shows a secondary rise, but then it must gradually fall to zero as the value of RJD continues to increase. The reason for the secondary rise is explained quite logically by Anderson and Straub.”
Supposedly, the bend loss coefficients in figure 19A constitute only those losses chargeable to the bend, the straight pipe loss having been deducted. The study by Beij demonstrated that the bend coefficient is independent of the Reynolds number when the latter exceeds a value of 200,000. The bend coefficient is influenced, however, by the relative roughness e/D and, in the case of rec- tangular elbows, by the aspect ratio W/D (ratio of width normal to radius to width in same plane as radius).
Anderson and Straub reduced the data in figure 19A to those for an equivalent smooth bend. The resulting curve, labeled “adjusted curve,” is shown by the heavy solid line in the figure. This ‘line supposedly represents the aver- age loss coefficient for 90” bends in circular pipes having smooth surfaces. As the relative rough- ness need be no greater for a rough pipe of large diameter than for a small smooth pipe, it stands to reason that bend loss coefficients for large conduits are probably no greater than those shown for small smooth pipe by the adjusted curve in the figure.
It therefore appears that the engineering pro- fession has been making a practice of overesti- mating bend loss coefficients for large pipes by from 50 to 100 percent. This was partially veri- fied when an attempt was made to separate bend losses from the experimental results of figures 5 through 10. It was found that, when bend losses were subtracted out using the generally
accepted coefficients of 0.15 -$ for a 90” bend and
0.11 $ for a 45” bend, the remaining straight pipe
friction often fell below the values given by the curve for smooth pipe. Although there is much to be desired in the way of confirmation, the authors are convinced that bend loss coefficients for large pipe are being consistently overestimated.
Loss coefficients for other than 90’ bends can be obtained by multiplying the 90” bend coefficients in figure 19A by a factor from figure 19B.
u Anderson, A. Q., and Straub, L. G., “Hydmulics of Conduit Bend&”
St. Anthony Falls Hydraulic. Laborstory, Bulktin No. 1, Minneapolk, Minn.. Doeember 1948.
36 FRICTION FACTORS FOR LARGE CONDUITS FLOWING FULL
1.0 a*
AUTHOR PIPE NOTES SYMBOL AUTHOR PIPE NOTES SYMBOL
- Alexander 1.25” ----O-. Davis 2’ ---Ql--
I Batch 3’ 1 4 Hofmann 17’ (smooth) ---O---
- Beij 4” - --D- - Hof mann 1.7’ (rough) ---+---
Brightmore 3’
Brightmore 4”
--G--- Schoder --4---- Vogel
6’ ---.,+----
6” -.-.-
4’ (square) ----+---- Vogel
L ? --- 12 16 ‘
A-VARIATION OF BEND COEFFICIENT WITH RELATIVE RADIUS FOR 90. BENDS OF CIRCULAR CROSS SECTION, AS MEASURED BY VARIOUS INVESTIGATORS
0.6
0.4
0.2
0 0 20 40 60 60 too I20
ANGLE OF SEND IN DEGREES
B-FACTORS FOR OTHER THAN 90’ BENDS
FIGURE 19 .-Bend loss coejkienta 08 observed are tabuhted in A;and a multiplying j&or for bends other than 90’ can be obtuined from 33.
Information for the Designer
Experimental Information
F
OR THE designer, the experimental information on straight pipe resistance is condensed in figures 14 through 18. This, together with a
chart of the Moody diagram (see fig. 4), is essenti- ally all that is needed for computing frictional resistance in large straight pipelines.
Additional Useful Information
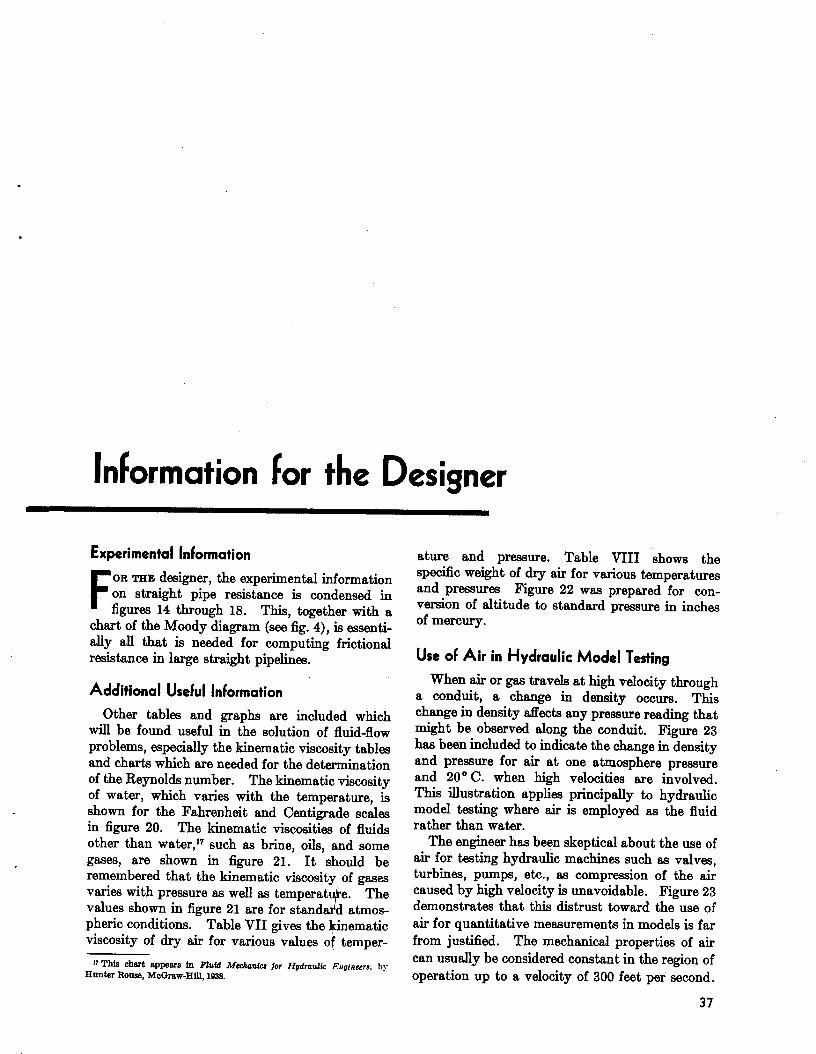
Other tables and graphs are included which will be found useful in the solution of fluid-flow problems, especially the kinematic viscosity tables and charts which are needed for the determination of the Reynolds number. The kinematic viscosity of water, which varies with the temperature, is shown for the Fahrenheit and Centigrade scales in figure 20. The kinematic viscosities of fluids other than water,” such as brine, oils, and some gases, are shown in figure 21. It should be remembered that the kinematic viicosity of gases varies with pressure ss well as temperat
if e. The
values shown in figure 21 are for standa d atmos- pheric conditions. Table VII gives the *
t ematic
viscosity of dry air for various values 0 temper-
I7 This chart appmm in Flufd Mechanier /or Hydraulic Enpinurs, hy Hunter Row, McGraw-Hill, 193%
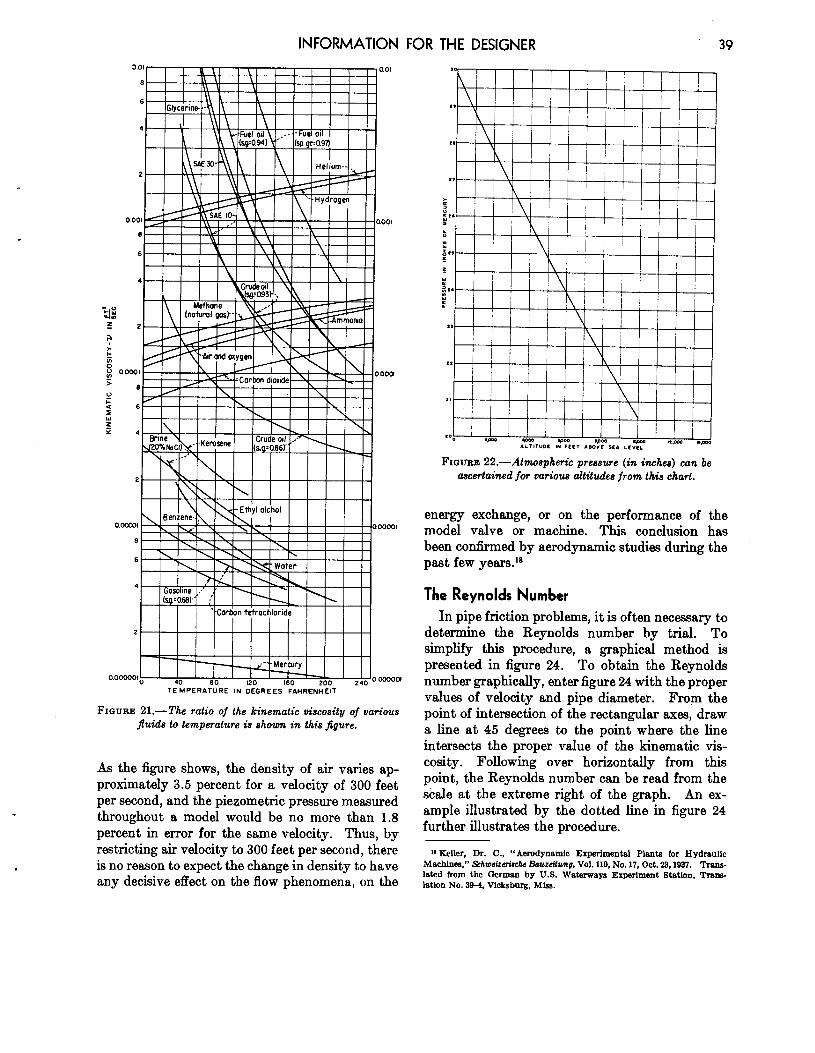
ature and pressure. Table VIII shows the specific weight of dry air for various temperatures and pressures Figure 22 was prepared for con- version of altitude to standard pressure in inches of mercury.
Use of Air in Hydraulic Model Testing
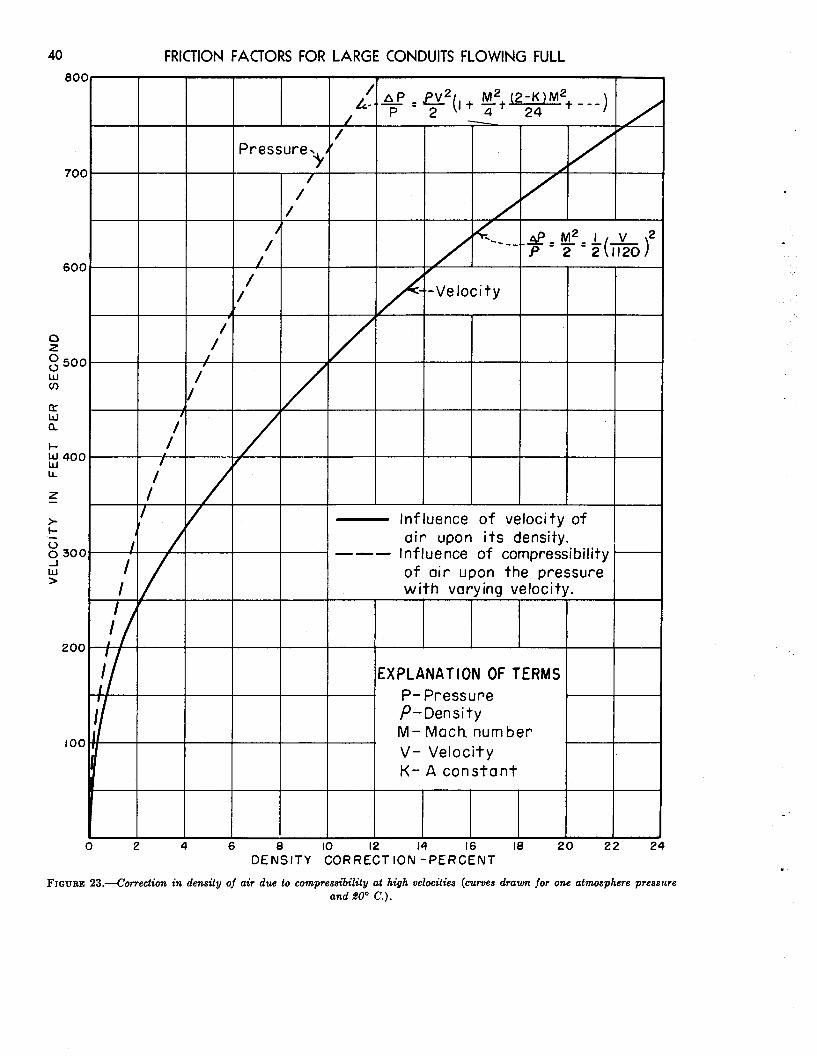
When air or gas travels at high velocity through a conduit, a change in density occurs. This change in density affects any pressure reading that might be observed along the conduit. Figure 23 has been included to indicate the change in density and pressure for air at one atmosphere pressure and 20” C. when high velocities are involved. This illustration applies principally to hydraulic model testing where air is employed as the fluid rather than water.
The engineer has been skeptical about the use of air for testing hydraulic machines such as valves, turbines, pumps, etc., as compression of the air caused by high velocity is unavoidable. Figure 23 demonstrates that this distrust toward the use of air for quantitative measurements in models is far from justified. The mechanical properties of air can usually be considered constant in the region of operation up to a velocity of 300 feet per second.
37

w co
IO01 \ - 130
\
\, , 90
\ \, I
\ -^
\
I I I IV ,dFohrenheit I I- I
Y-Centigrade \ \
! ! . .,
\
I I I I I INI. I I I I I I I i i i i i i i i 1
90
80
70
0 -- 0.3 0.4 0.5 0.6 0.7 0.8 0.9 1.2 I.3 1.4 I.5 1.6 1.7 I.6 1.9
30 x 10-5 2.0
KINEMATIC VISCOSITY SQUARE FEET PER SECOND x to-5
KINEMATIC VISCOSITY OF WATER RELATIVE TO TEMPERATURE
FIQURE 20.--The ratio of the kinematic oiscosity of water to its temperalure may be obtained from this chart.
..’ . .
INFORMATION FOR THE DESIGNER 39
.
4 \ \\I \ -.Fuel oil
Imznam ** .-.-Fuel oil
. . . ..ncc4
I
.I I P I W Water
etrochloride I I I
TEMPERATURE IN DEGREES -&RENHEIT
FIGURE 21.-T& ratio of the kinematic viscosity of various fluids to temperature is shown in this figure.
As the figure shows, the density of air varies ap- proximately 3.5 percent for a velocity of 300 feet per second, and the piezometric pressure measured throughout a model would be no more than 1.8 percent in error for the same velocity. Thus, by restricting air velocity to 300 feet per second, there is no reason to expect the change in density to have any decisive effect on the flow phenomena, on the
FIGUBE 22.-Atmospheric pressure (in inches) can be ascertained for various altitudes from this chart.
energy exchange, or on the performance of the model valve or machine. This conclusion has been confirmed by aerodynamic studies during the past few years.ls
The Reynolds Number
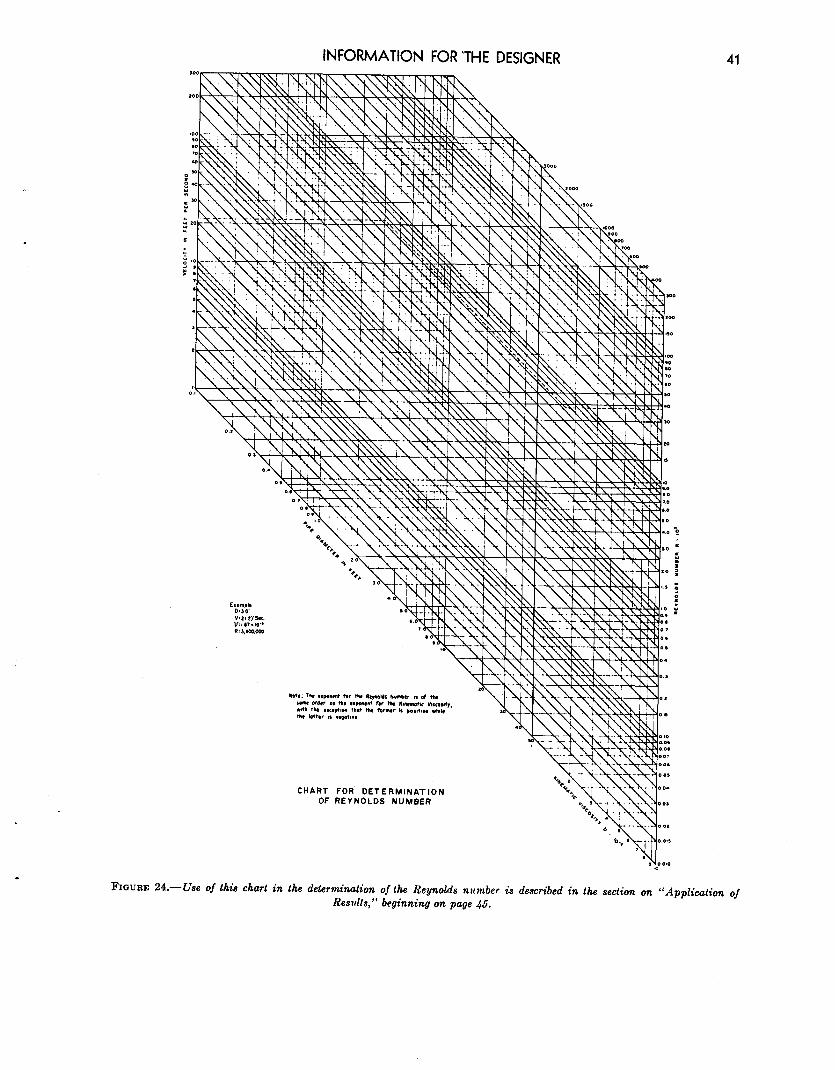
In pipe friction problems, it is often necessary to determine the Reynolds number by trial. To simplify this procedure, a graphical method is presented in figure 24. To obtain the Reynolds number graphically, enter figure 24 with the proper values of velocity and pipe diameter. From the point of intersection of the rectangular axes, draw a line at 45 degrees to the point where the line intersects the proper value of the kinematic vis- cosity. Following over horizontally from this point, the Reynolds number can be read from the scale at the extreme right of the graph. An ex- ample illustrated by the dotted line in figure 24 further illustrates the procedure.
18 Keller, Dr. C., “Aerodynamic Experimental Planb for Hydraulic
Machines,” Schweizcriache L3aw&unv, Vol. 110, No. 17, Oct. 23,1937. Tram- lated from the German by U.S. Waterways Experiment Station. Tram- lath No. 3Q-4, Vicksburg, Miss.
40 FRICTION FACTORS FOR LARGE CONDUITS FLOWING FULL 80
60
Influence of velocity of air upon its density.
--- Influence of compressibility of air upon the pressure with varying velocity.
EXPLANATION OF TERMS P-Pressure P-Density M- Mach. number V- Velocity K- A constant
,
d
0 2 4 6 8 IO 12 14 I6 I8 20 22 2 14 DENSITY CORRECTION -PERCENT
FIGURE 23.-Correction in density of air due to compressibility at high velocities (curves drawn jot one atmosphere pressure and 10’ C.).
.
.
INFORMATION FOR ‘THE DESIGNER 41
CHART FOR’ DETERMINATION OF REYNOLDS NUMBER
FIGURE 24.-Use of this churl in the determination of the Reynolds number is described in the section on “Application of Resttlls,” beginning on page 46.
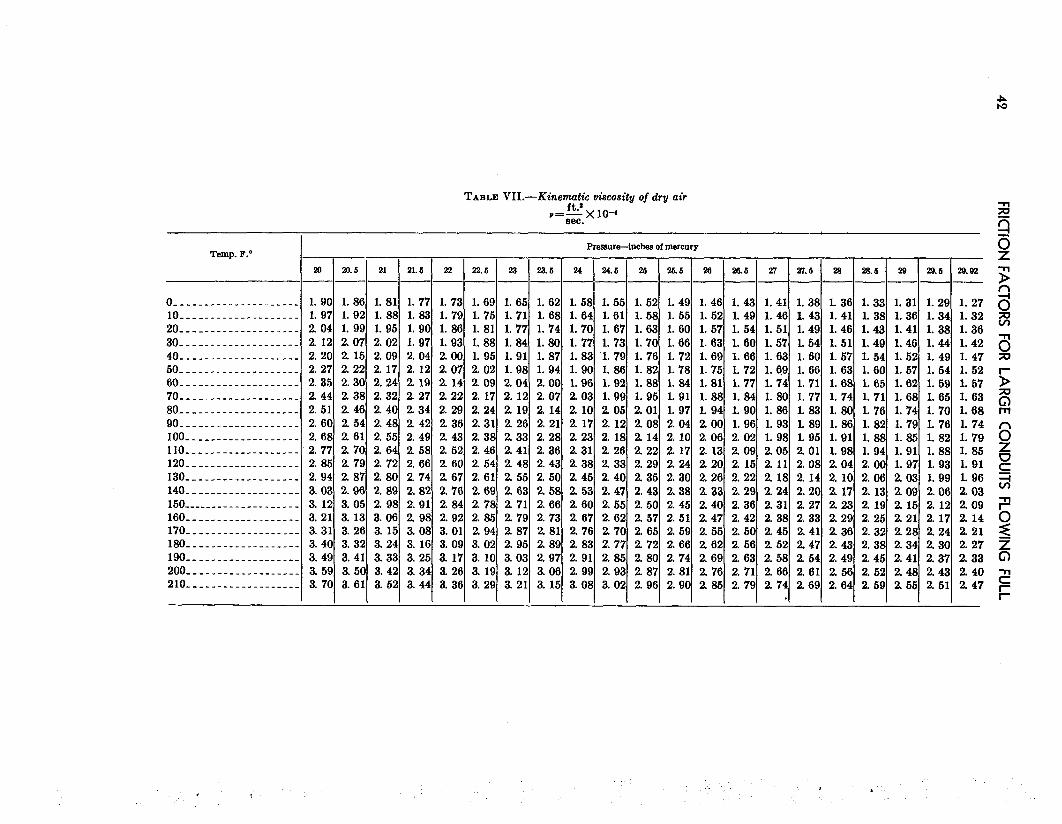
TABLE VII.-Kinematic viscosity of dru air y=ft.) x 14-J-4
sec.
Temp. F.’ Pressurtiiuchea of mercury
20 20.6 21 21.6 22 22.b 23 23.6 24 24.6 26 26.5 28 20.6 27 27.1 28 28.6 28 29.6 20.92 ----------_L--------- -VP
0 _____________________ 1.90 1.86 1.81 1.77 1.73 1.69 1.65 1.62 1.58 1.55 1.52 1.49 1.46 1.43 1.41 1.38 1.36 1.33 1.31 1.29 1.27 g
10 ____________________ 1.97 1.92 1.88 1.83 1.79 1.75 1.71 0
1.68 1.64 1.61 1.58 1.55 1.52 1.49 1.46 1.43 1.41 1.38 1.36 1.34 1.32 20 __________________ -_ 2.04 1.99 1.95 1.90 1.86 1.81 1.77 1.74 1.70 1.67 1.63 1.60 1.57 1.54 1.51 1.49 1.46 1.43 1.41 1.38 1.36 z
30 ____________________ 2.12 2.07 2.02 1.97 1.93 1.88 1.84 1.80 1.77 1.73 1.70 1.66 1.63 1.60 1.57 1.54 1.51 1.49 1.46 1.44 1.42 40 ____________________ 2.20 2.15 2.09 2.04 2.00 1.95 1.91 1.87 1.83 1.79 1.76 1.72 1.69 1.66 1.63 1.60 1.57
T; 1.54 1.52 1.49 1.47 A
50 ____________________ 2.27 2.22 2.17 2.12 2.07 2.02 1.98 1.94 1.90 1.86 1.82 1.78 1.75 1.72 1.6.9 1.66 1.63 1.60 1.57 1.54 1.52 I- 60 __________________ -_ 2.35 2.30 2.24 2.19 2.14 2.09 2.04 2.00 1.96 1.92 1.38 1.84 1.81 1.77 1.74 1.71 1.68 1.65 1.62 1.59 1.57 b
70 ____________________ 2.44 2.38 2.32 227 2.22 2.17 2.12 2.07 2.03 1.99 1.95 1.91 1.88 1.84 1.80 1.77 1.74 1.71 1.68 1.65 1.63 80 ____________________ 2.51 2.46 240 234 2.29 2.24 219 214 2.10 2.05 2.01 1.97 1.94 1.90 1.86 1.83 1.80 1.76 1.74 1.70 1.68 8 m
90 ____________________ 2.60 2.54 248 242 2.36 2.31 226 2.21 2.17 2.12 2.08 2.04 2.00 1.96 1.93 1.89 1.86 1.82 1.79 1.76 1.74 n 100 ___________________ 2.68 2.61 2.55 2.49 2.43 2.38 2.33 2.28 2.23 2.18 2.14 2.10 2.06 2.02 1.98 1.95 1.91 1.88 1.85 1.82 1.79 0
110 ___________________ 2.77 2.70 2.64 2.58 2.52 2.46 2.41 2.36 2.31 2.26 2.22 2.17 2.13 2.09 2.05 201 1.98 1.94 1.91 1.88 1.85 120 _________________ -_ 2.85 2.79 2.72 2.66 2.60 2.54 248 2.43 238 2.33 2.29 2.24 2.20 215 2.11 2.08 2.04 2.00 1.97 1.93 1.91 6 c
130 ___________________ 2.94 2.87 2.80 2.74 2.67 2.61 2.55 2.50 2.45 2.40 2.35 2.30 2.26 2.22 2.18 2.14 2.10 2.06 2.03 1.99 1.96 140 ___________________ 3.03 2.96 2.89 2.82 2.76 2.69 2.63 2.58 2.53 2.47 2.43 2.38 2.33 2.29 2.24 2.20 2.17 2.13 2.09 2.06 2.03
2
150 __________________ -_ 3.12 3.05 2.98 2.91 2.84 278 2.71 2.66 2.60 2.55 2.50 2.45 2.40 2.36 2.31 227 2.23 2.19 2.15 2.12 2.09 7 160 _____________ - _____ 3.21 3.13 3.06 2.98 2.92 2.85 2.79 2.73 267 2.62 2.57 2.51 2.47 2.42 2.38 2.33 2.29 2.25 2.21 2.17 2.14 0 170 ___________________ 3.31 3.26 3.15 3.08 3.01 294 287 2.81 2.76 2.70 2.65 2.59 2.55 2.50 245 2.41 2.36 2.32 2.28 2.24 2.21 < 180 _____ - _____________ 3.40 3.32 3.24 3.16 3.09 3.02 2.95 2.89 2.83 2.77 272 2.66 2.62 256 252 2.47 2.43 2.38 2.34 2.30 2.27 z 190 ___________________ 3.49 3.41 3.33 3.25 3.17 3.10 3.03 2.97 2.91 2.85 2.80 2.74 2.69 2.63 2.58 2.54 2.49 2.45 2.41 2.37 2.33 0 200 _________________ -_ 3.59 3.50 3.42 3.34 3.26 3.19 3.12 3.06 2.99 2.93 287 2.81 2.76 2.71 2.66 2.61 2.56 2.52 2.48 2.43 2.40 210 ___________________ 3.70 3.61 3.52 3.44 3.36 3.29 3.21 3.15 3.08 3.02 2.96 2.90 2.85 2.79 2.74 2.69 2.64 2.59 255 2.51 2.47 2
F
I i 1’
L

TABLE VIII.-Sp$jc weight of dry air
r=ft.rXlO-'
Temp. F.‘= Pre.sureAnchea of memury
20 20.6 21 21.6 22 22.5 23 23.6 24 24.6 25 25.6 26 28.6 27 27.6 28 28.5 29 22.6 29.92
--------------- ------
f:
0 _________---_--__---_ 5.77 5.91 6.05 6.20 6.35 6.49 6.63 6.78 6.92 7.06 7.21 7.35 7.50.7.64 7.78 7.93 lO_-_-_-----__-------- 5.64 5.78 5.93 6.07 6.21 6.35 6.49 6.63 6.77
807 8.22 836 8.51 863 6.91 7.05 7.20 7.34 7.48 7.62 7.76 7.90
3 =
20__--_--------------- 804 818 8.33 8.44
5.53 5.66 5.80 5.94 6.08 6.22 6.36 6.50 6.63 6.77 6.91 7.05 7.19 7.32 7.46 7.60 7.74 7.88 801 815 827 3 30-------------------_ 5.41 5.55 5.68 5.82 5.96 6.09 6.22 6.36 6.50 6.63 6.77 6.90 7.04 7.17 7.31 7.44 7.58 40-__----------------- 5.30 5.44 5.57 5.70 5.84 5.97 6.10 6.23 6.37
7.71 7.85 7.99 8.10 6.50 6.63 6.76 6.90 7.03 7.16 7.30 7.43
2 50------------------__ 7.56 7.69 7.83 7.94 5.20 5.33 5.46 5.59 5.72 5.85 5.98 6.11 6.24
6.37 6.50 6.63 6.76 6.89 7.02 7.15 7.28 7.41 7.54 7.67 7.78 a
60__-~_~~~~-~~_~~~~~__ 5.10 5.23 5.36 5.48 5.61 5.74 5.87 5.99 6.12 6.25 6.38 6.50 6.63 6.76 6.89 7.01 7.14 7.27
z
70______------__----__ 5.01 5.13 5.26 5.38 5.51 5.63 5.76 7.40 7.52 7.63
5.88 6.01 6.13 6.26 6.38 6.51 6.63 6.76 6.88 7.01 80-----_--------------
7.13 7.26 7.38 7.49 4.91 5.03 5.16 5.28 5.40 5.53 5.65 5.77 5.89 6.02 6.14 6.26 6.39 6.51 6.63
3 6.76 6.88 7.00 7.12 7.25 7.35 A
go--------------_---___ 4.82 494 5.06 5.18 5.30 5.42 5.54 5.67 5.79 5.91 6.03 6.15 6.27 6.39 6.51 6.63 lOO_____~~~~~~~~_~~___ 6.75 6.87 6.99 7.11 7.21 4.74 4.86 4.97 5.09 5.21 5.33 5.45 5.57 5.68 5.80 5.92 6.04 6.16 6.28 6.40 6.52 llO-____----------,--- 6.63 6.75 6.87 6.99 7.09
2 4.65 4.77 4.88 5.00 5.12 5.23 5.35 5.47 5.58 5.70 5.82 5.93
6.05 6.17 6.28 ,,.,
6.40 6.51 6.63 6.75 6.86 120~----~~~~--~~~~~~__
6.96 4.57 4.69 4.80 4.92 5.02 5.14 5.26 5.37 5.49 5.60 5.72 5.83 5.95 6.06 6.17 6.29 6.40 6.52 6.63 6.75 6.84 g
130-------~~--~~~~-~__ 4.50 4.61 4.72 4.83 4.95 5.06 5.17 5.28 5.40 5.51 5.62 5.73 5.85 5.96 6.07 6.18 6.30 6.41 140-------------------
6.52 6.63 6.73 4.42 4.53 4.64 475 4.86 4.97 5.08 5.19 5.30 5.41 5.52 5.64 5.75 5.86 5.97 6.08 6.19 6.30 6.41 6.52 6.61
g
150-__-_-------------- 4.35 4.46 456 4.67 4.78 4.89 5.00 5.11 5.22 5.33 5.43 5.54 5.65 5.76 5.87 5.98 6.09 6.20 6.30 6.41 6.50 6 160------------------- 4.28 4.38 449 4.60 4.70 4.81 492 5.03 5.13 5.24 5.34 5.45 5.56 5.67 5.77 a 170-------'------------
5.88 5.99 6.09 6.20 6.31 6.40 4.21 4.31 4.42 453 4.63 4.74 484 4.95 5.05 5.16 5.26 5.37 5.47 5.58 5.68 5.79 5.90
180___-_-------------- 6.00 6.10 6.21 6.30
4.14 4.25 4.35 4.46 4.56 4.6 4.76 4.86 497 5.08 5.18 5.28 5.39 5.49 5.59 190-__----------------
5.70 5.80 5.90 6.01 6.11 6.20 4.08 4.18 4.28 4.39 4.49 4.59 4.69 4.79 4.90 5.00.5.10 5.20 5.30 5.41 5.51 5.61
200-----------------__ 5.71 5.81 5.92 6.02 6.10
4.02 4 12 4 22 4 32 4.42 4.52 4.62 4.71 4 82 4.92 5.02 5.12 5.22 5.32 5.42 5.52 5.62 5.72 5.82 210________----_-___--
5.93 6.01 3.96 4 06 4.16 4.26 4 35 4.45 4.55 4.65 4.75 4.85 4.95 5.05 5.15 5.24 5.34 5.44 5.54 5.64 5.74 5.84 5.92

44 FRKTION FACTORS FOR LARGE CONDUITS FLOWING FULL
Where horseshoe conduits are to be considered, the Reynolds number is usually computed for an equivalent circular cross section, or it may be computed by substituting four times the hydraulic radius for D. In the case of rectangular conduits or rectangular air ducts flowing full, four times the hydraulic radius can safely be used for D, provided that the cross section is not extremely irregular and provided that the flow is turbulent. This practice would be greatly in error for viscous flow and questionable for flow at values of Reynolds number less than 500,000. The mean hydraulic radius has been selected as the length criterion for other than circular pipes on the supposition that the resistance for pipes of the same area is propor- tional to the fluid in contact with the pipe walls.
Roughness Coefficients Other Than f Some engineers are accustomed to evaluating
roughness of a pipe surface in terms of C in the Chezy formula or n in the Kutter and Manning expressions rather than with respect to the Darcy coefficient f. Although the Chezy formula will undoubtedly continue in use for some time for open-channel flow, it is losing ground rapidly in the field of closed conduits flowing full. The reason should be obvious after reviewing the method outlined in this monograph in which dy- namic similarity is maintained regardless of the fluid used and practically all plottings are ex- pressed in dimensionless terms.
The Chezy formula is
v=c&,
the Manning expression for 0 is
(2)
(3)
and the Kutter expression for C is
41.66+n - 1.811+0.00281
C= l+ 4l.,,,=j 5
(4)
6
The various roughness coefficients in the above formulas may be transferred to f by the following expressions:
f=$ in expression (2)
116.7n2 f= +3 - in expressions (3) and (4).
The dimensions in the above expressions are feet and seconds. In applying the latter expres- sion forf to both the Manning and Kutter formu- las, it is recognized that a small difference exists in the value of n. When it is considered, however, that the selection of n is usually dependent on the judgment and experience of the individual, the difference assumes little importance.
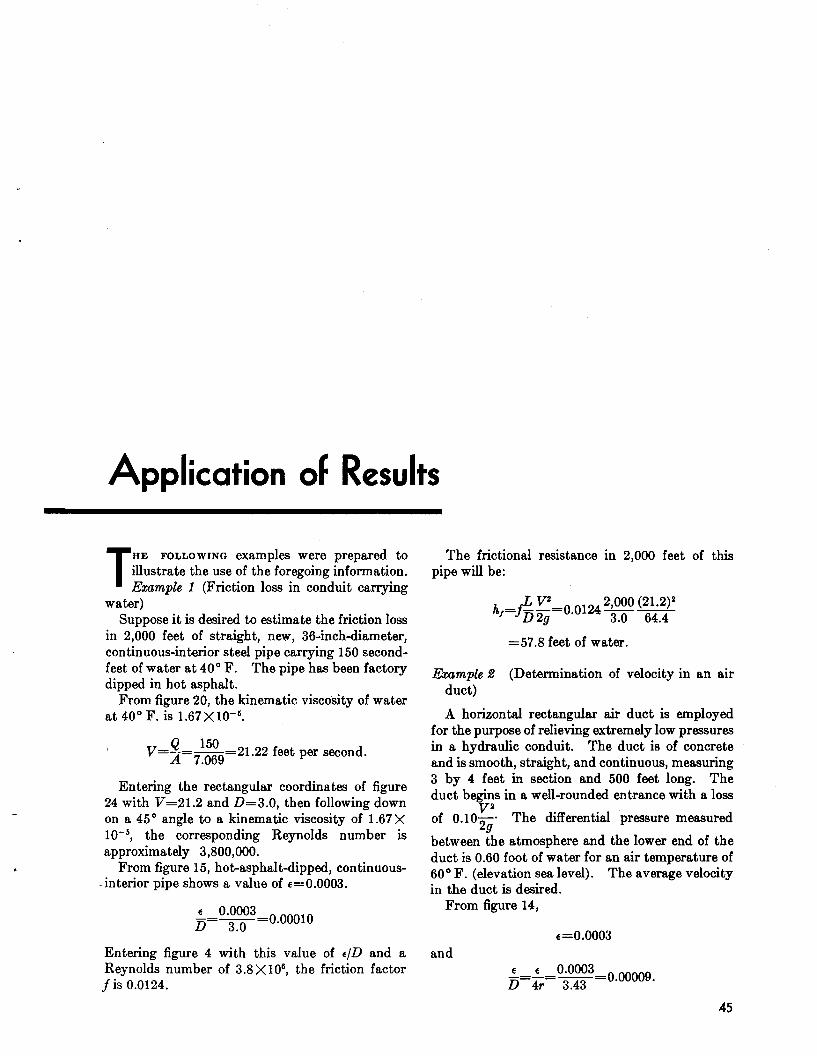
Application of Results
T HE FOLLOWING examples were prepared to illustrate the use of the foregoing information. Example 1 (Friction loss in conduit carrying
water) Suppose it is desired to estimate the friction loss
in 2,000 feet of straight, new, 36-inch-diameter, continuous-interior steel pipe carrying 150 second- feet of water at 40” F. The pipe has been factory dipped in hot asphalt.
From figure 20, the kinematic viscosity of water at 40” F. is 1.67X1O-6.
VA!= 150 -=21.22 feet per second. A 7.069
Entering the rectangular coordinates of figure 24 with V=21.2 and D=3.O, then following down on a 4.5’ angle to a kinematic viscosity of 1.67 X 10⁻⁵, the corresponding Reynolds number is approximately 3,800,OOO.
From figure 15, hot-asphalt-dipped, continuous- interior pipe shows a value of c=O.O003.
Ly+.00010 D .
Entering figure 4 with this value of a/D and a Reynolds number of 3.8 X 10⁶, the friction factor j is 0.0124.
The frictional resistance in 2,000 feet of this pipe will be:
=57.8 feet of water.
&le S (Determination of velocity in an air duct)
A horizontal rectangular air duct is employed for the purpose of relieving extremely low pressures in a hydraulic conduit. The duct is of concrete and is smooth, straight, and continuous, measuring 3 by 4 feet in section and 500 feet long. The duct begins in a well-rounded entrance with a loss
of O.lOy* The differential pressure measured 2g
between the atmosphere and the lower end of the duct is 0.60 foot of water for an air temperature of 60” F. (elevation sea level). The average velocity in the duct is desired.
From figure 14,
and e=0.0003
0.0003 A ir 3.43 -=-= -=0.00009.
45
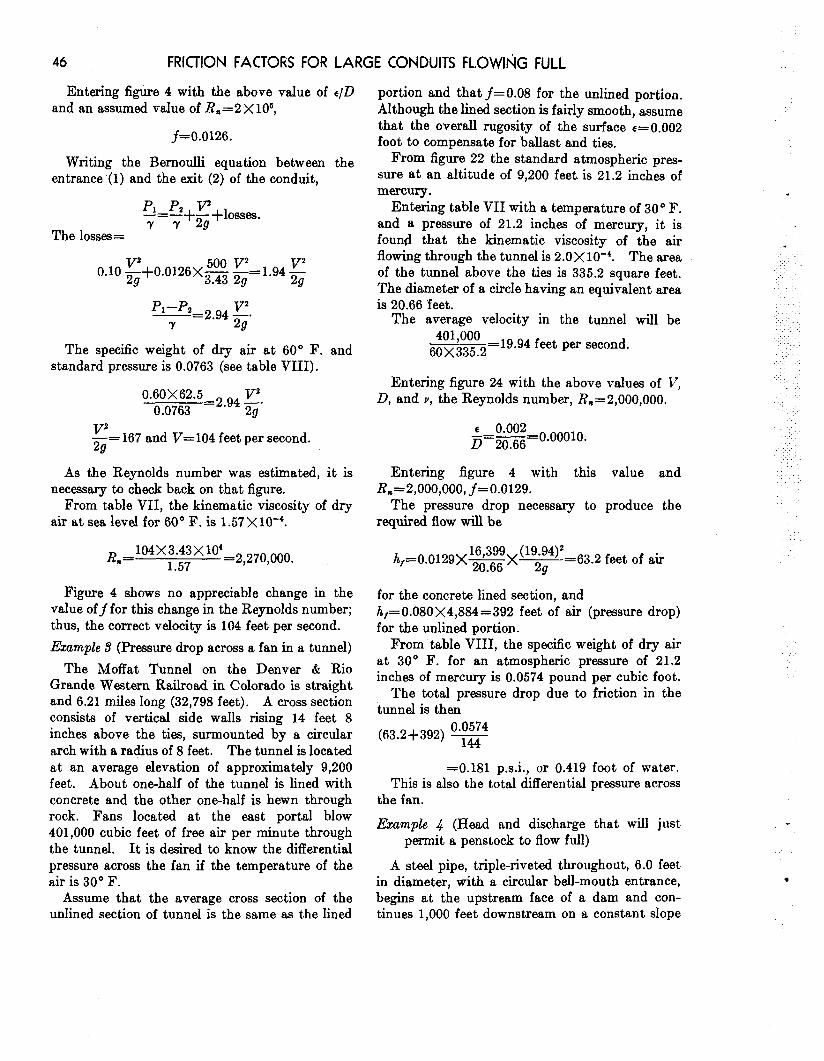
46 FRICTION FACTORS FOR LARGE CONDUITS FLOWItiG FULL
Entering figure 4 with the above value of c/D and an assumed value of R,=2X10⁶,
f=0.0126.
Writing the Bernoulli equation between the entrance (1) and the exit (2) of the conduit,
PI P2 v
The losses= y=y+G +1osses.
0.10 E+o.o126x= L.94 JY 3.43 2g 2g
PI --pz -=2.94 g. Y
The specific weight of dry air at 60” F. and standard pressure is 0.0763 (see table VIII).
y= 167 and V=104 feet per second. 29
As the Reynolds number was estimated, it is necessary to check back on that figure.
From table VII, the kinematic viscosity of dry air at sea level for 60” F. is 1.57 X10-‘.
R )I =1o4x3’43x1o4=2 270 000 1.57 , 9 *
Figure 4 shows no appreciable change in the value off for this change in the Reynolds number; thus, the correct velocity is 104 feet per second. Exumple S (Pressure drop across a fan in a tunnel)
The Moffat Tunnel on the Denver & Rio Grande Western Railroad in Colorado is straight and 6.21 miles long (32,798 feet). A cross section consists of vertical side walls rising 14 feet 8 inches above the ties, surmounted by a circular arch with a radius of 8 feet. The tunnel is located at an average elevation of approximately 9,200 feet. About one-half of the tunnel is lined with concrete and the other one-half is hewn through rock. Fans located at the east portal blow 401,000 cubic feet of free air per minute through the tunnel. It is desired to know the differential pressure across the fan if the temperature of the air is 30” F.
Assume that the average cross section of the unlined section of tunnel is the same as the lined
portion and that f=O.O8 for the unlined portion. Although the lined section is fairly smooth, assume that the overall rugosity of the surface C=O.OO~ foot to compensate for ballast and ties.
From figure 22 the standard atmospheric pres- sure at an altitude of 9,200 feet. is 21.2 inches of mercury.
Entering table VII with a temperature of 30° F. and a pressure of 21.2 inches of mercury, it is found that the kinematic viscosity of the air flowing through the tunnel is 2.0 X lo-‘. The area of the tunnel above the ties is 335.2 square feet. The diameter of a circle having an equivalent area is 20.66 feet.
e
:.’
:
The average velocity in the tunnel will be 401,000
60X335.2 =19.94 feet per second.
Entering figure 24 with the above values of V, D, and V, the Reynolds number, R,=~,OOO,OOO.
E 0.002 -=-=0.00010. D 20.66
. :
: , . : ( . .
‘_
Entering figure 4 with this value and R,=2,000,000, f=o.o129.
The pressure drop necessary to produce the required flow will be
: :
h =0 O129X’6~3ggX(1g~g4)z-63 / - 20.66 T- * 2 feet of air
for the concrete lined section, and h,=O.O80X4,884=392 feet of air (pressure drop) for the unlined portion.
From table VIII, the specific weight of dry air at 30“ F. for an atmospheric pressure of 21.2 inches of mercury is 0.0574 pound per cubic foot.
The total pressure drop due to friction in the tunnel is then
:
=0.181 p.s.i., or 0.419 foot of water. This is also the total differential pressure across
the fan.
Example 4 (Head and discharge that will just permit a penstock to flow full)
A steel pipe, triple-riveted throughout, 6.0 feet in diameter, with a circular bell-mouth entrance, begins at the upstream face of a dam and con- tinues 1,000 feet downstream on a constant slope

APPLICATION OF RESULTS 47
of 0.10. The surface has been protected with a brush coat asphalt similar to that shown in figure
When the friction slope equals the energy slope (which is 100 feet vertical in 1,000 feet horizontal),
13B. the pipe will just flow full. Assuming the entrance loss to be negligible, it
is desired to know the head on the entrance and the discharge which will just permit the tunnel to flow full throughout its entire length with water at 50” F.
Assuming values of : in the above expression,
the following values are obtained:
From figure 17, e=0.006 for this triple-riveted pipe, and
Assuming R,=20X10s, figure 4 shows j=O.O20. Writing the Bernoulli equation between the
entrance (1) and the exit (2) of the pipe:
70 39. 3 130.8 ---___-----_--__-___ 50 34.6 115.5 ____-___--__-_______ 40 32. 4 107.6 ________-___________ 30 30. 0 100 44.0 1,245
2 +P1=~+losses I- Y 2g
Thus, the head on the centerline of the entrance to the pipe will be 30 feet and the discharge 1,245 second-feet when the pipe just begins to flow full.
(-Jl()Xl ooo+Lv2+o 020x1’ooo IJ2 -- 9 Y2g’ 6 29
~~+p’z+3.33 v’ Y %l %l
Rechecking the friction factor for the discharge of 1,245 second-feet,
R I
-!?-44x6x105,18 ,(-JO ()o Y 1.41 , , -
p’+ 100 v* Y -=-. 2g 4.33
Figure 4 shows that the change in the Reynolds number does not affect the value of .f; thus, the above solution is correct.

,

Table A. Friction Tests of Concrete Pipe
Description and References
&we I.-Smooth cement surface; discharge rated by a current meter placed in the tailrace; about 10 percent of the line located on a small degree of curvature (r/D=30). About 5 percent subtracted from the overall measured losses as an estimate of entrance losses. The writers estimate that the plotted losses are about 1 percent greater than normal. This was a reliable test. (“Cor- renti Uniformi entro Grandi Condotte e Grandi Canah, Milano,” by Giuliode Marchi, Milan, Italy, 1932-36; Library Data File, USBR, 91-241.)
&rue I.-Smooth surface resulting from use of steel forms; discharge rated by Gibson method. The section measured was straight. The veloci- ties are probably 3 percent in error. Combining all errors, the friction factor was probably not more than 4 percent in error. (Transaeti, AXE, Vol. 101, 1936, p. 1409; also Library Data File, USBR, 91-241.)
Curve J.-Precast in steel forms 6 feet long; discharge rated by color movement, current meter, and Cipoletti weir. All joints were carefully talked on the inside. The alinement was straight. There was a gentle vertical bend near the inlet and one near the o,utlet. (Bulletin No. 852, by
Fred C. Scobey, USDA, Washington, D.C., 1924, p. 38.)
&rue /C.-Lining and the joints smooth; dis- charge rated by pitot tube. The alinement of the first section was nearly straight and there wss a gentle sinuous curve vertically in the second section. This pipe was precast in la-foot oiled steel forms. (Engineering News-Record, Apr. 29, 1926, p. 678.)
0urve B.-These experiments were reported by Basin to be “perfect in bore.” The ahnement was straight and the results indicate an unusually smooth pipe. (Bulletin No. 8J.6, USDA, Washing- ton, D.C., 1924, p. 79.)
Ourve 6.-Lining finished with a brush coat. The finish coat wore off on the bottom but brush marks were still visible on the sides. The approach and the alinement were straight. The inlet was rounded. The readings were taken during flood flows, the discharge being rated by current meter. (Transactions, ASCE, Vol. 93, 1929, p. 1588.)
Curve 7.-Lining finished with a brush coat. The finish coat wore off on the bottom but brush marks were still visible on the sides. The aline- ment was straight, the approach curved, and the
51
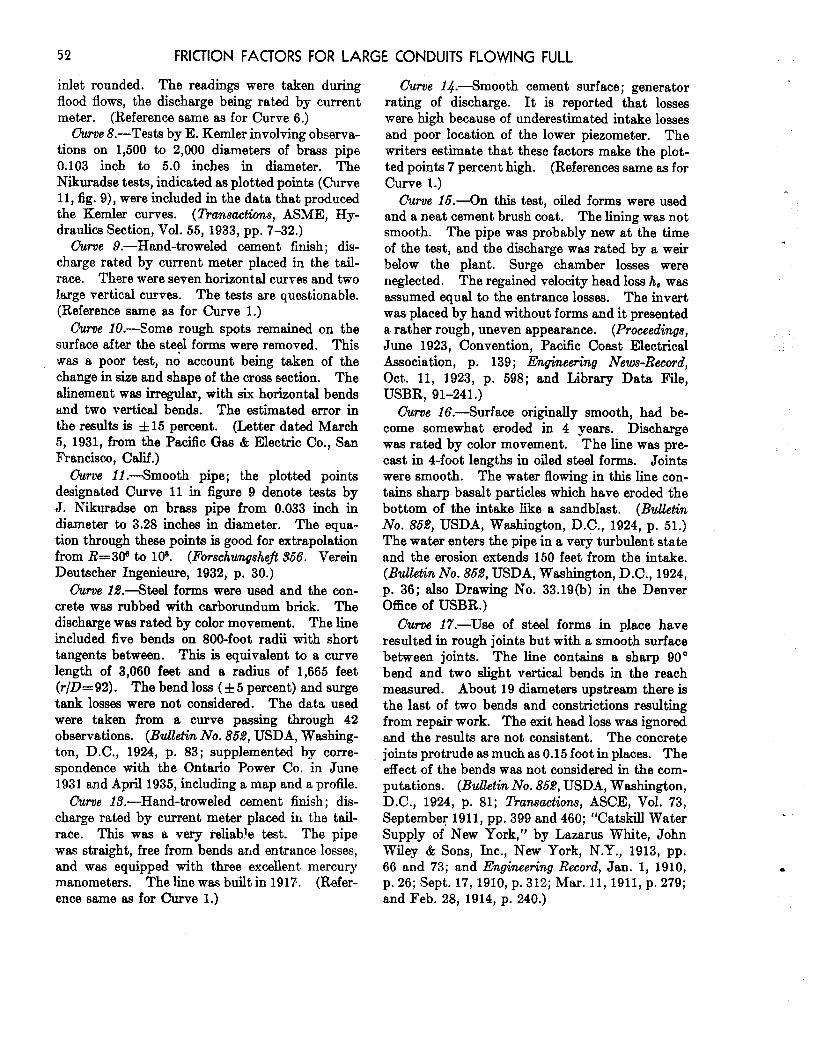
52 FRICTION FACTORS FOR LARGE CONDUITS FLOWING FULL
inlet rounded. The readings were taken during flood flows, the discharge being rated by current meter. (Reference same as for Curve 6.)
Curse &-Tests by E. Kemler involving observa- tions on 1,500 to 2,000 diameters of brass pipe 0.103 inch to 5.0 inches in diameter. The Nikuradse tests, indicated as plotted points (Curve 11, fig. S), were included in the data that produced the Kemler curves. (Transactions, ASME, Hy- draulics Section, Vol. 55, 1933, pp. 7-32.)
Curve Q.-Hand-troweled cement finish; dis- charge rated by current meter placed in the tail- race. There were seven horizontal curves and two loge vertical curves. The tests are questionable. (Reference same as for Curve 1.)
Ourve lo.---Some rough spots remained on the surface after the steel forms were removed. This was a poor test, nd account being taken of the change in size and shape of the cross section. The alinement was irregular, with six horizontal bends and two vertical bends. The estimated error in the results is f15 percent. (Letter dated March 5, 1931, from the Pacific Gas & Electric Co., San Francisco, Calif.)
Curve 11 .-Smooth pipe; the plotted pointa designated Curve 11 in figure 9 denote tests by J. Nikuradse on brass pipe from 0.033 inch in diameter to 3.28 inches in diameter. The equa- tion t.brough these points is good for extrapolation from R=306 to lo*. (Forschungsheft $66’. Verein Deutscher Ingenieure, 1932, p. 30.)
Curve i’S.-Steel forms were used and the con- crete was rubbed with carborundum brick. The discharge was rated by color movement. The line included five bends on 800-foot radii with short tangents between. This is equivalent to a curve length of 3,060 feet and a radius of 1,665 feet (r/D=92). The bend loss ( f 5 percent) and surge tank losses were not considered. The data used were taken from a curve passing through 42 observations. (B&et& No. 862, USDA, Washing- ton, D.C., 1924, p. 83; supplemented by corre- spondence with tbe Ontario Power Co. in June 1931 and April 1935, including a map and a profile.
Curve lS.-Hand-troweled cement finish; dis- charge rated by current meter placed in the tail- race. This was a very reliab!e test. The pipe was straight, free from bends and entrance losses, and was equipped with three excellent mercury manometers. The line was built in 1917. (Refer- ence same as for Curve 1.)
Curve 14.-Smooth cement surface; generator rating of discharge. It is reported that losses were high because of underestimated intake losses and poor location of the lower piezometer. The writers estimate that these factors make the plot- ted points 7 percent high. (References same as for Curve 1.)
Curve 16.-On this test, oiled forms were used and a neat cement brush coat. The lining was not smooth. The pipe was probably new at the time of the test, and the discharge was rated by a weir below the plant. Surge chamber losses were neglected. The regained velocity head loss h, was assumed equal to the entrance losses. The invert was placed by hand without forms and it’presented a rather rough, uneven appearance. (Proceedings, June 1923, Convention, Pacific Coast Electrical Association, p. 139; Enginekng News-Record, Oct. 11, 1923, p. 598; and Library Data File, USBR, 91-241.)
Curve 16.-Surface originally smooth, had be- come somewhat eroded in 4 years. Discharge was rated by color movement. The line was pre- cast in 4-foot lengths in oiled steel forms. Joints were smooth. The water flowing in this line con- tains sharp basalt particles which have eroded the bottom of the intake like a sandblast. (BuLktin No. 866, USDA, Washington, D.C., 1924, p. 51.) The water enters the pipe in a very turbulent state and the erosion extends 150 feet from the intake. (BuZZetin No. 8&?, USDA, Washington, D.C., 1924, p. 36; also Drawing No. 33.19(b) in the Denver Office of USBR.)
Curve 17.-Use of steel forms in place have resulted in rough joints but with a smooth surface between joints. The line contains a sharp 90” bend and two slight vertical bends in the reach measured. About 19 diameters upstream there is the last of two bends and constrictions resulting from repair work. The exit head loss was ignored and the results are not consistent. The concrete joints protrude as much as 0.15 foot in places. The effect of the bends was not considered in the com- putations. (Bulletin No. 852, USDA, Washington, D.C., 1924, p. 81; Trun.sactionq ASCE, Vol. 73, September 1911, pp. 399 and 460; “Catskill Water Supply of New York,” by Lazarus White, John Wiley & Sons, Inc., New York, N.Y., 1913, pp. 66 and 73; and Engineering Record, Jan. 1, 1910, p. 26; Sept. 17, 1910, p. 312; Mar. 11, 1911, p. 279; and Feb. 28, 1914, p. 240.)
.:
.
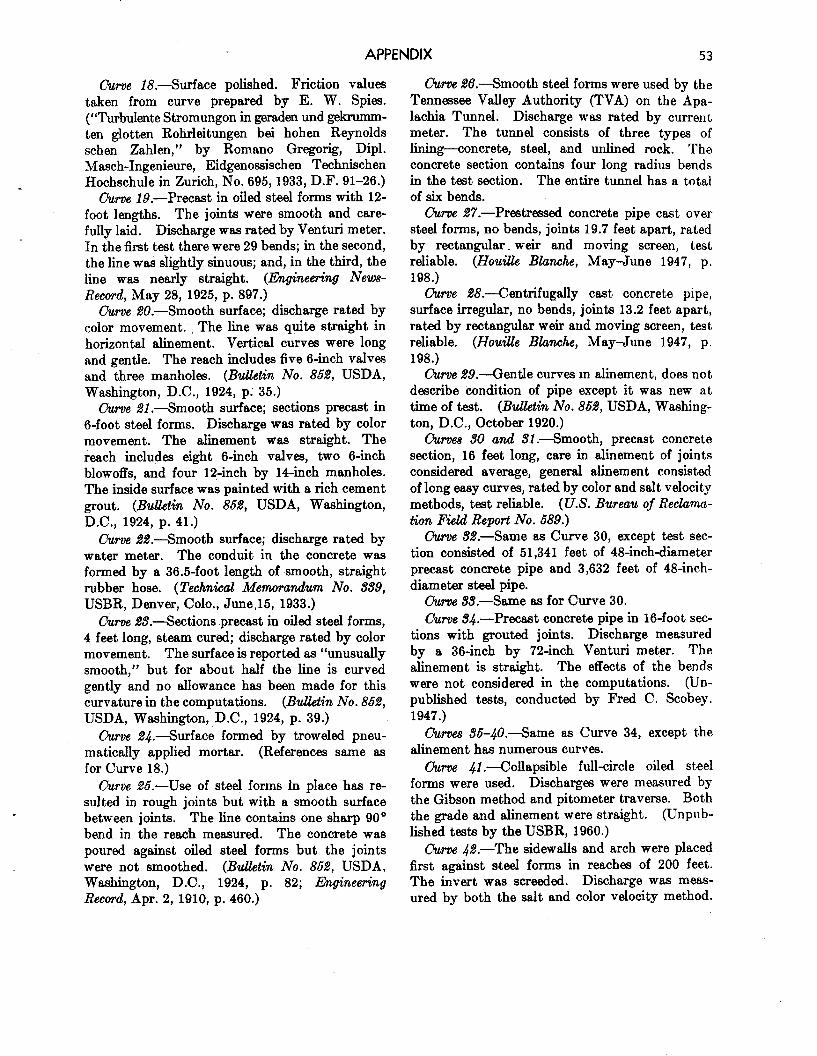
APPENDIX 53
OuTve 18.~Surface polished. Friction values taken from curve prepared by E. W. Spies. (“Turbulente Stromungon in geraden und gekrumm- ten glotten Rohrleitungen bei hohen Reynolds schen Zahlen,” by Roman0 Gregorig, Dipl. Masch-Ingenieure, Eidgenossischen Technischen Hochschule in Zurich, No. 695,1933, D.F. 91-26.)
&,rve 1,9.-Precast in oiled steel forms with 12- foot lengths. The joints were smooth and care- fully laid. Discharge was rated by Venturi meter. In the first test there were 29 bends; in the second, the line was slightly sinuous; and, in the third, the line was nearly straight. (Engineering New- Record, May 28, 1925, p. 897.)
0urve $?O.-Smooth surface; discharge rated by color movement. The line was quite straight in horizontal alinement. Vertical curves were long and gentle. The reach includes five 6-inch V&W and three manholes. (B&tin No. 852, USDA, Washington, D.C., 1924, p; 35.)
C%rve 21 .-Smooth surface; sections precast in 6-foot steel forms. Discharge was rated by color movement. The alinement was straight. The reach includes eight 6-inch valves, two 6-inch blowoffs, and four la-inch by 14inch manholes. The inside surface was painted with a rich cement grout. (Bulletin No. 852, USDA, Washington, D.C., 1924, p. 41.)
Uurve %?.-Smooth surface; discharge rated by water meter. The conduit in the concrete was formed by a 36.5-foot length of smooth, straight rubber hose. (Technical Memorandum No. 39, USBR, Denver, Colo., June, 15, 1933.)
0urve. &Ok-Sections precast in oiled steel forms, 4 feet long, steam cured; discharge rated by color movement. The surface is reported as “unusually smooth,” but for about half the line is curved gently and no allowance has been made for this curvature in the computations. (Bulletin No. 852, USDA, Washington, D.C., 1924, p. 39.)
Curve 24.-Surface formed by troweled pneu- matically applied mortar. (References same as for Curve 18.)
clurve 25.-Use of steel forms in place has re- sulted in rough joints but with a smooth surface between joints The line contains one sharp 90” bend in the reach measured. The concrete was poured against oiled steel forms but the joints were not smoothed. (Bulletin No. 852, USDA, Washington, D.C., 1924, p. 82; Engineering Record, Apr. 2, 1910, p. 460.)
f&se 26.-Smooth steel forms were used by the Tennessee Valley Authority (TVA) on the Apa- lachia Tunnel. Discharge was rated by current meter. The tunnel consists of three types of lining-concrete, steel, and unlined rock. The concrete section contains four long radius bends in the test section. The entire tunnel has a total of six bends.
Ourve 27.-Prestressed concrete pipe cast over steel forms, no bends, joints 19.7 feet apart, rated by rectangular. weir and moving screen, test reliable. (Hou%e Blanche, May-June 1947, p. 198.)
Curve 28.-Centrifugally cast concrete pipe, surface irregular, no bends, joints 13.2 feet apart, rated by rectangular weir and moving screen, test reliable. (Hou&k Blanche, May-June 1947, p. 198.)
Clue 29.-Gentle curves m alinement, does not describe condition of pipe except it was new at time of test. (B&tin No. 852, USDA, Washing- ton, D.C., October 1920.)
Qum 30 and Sl.-Smooth, precast concrete section, 16 feet long, care in alinement of joints considered average, general alinement consisted of long easy curves, rated by color and salt velocity methods, test reliable. (U.S. Bureau of Reclama- tion Field Report No. 589.)
Curve 32.-Same as Curve 30, except test sec- tion consisted of 51,341 feet of 48-inch-diameter precast concrete pipe and 3,632 feet of 4%inch- diameter steel pipe.
t%ve %.-Same as for Curve 30. Curve @.-Precast concrete pipe in 16-foot sec-
tions with grouted joints. Discharge measured by a 36-inch by 72-inch Venturi meter. The alinement is straight. The effects of the bends were not considered in the computations. (Un- published tests, conducted by Fred C. Scobey. 1947.)
Ccurvee S5-,$O.-Same as Curve 34, except the alinement has numerous curves.
&rue, 41 .-Collapsible full-circle oiled steel forms were used. Discharges were measured by the Gibson method and pitometer traverse. Both the grade and alinement were straight. (Unpnb- lished tests by the USBR, 1960.)
C!urve 42.-The sidewalk and arch were placed first against steel forms in reaches of 200 feet. The invert was screeded. Discharge was meas- ured by both the salt and color velocity method.
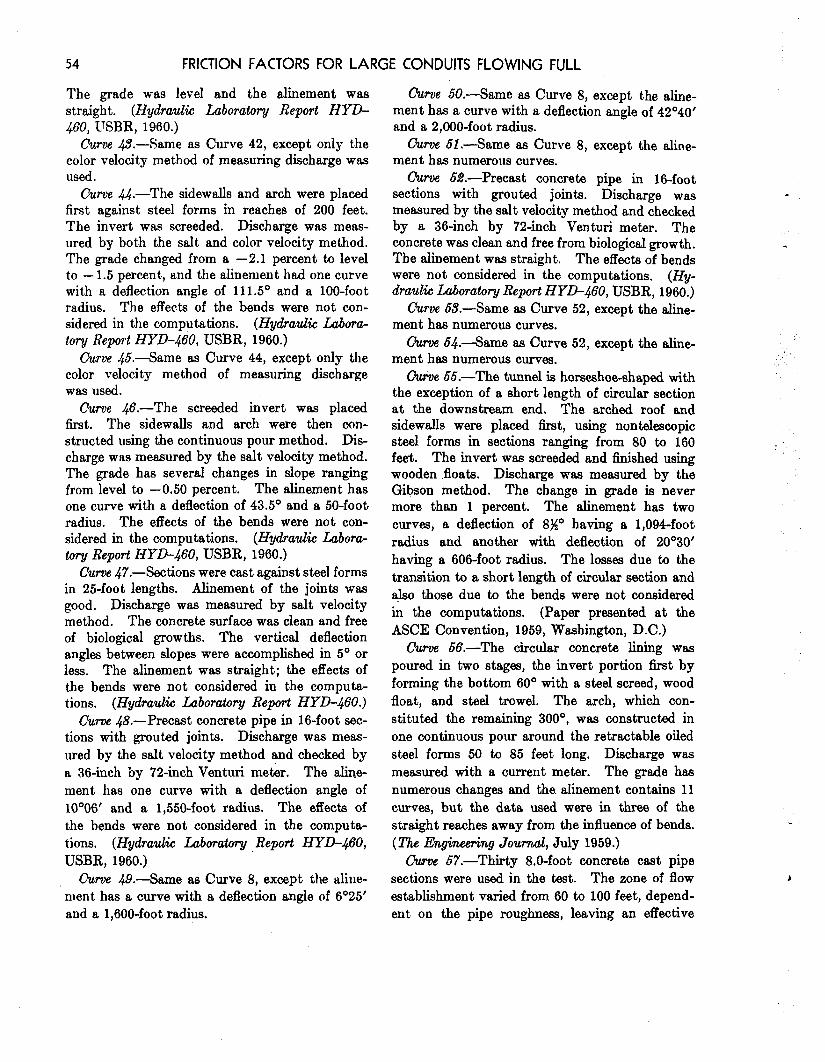
FRICTION FACTORS FOR LARGE CONDUITS FLOWING FULL
The grade was level and the alinement was &me 50.-Same as Curve 8, except t.he aline- straight. (Hydraulic Laboratory Report HYD- ment has a curve with a deflection angle of 42’40‘ 460, USBR, 1960.) and a 2,000-foot radius.
Curve @.---Same as Curve 42, except only the color velocity method of measuring discharge was used.
Chve 51.-Same as Curve 8, except the aline- ment has numerous curves.
Curve &-The sidewalls and arch were placed first against steel forms in reaches of 200 feet. The invert was screeded. Discharge was meas- ured by bot.h the salt and color velocity method. The grade changed from a -2.1 percent to level to - 1.5 percent, and the alinement had one curve with a deflection angle of 111.5O and a lOO-foot radius. The effects of the bends were not con- sidered in the computations. (Hydraulic Lubora- tory Report HYD-460, USBR, 1960.)
&rve b&-Precast concrete pipe in 16-foot sections with grouted joints. Discharge was measured by the salt velocity method and checked by a 36-inch by 7%inch Venturi meter. The concrete was clean and free from biological growth. The alinement was straight. The effects of bends were not considered in the computations. WY- drau& Laboratory Report HYD-460, USBR, 1960.)
Curve 5X-Same as Curve 52, except the aline- ment has numerous curves.
Curve 45.-Same as Curve 44, except only the color velocity method of measuring discharge was used.
Curve 54.-Same as Curve 52, except the aline- ment has numerous curves.
0urve 55.-The tunnel is horseshoe-shaped with
Curve 46.-The screeded invert was placed first. The sidewalls and arch were then con- structed using the continuous pour method. Dis- charge was measured by the salt velocity method. The grade has several changes in slope ranging from level to -0.50 percent. The alinement has one curve with a deflection of 43.5’ and a 50-foot radius. The effects of the bends were not con- sidered in the computations. (Hydraulic Labora- tory Report HYD-460, USBR, 1960.)
0urve 47.-Sections were cast against steel forms in 25-foot lengths. Alinement of the joints was good. Discharge was measured by salt velocity method. The concrete surface was clean and free of biological growths. The vertical deflection angles between slopes were accomplished in 5’ or less. The alinement was straight; the effects of the bends were not considered in the computa- tions. (Hydra&c Luboratmy Report HYD-460.)
Curve .J8.-Precast concrete pipe in 16-foot sec-
the exception of a short length of circular section at the downstream end. The arched roof and sidewalls were placed first, using nontelescopic steel forms in sections ranging from 80 to 160 feet. The invert was screeded and finished using wooden .floate. Discharge was measured by the Gibson method. The change in grade is never more than 1 percent. The alinement has two curves, a deflection of 8%” having a 1,094-foot radius and another with deflection of 20°30’ having a 606-foot radius. The losses due to the transition to a short length of circular section and +o those due to the bends were not considered in the computations. (Paper presented at the ASCE Convention, 1959, Washington, D.C.)
tions with grouted joints. Discharge was meas- ured by the salt velocity method and checked by a 36-inch by 7%inch Venturi met&. The aline- ment has one curve with a deflection angle of lO”O6’ and a 1,550-foot radius. The effects of the bends were not considered in the computa- tions. (Hydraulic Laboratory Report HYD-460, USBR, 1960.)
Curve 56.-The circular concrete lining was poured in two stages, the invert portion first by forming the bottom 60’ with a steel screed, wood float, and steel trowel. The arch, which con- stituted the remaining 300°, was constructed in one continuous pour around the retractable oiled steel forms 50 to 85 feet long. Discharge was measured with a current meter. The grade has numerous changes and the alinement contains 11 curves, but the data used were in three of the straight reaches away from the influence of bends. (The Engineering Jownal, July 1959.)
l?uve @.-Same as Curve 8, except the aline- merit has a curve with a deflection angle of 6’25’ and a 1,600-foot radius.
Ourve 57.-Thirty 8.0-foot concrete cast pipe sections were used in the test. The zone of flow establishment varied from 60 to 100 feet, depend- ent on the pipe roughness, leaving an effective
.

APPENDIX 55
length-of 140 to 180 feet for determination of the frictcon coefficients. Volumetric tanks were used
Curve 69.--Same as Curve 57, except the test section was tamped pipe.
to measure the discharge. The test reach was con- &roe GO.-Precast concrete pipe, 69-i ch inside strutted with “Average Joints,” joints that were diameter with trowelled mortar joints. simulated from measurements of field-installed 5
ischarge measurements were made by color-velocity using
pipe. Alinement and grade were straight. (Tech- pontacyl pink, a fluorometer, and a long,form nied Paper No. $8, Series B, St. Anthony Falls Venturi meter. The 102,967 feet of pipe used in Hydraulic Laboratory, University of Minnesota.) the measurements had been in service for about
t9t.w~ 68.-Same as Curve 57, except the test 15 years delivering municipa.1 water (Hydraulic section was tamped pipe. Laboratory Report No. HYD 885, USBR, 1968).
Table B. Friction Tests OF Continuous-Interior Steel Pipe
(Steel and Cast Iron)
Description and References
Curve I.-Lap-welded wrought steel pipe, bell- and-spigot joints, 17-foot lengths, coal-tar dipped; alinement straight; rated volumetrically and by Venturi mete-reliable test. (Curve 302, BdZe- tin No. 160, USDA, by Fred &obey, Washington, D.C., January 1930.)
0urse &-Lap-welded wrought steel pipe, bell- and-spigot joints, 19-foot lengths, coal-tar dipped; alinement straight; rated volumetrically and by Venturi meter-reliable test. (Curve 304, Bu.Ye- tin No. 160, USDA, by Scobey, Washington, D.C., January 1930.)
C%rwe b.-Bell-and-spigot joint steel pipe, coal- tar dipped ; alinement straight; rated by color method-reliable test. (Curve 308, &obey, USDA, Bud&in No, 150.)
0urse .&-Wrought steel pipe, patent joints, 20-foot lengths, coal-tar dipped; alinement straight; rated by Venturi meter-reliable test. (Curve 310, Scobey, USDA, BdZetin No. 160.)
Curre 6.-Coupling jointed, lap-welded steel pipe, asph.altrdipped; 36.5 percent of alinement on curves having radii of 100 to 717 feet; rated by Venturi meter-fair test. (Curve 312, Scobey, USDA, BuUetin No. 150.)
Curve G.-Full-welded steel pipe, made in 14- foot single plate sections, butt welded throughout, dipped in thin asphalt enamel; 11,000 feet of this pipe consists of 133 short curves on 14-foot chords, with greatest angle at any one pipe joint being 16’; aggregate of bends total 18 complete circles; rated by rectangular steel weir-reliable test. (Curve 313, Scobey, USDA, BuUetin No. 150.)
Curve 7.-Butt-joint riveted pipe (rivet heads countersunk); alinement straight; coated with hot asphalt and linseed oil, rated by weir and slide gate-fair test. (Curve 316, &obey, USDA, Bdletin No. 160.)
C&se 8.-But&joint riveted pipe (rivet heads countersunk) ; alinement straight; coated with hot asphalt and linseed oil, rated by weir and slide gate-fair test. (Curve 318, Scobey, USDA, Bdletin No. 160.)
tirve S.-Steel lock-bar pipe (continuous- interior) coated with mixture coal tar and asphalt; rated by Venturi meters-reliable test. (Curve 314, &obey, USDA, Bdktin No. 150.)
Curse IO.-Butt-welded longitudinal seams, girth seams hand lap welded every 14 feet; dipped in hot asphaltum; rated by Venturi meter- reliable test. (Curve 162, Scobey, USDA, BuUe- tin No. 160.)
Curve Il.--Same as for Curve 10. Curz~ l%.-Steel pipe, longitudinal joints welded,
girth joints belled and lead filled; coating in excel- lent condition; test section 19% diameters from P.I. of 55O vertical bend-fair test. (Marchetti, “Determinazioni sperimentati relative al moto uniforme nelle condotte forzate per forza motrice,” L’Energiu Eletirka, May, June, and August, 1934.)
Curse 1X-Lap-welded bump-joint pipe; test section contained two vertical bends of approxi- mately 20’ each ; rated by weir and current meter-fair test. (“Test of Friction Losses Made on Large Penstocks,” R. A. More, E.N.R., No. 15, 1923, p. 598.)
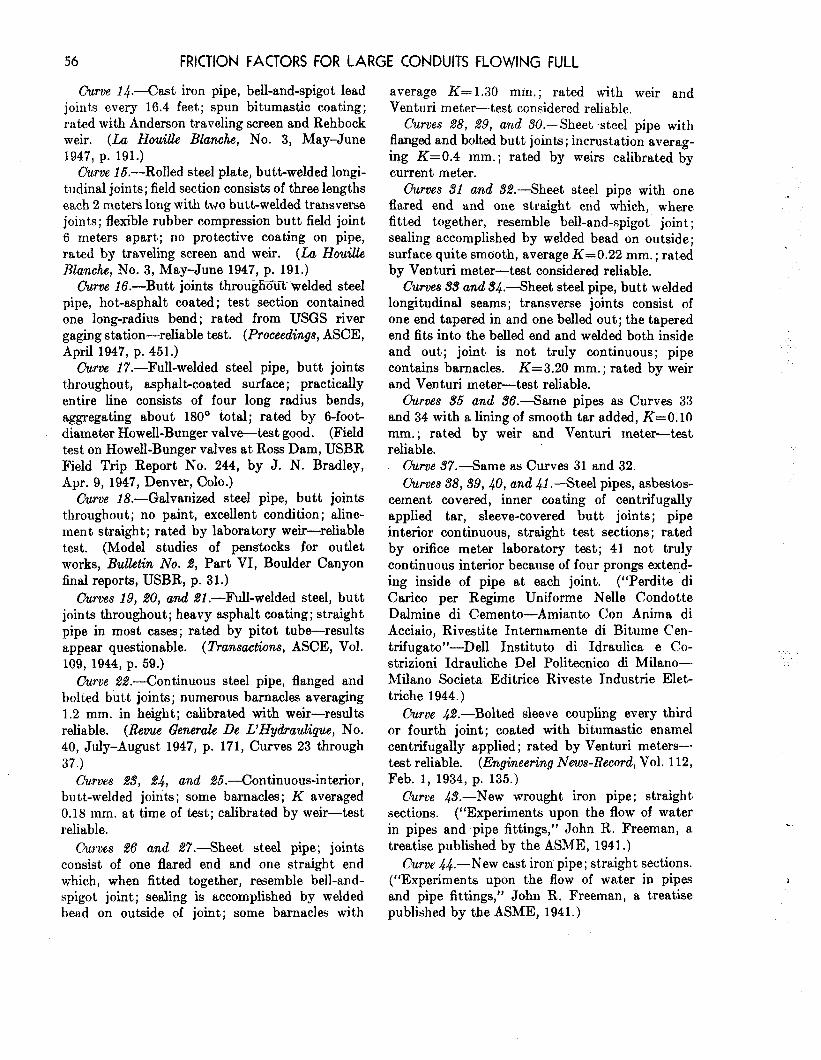
56 FRICTION FACTORS FOR LARGE CONDUITS FLOWING FULL
Curve I$.---Cast iron pipe, bell-and-spigot lead joints every 16.4 feet; spun bitumastic coating; rated with Anderson traveling screen and Rehbock weir. (La Houilk Blanche, No. 3, May-June 1947, p. 191.)
Curve I5.--Rolled steel plate, butt-welded longi- tudinal joints; field section consists of three lengths each 2 meters long with two butt-welded transverse joints; flexible rubber compression butt field joint 6 meters apart; no protective coating on pipe, rated by traveling screen and weir. (La HouiUe Blanche, No. 3, May-June 1947, p. 191.)
c”urve IS.--Butt joints througli%i~ welded steel pipe, hot-asphalt coated; test section contained one long-radius bend ; rated from USGS river gaging station-reliable test. (Proceedings, ASCE, April 1947, p. 451.)
Curve 17.-Full-welded steel pipe, butt joints t.hroughout, asphalt-coated surface; practically entire line consists of four long radius bends, aggregating about 180’ total; rated by 6-foot- diameter Howell-Bunger valve-test good. (Field test on Howell-Bunger valves at Ross Dam, USBR Field Trip Report No. 244, by J. N. Bradley, Apr. 9, 1947, Denver, Colo.)
Curve 18.-Galvanized steel pipe, butt joints throughout; no paint, excellent condition ; aline- men t straight ; rated by laboratory weir-reliable test. (Model studies of penstocks for outlet works, B&tin No. b, Part VI, Boulder Canyon final reports, USBR, p. 31.)
Curves 19, 20, and 81.-Full-welded steel, butt joints throughout; heavy asphalt coating; straight pipe in most cases; rated by pitot tube-results appear questionable. (Transactions, ASCE, Vol. 109, 1944, p. 59.)
Curve 22.-Continuous steel pipe, flanged and bolted butt joints; numerous barnacles averaging 1.2 mm. in height; calibrated with weir-results reliable. (Revue General De L’Hydrauhp, No. 40, July-August 1947, p. 171, Curves 23 through 37.)
Curves 23, 24, and 25.-Continuou.+interior, butt-welded joints; some barnacles; K averaged 0.18 mm. at time of test; calibrated by weir-test reliable.
Curues 26 and f27.--Sheet steel pipe; joints consist of one flared end and one straight end which, when fitted together, resemble bell-and- spigot joint; sealing is accomplished by welded bead on outside of joint; some barnacles with
average K=1.30 mm.; rated with weir and Venturi meter--test considered reliable.
Curves 28, 29, and SO.-Sheet -steel pipe with flanged and bolted butt joints; incrustation averag- ing K=0.4 mm.; rated by weirs calibrated by current meter.
Chrves 31 and %.--Sheet steel pipe with one flared end and one straight end which, where fitted together, resemble bell-and-spigot joint ; sealing accomplished by welded bead on outside; surface quite smooth, average K=0.22 mm. ; rated by Venturi meter-test considered reliable.
Curves 33 and Z&-Sheet steel pipe, butt welded longitudinal seams ; transverse joints consist of one end tapered in and one belled out; the tapered end fits into the belled end and welded both inside and out; joint is not truly continuous; pipe contains barnacles. K=3.20 mm.; rated by weir and Venturi meter-test reliable.
Curves S5 and 86.--Same pipes as Curves 33 and 34 with a lining of smooth tar added, K=O.lO mm. ; rated by weir and Venturi meter-test reliable.
Curve S7.-Same as Curves 31 and 32. Curves 58, 39, 40, and 41 .-Steel pipes, asbestos-
cement covered, inner coating of centrifugally applied tar, sleeve-covered butt joints; pipe interior continuous, straight test sections; rated by orifice meter laboratory test; 41 not truly continuous interior because of four prongs extend- ing inside of pipe at each joint. (“Perdite di Carico per Regime Uniforme Nelle Condotte Dalmine di Cemento-Amianto Con Anima di Acciaio, Rivestite Internamente di Bitume Cen- trifugato”-Dell Institute di Idraulica e Co- strizioni Idrauliche Del Politecnico di Milano- Milan0 Societa Editrice Riveste Tndustrie Elet- triche 1944.)
Curve @.-Bolted sleeve coupling every third or fourth joint; coated with bitumastic enamel centrifugally applied; rated by Venturi meters- test reliable. (Engineering News-Record, Vol. 112, Feb. 1, 1934, p. 135.)
Curve @.-New wrought iron pipe; straight, sections. (“Experiments upon the flow of water in pipes and pipe fittings,” John R. Freeman, a treatise published by the ASME, 1941.)
Curve &.-New cnst iron pipe; straight sections. (“Experiments upon the flow of water in pipes and pipe fittings,” John R. Freeman, a treatise published by the ASME, 1941.)
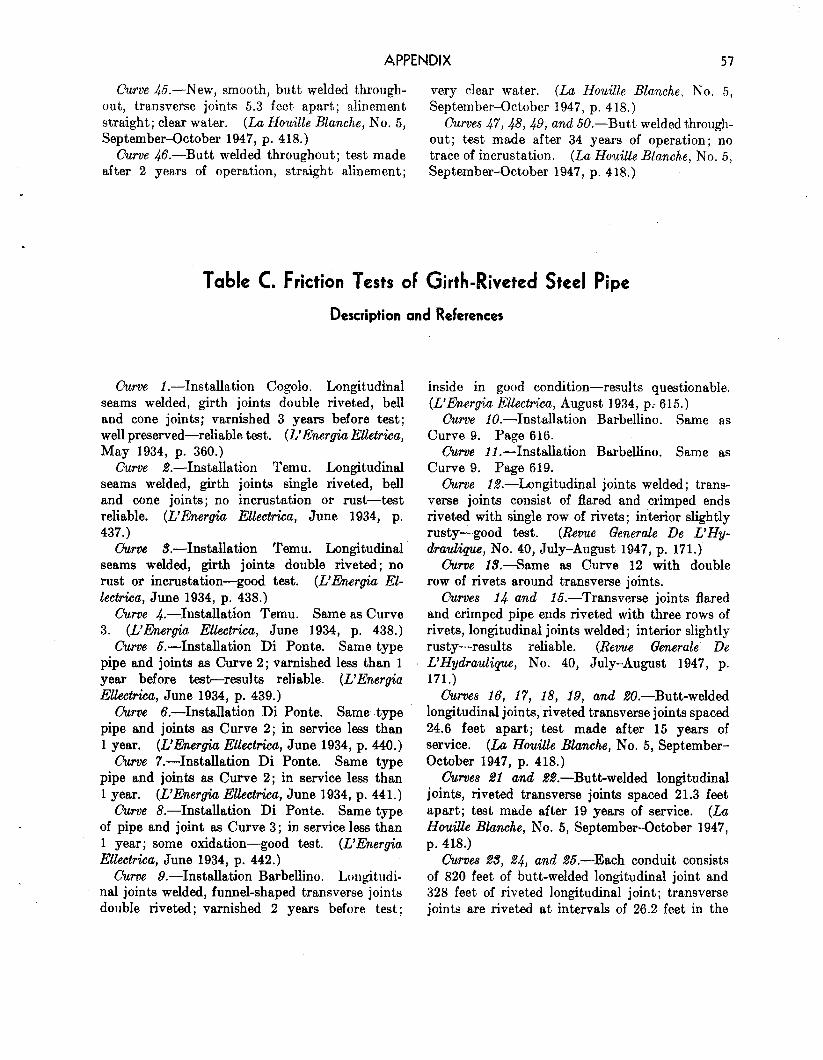
APPENDIX 57
Curve 45.-New, smooth, butt welded through- very clear water. (La HouiXe Blanche, No. 5, out, transverse joints 5.3 feet’ apart; alinement, September-Qctober 1947, p. 4 18.) straight; clear water. (La Houille Blanch.e, No. 5, Curves 47, 48, 49, and 50.-But,t welded through- September-October 1947, p. 418.) out; test made after 34 years of operation; no
Curve &.-Butt welded throughout; test made trace of incrustation. (La Houille .Blanch,e, No. 5, after 2 years of operation, straight alinement; September-October 1947, p. 418.)
Table C. Friction Tests OF Girth-Riveted Steel Pipe
Description and References
Curve 1.-Installation Cogolo. Longitudinal seams welded, girth joints double riveted, bell and cone joints; varnished 3 years before test; well preserved-reliable test. (L’Energia Etietrica, May 1934, p. 360.)
Curve S.-Installation Temu. Longitudinal seams welded, girth joints single riveted, bell and cone joints; no incrustation or rust-test reliable. (L’Energia Ellectrica, June 1934, p. 437.)
Curve S.-Installation Temu. Longitudinal seams welded, girth joints double riveted ; no rust or incrustation-good test. (L,&terg&z El- lectrica, June 1934, p. 438.)
Curve .&-Installation Temu. Same as Curve 3. (L’Emrgia Ellectrka, June 1934, p. 438.)
Curve 6.-Installation Di Ponte. Same type pipe and joints as Curve 2; varnished less than 1 year before test-results reliable. (L’Energia Ellectrka, June 1934, p. 439.)
Curve e.-Installation Di Ponte. Same type pipe and joints as Curve 2; in service less than 1 year. (L’Energia EUectrica, June 1934, p. 440.)
Curve 7.-Installation Di Ponte. Same type pipe and joints as Curve 2 ; in service less than 1 year. (L’Energ&z El&t&a, June 1934, p. 441.)
Curve &-Installation Di Ponte. Same type of pipe and joint as Curve 3; in service less than 1 year; some oxidation-good test. (L’Energk Ellectriea, June 1934, p. 442.)
Curve $.-Installation Barbellino. Longitudi- nal joints welded, funnel-shaped transverse joints double riveted; varnished 2 years before test;
inside in good condition-results questionable. (L’Energia Elleetrica, August 1934, p.- 615.)
Curve IO.-Installation Barbellino. Same as Curve 9. Page 616.
Curve 11 .-Installation Barbellino. Same as Curve 9. Page 619.
Curve lb.-Longitudinal joints welded; trans- verse joints consist of flared and crimped ends riveted with single row of rivets; interior slightly rusty-good test. (Revue Generale De L’Hy- drau&p, No. 40, July-August 1947, p. 171.)
Curve f&--Same as Curve 12 with double row of rivets around transverse joints.
Curves 14 and 15.-Transverse joints flared and crimped pipe ends riveted with three rows of rivets, longitudinal joints welded; interior slightly rusty-results reliable. (Revue Generale De L’Hydraulip, No. 40, July-August 1947, p. 171.)
Curves 16, 17, 18, 19, and ZO.-Butt-welded longitudinal joints, riveted transverse joints spaced 24.6 feet apart; test made after 15 years of service. (La Houille Blamhe, No. 5, September- October 1947, p. 418.)
Curves 21 and H.-Butt-welded longitudinal joints, riveted transverse joints spaced 21.3 feet apart; test made after 19 years of service. (La HouiUe Blanche, No. 5, September-October 1947, p. 41.8.)
Curves S’S, 24, and .??5.-Each conduit consists of 820 feet of butt-welded longitudinal joint and 328 feet of riveted longitudinal joint; transverse joints are riveted at intervals of 26.2 feet in the
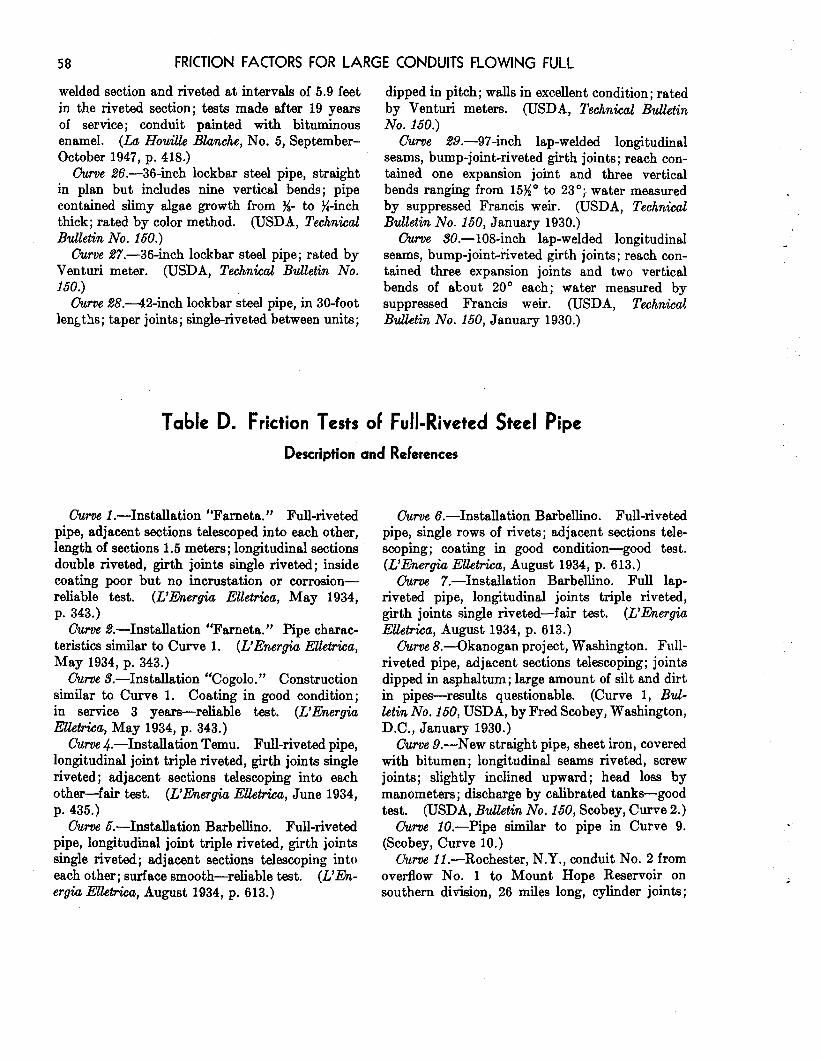
58 FRICTION FACTORS FOR LARGE CONDUITS FLOWING FULL
welded section and riveted at intervals of 5.9 feet in the riveted section; tests made after 19 years of service; conduit painted with bituminous enamel. (Lfz Houiue Blanche, No. 5, September- October 1947, p. 418.)
Curve %6.-36-&h lockbar steel pipe, straight in plan but includes nine vertical bends; pipe contained slimy algae growth from s- to %-inch thick; rated by color method. (USDA, Technical Bdletin No. 160.)
Curve 27.-36-&h lockbar steel pipe; rated by Venturi meter. (USDA, Technical Bulletin No. 160.)
C-urve ,98.42-inch lockbar steel pipe, in 30-foot lengths; taper joints; single-riveted between units;
dipped in pitch; walls in excellent condition; rated by Venturi meters. (USDA, Technical Bulletin No. 160.)
0urve 29.-97-inch lap-welded longitudinal seams, bump-joint-riveted girth joints; reach con- tained one expansion joint and three vertical bends ranging from 15%” to 23 ‘; water measured by suppressed Francis weir. (USDA, Technical Bulletin No. 160, January 1930.)
Curve SO.-108~inch lap-welded longitudinal seams, bump-joint-riveted girth joints; reach con- tained three expansion joints and two vertical bends of about 20’ each; water measured by suppressed Francis weir. (USDA, Tech&d B&tin No. 150, January 1930.)
Table D. Friction Tests of Full-Riveted Steel Pipe
Description and References
Curve 1 .-Installation ‘Farneta.” Full-riveted pipe, adjacent sections telescoped into each other, length of sections 1.5 meters; longitudinal sections double riveted, girth joints single riveted; inside coating poor but no incrustation or corrosion- reliable test. (L’Energia Elletrica, May 1934, p. 343.)
Curve %-Installation “Farneta.” Pipe charac- teristics similar to Curve 1. (L’Energia EUetrica, May 1934, p. 343.)
Curve Z-Installation “Cogolo.” Construction similar to Curve 1. Coating in good condition; in service 3 years-reliable test. (L’Energiu Elletrica, May 1934, p. 343.)
Curve 4.-Installation Temu. Full-riveted pipe, longitudinal joint triple riveted, girth joints single riveted; adjacent sections telescoping into each other-fair test. (L’Energiu Elletrica, June 1934, p. 435.)
Curve &.-Installation Barbellino. Full-riveted pipe, longitudinal joint triple riveted, girth joints single riveted; adjacent sections telescoping into each other; surface smooth-reliable test. (L’En- ergia E&trica, August 1934, p. 613.)
Curve 6.-Installation Barbellino. Full-riveted pipe, single rows of rivets; adjacent sections tele- scoping; coating in good condition-good test. (L’Energia EUetrica, August 1934, p. 613.)
&roe 7.-Installation Barbellino. Full lap- riveted pipe, longitudinal joints triple riveted, girth joints single riveted-fair test. (L’Energiu EUetrka, August 1934, p. 613.)
Curve 8.-Okanogan project, Washington. Full- riveted pipe, adjacent sections telescoping; joints dipped in asphalturn; large amount of silt and dirt in pipes-results questionable. (Curve 1, Bd- letin No. 160, USDA, by Fred &obey, Washington, D.C., January 1930.)
Curve 9.-New straight pipe, sheet iron, covered with bitumen; longitudinal seams riveted, screw joints; slightly inclined upward; head loss by manometers; discharge by calibrated tanks-good test. (USDA, Bulletin No. 160, Scobey, Curve 2.)
Curve IO.-Pipe similar to pipe in Curve 9. (Scobey, Curve 10.)
&rue Il.-Rochester, N.Y., conduit No. 2 from overflow No. 1 to Mount Hope Reservoir on southern division, 26 miles long, cylinder joints;
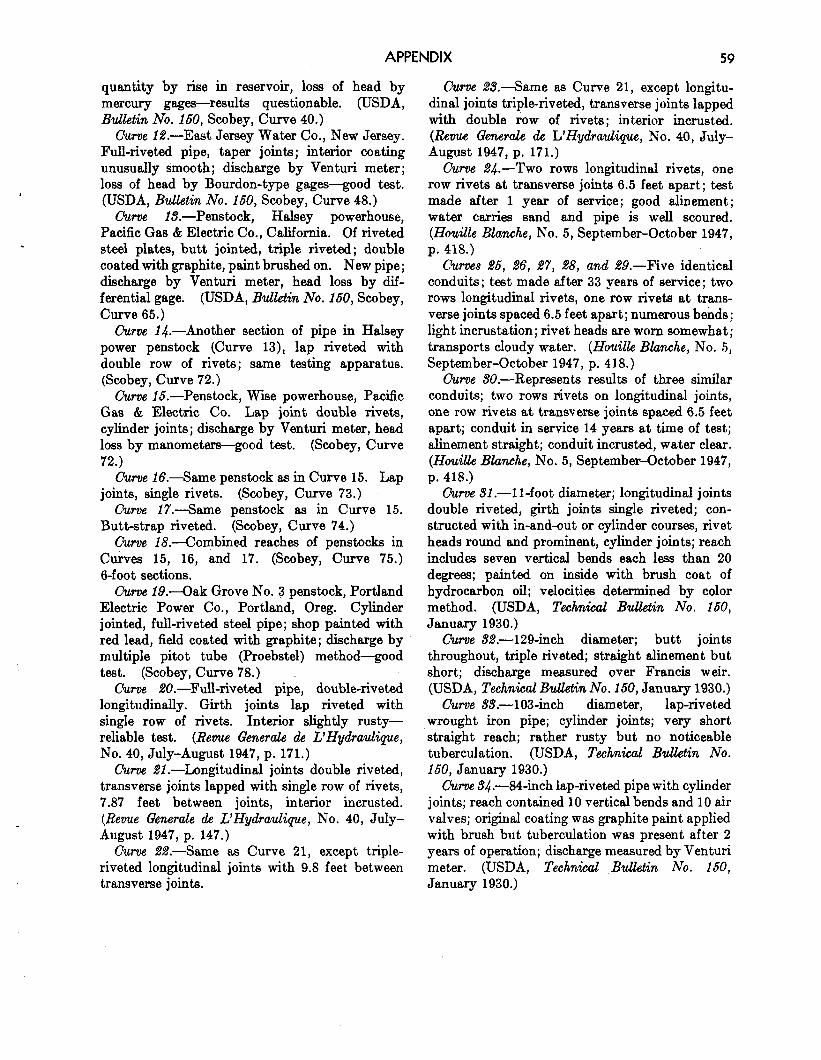
APPENDIX 59
quantity by rise in reservoir, loss of head by mercury gages-results questionable. (USDA, Bu.?letin No. 160, &obey, Curve 40.)
Curee Id.-East Jersey Water Co., New Jersey. Full-riveted pipe, taper joints; interior coating unusually s;mooth ; discharge by Venturi meter; loss of head by Bourdon-type gages-good test. (USDA, Bulletin No. 160, Scobey, Curve 48.)
Curve lb.-Penstock, Halsey powerhouse, Pacific Gas & Electric Co., California. Of riveted steel plates, butt jointed, triple riveted; double coated with graphite, paint brushed on. New pipe; discharge by Venturi meter, head loss by dif- ferential gage. (USDA, Bulletin No. 160, &obey, Curve 65.)
Curve 14.-Another section of pipe in Halsey power penstock (Curve 13), lap riveted with double row of rivets; same testing apparatus. (Scobey, Curve 72.)
Curve 15.-Penstock, Wise powerhouse, Pacific Gas & Electric Co. Lap joint double rivets, cylinder joints; discharge by Venturi meter, head loss by manometers-good test. @obey, Curve 72.)
Curve lB.-Same penstock as in Curve 15. Lap joints, single rivets. (Scobey, Curve 73.)
CTurve 17.-Same penstock as in Curve 15. Butt-strap riveted. (&obey, Curve 74.)
Curve lg.-Combined reaches of penstocks in Curves 15, 16, and 17. (Scobey, Curve 75.) 6-foot sections.
Qume lg.-Oak Grove No. 3 penstock, Portland Electric Power Co., Portland, Oreg. Cylinder jointed, full-riveted steel pipe; shop painted with red lead, field coated with graphite; discharge by multiple pitot tube (Proebstel) method-good test. (Scobey, Curve 78.)
Curve !ZO.-Full-riveted pipe, double-riveted longitudinally. Girth joints lap riveted with single row of rivets. Interior slightly rusty- reliable test. (Revue Generale de L’Hydraulique, No. 40, July-August 1947, p. 171.)
Curve 61.-Longitudinal joints double riveted, transverse joints lapped with single row of rivets, 7.87 feet between joints, interior incrusted. (Revue Generale de L’Hydraulique, No. 40, July- August 1947, p. 147.)
Curve %&-Same as Curve 21, except triple- riveted longitudinal joints with 9.8 feet between transverse joints.
Curve M.-Same as Curve 21, except longitu- dinal joints triple-riveted, transverse joints lapped with double row of rivets; interior incrusted. (Revue Generale de L’Hydrau&que, No. 40, July- August 1947, p. 171.)
Curve 24.-Two rows longitudinal rivets, one row rivets at transverse joints 6.5 feet apart; test made after 1 year of service ; good alinement ; water carries sand and pipe is well scoured. (Houille Blanche, No. 5, Sept,ember-October 1947, p. 418.)
Curves 25, 66, 27, 28, and ZT’9.-Five identical conduits ; test made after 33 years of service; two rows longitudinal rivets, one row rivets at trans- verse joints spaced 6.5 feet apart; numerous bends; light incrustation; rivet heads are worn s0mewha.t; transp0rt.s cloudy water. (Houilk Blanche, No. 6, September-October 1947, p. 4 18.)
&rue SO.-Represents results of three similar conduits; two rows tivets on longitudinal joints, one row rivets at transverse joints spaced 6.5 feet apart; conduit in service 14 years at time of test; alinement straight; conduit incrusted, water clear. (Howilk BZanche, No. 5, September-October 1947, p. 418.)
0urve 31.-l l-foot diameter; longitudinal joints double riveted, girth joints single riveted; con- structed with in-and-out or cylinder courses, rivet heads round and prominent, cylinder joints; reach includes seven vertical bends each less than 20 degrees; painted on inside with brush coat of hydrocarbon oil; velocities determined by color method. (USDA, Technical Bulletin No. 150, January 1930.)
oumte %?.-129-&h diameter; butt joints throughout, triple riveted; straight alinement but short; discharge measured over Francis weir. (USDA, Technical BvUetin No. 150, January 1930.)
Curve 35.-103-&h diameter, lap-riveted wrought iron pipe; cylinder joints; very short straight reach; rather rusty but no noticeable tuberculation. (USDA, Technical Bulletin No. 150, January 1930.)
Curve %$..--84~inch lap-riveted pipe with cylinder joints; reach contained 10 vertical bends and 10 air valves; original coating was graphite paint applied with brush but tuberculation was present after 2 years of operation; discharge measured by Venturi meter. (USDA, Technical Bulletin No. 150, January 1930.)
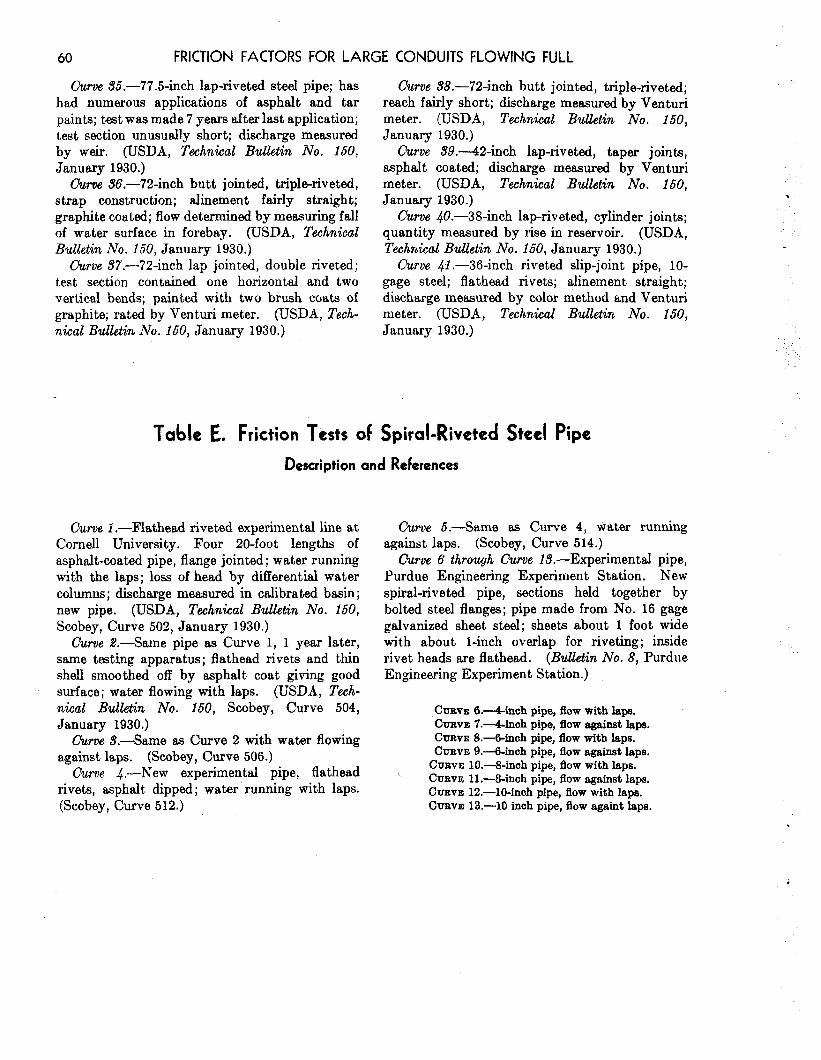
60 FRICTION FACTORS FOR LARGE CONDUITS FLOWING FULL
Curve 35.-77.5inch lap-riveted steel pipe; has had numerous applications of asphalt and tar paints; test was made 7 years after last application; test section unusually short; discharge measured by weir. (USDA, Technical Bulktin No. 150, January 1930.)
&-re 36.-72-inch butt jointed, triple-riveted, strap construction; alinement fairly straight; graphite coated; flow determined by measuring fall of water surface in forebay. (USDA, Technical Bulletin No. 160, January 1930.)
Curve S7.-72-inch lap jointed, double riveted; test section contained one horizontal and two vertical bends; painted with two brush coats of graphite; rated by Venturi meter. (USDA, Tech- nical Bulletin No. 150, January 1930.)
Curve J8.-72-inch butt jointed, triple-riveted; reach fairly short; discharge measured by Venturi meter. (USDA, Techmid Bdletin No. 150, January 1930.)
Curve 39.--42-inch lap-riveted, taper joints, asphalt coated; discharge measured by Venturi meter. (USDA, Technical Bulletin No. 150, January 1930.)
Curve do.-3%inch lap-riveted, cylinder joints; quantity measured by rise in reservoir. (USDA, Technical BuUetin No. 150, January 1930.)
Curve kl.-36-inch riveted slip-joint pipe, lo- gage steel; flathead rivets; alinement straight; discharge measured by color method and Venturi meter. (USDA, Technical Bulletin No. 150, January 1930.)
Table E. Friction Tests of Spiral-Riveted Steel Pipe
Description and References
Curve 1 .-Flathead riveted experimental line at Cornell University. Four 20-foot lengths of asphalt-coated pipe, flange jointed; water running with the laps; loss of head by differential water columns; discharge measured in calibrated basin ; new pipe. (USDA, Technical Bulletin No. 150, Scobey, Curve 502, January 1930.)
Curve .%?.--Same pipe as Curve 1, 1 year later, same testing apparatus; flathead rivets and thin shell smoothed off by asphalt coat giving good surface; water flowing with laps. (USDA, Tech- nical Bulletin No. 150, Scobey, Curve 504, January 1930.)
Curve S.-Same as Curve 2 with water flowing against laps. (Scobey, Curve 506.)
Curve d.---New experimental pipe, flathead rivets, asphalt dipped; water running with laps. (Scobey, Curve 512.)
Curve 5.-Same as Curve 4, water running against laps. (Scobey, Curve 514.)
0ume 6 through Curve Id.-Experimental pipe, Purdue Engineering Experiment Station. New spiral-riveted pipe, sections held together by bolted steel flanges; pipe made from No. 16 gage galvanized sheet steel; sheets about 1 foot wide with about l-inch overlap for riveting; inside rivet heads are flathead. (Bulletin No. 8, Purdue Engineering Experiment Station.)
CURVE &-4-&h pipe, flow with laps. CURVE 7.-4&mh pipe, flow against laps. CURVE EL-t3-inch pipe, flow with laps. Cnav~ 9.-6-inch pipe, flow against laps.
CURVE 10.-Sinch pipe, flow with laps. CURVE Il.--&inch pipe, flow against laps. CURVE 12.-lo-inch pipe, flow with laps. CURVE 13.-10 inch pipe, flow againt laps.
: :’ ‘.

APPENDIX
Table F. Friction Tests of Wood-Stave Pipe
Description and References
61
Curve 1 .--Continuous wood-stave pipe of Doug- las fir; gentle horizontal curves, no vertical curves; velocity obtained by color method. (USDA, Professionul Paper No. 376, November 1916.)
Curve %-Continuous wood-stave pipe, Doug- las fir; gentle horizontal bends, no vertical bends, water free of sediment; discharge measured by submerged round-crested weir and current meter. (USDA, Professional Paper No. 376, November 1916.)
Curve S.-Continuous wood-stave pipe, Doug- las fir; gentle horizontal and vertical curves, water free of sediment; velocity by color method and current meter. (USDA, Professhmal Paper No. 376, November 1916.)
Curvy 4 and 5.-Continuous stave pipe, fir; numerous horizontal and vertical curves but not excessively sharp; discharge measured by Venturi meter. (USDA, Professional Paper No. 9’6, November 1916.)
Curves 6 and 7.-Continuous wood-stave pipe, Douglas fir; inside surface unusually smooth; continuous downslope alinement; discharge mea- sured by 18-foot weir. (USDA, Professional Paper No. 376, November 1916.)
Ccurve 8.-C!ontinuous stave fir pipe; gentle curves joined by short tangents, minimum radius
of curvature 289 feet; pipe laid on even gradient with one exception; growths of spongilla in scat- tered bunches on inside surface of pipe, each mea- suring about one-fourth square inch in area and projecting about three-sixteenth inch; growth was not present on bottom; rated by current meter. (USDA, ProfessionuJ Paper No. 376, November 1916.)
Curve O.--Continuous wood-stave pipe, Doug- las fir; inside surface unusually smooth; continuous downslope alinement; discharge measured by 1% foot weir. (USDA, Professional Paper No. 37'6, November 1916.)
Ourve IO.-Continuous stave redwood pipe; smooth, new inverted siphon with steep legs joined by vertical curve; high velocity prevents accumula- tion of silt; rated by color method and current meter. (USDA, Professional Paper No. 3'6, November 1916.)
Ourve 1 I.-Continuous stave fir pipe, practically straight; no growth in pipe; rated by current meter. (USDA, Professional Paper No. 376, November 1916.)
Curves l,?? and lS.---Continuous stave Douglas fir pipe, practically straight; rated by 6-foot Cipol- letti weir and current meter; friction loss rather high. (USDA Professional Paper No. 376, November 1916.)
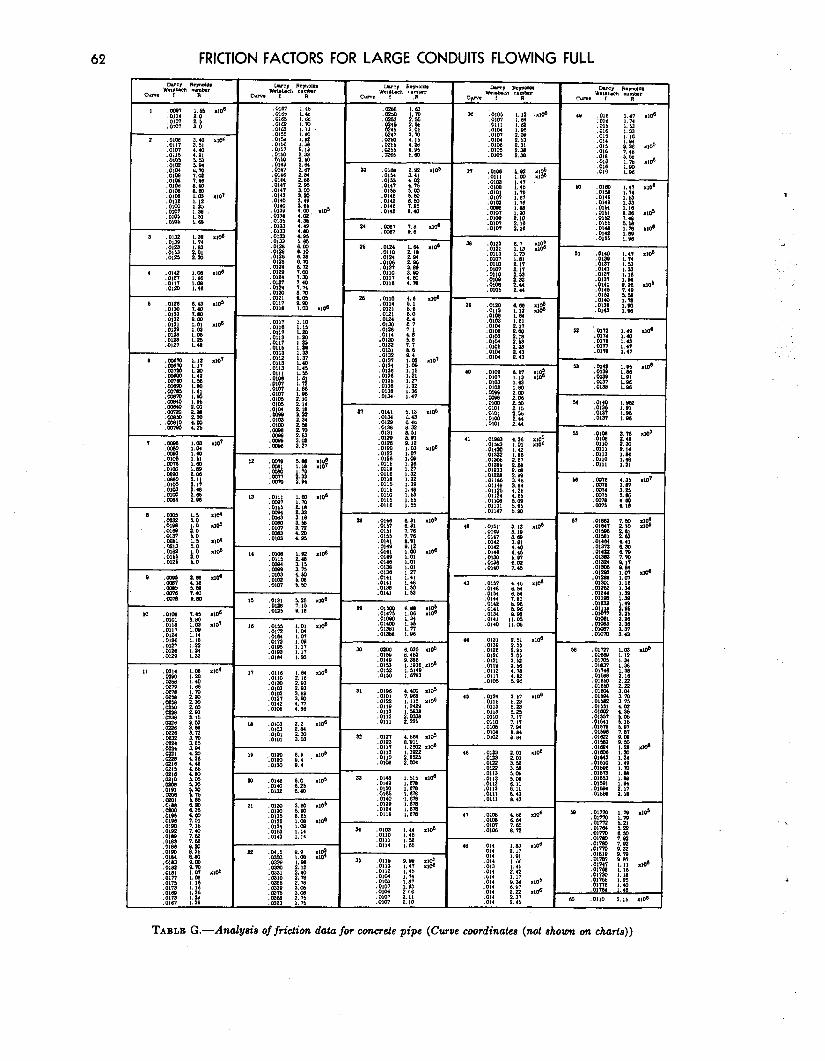
62 FRICTION FACTORS FOR LARGE CONDUITS FLOWING FULL I- -
, I :fE :::* .lO( :8!E ::Lt
. .
TABLE G .-Analysis of friction datu for concrete pipe (Curve coordinates (not shown on charts))

APPENDIX
TABLE H.-Analysis of friction data for continuous-interior steel pipe (Curve coordinates (not shown on charts))
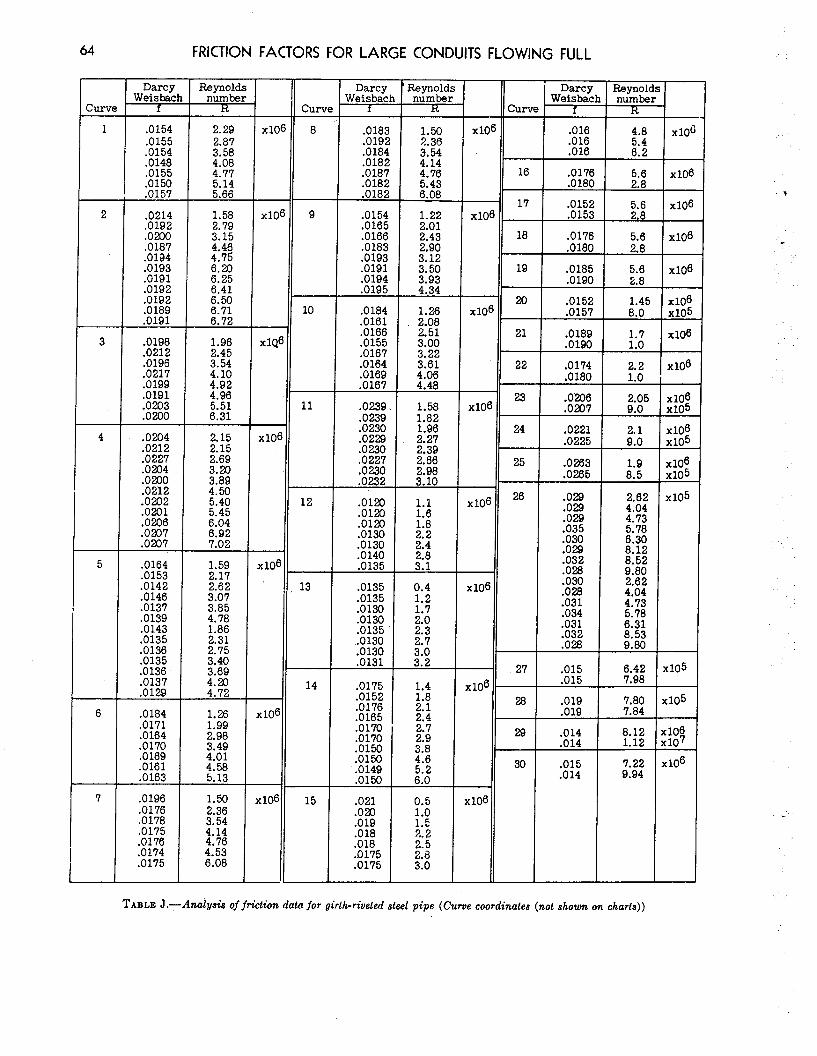
64 FRICTION FACTORS FOR LARGE CONDUITS FLOWING FULL
Curl
Darcy Weisbac
s
Reynold: numbe:
H
2.29 2.87 3.58 4.08
2: 5:66
1.58 2.79 3.15 4.46 4.75
E 6:41
E 6172
1.96 2.45 3.54 4.10 4.92
EY 6:31
Darcy
v
Darcy Weisbac
Reynold number
f R
Reynold: number
R
Is r
.016
.016
.016 z*: 0:2
.0176
.0180
:% x::
.0176 5.0 a0180 2.8
.0185 5.6
.OlQO 2.8
.0152 1.45 .0157 8.0
::o' x106
.0174
.0180 x106
.0206 2.05
.om7 9.0
.0221
.0225
.0263
.0265
x106 x105
x106 x105
x106 x105
.02Q
.02Q
.02Q
:o"E .02Q
5% .030 .028 .031 .034 .031
:%
.015
.015
.OlQ
.OlQ
.014
.014
.015 .014
2.62 4.04
2 f3:30 8.12 8.52 9.80 2.02 4.04
:-7'i 6:31
Ez A
x105
"7% A
7.80 7.84
x105
K105
8.12 cl06 1.12 t107
7.22 9.94
Klo'
Curv’
1
Curv
.0154 .0155 .0154 .0148 .0155 .0150 .0157
.0214 .OlQZ .0200 .0187 .0134
:E .0192 .OlQZ
%z L
.0198
.0212
.OlQ6
.0217
.OlQQ .OlQl
:%%
XlC 8 x10’ :z 3'154 4.14 4.76 5.43 6.08
9
.018:
.OlQI .0184 .018i .018’i .018i 0182 L
.0154
.0165
.0166
.0183
.0193 .OlQl .0194 .OlQ5
16
XlC 1.22 2.01
i-2 3112
EZ 4134
XlOf 17
18
19
10 x1oe 20
x14 21
11
.0184
.0161
.0166
.0155 .0167 .0164
*Et L
.0239
.0239
.0230
.0229
.0230
.0227
.0230 0232 L
:E .012O .0130 .0130 .0140 0135 L
.0135
.0135
:EiZ .0135 .0130 .0130 0131 L
.0175
:Eg" .0165 .0170 .0170
:o":Zi .0149 .0150
1.26 2.08 2.51 3.00
EH p$
L
1.58 1.82 1.96 2.27 2.39 2.66 2.98 3.10
x106 23
KlO’ 24
2.15 2.15 2.69
%t
25
4:50 5.40 .2 KlO6
26
5.45 6.04 6.92 7.02
0.4
::;
2:
32': 3:2
1.59 t1ot 2.17 2.62 13 ~106 3.07 3.85 4.78 1.86 2.31 2.75 3.40 3.69 27
2% 14 x106
28 1.26 x10’ 1.99 2.98 29 3.49 4.01 4.58 30 5.13
1.50 15 .021 x106 2.36 .020 3.54 .OlQ 4.14 4.76
.018
4.53 .018
6.08 .0175 .0175
,
2
3
4 .0204 .0212 .0227 .0204 .0200 .0212
:%ZP .0206 .0207 .oM)7
.0164 .0153 .0142 .0146 .0137 .013Q .0143 .0135 .0136 .0135 .0136 .0137 .012Q
.0184
.0171
.0164
:E .0161 .0163
.OlQ6
.0176
.0178 .0175 .0176 .0174 .0175
TABLE J.-Analysis of friction data for girth-riveted steel pipe (Curve coordinates (not shown on charts))
5
6
7
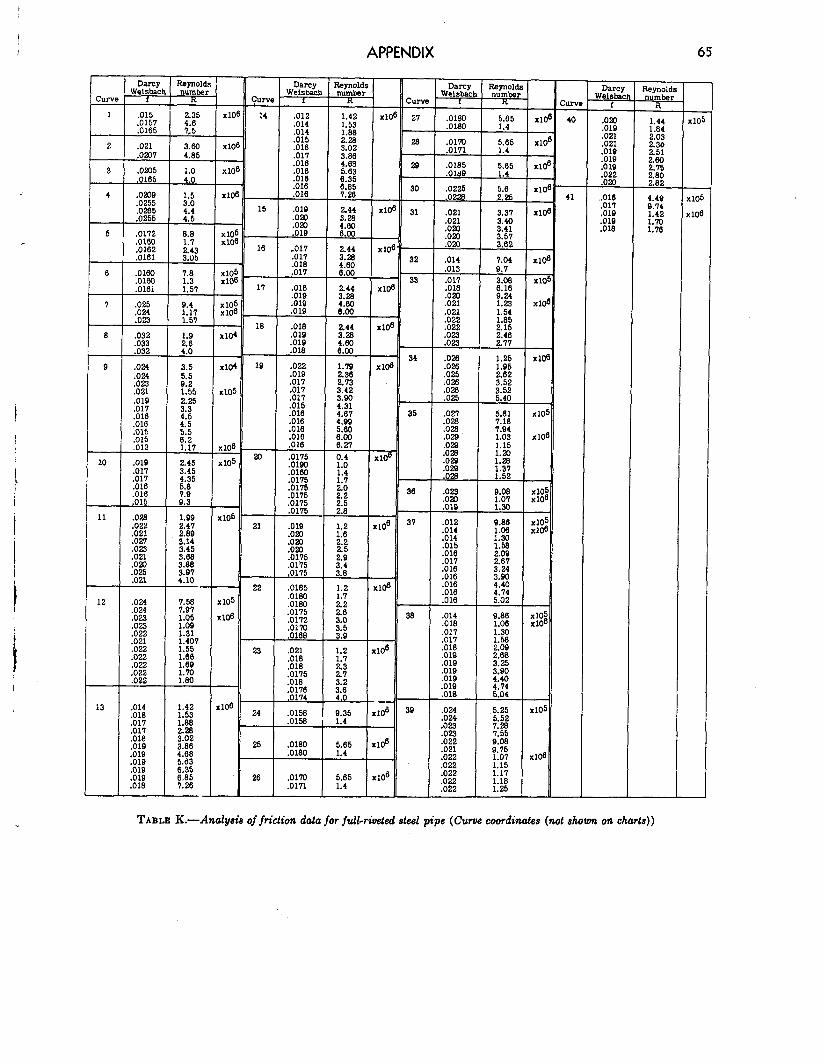
APPENDIX 65
CW!
1 I 2
3
4
L
-
c&
I4 x10’
x10(
XlOl .Ol6 4:SS .016 5.63
29 2% .OlQ
.016 .022
.016 E XlOf
30 &
.016 & 41 ..016
15 .OlQ 244 xm .017
:8E E
31 .019
-- Reynold
_number R
1.44
Ei 2.30 2.51 2.60 2.15
2:; A
4.49 9.14 1.42
::Ci
-
- x1(
-
<lC
110
-
Darcy Reynold W&?tW number
f R
235
:::
.021 0201 L
3.60 4.85
.02X
.0165 1.0 4.0
.om9
.0255
.0265 .0255
.0172
.0160
.0162
.0161
:::
::i
8.8 1.7 2.43 3.05
.0160
.Olrn
.0161
,025 .024 .023
:% 032 L
.024
.024
:% .019
:E ,016
:E 013 L
1.8
El
9.4
::; A
1.9
::I
.019 .Oll
:% .OM .015
.028
.022 .021
:8Z .021 .OZO .025 .021
.024 .024 .023 .023
:% .022 .022 .022 .022 .a22
.014
.018 .Oll
:E .OlQ .019 .OlQ
:E .018
l.Q9
% 3:14 3.45 3.68 3.88 3.97 4.10 ---
77:Z 1.05 1.09 1.31
E’ 1.66 1.69 1.10 1.80
% 1:ss
to”2 3:&s
45:::
::83: 1.26
--
Darcy Weisbac!
f
.012
.014
.014
:% .Oll
ds
ClUW !I
Darcy Weid%
c i
1.42 x10 21 1.53 ma
:E
3:; 23 :%i [ :::”
.021
.021
16 :oo:;
2.44 x10’
.018 2% 32 .014 I 1.04
XlOE .Oll xloe
s:oo 33
11 .018 244 x10( ,019
xl05 .019 i% xl06 .OlQ 6:OO
18 .018 2.44 Xl& Xl04 .OlQ 3.28
:E $& - 34 .026 1.25 x10⁴ 19 .022
8:; Kl@ .026 1.95
.OlQ .025 2.62 .017 .026 3.52
x105 .Oll .026 .Oll
$4$
.015 4:31 ,025 i% A
.016 4.61 35 .021 .016
kii .028 E
:::i 6:W .025 7194 .029 1.03
x106 .016 6.27 ,029 1.15
x105 20 .0115 0.4
:iEl
z 1.0 :E ::g
1.4 .02-Q
.0115 ;:o’
,028 :.c A
:00:1 .0115
x105 .0175
$I
36 :i% Kz .019
h i2.0
21 .019 106 31 .012 8.86
.020
.OaO g :% :::
.020
:% 29”
.015
.016 32
js-
.017 2:61
.0175 .018 .016 :c
22 .0185 1.2 106 .016 4:40
.0180 E!
.016 4.14 x10⁵ .0180 .016 5.02
x106 .0115
:%i ii?
38 .014 8.86
jli-
,018 1.06
.0168 ,011 1.30 .Cll
23 .021 106 .018 tzi
,018 ::; ,018
.018 E
,019 2
:oO:875
.OlQ
.OlQ
.0116 33:: .019
.0174 1.0 .OlS
x106 -
24 .0158 9.35 10a 39 .024 5.25
.0158 1.4 .024 5.52 .023 .023 T:E
25 .0180 5.65 106 .022
.0180 1.4 ,021 .022 .022
26 .oim 5.65 106 .022
.Olll 1.4 :%i :.:8' 1:25 1
TABLE K.-Analyaia of friction data jot full-riveted e&e1 pipe (Cuwe coordinates (not shown on charte))
~ 6
1
8
Q
10
11
12
13
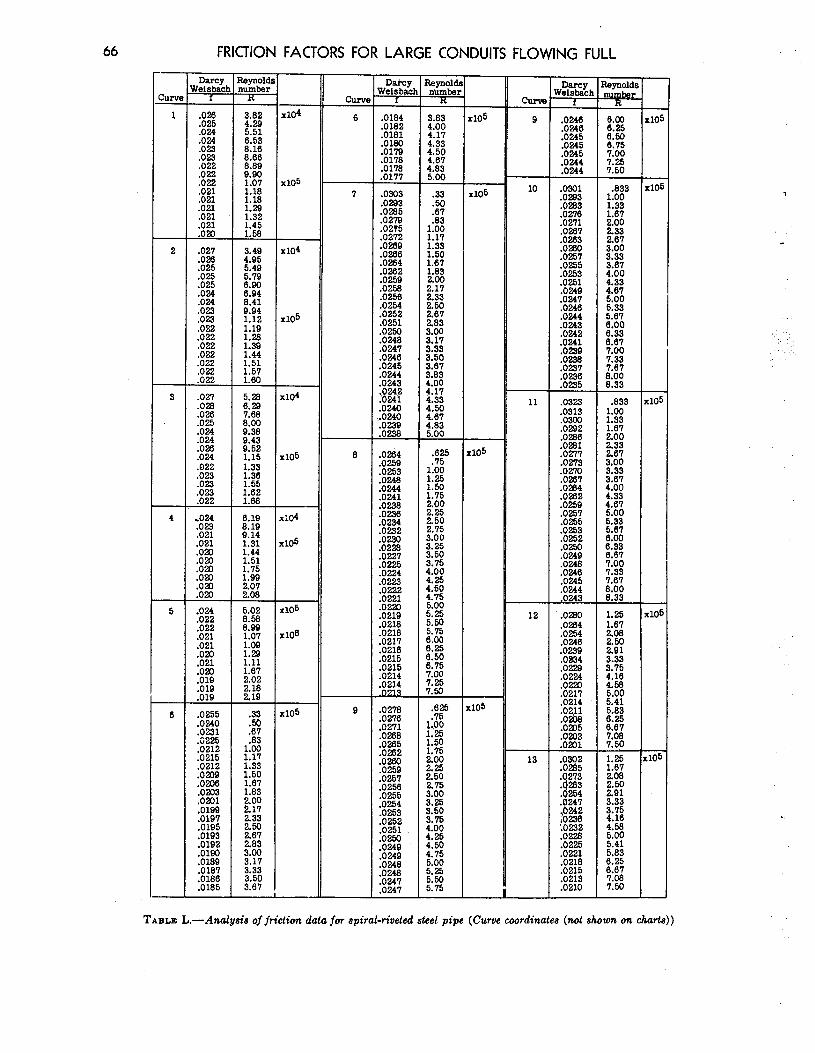
FRICTION FACTORS FOR LARGE CONDUITS FLOWING FULL
‘. ‘:, : :
:
. .
TABLE L.-Analysis of friction data for spiral-riveted steel pipe (Curve coordinates (not shown on charts))
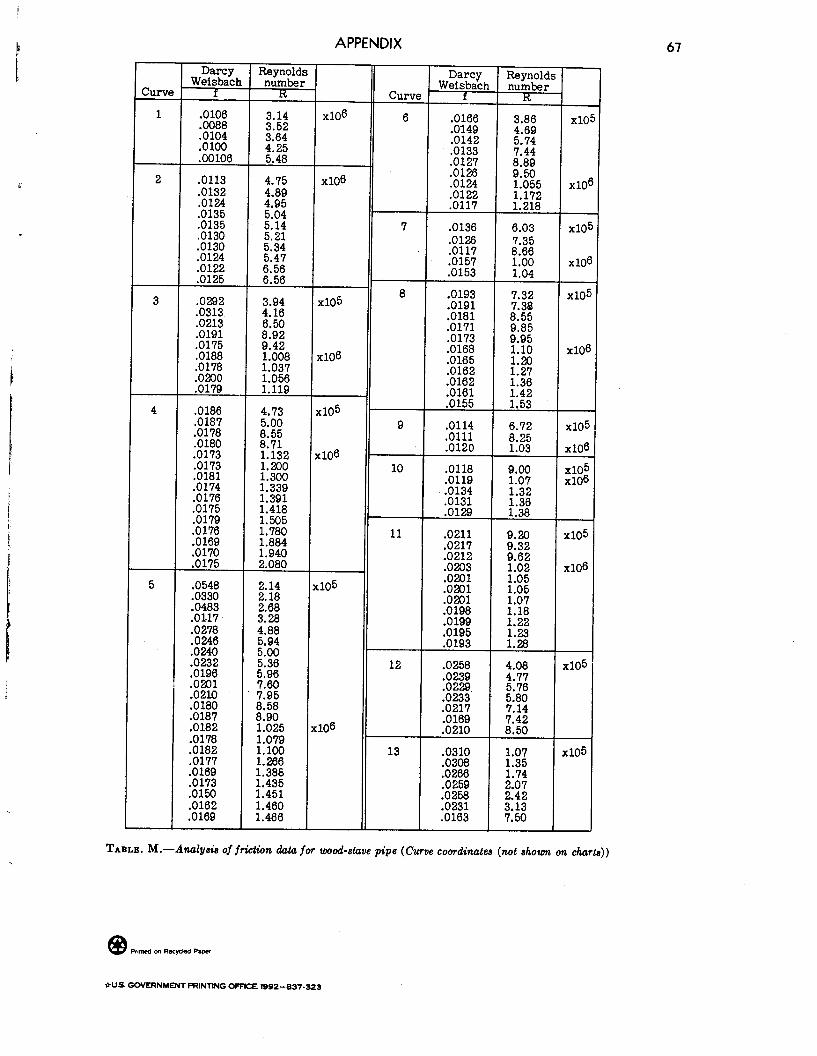
APPENDIX 67
WeDasi:h ReplOldS number
Curve f R I&%h
Reynolds Curve
number f R
1 .0100 3.14 x10⁶ .0088 6 3.52 .0166 3.86 x10 .0104 3.64 .0149 .OlOO
Ei .0142 8%
.00106 .0133 7144 . .0127 8.89
2 .0113 4.75 x10⁶ .0132
:Ei 9.50 4.89 1.055 x10'
.0124 4.95 .0122 1.172
.0135 .0117
5.04 1.218
.0135 5.14 7 .0130 .0136 5.21
6.03 x10! SE: 5.34 5.47 .0126 .0117 8.66 7.35
.0122 6.56 .0157 1.00 x10( .0125 6.56 .0153 1.04
3 .0292 3.94 x10⁵ 8 .0193 .0313 4.16 .0191
Es2 XlOf
:%T .0171 .0181 8:55 9.85 .0175 ;:9; .0173 9.95 .0188 1:008 x106 .0168 1.10 XlOf .0178 1.037 .0165 :Ei 1.119 1.056 .0162 .0162 ::2":
.0161 :-ii 4 .0186 4.73 x10⁵ .0155 1:53
.0187 5.00 .0178 9 8.55 .0114 6.72 x10⁵ .0180 8.71 .Olll .0173 1.132 x10⁶ .0120 2; . x10
:oOE 1.300 1.200 10 .0118 9.00 x10 .0174 .0119 1.07 x10' .0176 :%i: .0175 1:418 :00:33: .0179 1.505 .0129
1138 EB"
.0176 1.780 :%i 1.940 1.884 11 .0211 .0217 E x10!
.0175 2.080 .0212 9:62 .0203 1.02 x10(
5 SO548 2.14 x10⁵ .02Ql 1.05
.0330 2.18 .0201 .0483 2.68 .0201 E .olJ7 3.28 .0198 1:18
.0278 .0199
.0246 Ei
1.22 .0195 1.23
.0240 5:oo .0193 1.28
:Es2 5.96 5.36 12 .0258 4.08 x10⁵ .0201 7.60 .0239
:% E85 .0233 .0229. EB' 5:80 %I 8:90 1.025 .0217 x106 .0169 7.42 7.14
.0210
:o"Z
8.50
:%z 13 .0177 1:266
.0310
.0308 .0169
E x105
:%i .0266 .0173
1174
1:451 .0259
.0150 2.07
.0258 2.42 .0162 1.460 .0231 3.13 .0169 1.466 .0163 7.50
TABLE. M .-Analysis of friction data for wood-stave pipe (Curve coordinates (not shown on charts))
*US. GOVERNMP(T PRINTING OFFICE: 1992--837.323