Embed Size (px)
Citation preview
Analysis of Statistical Trends Between Design and Comfort
at Chili's Restaurants
Engineering Management, Information, and Systems
OW-Department
immom
Southern Methodist University School of Engineering Dallas, Texas 75275
Analysis of Statistical Trends Between Design and Comfort
at Chili's Restaurants
EMIS Senior Design Spring 2005
Asif Hussain Kristyn Starr
Table of Contents
Management Summary . 1
Background and Description .................................................................3
Analysis of the Situation ...................................................................... 5
Technical Description .........................................................................7
Analysis and Managerial Interpretation .....................................................11
Conclusions and Critique ..................................................................... 35
Appendix........................................................................................39

Management Summary
We were asked by Brinker International to carry out a Trend Analysis for one of
its major restaurants, Chili's. The data we used for this analysis was off of their Guest
Satisfaction Survey (GSS) from Fiscal year 2004 Quarter 3 to Fiscal year 2005 Quarter 3.
There were approximately 2 million entries and our primary tool to carry out the analysis
was SPSS, statistical analysis software used in businesses to solve business and research
problems regarding data management and analysis. Our primary objective was to
determine if restaurant prototypes affected a guest's comfort level and overall restaurant
experience. Chili's has 19 different prototypes and all of their stores come under these.
Prototypes differ from each other in architecture, interior setup, furniture, themes and
decoration.
In SPSS we ran Crosstabs procedures which produced Pearson's r values between
Overall Comfort and several other relevant variables taken from the GSS. Pearson's r
values are used to determine if 2 different variables have a strong correlation (statistical
relationship). Through these procedures we determined that there were not any strong
correlations between Overall Comfort and the other variables used.
One-Way ANOVA tests were used to find statistical significance between the
mean values of all the variables with regards to prototypes. Through this we found that
there are some prototypes that differ significantly from other prototypes in their mean
values. Some prototypes were rated statistically higher than others but due to the lack of
benchmarks, we were unable to conclude whether certain prototypes were better than
others according to Brinker's standards.
2
1 Background and Description
3
Brinker International has been collecting data regarding guest satisfaction and
they gave us their data from Fiscal year 2004 Quarter 3 to Fiscal year 2005 Quarter 3.
They wanted us to use the data gathered to prove or disprove that the architecture,
prototype, affects a customer's comfort. The restaurant we focused our attention on was
Chili's. With this data they hope they can easily remedy minor problems in comfort and
possibly target a high comfort rating prototype. This would give them an idea of where to
alter the poor prototypes and emulate new restaurants against.
The GSS asks close to 150 questions ranging from income to overall experience.
Guests rate most of the questions on a scale from 1 to 5; 5 being excellent and 1 being
bad. Some of the questions asked more depth as to why a guest gave a poor rating on a
query. For example one of the questions was directed at the overall cleanliness of the
restaurant. If the user rated the cleanliness poorly they were asked as to why; examples
of response choices were unclean seats, tables, floors, menus, bar, fixtures/wall,
silverware/plateware, and staff's attire.
The first step in our process was to decide which questions to keep as our
variables in finding trends in the data. We focused on a total of 19 variables. These were
the variables we felt directly could affect the comfort of a guest; they were finalized with
the help of our contact at Brinker. The next step, before analysis could begin, was to
merge the prototypes with the corresponding restaurants since our focus was on the
prototypes and not the individual restaurants.
4
Analysis of Situation
- P^^p
5
We approached the problem from a statistical point of view. The database had
about 2 million cases of which we could work with in finding trends. It was decided that
it was best to use all of them verses a random sample because the random sample could
end up heavily weighted towards a prototype and the assured significance with the full
database would be lost with a random sample.
With the help of SPSS we were able to investigate some preconceived notions we
had of the problem. One of these was the idea that the comfort was affected by such
variables as cleanliness, atmosphere, server's enthusiasm and restroom status. We
decided that using the Crosstabs analysis of SPSS would enable us to prove or disprove
our original notions by finding a correlation between comfort and the other variables. The
information from the Crosstabs would then be used to help enforce any findings from the
One-Way ANOVA. It was decided that a One-Way ANOVA would be the best way to
compare the prototypes against each other by using a means comparison of the variables
to see which were significantly different.

Technical Description
7
Our analysis was based off of 1,800,000 cases from the GSS and contained 18
variables from 4 different categories. The categories were: staff, restaurant environment,
comparison to similar restaurant types and other.
Staff Questions: Acknowledge quickly upon seating Attentiveness of server Beverage served timely Food served timely Enthusiasm of server, promptness of payment Servers' knowledge Welcomed upon arrival.
Restaurant Environment Questions: Overall atmosphere Overall cleanliness Overall comfort Restrooms
Comparison to Similar: Overall Atmosphere
Food Service
IOther:Overall Experience
I
Operation Hours
The analysis was completed using the Crosstabs analysis and One-Way ANOVA on
ISPSS. The only assumption made to the data was despite being considerably less entries
I
for 3 of the prototypes we felt there were enough that when comparing means it would
not affect the outcome. This assumption was further established by running the cases
I weighted on a One-Way ANOVA.
8
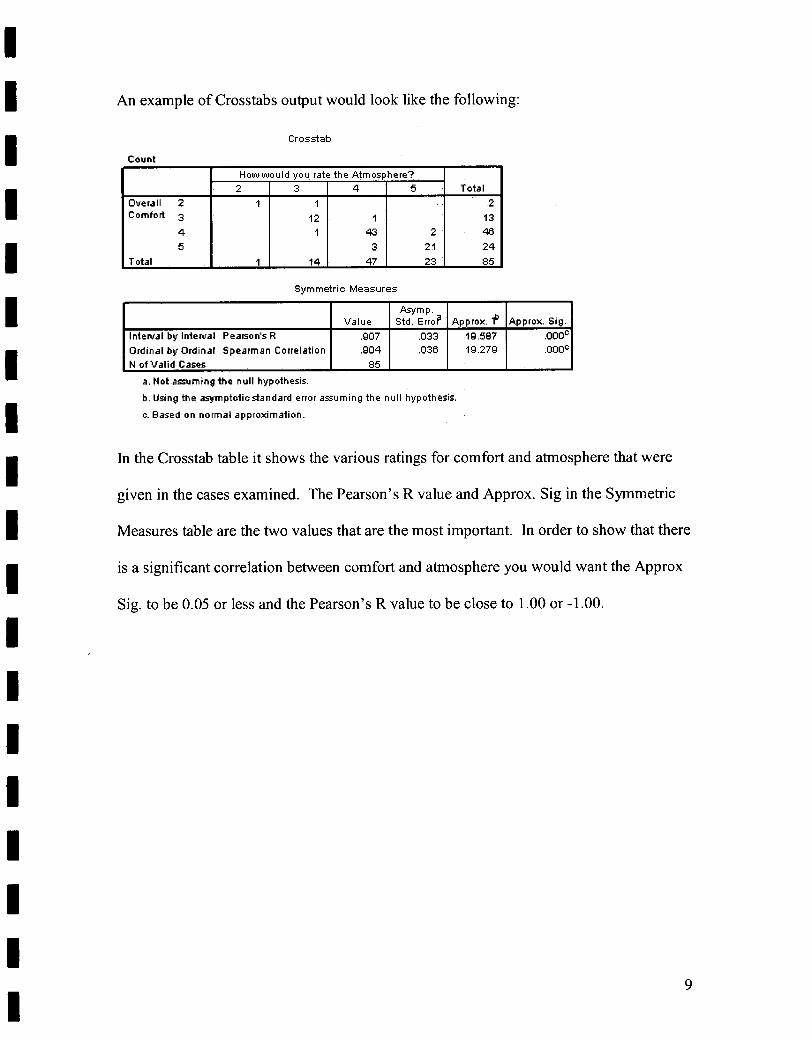
An example of Crosstabs output would look like the following:
Crosstab
r nunt
How would you rate the Atmosphere?Total 2 3 4 5
Overall 2 1 1 2 Comfort3 12 1 13
4 1 43 2 46 5 3 21 24
Total 1 1 14 1 47 23 85
Symmetric Measures
Asym p. Value Std. Error Approx. P Approx. Sig.
Interval by Interval Pearsons R .907 .033 19.587 .00O
Ordinal by Ordinal Spearman Correlation .904 .036 19.279 .00O N of Valid Cases 85
a. Not assuming the null hypothesis.
b. Using the asymptotic standard error assuming the null hypothesis.
o. Based on normal approximation.
In the Crosstab table it shows the various ratings for comfort and atmosphere that were
given in the cases examined. The Pearson's R value and Approx. Sig in the Symmetric
Measures table are the two values that are the most important. In order to show that there
is a significant correlation between comfort and atmosphere you would want the Approx
Sig. to be 0.05 or less and the Pearson's R value to be close to 1.00 or -1.00.
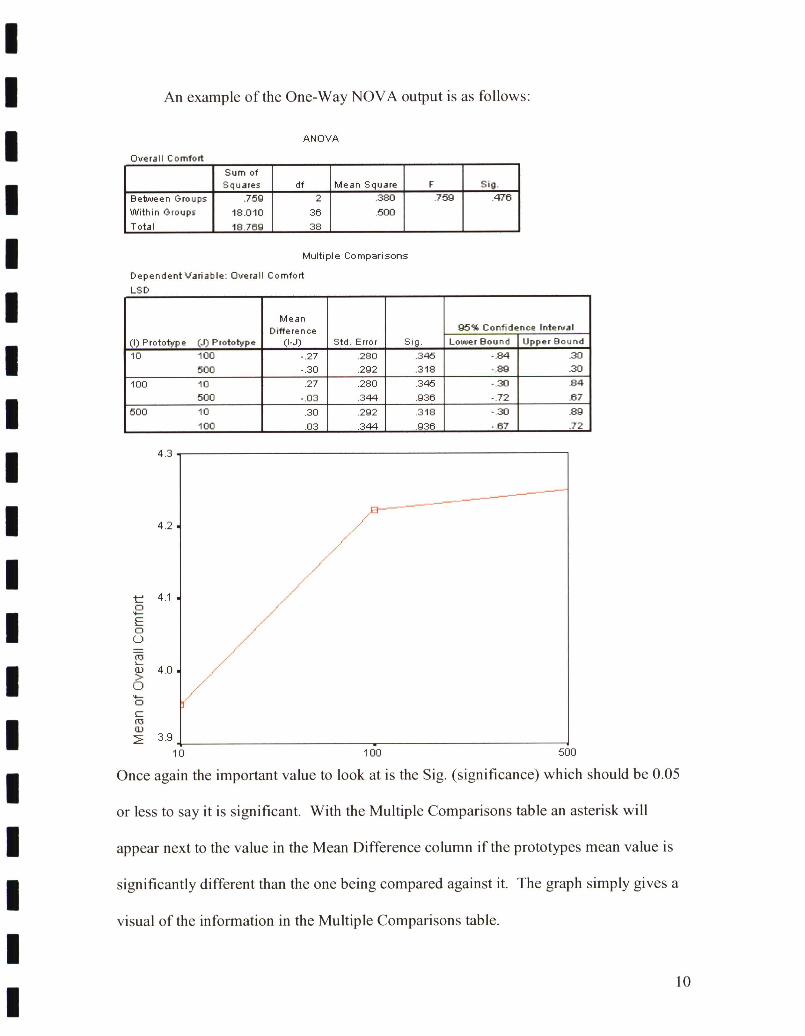
An example of the One-Way NOVA output is as follows:
AN OVA
nr,f.rf
Sum of Squares df Mean Square F Sic.
Bebseen Groups .759 2 .380 .759 .476 Within Groups 18.010 36 .500 Total 18.750 38
Multiple Comparisons
Dependent Variable: Overall Comfort I S1
Mean Difference 95% Confidence Interval
Lower Bound Upper Bound (I) Prototype (J) Prototype (l-J) Std. Error Sig. 10 100 -.27 .280 .345 -84 .30
500 -.30 .202 .318 -.89 .30 100 10 .27 .280 .345 -.30 .84
500 -.03 .344 .935 -.72 .67 500 10 .30 j .292 j .318 j -.30 .89
100 . .03 .344 .036 - 67 .72
4.3
I-.
4.2
t 4.1 0 9-
0 (—)
4.0
0
0
cr5
3.9[
10 100 500
Once again the important value to look at is the Sig. (significance) which should be 0.05
or less to say it is significant. With the Multiple Comparisons table an asterisk will
appear next to the value in the Mean Difference column if the prototypes mean value is
significantly different than the one being compared against it. The graph simply gives a
visual of the information in the Multiple Comparisons table.
10

Analysis and Managerial Interpretation
11
First, a Crosstabs analysis was run first to see if there was a correlation between
comfort and any of our carefully selected 19 variables. In order for us to say there is a
strong correlation between comfort and other variables the Pearson's rvalue would need
to be close to 1.00, meaning that there is a positive relationship, or -1.00 meaning there is
a negative relationship. The maximum rvalue produced was 0.620 . This is too faraway
from 1.00 or -1.00 to confidently say that there is a correlation between the 2 variables.
However, since we were dealing with almost 2 million survey entries comfort is
somewhat affected by other variables. This maximum value was for the correlation
between comfort and overall cleanliness as seen in Figure 1.
12
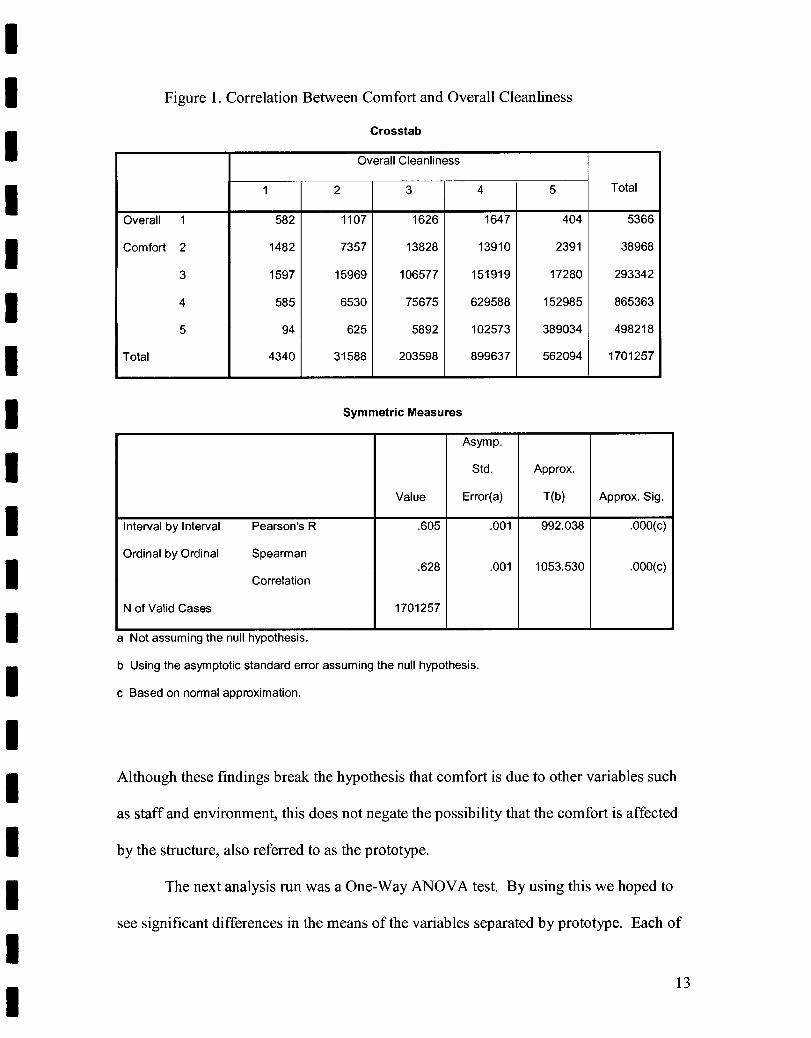
Figure 1. Correlation Between Comfort and Overall Cleanliness
Crosstab
Overall Cleanliness
Total 1 2 3 4 5
Overall 1 582 1107 1626 1647 404 5366
Comfort 2 1482 7357 13828 13910 2391 38968
3 1597 15969 106577 151919 17280 293342
4 585 6530 75675 629588 152985 865363
5 94 625 5892 102573 389034 498218
Total 4340 31588 203598 899637 562094 1701257
Symmetric Measures
Asymp.
Std. Approx.
Value Error(a) T(b) Approx. Sig.
Interval by Interval Pearsons R .605 .001 992.038 .000(c)
Ordinal by Ordinal Spearman.628 .001 1053.530 .000(c)
Correlation
N of Valid Cases 1701257
a Not assuming the null hypothesis.
b Using the asymptotic standard error assuming the null hypothesis.
c Based on normal approximation.
Although these findings break the hypothesis that comfort is due to other variables such
as staff and environment, this does not negate the possibility that the comfort is affected
by the structure, also referred to as the prototype.
The next analysis run was a One-Way ANOVA test. By using this we hoped to
see significant differences in the means of the variables separated by prototype. Each of
13
our 19 variables was run separately using prototype as the factor of comparison. The
means were calculated from the guests' ratings of I to S for each of the 19 variables. For
the ease of documentation and readability each variable is set up with the figure name,
corresponding graph, question asked, response and appropriate score, and the highest and
lowest ranking prototypes.
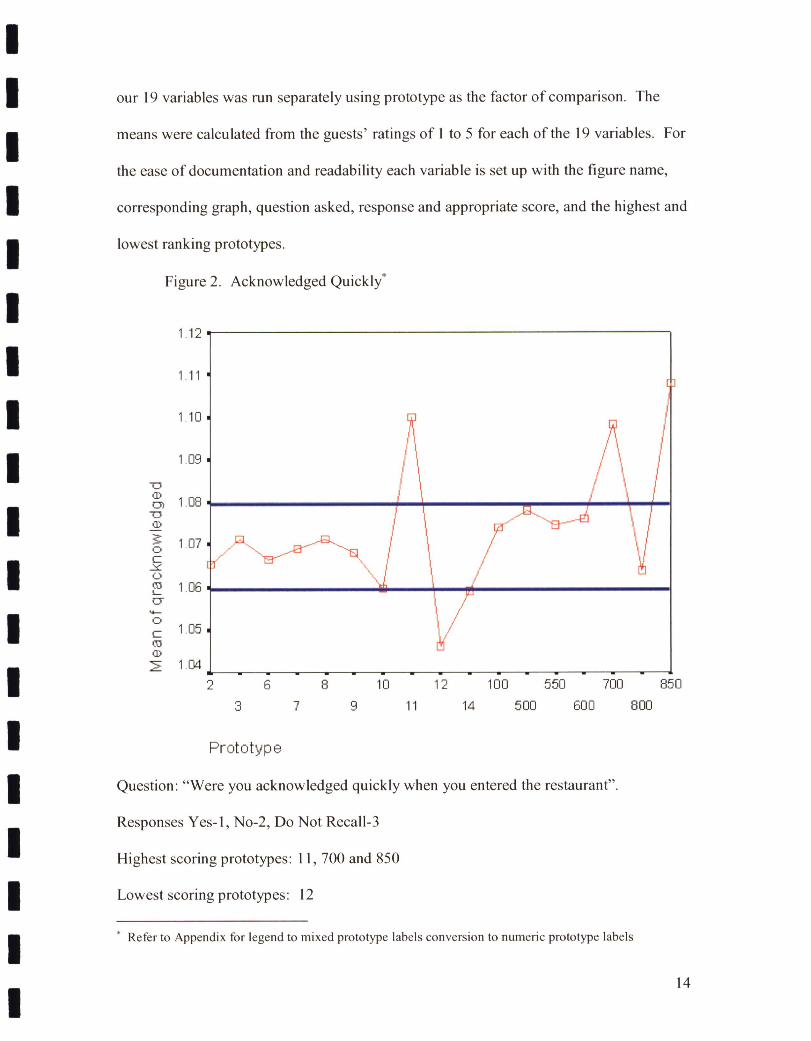
Figure 2. Acknowledged Quickly*
112
111
110
1 09
D
0) 1.08
107
106
1.05
I'll
2 6 8 10 12 100 550 700 850
3 7 9 11 14 500 600 8110
Prototype
Question: "Were you acknowledged quickly when you entered the restaurant".
Responses Yes-I, No-2, Do Not Recall-3
Highest scoring prototypes: II, 700 and 850
Lowest scoring prototypes: 12
Refer to Appendix for legend to mixed prototype labels conversion to numeric prototype labels
14
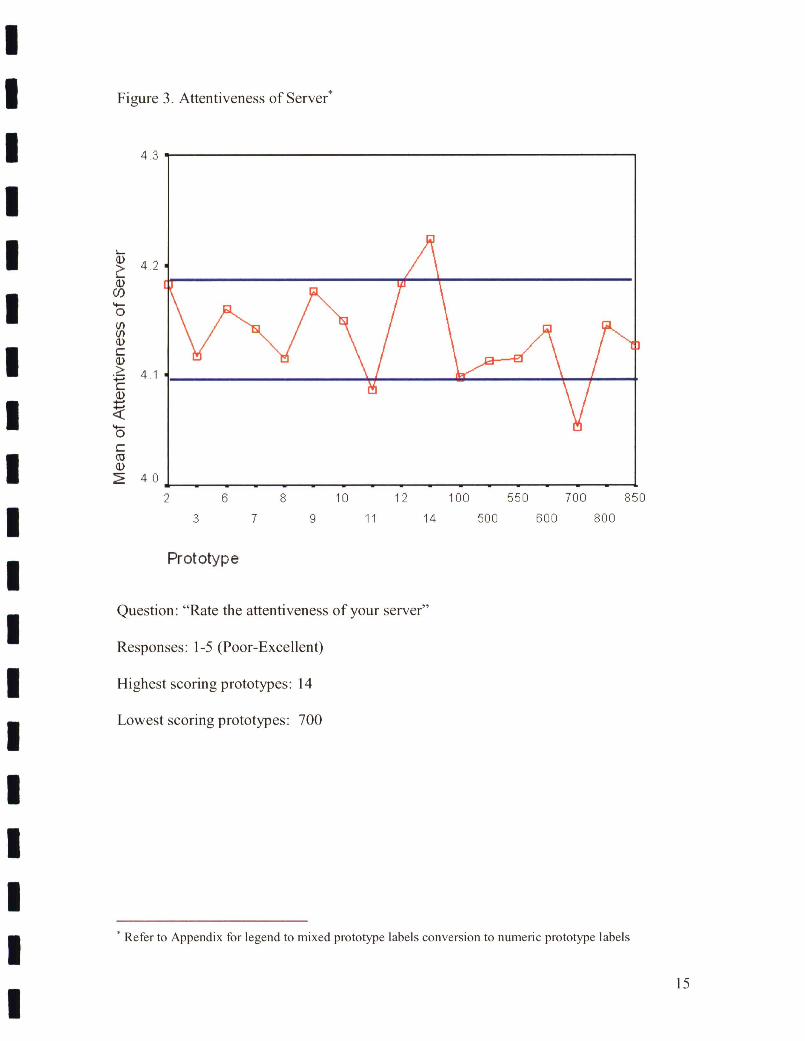
Figure 3. Attentiveness of Server*
43
V 42 a)
C/)
0 (1) (I) ci)
ci) > 4.-ci)
(U ci)
40
2 6 8 10 12 100 550 700 850
3 7 9 11 14 500 600 800
Prototype
Question: "Rate the attentiveness of your server"
Responses: 1-5 (Poor-Excellent)
Highest scoring prototypes: 14
Lowest scoring prototypes: 700
Refer to Appendix for legend to mixed prototype labels conversion to numeric prototype labels
15
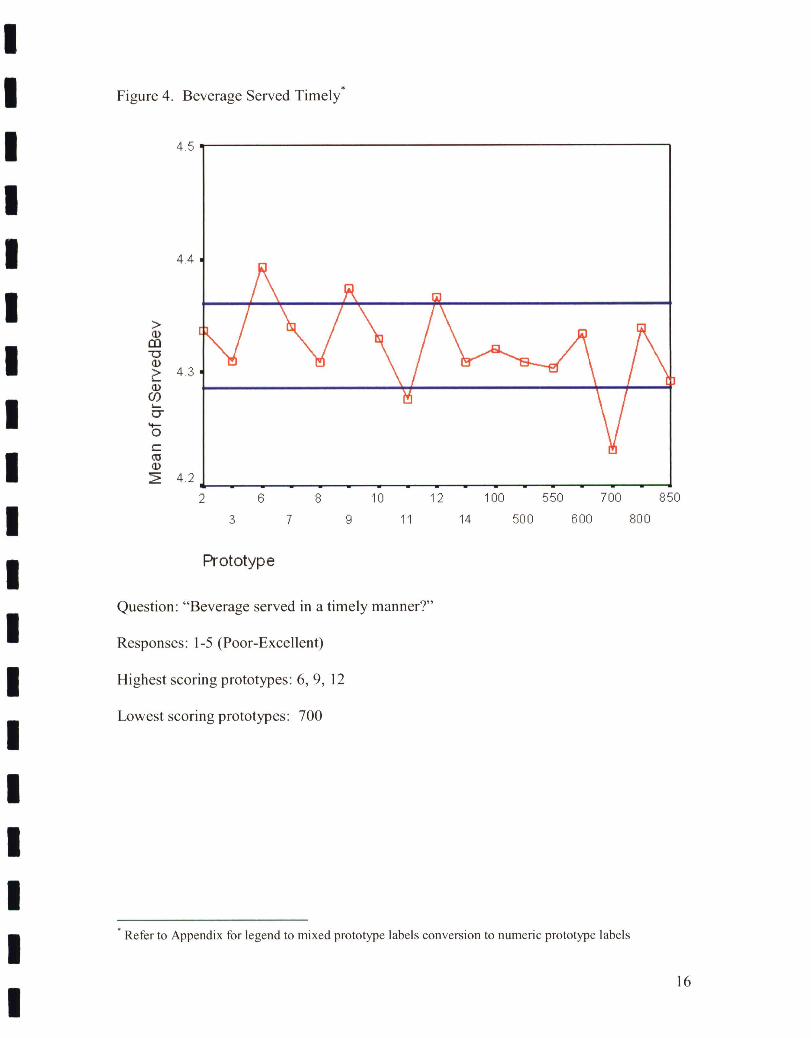
Figure 4. Beverage Served Timely*
45
IEN
> W
43
CO
42J - -
2 6 8 10 12 100 550 700 850
3 7 9 11 14 500 600 800
Prototype
Question: "Beverage served in a timely manner?"
Responses: 1-5 (Poor-Excellent)
Highest scoring prototypes: 6, 9, 12
Lowest scoring prototypes: 700
Refer to Appendix for legend to mixed prototype labels conversion to numeric prototype labels
Lr1
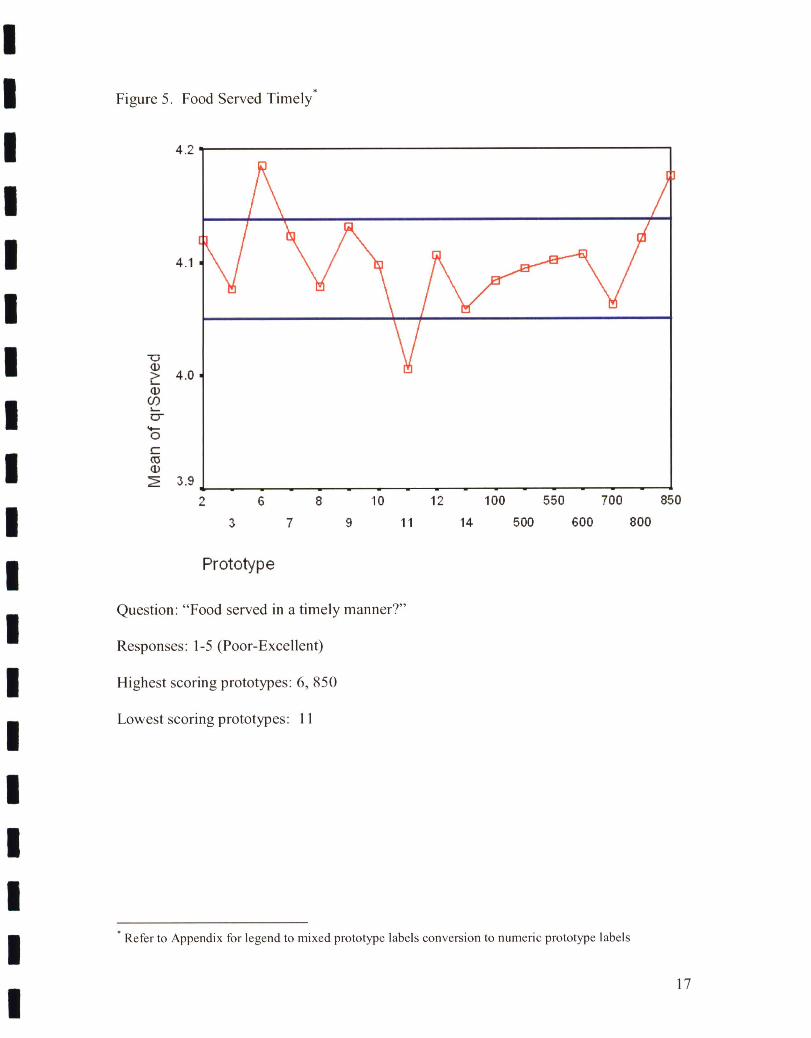
Figure 5. Food Served Timely*
4.2
4.1
-U a) >4.0 a)
(WI)
'I-0 C CO Q)
2 6 8 10 12 100 550 700 850
3 7 9 11 14 500 600 800
Prototype
Question: "Food served in a timely manner?"
Responses: 1-5 (Poor-Excellent)
Highest scoring prototypes: 6, 850
Lowest scoring prototypes: 11
* Rclr to Appendix for legend to mixed prototype labels conversion to numeric prototype labels
17
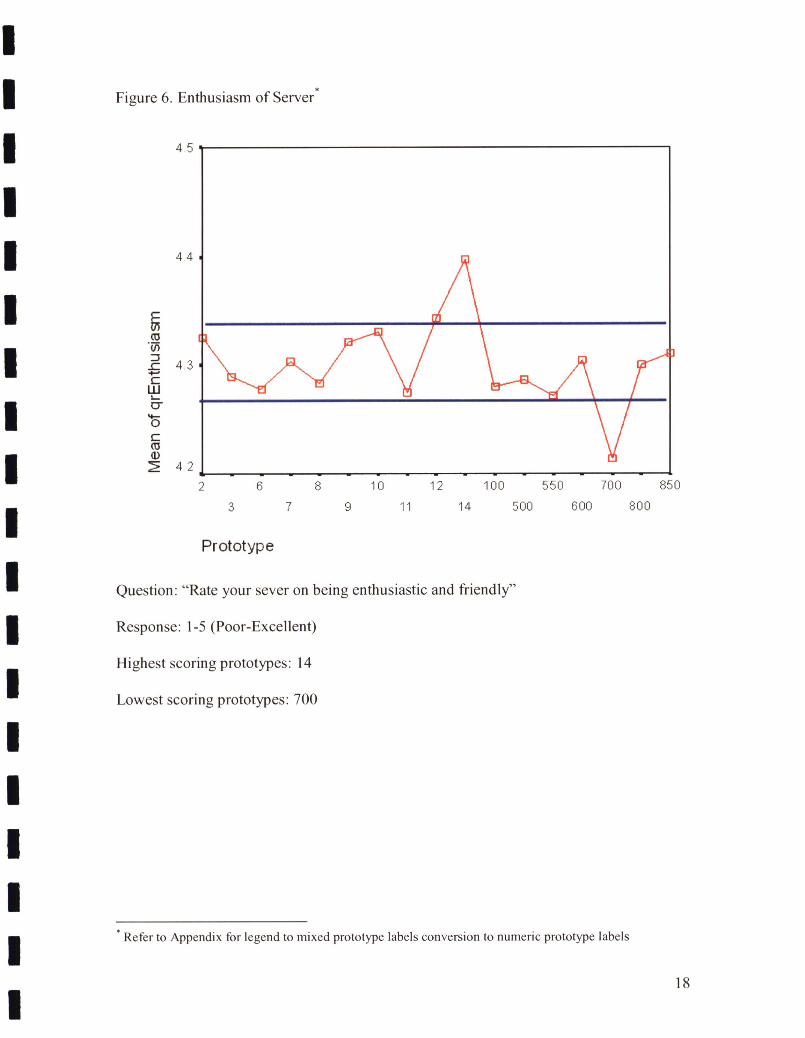
Figure 6. Enthusiasm of Server*
45
44
Ir
.CO U)
r 43 9-, C
Lii 0
0 C ('3
2 421 - - 2 6 8 10 12 100 550 700 850
3 7 9 11 14 500 600 800
Prototype
Question: "Rate your sever on being enthusiastic and friendly"
Response: 1-5 (Poor-Excellent)
Highest scoring prototypes: 14
Lowest scoring prototypes: 700
Refer to Appendix thr legend to mixed prototype labels conversion to numeric prototype labels
18
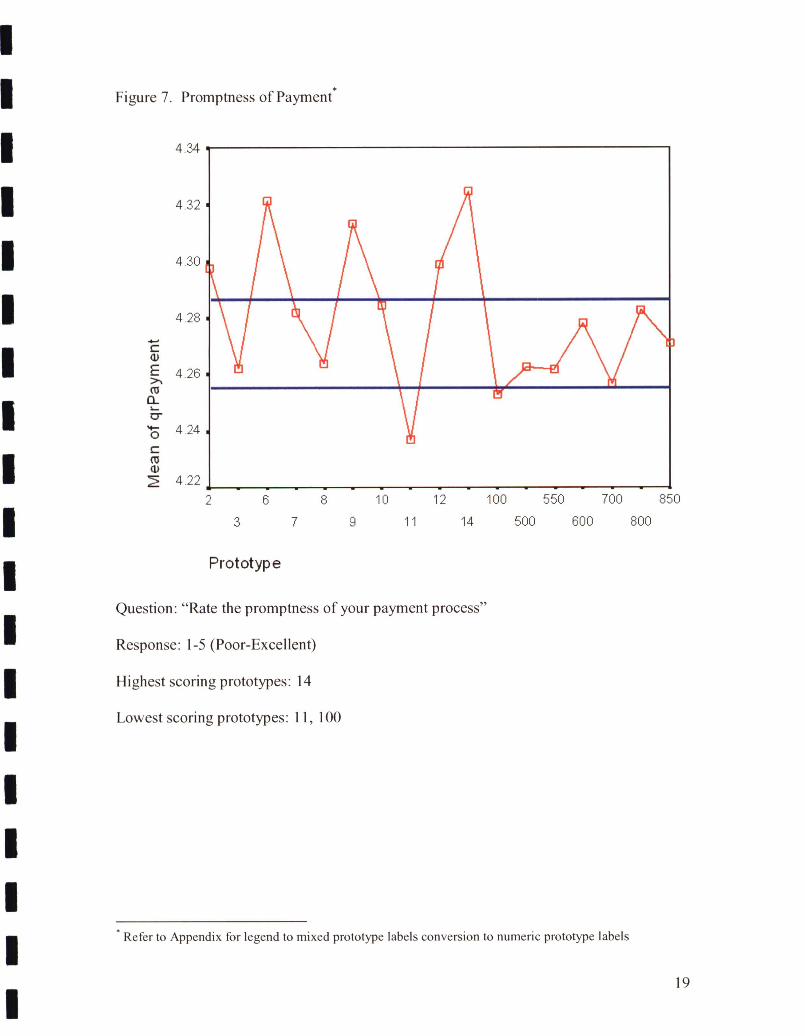
Figure 7. Promptness of Payment*
4 34
432
430
4.28
426
4.24
422
2 6 8 10 12 100 550 700 850
3 7 9 11 14 500 600 800
Prototype
Question: "Rate the promptness of your payment process"
Response: 1-5 (Poor-Excellent)
Highest scoring prototypes: 14
Lowest scoring prototypes: 11, 100
Relr to Appendix for legend to mixed prototype labels conversion to numeric prototype labels
19
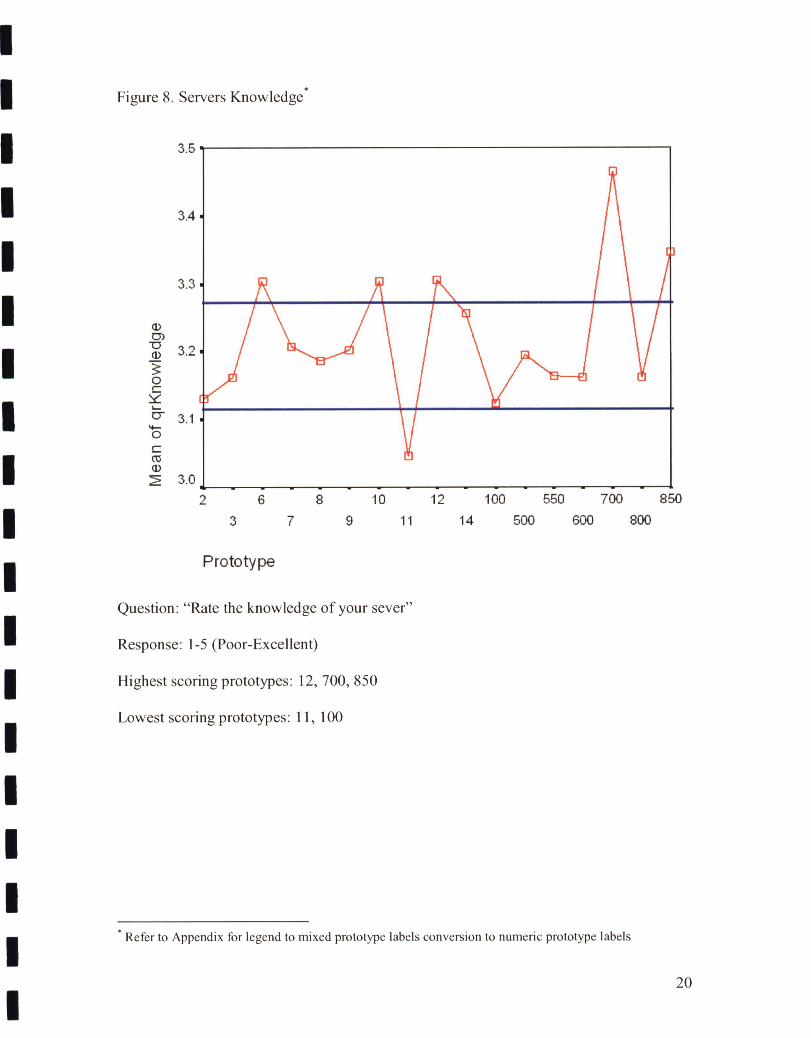
Figure 8. Servers Knowledge*
3.5
3.4
3.3
a) 0)
3.2 3. 0
3.1
3.0J -
2 6 8 10 12 100 550 700 850
3 7 9 11 14 500 600 800
Prototype
Question: "Rate the knowledge of your sever"
Response: 1-5 (Poor-Excellent)
Highest scoring prototypes: 12, 700, 850
Lowest scoring prototypes: 11, 100
Refir to Appendix for legend to mixed prototype labels conversion to numeric prototype labels
20
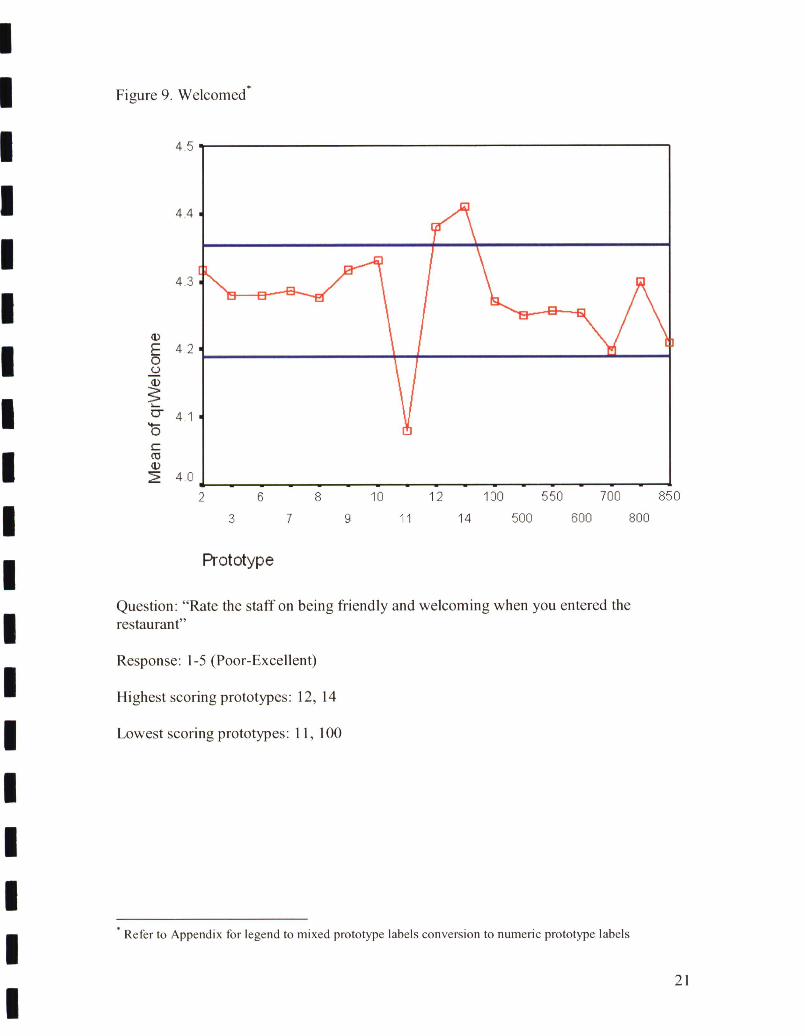
Figure 9. Welcomedt
45
44
43
L)
E42 0 0
1)
41
(0
40J -
2 6 8 10 12 100 550 700 850
3 7 9 ii 14 500 600 800
Prototype
Question: "Rate the staff on being friendly and welcoming when you entered the restaurant"
Response: 1-5 (Poor-Excellent)
Highest scoring prototypes: 12, 14
Lowest scoring prototypes: 11, 100
ReIr to Appendix for legend to mixed prototype labels conversion to numeric prototype labels
21
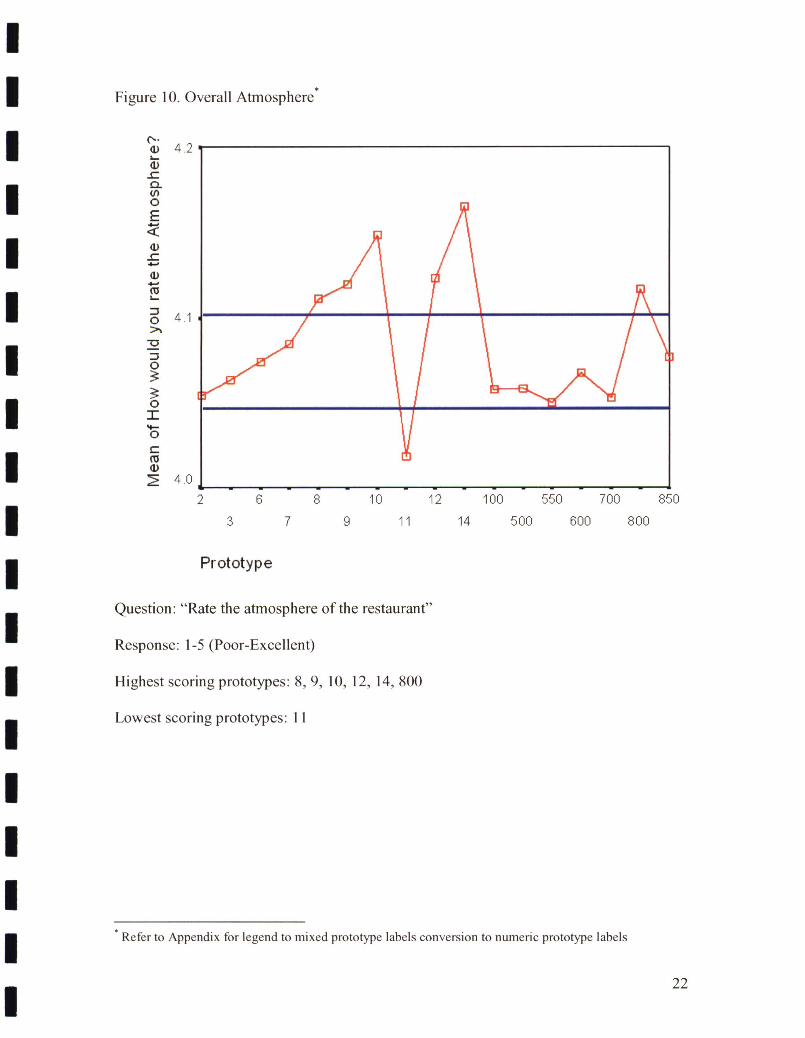
Figure 10. Overall Atmosphere*
142
C) 41 >
0
0 I .4-0
( ci)40
2 6 8 10 12 100 550 700 850
3 7 9 11 14 500 600 800
Prototype
Question: "Rate the atmosphere of the restaurant"
Response: 1-5 (Poor-Excellent)
Highest scoring prototypes: 8, 9, 10, 12, 14, 800
Lowest scoring prototypes: 11
Retr to Appendix for legend to mixed prototype labels conversion to numeric prototype labels
22
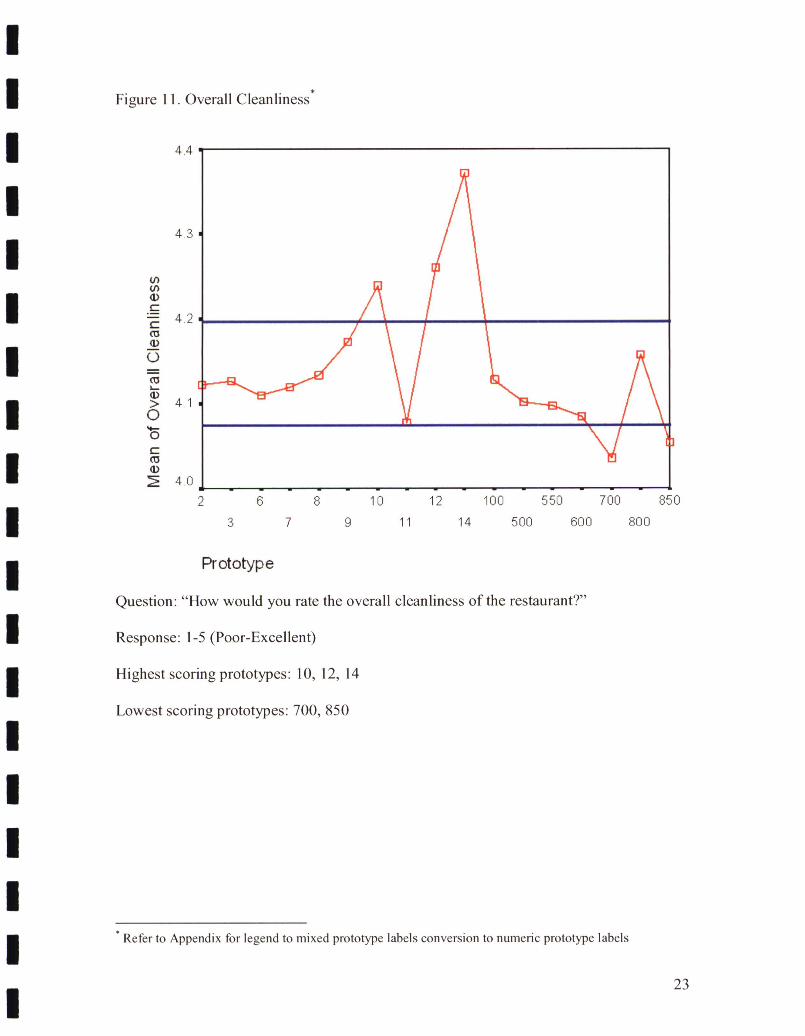
Figure II. Overall Cleanliness
4.4
43
U) U)
4.2 ('3 a) 0 ('3
a) > 4.1 0 0
('3 1)
40
2 6 8 10 12 100 550 700 850
3 7 9 ii 14 500 600 800
Prototype
Question: "How would you rate the overall cleanliness of the restaurant?"
Response: 1-5 (Poor-Excellent)
Highest scoring prototypes: 10, 12, 14
Lowest scoring prototypes: 700, 850
Refer to Appendix for legend to mixed prototype labels conversioti to numeric prototype labels
23
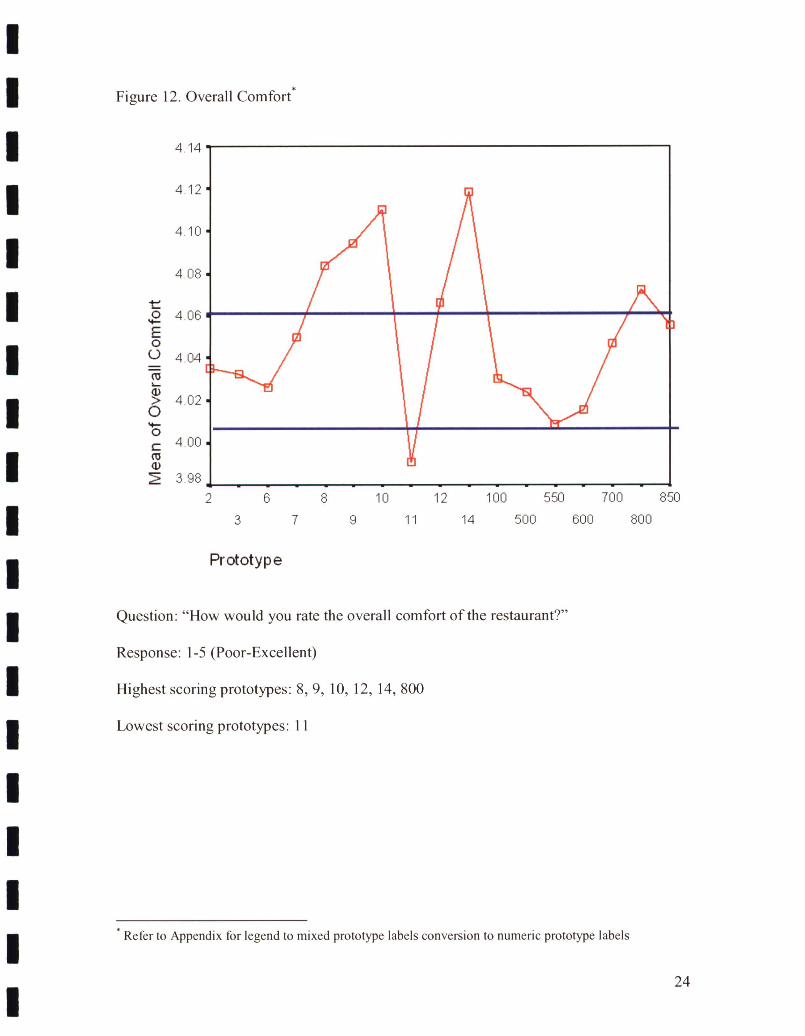
Figure 12. Overall Comfortt
4.14
') l 1 '-I. I
4 10
4 08
406
404
402 0 4-0
400 Co a)
3.98J -
2 6 8 10 12 100 550 700 850
3 7 9 ii 14 500 600 800
Prototype
Question: "How would you rate the overall comfort of the restaurant?"
Response: 1-5 (Poor-Excellent)
Highest scoring prototypes: 8, 9, 10, 12, 14, 800
Lowest scoring prototypes: 11
Refer to Appendix for legend to mixed prototype labels conversion to numeric prototype labels
24
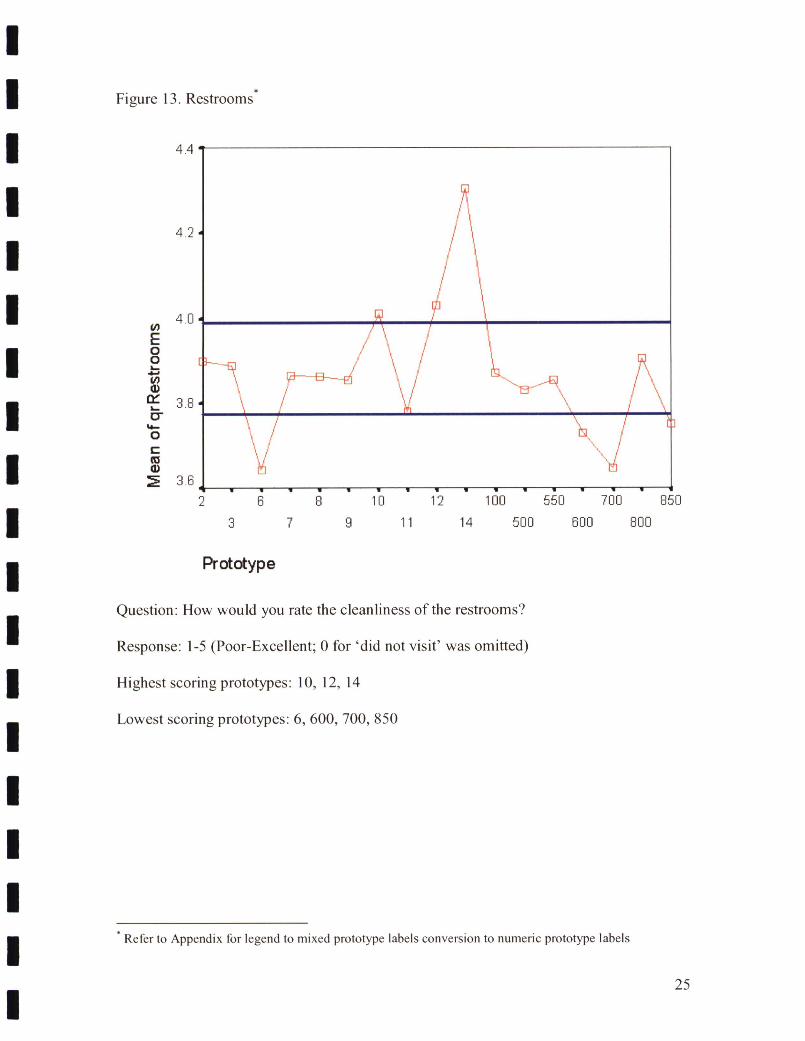
Figure 13. Restrooms*
4.4
4 2
NO (I, E 0 0 I-
3.8 Cr
0
C Ct ci)
36
r1
V V V V I I V I I
2 6 9 10 12 100 560 7011 850
3 7 9 ii 14 500 500 800
Prototype
Question: 1-low would you rate the cleanliness of the restrooms?
Response: 1-5 (Poor-Excellent; 0 for 'did not visit' was omitted)
Highest scoring prototypes: 10, 12, 14
Lowest scoring prototypes: 6, 600, 700, 850
Refer to Appendix for legend to mixed prototype labels conversion to numeric prototype labels
25
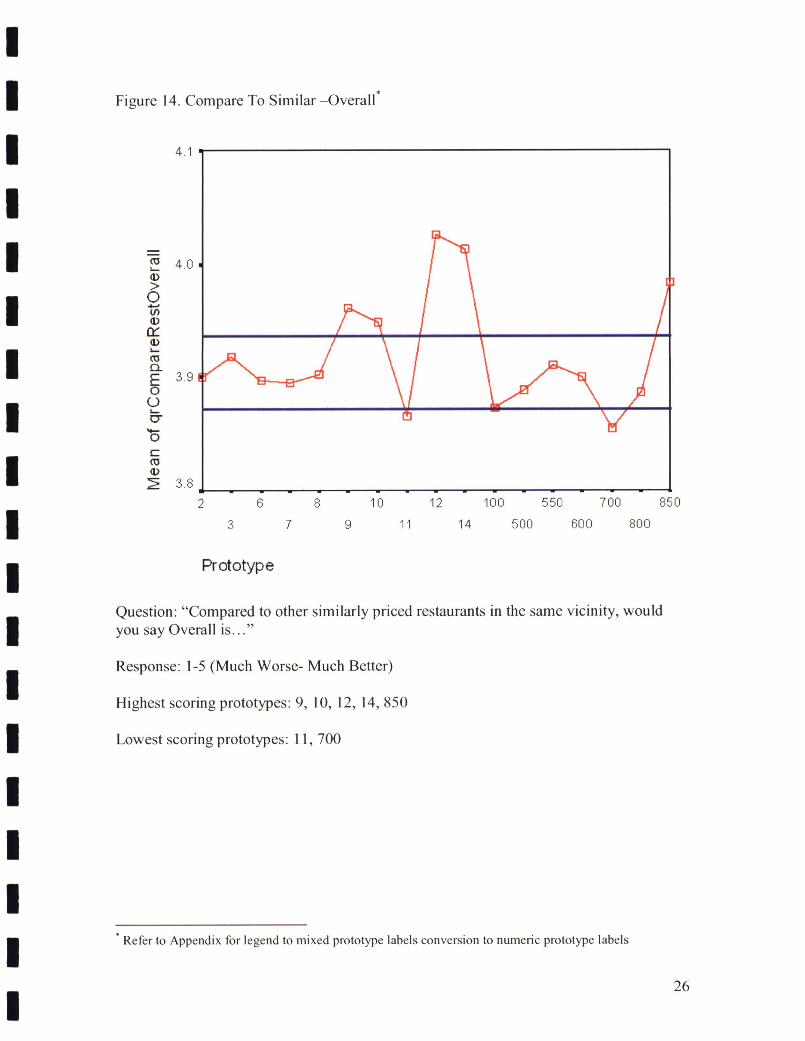
Figure 14. Compare To Similar _Overall*
4.1
40 a) >
2
co CL
a)
a)
E39 0 0 C-
a)
2 6 8 10 12 100 550 700 850
3 7 9 11 14 500 600 800
Prototype
Question: "Compared to other similarly priced restaurants in the same vicinity, would
you say Overall is..."
Response: 1-5 (Much Worse- Much Better)
Highest scoring prototypes: 9, 10, 12, 14, 850
Lowest scoring prototypes: 11, 700
- Refer to Appendix thr legend to mixed prototype labels conversion to numeric prototype labels
26
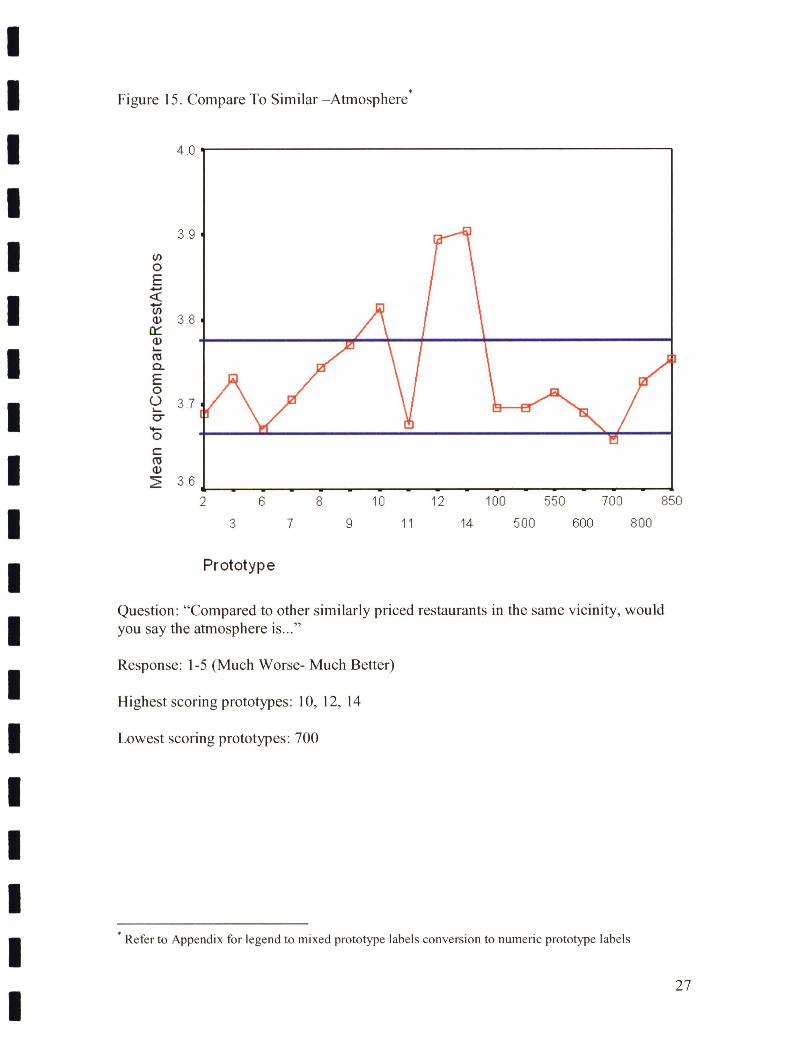
Figure 15. Compare To Similar _Atmosphere*
4.0
39 ci) 0
CL
38 U)
0 OL 3.7
'I-0
a)36
2 6 8 10 12 100 550 700 850
3 7 9 11 14 500 600 800
Prototype
Question: "Compared to other similarly priced restaurants in the same vicinity, would you say the atmosphere is.,."
Response: 1-5 (Much Worse- Much Better)
Highest scoring prototypes: 10, 12, 14
Lowest scoring prototypes: 700
Refer to Appendix for legend to mixed prototype labels conversion to numeric prototype labels
27
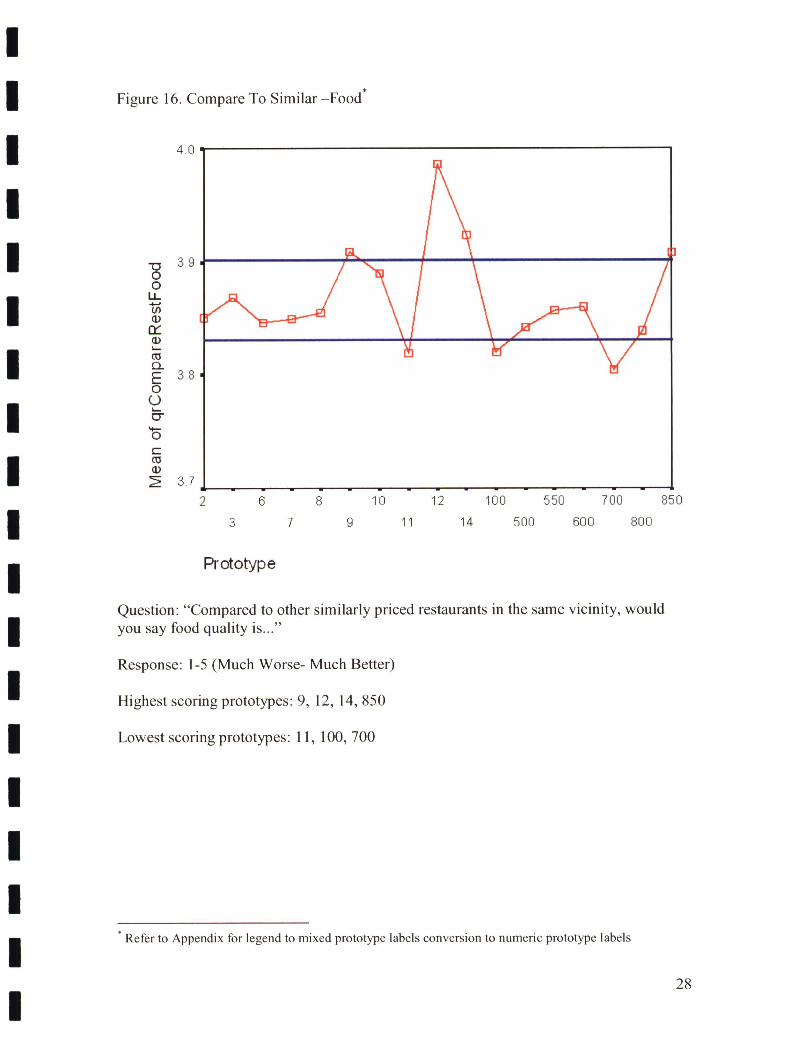
Figure 16. Compare To Similar _Food*
40
- 3.9 0 0
LL
(A a)
0:: (D
CO CI
E38 0
ca
0
=
11)
3.7
2 6 8 10 12 100 550 700 850
3 7 9 11 14 500 600 800
Prototype
Question: "Compared to other similarly priced restaurants in the same vicinity, would you say food quality is..."
Response: 1-5 (Much Worse- Much Better)
Highest scoring prototypes: 9, 12, 14, 850
Lowest scoring prototypes: 11, 100, 700
Refer to Appendix for legend to mixed prototype labels conversion to numeric prototype labels
28
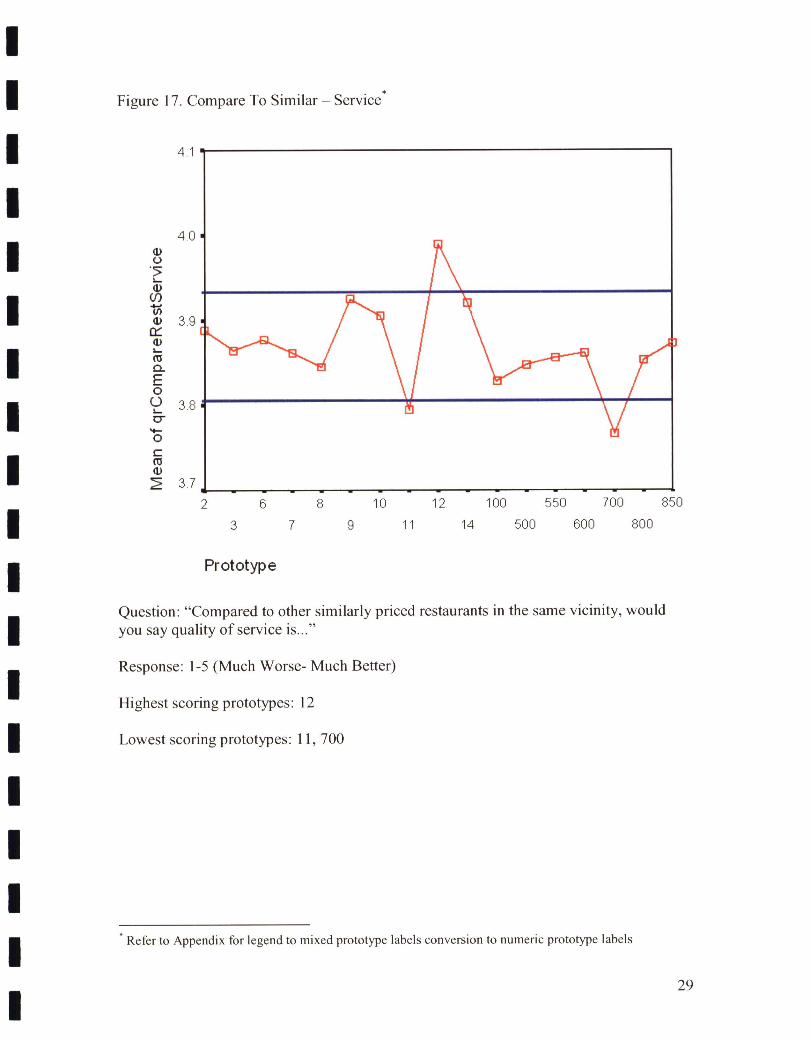
Figure 17. Compare To Similar Service*
41
40 a) 0 5 a)
a) 39
CL
a)
E 0
3.8
0
(5 a;
37
2 6 8 10 12 100 550 700 850
3 7 9 11 14 500 600 800
Prototype
Question: "Compared to other similarly priced restaurants in the same vicinity, would you say quality of service is..."
Response: 1-5 (Much Worse- Much Better)
Highest scoring prototypes: 12
Lowest scoring prototypes: 11, 700
Refer to Appendix for legend to mixed prototype labels conversion to numeric prototype labels
29
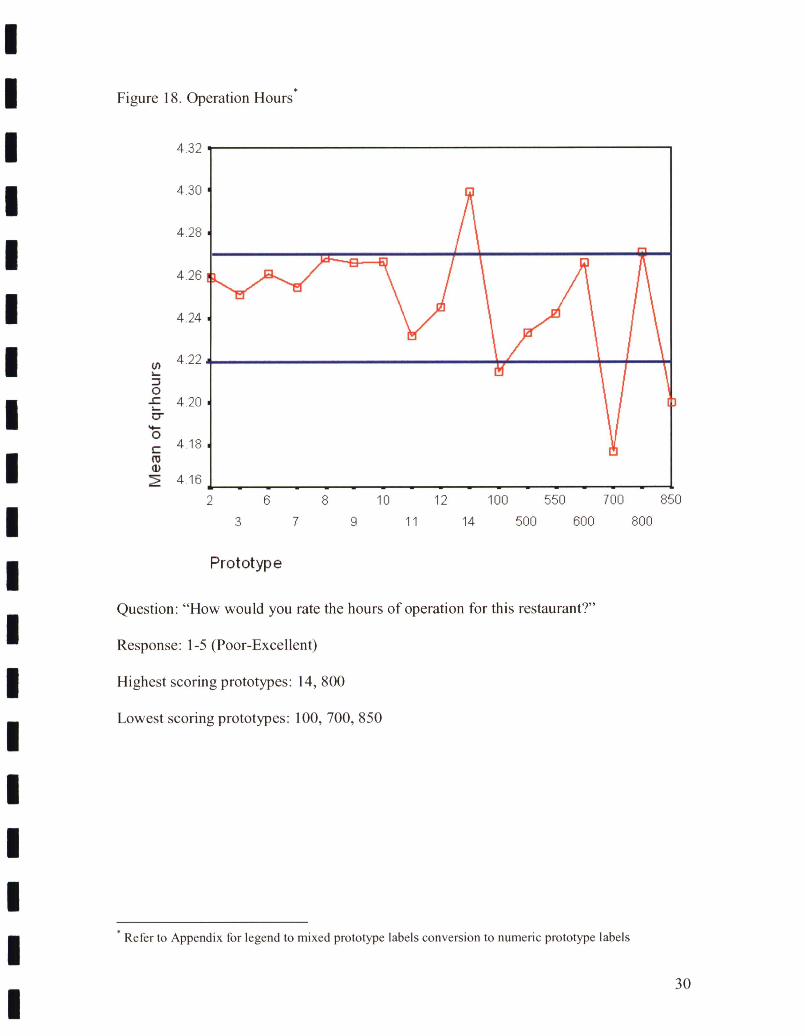
Figure 18. Operation Hours
4 24
4.22
-c 420
418
416
2 6 8 10 12 100 550 700 850
3 7 9 ii 14 500 600 800
Prototype
Question: "How would you rate the hours of operation for this restaurant?"
Response: 1-5 (Poor-Excellent)
Highest scoring prototypes: 14, 800
Lowest scoring prototypes: 100, 700, 850
* Refer to Appendix for legend to mixed prototype labels conversion to numeric prototype labels
30
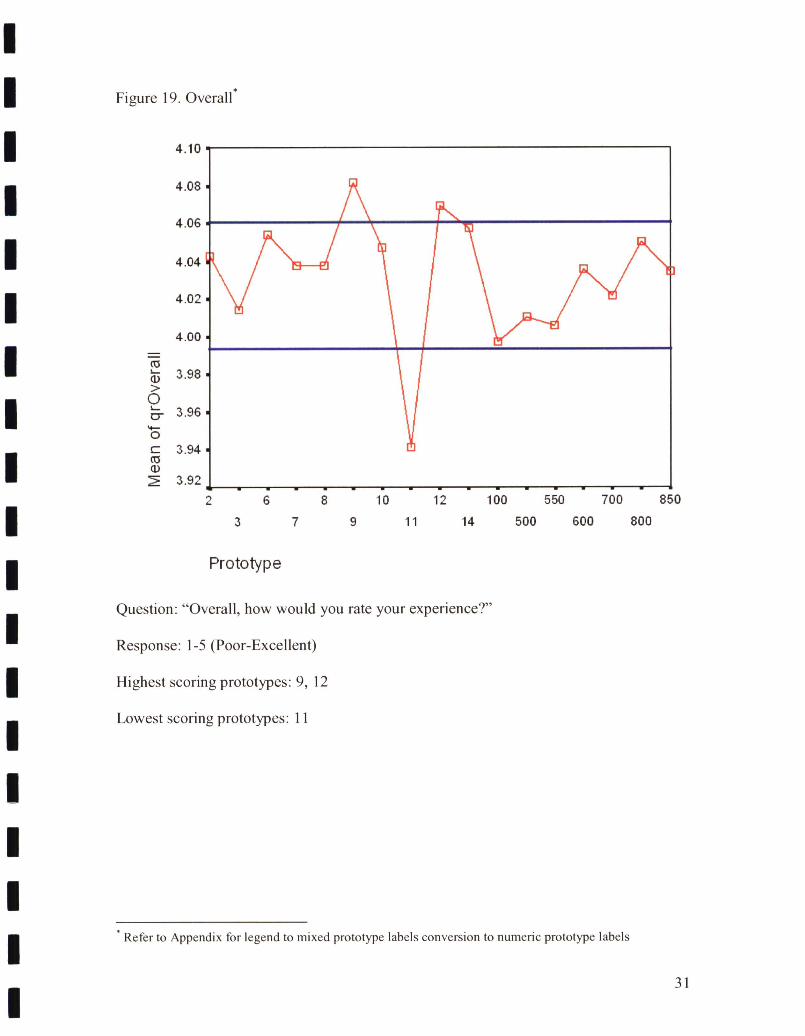
Figure 19. Overall*
4.10
4.08
4.06
4.04
4.02
4.00
(T5
>
2 D 3.96
0
C 3.94 ('3 a)
3.92j - -
2 6 8 10 12 100 550 700 850
3 7 9 11 14 500 600 800
Prototype
Question: "Overall, how would you rate your experience?"
Response: 1-5 (Poor-Excellent)
Highest scoring prototypes: 9, 12
Lowest scoring prototypes: 11
* Refer to Appendix tbr legend to mixed prototype labels conversion to numeric prototype labels
31
IThe questions in regard to overall comfort and overall cleanliness had a paired
question asking if the guest had rated it low, why. We found it was important to look that
the frequencies of the reasons to the poor responses for the questions regarding overall
Icomfort and overall cleanliness. In the GSS a low rating was considered anything less
than very good (4) or excellent (5) on a 1 to 5 scale.
32
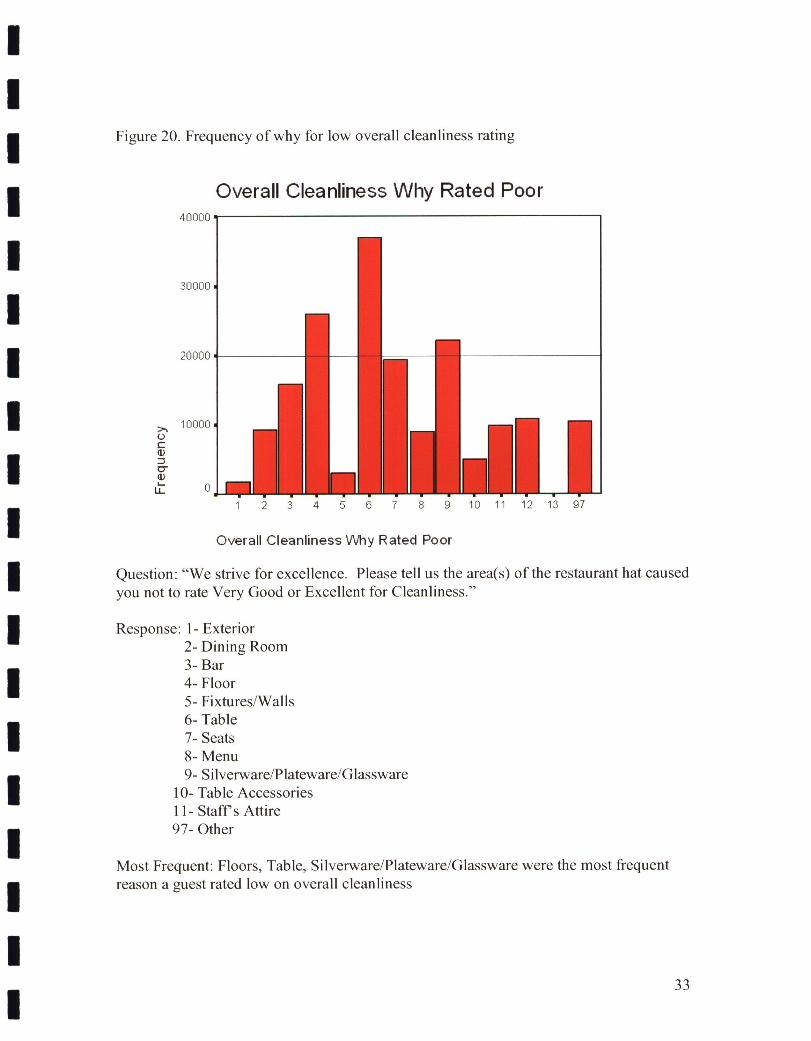
Figure 20. Frequency of why for low overall cleanliness rating
Overall Cleanliness Why Rated Poor 40000
30000
20000
10000 C)
a)
a) LIE 0
1 1 L H
Overall Cleanliness Why Rated Poor
Question: "We strive for excellence. Please tell us the area(s) of the restaurant hat caused you not to rate Very Good or Excellent for Cleanliness."
Response: 1- Exterior 2- Dining Room 3- Bar 4- Floor 5- Fixtures/Walls 6- Table 7- Seats 8- Menu 9- Silverware/Plateware/Glassware
10- Table Accessories 11- Staff's Attire 97- Other
Most Frequent: Floors, Table, Silverware/Plateware/Glassware were the most frequent reason a guest rated low on overall cleanliness
33
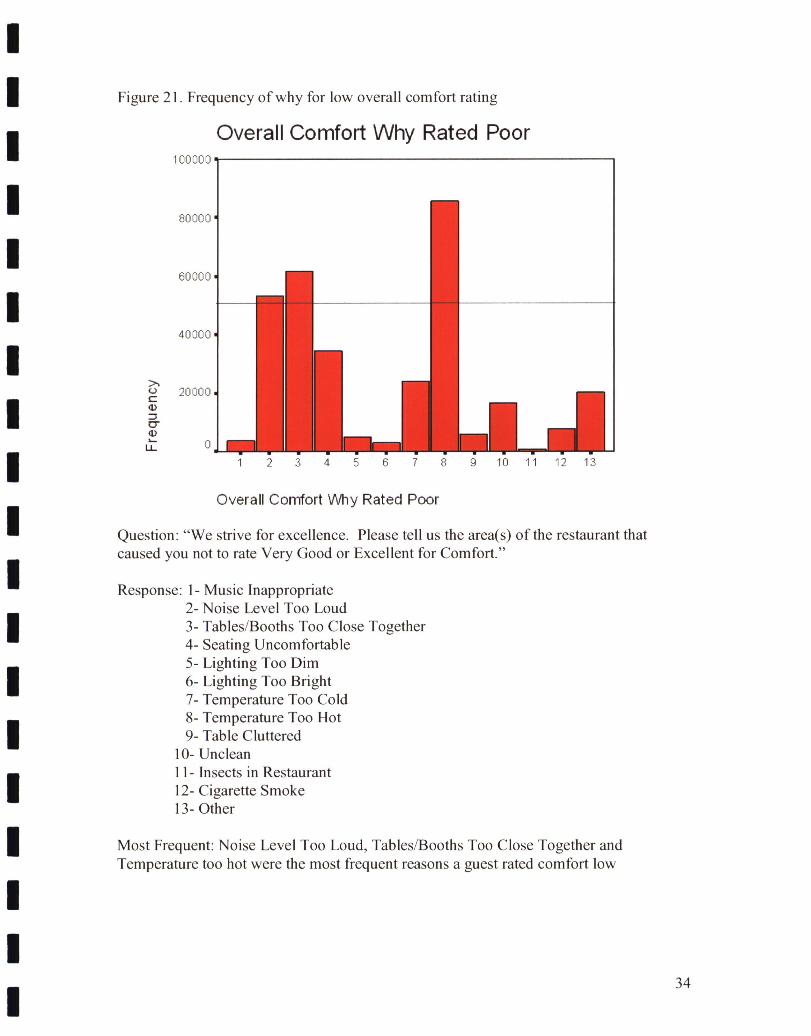
Figure 21. Frequency of why for low overall comfort rating
Overall Comfort Why Rated Poor 100000
80000
60000
40000
C-) 20000
07
(D
LL 0
1 5 5 H H H
Overall Comfort Why Rated Poor
Question: "We strive for excellence. Please tell us the area(s) of the restaurant that caused you not to rate Very Good or Excellent for Comfort."
Response: 1- Music Inappropriate 2- Noise Level Too Loud 3- Tables/Booths Too Close Together 4- Seating Uncomfortable 5- Lighting Too Dim 6- Lighting Too Bright 7- Temperature Too Cold 8- Temperature Too Hot 9- Table Cluttered
10- Unclean II- Insects in Restaurant 12-Cigarette Smoke 13-Other
Most Frequent: Noise Level Too Loud, Tables/Booths Too Close Together and Temperature too hot were the most frequent reasons a guest rated comfort low
34

Conclusion and Critique
35
We concluded, from our graphs and statistical output, that Prototypes 14 and 12
had high scores and Prototypes 11 and 7.X consistently scored low in the survey. After
reviewing the Prototype definitions we discovered that Prototype 14, which most often
had the highest mean scores, had recently been renovated and refurnished. It was safe to
assume that guests had enjoyed their restaurant experience here and the changes made to
the restaurant had improved guest satisfaction.
Since Prototype 11 was scoring low consistently we checked the output to see if
there were any trends. Most of the low scores for Prototype 11 were associated with the
staff and their lack of ability to keep the restaurant in order. There were consistent low
scores regarding the server's attentiveness, the speed with which food and drinks were
brought out to the guests and the time it took for the guest to receive his/her check and
pay for their meal. This could imply that the staffs at these restaurants are not trained well
or enthusiastic about their jobs or that the set-up and architecture of these restaurants is so
poor that it prevents the staff from being time-efficient and good servers.
Prototype 7.X is the same as prototype 7 except that it is expanded. There are
only 2 stores with this prototype and only 0.2% of all cases were from prototype 7.X
which could be the primary reason that 7.X consistently scored lower than 7 and most
other prototypes. The other reason 7.X may have scored low is because of its location.
The people in that particular area may not be fond of the prototype so if prototype 7 was
there it may have also scored poorly.
Our recommendations for Brinker regarding their Chili's restaurants is that there
may be a need to ask more direct and specific questions regarding each aspect of a
prototype. Another recommendation maybe for them to carry out some focus groups

inquiring about the low scoring prototypes in order to improve their scores or incorporate
some of Prototypes 14 and 12's characteristics into their low-scoring stores to improve
their ratings. Lastly, Brinker may want to do further analysis on the topic by examining
the top 2 boxes of scores as opposed to comparing themeans because at times the means
can be somewhat misleading with such a large amount of data.
37

Appendix
38
* Prototypes had to be relabeled as only numerical values in order to perform the analysis in SPSS
INumeric Prototype Label Mixed Prototype Label
10 10
12 12 14 14
100 SP I 500 800 8.M 550 5.A I 600 6.X 700 7.X 850 8.X
39


![Anti-Windup Implementation of Projected Dynamics · dynamical systems that encompasses projected gradient ow [17], projected New-ton ow [16], subgradient ow [9] and projected saddle-ows](https://img.pdfslide.us/doc/110x75/60294d1aac77a707331df610/anti-windup-implementation-of-projected-dynamics-dynamical-systems-that-encompasses.jpg)