Embed Size (px)
Citation preview
Abstract�Electron reconstructed biological data with few-nanometsurface models are conststructural data. These approximate the contrascomponents within the presented for obtainingcorrespond most closely the edge of each componsimulated volumetric datareconstructed volume ojunction of the frog.
O
Depart
Keywords�tomograp
optimization, electron mic
I. I The best spatial resoluorganization of subcellulis obtained in 3D recotissue samples genetomography [1-6]. Parti(2�3 nm) was obtained at the neuromuscular junmethod based on segminterest (VOIs), followesurface to model the strThe isodensity level ofhuman operator to prodappeared to provide a beedge of the structure con
We present a new meoptimal isodensity leveisodensity level is chosgradients in the vicinity method offers several amethod to obtain an accand more convenient tha[7-10], thus reducing ope
II. M Individual components osegmented to form VOIdelineate their boundariethen constructed using on
0-7803-7789-3/03/$17
Optimization Method for Isodensity Surface Models btained with Electron Microscope Tomography Data
D. Ress, M. L. Harlow, R. M. Marshall, U. J. McMahan
ment of Neurobiology, Stanford University Medical School, CA, USA
microscope tomography produces tissue volumes containing structural er spatial resolution. Frequently, ructed to visualize and analyze the models are usually constructed to t boundaries of various structural volume. An automatic method is isodensity surface models that
to the steepest contrast boundary at ent. We validate our method using , and demonstrate its application to a btained from the neuromuscular
An initial isodensity level is chosen using the cumulative distribution function for gray values within the VOI. Specifically, we select the value that most closely corresponds to that enclosing 60% of the darkest voxels within the isodensity surface. This initial surface provides what is usually a structurally reasonable starting point for the optimization.
A spatial-gradient quality metric, M, is then calculated for the surface. At each vertex on the surface, the local vector spatial gradient,
v ∇ G , is calculated by convolving the
gray-scale data in the vicinity of the vertex with 3×3×3 Cartesian finite difference kernels dx, y, z, (For example, dx consists of nine repeated rows of the vector [0.5, -1, 0.5].) Next, the outward surface-normal vector, , is calculated at each vertex, and we form the scalar product of this vector with the spatial gradient to obtain the outward-normal component of the spatial gradient. Finally, we calculate the area of the surface trapezoid associated with each vector, and form the area-weighted sum of the normal spatial gradient, a numerical approximation of:
� nhy, segmentation, ultrastructure, roscopy
NTRODUCTION
tion for studying the shapes and ar components in biological tissues nstructions of heavy-metal stained rated by electron microscope cularly high-resolution information from the active-zone material found ction of the frog, using an analysis
entation of individual volumes-of-d by construction of an isodensity ucture contained with the VOI [5]. these surfaces was adjusted by a uce a surface model that visually st fit to the contrast boundary at the tained in the VOI.
M = dA � n •v ∇ G( )∫ . (1)
The isodensity value of the surface is now varied in an optimization process that seeks to maximize M. We use a standard optimization routine that is implemented in the software product IDL (Research Systems Inc, Boulder, CO, USA), using a downhill-simplex method [11].
To provide an objective standard to assess the performance of the optimization method, we created a simulated volume containing realistic representations of synaptic vesicles. We chose an isotropic voxel size of 1 nm, a reasonable value for actual reconstructed EM tomography volumes. Vesicles were simulated by summing a few low-order spherical harmonics to create a spheroidal shape with roughly 50-nm diameter. To assess the ability of our surface models to delineate fine-scale structure, surface texture was created by adding additional low-amplitude, high-order spherical harmonics. Superposing two such spheroids with radii offset by 5 nm simulated the trilaminar character of stained membranes. The entire simulated volume was smoothed slightly (3×3×3 boxcar kernel, repeated twice) to reduce quantization artifacts, and normally distributed noise was added to simulate a typical signal-to-noise ratio of five.
thod to automatically determine an l for each surface model. The en to maximize the local spatial of the isodensity contour. The new dvantages. It provides an objective urate surface model, and it is faster n visually guided manual methods rator time and effort.
Surface models were also obtained from actual data from the frog neuromuscular junction. Our preparations were conventional [12, 13]. Briefly, cutaneous pectoris muscles of adult Rana pipiens (5 cm nose rump length) were, in sequence, fixed with 1% phosphate buffered glutaraldehyde, refixed and stained with 1% osmium tetroxide in phosphate
ETHODOLOGY
f the reconstructed volume are first s that contain but do not precisely s [5]. Isodensity surface models are ly the contents of each VOI.
.00 ©2003 IEEE 774 EMBC 2003
buffer, stained with saturated aqueous uranyl acetate, dehydrated in ethanol and propylene oxide and embedded in Epon 812. Thin sections having a silver interference color (~50 nm thick) were mounted on 1×2 mm single slot Formvar coated grids, and stained with uranyl acetate followed by lead citrate. For use in the alignment of tilt images, mounted sections were floated on a drop of ~ 0.01% unconjugated gold colloid in H2O (Sigma Chemical Co, St Louis, MO) for 1�2 min and air-dried.
The data set was made at room temperature on a FEI Tecnai T20 electron microscope operated at 200KV. It was equipped with LaB6 electron source, a cryoholder and a 1024×1024 CCD. The tilt series consisted of 201 images spanning angles from -75° to +75° in 0.75° increments. The images were made at a microscope magnification of 29,000×, yielding a pixel size of 0.59 nm in the image.
The gold beads on the section served as fiducial markers for aligning the tilt images. We used an alignment scheme previously developed in our laboratory [12] that provided an accuracy of 2.1 pixels (1.2 nm) RMS. Volume reconstructions were produced by weighted backprojection, and this volume was then downsampled 2× to reduce computational load.
Vesicles were segmented from the reconstructed volume using a semi-automatic method applied to a series of 2D slices. Segmentation was initiated by having an operator mark an anchor path on a single volume slice. This path was then automatically propagated perpendicular to the slice plane. The segmentation VOIs were somewhat larger than the stained structures that they enclosed to allow accurate and complete isodensity-surface calculations [5].
III. RESULTS A. Simulated synaptic vesicle
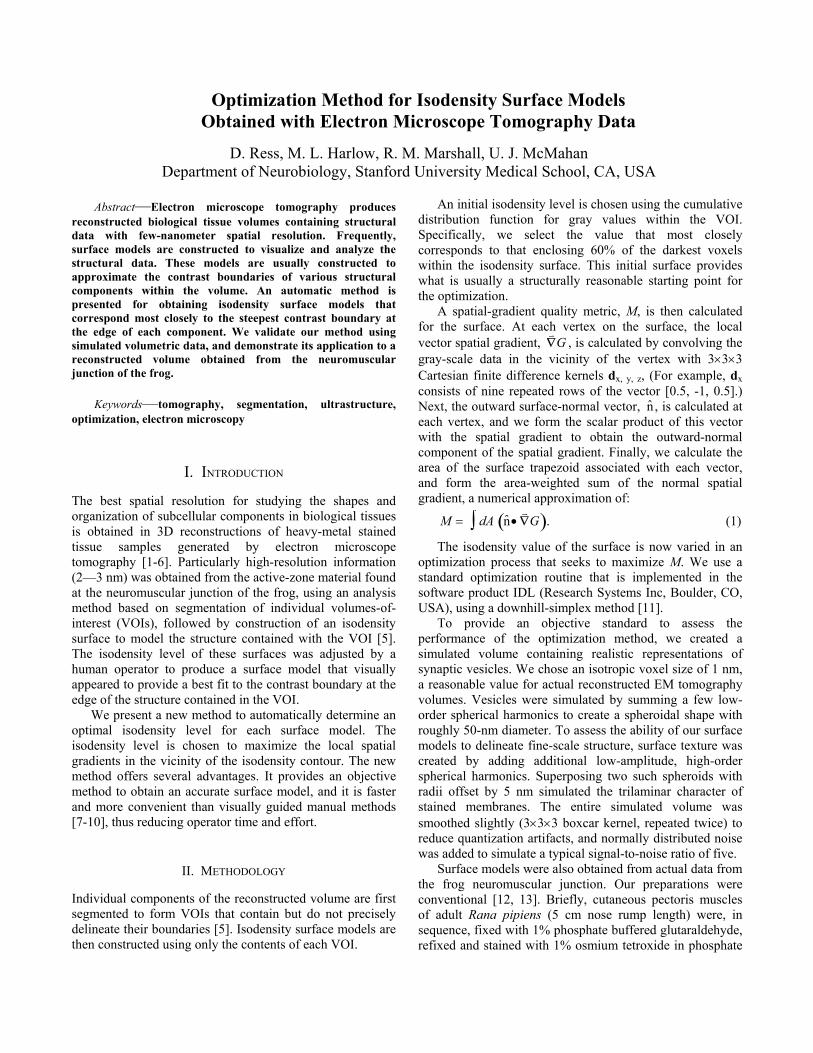
Surface models were generated and optimized for a simulated volume containing several vesicles and some simple cylindrical structures that simulate active-zone material. Here, we present the results of optimizing the isodensity surface model for one of the vesicles. The default choice of isodensity level is not optimal. The blue �x� in Fig. 1 indicates the M value of the initial choice. The optimization routine sampled the isodensity levels shown by the set of orange asterisk symbols. For reference, these points are overlaid on curve formed by calculating M on a closely sampled grid of isodensity levels.
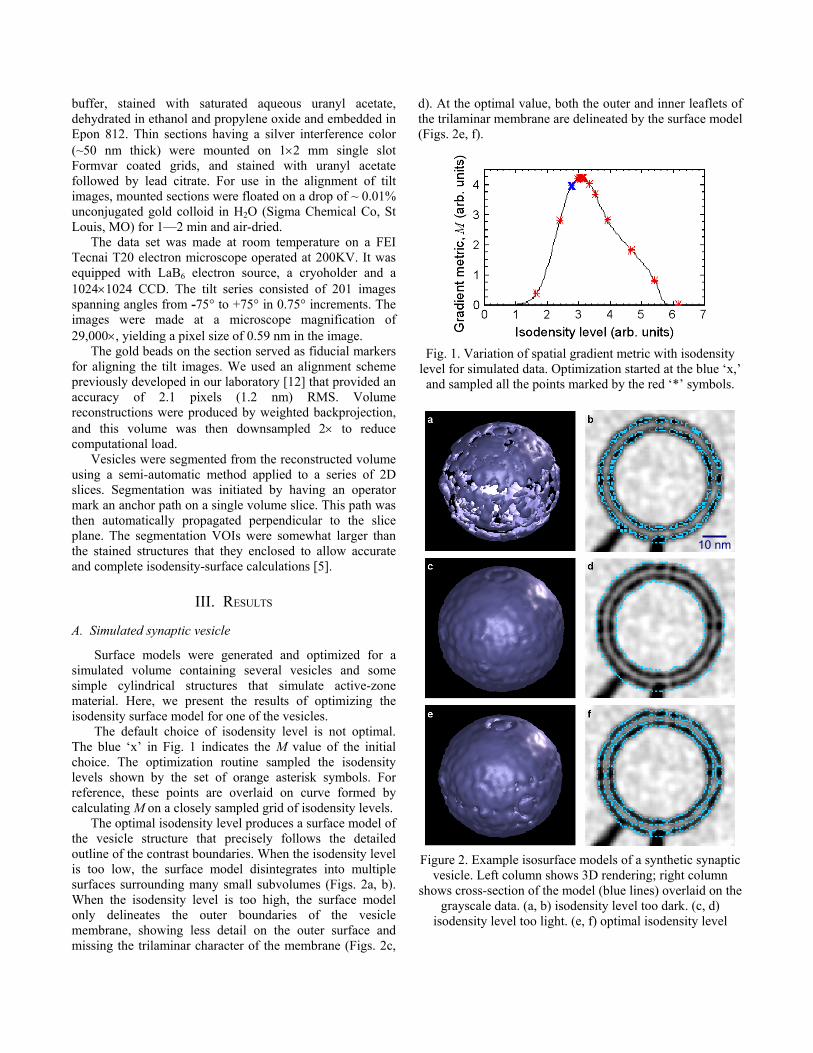
The optimal isodensity level produces a surface model of the vesicle structure that precisely follows the detailed outline of the contrast boundaries. When the isodensity level is too low, the surface model disintegrates into multiple surfaces surrounding many small subvolumes (Figs. 2a, b). When the isodensity level is too high, the surface model only delineates the outer boundaries of the vesicle membrane, showing less detail on the outer surface and missing the trilaminar character of the membrane (Figs. 2c,
d). At the optimal value, both the outer and inner leaflets of the trilaminar membrane are delineated by the surface model (Figs. 2e, f).
Fig. 1. Variation of spatial gradient metric with isodensity level for simulated data. Optimization started at the blue �x,� and sampled all the points marked by the red �*� symbols.
10 nm
Figure 2. Example isosurface models of a synthetic synaptic vesicle. Left column shows 3D rendering; right column
shows cross-section of the model (blue lines) overlaid on the grayscale data. (a, b) isodensity level too dark. (c, d)
isodensity level too light. (e, f) optimal isodensity level
775
B. Actual synaptic vesicle
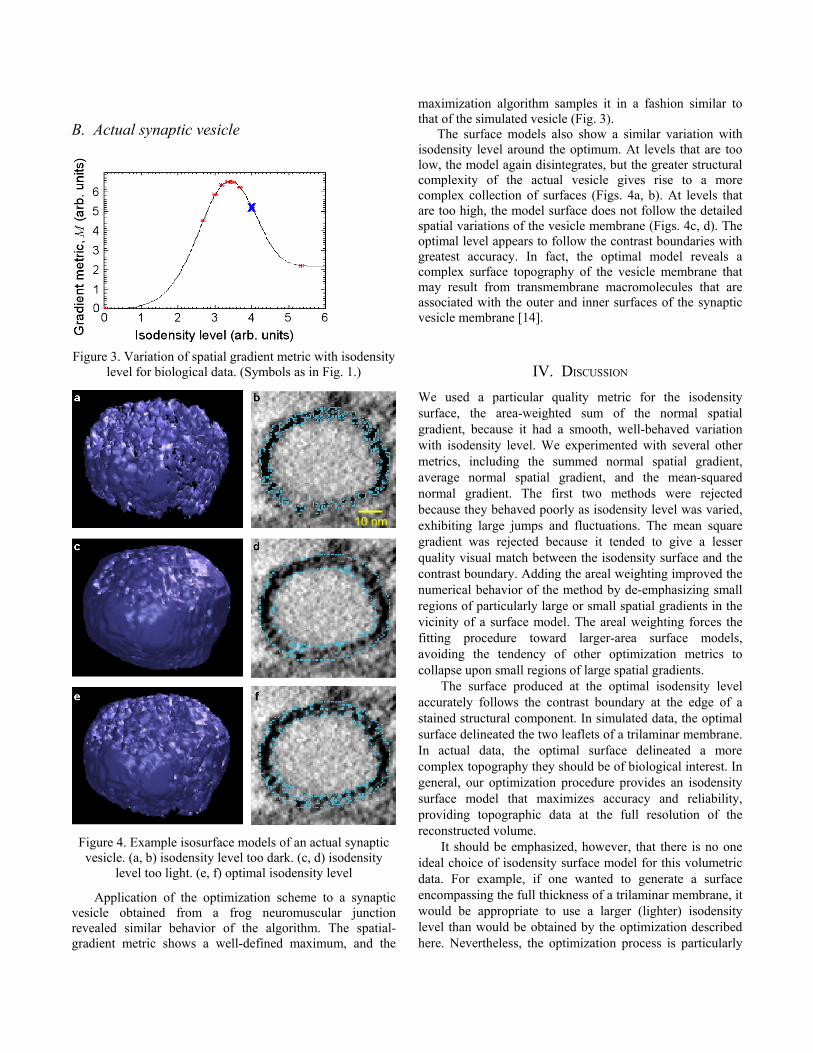
Figure 3. Variation of spatial gradient metric with isodensity level for biological data. (Symbols as in Fig. 1.)
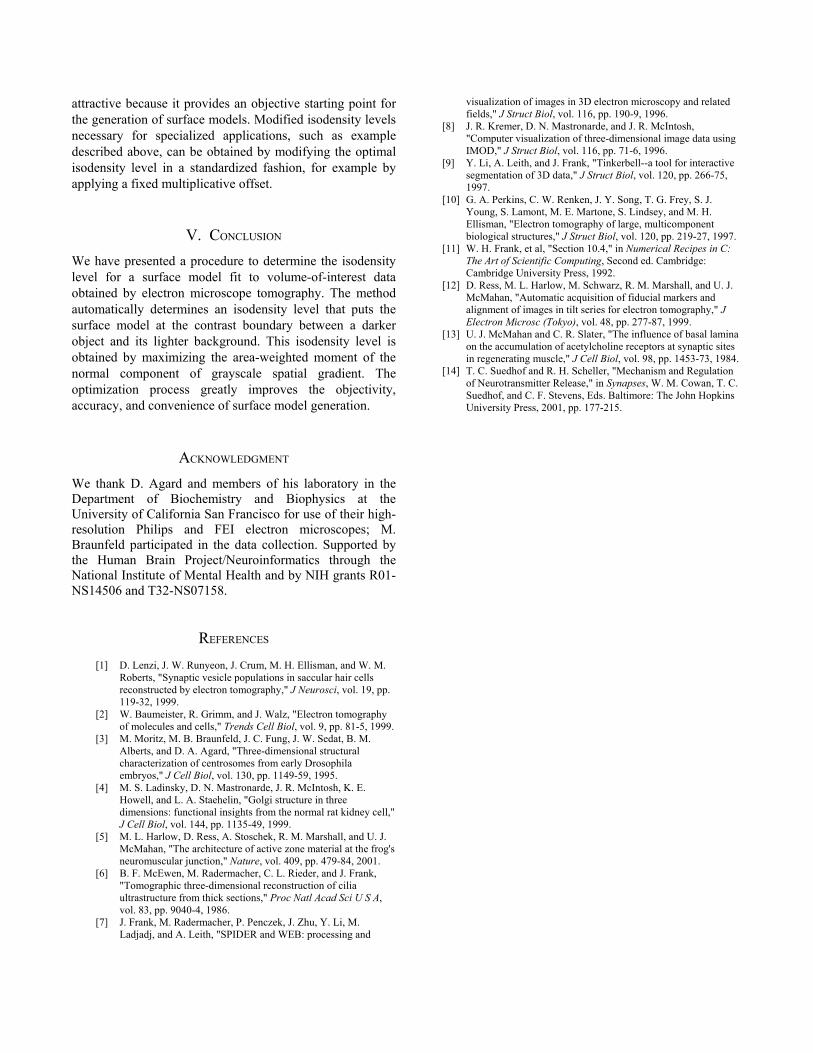
Figure 4. Example isosurface models of an actual synaptic vesicle. (a, b) isodensity level too dark. (c, d) isodensity
level too light. (e, f) optimal isodensity level
Application of the optimization scheme to a synaptic vesicle obtained from a frog neuromuscular junction revealed similar behavior of the algorithm. The spatial-gradient metric shows a well-defined maximum, and the
maximization algorithm samples it in a fashion similar to that of the simulated vesicle (Fig. 3).
The surface models also show a similar variation with isodensity level around the optimum. At levels that are too low, the model again disintegrates, but the greater structural complexity of the actual vesicle gives rise to a more complex collection of surfaces (Figs. 4a, b). At levels that are too high, the model surface does not follow the detailed spatial variations of the vesicle membrane (Figs. 4c, d). The optimal level appears to follow the contrast boundaries with greatest accuracy. In fact, the optimal model reveals a complex surface topography of the vesicle membrane that may result from transmembrane macromolecules that are associated with the outer and inner surfaces of the synaptic vesicle membrane [14].
IV. DISCUSSION
We used a particular quality metric for the isodensity surface, the area-weighted sum of the normal spatial gradient, because it had a smooth, well-behaved variation with isodensity level. We experimented with several other metrics, including the summed normal spatial gradient, average normal spatial gradient, and the mean-squared normal gradient. The first two methods were rejected because they behaved poorly as isodensity level was varied, exhibiting large jumps and fluctuations. The mean square gradient was rejected because it tended to give a lesser quality visual match between the isodensity surface and the contrast boundary. Adding the areal weighting improved the numerical behavior of the method by de-emphasizing small regions of particularly large or small spatial gradients in the vicinity of a surface model. The areal weighting forces the fitting procedure toward larger-area surface models, avoiding the tendency of other optimization metrics to collapse upon small regions of large spatial gradients.
10 nm
The surface produced at the optimal isodensity level accurately follows the contrast boundary at the edge of a stained structural component. In simulated data, the optimal surface delineated the two leaflets of a trilaminar membrane. In actual data, the optimal surface delineated a more complex topography they should be of biological interest. In general, our optimization procedure provides an isodensity surface model that maximizes accuracy and reliability, providing topographic data at the full resolution of the reconstructed volume. It should be emphasized, however, that there is no one ideal choice of isodensity surface model for this volumetric data. For example, if one wanted to generate a surface encompassing the full thickness of a trilaminar membrane, it would be appropriate to use a larger (lighter) isodensity level than would be obtained by the optimization described here. Nevertheless, the optimization process is particularly
776
attractive because it provides an objective starting point for the generation of surface models. Modified isodensity levels necessary for specialized applications, such as example described above, can be obtained by modifying the optimal isodensity level in a standardized fashion, for example by applying a fixed multiplicative offset.
V. CONCLUSION
We have presented a procedure to determine the isodensity level for a surface model fit to volume-of-interest data obtained by electron microscope tomography. The method automatically determines an isodensity level that puts the surface model at the contrast boundary between a darker object and its lighter background. This isodensity level is obtained by maximizing the area-weighted moment of the normal component of grayscale spatial gradient. The optimization process greatly improves the objectivity, accuracy, and convenience of surface model generation.
ACKNOWLEDGMENT
We thank D. Agard and members of his laboratory in the Department of Biochemistry and Biophysics at the University of California San Francisco for use of their high-resolution Philips and FEI electron microscopes; M. Braunfeld participated in the data collection. Supported by the Human Brain Project/Neuroinformatics through the National Institute of Mental Health and by NIH grants R01-NS14506 and T32-NS07158.
REFERENCES
[1] D. Lenzi, J. W. Runyeon, J. Crum, M. H. Ellisman, and W. M. Roberts, "Synaptic vesicle populations in saccular hair cells reconstructed by electron tomography," J Neurosci, vol. 19, pp. 119-32, 1999.
[2] W. Baumeister, R. Grimm, and J. Walz, "Electron tomography of molecules and cells," Trends Cell Biol, vol. 9, pp. 81-5, 1999.
[3] M. Moritz, M. B. Braunfeld, J. C. Fung, J. W. Sedat, B. M. Alberts, and D. A. Agard, "Three-dimensional structural characterization of centrosomes from early Drosophila embryos," J Cell Biol, vol. 130, pp. 1149-59, 1995.
[4] M. S. Ladinsky, D. N. Mastronarde, J. R. McIntosh, K. E. Howell, and L. A. Staehelin, "Golgi structure in three dimensions: functional insights from the normal rat kidney cell," J Cell Biol, vol. 144, pp. 1135-49, 1999.
[5] M. L. Harlow, D. Ress, A. Stoschek, R. M. Marshall, and U. J. McMahan, "The architecture of active zone material at the frog's neuromuscular junction," Nature, vol. 409, pp. 479-84, 2001.
[6] B. F. McEwen, M. Radermacher, C. L. Rieder, and J. Frank, "Tomographic three-dimensional reconstruction of cilia ultrastructure from thick sections," Proc Natl Acad Sci U S A, vol. 83, pp. 9040-4, 1986.
[7] J. Frank, M. Radermacher, P. Penczek, J. Zhu, Y. Li, M. Ladjadj, and A. Leith, "SPIDER and WEB: processing and
visualization of images in 3D electron microscopy and related fields," J Struct Biol, vol. 116, pp. 190-9, 1996.
[8] J. R. Kremer, D. N. Mastronarde, and J. R. McIntosh, "Computer visualization of three-dimensional image data using IMOD," J Struct Biol, vol. 116, pp. 71-6, 1996.
[9] Y. Li, A. Leith, and J. Frank, "Tinkerbell--a tool for interactive segmentation of 3D data," J Struct Biol, vol. 120, pp. 266-75, 1997.
[10] G. A. Perkins, C. W. Renken, J. Y. Song, T. G. Frey, S. J. Young, S. Lamont, M. E. Martone, S. Lindsey, and M. H. Ellisman, "Electron tomography of large, multicomponent biological structures," J Struct Biol, vol. 120, pp. 219-27, 1997.
[11] W. H. Frank, et al, "Section 10.4," in Numerical Recipes in C: The Art of Scientific Computing, Second ed. Cambridge: Cambridge University Press, 1992.
[12] D. Ress, M. L. Harlow, M. Schwarz, R. M. Marshall, and U. J. McMahan, "Automatic acquisition of fiducial markers and alignment of images in tilt series for electron tomography," J Electron Microsc (Tokyo), vol. 48, pp. 277-87, 1999.
[13] U. J. McMahan and C. R. Slater, "The influence of basal lamina on the accumulation of acetylcholine receptors at synaptic sites in regenerating muscle," J Cell Biol, vol. 98, pp. 1453-73, 1984.
[14] T. C. Suedhof and R. H. Scheller, "Mechanism and Regulation of Neurotransmitter Release," in Synapses, W. M. Cowan, T. C. Suedhof, and C. F. Stevens, Eds. Baltimore: The John Hopkins University Press, 2001, pp. 177-215.
777