Embed Size (px)
Citation preview

Engineering Fracture Mechanics 78 (2011) 1277–1288
Contents lists available at ScienceDirect
Engineering Fracture Mechanics
journal homepage: www.elsevier .com/locate /engfracmech
Fracture toughness of foams with tetrakaidecahedral unit cells usingfinite element based micromechanics
Prasanna Thiyagasundaram 1, Junqiang Wang 2, Bhavani V. Sankar ⇑, Nagaraj K. ArakereDepartment of Mechanical and Aerospace Engineering, PO Box 116250, University of Florida, Gainesville, FL 32611-6250, USA
a r t i c l e i n f o
Article history:Received 27 July 2010Received in revised form 11 December 2010Accepted 4 January 2011Available online 15 January 2011
Keywords:Cellular materialsFoamsFracture toughnessMicromechanicsTetrakaidecahedral unit cell
0013-7944/$ - see front matter � 2011 Elsevier Ltddoi:10.1016/j.engfracmech.2011.01.003
⇑ Corresponding author.E-mail addresses: [email protected] (P. Thiyagasu
1 Present address: Intel Corporation, Portland, Ore2 Present address: Belcan Engineering Group Inc., C
a b s t r a c t
Fracture toughness of open-cell foams consisting of tetrakaidecahedral unit cells is pre-dicted by simulating crack propagation using a finite element (FE) based micromechanicalmodel. The inputs to the model are the geometric parameters required to model therepeating unit cell and tensile strength of the foam ligament or strut. Cracks are createdby removing certain number of cells pertaining to a crack length. The FE model consistsof a local micro-scale region surrounding the crack tip. For an assumed stress intensity fac-tor, the displacements along the boundary of the local model are calculated based on linearelastic fracture mechanics for orthotropic materials. The stresses in the ligaments ahead ofthe crack tip calculated from this micro-model in conjunction with the tensile strength ofthe strut material are used to predict fracture toughness. A parametric study with differentmicro-model sizes and different crack lengths is performed to check for convergence ofpredicted Mode-I, Mode-II and mixed mode fracture toughness values. The effect of apply-ing rotations as additional boundary conditions along with translational displacementboundary conditions on the predicted fracture toughness values is also studied.
� 2011 Elsevier Ltd. All rights reserved.
1. Introduction
Cellular materials are made up of a network of beam or plate-like structures. There are a number of cellular materials thatoccur in nature, such as honeycombs, wood, bone, and cork. Cellular materials can offer high thermal resistance, low density,and high energy-absorption. Foams are a class of cellular solids, generally made by dispersing gas into a liquid and then cool-ing it to solidify. Foams are categorized as open-cell and closed-cell foams. Depending on the solid materials made intofoams, they are also categorized as polymeric, metallic, and ceramic foams, etc. Due to developments in material scienceand manufacturing techniques, advanced foams have great potential for use in automobile, aircraft, and space vehicle struc-tures. A special example is the application in thermal protection system (TPS) of space vehicles. Most of the available liter-ature focuses on thermo-elastic constants of foams, whereas fracture and failure have been paid very little attention. Thusthere exists an urgent need for the study of crack propagation behavior and fracture toughness of foams. Since the represen-tative volume element or unit cell of many types of foams such as the carbon foam.
Fig. 1 could be well approximated as a tetrakaidecahedron (Fig. 2), fracture toughness of tetrakaidecahedral foams will bestudied in this paper.
. All rights reserved.
ndaram), [email protected] (B.V. Sankar), [email protected] (N.K. Arakere).gon, United States.
incinnati, Ohio, United States.

Nomenclature
D length of the side of equilateral triangle cross section of the strutE001, E010, E100 elastic moduli of the foam in the lattice vector directionsGc critical strain energy release rateKI Mode I stress intensity factorKIc Mode-I fracture toughnessKII Mode II stress intensity factorKIIc Mode-II fracture toughnessl length of each strut in the tetrakaidecahedron unit cellxxy rotations in the XY plane (Fig. 3)p, q, s parameters dependent on the material constants of the foamw phase angle used as a measure of mode mixityr radial distance of points in the K-field boundary from the crack tipSij compliance matrix coefficients of the foamq� density of the foamqs density of the solid materialrtip maximum principal stress in the strut in the vicinity of crack tipru ultimate tensile strength of struth angle measured between the positive X-axis and line joining the crack tip to the points in the K-field boundaryu displacement in the X-direction (Fig. 3),v displacement in the Y-direction (Fig. 3)
1278 P. Thiyagasundaram et al. / Engineering Fracture Mechanics 78 (2011) 1277–1288
It has been accepted for a long time that a tetrakaidecahedron, packed in a BCC structure, satisfies the minimum surfaceenergy condition for mono-dispersed bubbles [1]. Only in 1994 a little better example with smaller surface energy was found[2]. The tetrakaidecahedral foams have held the interest of researchers for decades. Microcellular graphitic carbon foamswere first developed at the US Air Force Research Laboratory in the 1990s [3]. The repeating unit cell of this foam can beapproximated by a regular tetrakaidecahedron [4]. Micromechanical models have been used to predict mechanical proper-ties such as Young’s modulus, bulk modulus, yield surface, etc. Linear elastic behavior of low-density tetrakaidecahedralfoams has been studied [5,6] and analytical model of elastic moduli has been developed [7]. Based on this analytical model,a fracture model for rigid polyurethane foam was derived analytically [8]. Nonlinear elastic response of the foams was stud-ied under compressive loading and a failure surface was defined [9]. However, not much work has been done on predictingthe fracture toughness of tetrakaidecahedral foams.
The most important parameter of cellular materials is the relative density �q ¼ q�=qs, where q� is the density of cellularmedium and qs the solid density, which is the density of the material that constitutes the struts or plates of the cell. The rel-ative density is a measure of solidity, and most of the material properties depend on the relative density. Analytical methodsfor determining the mechanical and thermal properties of cellular solids are well documented. However, research on fracture
Fig. 1. Micrograph of an AFRL carbon foam [3].

Fig. 2. Three tetrakaidecahedral cells with strut length l and thickness t in a BCC lattice [16].
P. Thiyagasundaram et al. / Engineering Fracture Mechanics 78 (2011) 1277–1288 1279
behavior of foams is still at its infancy. A theoretical model [10] showed that the Mode-I fracture toughness of open-cell foamsKIc was proportional to (q�/qs)3 and Mode-II fracture toughness to (q�/qs)2. This theoretical model was confirmed by studyingseveral open-cell foams with short cracks [11,12]. Experiments were conducted to verify the theoretical model [13–15]. Acomprehensive summary of mechanical properties of foams including fracture toughness could be found in Gibson and Ash-by’s book [16]. Recently, new results and models on fracture toughness of open-cell foams were presented [17–19].
FEM based micromechanics is one of the methods to investigate the fracture toughness of cellular materials. In this meth-od displacement boundary conditions corresponding to a given stress intensity factor are calculated based on linear elasticfracture mechanics and applied to the micro-model. This approach was first used by Schmidt and Fleck [20] to study crackgrowth initiation and subsequent resistance to propagation in hexagonal honeycomb structures made from ductile cellwalls. K-resistance curves were calculated under the assumption of small-scale yielding. Choi and Sankar [17,18] later useda similar approach for studying the fracture behavior of carbon foams. It has also been used to study the damage tolerance ofelastic–brittle, 2-D isotropic lattices [21].
We use the same approach as Choi and Sankar [17,18] to determine the fracture toughness of tetrakaidecahedral foams.We directly apply displacements based on the K-field on the boundary of the micromechanical model. A commercial soft-ware – ABAQUS� – is used for FEM calculations and the input files of FEM are generated by MATLAB�. Furthermore, weinvestigate the effect of applying rotations as boundary conditions [21] in addition to prescribed translational displacementboundary conditions on the predicted fracture toughness.
2. Approach
Our approach is a global–local approach wherein the microstructure is modeled in detail near the crack tip (inner region),and boundary conditions are applied at far away points (outer region) according to continuum fracture mechanics (see
X
Y
Fig. 3. Finite element micro-scale model of the cellular medium with a crack. The dimensions of the model depend on the number of unit cells used.

1280 P. Thiyagasundaram et al. / Engineering Fracture Mechanics 78 (2011) 1277–1288
Fig. 3). The foam in the outer region is considered as a homogeneous orthotropic material. The microstructure of the innerregion surrounding the crack tip is modeled in detail. The individual struts of the foam are modeled using finite elements.Consequently we assume that the displacement and stress fields in the outer region are well described by continuum frac-ture mechanics. Thus the displacements along the boundary of the inner and outer regions can be predicted by fracturemechanics equations for a given stress intensity factor. Obviously the inner region should be much larger than the strutdimensions. We verify this by performing a convergence study by varying the size of the inner region.
For foams made of brittle materials, once we know the stress intensity factor at macroscale and the corresponding max-imum micro-scale tensile stresses in the struts ahead of the crack, we can calculate the fracture toughness of the foam by thefollowing equation [17]:
Table 1Propert
Mate
Geom
Cros
K I
K Ic¼ rtip
ru) K Ic ¼
K I
rtipru ð1Þ
where KI is the Mode I stress intensity factor, KIc is the Mode-I fracture toughness, ru is the tensile strength of struts or thefoam ligaments, and rtip is the maximum tensile stress in the first unbroken strut ahead of the crack tip.
Sih and Liebowitz [22] determined the K-field in the vicinity of a crack tip in homogeneous orthotropic materials. We candirectly apply displacements based on the K-field on the boundary of the microstructure. The displacement field near thecrack tip for Mode I:
uðr; hÞ ¼ K I
ffiffiffiffiffi2rp
rRe
1s1 � s2
s1p2ðcos hþ s2 sin hÞ1=2 � s2p1ðcos hþ s1 sin hÞ1=2h i� �
vðr; hÞ ¼ K I
ffiffiffiffiffi2rp
rRe
1s1 � s2
s1q2ðcos hþ s2 sin hÞ1=2 � s2q1ðcos hþ s1 sin hÞ1=2h i� �
ð2Þ
Fig. 4. A tetrakaidecahedral unit cell and the cross section of a strut.
ies of the strut chosen for Fracture toughness calculation.
Property Value
rial properties of the strut Density, qs (kg/m3) 1650Elastic modulus, Es (GPa) 23.42Poisson ratio, ms 0.33Tensile strength ru (MPa) 689.5
etry (Fig. 4–1) L (mm) 1D (mm) 0.06Relative density 0.001653
s-section properties (equilateral triangle) Cross sectional area, A (m2) 1.5588 � 10�9
Moment of Inertia, Ix, Iy (m4) 2.3382 � 10�19
Polar moment of Inertia, J (m4) 4.6765 � 10�19

P. Thiyagasundaram et al. / Engineering Fracture Mechanics 78 (2011) 1277–1288 1281
The displacement field near the crack tip for Mode II:
F
uðr; hÞ ¼ K II
ffiffiffiffiffi2rp
rRe
1s1 � s2
p2ðcos hþ s2 sin hÞ1=2 � p1ðcos hþ s1 sin hÞ1=2h i� �
vðr; hÞ ¼ K II
ffiffiffiffiffi2rp
rRe
1s1 � s2
q2ðcos hþ s2 sin hÞ1=2 � q1ðcos hþ s1 sin hÞ1=2h i� �
ð3Þ
Table 2Elastic properties of the foam used in the current study.
Property Value
Elastic moduli Ex = Ex = Ez (Pa) 46.7 � 103
Poisson ratios mxy = myz = mxz 0.498Shear moduli Gxy = Gyz = Gxz (Pa) 14.9 � 103
ig. 5. Mode-I fracture toughness (deformed configurations). (A) 10(w) � 11(h), (B) 16(w) � 15(h), (C) 24(w) � 25(h), and (D) 30(w) � 31(h).

1282 P. Thiyagasundaram et al. / Engineering Fracture Mechanics 78 (2011) 1277–1288
In the above relations the displacements are given as a function of polar coordinates r and h instead of usual x and y forconvenience. The parameters p, q and s are dependent on material elastic constants and the relations can be found in Sih andLiebowitz [22]. The details of obtaining the stiffness matrix has also been given in Appendix A. Using the expressions for uand v in the above equations, rotations about the z-axis can be calculated as
Table 3Mode-I
Case
123456789
10111213
xxy ¼12@v@x� @u@y
� �ð4Þ
The expressions for obtaining the deformation gradients @v@x ;
@u@y
� �are given in Appendix B.
After we find the maximum tensile stress in the struts near the crack tip, we can use Eq. (1) to obtain the Mode-I fracturetoughness of the foam. For Mode-II fracture toughness, we use KII and KIIc in Eq. (1) instead of KI and KIc.
3. FEM model of the unit cell
The tetrakaidecahedral unit cell that we propose to study is a 14-sided polyhedron with six square and eight hexagonalfaces. It is more precisely called truncated octahedron, since it is created by truncating the corners of an octahedron [23].From a different viewpoint, it can be generated by truncating the corners of a cube [7]. All the edges of the cell are of equallength L and cross sectional area A as shown in Fig. 4. The tetrakaidecahedral foam has a BCC lattice structure. The axes of theBCC lattice are parallel to the axes of the cube. Due to the symmetry of the structure, the Young’s moduli of the foam in thelattice vector directions are equal:
E�001 ¼ E�010 ¼ E�100 ð5Þ
Each strut of the cell is treated as a beam element. In our study, the cross section of the struts is assumed to be an equi-lateral triangle with side length D (Fig. 4). Similar foam with triangular cross section was studied by Zhu et al. [7]. The tri-angular cross section is considered closer to the three-cusp hypocycloid cross section of polyurethane foams as was shownby Sullivan et al. from their microstructure studies [24]. In the finite element analysis we need to input numerical values forthe solid material properties. The properties used in this study are given in Table 1.
We use the finite element based micromechanical analysis described by Thiyagasundaram et al. [25] to calculate thehomogeneous elastic constants of the foam. One can also use the analytical expressions derived by Zhu et al. [7]. The calcu-lated properties are given in Table 2. These properties were used to calculate the compliance coefficients in Eq. (A1) inAppendix A. We have used the two-node Euler–Bernoulli (B33) beam elements in ABAQUS 6.9–2 to model the struts.
4. Results and discussion
The procedures described in Section 2 were used to predict the Mode I, Mode II and mixed mode fracture toughness of thefoam. Since we are interested in plane strain fracture toughness only one unit cell was used in the thickness direction (z-direction). Periodic boundary conditions were imposed on the two surfaces normal to the z-axis.
4.1. Mode-I and Mode-II fracture toughness
A convergence study was performed by calculating the fracture toughness choosing micromechanical models of differentsizes. The size of the model is varied by increasing the number of unit cells chosen along the x and the y directions.
fracture toughness results with Input KI = 100.
Modelwidth(cells)
Modelheight(cells)
Cracklength(cells)
Total numberof nodes
Strut tip stress(MPa)
Fracture toughnessðPa
ffiffiffiffiffimpÞ
Difference between values withand without rotation (%)
W/Orotation
Withrotation
W/Orotation
Withrotation
10 11 5 1844 112 111.5 615.4 618.2 0.4512 13 6 2596 111.6 111.3 617.6 619.8 0.3514 15 7 3476 111.5 111.2 618.7 620.1 0.2216 17 8 4484 111.3 111.2 619.4 620.2 0.1218 19 9 5620 111.2 110.9 620.2 621.5 0.2120 21 10 6884 111.1 110.9 620.7 621.7 0.1722 23 11 8276 111 110.8 621.2 622.1 0.1424 25 12 9796 110.9 110.8 621.6 622.5 0.1426 27 13 11,444 110.8 110.7 622.1 623 0.1428 29 14 13,220 110.8 110.7 622.1 622.9 0.1330 31 15 15,124 110.8 110.7 622.1 622.8 0.1132 33 16 17,156 110.8 110.7 622.2 622.7 0.0934 35 17 19,316 110.8 110.7 622.1 622.7 0.10

Fig. 6. Mode-I fracture toughness convergence.
P. Thiyagasundaram et al. / Engineering Fracture Mechanics 78 (2011) 1277–1288 1283
In the current study, two sets of boundary conditions have been considered, one which does not include rotations xxy asboundary condition and the other which includes rotations. The question of including rotation arises because of the fact thatbeam elements are used to model the foam in the vicinity of the crack tip and the beam element nodes have rotation as adegree of freedom. In the previous work Choi and Sankar [17] ignored the rotations basically setting the corresponding cou-ple to be equal to zero. On the other hand Schmidt and Fleck [20] included the rotation as a boundary condition. In the pres-ent study we considered both cases – with and without rotation boundary condition.
Thirteen different models were considered to check convergence for Mode I. Four models out of the 13 models are shownin Fig. 5. The crack size is 50% of the width in all the cases chosen. The results obtained have been shown in Table 3. The totalnumber of nodes in the models varies from 1800 to almost 20,000 nodes respectively as shown in the Table 3. It is seen thatas the size of the model is increased, there is convergence (Fig. 6).
Fig. 7. Mode-II fracture – deformed configurations. (A) 10(w) � 11(h), (B) 12(w) � 13(h), (C) 28(w) � 29(h), and (D) 30(w) � 31(h).
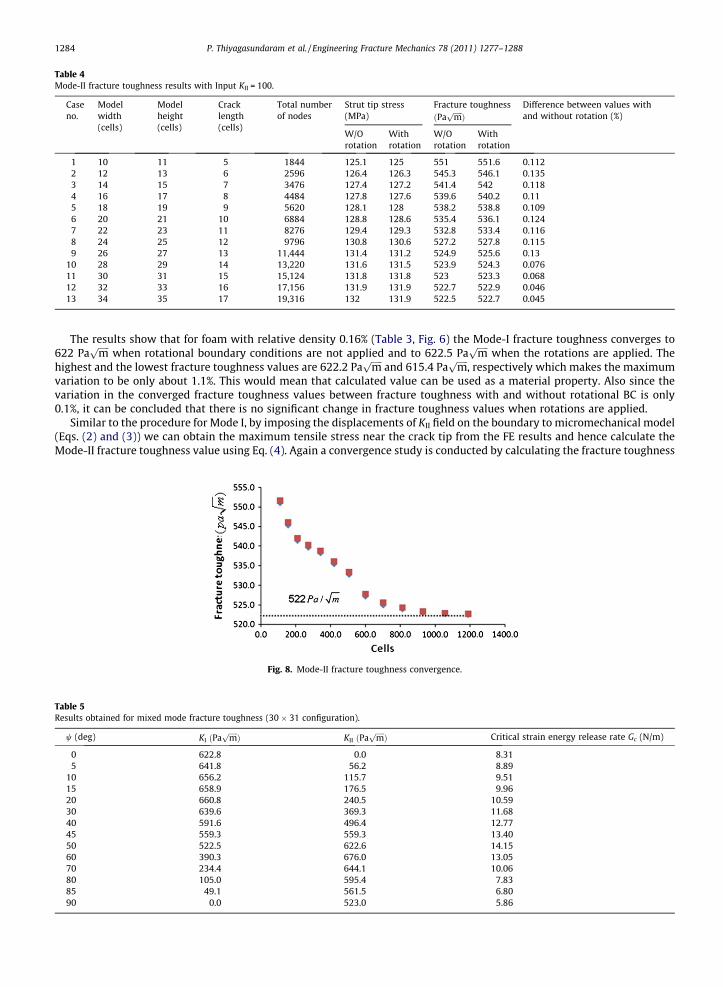
Table 4Mode-II fracture toughness results with Input KII = 100.
Caseno.
Modelwidth(cells)
Modelheight(cells)
Cracklength(cells)
Total numberof nodes
Strut tip stress(MPa)
Fracture toughnessðPa
ffiffiffiffiffimpÞ
Difference between values withand without rotation (%)
W/Orotation
Withrotation
W/Orotation
Withrotation
1 10 11 5 1844 125.1 125 551 551.6 0.1122 12 13 6 2596 126.4 126.3 545.3 546.1 0.1353 14 15 7 3476 127.4 127.2 541.4 542 0.1184 16 17 8 4484 127.8 127.6 539.6 540.2 0.115 18 19 9 5620 128.1 128 538.2 538.8 0.1096 20 21 10 6884 128.8 128.6 535.4 536.1 0.1247 22 23 11 8276 129.4 129.3 532.8 533.4 0.1168 24 25 12 9796 130.8 130.6 527.2 527.8 0.1159 26 27 13 11,444 131.4 131.2 524.9 525.6 0.13
10 28 29 14 13,220 131.6 131.5 523.9 524.3 0.07611 30 31 15 15,124 131.8 131.8 523 523.3 0.06812 32 33 16 17,156 131.9 131.9 522.7 522.9 0.04613 34 35 17 19,316 132 131.9 522.5 522.7 0.045
1284 P. Thiyagasundaram et al. / Engineering Fracture Mechanics 78 (2011) 1277–1288
The results show that for foam with relative density 0.16% (Table 3, Fig. 6) the Mode-I fracture toughness converges to622 Pa
ffiffiffiffiffimp
when rotational boundary conditions are not applied and to 622.5 Paffiffiffiffiffimp
when the rotations are applied. Thehighest and the lowest fracture toughness values are 622.2 Pa
ffiffiffiffiffimp
and 615.4 Paffiffiffiffiffimp
, respectively which makes the maximumvariation to be only about 1.1%. This would mean that calculated value can be used as a material property. Also since thevariation in the converged fracture toughness values between fracture toughness with and without rotational BC is only0.1%, it can be concluded that there is no significant change in fracture toughness values when rotations are applied.
Similar to the procedure for Mode I, by imposing the displacements of KII field on the boundary to micromechanical model(Eqs. (2) and (3)) we can obtain the maximum tensile stress near the crack tip from the FE results and hence calculate theMode-II fracture toughness value using Eq. (4). Again a convergence study is conducted by calculating the fracture toughness
Fig. 8. Mode-II fracture toughness convergence.
Table 5Results obtained for mixed mode fracture toughness (30 � 31 configuration).
w (deg) KI ðPaffiffiffiffiffimpÞ KII ðPa
ffiffiffiffiffimpÞ Critical strain energy release rate Gc (N/m)
0 622.8 0.0 8.315 641.8 56.2 8.89
10 656.2 115.7 9.5115 658.9 176.5 9.9620 660.8 240.5 10.5930 639.6 369.3 11.6840 591.6 496.4 12.7745 559.3 559.3 13.4050 522.5 622.6 14.1560 390.3 676.0 13.0570 234.4 644.1 10.0680 105.0 595.4 7.8385 49.1 561.5 6.8090 0.0 523.0 5.86

P. Thiyagasundaram et al. / Engineering Fracture Mechanics 78 (2011) 1277–1288 1285
choosing different micromechanical model sizes. As for the case of Mode I, the size of the model is varied by increasing thenumber of unit cells chosen along the x and the y directions. Similar to Mode I, two sets of cases have been considered – onewhich does not include rotations as boundary conditions and the other which includes rotations. Deformed configurations of
Fig. 9. Mixed mode fracture toughness – deformed configurations (30 � 31). (A) w ¼ 0, (B) w ¼ 15, (C) w ¼ 30, (D) w ¼ 45, (E) w ¼ 60, and (F) w ¼ 90.

Fig. 10. Mixed mode fracture toughness results (30 � 31 configuration).
1286 P. Thiyagasundaram et al. / Engineering Fracture Mechanics 78 (2011) 1277–1288
a few models chosen for this study are shown in Fig. 7. The results obtained are presented in Table 4 and convergence hasbeen shown in Fig. 8.
The results show that the Mode-II fracture toughness converges to about 522 Paffiffiffiffiffimp
when rotational displacements arenot applied and to 521.5 Pa
ffiffiffiffiffimp
when the rotations are applied. The highest and the lowest fracture toughness values are551.6 Pa
ffiffiffiffiffimp
and 521.7 Paffiffiffiffiffimp
respectively which makes the maximum variation about 5.3%. Also since the variation inthe converged fracture toughness values between fracture toughness with and without rotational BCs is only 0.1%, thereseems to be no significant change in fracture toughness values when rotations are applied.
4.2. Mixed mode fracture toughness
In calculating mixed mode fracture toughness, two stress intensity factors are required as input for calculation of bound-ary displacements. The Mode I and Mode II to stress intensity factors were varied as
K II ¼ K I tan w; ð0 6 w 6p2Þ ð6Þ
where w is the phase angle, a measure of mode mixity. One can note that w ¼ 0 corresponds to pure Mode I and w ¼ p2 to
Mode II. Intermediate values of w indicate mixed mode fracture. All the other equations for calculating displacements androtations remain the same as given in the appendices.
Results obtained from simulations for predicting mixed mode fracture toughness are shown in Table 5. Some deformedconfigurations for different combinations of KI and KII are shown in Fig. 9. The size of the local region is assumed to be30 � 31 cells. In order to present the mixed mode fracture toughness results we use the total critical energy release rateGc as a measure of effective fracture toughness and plot is as a function of the phase angle w in Fig. 10. We use the isotropicmaterial formula for Gc given by
Gc ¼K2
I þ K2II
Eð7Þ
where E is the Young’s modulus of the foam, say Ex. It should be noted from the results in Table 2 that the foam is nearlyisotropic, and the use of the above formula in Eq. (7) is justified at least for qualitative understanding of the effect of modemixity on the fracture toughness. From Fig. 10 one can note that the fracture toughness increases as the phase angle in-creases from 0-degree and reaches a maximum value at about w ¼ 50
�.
5. Summary and conclusion
A finite element based method has been used to calculate the fracture toughness of foams. The inputs to the model are thegeometric parameters required to model the repeating unit cell and tensile strength of the foam ligament or strut. A microm-echanics based method has been used to calculate the Mode I, Mode II and Mixed mode fracture toughness of foams withtetrakaidecahedral unit cells. Fracture toughness has been shown to converge as the size of micromechanical model is in-creased. Hence, the calculated fracture toughness can be used as a material property. It has also been shown that applyingrotation boundary conditions does not influence the calculated fracture toughness significantly, at least for the cases consid-ered here.

P. Thiyagasundaram et al. / Engineering Fracture Mechanics 78 (2011) 1277–1288 1287
Acknowledgements
The Florida Space Grants Consortium’s FSREGP Program supported this research. The authors gratefully acknowledge theinterest and encouragement of Dr. Jaydeep Mukherjee, Director of NASA Florida Space Grants Consortium and Interim Direc-tor of Florida Space Institute.
Appendix A
The compliance matrix [S] of a plane orthotropic medium is given by
½S� ¼
S11 S12 S16
S21 S22 S26
S16 S26 S66
26664
37775 ¼
1=Ex �mxy=Ey 0
�mxy=Ex 1=Ey 0
0 0 1=Gxy
26664
37775 ðA1Þ
where the elastic constants in the above equation can be obtained from Table 2.The characteristic equation of the orthotropic material as given by Sih and Liebowitz [22]
S11l4 � 2S16l3 þ ð2S12 þ S66Þl2 � 2S26lþ S22 ¼ 0 ðA2Þ
There are four roots of the above characteristic equation. We denote s1 and s2 as the two unequal roots with positive con-jugate values:
s1 ¼ l1 ¼ a1 þ ib1; s2 ¼ l2 ¼ a2 þ ib2 ðA3Þ
The constants pj and qj (j = 1, 2) are related s1 and s2 as below
p1 ¼ S11s21 þ S12 � S16s1; p2 ¼ S11s2
21 þ S12 � S16s2 ðA4Þ
q1 ¼S12s2
1 þ S22 � S26s1
s1, q2 ¼
S12s22 þ S22 � S26s2
s2
The displacement field in the vicinity of crack tip is a function of the orthotropic material parameters p1, p2, q1, q2, s1 ands2 as given in Eqs. (2) and (3).
Appendix B
The procedures for calculating rotation boundary conditions (xxy) are as follows. From the displacement field given in Eq(2) we can calculate displacement gradients for Mode I as:
@u@r¼ K I
1ffiffiffiffiffiffiffiffiffi2prp
Re1
s1� s2s1p2ðcoshþ s2 sinhÞ1=2� s2p1ðcoshþ s1 sinhÞ1=2h i� �
@u@h
¼ K I
ffiffiffiffiffi2rp
rRe
1s1� s2
s1p22 ðcoshþ s2 sinhÞ�1=2ð�sinhþ s2 coshÞ� s2p1
2 ðcoshþ s1 sinhÞ�1=2ð�sinhþ s1 coshÞh i� �
@v@r
¼ K I1ffiffiffiffiffiffiffiffiffi2prp
Re1
s1� s2s1q2ðcoshþ s2 sinhÞ1=2� s2q1ðcoshþ s1 sinhÞ1=2h i� �
@v@h
¼ K I
ffiffiffiffiffi2rp
rRe
1s1� s2
s1q22 ðcoshþ s2 sinhÞ�1=2ð�sinhþ s2 coshÞ� s2q1
2 ðcoshþ s1 sinhÞ�1=2ð�sinhþ s1 coshÞh i� �
ðA5Þ
The displacement gradients for Mode II can be derived in a similar fashion:
@u@r¼ K II
1ffiffiffiffiffiffiffiffiffi2prp
Re1
s1 � s2p2ðcos hþ s2 sin hÞ1=2 � p1ðcos hþ s1 sin hÞ1=2h i� �
@u@h
¼ K II
�ffiffiffiffiffi2rp
rRe
1s1 � s2
p22 ðcos hþ s2 sin hÞ�1=2 � sin hþ s2 cos hð Þ � p1
2 ðcos hþ s1 sin hÞ�1=2ð� sin hþ s1 cos hÞh i� �
@v@r
¼ K II1ffiffiffiffiffiffiffiffiffi2prp
Re1
s1 � s2q2ðcos hþ s2 sin hÞ1=2 � q1ðcos hþ s1 sin hÞ1=2h i� �
@v@h
¼ K II
ffiffiffiffiffi2rp
rRe
1s1 � s2
q22 ðcos hþ s2 sin hÞ�1=2ð� sin hþ s2 cos hÞ � q1
2 ðcos hþ s1 sin hÞ�1=2ð� sin hþ s1 cos hÞh i� �
ðA6Þ

1288 P. Thiyagasundaram et al. / Engineering Fracture Mechanics 78 (2011) 1277–1288
The rotational boundary condition can be calculated as:
@v@x¼ cos h
@v@r
� sin h
r@v@h
@u@y¼ sin h
@u@r
þ cos h
r@u@h
xxy ¼
12@v@x� @u@y
� �ðA7Þ
References
[1] Thompson W. On the division of space with minimum partitional area. Philos Mag 1887;24:503–900.[2] Weaire D, Phelan R. A counterexample to Kelvin conjecture on minimal-surfaces. Philos Mag Lett 1994;69:107–10.[3] Hall RB, Hager JW. Performance limits for stiffness-critical graphitic foam structures. 1. Comparisons with high-modulus foams, refractory alloys and
graphite–epoxy composites. J Compos Mater 1996;30:1922–37.[4] Lee S, Wang J, Sankar BV. A micromechanical model for predicting the fracture toughness of functionally graded foams. Int J Solids Struct
2007;44:4053–67.[5] Li K, Gao XL, Roy AK. Micromechanics model for three-dimensional open-cell foams using a tetrakaidecahedral unit cell and Castigliano’s second
theorem. Compos Sci Technol 2003;63:1769–81.[6] Li K, Gao XL, Roy AK. Micromechanical modeling of three-dimensional open-cell foams using the matrix method for spatial frames. Compos Part B –
Engng 2005;36:249–62.[7] Zhu HX, Knott JF, Mills NJ. Analysis of the elastic properties of open-cell foams with tetrakaidecahedral cells. J Mech Phys Solids 1997;45:319.[8] Ridha M, Shim VPW, Yang LM. An elongated tetrakaidecahedral cell model for fracture in rigid polyurethane foam. Fract Strength Solids VI 2006;306–
308(Pts. 1 and 2):43–8.[9] Laroussi M, Sab K, Alaoui A. Foam mechanics: nonlinear response of an elastic 3D-periodic microstructure. Int J Solids Struct 2002;39:3599–623.
[10] Maiti SK, Ashby MF, Gibson LJ. Fracture-toughness of brittle cellular solids. Scr Metall 1984;18:213–7.[11] Huang JS, Gibson LJ. Fracture-toughness of brittle foams. Acta Metall Mater 1991;39:1627–36.[12] Huang JS, Gibson LJ. Fracture-toughness of brittle honeycombs. Acta Metall Mater 1991;39:1617–26.[13] Brezny R, Green DJ. The effect of cell-size on the mechanical-behavior of cellular materials. Acta Metall Mater 1990;38:2517–26.[14] Brezny R, Green DJ. Factors controlling the fracture-resistance of brittle cellular materials. J Am Ceram Soc 1991;74:1061–5.[15] Brezny R, Green DJ, Dam CQ. Evaluation of strut strength in open-cell ceramics. J Am Ceram Soc 1989;72:885–9.[16] Gibson LJ, Ashby MF. Cellular solids: structure and properties. UK: Cambridge University Press; 1997.[17] Choi S, Sankar BV. Fracture toughness of carbon foam. J Compos Mater 2003;37:2101–16.[18] Choi S, Sankar BV. A micromechanical method to predict the fracture toughness of cellular materials. Int J Solids Struct 2005;42:1797–817.[19] Wang J. Fracture toughness of cellular materials using finite element based micromechanics. Doctoral Dissertation. University of Florida, Gainesville,
Florida; 2007.[20] Schmidt I, Fleck NA. Ductile fracture of two dimensional cellular structures. Int J Fract 2001;111:327–42.[21] Fleck NA, Qiu X. The damage tolerance of elastic–brittle, two dimensional isotropic lattices. J Mech Phys Solids 2007;55:562–88.[22] Sih GC, Liebowitz H. Mathematical theories of brittle fracture. New York and London: Academic Press; 1968.[23] Weisstein EW. Truncated octahedron. MathWorld – A Wolfram web resource. <http://mathworld.wolfram.com/TruncatedOctahedron.html>.[24] Sullivan RM, Ghosm LJ, Lerch BA, 2008. Application of an elongated Kelvin model to space shuttle foams. AIAA Paper 2008-1786. In: The proceedings of
the 49th AIAA/ASME/ASCE/AHS/ASC structures, structural dynamics, and materials. Reston (VA): AIAA.[25] Thiyagasundaram P, Sankar BV, Arakere NK. Elastic properties of open-cell foams with tetrakaidecahedral cells using finite element analysis. AIAA J
2010;48(4):818–28.