Embed Size (px)
Citation preview

Engineering Faculty Motivation for and Engagementin Formative Assessment
Kenneth C. Stanton
Dissertation submitted to the Faculty of the Virginia PolytechnicInstitute and State University in partial fulfillment of the requirements
for the degree of:
Doctor of PhilosophyIn
Engineering Education
Richard M. Goff, ChairPeter E. Doolittle
Brett D. JonesTamara W. KnottMarie C. Paretti
February 17, 2011Blacksburg, Virginia
Keywords: Engineering, Faculty, Motivation, Engagement, Formative Assessment
Copyright © 2011 by Kenneth C. Stanton

Engineering Faculty Motivation for
and Engagement in Formative Assessment
Kenneth C. Stanton
Abstract
The purposes of this study were to conduct an exploratory study of the status quo of
engineering faculty motivation for and engagement in formative assessment, and to conduct a
preliminary validation of a motivational model, based in self-determination theory, that explains
relationships between these variables. To do so, a survey instrument was first developed and
validated, in accordance with a process prescribed in the literature, that measured individual
engineering faculty members’ motivational traits and engagement regarding formative
assessment, as no such instrument existed. The survey asked engineering faculty about their
satisfaction of autonomy, competence, and relatedness needs, degree of self-determined
motivation experienced, and engagement, all relative to formative assessment of student
learning.
Data from the final instrument were obtained from a stratified national sample of
approximately 2,500 U.S. engineering faculty, attaining 223 responses, and was first evaluated
for validity and reliability. The major validity check utilized was to review two examples of
formative assessment that respondents provided and then discard data from invalid responses;
over 70% of responses qualified as valid. Only responses with valid examples of formative
assessment were used, indicating that the inferences drawn from this study only directly pertain
to faculty who understand formative assessment, a subset of the U.S. engineering faculty
population. The reliability of instrument constructs was evaluated through use of Cronbach’s
Alpha, including removal of low-scoring survey items. Following, the remaining data were

iii
analyzed with descriptive statistics to evaluate trends and with linear regression to validate the
motivational model.
Results show that, for the subset of engineering faculty studied, engagement in formative
assessment is positive, motivation for it is self-determined and largely derives from faculty
identifying its contribution to teaching and learning, and needs of autonomy, competence, and
relatedness are moderately to highly satisfied. Further, from testing of the motivational model, it
can be reasonably concluded that faculty engagement is significantly predicted by self-
determined motivation, but the prediction of self-determined motivation by motivational needs
has a caveat: the self-determined motivation of male engineering faculty was predicted by
autonomy and relatedness, but by autonomy and competence for females.

iv
Dedication
This work is dedicated to Jeremy Michael Herbstritt, whose life was taken in the tragic
shootings at Virginia Tech on April 16, 2007. After meeting him and his father, Michael, in the
summer of 2006 as he moved in to my apartment building, we quickly became great friends. He
was a hard-worker, a true friend, an honest guy, and gave everything he could to others. He
introduced me to Gaurav Bansal, who we initially feared was lost in the shootings that day but
instead was safe and later became a great friend, too.
I got to spend a lot of time with Jeremy’s family in the days following the shootings, and
was so proud of how they handled everything. Getting to know them better showed me exactly
where the bright and dedicated traits that defined Jeremy came from. I hope that, with this very
personal and public dedication, they can see once again how much impact their son had on the
people who met him, and how proud they should be to have contributed so much to the world
through him.
This dedication is to Jeremy, also, as at the time of the tragedy, I was en route to the
Dean’s of Engineering office, just one floor above where Jeremy was that day, to announce my
decision to join the Ph.D. program in Engineering Education, for which this dissertation is
submitted. In the time Jeremy’s life ended, I was beginning this journey, and his sister was
completing the Boston Marathon. I wish to end this part of my journey by recognizing him.

v
Acknowledgement
I would like to acknowledge many parties for helping to make this possible. First, I
would like to recognize the efforts of both Dr. Hayden Griffin and colleagues, who worked so
hard to make this Ph.D. program possible, and of my advisement committee. My advisor, Dr.
Richard Goff, has been tremendously helpful and persistent throughout, and has challenged me
at the times when I really needed it. My other committee members, Dr. Brett Jones, Dr. Marie
Paretti, Dr. Peter Doolittle, and Prof. Tamara Knott, have endured a lot as I have struggled
through this Ph.D. process, and I want to acknowledge their hard work and challenges to help me
do my best work; I have learned a lot from it. Not only was this my first thesis, but in many
cases I was the first to attempt the exams of the Engineering Education Ph.D. program, and it
was tough for all of us. I would also like to thank Dr. Phil Chapman for his time serving as my
statistical consultant; his input was instrumental in describing many of my statistical results
correctly and with the proper backing. Finally, I would like to acknowledge Drs. Tom Bradley
and Tom Siller of Colorado State University for their willingness to work with me before
completing my Ph.D., and for their support while I finished this work.
Second, I need to acknowledge those who have supported me through all of this. To my
Mom, Mary, my Dad, Ken, and my step-Dad, Jeff, you have given me so much and there is no
way I can put my gratitude into words. You are amazing parents and have been there as I’ve
chased my dreams, and I wouldn’t be here without your love and support. Also, to my
wonderful fiancé, Alyson Boyce, who has seen all my ups and downs through this process and
yet still followed me halfway across the country and agreed to marry me. I’m a very lucky guy,
and I look forward to being there for you as you work through your graduate program. Last, but
not least, I want to thank all my awesome students, many of which I am still good friends with,
vi
who constantly reminded me what it is I’m after: bringing out all the exciting and challenging
things that define engineering into the classrooms and hallways of higher education.
Finally, I would like to thank those who supported me financially. For many years of my
Ph.D. studies, the Department of Engineering Education offered me a Graduate Teaching
Assistanceship, which made it possible for me to afford my graduate schooling but also gave me
the opportunity to do what I really love – teach. As well, I want to thank the Virginia Tech
Graduate Student Assembly (GSA), which provided partial funding of $200 to offset the costs of
the online survey services used in this study.

vii
Table of ContentsAbstract ......................................................................................................................................................... ii
Dedication.................................................................................................................................................... iv
Acknowledgement ........................................................................................................................................ v
Table of Contents........................................................................................................................................vii
List of Figures ............................................................................................................................................... x
List of Tables ...............................................................................................................................................xi
Glossary of Terms......................................................................................................................................xiii
Chapter 1: Introduction ................................................................................................................................. 1
1.1 Background of the Problem ................................................................................................................ 1
1.2 Statement of the Problem.................................................................................................................... 4
1.2.1 A Note about the Study Population.............................................................................................. 5
1.3 Purpose and Research Questions ........................................................................................................ 5
1.4 Significance of the Study .................................................................................................................... 6
1.5 Assumptions and Limitations.............................................................................................................. 7
1.6 Organization of the Dissertation ......................................................................................................... 8
Chapter 2: Background ................................................................................................................................. 9
2.1 Assessment.......................................................................................................................................... 9
2.1.1 Formative and Summative Assessment ....................................................................................... 9
2.1.2 Benefits of Formative Assessment............................................................................................. 13
2.1.3 Other Aspects of Assessment..................................................................................................... 15
2.1.4 Assessment Summary ................................................................................................................ 16
2.2 Engagement in Formative Assessment ............................................................................................. 16
2.2.1 Constructs of Engagement ......................................................................................................... 17
2.3 Self-Determination Theory ............................................................................................................... 19
2.3.1 The Theory................................................................................................................................. 20
2.3.2 Self-Determination in Assessment............................................................................................. 24
2.3.2.1 The Role of Accreditation................................................................................................... 25
2.3.3 Self-Determination Theory Summary........................................................................................ 27
2.4 Hierarchical Model of Motivation .................................................................................................... 27
2.4.1 The Model .................................................................................................................................. 28
2.4.2 The Hierarchical Model in Education ........................................................................................ 30
2.5 Background Summary ...................................................................................................................... 32

viii
Chapter 3: Methodology ............................................................................................................................. 33
3.1 Research Design................................................................................................................................ 33
3.1.1 Context....................................................................................................................................... 34
3.2 Instrument Design............................................................................................................................. 35
3.2.1 Procedure ................................................................................................................................... 35
3.2.2 Validity and Reliability.............................................................................................................. 38
3.2.3 Instrument Constructs Required................................................................................................. 40
3.2.4 Instrument Structure................................................................................................................... 42
3.2.5 Existing Instruments Used ......................................................................................................... 44
3.2.6 Additional Constructs and Items................................................................................................ 47
3.2.7 Instrument Design Summary ..................................................................................................... 48
3.3 Sample Selection............................................................................................................................... 48
3.3.1 Population .................................................................................................................................. 48
3.3.2 Pilot Sample ............................................................................................................................... 49
3.3.3 Final Survey Instrument Sample................................................................................................ 49
3.3.3.1 Summary of Respondents ................................................................................................... 50
3.3.3.2 Response Rate Concerns ..................................................................................................... 54
3.4 Data Collection Procedures............................................................................................................... 61
3.4.1 Participant Privacy and IRB....................................................................................................... 61
3.4.2 Data Collection and Tools.......................................................................................................... 62
3.5 Data Analysis Procedures ................................................................................................................. 63
3.5.1 Pilot Survey Interviews.............................................................................................................. 63
3.5.2 Final Instrument Validity and Reliability .................................................................................. 65
3.5.3 Construct Scoring and Descriptive Statistics for RQ1............................................................... 66
3.5.4 Regression for RQ2 and RQ3 Model Validation ....................................................................... 67
3.5.5 Data Analysis Summary............................................................................................................. 70
Chapter 4: Results ....................................................................................................................................... 71
4.1 Instrument Development................................................................................................................... 71
4.1.1 Pilot Survey................................................................................................................................ 71
4.1.1.1 Pilot Interviews ................................................................................................................... 71
4.1.1.2 Changes to Survey .............................................................................................................. 72
4.1.2 Final Survey ............................................................................................................................... 72
4.1.2.1 Examples of Formative Assessment ................................................................................... 73

ix
4.1.2.2 Reliability............................................................................................................................ 75
4.1.2.3 Assumptions of Regression................................................................................................. 77
4.1.2.3.1 Linearity of Regression Relationships ......................................................................... 78
4.1.2.3.2 No Multicollinearity..................................................................................................... 80
4.1.2.3.3 Independence of Errors ................................................................................................ 81
4.1.2.3.4 Homoscedasticity ......................................................................................................... 82
4.2 Research Questions........................................................................................................................... 82
4.2.1 Research Question 1................................................................................................................... 83
4.2.2 Research Question 2................................................................................................................... 88
4.2.3 Research Question 3................................................................................................................... 92
Chapter 5: Discussion ................................................................................................................................. 96
5.1 Motivational Needs........................................................................................................................... 96
5.1.1 Autonomy .................................................................................................................................. 97
5.1.2 Competence................................................................................................................................ 98
5.1.3 Relatedness ................................................................................................................................ 99
5.1.4 Sex Differences in Motivational Needs ................................................................................... 102
5.2 Self-Determined Motivation ........................................................................................................... 105
5.2.1 Identified Regulation................................................................................................................ 106
5.2.2 Intrinsic Motivation.................................................................................................................. 107
5.2.3 External and Introjected Regulation ........................................................................................ 107
5.2.4 Self-Determined Motivation .................................................................................................... 109
5.3 Engagement in Formative Assessment ........................................................................................... 110
Chapter 6: Conclusions ............................................................................................................................. 114
References................................................................................................................................................. 118
Appendix A: Pilot Instrument ................................................................................................................... 124
Appendix B: Pilot Interview Questions and Procedure ............................................................................ 130
Appendix C: Research Question Breakdown and Construct List ............................................................. 132
Appendix D: Final Survey Instrument ...................................................................................................... 134
Appendix E: Survey Instrument with Final Constitution of Construct Items, for use in Future Studies .. 140
Appendix F: Additional Data from Analysis of Regression Assumptions ............................................... 146
Appendix G: Individual Survey Item Average Scores.............................................................................. 154
Appendix H: Back Matter ......................................................................................................................... 157
x
List of FiguresFigure 2.1: The process typically utilized for a class assignment (top) versus the process typically
employed with formative assessment (bottom)........................................................................................... 12
Figure 2.2: The self-determination continuum showing types of motivation with their regulatory styles,
loci of causality, and corresponding processes (Ryan & Deci, 2000, p. 72)............................................... 20
Figure 2.3: Motivational model tested in this study, which was based on Vallerand’s (1997) Hierarchical
Model of self-determination theory where perceived satisfaction of motivational needs leads to different
motivational types and degree of self-determination, which lead to different aspects of engagement in
formative assessment. ................................................................................................................................. 28
Figure 2.4: Vallerand’s (1997) Hierarchical Model of motivation. Note: this diagram was intended for
use in a study of education and sport motivation, and hence has more specific motivational contexts in the
contextual level (Vallerand & Losier, 1999). ............................................................................................. 29
Figure 3.1: Two possible scenarios of what the sample of this study may look like, where the shaded area
represents faculty who knew what formative assessment is. ...................................................................... 60
Figure 4.1: Scatterplots for data relationships between motivational needs and self-determined motivation
.................................................................................................................................................................... 78
Figure 4.2: Scatterplots for data relationships between self-determined motivation and some engagement
constructs. ................................................................................................................................................... 79
Figure 4.3: Scatterplots for data relationships between self-determined motivation and the remaining
engagement constructs. ............................................................................................................................... 80

xi
List of TablesTable 3.1: Basic demographics of 149 respondents, whose data were used in analyses, including 95%
confidence interval of sample percentage and national averages of the population, as available. Note: not
all respondents provided demographic data, so numbers may not add up to 149....................................... 51
Table 3.2: Demographics of respondents’ colleges and universities. ......................................................... 53
Table 3.3: Summary and count of comments received from respondents via email and in input box at the
end of the survey. ........................................................................................................................................ 60
Table 3.4: Expected regression relationships from motivational needs to self-determined motivation. .... 69
Table 3.5: Expected regression relationships from self-determined motivation to engagement constructs.
.................................................................................................................................................................... 69
Table 4.1: Scoring rubric for examples of formative assessment provided by participants. ...................... 74
Table 4.2: Description of the two-pass evaluation process for categorizing both examples of formative
assessment provided by respondents........................................................................................................... 75
Table 4.3: Reliability analysis results for motivational needs constructs, including subjective ratings as
described in section 3.5.2; (R) indicates that the item was reverse-scored................................................. 76
Table 4.4: Reliability analysis results for self-determined motivation constructs; (R) indicates that the
item was reverse scored. ............................................................................................................................. 76
Table 4.5: Reliability analysis results for engagement constructs; (R) indicates that the item was reverse
scored. ......................................................................................................................................................... 76
Table 4.6: Abbreviations used in statistical software.................................................................................. 77
Table 4.7: Correlations between dependent variables of regressions. ........................................................ 81
Table 4.8: Residual plots for each regression performed............................................................................ 81
Table 4.9: Construct sample means, standard deviations, and confidence intervals resulting from final
survey data collection. ................................................................................................................................ 83
Table 4.10: Results from regression from motivational needs to self-determined motivation. .................. 89

xii
Table 4.11: Results of regressions from motivational needs to self-determined motivation separated by
sex. .............................................................................................................................................................. 90
Table 4.12: Results of regression from motivational needs to external regulation. .................................... 91
Table 4.13: Results of regression from motivational needs to introjected regulation................................. 91
Table 4.14: Results of regression from motivational needs to identified regulation. ................................. 92
Table 4.15: Results of regression from motivational needs to intrinsic motivation. .................................. 92
Table 4.16: Results of regressions from self-determined motivation to engagement. ................................ 93
Table 4.17: Results of regressions from intrinsic motivation, identified regulation, introjected regulation,
and external regulation to each of the engagement constructs.................................................................... 94
Table 5.1: Standard deviations for competence, relatedness, and self-determined motivation scores by sex,
with p-values for F-test comparison of the standard deviations................................................................ 104

xiii
Glossary of Terms
Motivation and Self-Determination Theory
Amotivation represents a state one step beyond external regulation, whereby the individual’scompetence or autonomy is so compromised that they lack any intention to act atall towards the goal (Deci & Ryan, 2000b; Niemiec & Ryan, 2009; Ryan &Niemiec, 2009)
Autonomy an innate motivational need that “reflects the desire of individuals to be theorigin or source of their own behavior and is experienced when individualsperceive their behavior as self-endorsed” (Vlachopoulos & Michailidou, 2006, p.180)
Note: autonomy is typically used in the literature synonymously with “self-determination” but differs in use in this study as it is referred to as a need thatleads to self-determined motivation.
Competence an innate motivational need that “refers to one’s propensity to interacteffectively with one’s environment and to experience opportunities to exerciseand express one’s capacities” (Vlachopoulos & Michailidou, 2006, p. 180)
Extrinsicmotivation
a behavior engaged to obtain an outcome external to the self; separated into fourtypes of regulation: integrated, identified, introjected, and external (Niemiec &Ryan, 2009)
Identifiedregulation
the underlying value of a behavior is somewhat external but still identified withas internal (Deci & Ryan, 2000b; Niemiec & Ryan, 2009; Ryan & Niemiec,2009)
Integratedregulation
the most internalized of extrinsic motivations, where the external purposes ofundertaking the activity are fully integrated with the individual’s sense of self(Deci & Ryan, 2000b; Niemiec & Ryan, 2009; Ryan & Niemiec, 2009)
Internalization a process in which individuals attempt to reform an activity, or their perspectiveof it, in such a way that it can be taken in as aligned with the sense of self (Deci& Ryan, 2000b; Niemiec & Ryan, 2009)
Intrinsicmotivation
a state where an individual engages in behaviors they find interesting andenjoyable per their own volition and in which any external consequences orbenefits are not salient, and is highly self-determined (Deci & Ryan, 2000b;Niemiec & Ryan, 2009)
Introjectedregulation
external regulations are held externally, and not internalized, in the sense that theperson feels failure to act will affect their image (an external construct) but notnecessarily their sense of self (internal) (Deci & Ryan, 2000b; Niemiec & Ryan,2009)
Motivation “a mental construct […] indicated by the intensity, direction, and persistence ofa goal-directed behavior or action” (Motivation, emotion, and cognition :integrative perspectives on intellectual functioning and development, 2004, p.11)
Relatedness an innate motivational need that “refers to feeling connected with significantothers, cared for, or that one belongs in a given social milieu” (Vlachopoulos &Michailidou, 2006, p. 180)

xiv
Self-determination
“communicates an inner endorsement of one’s actions – the sense that an actionis freely initiated and emanates from within one’s self” (Reeve, 2002, p. 196)
Assessment of Student Learning
Assessment an ongoing process aimed at understanding and improving student learning.It involves making our expectations explicit; systematically gathering,analyzing, and interpreting evidence to determine how well performancematches those expectations and standards; and using the resultinginformation to document, explain, and improve performance. (Angelo, 1995)
Formativeassessment
Formative assessment is an ongoing process aimed at understanding andimproving teaching and student learning in the midst of educational efforts.It involves making our methods explicit; systematically gathering, analyzing,and interpreting evidence to determine how well performance matches thoseexpectations and standards; and using the resulting information beforesummative assessments or evaluations are performed to improve teachingand learning. (study definition)
Summativeassessment
used to seek evidence at the end of a course or program to examine whetheror not educational objectives were achieved, and typically is not intended toimprove teaching and learning while it is in progress as formative assessmentmethods are (Moskal, 2008; Barbara M. Olds & Miller, 2008; Barbra M.Olds, Moskal, & Miller, 2005)
Engagement in Formative Assessment
Choice ofbehavior
choosing to do assessment over other education/research tasks and choosingto engage in all four assessment stages: using various methods, collectingdata, analyzing data, and applying results to improve teaching and learning
Concentration /attention
The ability to focus on assessment tasks while in progress
Engagement In the context of the classroom, engagement refers to behaviors and the“concentration of attentional, cognitive, and affective resources” (p. 339) ona task or activity (Chen, Lattuca, & Hamilton, 2008)
Intent reporting intentions to use formative assessment in the futurePersistence staying on-task even when faced with negative results or difficultiesSatisfaction feeling satisfied when performing formative assessment, even if results are
not always positive

1
Chapter 1: Introduction
This introductory chapter provides a background to the problem, and then a statement of
the problem itself. Following, the purpose and research questions of the study are presented,
followed by the significance of the study results. Lastly, assumptions and limitations of the
study are put forth and an outline of the remainder of the dissertation presented.
1.1 Background of the Problem
Engineering programs aim to provide the best education possible as they prepare students
for careers as the future engineers of the world. However, engineering programs are struggling
to retain students through to graduation (Ohland et al., 2008) even though engineering jobs are
currently hard to fill (Coster, 2010). Worse, programs aren’t just losing their lowest performers,
they are losing their best students, and those in between, at nearly the same rates (Ohland et al.,
2008; Seymour & Hewitt, 1997), indicating that it is more than just their ability influencing their
decisions to stay or leave.
In 1997, a major study by Seymour and Hewitt found that the primary factor cited in
engineering and science students’ decisions to leave their field were issues with teaching quality;
recent studies have confirmed this finding (e.g., see Ohland et al., 2008). Over the years, a
number of reform efforts in engineering education have targeted teaching quality for this reason
(Splitt, 2002), and the National Academy of Engineering (2005) saw the same problem and
solution:
In a 1998 study, fully 98 percent of students switching from engineering to
another major cited poor teaching as a major reason for their departure…. Thus,
increased attention to teaching, to how students learn, and to student mentoring is
important for improving the undergraduate experience. (p. 23)

2
Calls for improvement of engineering education have come from organizations like
ABET, ASEE, NRC, and NAE (National Academy of Engineering, 2005; Splitt, 2002;
Volkwein, Lattuca, & Terenzini, 2008) that seek to increase the quality of teaching and learning,
and subsequently improve student retention and engagement. Various approaches have been
suggested, such as seeking positive culture changes, developing communities of practice,
changing accreditation standards, increasing faculty buy-in to changes, increasing reflective and
student-centered teaching, and increasing use of assessment. For example, ABET’s new
accreditation standards, known as EC-2000, include requirements for engineering programs to
perform assessment of student learning (ABET, 2009; Shuman, Besterfield-Sacre, & McGourty,
2005). These requirements stress assessment use because it serves as a feedback mechanism to
inform better teaching and learning (Moskal, 2008), and it has been shown to be successful in
attaining improvements in teaching and learning (Black & Wiliam, 1998a, 1998b). Of the two
common types, formative and summative, formative assessment has the most immediate and
direct impact on improving teaching and learning as it is, by definition, used in the near-term to
make adjustments to educational efforts in the midst of the education process, before any
summative evaluation of learning takes place (Moskal, 2008; Rowntree, 1987). Many formal
and informal techniques are available for educators to use in performing formative assessment
(e.g., Angelo & Cross, 1993; Black & Wiliam, 1998b; Fisher, 2007).
With the goal of increasing presence of assessment in academic programs, most
policymakers and administrators have used large-scale mandates and requirements to get faculty
to perform summative assessment (e.g., see ABET, 2009; Prados, Peterson, & Lattuca, 2005a;
Volkwein et al., 2008). However, smaller-scale efforts, like those within a college or program,
have taken different approaches, such as building group cohesion (Bird, 2001), appealing to

3
teaching interests (Brown, 2005), and creating engaging environments (Clark, 2009). In terms of
motivation, each of these approaches has different effects on different people, meaning that some
initiatives may attain engagement in assessment from some individuals but not from others.
To better understand its effects, studies of education reform are increasingly considering
the psychological construct of motivation, since it is a major underlying factor in individuals’
decisions to engage in behaviors and embrace changes. Fink, Ambrose, and Wheeler (2005)
suggest that:
If we want to introduce meaningful change in how engineering education is practiced
throughout the profession, faculty members will need a new perspective that validates
why learning about teaching is important, i.e., motivation that comes from the culture, as
well as opportunities to engage in what and how to learn about teaching, e.g., a
systematic way for continual educational development. (p. 192)
Thus, if the status and role of motivational factors for various players in educational reform were
better understood, they could be used to inform policies and interventions, potentially with
higher impact than approaches that do not have such knowledge (Niemiec & Ryan, 2009). For
example, Niemiec and Ryan (2009) found that policy changes made by administrators without
consideration for the motivations of teachers suffered not only in compliance, but in the
enthusiasm and creativity demonstrated, as compared to changes that were made by taking
teachers’ motivations into account. In reform efforts intended to increase the use and
effectiveness of formative assessment, therefore, it would be advantageous to have knowledge of
faculty motivation for it. This knowledge would allow for optimization of approaches to
attaining faculty buy-in, engagement, and persistent participation in formative assessment, and
for each member’s participation to be considered individually (McKeachie, 1996; Wallin, 2003).

4
Self-determination theory is a useful theory to explain motivations for formative
assessment as it has a unique view of the relationship between internal and external motivation –
a relationship that can provide distinctive explanations of why individuals engage the way they
do in activities. The theory is based on three innate needs, believed to be universal to all
humans: autonomy, competence, and relatedness (Deci & Ryan, 2000). This universality is
important as it provides analyses with more power to overcome issues of cultural variance,
subjectivity, and incomplete motivational descriptions, in comparison to other motivation
theories (Deci & Ryan, 2000; Sutton, 2005). Further, the empirical outcomes of self-determined
motivation are positive affect, behavior, and cognition toward the factor being considered
(Vallerand, 1997). Therefore, self-determination theory ought to explain and predict faculty’s
affective, behavioral, and cognitive engagement in formative assessment, which are of value as
they should lead to the desired improvements of teaching and learning in engineering.
1.2 Statement of the Problem
Research has shown that formative assessment is a valuable task for improving teaching
and learning (e.g., Black & Wiliam, 1998b); however, very little work has been done to
understand engineering faculty motivations for teaching-related activities (e.g., see J. Turns,
Eliot, Neal, & Linse, 2007), and no literature was found that studied the motivation of
engineering faculty as it pertains to assessment. Additionally, there is a lack of information
about engineering faculty engagement in and attitudes toward formative assessment, in general.
Furthermore, formative and summative assessment have not been studied separately, such that
differences can be accounted for in policymaking and intervention development.
Therefore, the problem is that there is a dearth of information available on faculty
motivation that could be used to inform assessment policy and, if deemed necessary,

5
interventions for formative assessment. In response, this study intended to do three things: 1)
develop and test a survey instrument that can be used to study engineering faculty motivation for
formative assessment, since no such instrument existed; 2) provide a much needed, preliminary
description of engineering faculty's attitudes and motivation regarding formative assessment; and
3) given current challenges in engineering faculty teaching, present and test a model that could
provide a basis for future work on how to increase faculty's use of formative assessment.
1.2.1 A Note about the Study Population
As part of this investigation, care had to be given to ensure that engineering faculty who
responded to the survey understood what formative assessment is, else inferences might
mistakenly be drawn about something else, such as summative assessment. This was addressed
by screening the respondents, as described in section 3.2.2 and executed in section 4.1.2.1, and
including in analyses only those who demonstrated understanding of formative assessment. As a
direct result, this study’s inferences only apply to the subset of U.S. engineering faculty who
understand what formative assessment is. Therefore, from here forward, discussion of the
population studied will be referred to as the “subset” of U.S. engineering faculty or “these”
faculty, to be clear that inferences may not extend to all U.S. engineering faculty at large.
1.3 Purpose and Research Questions
The purposes of this work were to conduct a preliminary, exploratory study of the status
quo of motivation for and engagement in formative assessment for the subset of engineering
faculty studied, and to provide a preliminary validation of a motivational model, based in self-
determination theory, that explains relationships between these variables for this population. To
do so, a survey instrument was first developed and validated that measures engineering faculty
members’ satisfaction of motivational needs, self-determined motivation, and engagement

6
regarding formative assessment of student learning, as no such instrument existed, and then the
data were used to answer the research questions and hypotheses for this study:
RQ1: What are current levels of the following: 1) affective, behavioral, and cognitive
engagement; 2) self-determined motivation; and 3) satisfaction of motivational needs
regarding formative assessment for the subset of engineering faculty studied?
RQ2: Does satisfaction of autonomy, competence, and relatedness needs predict self-
determined motivation for formative assessment in the subset of engineering faculty
studied?
H1: Multiple regression coefficients of autonomy, competence, and relatedness to
self-determined motivation will be positive and significant.
RQ3: Does self-determined motivation for formative assessment predict positive
interest/enjoyment, value/usefulness, satisfaction, choice of behavior, persistence,
effort/importance, intent, or concentration/attention, or negative anxiety in the subset of
engineering faculty studied?
H2: Regression coefficients of self-determined motivation to engagement
constructs of interest/enjoyment, value/usefulness, satisfaction, choice of
behavior, persistence, effort/importance, intent, or concentration/attention will be
positive and significant or of anxiety will be negative and significant.
1.4 Significance of the Study
Three outcomes from this work make significant contributions to the knowledge base of
engineering education. First, the survey instrument that was developed provides a valid and
reliable measurement tool for investigating faculty engagement and motivation for formative
assessment. Second, the data from the national sample of engineering faculty provides a

7
preliminary description of the status quo of engagement and motivation with regard to formative
assessment for the subset of faculty studied, which can be used to establish a foundation and
expectations for future studies. Third, since the motivational model holds (with a caveat) for the
subset of the population studied, it provides a preliminary basis for understanding engagement
and motivation in formative assessment. Therefore, this work contributes to the growing bodies
of work on motivation, assessment of student learning, and formative assessment, and begins
new work in the specific area of faculty motivation and engagement regarding formative
assessment.
1.5 Assumptions and Limitations
This study made one major assumption: that faculty members responsible for
administering a course are also the best candidates to perform assessment on their own course.
Some (e.g. Rowntree, 1987) argue that there is a conflict of interest in this, and that external
assessors should be used. Since this work focuses on formative assessment, which is typically
not used for tenure or promotion decisions but rather internally, it is unlikely that this would be
of concern.
There were several limitations to this study. First, since this study only had participants
from U.S. institutions of higher education, results are only generalizable to such a population.
Second, and similarly, due to some significant differences in demographics of the respondents
and those of the national averages (in ASEE, 2009), the findings herein may not be generalizable
to all U.S. engineering faculty; this is discussed in more detail in section 3.3.3.1. Third, due to
the 9% survey response rate and lack of a priori knowledge of engineering faculty’s
understanding of formative assessment, concerns exist for possible bias in results; this limitation
is explored in detail in section 3.3.3.2. A fourth and final limitation is that the assessment

8
definition used here limits the types of assessment to which results of this work can be
generalized.
1.6 Organization of the Dissertation
Preceding this introductory chapter, a glossary of terms is provided that defines terms that
may be new to readers or more common terms that are used in a specific way in this study. The
second chapter of this dissertation summarizes findings from a review of key literature for the
central aspects of this work: formative assessment of student learning, motivation and self-
determination theory, and the model that was tested in this study. The third chapter describes the
research methodology, including the study samples and survey instrument. Chapter four presents
the results of the survey development and data to be used in determining current perspectives of
formative assessment and for validation of the motivational model. Following, chapter five
discusses inferences drawn from the results presented in chapter four. Finally, chapter six
concludes the study, and suggests future work.

9
Chapter 2: Background
This chapter summarizes a literature review for the key components of this work. First,
assessment, formative assessment, and the operationalization of engagement in formative
assessment are discussed. Second, self-determination theory is presented and operationalized for
this study. Third, the motivational model is presented and discussed in the context of this study.
2.1 Assessment
The term “assessment” has various definitions in the education lexicon pertaining to
learning, grading, accreditation, accountability, and research. This work focuses on assessment
of student learning, as defined by Angelo (1995):
Assessment is an ongoing process aimed at understanding and improving student
learning. It involves making our methods explicit; systematically gathering, analyzing,
and interpreting evidence to determine how well performance matches those expectations
and standards; and using the resulting information to document, explain, and improve
performance. (p. 7)
An important aspect of this definition is that it includes four essential elements: the assessment
method(s) used, the collection of assessment data, the analysis of collected data, and the
application of results for improvements of teaching and learning. The following sections explore
this and other relevant aspects of assessment in more detail.
2.1.1 Formative and Summative Assessment
If the goal of learning is to achieve deep understanding, then formative assessment should
identify problems and progress toward that goal, and summative assessment should
measure the level of success at reaching that goal. (Bransford, Brown, Cocking,
Donovan, & Pellegrino, 2000, p. 258)

10
This quote from How People Learn provides a basic comparison of formative and summative
assessment. Formative assessment measures student learning in the midst of a course or program
with the intention of making improvements while still in progress (McManus, 2008; Moskal,
2008; Barbara M. Olds & Miller, 2008; Barbra M. Olds et al., 2005). An example of formative
assessment would be using an in-class discussion question aimed at measuring student
understanding of a new concept, and addressing misconceptions that students have based on the
findings of that assessment. Summative assessment is, by contrast, not intended to improve
teaching and learning while in progress like formative assessment methods are, but rather is used
to collect evidence at the end of a course or program to examine whether or not educational
objectives were achieved (Moskal, 2008; Barbara M. Olds & Miller, 2008; Barbra M. Olds et al.,
2005). An example of summative assessment would be giving an exam at the end of a course to
measure performance on key topics and using results of the exam for inferences about students’
attainment of key learning objectives (i.e., outcomes-based assessment).
Combining the specifics of formative assessment with the general definition of
assessment above, the working definition of formative assessment for this study is obtained:
Formative assessment is an ongoing process aimed at understanding and improving
teaching and student learning in the midst of educational efforts. It involves making our
methods explicit; systematically gathering, analyzing, and interpreting evidence to
determine how well performance matches those expectations and standards; and using the
resulting information before summative assessments or evaluations are performed to
improve teaching and learning.
A crucial aspect of assessment is the timely use of feedback that it provides, in the form
of assessment data, to both instructors and students. Often the feedback given to students

11
through tests and papers is summative in nature, meaning that they only see the outcome of their
learning and have little to no opportunity to improve on it (Bransford et al., 2000). In this way,
student learning takes place with minimal feedback or direction from instructors, and the
instructor takes little to no information from the student’s work as to how well learning has
progressed until the instructional period is over (Bransford et al., 2000). When a course
assignment is implemented this way, the topic is taught, the student receives and completes the
work, the instructor grades it, and the grade is recorded and returned to the student; this process
is illustrated in the top of Figure 2.1. With formative assessment, on the other hand, students get
timely feedback on their learning, giving ample opportunity to improve before they are tested in
summative ways, which deeply impact their grades, and instructors are able to adapt and respond
to issues with teaching and learning as they arise (Bransford et al., 2000); this assessment
process is illustrated in the bottom of Figure 2.1.

12
Figure 2.1: The process typically utilized for a class assignment (top) versus the process typically employed with formativeassessment (bottom).
Formative assessment was the focus of this work due to two deciding factors. First,
formative assessment has more direct and immediate impact on teaching and learning than
summative since the feedback is employed in the near-term (Moskal, 2008; Rowntree, 1987);
this is more likely to support faculty’s competence than feedback that comes some time after the
teaching has completed (Stumpf & Rindova, 1996). Second, formative assessment methods and
results are typically controlled by the instructor, as opposed to summative data that are often
prescribed by accreditors and department administration (McManus, 2008); this is more likely to
support autonomy of faculty (Stumpf & Rindova, 1996). Summative assessment, on the other
hand, is typically standardized and mandated, and as such, is likely to impair competence and
autonomy and therefore unlikely to be self-determined; this is not to imply that a study of
motivation for summative assessment would not be of value, it is just less likely to provide
variance amongst individual faculty members due to these issues.
The proper role and implementation of grading is outside the scope of this work, but the
effects of assigning grades are relevant to discuss briefly in terms of motivation. Grades are
sometimes confused as assessment; while grades do provide some feedback on performance,

13
they alone do not convey enough depth of information to enlighten the types of decisions that
assessment is designed for. The use of rubrics, an assessment technique, is one example of a
bridge between assessment and grading, allowing for the breakdown of a grade into key
components with specific feedback on each (see M. Besterfield-Sacre, Gerchak, Lyons, Shuman,
& Wolfe, 2004; Moskal, 2008; Moskal, Leydens, & Pavelich, 2002; Walvoord, 2004). More
importantly, though, grades can act as extrinsic motivators to both students and instructors since
they are used by external agents – such as employers, administrators, and parents – for important
decisions, and can thus have motivational ramifications. In this study, grades were considered
extrinsic motivators and excluded from evaluations of faculty motivation to assess student
learning.
2.1.2 Benefits of Formative Assessment
There are at least two specific ways in which the use of formative assessment has benefits
for academia: through faculty, in their improvement of teaching and learning, and through
students, in their learning and self-development.
Black and Wiliam (1998a, 1998b) posit that formative assessment is a highly effective
means of improving teaching and learning, based on their meta-analysis of over 680 pieces of
literature. In one part of their study, a meta-analysis of 43 related studies revealed that formative
assessment led to very large improvements on test scores – with normalized effect sizes between
0.4 and 0.7 – for the lowest performers, which is often a challenging group for instructors to
assist. Further, when reviewing the effects of feedback from formative assessment, they found
that benefits to teaching were greatest when faculty were confident in themselves and their
teaching ability. At the same time, they concluded that formative assessment is not well
understood or used by faculty and that addressing this would require changes in instructors’

14
motivation for assessment, such that they make efforts to learn more about it; this finding is in
line with the theory applied in this study, in that motivation for assessment predicts engagement
in it.
Considering more recent research, interviews with teachers and observations of classes at
12 schools in Scotland found that an initiative specifically created to use formative assessment
had very positive effects on both students and faculty. The faculty formed a community of
practice and shared values, which resulted in increased interest to improve their teaching and try
new pedagogies, stating that they could not have sustained their engagement without these
(Kirton, Hallam, Peffers, Robertson, & Stobart, 2007). Other recent research (Bond, 2009;
Ecclestone, 2006; R. Stiggins, 2006; Yue et al., 2008) has tested and confirmed various benefits
of formative assessment on faculty’s teaching and students’ learning, as well.
Research has found that when formative assessment is used, students make significant
gains as well. From a survey of 751 undergraduates and 85 of their faculty, Myers (2008) found
that assessment plays a significant role in student retention and learning when it is used to
measure students’ prior knowledge, learning priorities, and goals. Since the learning priorities
and goals of students often do not match those of faculty, these differing expectations can clash
in the classroom, impairing learning. In this sense, assessing these priorities and goals at the
beginning of a course gives students a voice in the way the course is conducted, creating a strong
opportunity to maximize learning. Use of formative assessment methods, such as the
background survey, and fostering faculty-student communication not only yields information
that can improve learning and increase retention, but students have reported that courses
administered this way are also conducive to establishing their identity and sense of self (Myers,
2008). An abundance of additional research supports these conclusions and adds others,

15
including positive effects on student motivation, achievement, and persistence on difficult tasks
(see Black & Wiliam, 1998a, 1998b; Brookhart & DeVoge, 1999; Ecclestone, 2006; Hallinan &
Danaher, 1994; Hancock, 2007; Kirton et al., 2007; McMillan & Hearn, 2009; Poulos &
Mahony, 2008; Seale, Chapman, & Davey, 2000; Shepard, 1995; R. Stiggins, 2006, 2007; R. J.
Stiggins, 1999; Swing, 2001; Yue et al., 2008). This work seeks ways to increase positive
engagement in formative assessment by faculty, in order that these benefits and others are
realized to their full potential, and to address related issues being pursued by engineering
educators.
2.1.3 Other Aspects of Assessment
Beyond formative and summative assessment, other aspects of assessment found in the
literature were considered in the framing of this study: assessment data collected for
experimental purposes, as both direct and indirect measures of learning, and from both inside and
outside of the classroom. First, assessment data obtained for experimental purposes are that
which are used to evaluate the effectiveness of either a current or new approach to teaching, as
opposed to simply descriptive (summative) purposes (Dues, Fuehne, Cooley, Denton, &
Kraebber, 2008); this study is interested in experimental, as it is in line with the principle of
formative assessment being used to improve teaching and learning. Second, direct assessments
of student learning are those that use student work as data, and indirect assessments ask students
for their opinions and perceptions or use other data, such as GPA (Dues et al., 2008); this study
is interested in both as they have complementary contributions to measuring learning. Third,
classroom assessment includes assignments, projects, reports, and exams that students complete
for a class (Dues et al., 2008), and this study is interested in those as well as any data faculty

16
might attain from other sources (e.g. other professors, student surveys, etc.) in attempts to
improve teaching and learning.
2.1.4 Assessment Summary
This section highlighted aspects of assessment relevant to this study, including formative
and summative assessment and the benefits of using formative assessment. Assessment, and
more specifically, formative assessment, was defined and discussed in terms of its benefits to
both educators and students. In this study, the benefits to educators are the focus, specifically in
the near-term feedback provided used to inform teaching and learning decisions. The next
section will discuss the idea of engagement in formative assessment, which is the desired
outcome of self-determined motivation for formative assessment.
2.2 Engagement in Formative Assessment
Positive engagement in formative assessment is sought in order to gain the benefits
discussed in section 2.1.2. In the context of the classroom, engagement refers to behaviors and
the “concentration of attentional, cognitive, and affective resources” (p. 339) on a task or activity
(Chen, Lattuca, & Hamilton, 2008). Therefore, in this study, positive affect, behavior, and
cognition were considered the desired outcomes of self-determined motivation for formative
assessment, as attainment of these outcomes should make progress toward improvement of
teaching and learning.
As is discussed further in section 2.4, Vallerand’s (1997) Hierarchical Model of
motivation posits that the consequences of self-determined motivation are positive engagement
in the categories of affect, behavior, and cognition. The studies cited in Vallerand’s work (1997)
identified empirically-tested outcomes of affect to be interest, positive emotions, satisfaction, and
anxiety; of behavior to be choice of behavior (prioritization), persistence, intensity, complexity,
17
intent, and performance; and of cognition to be concentration, attention, memory, and conceptual
learning (p. 320). Thus, engagement in formative assessment by engineering faculty was
operationalized in this study as positive affect, behavior, and cognition toward such assessment.
Each of the three types is discussed in more detail in the following section; more detail on how
they were measured can be found in section 3.2.
2.2.1 Constructs of Engagement
First, in this study, the affective domain included interest, positive emotions, satisfaction,
and anxiety. Interest was measured collectively with enjoyment, the way they were combined in
existing instruments, as an inclination toward formative assessment. Under the category of
positive emotion, value and usefulness were constructs from existing instruments measured
collectively as seeing worth in using formative assessment. Satisfaction was measured as feeling
satisfied with use of formative assessment, even if results are not always positive. Anxiety was
measured as pressure, tension, and anxiety (constructs from existing instruments) and was
expected to have a negative relationship with self-determined motivation.
Second, the behavior domain included choice of behavior, persistence, and intent.
Choice of behavior was measured as choosing to do assessment over other education or research
tasks and choosing to engage in all four assessment stages: using various methods, collecting
data, analyzing data, and applying results to improve teaching and learning. Persistence in
formative assessment was measured as staying on-task even when faced with negative results or
difficulties. Intent was considered to be reporting intentions to use formative assessment in the
future. Intent was also important as the link between behavioral intentions and actual behavior
have been well established (Richer, Blanchard, & Vallerand, 2002, p. 2094) but with the added
18
caveat that this relationship breaks down when a person is controlled or has no choice in the
matter (Richer et al., 2002, p. 2105).
Third, the cognitive domain included concentration and attention. Concentration and
attention are closely tied and were measured collectively in existing instruments, and were
considered to be the ability to focus on the assessment tasks while in progress.
The rationale for choosing these specific elements of affect, behavior, and cognition
consequences to represent engagement in formative assessment is based on a synthesis of the
motivation literature and a subjective evaluation of their application to this study. First, select
motivation studies based in Vallerand’s Hierarchical Model and self-determination theory (Guay,
Vallerand, & Blanchard, 2000; Miserandino, 1996; Reeve, 2002; Roth, Assor, Kanat-Maymon,
& Kaplan, 2007; Sebire, Standage, & Vansteenkiste, 2009; Vallerand, Fortier, & Guay, 1997;
Vallerand & Losier, 1999) have used elements of the three categories of consequences
(engagement) in studies of education, sports, and exercise. Specifically, in the educational
context, interest, anxiety, persistence, intensity, and concentration were most commonly used
(Miserandino, 1996; Reeve, 2002; Roth et al., 2007; Vallerand et al., 1997), which demonstrated
some applicability of these constructs in the context of the education-based study conducted
here. Second, elements of interest, positive emotions, anxiety, persistence, intensity, and
concentration were also favored because they have been successfully measured by existing
survey instruments, such as the Intrinsic Motivation Inventory (IMI), to be discussed more in the
chapter three. Third, elements of complexity and performance didn’t seem to have as much
relevance to this study compared to the others, from a subjective evaluation of their applicability
to this self-report study of formative assessment perspectives. Fourth, and similarly, the memory
and conceptual learning constructs were measured in the literature (Benware & Deci, 1984) by

19
direct observation rather than self-report, and weren’t able to be translated to survey items for
use in this study. Finally, satisfaction, choice of behavior, and attention were selected for
inclusion as they are expected to be outcomes that impact effectiveness of formative assessment
as well as being of interest to engineering education researchers.
2.3 Self-Determination Theory
Motivation was defined by Dai and Sternberg as “a mental construct […] indicated by the
intensity, direction, and persistence of a goal-directed behavior or action” (Motivation, emotion,
and cognition : integrative perspectives on intellectual functioning and development, 2004, p.
11). McKeachie (1996) emphasized the role of motivation when studying individuals’ behavior:
“When people in the same situation with similar backgrounds differ in behavior, it is natural for
us to attribute the differences to motivation” (p. 19). This study utilized motivation theory to
measure and evaluate the motivation, behavior, and perspectives of engineering faculty with
regard to their engagement in formative assessment.
Self-determination theory posits that individuals have three innate needs of autonomy,
competence, and relatedness, which the individual must perceive to be satisfied in order to
experience and sustain self-determined motivation. There are six levels of motivation described
by self-determination theory, each subsequently having a lower degree of self-determination on
the motivation continuum: intrinsic motivation, integrated regulation, identified regulation,
introjected regulation, external regulation, and amotivation (Deci & Ryan, 2000). Of those,
integrated regulation, identified regulation, introjected regulation, and external regulation are
classified as extrinsic motivation, and intrinsic motivation, integrated regulation, and identified
regulation are classified as self-determined (Vallerand, 1997). This section will expand on the

20
theory in more detail and then discuss the application of self-determination theory to engagement
in formative assessment.
2.3.1 The Theory
Self-determination theory (SDT) states that learning, performing, developing oneself, and
curiosity are inherent in human nature and that behaviors are engaged optimally when a person
experiences a high degree of self-determined motivation (Ryan & Deci, 2000). This optimal
engagement is realized as the most intensely positive affect, behavior, and cognition and is
maximized when an individual is intrinsically motivated (Vallerand, 1997). However, not all
motivations are intrinsic, and an individual may experience amotivation, extrinsic motivation, or
intrinsic motivation globally or for any given context, situation, or activity (Niemiec & Ryan,
2009); refer to Figure 2.2 for the motivation continuum on which these lie.
Figure 2.2: The self-determination continuum showing types of motivation with their regulatory styles, loci of causality,and corresponding processes (adapted from Ryan & Deci, 2000, p. 72).
Intrinsic motivation, extrinsic motivation, and amotivation have different degrees of self-
determination and qualities about them. Intrinsic motivation is a highly self-determined state

21
where an individual engages in behaviors they find interesting and enjoyable per their own
volition and in which any external consequences or benefits are not salient (Deci & Ryan, 2000;
Niemiec & Ryan, 2009). A behavior engaged to obtain an outcome external to the self, on the
other hand, is classified as extrinsic motivation and is separated into four types of regulation:
integrated, identified, introjected, and external (Niemiec & Ryan, 2009), as illustrated in Figure
2.2. Integrated regulation is the most internalized of extrinsic motivations, where the external
purposes of undertaking the activity are fully integrated with the individual’s sense of self. Next
is identified regulation, whereby the underlying value of a behavior is somewhat external but still
identified with internally. At the following level, introjected regulation, the regulators are held
externally and not internalized, in the sense that the person feels failure to act will affect their
image (an external construct) but not necessarily their sense of self (internal). In the fourth level,
external regulation is the most controlling stage of motivation whereby the person engages only
to receive a reward or to avoid a punishment, and neither of which are viewed as affecting the
individual’s internal sense of self. Finally, amotivation represents a state one step beyond
external regulation, whereby the individual’s competence or autonomy is so compromised that
they lack any intention to act at all towards the goal (Deci & Ryan, 2000; Niemiec & Ryan,
2009; Ryan & Niemiec, 2009). Within these six classifications, intrinsic motivation and
integrated and identified regulation are considered to be self-determined motivation as the locus
of causality is, to some degree, perceived to be internal, though all six types have a relative,
positive or negative degree of self-determination on the continuum (Ryan & Deci, 2000).
Movement across the motivational continuum toward intrinsic motivation takes place
through internalization, a process in which individuals attempt to reform the activity, or their
perspective of it, in such a way that it can be perceived as aligning with the sense of self (Deci &

22
Ryan, 2000; Niemiec & Ryan, 2009). As the person begins to value the activity and become
more self-determined in their motivation, any external rewards or prompts become less salient.
This internalization process is driven by satisfaction of the individual’s basic psychological
needs of autonomy, competence, and relatedness. When these needs are satisfied, the individual
will experience motivation in a more internalized way; when hindered – like in controlling,
difficult, or socially unwelcoming situations, respectively to each need – motivations will remain
or become extrinsic (Deci & Ryan, 2000). Further, in some instances, this may even induce
defensive processes to protect the self (Deci & Ryan, 2000). In the following three paragraphs,
each need is discussed in more detail.
Autonomy “reflects the desire of individuals to be the origin or source of their own
behavior and is experienced when individuals perceive their behavior as self-endorsed”
(Vlachopoulos & Michailidou, 2006, p. 180). To be clear, autonomy requires more than just
having chosen a behavior, as sometimes options available to a person are either undesirable or do
not align with the person’s interests and values (Deci & Ryan, 2000). Further, an individual’s
sense of self can change over time, shaped by events that are internalized through reflective
processes (e.g., see Matusovich, Streveler, Miller, & Olds, 2009). Autonomy stands in
opposition to being controlled by some external entity, per the individual’s perception of the
locus of control (Deci & Ryan, 2000), such as an instructor feeling they must perform summative
assessments because accreditation requires them, rather than because the instructor finds them to
be important and useful. Autonomy is a unique motivational construct, crucial to self-
determination but not central to other common motivation theories, such as self-efficacy theory
(Niemiec & Ryan, 2009).
23
Competence relates closely to the construct of self-efficacy and “refers to one’s
propensity to interact effectively with one’s environment and to experience opportunities to
exercise and express one’s capacities” (Vlachopoulos & Michailidou, 2006, p. 180). For
example, a professor may not feel confident assessing students, but if introduced to small
challenges over time and given time to practice and master the task, they may feel increasingly
competent over time. However, a professor with no knowledge and no guidance is unlikely to
feel competent and, therefore, would not enjoy assessing student learning, even when persuaded
by an external motivator, such as a mandate (Deci & Ryan, 2000; Niemiec & Ryan, 2009). This
view of competence aligns with other motivational views, such as flow theory (Csikszentmihalyi,
1990), expectancy-value theory (Wigfield & Eccles, 2000), and the zone of proximal
development (Vygotsky, as cited in Ormrod, 2008), and is a widely-used motivational construct.
Relatedness “refers to feeling connected with significant others, cared for, or that one
belongs in a given social milieu” (Vlachopoulos & Michailidou, 2006, p. 180). For example, an
instructor may experience relatedness when they feel as though they are more of a part of the
faculty body because they make efforts to improve their teaching, as they perceive that this is a
social norm. This construct of relatedness, however, carries an important caveat regarding
balance. That is, a person who is overly reliant on others and connections to them can actually
be the person’s subconscious attempt to compensate for previous thwarting of relatedness, and
hence can appear as the need being satisfied when it is actually insatiable. Otherwise, this
construct is measured and applied simply, and is common to motivation theories though rarely
referred to by the same terminology (Deci & Ryan, 2000). Of note, however, in this study
relatedness had to be directly connected to formative assessment or else it may have affected

24
construct validity; hence, it was slightly more inclined toward sharing assessment results with
others than interpersonal connections in general.
2.3.2 Self-Determination in Assessment
One aspect of this work is to determine whether fostering self-determined motivation for
formative assessment will increase positive engagement in it. Self-determined engagement can
be experienced by faculty members who participate in formative assessment willingly and for
internalized reasons, have confidence in themselves and their ability, and experience a healthy
connection to other stakeholders; i.e., they should experience self-determined engagement in
formative assessment with feelings of autonomy, competence, and relatedness, respectively.
To foster self-determined engagement in assessment, a few things must be considered.
College teaching has many opportunities to be intrinsically rewarding – e.g., facilitating
students’ growth and learning, experiencing the freedom afforded in teaching, and making
connections with both colleagues and students – and research has shown that people generally
consider teaching to be intrinsically interesting (Deci, Kasser, & Ryan, 1996). However, when
we consider formative assessment instead of teaching, it is less clear how faculty feel about their
autonomy, competence, and relatedness needs. If they do assessment for reasons other than that
they believe in it or feel their assessment skills are sufficient they may engage in it extrinsically,
losing the benefits of engagement that precipitates from self-determined motivation, and, as a
worst-case, develop an aversion to it. However, extrinsically-motivated behaviors may become
introjected or integrated regulation – more self-determined forms of extrinsic motivation –
through the process of internalization, as discussed above (Deci et al., 1996). Therefore, if self-
determined engagement is sought as a means to support positive engagement in formative
assessment, scholarly inquiry must be conducted to ensure that this model of motivation and

25
engagement holds for formative assessment. Then, factors that influence the motivation of
faculty can be investigated and appropriate policies and interventions designed, knowing that
they can produce increasingly positive engagement in formative assessment.
2.3.2.1 The Role of Accreditation
Since accreditation has become prevalent in higher education as a means to establish
accountability and ensure quality in educational programs, it is relevant to discuss its role in the
study proposed here. Recent changes in engineering accreditation requirements have been aimed
at establishing and promoting use of summative assessment for evaluation of programs’
effectiveness in attaining educational objectives. As well, engineering’s academic accreditation
agency, ABET, reformed their standards with, amongst others, a goal of increasing engagement
in formative assessment at the institutions they accredit (M. Besterfield-Sacre et al., 2000;
Prados, Peterson, & Lattuca, 2005b; Volkwein et al., 2008).
However, it seems unlikely that an external agency could induce self-determined
engagement in assessment, as accreditation tasks will be viewed as external requirements; this
has been reflected in studies on the impact of the newest ABET requirements on use of
assessment by faculty. In Volkwein et al. (2008), through simple questionnaires, faculty
reported that they thought about assessment more in the years after the new accreditation
requirements were introduced, but department heads reported that they were not seeing
improvements in usage of or impact from assessment. Further, per his critical review of
assessment and accreditation literature, Woolston (2008) stated that in many cases, institutions
conduct a great deal of assessment as accreditation reports come due, but immediately fall back
to minimal use once reaccreditation is attained. These are symptomatic of extrinsic engagement
in assessment, where the faculty members were engaging in the assessment tasks – or not

26
engaging at all – because they were forced to and because they never internalized the behaviors.
Prados, Peterson, and Lattuca (2005b) discuss the relaxation of accreditation standards when
ABET revised them in 2000; this was likely done to increase autonomy in accreditation, as
programs were given the ability to define their assessment goals and actions in accordance with
their own institutional and departmental cultures, reported through their “self-study” plan.
Woolston (2008), however, still has reservations about accreditation ever becoming a promoter
of intrinsic engagement in assessment, as he argues that key assumptions underlying the new
standards endorse a philosophy that will necessarily impair autonomy.
Sutton (2005) sees accreditation as a barrier to attaining self-determined motivation for
assessment, arguing that faculty and administration “feel coerced and so resist or even undermine
assessment activities on campus,” and cites a statement released from the 2005 meeting of the
North Central Association Higher Learning Commission that said “effective assessment is a
matter of commitment not compliance” (p. 4). Grounding her view of the problem and solution
in self-determination theory, she describes faculty’s engagement in assessment to be
unproductive and unappreciated when it is found in the more extrinsic forms of motivation, and
suggests ways to internalize the engagement by addressing faculty’s autonomy, competence, and
relatedness with respect to assessment. Specifically, she suggests: using simple terminology,
giving faculty feedback on their work, and holding discussions about assessment, to improve
competence feelings; emphasizing the improvement of teaching and learning over meeting
accreditation demands, proving that there is choice in how assessment is conducted and aligning
it with personal goals, and providing rationale for assessment tasks, to improve autonomy
feelings; and supporting both positive and negative assessment results and making assessment a
fun, team effort, to improve relatedness.

27
As such, it is doubtful that accreditation requirements could foster self-determined
motivation to engage in assessment and thereby contribute to the model presented in this study.
Nonetheless, it may be that, over time, accreditation could build momentum for assessment
usage until the requirement is no longer necessary; then, the extrinsic motivators could be
removed and assessment would continue intrinsically. Research supports the notion that this can
and does occur through the process of internalization in individuals (Deci et al., 1996).
However, and in summary, accreditation is not targeted in this work for the same reasons that
summative assessment is not – it is not likely to promote self-determined motivation directly.
Therefore, accreditation and summative assessment will not be discussed further and will not be
measured, though their possible role in attaining the research objective should not ignored and
could be the focus of future studies using self-determination theory.
2.3.3 Self-Determination Theory Summary
Self-determination theory posits that individuals experience intrinsic and self-determined
motivation when their needs of autonomy, competence, and relatedness are satisfied. In
assessment, it is argued that the idea of formative assessment has the greatest potential to satisfy
these needs, especially in comparison to accreditation and summative assessment. As such, this
study is intended to test the nature of formative assessment in motivation, and the next section
will discuss the model by which this relationship is being explored.
2.4 Hierarchical Model of Motivation
Figure 2.3 is a hypothesized model of the relationships between the perceived satisfaction
of motivational needs (autonomy, competence, and relatedness), the subsequent degree of self-
determined motivation, and the resulting engagement (Deci & Ryan, 2000; Vallerand, 1997).
Applied to this study, an engineering faculty member’s perceptions of autonomy, competence,

28
relatedness needs being satisfied in formative assessment were hypothesized to lead to a degree
of self-determined motivation experienced, and the subsequent motivation were hypothesized to
lead to positive affective, behavioral, and cognitive engagement in formative assessment. In
addition, different degrees and types of motivation are hypothesized to lead to different levels of
engagement in various formative assessment behaviors. In the section that follows, the model
and its application to this study of formative assessment are explored in more detail.
2.4.1 The Model
The Hierarchical Model of motivation was constructed by Vallerand (1997) to represent
motivation, as described by self-determination theory, more completely by modeling at multiple
hierarchical levels and across interdependent stages. The model includes three levels of
Figure 2.3: Motivational model tested in this study, which was based on Vallerand’s (1997) Hierarchical Model of self-determination theory where perceived satisfaction of motivational needs leads to different motivational types and degree of
self-determination, which lead to different aspects of engagement in formative assessment.
Self-determination
Autonomy
Competence
Relatedness
Motivation Type / Degreeof Self-determination
Value/Usefulness
Satisfaction
Anxiety
Introj. Reg.
Ext. Reg.
Am
otivation
Ident. Reg.
Integ. Reg.
IntrinsicMotivational needs Motivation type Engagement
Interest/Enjoyment
Choice of Behavior
Persistence
Effort/Importance
Intent
Concentration/Att.

29
generality: the global, or personality, level; the contextual, or life domain, level; and the
situational, or state, level. Within each level, it is theorized that social factors determine
mediators of autonomy, competence, and relatedness, which determine the degree of self-
determination experienced, which determine outcomes/consequences of affect, behavior, and
cognition; see Figure 2.4 for an illustration.
Figure 2.4: Vallerand’s (1997) Hierarchical Model of motivation.
There are five postulates of the Hierarchical Model, most of which are relevant to the
study herein. Postulate one says that a complete consideration of motivation must include
consideration for all three types of motivation: amotivation, extrinsic motivation, and intrinsic
motivation (Vallerand, 1997). In this study, all three will be considered as they exist on the
motivation continuum, measured as the Relative Autonomy Index (RAI) in the survey
instrument. Postulate two states that motivation exists within the three hierarchical levels of the

30
model: global, contextual, and situational (Vallerand, 1997). This is of particular concern to this
study, as formative assessment, measured as a general activity, falls somewhere in between the
education context and teaching situation. Therefore, measuring formative assessment as defined
means that findings will be “circumscribed to this level of generality” (Bob Vallerand, personal
communication, March 23, 2010). Postulate three says that motivation at any given level results
from both social factors at that level and top-down effects from another level (Vallerand, 1997).
This study aims to provide evidence that there is a relationship between motivational needs, self-
determined motivation, and engagement in formative assessment, and exploration of the effects
of the other variables suggested in the postulate is left as future work. Postulate four asserts that
bottom-up effects can influence motivation at a higher level (Vallerand, 1997), but, as above,
these extraneous variables will not be considered in the current study. This may mean that some
variance between needs and motivation is unexplained, but should not negatively affect the
results of the model being tested herein. Finally, postulate five states that motivation leads to
important consequences (Vallerand, 1997). In this study, the consequences are the affective,
behavioral, and cognitive engagement in formative assessment, as described in section 2.2.
2.4.2 The Hierarchical Model in Education
Vallerand’s (1997) Hierarchical Model has been empirically tested at the global level
(e.g., Guay et. al, 1996, as cited in Vallerand, 1997) and for various contexts (e.g., Miserandino,
1996; Sebire et al., 2009; Vallerand et al., 1997; Vallerand & Losier, 1999) and situations (e.g.,
Guay et al., 2000; Vallerand and Blanchard, 1996b, as cited in Vallerand, 1997). In these
studies, the model has held, as proposed, for most of the variables tested. For example, Guay et
al. (2000), conducted five studies to validate their Situational Motivation Scale (SIMS)
questionnaire. In the third study, 145 French-Canadian college students completed the SIMS

31
questionnaire by recalling a conversation they had in the previous two hours with a significant
other. Results showed that the participants whose significant other afforded them the most
sovereignty in the conversation had the highest satisfaction of autonomy, competence, and
relatedness needs in the conversational situation, had the highest scores on the most internalized
motivations (i.e., intrinsic motivation and identified regulation) and the lowest scores on the
external motivations (i.e., external regulation and amotivation), and had the strongest indication
that they desired to have more conversations with the person (Guay et al., 2000). These results
showed support for the validity of not only the Hierarchical Model on the situational level, but
the ability of the survey instrument to measure the model constructs.
In the context of education, Vallerand et al. (1997), conducted an investigation of high
school dropout that is quite analogous to the study that was conducted here. In their
investigation, over 4,500 9th and 10th grade French-Canadian students completed a questionnaire
consisting of five parts: parent and teacher autonomy support (social factors), perceived school
autonomy and competence (motivational mediators), the Academic Motivation Scale (self-
determined motivation), future schooling intentions (consequences), and demographics (pp.
1164-1165). A year later, the schools were again contacted to supplement the future schooling
intentions of the students with actual dropout and persistence information. The authors first
analyzed data with ANOVA tests to look for significant differences across categories of students.
Of relevance, they found that 6 of the 7 motivation types (e.g. introjected regulation, intrinsic
motivation) showed significantly higher self-determination for persisting students than for
dropouts. Second, the authors tested the Hierarchical Model using structural equation modeling,
a statistical technique with factor analysis and regression at its roots. Results completely
confirmed the model; that is, low autonomy support from parents and teachers lead to low
32
autonomy and competence feelings of students toward school, which in turn led to low self-
determination toward school, which was a strong predictor of dropout. The only variable that
was not significant in the model was autonomy support by school administrators, which was
predicted to be a weaker connection before the onset of the study (Vallerand et al., 1997).
There are many implications from this study for the one conducted here. First, the
Hierarchical Model was shown to hold in an educational context, showing support for
application of both the model and self-determination theory in education. Second, the methods
used in their study bear strong semblance to those used here, lending some support for the
methodology of this study. Third, the scoring of the motivation scale, though not discussed
above, was addressed in the same manner as was used here, where the motivational construct
scores (e.g. introjected regulation, intrinsic motivation) are combined to form a singular,
continuous score of self-determination (Relative Autonomy Index, RAI). Fourth, and finally, the
construct of intent was tested and confirmed to be a valid measure of future behavior, which
lends some support for the same construct used in the study here.
2.5 Background Summary
In this chapter, a summary of the literature was presented, focusing on three key areas
relating to the study: formative assessment and engagement in it, self-determination theory, and
the motivational model tested. In the next chapter on methodology, the study design is presented
along with data collection and analysis.

33
Chapter 3: Methodology
This work was a quantitative study that included a survey-instrument development, where
the survey instrument was used to collect data for the quantitative study. Primarily, the goal of
the instrument development was to create and validate a survey instrument that measures
engineering faculty members’ satisfaction of their autonomy, competence, and relatedness needs,
their degree of self-determined motivation, and their engagement, all pertaining to formative
assessment. Secondarily, the goal of the quantitative study was to answer the research questions
by collecting data from a national sample of engineering faculty and using a subset of it to
provide a preliminary description of the status quo and for validation of the motivational model.
This chapter will further expand on the research design, instrument design, sample selection, and
data collection and analysis in the sections that follow.
3.1 Research Design
This work was a quantitative study that included a survey instrument design. The survey
instrument was designed to provide data necessary to draw valid and reliable inferences to
answer the research questions, and the methods used to construct this instrument were based on
the process recommended by Colton and Covert (2007). Section 3.2 of this document contains
details on the instrument design procedure and section 3.5 describes the data analysis, including
the quantitative study. This section will elaborate on the choices made in the research design.
First, in order that the research questions could be investigated with the most
generalizable results, a relatively-large and representative sample of engineering faculty was
desired. Quantitative studies are best suited for collecting and analyzing data from larger
samples, and lend themselves well to statistical analyses (J. W. Creswell, 2002). In the work
conducted here, the study of motivation necessitated that either interviews or surveys be used,

34
since direct input from the individual is required to understand their motivation (Motivation,
emotion, and cognition : integrative perspectives on intellectual functioning and development,
2004). Furthermore, validation of the motivational model required use of statistical analyses on
a relatively large data set to ensure that the necessary statistical power was obtained for all
variables. Therefore, a quantitative survey instrument was the ideal method to employ to
develop the instrument and answer the research questions of this study.
Second, it was necessary to develop a survey instrument that could collect the required
data, as such an instrument did not exist. Even though several existing instruments, which had
undergone validation and reliability testing, were used to construct this instrument, significant
modifications were made in some cases and hence needed to be developed carefully and undergo
validation and reliability testing. Therefore, various survey instrument design methods were
reviewed. Colton and Covert (2007) was selected for this study as it is written specifically for
use in the social sciences and since the approach was familiar to the researcher. The eight-step
process that Colton and Covert (2007) recommend, discussed in more detail in section 3.2, also
adhered to many of the oft-cited recommendations of Creswell (2002) for research design, such
as considering validity through the whole design process and carefully devising research
questions and purpose statements before anything else.
3.1.1 Context
The context for this study was undergraduate engineering education classes in U.S.
institutions of higher education. Engineering education classes include any undergraduate
classes that are intended to educate students on engineering topics. There are a few reasons for
the selection of this context.

35
First, engineering faculty were studied, versus faculty in all fields, as the desire was to
draw inferences about the motivation and engagement in formative assessment of engineering
faculty specifically. This way, specific analyses can be performed within the narrowed context
of engineering education using knowledge and literature that is specific to the field.
Second, the rationale for limiting this population to faculty at U.S. institutions was to
mitigate issues with language, national culture, and research ethics (such as IRB) for both
participants’ interpretation of the survey and researchers’ analysis of the results. It was also
more convenient to target U.S. institutions, as the American Society of Engineering Education
(ASEE) has published a book with information solely on such colleges (ASEE, 2009).
3.2 Instrument Design
For the instrument design, eight steps were taken to ensure the most valid and reliable
survey instrument was developed (Colton & Covert, 2007). The sections that follow will discuss
these steps and relevant information in more detail.
3.2.1 Procedure
The survey instrument design process in this study was recommended by Colton and
Covert (2007). The steps of this process were:
1. Identify the purpose and focus of the study, and questions to be answered;
2. Obtain feedback from stakeholders to clarify the purpose and focus;
3. Identify the research methodology and type of instrument to use;
4. Begin to formulate questions or items;
5. Pretest items and preliminary draft with expert reviewers;
6. Revise instrument based on feedback and prepare for pilot testing;
7. Pilot test and revise prior to final administration; and
36
8. Administer instrument, and analyze and report results (p. 18).
In the following paragraphs, each step is discussed in more detail.
Step 1 required background literature to be synthesized and analyzed to define the
purpose and focus of the study, to establish research questions, and to define the constructs and
their operationalization (Colton & Covert, 2007). In this dissertation, chapter 2 discussed the
literature review and defined constructs, and chapter 1 presented the purpose, focus, and research
questions of the study.
Step 2 was conducted in the proposal review meeting, where the expert committee
reviewed the purpose and focus of this work, to ensure efforts were clear and well-directed
(Colton & Covert, 2007).
Step 3 required the research methodology and methods to be defined based on the
purpose of the study and background research reviewed (Colton & Covert, 2007). The choice of
methods was limited to surveys and interviews since this work studied motivation of individuals,
which requires participants to self-report their perceptions of situations. Further, this work
sought to develop an instrument that is widely applicable and generalizable, for which a survey is
most adept at achieving given the ability to distribute it widely and to a large sample and ability
to analyze survey data quantitatively (J. W. Creswell, 2002; J. W. Creswell & Clark, 2007). For
more information on the methodology and research design, refer to section 3.1.
In step 4 the preliminary instrument was formed by bringing together constructs to be
measured, reviewing existing instruments, and identifying steps necessary for validation (Colton
& Covert, 2007). This dissertation discusses these three tasks in sections 3.2.3, 3.2.5, and 3.2.2,
respectively.

37
Step 5 was a review of the preliminary instrument, in which an evaluation of the survey
was conducted for construct validity, clarity of purpose, and clarity of instructions and questions
(Colton & Covert, 2007). Reviewers for the instrument included the experts of the PhD advisory
committee, and only minor changes were made to the preliminary instrument.
Step 6 required revisions to the preliminary instrument, based on feedback obtained in
step 5, to form the pilot survey. Details reviewed included wording, questions and sections
order, item and response formats, relevance, clarity, and grammar, and time requirement (Colton
& Covert, 2007, pp. 131-132).
Step 7 was the pilot testing and final revision stage, where the pilot survey was reviewed
with a small sample of participants (discussed in section 3.3.2) and then revised to form the final
survey; participants in this step were excluded from participating in the final instrument. The
goal of the survey piloting was to investigate how respondents understood the survey questions,
identify the types of information participants retrieved to answer questions, and evaluate whether
participants performed the survey task the way that was intended; see section 4.1.1 for results.
The pilot testing was conducted as brief interviews where participants were first given a paper
copy of the survey and asked to fill it out, taking notes and/or vocalizing thoughts as they
proceeded such that they could provide thoughts, concerns, or problems along with their
responses. Then, following completion, questions were posed to solicit qualitative feedback on
each quantitative survey item or block of items; these interview questions are provided in
Appendix B. After data were collected from the pilot testing, checks for validity and reliability
were performed, aimed at attaining the goals listed above. Survey items or sections that had
reliability or validity issues were revised to complete the final instrument (Colton & Covert,
2007). The full pilot procedure and questions are listed in Appendix B.
38
Lastly, for step 8, the final instrument was administered to the sample described in
section 3.3.3, and final data collected as discussed in section 3.4. Analysis of the data was
performed per section 3.5, and reported in chapter four along with a discussion in chapter five.
3.2.2 Validity and Reliability
Validation is “the process of accumulating evidence that supports the appropriateness of
the inferences that are made of responses to an assessment instrument for specified […] uses”
(Moskal et al., 2002, p. 351). Therefore, to validate inferences drawn to answer the questions in
section 3.2.1, pertinent evidence was sought to allow the inferences to be tested. A few different
validation aspects appear in the literature (e.g., Colton & Covert, 2007; Messick, 1995; Moskal
et al., 2002); this study addressed four aspects discussed in Colton and Covert (2007): content,
construct, external, and internal validity. Content validity is the degree to which the intended
content of the instrument, including the topic and processes addressed, are represented
completely. Construct validity requires that the definition and operationalization of constructs
are informed by theory and backed by measurements on actual data, and tested for both
convergence and discrimination. External validity looks at the ability to generalize results from
the study to those of a broader population. Internal validity is concerned with the confidence that
can be placed on the predictability of causal variables to effect variables.
Before looking further at the specific categories of validity addressed, however, it was
important to note that items for a good portion of the survey instrument were formed from
existing survey instruments that have been validated for measuring the constructs of this study;
these instruments are discussed in section 3.2.5. The items taken from these were altered as little
as possible to fit the context and purposes of this study, yet still required revalidation.

39
Content validity was addressed in steps 1, 3, and 4 of the design process, and reviewed at
steps 2, 5, and 7 through expert reviews and participant feedback. The goal was to ensure that all
constructs are represented in the instrument completely; as such, the study’s purpose,
background, and constructs were used to check against. In steps 1, 3, and 4, a number of actions
were taken to ensure content validity: using an existing, tested motivational model to determine
the necessary constructs (i.e., Vallerand, 1997), performing a literature review to ensure a
thorough approach, and using survey items that have already been tested to measure the
constructs (Colton & Covert, 2007).
Construct validity was addressed through both convergent and discriminant validity. At a
basic level, construct validity was provided by the literature review and construct definitions in
this work, establishing a singular meaning to operationalize the constructs. Later, in the piloting
stage, open-ended questions were provided that requested participants to add commentary on
what they believed was being measured by every constructs’ items, looking for alignment
between participant responses and the construct definitions. In the final step of the instrument
development, reliability measures were utilized to ensure that the questions pertaining to each
construct were consistently measuring that construct and not others, which are the convergent
and discriminant aspects of construct validity, respectively (Colton & Covert, 2007). Results of
these analyses are presented in section 4.1.1.1.
External validity was evaluated in two sections of this work: 3.3.3.1 and 3.3.3.2. In the
former section, the demographics of the respondents were compared to the demographics of all
U.S. engineering faculty. In the latter section, an evaluation of non-response bias on the results
of the study was performed and discussed. Together, these approaches sought to evaluate the

40
ability of the results and inferences from this study to be generalized to the population of U.S.
engineering faculty at large.
Internal validity was evaluated at a small scale while reviewing the regression results in
section 4.2. In this evaluation, the R-squared values were assessed for the likelihood that other
confounding variables might be present that affected the outcomes.
Reliability is “the extent to which an instrument produces the same information at a given
time or over a period of time” (Colton & Covert, 2007, p. 74). In this study, internal reliability
was measured for the various constructs via Cronbach’s Alpha, which permits evaluation of
internal reliability by measuring inter-correlations between items and groups of items. From
this, the reliability of a single item to measure a construct can be evaluated, and the decision to
remove an item may be made if it would significantly increase the reliability of the remaining
items. This process was applied to the final instrument, where Cronbach’s Alpha was
aggressively applied before final data analysis to remove items (and their data) where reliability
could be significantly improved by doing so. The criteria used to judge Cronbach’s Alpha values
were: greater than 0.9 was excellent, between 0.8 and 0.9 was good, between 0.7 and 0.8 was
acceptable, between 0.6 and 0.7 was questionable, between 0.5 and 0.6 was poor, and below 0.5
was unacceptable (George and Mallery, 2003, as cited in Jones, Paretti, Hein, & Knott, 2010, p.
323). Results of reliability analysis are presented in section 4.1.2.2.
3.2.3 Instrument Constructs Required
The instrument needed to collect data that could be used to answer the study’s research
questions, which are repeated here for convenience:

41
RQ1: What are current levels of the following: 1) affective, behavioral, and cognitive
engagement; 2) self-determined motivation; and 3) satisfaction of motivational needs
regarding formative assessment for the subset of engineering faculty studied?
RQ2: Does satisfaction of autonomy, competence, and relatedness needs predict self-
determined motivation for formative assessment in the subset of engineering faculty
studied?
RQ3: Does self-determined motivation for formative assessment predict positive
interest/enjoyment, value/usefulness, satisfaction, choice of behavior, persistence,
effort/importance, intent, or concentration/attention, or negative anxiety in the subset of
engineering faculty studied?
Considering these questions, three categories of constructs were established: satisfaction of
motivational needs by formative assessment (RQ1 and RQ2), motivation for formative
assessment (RQ1 and RQ2), and engagement in formative assessment (RQ1 and RQ3). For
satisfaction of motivational needs, the constructs were autonomy, competence, and relatedness,
as prescribed by self-determination theory (Deci & Ryan, 2000). For motivation for formative
assessment, the constructs were external regulation, introjected regulation, identified regulation,
and intrinsic motivation, as prescribed by self-determination theory (Deci & Ryan, 2000);
additionally, the variable Relative Autonomy Index (RAI) was calculated as a combined score of
these four motivation constructs1, to indicate the degree of self-determined motivation; refer to
section 2.3 for more details on these constructs and the motivational needs discussed above. For
engagement in formative assessment, the constructs were interest/enjoyment, value/usefulness,
satisfaction, and anxiety as the affective constructs; choice of behavior, persistence,
1 The RAI was calculated as 2 x Intrinsic Motivation + Identified Regulation – Introjected Regulation – 2 x ExternalRegulation, as recommended in the IMI survey (see section 3.2.5).

42
effort/importance, and intent for the behavioral constructs; and concentration/attention for the
cognitive constructs, as listed in Vallerand (1997); refer to section 2.2 for more detail on the
engagement constructs. Additionally, demographic variables of sex, ethnicity, academic rank,
institution, engineering discipline, and number of classes taught were included, which were
adopted from the ASEE text (2009).
3.2.4 Instrument Structure
In step four of the instrument development procedure, the structure for the instrument
was developed to guide construction and layout and to ensure all necessary parts were included.
This structure is given here; see Appendix D for the instrument itself:
1. Informed consent request – must accept to enter survey, or decline to participate.
a. IRB #10-471, approved May 25, 2010.
2. Survey Title
a. Clear and simple, with unambiguous terms, conveys basic purpose.
3. Introduction.
a. Clear and simple purpose and goals of study.
4. Directions.
a. Overall directions, including definition and explanation of formative
assessment.
b. Subsection directions, to ensure response process is clear.
5. Examples of formative assessment (open-ended).
a. Two questions requesting examples of formal names or informal descriptions
of formative assessment.
6. Survey items (close-ended).

43
a. Engagement of formative assessment questions – asked early on to help
solidify meaning of formative assessment for participants.
b. Self-determination for assessment questions.
c. Satisfaction of three needs for assessment questions.
7. Demographics questions.
a. Sex, ethnicity, academic rank, institution, engineering discipline, and number
of classes taught.
8. Closing.
a. Open-ended comments, thank for participation, repeat contact information.
All of the main survey items collected quantitative data in close-ended form, ideal for
statistical analysis such that results are generalizable and the instrument is widely useful (John
W. Creswell, Plano Clark, Gutmann, & Hanson, 2003). These questions solicited two
quantitative data types, nominal and interval. Nominal, or categorical, data break people into
categories by demographic information, which is useful for describing participants. Interval, or
scaled, data are recorded in numerical values with equal spacing between choices, whereby few
limitations exist to the statistical techniques that can be used. This second type of data is
generally good to collect if extensive statistical analysis is important to the research (Suskie,
1992), as was the case in this study using regression analysis. The interval-type questions asked
on typical self-determination theory instruments (see Deci & Ryan, 2010) have a range of 1 to 7,
with 1 being labeled “not at all true” and 7 being labeled “very true” with 4 sometimes described
as “somewhat true.” This format has an advantage over Likert-rating scale questions, which
provide ordinal data only, typically on a 5-point scale ranging from “strongly-agree” to
“strongly-disagree” and including “neutral” in the middle: the robustness of ordering Likert data

44
is questioned, and the ordinal data obtained somewhat limits statistical analysis (Suskie, 1992).
As such, all of the items on this survey instrument used the interval-type format with a response
range of 1 to 7 as described above, which, in most cases, matched the existing instruments from
which they were taken.
3.2.5 Existing Instruments Used
The survey for this study was formed from four existing instruments that were designed
to measure the constructs of interest: 1) the Intrinsic Motivation Inventory (IMI), 2) the Exercise
Self-Regulation Questionnaire (SRQ-E), 3) the Basic Psychological Needs Scale (BPNS), and 4)
the Rochester Assessment of Intellectual and Social Engagement (RAISE).
The Intrinsic Motivation Inventory (IMI) is available for research use on the SDT website
(Deci & Ryan, 2010) and contains items that were modified for use in this study’s instrument.
Of the many constructs available for measure, interest/enjoyment, value/usefulness (for positive
emotion), pressure/tension (for anxiety), and effort/importance (for intensity) were used. Items
for each construct have multiple questions related to an activity for which the respondent chooses
their answer on a scale of 1 to 7, where 1 is “not at all true” and 7 is “very true,” with 4 being
labeled “somewhat true;” scoring for a construct is the average of all responses for that construct
after any necessary items are reverse coded. Multiple questionnaires were listed on the website
under the IMI, with many of their questions taking the generic form of “I enjoyed doing the task
very much.” After selecting questions from the IMI questionnaires for the constructs listed
above, they were reworded for the present tense and for formative assessment to be the task
considered. One validation of the IMI was by McAuley, Duncan, and Tammen (1989) through a
basketball free-throw shooting game: 116 participants played in the game, and then took the IMI
immediately following. Confirmatory factor analysis and coefficient alphas showed adequate

45
support for the constructs contained in the IMI (interest/enjoyment, α = 0.78; value/usefulness α
= 0.80; pressure/tension, α = 0.68; effort/importance, α = 0.84).
The Exercise Self-Regulation Questionnaire (SRQ-E) is available for research use on the
SDT website (Deci & Ryan, 2010) and contains items that were modified for use in this study’s
instrument. The constructs of the instrument are external regulation, introjected regulation,
identified regulation, and intrinsic motivation2, which are combined to form a single score for
self-determined motivation called the Relative Autonomy Index (RAI). Since this study most
directly used the self-determination score, the other motivation type (amotivation) was not be
added, as it was not part of the RAI scoring. Items for each construct in the SRQ-E have
multiple questions related to a base activity for which the respondent chooses their answer on a
scale of 1 to 7, where 1 is “not at all true” and 7 is “very true,” with 4 being labeled “somewhat
true,” and scoring for a construct is the average of all responses for that construct. Multiple
questionnaires are listed on the website under the SRQ-E, and many of them have a stem such as
“I try to exercise on a regular basis” and then items such as “because it’s fun.” The
questionnaire called “Motivation for Exercise” was selected, as the items’ stems were
appropriate for the audience and easily reworded for formative assessment for this study.
Levesque et al., (2007) validated a similar version of the SRQ for the health-care domain by
sampling 2,731 people from various backgrounds. Through exploratory and confirmatory factor
analysis, support was found for all but one item, and coefficient alpha values were good
(intrinsic motivation, α = 0.85 to 0.93; identified regulation, α = 0.73 to 0.79; introjected
regulation, α = 0.74 to 0.86; and external regulation, α = 0.73 to 0.91).
2 It is worth noting that intrinsic motivation and integrated regulation have not been empirically separable instudies, and therefore are not measured separately.

46
The Basic Psychological Needs Scale (BPNS) is available for research use on the SDT
website (Deci & Ryan, 2010) and contains items that were modified for use in this study’s
instrument. The constructs of the instrument pertain to satisfaction of the motivational needs of
autonomy, competence, and relatedness. Items for each construct have multiple questions
related to a context for which the respondent chooses their answer on a scale of 1 to 7, where 1 is
“not at all true” and 7 is “very true,” with 4 being labeled “somewhat true,” and scoring for a
construct is the average of all responses for that construct. Multiple questionnaires are listed on
the website under the BPNS with statements such as “I do not feel very competent when I am at
work.” The “Basic Need Satisfaction in General” questionnaire was selected of the BPNS
instruments available, as the questions were appropriate for the audience and easy to reword for
formative assessment for this study. Vlachopoulos and Michailidou (2006) developed and
validated a version of this instrument for the exercise domain with two samples of 500
participants from private fitness centers. Results of the study found adequate validity and
reliability for the factor structure, internal consistency, generalizability, discriminate validity,
predictive validity, test-retest reliability, and social desirability effects (autonomy, α = 0.84;
competence, α = 0.81, relatedness, α = 0.92).
The Rochester Assessment of Intellectual and Social Engagement (RAISE) is available
for research use from a journal article (Miserandino, 1996) and contains items that were
modified for use in this study’s instrument. This instrument was designed for measuring
perceived engagement or disaffection constructs, amongst others, and from it, items for anxiety,
persistence, and concentration were adopted. Items for each construct have multiple questions
related to situations for which the respondent chooses their answer on a scale of 1 to 4, where 1
is “not at all,” 2 is “not very true,” 3 is “sort of true,” and 4 is “very true,” and scoring for a

47
construct is the average of all responses for that construct. The questionnaire has statements
such as “When my teacher explains new material, I feel scared.” These questions were reworded
for formative assessment, slightly revised for age-appropriateness, and the scale increased to 1 to
7 to be consistent with the other scales this study. Miserandino (1996) tested the instrument with
187 third and fourth grade students and analyzed data with factor analyses, and found that most
factors and items had adequate validity and reliability scores; the items used in this survey
instrument scored adequately (anxiety, α = 0.72; persistence, α = 0.77; and concentration α =
0.79).
3.2.6 Additional Constructs and Items
Items for three of the constructs were modified significantly or extracted from non-survey
studies, and hence were the most subject to validity and reliability issues. However, as discussed
in sections 4.1.1.1 and 4.1.2.2, all three showed sufficient evidence that the survey items were
both valid and reliable as applied in this study.
First, for the construct of satisfaction, items were taken from the Academic Motivation
Scale (α = 0.85), in Vallerand et al. (1993), and the Employee Attitude Survey (α = 0.92), in
Deci, Connell, and Ryan (1989), and were combined and reworded. Second, for the construct of
intent, items were taken from the questionnaire developed by Vallerand, Fortier, and Guay
(1997) (α = 0.64), and then reworded for this study. Finally, for the construct of choice of
behavior, items were extracted from the study in Swann and Pittman (1977), which did not use a
survey but rather interviews and observations. Since the researchers’ comments were quoted, it
was possible to take survey items from these quotes and descriptions in the study, but no alpha
values or other statistical tests were performed. This elevated concern for validity and reliability
of this construct, as it had not been tested in survey form; results in sections 4.1.1.1 and 4.1.2.2
48
showed good support for the construct in the pilot analysis and final survey reliability,
respectively.
3.2.7 Instrument Design Summary
In this section, the eight steps of the instrument design process were presented and
discussed, including the development and testing of preliminary, pilot, and final versions of the
instrument. Subsections discussed inferences deduced from analysis of the instrument data,
measures taken to ensure validity and reliability of those inferences, and the use of existing
instruments and literature to form the survey items for this study. The next section will discuss
privacy concerns and data collection with the instrument.
3.3 Sample Selection
This section discusses the target population for the motivational model to apply to, as
validated, and the samples attained for both the quantitative study and the instrument
development.
3.3.1 Population
The target population of this study consisted of engineering faculty who teach
engineering courses at U.S. institutions of higher education and who understand formative
assessment (as it is defined in this study). Faculty could be of any level, including but not
limited to instructors, administrators, and adjunct, assistant, associate, and full professors, as any
of them may use formative assessment to measure student learning. Institutions at which they
serve included but were not limited to community colleges, teaching institutions, research
institutions, and graduate degree-granting institutions; the Carnegie Foundation has a complete
listing of classifications ("The Carnegie Classification of Institutions of Higher Education,"
2005), which was used to identify colleges and universities that participated in this study.

49
3.3.2 Pilot Sample
An intentional, convenience sample of five engineering faculty at Virginia Tech was
selected to participate in the survey pilot study. These five participants satisfied at least one of
the following criteria, and all four criteria were covered by the five participants: 1) on a
departmental assessment committee, 2) utilizing formative assessment currently, 3) unfamiliar
with formative assessment, and 4) little to no interest in using formative assessment. Satisfaction
of these criteria allowed for input from a variety of perspectives on the survey instrument and for
early validation of the survey constructs. The most difficult to find was someone who had little
to no interest in using formative assessment, since the definition of formative assessment is such
that almost every faculty member uses it to some degree. As a result, two faculty members were
interviewed who were unfamiliar with and had some aversion to the terminology.
3.3.3 Final Survey Instrument Sample
A target of 200-300 responses was deemed sufficient for the various statistical analyses
conducted, based on the following rationale. The primary statistical concern for the sample size
was the regression analyses, which roughly require a 5:1 ratio for samples to constructs, with a
10:1 ratio being preferable (Ott & Longnecker, 2001; Rawlings, Pantula, & Dickey, 1998).
Since there were 16 constructs evaluated in this study, a minimum of 160 responses were
preferred, though 80 would have been sufficient; 223 responses were received, and 149 of them
used, which satisfied the desired ratio. Beyond the collective regression analyses, though, it was
difficult to predict how many responses would be obtained for the analyses performed on smaller
groups, such as those grouped by engineering discipline or academic rank. Therefore, the
preference was to obtain as many responses as possible, overall. With an expected response rate
of 10-20%, this indicated that at least 2,000 – 3,000 faculty should be invited to participate in the

50
survey. Further, a sample within institutions was preferred, as opposed to a random selection of
3,000 engineering faculty from different schools, so cross-validation and inferences could be
attained from multiple faculty across demographics, such as those at the same school or in the
same department; unfortunately, responses did not cluster well enough to afford such inferences.
An initial sample of 115 U.S. higher education institutions was selected at random from
the Profiles of Engineering and Engineering Technology Colleges (ASEE, 2009) to participate in
the study, resulting in a potential sample size of 10,570 engineering faculty according to listed
data. For each of the selected institutions, their website was reviewed to find contact email
addresses for faculty; only 37 had such information available, resulting in a sample of 3,248
faculty members from the population. This sample made it likely that approximately 200-300
responses would be received, assuming that 80% of the email addresses would be valid and 10%
of those with valid addresses would respond. As such, an invitation to partake in the study was
sent to these engineering faculty, resulting in 223 responses from the population, an actual
response rate of approximately 9%. The impact of this response rate is discussed in detail in
section 3.3.3.2.
3.3.3.1 Summary of Respondents
Of the 223 responses to the final survey, 149 were selected for final analysis by the
process described in section 3.2.2 and conducted in 4.1.2.1. These respondents are summarized
in Table 3.1; however, note that not all respondents provided demographic information, so
numbers may not add up to 149. In addition, the Carnegie Classification of Institutions of
Higher Education (2005) was used to classify the respondents’ institutions. The undergraduate
profile, size and setting, and basic classifications were simplified for use in this study in that not

51
all the sub-classifications in them were necessary; the resulting classifications are shown in
Table 3.2.
In addition to the demographics of survey respondents, Table 3.1 contains statistics
regarding national averages for demographics of U.S. engineering faculty, taken from the ASEE
text (2009) for sex, ethnicity, discipline, and rank, and 95% confidence intervals for the sample
percentages. Noted by asterisks, some of the 95% confidence intervals include the true value of
the population in the last column, indicating that there is only a 5% chance that the sample is not
actually representative of the population. The data show that it is close but unlikely that the
respondents in this study are representative of the population in terms of sex, but rather is more
representative of females; this high response from females is a typically-observed trend in
surveys, though (Korkeila et al., 2001). As well, it is unlikely that the ethnicities of respondents
are representative with oversampling of Caucasians and undersampling of Asian-Americans.
However, for the most part, the respondent sample is representative of engineering faculty
nation-wide in terms of engineering discipline and academic rank. Despite the differences in the
sample and the population, only one significant difference was obtained between any elemental
groups of the demographics for the constructs of this study, which was males and females
differing on the predictability of competence and relatedness needs to motivation, as described in
section 4.2.2.
Table 3.1: Basic demographics of 149 respondents, whose data were used in analyses, including 95% confidence intervalof sample percentage and national averages of the population, as available. Note: not all respondents provided
demographic data, so numbers may not add up to 149.
Demo-graphic:
Response: Count: Percent of sample(95% CI):
Nat’l.avg.
Sex MaleFemale
8736
71% (63, 79%)29% (21, 37%)
87.7%12.3%
Ethnicity African-AmericanAsian-American
14
0.84% (-0.8, 2.5%)3.4% (0.1, 6.7%)
2.5%*22.7%

52
CaucasianHispanicNative AmericanOther
104415
87% (81, 93%)3.4% (0.1, 6.7%)0.84% (-0.8, 2.5%)4.24% (0.6, 7.9%)
64.7%3.5%*0.2%*6.4%*
College orUniversity
Austin Community CollegeBoise State Univ.Brown Univ.Bucknell Univ.Cornell Univ.Hofstra Univ.Illinois Institute of TechnologyIUPUIIowa State Univ.Kettering Univ.Lake Superior State Univ.Polytechnic Inst. of New York Univ.Purdue Univ.Rose-HulmanRutgers, The State Univ. of NJSeattle Univ.Southeast Missouri State Univ.St. Joseph'sSyracuse Univ.Univ. of CO at Colorado SpringsUniv. of DenverUniv. of FloridaUniv. of Hawaii at ManoaUniv. of KansasUniv. of MississippiUniv. of Notre DameUniv. of RochesterUniv. of Texas - Pan AmericanUniv. of Texas at AustinUniv. of VirginiaUtah State Univ.
1317813215112314211112111526211196
0.8%2.4%0.8%5.6%6.5%0.8%2.4%1.6%0.8%4.0%0.8%0.8%18.5%0.8%3.2%1.6%0.8%0.8%0.8%0.8%1.6%8.9%0.8%4.0%1.6%4.8%1.6%0.8%8.9%7.3%4.8%
N/A
Engineeringdiscipline
AerospaceArchitecturalBiological and AgriculturalBiomedicalChemical
314116
2.4% (-0.4, 5.2%)0.8% (-0.8, 2.4%)3.3% (0.1, 6.6%)8.9% (3.7, 14.1%)4.9% (1.0, 8.8%)
3.0%*0.5%*1.7%*4.3%*7.5%*
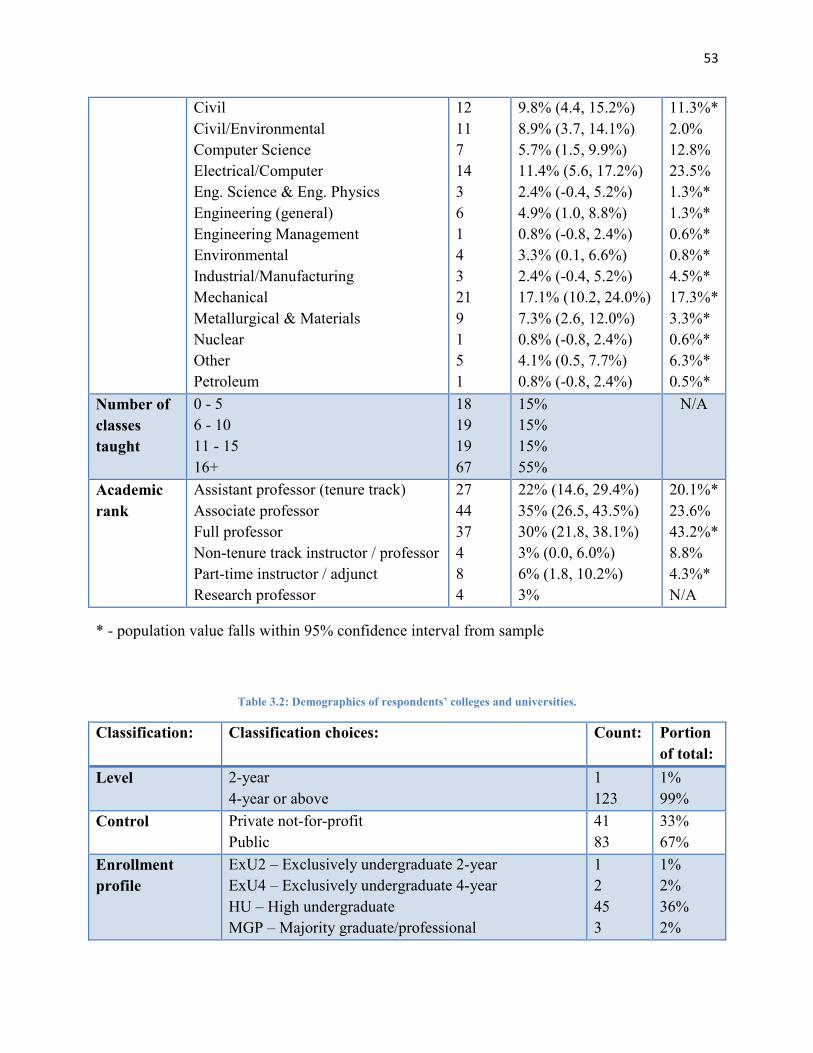
53
CivilCivil/EnvironmentalComputer ScienceElectrical/ComputerEng. Science & Eng. PhysicsEngineering (general)Engineering ManagementEnvironmentalIndustrial/ManufacturingMechanicalMetallurgical & MaterialsNuclearOtherPetroleum
121171436143219151
9.8% (4.4, 15.2%)8.9% (3.7, 14.1%)5.7% (1.5, 9.9%)11.4% (5.6, 17.2%)2.4% (-0.4, 5.2%)4.9% (1.0, 8.8%)0.8% (-0.8, 2.4%)3.3% (0.1, 6.6%)2.4% (-0.4, 5.2%)17.1% (10.2, 24.0%)7.3% (2.6, 12.0%)0.8% (-0.8, 2.4%)4.1% (0.5, 7.7%)0.8% (-0.8, 2.4%)
11.3%*2.0%12.8%23.5%1.3%*1.3%*0.6%*0.8%*4.5%*17.3%*3.3%*0.6%*6.3%*0.5%*
Number ofclassestaught
0 - 56 - 1011 - 1516+
18191967
15%15%15%55%
N/A
Academicrank
Assistant professor (tenure track)Associate professorFull professorNon-tenure track instructor / professorPart-time instructor / adjunctResearch professor
274437484
22% (14.6, 29.4%)35% (26.5, 43.5%)30% (21.8, 38.1%)3% (0.0, 6.0%)6% (1.8, 10.2%)3%
20.1%*23.6%43.2%*8.8%4.3%*N/A
* - population value falls within 95% confidence interval from sample
Table 3.2: Demographics of respondents’ colleges and universities.
Classification: Classification choices: Count: Portionof total:
Level 2-year4-year or above
1123
1%99%
Control Private not-for-profitPublic
4183
33%67%
Enrollmentprofile
ExU2 – Exclusively undergraduate 2-yearExU4 – Exclusively undergraduate 4-yearHU – High undergraduateMGP – Majority graduate/professional
12453
1%2%36%2%

54
MU – Majority undergraduateVHU – Very high undergraduate
5518
44%15%
Undergraduateprofile
(special)FT4 – Full-time 4-yearMFT4 – Medium full-time 4-yearPT2 – Higher part-time 2-year
711061
6%89%5%1%
Size & setting (special)L4 – Large 4-yearM4 – Medium 4-yearS4 – Small 4-yearVL2 – Very large 2-year
7961911
6%77%15%1%1%
Basic Assoc – Associate’s CollegeBac – Baccalaureate CollegeDRU – Doctoral/Research UniversityMaster's – Master’s Colleges and UniversitiesRU/H – Research University (high research)RU/VH – Research University (very high research)Spec/Engg – Schools of Engineering
181816837
1%6%1%6%13%67%6%
3.3.3.2 Response Rate Concerns
Biased results can come from various sources, such as the portion of the survey invitees
who don’t respond; a low survey response rate can present problems beyond just concerns of
collecting enough data to attain statistical significance. Without consideration for why they don’t
respond and what effect that might have on the otherwise-random sample, biased results may be
reported without notice. For example, a meta-review of 10 years of The Journal of Agricultural
Education found that publications reported response rates in the range of 28% to 100% (Lindner,
Briers, & Murphy, 2001), but the study also found that only 45% of articles mentioned non-
response bias, despite them having less than 100% response rates. Of those, 47% made no
attempt to control for non-response bias, and another 31% compared early to late responders to
evaluate non-response. Promising, however, was the finding that for all of the studies that

55
attempted to control for non-response bias, only 6% of them found significant differences in
respondents and non-respondents.
Korkeila et al. (2001), found in their review of the literature that “reasons for not
returning a questionnaire have been numerous: in gaining no personal benefit from the survey,
having no interest in the topic, lack of confidence, feeling of intrusion of privacy, lack of time,
forgetfulness, or present illness” (p. 991, references removed); additionally, de Winter et al.
(2005), note that “saliency of the research topic” is a common factor. However, Korkeila et al.
(2001) also warn that “[l]ow participation rates do not necessarily result in a selection bias” (p.
992). Hence, any study that attains less than 100% response should explore reasons for non-
response and/or investigate the bias that the non-respondents may have had on the data (de
Winter et al., 2005).
The original target for this study was 30% response, but advisement suggested that this
target was too high, and hence it was lowered to 10-20%. The biggest concern for response was
originally about receiving enough to be able to conduct the statistical regressions, and the
possibility of bias due to non-response was initially overlooked. Miller and Smith (1983, as
cited in Lindner et al., 2001) state that non-response bias is a concern for response rates as high
as 90%; therefore, the 9% response received from this study certain warranted investigation. To
evaluate possible non-response bias, three approaches were used: comparison of early and late
respondents, consideration of reasons for non-response, and review of comments from invitees.
First, a comparison of early and late responders was conducted, identified by associating
them with the “wave” of email reminders sent – those who responded to the first two email
invitations were deemed “early responders” and those who responded to the final reminder (third
email sent) were deemed “late responders.” Then, basic statistics, used to answer RQ1, were

56
calculated for these groups and compared using two-sample t-tests. Following, the regressions
used to answer RQ2 and RQ3 of this study (as discussed in section 3.5.4) were run for both
groups to see if the data produced different results for them. This procedure to test non-response
bias is called a “time trend extrapolation test” (Deutskens, de Ruyter, Wetzels, & Oosterveld,
2004, p. 28) and was described in Lindner et al. (2001) and used in both de Winter et al. (2005)
and Korkeila et al. (2001) to evaluate non-response bias. “The assumption is that respondents
who respond less readily are similar to non-respondents (Armstrong and Overton, 1977)”
(Deutskens et al., 2004, p. 28).
None of the variables produced significantly different means at the p<0.05 level when
early and late respondents were compared, and none of the regressions produced differences in
the significance of predictors. A few variables (e.g., anxiety) had differences at the p<0.10 level,
but the differences still had no practical implications that would affect inferences. Lindner et al.
(2001) also found no differences in respondents and non-respondents in their study, and
concluded “the results are generalizable to the target population” (p. 45). Therefore, in the best
judgment of this study’s results, it appears unlikely that there are major differences between the
non-respondents and respondents, and thus it is unlikely that the low response rate would have
notable impact on any inferences drawn from the data.
Second, reasons for non-response were considered in context with the timing of the
survey invitation sent to engineering faculty, the response to the pilot survey, and possible
technical problems with survey distribution. For one, it is widely known that faculty are
generally very busy with their duties of teaching, research, and service, and engineering faculty
are no exception. However, not all faculty maintain as heavy of a research load as engineering
faculty do, and the summer is often when travel and research consume a great deal of time; in

57
fact, about 100 out-of-office auto-reply emails were received from faculty during this study. As
such, since the survey reached engineering faculty in late summer (August 17, 2010) and was
closed slightly after the beginning of the fall semester (September 10, 2010), summer travel,
preparation for teaching fall classes, and wrapping up summer research all could have been
priorities that outranked responding to this survey invitation. As well, the principle investigators
had no direct relationship with any of the invitees to the final survey, lowering the chance of
interpersonal obligation being a motivator for completing the survey. Two, in preparation for the
final survey, the pilot survey was distributed to a sample of engineering faculty at Virginia Tech
at the same time that interviews were conducted. While, in the end, none of the data were used
in the final instrument development, it is worth noting that only 26 of 253 faculty responded to
the pilot survey, for a response rate of just over 10%. Attaining this low of a response rate from
an invitation sent much earlier in the summer (June 23 to July 14, 2010) and to a sample with a
much more personal connection to the principle investigators suggests that low response may be
more due to factors such as the term “formative assessment” being unfamiliar to faculty and less
to factors of timing or personal familiarity. Three, while invitations to the final survey were sent
to 3,248 engineering faculty emails, there is no doubt that technical problems caused many of
those to not reach faculty members. Over 400 rejection notices were received for email
addresses that were undeliverable, seven schools had zero respondents (which had a total of 387
faculty, and may have been due to the school blocking messages from SurveyMonkey), and
some initial test messages were blocked by junk mail filters. Thus, it is possible that invitations
only reached about 2,000 - 2,300 invitees; this would only increase the response rate to about
10%, but this fact should not be overlooked, as only estimates can be made as to how many

58
emails were actually delivered. Therefore, consideration of these factors suggests that the low
response rate wasn’t all that unexpected.
Looking also to the literature for information on typical response rates, it was found that
email-only survey distributions typically attain the lowest response rates at about 20%, whereas
supplements such as postcards (preceding or following survey distribution) can significantly
increase response rates up to about 28%, and mail surveys attain the highest response at 32%
(Kaplowitz, Hadlock, & Levine, 2004). These increases are valuable, but come at nearly ten
times the cost of an email-based survey distribution (Kaplowitz et al., 2004) and can irritate or
annoy potential respondents (Deutskens et al., 2004). Too many follow-up messages have
diminishing returns or may be considered spam (Deutskens et al., 2004); this study limited
contact to one initial invitation email and two reminder emails. Another suggestion to increase
response rate was to offer incentives to participants, either as a direct compensation like a
voucher or indirectly as a chance to win a bigger prize, such as $100 gift card. Even though
incentives have not been shown to hurt the quality of responses (Deutskens et al., 2004), it would
have been somewhat hypocritical to provide external incentives to complete the survey when
self-determination theory says that tasks motivated by external regulation produce lesser levels
of cognitive engagement (Deci & Ryan, 2000). As well, the issue of non-response wasn’t given
great consideration until the survey had concluded, so no budget was available to exercise such
options. Lastly, in consideration for the 9% response rate of this study, Deutskens et al. (2004)
had a response rate of 9.4% on their long-version survey with a “donation to charity as incentive
and an early reminder” (p. 28) whereas other incentive, reminder, and length designs attained
upwards of 31.4%. Therefore, findings in the literature support the conclusion above that a

59
relatively-low response rate was not unexpected for this survey, given the length, incentives, and
reminders.
Third, the comments and feedback from invitees were reviewed to better understand
those who didn’t respond; Table 3.3 gives a summary of this feedback. Some invitees gave
reasons for rejecting the survey based on its format or because they were busy or ill, while quite
a few others excused themselves because they weren’t teaching, all of which were expected
responses. However, a number of both responding and non-responding faculty had concerns
about the educational language used and, more specifically, the term “formative assessment.”
This raised the concern that many engineering faculty may not have responded largely because
of unfamiliarity or aversion to educational terms used in the survey invitation. As well,
compared to other education-focused surveys sent to engineering professors, this survey was
about general use of formative assessment versus other surveys that ask about specific
educational activities that faculty engage in, such as giving lectures or running a capstone-design
course. Therefore, it is possible that a disproportionate percentage of faculty who responded to
this survey invitation were very familiar and comfortable with the concept of formative
assessment and related educational terminology; Figure 3.1 demonstrates two possible scenarios
related to this idea. On the left, out of the sample invited to participate, which is represented by
the entire circle, only the small, shaded portion understand formative assessment; in the circle on
the right, almost all of the faculty in the sample understand formative assessment. Considering
that 71% of the respondents to this survey gave valid examples of formative assessment, as
shown in section 4.1.2.1, it would be logical to conclude that this statistic is generalizable to the
population, and therefore that the right-most circle in Figure 3.1 is correct. However, noting the
comments in Table 3.3 below and discussion above, it is more likely that a strong response bias
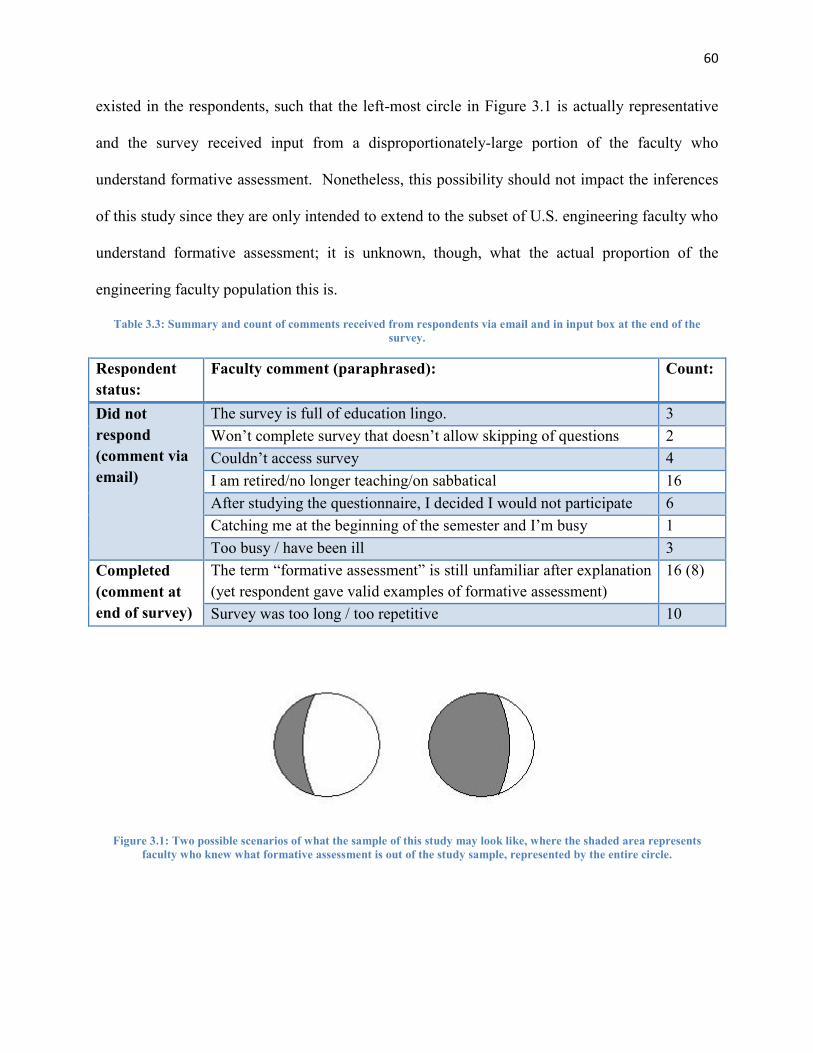
60
existed in the respondents, such that the left-most circle in Figure 3.1 is actually representative
and the survey received input from a disproportionately-large portion of the faculty who
understand formative assessment. Nonetheless, this possibility should not impact the inferences
of this study since they are only intended to extend to the subset of U.S. engineering faculty who
understand formative assessment; it is unknown, though, what the actual proportion of the
engineering faculty population this is.
Table 3.3: Summary and count of comments received from respondents via email and in input box at the end of thesurvey.
Respondentstatus:
Faculty comment (paraphrased): Count:
Did notrespond(comment viaemail)
The survey is full of education lingo. 3Won’t complete survey that doesn’t allow skipping of questions 2Couldn’t access survey 4I am retired/no longer teaching/on sabbatical 16After studying the questionnaire, I decided I would not participate 6Catching me at the beginning of the semester and I’m busy 1Too busy / have been ill 3
Completed(comment atend of survey)
The term “formative assessment” is still unfamiliar after explanation(yet respondent gave valid examples of formative assessment)
16 (8)
Survey was too long / too repetitive 10
Figure 3.1: Two possible scenarios of what the sample of this study may look like, where the shaded area representsfaculty who knew what formative assessment is out of the study sample, represented by the entire circle.

61
In summary, statistical comparisons of early and late respondents showed no differences,
and consideration of non-response factors and review of faculty comments suggested reasons for
the low response rate. These findings suggest a low likelihood of bias in the study results from
those who did not respond to the survey invitation; however, it does not completely rule out the
possibility, and since this is the first such study of engineering faculty motivation for formative
assessment, study results should be considered preliminary. In addition, the faculty comments
showed a possible bias in the sample from over-representation of those who understand
formative assessment, but this bias is inconsequential since this is the subset of the population
that inferences of this study extend to. Therefore, in conclusion, these findings indicate a low
likelihood that non-response bias tainted the results of this study, and hence the outcomes can be
interpreted as an informative, yet preliminary, indication of the attitudes, motivations, and
engagement of U.S. engineering faculty who understand formative assessment.
3.4 Data Collection Procedures
This section discusses the means of collecting data that were applied for both the
instrument development and the final instrument. Central to this section are concerns for the
privacy of participants, as well as the procedure and tools to collect data.
3.4.1 Participant Privacy and IRB
Before data were collected, the privacy and anonymity of participants was ensured in a
way that still allowed critical data to be obtained. The Institutional Review Board (IRB) at
Virginia Tech is responsible for approving all studies to be conducted on human subjects, and an
expedited application was approved for this study on May 25, 2010, under IRB number 10-471.
To protect participants’ privacy, numerical codes were used to identity participants without use
of their names, though some identifying information from demographics questions was retained.

62
Further, results are reported in aggregate such that participants cannot be identified from the
data; though it was not a problem, in the event that a participant might have been identifiable by
data disclosure, data would have been discarded to ensure privacy. All electronic data are held in
an encrypted folder to ensure protection, and information connecting participants to their code in
a separate, secure location. No risks to participants are expected beyond the privacy concerns
noted above.
3.4.2 Data Collection and Tools
Instrument data collection was conducted during the pilot and final instrument testing
phases. The final survey instrument was implemented through the online survey website
SurveyMonkey.com, chosen for its flexible user interface, trusted data security, and reasonable
price. The cost of using the service was $200 due to the number of questions on the instrument
and number of responses expected plus $100 to encrypt the data as required by the IRB. A
separate instrument was created for each stage of the instrument development such that no data is
mixed from one phase to the next.
For the pilot study, participants were chosen as described in section 3.3 for the respective
phases and first contacted via email on June 23, 2010, with an invitation to participate via a
weblink to the online survey. The invitation included a deadline of July 14, 2010, for the
participant to respond by, and reminders were sent on June 30, 2010, and July 7, 2010, to those
who had not responded. Data was also collected from the pilot study interviews on the interview
question sheets (see Appendix B) and the printed survey instrument provided to participants.
The question sheets allowed notes to be taken for both close-ended and open-ended questions
used to evaluate the validity of the survey instrument items. As well, with participant
permission, interviews were recorded for enhancement and clarification of notes taken.

63
For the final instrument, participants were chosen as described in section 3.3 and first
contacted via email on August 17, 2010, with an invitation to participate via a weblink to the
online survey. The invitation included a deadline of September 10, 2010, for the participants to
respond by, and reminders were sent on August 24, 2010, and September 2, 2010, to those who
had not responded.
3.5 Data Analysis Procedures
This section discusses how the data obtained from pilot and final instrument testing were
analyzed. The first section discusses analysis of qualitative data obtained from the pilot
instrument testing, for the purpose of creating the final instrument. The second section presents
analyses used on the final instrument data for validity and reliability purposes. Following, the
third section discusses the basic scoring and statistical analysis used to answer RQ1 in describing
the current status of engineering faculty perspectives of formative assessment. Finally, the
fourth section discusses use of final instrument data to answer RQ2 and RQ3 to validate the
motivational model proposed in this work.
3.5.1 Pilot Survey Interviews
For the pilot instrument, qualitative data collected on the interview question sheets and
paper survey instruments were reviewed in instrument development step 7. As noted in Colton
and Covert (2007), participants’ comments on these questions were expected to vary in the target
and the nature of their response, and as such, required somewhat ad hoc approaches to analyzing
the data and revising the instrument. Notwithstanding, a few central questions were addressed to
analyze the data and revise the instrument; they are listed in Appendix B and repeated here for
convenience:

64
1. What is the nature of the respondent’s statement? (uncertainty, confusion, objection,
or disagreement with the item)
2. What is the root of the issue the respondent is discussing? (the instructions, the item,
the responses, etc.)
3. What may be changed about the instrument or item to resolve the issue?
4. Which change would maximize the validity of this item, construct, or section of the
instrument?
These questions were used to determine a definitive course of action when considered together
with analysis of commentary relevant to question four. Then, the layout, instructions, order,
stem, wording, or response of the survey items were revised to increase the overall validity and
clarity of the instrument. The results of the pilot and changes to the survey are discussed in
sections 4.1.1.1 and 4.1.1.2, respectively.
After completion of the pilot interviews, feedback from the questions above were
organized in an electronic document around the respective survey items and constructs for which
they pertained; as well, feedback on survey instructions, demographic questions, and layout were
organized in pertinent areas of the document. Following, the items, constructs, and format were
reviewed with consideration for the feedback received, and then revised to improve clarity and
validity. More detailed information on how this analysis of pilot data was performed is
presented in results section 4.1.1.

65
3.5.2 Final Instrument Validity and Reliability
The final instrument data was first used to check and address issues with validity and
reliability to ensure they were optimized before using the data to answer the research questions.
First, the validity of the responses were checked by reviewing the examples of formative
assessment provided. To evaluate the responses, they were coded by a rubric established for use
in this survey by combining the study definition of formative assessment with types of formative
assessment taken from the literature. In this way, each example provided by engineering faculty
could be scored with the rubric, and that score used to determine whether or not the respondent
was thinking of formative assessment, as defined (i.e., determine if their response was valid data
for answering this study’s research questions). After reviewing and scoring the examples, only
the data from respondents whose responses were deemed to be valid were used in the remainder
of the analyses, which formed the subset of the U.S. engineering faculty population that this
study was most interested in. More details on the outcomes of this analysis are presented in
results section 4.1.2.1.
After removing responses to obtain the most valid data set, analysis was performed to
ensure that the survey items reliably measured the constructs for which they were designed. As
such, Cronbach’s Alpha was calculated for each construct and reviewed. From this, the
reliability of a single item to measure a construct was evaluated, and the decision to remove
certain items was made when it significantly increased the reliability of the remaining items.
This process was applied to the final instrument using the following criteria: greater than 0.9 was
excellent, between 0.8 and 0.9 was good, between 0.7 and 0.8 was acceptable, between 0.6 and
0.7 was questionable, between 0.5 and 0.6 was poor, and below 0.5 was unacceptable (George
and Mallery, 2003, as cited in Jones et al., 2010, p. 323). Details on the outcomes of this
analysis are reported in results section 4.1.2.2.

66
3.5.3 Construct Scoring and Descriptive Statistics for RQ1
After the items and constructs on the final survey instrument were reduced to those that
were reliable, the construct scores were calculated from the respective items for use in
descriptive statistics and regression analyses. The constructs in this study required that its items
were averaged to calculate the construct score, such that the construct score would always be on
the same 1-to-7 scale that the items were rated on, regardless of the number of items in the
construct. In this way, the construct scores could be interpreted in the same way that participants
responded to the items: a 1 is “not very true,” a 4 is “somewhat true,” and a 7 is “very true,” and
those in between. Further, since this data was in interval format, it allowed for numerical
interpretations, e.g., a 6.0 is 83% (5/6) of the maximum response value, and enhanced categorical
interpretations, e.g., a 6.0 indicates that the respondent feels this is “quite true” or almost “very
true.”
The only exception to this average scoring was calculation of the composite score for
self-determined motivation, the Relative Autonomy Index (RAI), which was the essential
motivational measure for model validation. Calculation of the RAI involved a weighted
combination of the four motivation constructs, resulting in a scale of -18 to +18, as follows: 2 x
intrinsic motivation + identified regulation - introjected regulation – 2 x external regulation.
Interpretations of this score had two qualities: magnitude and direction. The sign of the score
indicated the direction of the motivation, which in this case meant negative is controlled
motivation and positive is autonomous regulation (Deci & Ryan, 2010). The magnitude was
represented by the numerical value, which in this case indicated the magnitude of either the
autonomous or the controlled motivation. Therefore, for example, a -12.0 would indicate that the
respondent felt very controlled in this case, and therefore the external motivators were most
salient to him/her.

67
Descriptive statistics were used with the construct scores to describe engineering faculty
in terms of the various constructs pertaining to motivation and engagement. The statistical
means and standard deviations are reported with the results in section 4.2.1, to show the general
responses of survey respondents for the constructs measured. Interpretations of these results are
provided for these data throughout chapter 5, to show how faculty members generally rate their
motivation and engagement in formative assessment.
To determine if responses vary across all of demographic variables, Student t-tests were
conducted to check for interactions and significant differences. Statistically significant results
were interpreted as demonstrating that different classes of faculty or faculty at different
institutions have different levels of motivation and engagement in formative assessment. There
were no direct implications of these results to the research questions of this study, but these data
were reviewed in the event that they suggest future work to explore factors that influence
individual faculty members’ motivation and engagement in formative assessment.
3.5.4 Regression for RQ2 and RQ3 Model Validation
For step 8 of the instrument development process, the final instrument was distributed to
engineering faculty at randomly selected U.S. engineering colleges and resulting data collected
from the survey website. Analysis of the survey items was performed with SPSS and JMP
statistical software though linear regression, used to validate the model illustrated in Figure 2.4
to address RQ2 and RQ3. To test the ability of motivational needs satisfaction to predict
motivation types (e.g., external regulation) and self-determined motivation (i.e., the combined
score, RAI), the data for the three needs was first entered into the statistical software as the
independent variables for regression. Then, the data for the four motivation types and the self-
determined motivation were entered one at a time for the dependent variable, to test each

68
independently. Similarly, to test the ability of motivation types and self-determined motivation
to predict affective, behavioral, and cognitive aspects of engagement, the four motivation types
and self-determined motivation data were entered into the statistical software as independent
variables for regression. Then, the data for each of the engagement constructs was entered one at
a time as the dependent variable for testing.
R-squared values for each dependent variable were desired to be as close to 1.0 (100%)
as possible, indicating a good fit by the regression, since this value reveals the percentage of
variance in the dependent variable explained by the independent variables. In the case that the
regression to a construct results in a low R-squared value, i.e., less than 5%, the regression would
have been rejected; however, this did not occur. Otherwise, the interpretation of the R-squared
value is for internal validity purposes, as described in section 3.2.2, to note the ability of the
independent variables to explain the change in the dependent variable and the likelihood that
other variables would assist with explaining the variance.
Beta values, which represent the slope of the regression line, obtained from the regression
analysis were checked for statistical significance, to ensure minimal likelihood that there is
actually no effect on the dependent variable by the independent variable. Beta values were
expected to be positive and significant for all dependent variables except anxiety; further, Beta
values from motivational needs to motivation types are expected to be significant and be highest
to lowest from intrinsic motivation down the continuum to external regulation. Tables 3.3 and
3.4 illustrate these expectations for the regressions performed.

69
Table 3.4: Expected regression relationships from motivational needs to self-determined motivation.
Independent variables Dependent variable Expected outcomeAutonomy, Competence, and
RelatednessExtrinsic Regulation Strong negative relationship
Introjected Regulation Small negative relationshipIdentified Regulation Small positive relationshipIntrinsic Motivation Strong positive relationship
Motivation Score (RAI) Strong positive relationship
Table 3.5: Expected regression relationships from self-determined motivation to engagement constructs.
Independent variables Dependent variable Expected outcomeMotivation Score (RAI) Interest/enjoyment Strong positive relationship
Value/usefulness Strong positive relationshipSatisfaction Strong positive relationship
Pressure/tension Strong negative relationshipChoice of behavior Strong positive relationship
Persistence Strong positive relationshipEffort/importance Strong positive relationship
Intent Strong positive relationshipConcentration/attention Strong positive relationship
So long as Beta values were statistically significant (p < 0.05) and reflected the
expectations above, the results were considered a validation of the motivational model as
proposed. Beyond this validation, the magnitude of Beta values were interpreted for their impact
on the variables of interest in this study, namely, the engagement variables. That is, one aim of
this work was to explain how motivation affects engagement in formative assessment, such that
the motivation of engineering faculty can be addressed (e.g., through interventions) to increase
positive engagement in formative assessment. As such, the discussion in chapter five of this
study reviews the impact that increasing satisfaction of autonomy, competence, and relatedness
has on engagement in formative assessment through self-determined motivation, and the impact
that self-determined motivation has directly on engagement in formative assessment, by
interpreting the magnitude of the Beta coefficients.
Finally, the basic assumptions of linear regression were evaluated for the data collected in
this study, to ensure that the regression results could be interpreted as directly as possible. The

70
four assumptions evaluated were (and the section where the results are posted): 1) linearity of the
relationship between dependent and independent variables (4.1.2.3.1), 2) no multicollinearity
between the dependent variables (4.1.2.3.2), 3) independence of the regression residuals, or
errors (4.1.2.3.3), and 4) homoscedasticity of regression residuals (4.1.2.3.4).
3.5.5 Data Analysis Summary
This section discussed analyses of qualitative feedback from the pilot study and
quantitative data from the final instrument. The qualitative data from the pilot study was used to
create the final survey instrument, and results are described in section 4.1.1. The quantitative
data was first used for both validity and reliability purposes, and then to test the motivational
model, and results are presented in section 4.1.2. The next chapter presents the results of the
study for both the instrument development and answering the research questions.

71
Chapter 4: Results
This chapter first presents results of the instrument development, including both the pilot
study and validity and reliability data from the final instrument implementation. Then, results
from the implementation of the final instrument are provided, organized by research question.
4.1 Instrument Development
This section describes the results of the pilot study and the final survey implementation,
which directly affected the development and finalization of the survey instrument.
4.1.1 Pilot Survey
As described in sections 3.2.2 and 3.5.1, a pilot study was performed as part of the
instrument development process recommended by Colton and Covert (2007), where interviews
were conducted with five engineering faculty. The sections below discuss results from the
interviews and subsequent changes made to form the final instrument.
4.1.1.1 Pilot Interviews
After conducting the interviews and organizing the data for review, each survey item was
examined individually. Of all the items, nineteen of the 43 items measuring engagement, five of
the 16 items measuring motivation, and seven of the 20 items measuring motivational needs
received feedback that indicated the items were unclear or misleading. Further, when
interviewees were asked about the grouping of items into constructs, feedback for four of the
constructs indicated serious concern for the clarity of their meaning or consistency of their
meaning. As a result, nearly all the items of concern were reworded, except for two items that
were eliminated, due to inability to reword them in a way that addressed the feedback adequately
yet didn’t compromise the intended meaning of the item. Additionally, the instructions and

72
layout of the survey were slightly revised to improve clarity. These changes are described with
more specificity in the following section.
4.1.1.2 Changes to Survey
Three minor changes were made to the final survey instrument in general, based on pilot
testing results. First, in the instructions, one sentence was added to notify participants that they
could reasonably expect to finish the survey in approximately 15 minutes. Second, the
demographic questions were moved to the end of the survey with the intent of increasing the
sense of privacy participants have. Third, in the instructions for the engagement section, the
words “affective, behavioral, and cognitive” were removed, as interview participants stated the
words were confusing and unnecessary.
Some more significant changes were made to the survey items; changes were considered
insignificant if only minor alterations to one or two words were made. The constructs with items
significantly revised were (with number of items revised): value/usefulness (1), satisfaction (2),
anxiety (1 revised, 2 removed), choice of behavior (3), persistence (5), effort/importance (2), and
concentration/attention (3) from engagement; external regulation (2), introjected regulation (1),
and intrinsic motivation (2) from motivation; and autonomy (1), competence (1), and relatedness
(5) from motivational needs. The pilot and final survey instruments can be reviewed in
Appendices A and D, respectively, to observe these changes directly.
4.1.2 Final Survey
From the implementation of the final survey instrument, 223 responses were received
through the survey website. Of those 223 responses, 220 provided examples of formative
assessment for the first survey question, 201 answered at least some of the engagement
questions, 185 answered at least some of the motivation questions, 183 answered at least some of
73
the motivational needs questions, and 183 completed all or most of the entire survey. As such,
these numbers represent the sample size for each set of statistical analyses used to analyze data,
described below.
4.1.2.1 Examples of Formative Assessment
Since it was unknown how well engineering faculty understand the term “formative
assessment” and its use, it was imperative to have a way to evaluate what respondents were
thinking of as they marked each survey item. That is, if respondents were answering the
questions while considering summative assessment, it would tell us very little about their
motivation and engagement in formative assessment. As such, participants were asked to
provide two examples of formative assessment either by formal name or by description for the
first question on the final survey instrument.
The responses to these questions were evaluated with a simple coding approach. First,
the responses were collected and roughly categorized to examine the scope of responses to be
evaluated. Second, a list of accepted formative assessment techniques was collected from the
literature (Adsit, 2002; Angelo & Cross, 1993). Third, all responses that listed one of these
accepted techniques were awarded 10 points on the 10-point scoring scale. Fourth, all responses
that listed a summative assessment technique were awarded 2 points and all irrelevant or blank
responses were awarded 1 point on the 10-point scoring scale. Fifth, the remaining responses, as
roughly categorized from step one, were evaluated against the working definition of formative
assessment, as given in Section 2.1.1; see Table 4.1 below for a list of the descriptions and
numerical scores assigned to the formative assessment examples that respondents provided.
Sixth, and finally, the respondents were separated into three categories by reviewing their
responses and scores in two passes. The first pass assigned the category of “green” if both of the

74
two example scores were 7 or greater, “yellow” if both were between 6 and 3, or “red” if both
were 2 and lower. In the second pass, they were designated “green” if both examples provided
strong evidence that the respondent understands formative assessment, “yellow” if their
understanding was still questionable after reviewing both examples, and “red” if there was
sufficient evidence that the respondent was not thinking about formative assessment, as
described in Table 4.2.
Table 4.1: Scoring rubric for examples of formative assessment provided by participants.
General description ofexamples that earn thisscore
Score ofexample
Detailed description of score Sample of formative assessmentexamples provided byrespondents
Using a [minute paper,muddiest point, studentsurvey, etc.] to informteaching decisions forcurrent classes
10 Uses recognized technique designed formeasuring student learning, data iscollected and analyzed, and then used toinform teaching in progress
“One-minute papers. At thebeginning or at the end of classstudents take one minute toanswer a question related to theclass. I use this info to checkstudents' prior knowledge or anymisconceptions they may havedeveloped after the lesson”
[minute paper, muddiestpoint, student survey, etc.]
9 Lists a recognized formative assessmenttechnique but doesn't clarify how the datais analyzed or used. With knowledge ofsuch techniques, it may be implied thatthe data will be used in a formativemanner
“Muddiest point.”; “I-clickers.”;“Background knowledge survey.”
Using [highly likelymeasure of studentlearning] to informteaching decisions forcurrent classes
8 Describes technique that is very likely tomeasure student learning, data iscollected and analyzed, and then used toinform teaching in progress.
“Posing problems to the class thatneed use of the concept more thanonce to check if they got it”
Using [tests, quizzes,homeworks] to informteaching decisions forcurrent classes
7 Doesn't use technique specificallydesigned for measuring student learning,but description indicates that feedbackobtained is still used to inform teachingwhile in progress
“Short homework due everylecture, review homework scoresand thought processes of students,students present homeworksolution at start of class”
(not used) 6 (not used) (not used)Collect data from[possible measure ofstudent learning] but noclarification or indicationof use
5 Probability of qualifying as anassessment is good, but it is unknown ifresults are used to inform teaching inprogress
“End-of-lecture questions to becompleted prior to the next class”;“extra problems that will not begraded, posted in the Web.”
Collect data from [test,quizzes, homeworks] butno indication of use
4 Not a technique designed for measuringstudent learning, indication that data iscollected but no description of use
“Evaluation of homeworkperformance”; “on-line quizzeson Blackboard”
[test, quizzes,homeworks]
3 Not a technique designed for measuringstudent learning, no indication of datacollection or use
“weekly homework assignments”;“quizzes”

75
Summative assessment 2 Designed for measuring student learning,but clearly not for use in adjustingteaching practices while in progress
“tests”; “Evaluate reports usingstandard grading worksheet onABET criteria performance.”
No answer, or unrelated toassessment
1 Minimal category “Pop quizzes when I think theyaren't reading”; “Asking questionsof students about where in U.S.they have traveled”
Table 4.2: Description of the two-pass evaluation process for categorizing both examples of formative assessmentprovided by respondents.
Pass Description Categorization CountOne Both example scores ≥ 7 Green 92
Both example scores ≤ 6 and ≥ 3 Yellow 18Both example scores ≤ 2 Red 10
Two At least one example score ≥ 7 and other example didnot shed doubt on respondents’ understanding offormative assessment
Green 57
At least one example score ≥ 3 but neither exampleshowed respondent had strong understanding offormative assessment
Yellow 16
At least one example score ≤ 2and other example didnot make a case for respondents’ understanding offormative assessment
Red 18
After this categorization was completed, only the 149 responses categorized as “green”
(71% of those who provided examples) were used for analysis in this study including reliability
testing and regression analysis, as these were the only responses for which a strong argument
could be made that respondents were thinking of formative assessment, as it was defined in this
study. Furthermore, since these respondents were a subset of the sample, this subset was the
population for which inferences from this study extend to, considered to be those U.S.
engineering faculty who understand formative assessment.
4.1.2.2 Reliability
Reliability of the items that constitute a construct was evaluated by calculating the
Cronbach’s alpha score for the items that constituted each construct, and then by removing
questions that would appreciably increase the alpha value. The final constitution of all
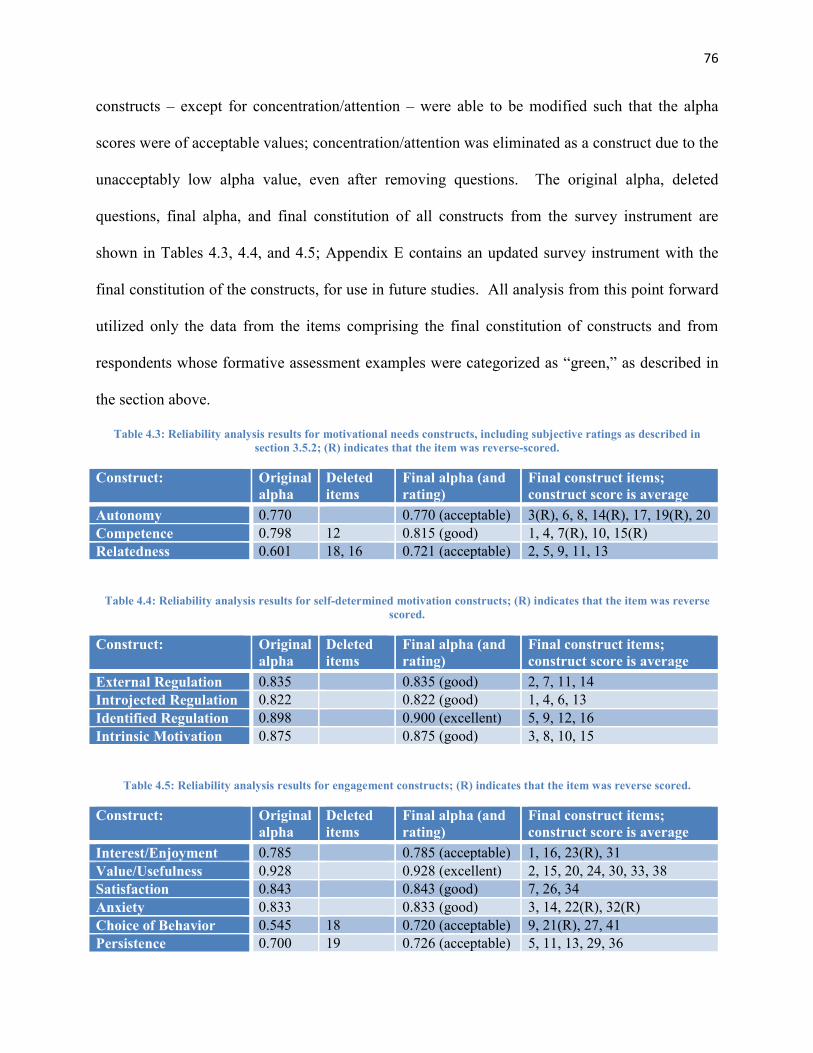
76
constructs – except for concentration/attention – were able to be modified such that the alpha
scores were of acceptable values; concentration/attention was eliminated as a construct due to the
unacceptably low alpha value, even after removing questions. The original alpha, deleted
questions, final alpha, and final constitution of all constructs from the survey instrument are
shown in Tables 4.3, 4.4, and 4.5; Appendix E contains an updated survey instrument with the
final constitution of the constructs, for use in future studies. All analysis from this point forward
utilized only the data from the items comprising the final constitution of constructs and from
respondents whose formative assessment examples were categorized as “green,” as described in
the section above.
Table 4.3: Reliability analysis results for motivational needs constructs, including subjective ratings as described insection 3.5.2; (R) indicates that the item was reverse-scored.
Construct: Originalalpha
Deleteditems
Final alpha (andrating)
Final construct items;construct score is average
Autonomy 0.770 0.770 (acceptable) 3(R), 6, 8, 14(R), 17, 19(R), 20Competence 0.798 12 0.815 (good) 1, 4, 7(R), 10, 15(R)Relatedness 0.601 18, 16 0.721 (acceptable) 2, 5, 9, 11, 13
Table 4.4: Reliability analysis results for self-determined motivation constructs; (R) indicates that the item was reversescored.
Construct: Originalalpha
Deleteditems
Final alpha (andrating)
Final construct items;construct score is average
External Regulation 0.835 0.835 (good) 2, 7, 11, 14Introjected Regulation 0.822 0.822 (good) 1, 4, 6, 13Identified Regulation 0.898 0.900 (excellent) 5, 9, 12, 16Intrinsic Motivation 0.875 0.875 (good) 3, 8, 10, 15
Table 4.5: Reliability analysis results for engagement constructs; (R) indicates that the item was reverse scored.
Construct: Originalalpha
Deleteditems
Final alpha (andrating)
Final construct items;construct score is average
Interest/Enjoyment 0.785 0.785 (acceptable) 1, 16, 23(R), 31Value/Usefulness 0.928 0.928 (excellent) 2, 15, 20, 24, 30, 33, 38Satisfaction 0.843 0.843 (good) 7, 26, 34Anxiety 0.833 0.833 (good) 3, 14, 22(R), 32(R)Choice of Behavior 0.545 18 0.720 (acceptable) 9, 21(R), 27, 41Persistence 0.700 19 0.726 (acceptable) 5, 11, 13, 29, 36
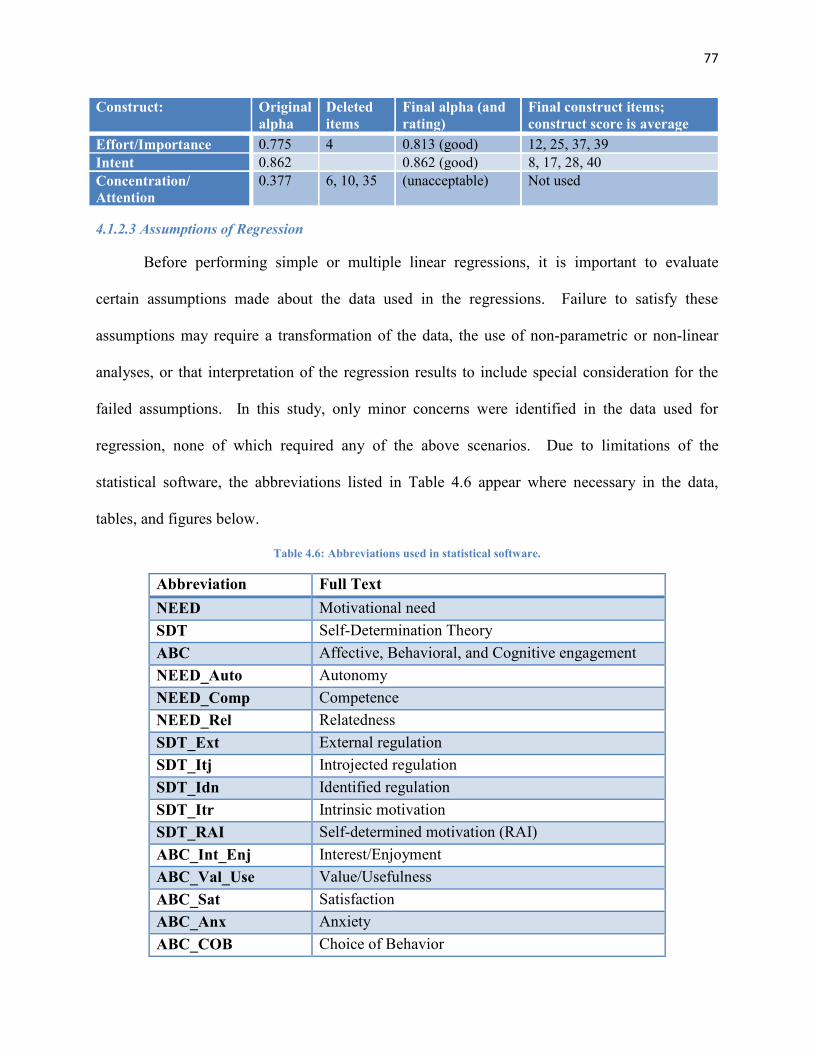
77
Construct: Originalalpha
Deleteditems
Final alpha (andrating)
Final construct items;construct score is average
Effort/Importance 0.775 4 0.813 (good) 12, 25, 37, 39Intent 0.862 0.862 (good) 8, 17, 28, 40Concentration/Attention
0.377 6, 10, 35 (unacceptable) Not used
4.1.2.3 Assumptions of Regression
Before performing simple or multiple linear regressions, it is important to evaluate
certain assumptions made about the data used in the regressions. Failure to satisfy these
assumptions may require a transformation of the data, the use of non-parametric or non-linear
analyses, or that interpretation of the regression results to include special consideration for the
failed assumptions. In this study, only minor concerns were identified in the data used for
regression, none of which required any of the above scenarios. Due to limitations of the
statistical software, the abbreviations listed in Table 4.6 appear where necessary in the data,
tables, and figures below.
Table 4.6: Abbreviations used in statistical software.
Abbreviation Full TextNEED Motivational needSDT Self-Determination TheoryABC Affective, Behavioral, and Cognitive engagementNEED_Auto AutonomyNEED_Comp CompetenceNEED_Rel RelatednessSDT_Ext External regulationSDT_Itj Introjected regulationSDT_Idn Identified regulationSDT_Itr Intrinsic motivationSDT_RAI Self-determined motivation (RAI)ABC_Int_Enj Interest/EnjoymentABC_Val_Use Value/UsefulnessABC_Sat SatisfactionABC_Anx AnxietyABC_COB Choice of Behavior
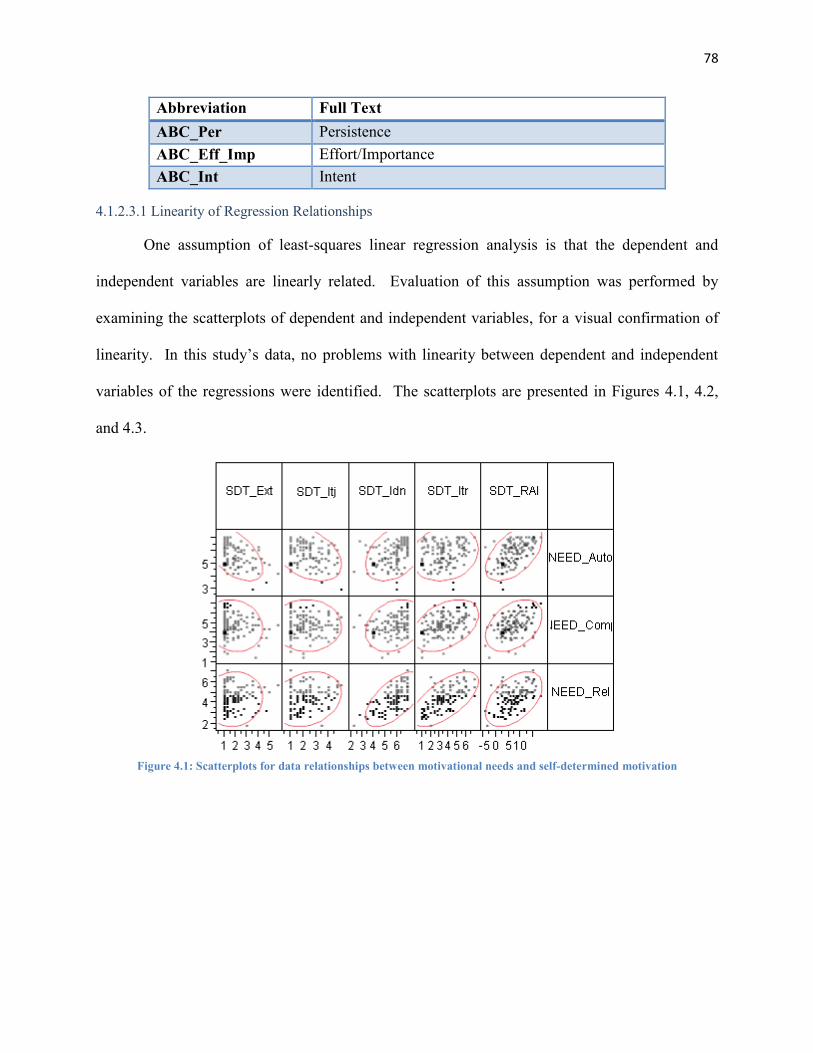
78
Abbreviation Full TextABC_Per PersistenceABC_Eff_Imp Effort/ImportanceABC_Int Intent
4.1.2.3.1 Linearity of Regression Relationships
One assumption of least-squares linear regression analysis is that the dependent and
independent variables are linearly related. Evaluation of this assumption was performed by
examining the scatterplots of dependent and independent variables, for a visual confirmation of
linearity. In this study’s data, no problems with linearity between dependent and independent
variables of the regressions were identified. The scatterplots are presented in Figures 4.1, 4.2,
and 4.3.
Figure 4.1: Scatterplots for data relationships between motivational needs and self-determined motivation

79
Figure 4.2: Scatterplots for data relationships between self-determined motivation and some engagement constructs.

80
Figure 4.3: Scatterplots for data relationships between self-determined motivation and the remaining engagementconstructs.
4.1.2.3.2 No Multicollinearity
Least-squares linear regression also relies on the assumption that the dependent variables
of a regression are not highly correlated to each other. To evaluate this, the Pearson correlations
for the dependent variables to each other were reviewed, to ensure they are less than 0.7. To
evaluate this study’s data, correlation tables for all of the dependent variables were reviewed, as
shown in Table 4.7. In the upper left portion of the table, the correlation values between the
motivation variables are all less than 0.7, indicating that there is little to no concern for
multicollinearity. As well, the lower right portion of the table shows that the correlation values
for the motivational needs are all well below 0.7, showing that there is no concern for
multicollinearity.

81
Table 4.7: Correlations between dependent variables of regressions.
SDT_Ext SDT_Itj SDT_Idn SDT_Itr NEED_Auto NEED_Comp NEED_RelSDT_Ext 1.0000SDT_Itj 0.6274 1.0000SDT_Idn -0.2177 0.0034 1.0000SDT_Itr 0.0431 0.1876 0.5225 1.0000NEED_Auto -0.5527 -0.4165 0.3876 0.1654 1.0000NEED_Comp -0.1281 -0.0189 0.2586 0.4244 0.2879 1.0000NEED_Rel 0.0672 0.2233 0.6329 0.6526 0.1585 0.4837 1.0000
4.1.2.3.3 Independence of Errors
Least-squares linear regression also relies on all of the residuals (errors) to be
independent of each other. This can be evaluated by looking for clumps of data points in plots of
residual values versus predicted values. A few examples of residuals are shown in Table 4.8; all
of the regression residuals are shown in Appendix F. No problems were found with the
assumption that errors are independent for the data collected in this study.
Table 4.8: Residual plots for each regression performed.
Residuals of regression from autonomy, competence, andrelatedness to composite self-determination score (RAI).
Residuals of regression from autonomy, competence, andrelatedness to external regulation.

82
Residuals of regression from autonomy, competence, andrelatedness to introjected regulation.
Residuals of regression from autonomy, competence, andrelatedness to identified regulation.
4.1.2.3.4 Homoscedasticity
Another assumption of least-squares linear regression is that the variance is relatively
constant over all data points, a condition known as homoscedasticity. A common method for
measuring homoscedasticity is to examine plots of regression residuals versus predicted values,
and to look for a normal distribution of points with respect to the horizontal axis. Again
reviewing the plots in Table 4.8 and Appendix F, all show relatively good homoscedasticity in
the residuals’ variance, demonstrated by the cloud-like formation of data points.
It is important to note that some residuals plots show odd patterns of data, which could be
mistaken for heteroscedasticity. What is actually seen are patterns that emerge from either
statistically insignificant regressions (e.g., see the external regulation to intent regression, the last
plot displayed above) or the data being limited by the discrete nature of the response choices of 1
to 7 (e.g., see the autonomy, competence, and relatedness to external regulation regressions, in
the top row of plots above).
4.2 Research Questions
This section will present results obtained from analysis of the final survey data, organized
by research question. Note that this study was intended to provide preliminary data about the

83
motivation and engagement of subset of U.S. engineering faculty who understand formative
assessment.
4.2.1 Research Question 1
The first research question was: What are current levels of the following: 1) affective,
behavioral, and cognitive engagement; 2) self-determined motivation; and 3) satisfaction of
motivational needs regarding formative assessment for the subset of engineering faculty studied?
To answer this question, the mean, standard deviation, and 95% confidence intervals of construct
scores were calculated, and are presented in Table 4.9. If readers wish to extend interpretations
of construct scores via individual item means and standard deviations, they can be found in
Appendix G.
Table 4.9: Construct sample means, standard deviations, and confidence intervals resulting from final survey datacollection.
Construct Score Item Content (range 1-7 unlessotherwise specified)
M (95% CI) SD (95% CI)
Autonomy Avg. of Needs Q’s: 3(R), 6, 8, 14(R), 17,19(R), 20
5.79 (5.63, 5.94) 0.89 (0.79, 1.02)
Competence Avg. of Needs Q’s: 1, 4, 7(R), 10, 15(R) 4.78 (4.59, 4.97) 1.09 (0.97, 1.24)Relatedness Avg. of Needs Q’s: 2, 5, 9, 11, 13 4.39 (4.20, 4.58) 1.06 (0.94, 1.21)IntrinsicMotivation
Avg. of Motivation Q’s: 3, 8, 10, 15 3.64 (3.37, 3.91) 1.52 (1.35, 1.74)
IdentifiedRegulation
Avg. of Motivation Q’s: 5, 9, 12, 16 5.82 (5.63, 6.00) 1.04 (0.93, 1.19)
IntrojectedRegulation
Avg. of Motivation Q’s: 1, 4, 6, 13 2.27 (2.07, 2.47) 1.13 (1.01, 1.29)
ExternalRegulation
Avg. of Motivation Q’s: 2, 7, 11, 14 1.81 (1.62, 2.00) 1.05 (0.93, 1.20)
RelativeAutonomy Index
2 * Intrinsic Motivation + IdentifiedMotivation – Introjected Regulation – 2 *External Regulation (range: -18 to +18)
7.22 (6.39, 8.04) 4.63 (4.12, 5.29)
Interest /Enjoyment
Avg. of Engagement Q’s: 1, 16, 23(R), 31 4.29 (4.08, 4.50) 1.18 (1.05, 1.34)
Value /Usefulness
Avg. of Engagement Q’s: 2, 15, 20, 24, 30,33, 38
5.53 (5.35, 5.70) 0.97 (0.86, 1.10)
Satisfaction Avg. of Engagement Q’s: 7, 26, 34 5.13 (4.94, 5.33) 1.12 (0.99, 1.28)Anxiety Avg. of Engagement Q’s: 3, 14, 22(R),
32(R)3.11 (2.87, 3.36) 1.37 (1.22, 1.57)
Choice of Avg. of Engagement Q’s: 9, 21(R), 27, 41 4.15 (3.95, 4.34) 1.11 (0.98, 1.26)
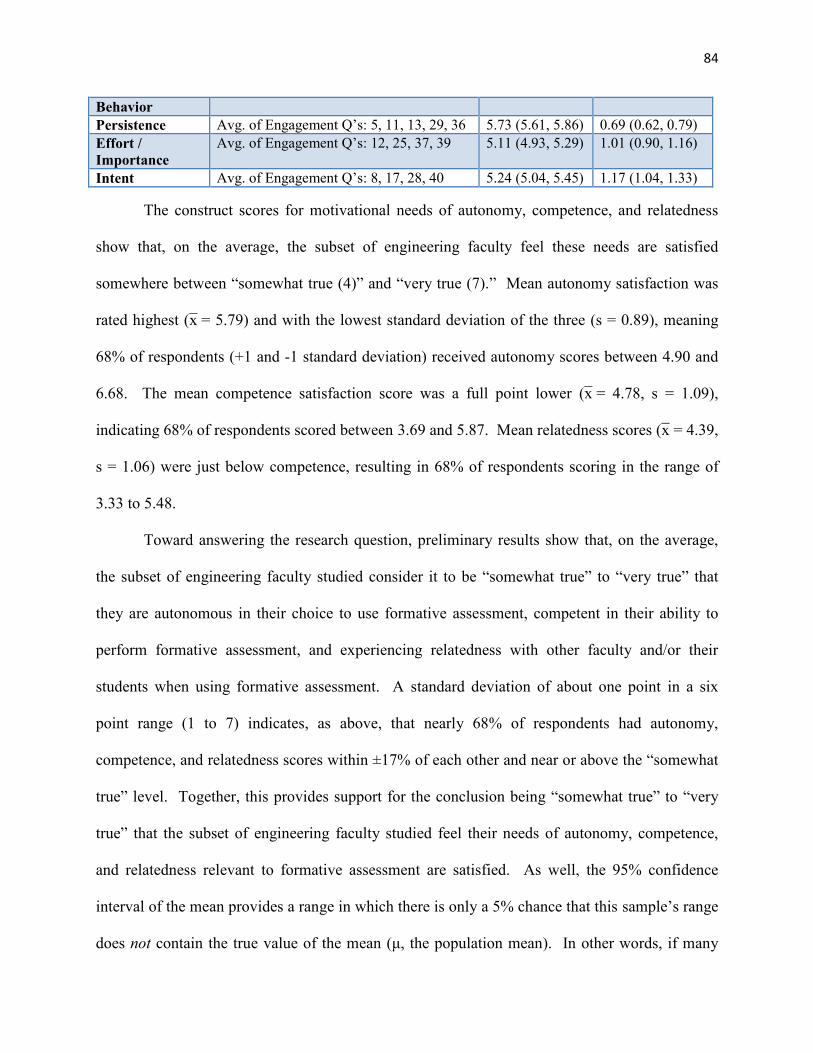
84
BehaviorPersistence Avg. of Engagement Q’s: 5, 11, 13, 29, 36 5.73 (5.61, 5.86) 0.69 (0.62, 0.79)Effort /Importance
Avg. of Engagement Q’s: 12, 25, 37, 39 5.11 (4.93, 5.29) 1.01 (0.90, 1.16)
Intent Avg. of Engagement Q’s: 8, 17, 28, 40 5.24 (5.04, 5.45) 1.17 (1.04, 1.33)
The construct scores for motivational needs of autonomy, competence, and relatedness
show that, on the average, the subset of engineering faculty feel these needs are satisfied
somewhere between “somewhat true (4)” and “very true (7).” Mean autonomy satisfaction was
rated highest (x̄ = 5.79) and with the lowest standard deviation of the three (s = 0.89), meaning
68% of respondents (+1 and -1 standard deviation) received autonomy scores between 4.90 and
6.68. The mean competence satisfaction score was a full point lower (x̄ = 4.78, s = 1.09),
indicating 68% of respondents scored between 3.69 and 5.87. Mean relatedness scores (x̄ = 4.39,
s = 1.06) were just below competence, resulting in 68% of respondents scoring in the range of
3.33 to 5.48.
Toward answering the research question, preliminary results show that, on the average,
the subset of engineering faculty studied consider it to be “somewhat true” to “very true” that
they are autonomous in their choice to use formative assessment, competent in their ability to
perform formative assessment, and experiencing relatedness with other faculty and/or their
students when using formative assessment. A standard deviation of about one point in a six
point range (1 to 7) indicates, as above, that nearly 68% of respondents had autonomy,
competence, and relatedness scores within ±17% of each other and near or above the “somewhat
true” level. Together, this provides support for the conclusion being “somewhat true” to “very
true” that the subset of engineering faculty studied feel their needs of autonomy, competence,
and relatedness relevant to formative assessment are satisfied. As well, the 95% confidence
interval of the mean provides a range in which there is only a 5% chance that this sample’s range
does not contain the true value of the mean (μ, the population mean). In other words, if many

85
more samples were taken of 149 engineering faculty who understand formative assessment, 95%
of them would contain the true mean; there is only a 5% chance that this is not one of them.
Therefore, since all values in the range of the 95% confidence intervals listed in Table 4.9 for
autonomy, competence, and relatedness support the same conclusion as above, the ability of the
inferences above to be generalized to the population of study is well-supported, statistically
speaking. The same can be said of the confidence intervals of the standard deviation, which,
even in the worst-case scenario, do not invalidate the inferences above.
Scores for self-determined motivation constructs showed distinct patterns of how the
subset of engineering faculty experience motivation to perform formative assessment. External
regulation scored lowest, on average (x̄ = 1.81, s = 1.05), indicating that 68% of respondents
scored between 1.00, the minimum score that was designated “not very true (1),” and 2.86.
Introjected regulation had the next lowest score (x̄ = 2.27, s = 1.13), with 68% of respondents
scoring between 1.14 and 3.40. Intrinsic motivation scored notably higher (x̄ = 3.64, s = 1.52),
but still only second highest, with 68% of scores in the wide range of 2.12 to 5.16. Identified
regulation had the highest average score (x̄ = 5.82, s = 1.04), with 68% of scores between 4.78
and 6.86. Additionally, the composite score, the average Relative Autonomy Index (RAI; x̄ =
7.22, s = 4.63), was a good reflection of the average scores for the separate motivation constructs
(i.e., intrinsic motivation, etc.); using the RAI weighting formula (section 3.5.3) with the separate
average scores, the RAI comes out to 7.21. This indicates that the statistical distributions were
similar and that neither the means nor the composite score conceal patterns in the response data.
These preliminary results show that the subset of engineering faculty, on the average,
experience identified regulation and autonomous (self-determined) motivation to perform
formative assessment. The high average score for identified regulation indicates that these

86
engineering faculty identify formative assessment with the duty of teaching, as can be seen in the
wording of survey items in Appendix D. Beyond this identified regulation, results show it is
“somewhat true” that these faculty experience some intrinsic motivation to do formative
assessment, but that experience is widely-varying across faculty. Further, with relatively low
scores on both introjected and external regulation, it is “not very true” that the subset of
engineering faculty use formative assessment because they would feel guilty if they didn’t or
have external pressure to do so, respectively. In terms of self-determined motivation (via the
RAI), results show that most of these faculty have an internalized drive of moderate intensity
(7.21 on 18-point scale) to perform formative assessment. The conclusion that the subset of
engineering faculty studied largely perform formative assessment for internalized and identified
reasons is therefore well-supported, and further supported by the 95% confidence intervals that
vary little from the sample mean and standard deviation.
Mean construct scores for engagement in formative assessment indicate positive results,
in terms of expectations: all seven positive aspects of engagement had mean scores above 4
(“somewhat true” on the survey response scale) and the one negative aspect of engagement had a
mean score below 4. In the affective category, the subset of faculty studied rated their
perspective of formative assessment as interesting and enjoyable to be “somewhat true” (x̄ =
4.29, s = 1.18), on average, and 68% of respondents had scores between 3.11 and 5.47. For the
value and usefulness of formative assessment, the subset of engineering faculty scored it between
“somewhat true” and “very true” (x̄ = 5.53, s = 0.97), on average, with 68% of scores between
4.56 and 6.50. These faculty also reported their experience of satisfaction from use of formative
assessment to be between “somewhat true” and “very true” (x̄ = 5.13, s = 1.12), with 68%
scoring between 4.01 and 6.25. In terms of anxiety, the negative affective construct, these

87
faculty reported that they feel anxious about performing formative assessment to be between
“somewhat true” and “not very true” (x̄ = 3.11, s = 1.37), on average, with 68% of response
scores falling in a wide range from 1.74 to 4.48. In the behavioral category, faculty scored
formative assessment being a priority (choice of behavior) to be “somewhat true” (x̄ = 4.15, s =
1.11), with 68% of responses spanning 3.04 to 5.26. The subset of faculty reported that it is
between “somewhat true” and “very true” that they are persistent when formative assessment
presents challenges (x̄ = 5.73, s = 0.69), with 68% of responses in the range of 5.04 and 6.42.
The effort and importance that these engineering faculty reported was also between “somewhat
true” and “very true” (x̄ = 5.11, s = 1.01), with 68% of responses falling in that range,
specifically between 4.10 and 6.12. Finally, these faculty reported that their intent to use
formative assessment in the future was between “somewhat true” and “very true” (x̄ = 5.24, s =
1.17), on average, and 68% of those responses still in that range as they scored between 4.07 and
6.41.
These preliminary results show that, for most aspects of affective and behavioral
engagement, it is largely true that these faculty experience positive engagement in formative
assessment. While they don’t rate it as a top priority or as their first choice of behaviors, they do
see value in it and find formative assessment useful to assist in their teaching and in students’
learning. If things don’t go well, these faculty report that they generally persist rather than
dropping the effort, and experience very little anxiety whether things go well or not. They put
effort into performing assessment, and intend to continue in the future. Finally, the subset of
engineering faculty studied report that they experience satisfaction in the outcomes of their
formative assessment efforts, and find it somewhat interesting and enjoyable, as well. Based on

88
relatively narrow ranges in 95% confidence intervals, it appears that these conclusions hold for
the general population of engineering faculty who understand formative assessment.
To explore the effects of demographic variables, ANOVA tests used to compare the
means of each of these constructs for different sexes, ethnicities, academic ranks, institutions,
institution categorizations, engineering disciplines, and experiences with teaching; however, no
such differences were found. Part of this was due to the low sample sizes for each category; e.g.,
the greatest number of responses received from any one institution was 23. Further, even when
re-categorized to create larger sample sizes for comparison, no significant differences were
found; e.g., number of classes taught was re-grouped into those greater than and those less than
16 courses yet still no significant differences were found.
4.2.2 Research Question 2
The second research question was: Does satisfaction of autonomy, competence, and
relatedness needs predict self-determined motivation for formative assessment in the subset of
engineering faculty studied? Additionally, the hypothesis tested in answering this question was:
Multiple regression coefficients of autonomy, competence, and relatedness to self-determined
motivation will be positive and significant.
The first prediction of self-determined motivation, represented by the composite RAI
score, using all three predictors of autonomy, competence, and relatedness resulted in a
statistically-insignificant coefficient for competence (p = 0.270). In response, competence was
removed as a predictor and the regression again conducted; the resulting model coefficients held
statistical significance, and are presented in Table 4.10, which shows the statistical results of the
different models with and without competence as a predictor.

89
Table 4.10: Results from regression from motivational needs to self-determined motivation.
Relative Autonomy IndexVariable B Sig. (p) Model R2
Model 1Autonomy 2.42 <0.0001
47.0%Competence 0.370 0.270Relatedness 1.62 <0.0001
Model 2Autonomy 2.52 <0.0001 46.4%Relatedness 1.62 <0.0001
As such, it is concluded that the proposed model (and therefore, the hypothesis) does not
hold for the predictor of competence according to the preliminary data collected here.
Notwithstanding, autonomy and relatedness are significant predictors of self-determined
motivation and explain nearly 50% of the variance in responses from engineering faculty. The
magnitude of these predictors, however, should be interpreted after normalization, since the
independent variables are on a scale of 1 to 7 and the dependent variable (RAI) is on a scale of -
18 to +18. Therefore, after normalization3, the autonomy coefficient is 0.42 and relatedness is
0.30. This indicates that, if relatedness is held constant for a given engineering faculty member,
a 1-point increase in their autonomy score would amount to a 0.42-point increase in self-
determined motivation, on the normalized scale. Similarly, if autonomy was held constant, a 1-
point increase in their relatedness score would produce a 0.30-point increase in self-determined
motivation, again on the normalized scale. If the satisfaction of both needs were raised by 1
point, then self-determined motivation should increase by 0.72 points, again on the normalized
scale. This shows both statistically-significant and practically-meaningful impact of the
motivational needs of autonomy and relatedness on self-determined motivation for formative
assessment.
3 The normalization equation is: Coeff(norm) = Coeff/6, and an RAI value can be normalized to the 1 to 7 scalewith: RAI(norm) = (RAI/6) + 4.

90
When the regressions were re-evaluated by demographic variables, only one variable had
a significant impact on the predictor variables: sex. That is, the regression of autonomy,
competence, and relatedness to self-determined motivation produced different significant
predictors when separated by male and female responses, as compared to the combined data
presented above. When separated by sex, the first regression of self-determined motivation
using all three predictors of autonomy, competence, and relatedness resulted in a statistically-
insignificant coefficient for either competence or relatedness. In response, each was removed
one at a time and the regression again conducted; the resulting model coefficients held statistical
significance, and are presented in Table 4.11, along with the original model with competence
included.
Table 4.11: Results of regressions from motivational needs to self-determined motivation separated by sex.
Relative Autonomy Index - MaleVariable B Sig. (p) Model R2
Model 1Autonomy 2.59 <0.0001
48.7%Competence -0.246 0.5589Relatedness 1.78 <0.0001
Model 2Autonomy 2.53 <0.0001 48.5%Relatedness 1.70 <0.0001
Relative Autonomy Index - FemaleVariable B Sig. (p) Model R2
Model 1Autonomy 2.01 0.0365
49.6%Competence 1.45 0.0457Relatedness 0.89 0.2686
Model 2Autonomy 2.04 0.0339 47.6%Competence 1.95 0.0011
These preliminary results show that two different models may be necessary to represent
the motivation of the subset of male and female engineering faculty, with regard to formative

91
assessment. For the males, autonomy and relatedness are significant predictors of self-
determined motivation, which is the same as the model above that included both sexes; when
normalized, the coefficient for autonomy is 0.42 and relatedness is 0.28. For the females,
relatedness is not significant, but competence is, meaning that for female engineering faculty,
autonomy and competence are significant predictors of self-determined motivation for formative
assessment; the normalized coefficients are 0.34 for autonomy and 0.33 for competence.
The regressions from autonomy, competence, and relatedness to external regulation,
introjected regulation, identified regulation, and intrinsic motivation also found competence to be
an insignificant predictor; as well, autonomy was insignificant for predicting intrinsic
motivation. Results of these regressions are shown in Tables 4.12, 4.13, 4.14, and 4.15.
Table 4.12: Results of regression from motivational needs to external regulation.
External RegulationVariable B Sig. (p) Model R2
Model 1Autonomy -0.669 <0.0001
33.2%Competence -0.052 0.5439Relatedness 0.181 0.0340
Model 2Autonomy -0.682 <0.0001 33.0%Relatedness 0.157 0.0372
Table 4.13: Results of regression from motivational needs to introjected regulation.
Introjected RegulationVariable B Sig. (p) Model R2
Model 1Autonomy -0.578 <0.0001
26.1%Competence -0.042 0.6640Relatedness 0.336 0.0006
Model 2Autonomy -0.590 <0.0001 26.0%Relatedness 0.317 0.0003

92
Table 4.14: Results of regression from motivational needs to identified regulation.
Identified RegulationVariable B Sig. (p) Model R2
Model 1Autonomy 0.384 <0.0001
50.2%Competence -0.146 0.0470Relatedness 0.644 <0.0001
Table 4.15: Results of regression from motivational needs to intrinsic motivation.
Intrinsic MotivationVariable B Sig. (p) Model R2
Model 1Autonomy 0.060 0.6257
44.2%Competence 0.186 0.1018Relatedness 0.837 <0.0001
Model 2Autonomy 0.109 0.3628 43.0%Relatedness 0.922 <0.0001
Model 3Relatedness 0.937 <0.0001 42.6%
4.2.3 Research Question 3
The third research question was: Does self-determined motivation for formative
assessment predict positive interest/enjoyment, value/usefulness, satisfaction, choice of behavior,
persistence, effort/importance, intent, or concentration/attention, or negative anxiety in the subset
of engineering faculty studied? Additionally, the hypothesis put forth to answer this question
was: Regression coefficients of self-determined motivation to engagement constructs of
interest/enjoyment, value/usefulness, satisfaction, choice of behavior, persistence,
effort/importance, intent, or concentration/attention will be positive and significant or of anxiety
will be negative and significant.

93
The regressions from RAI to each of the engagement variables were conducted and
showed all of the coefficients to be significant and of the polarity predicted; Table 4.16 shows
the results.
Table 4.16: Results of regressions from self-determined motivation to engagement.
Interest/Enjoyment Value/UsefulnessVariable B Sig. (p) R2 B Sig. (p) R2
RelativeAutonomy
Index (RAI)0.172 <0.0001 45.9% 0.136 <0.0001 42.5%
Satisfaction AnxietyVariable B Sig. (p) R2 B Sig. (p) R2
RelativeAutonomy
Index (RAI)0.158 <0.0001 42.9% -0.103 <0.0001 12.0%
Choice of Behavior PersistenceVariable B Sig. (p) R2 B Sig. (p) R2
RelativeAutonomy
Index (RAI)0.125 <0.0001 27.6% 0.074 <0.0001 24.6%
Effort / Importance IntentVariable B Sig. (p) R2 B Sig. (p) R2
RelativeAutonomy
Index (RAI)0.132 <0.0001 36.6% 0.148 <0.0001 34.6%
Again, coefficients represented the relationship between two different scales, and hence
needed to be normalized for interpretation; in this case, however, the coefficients were from a
larger scale to a smaller scale, and hence were multiplied by six to normalize. As such, the
normalized coefficients, in increasing order, were: -0.62 for anxiety, 0.44 for persistence, 0.75
for choice of behavior, 0.79 for effort/importance, 0.82 for value/usefulness, 0.89 for intent, 0.95
for satisfaction, and 1.03 for interest/enjoyment. Therefore, even for the smallest coefficient
(persistence), a 1-point change in the self-determined motivation score (RAI) amounts to a 0.44
point change in the engagement score; all other coefficients are larger in magnitude. This
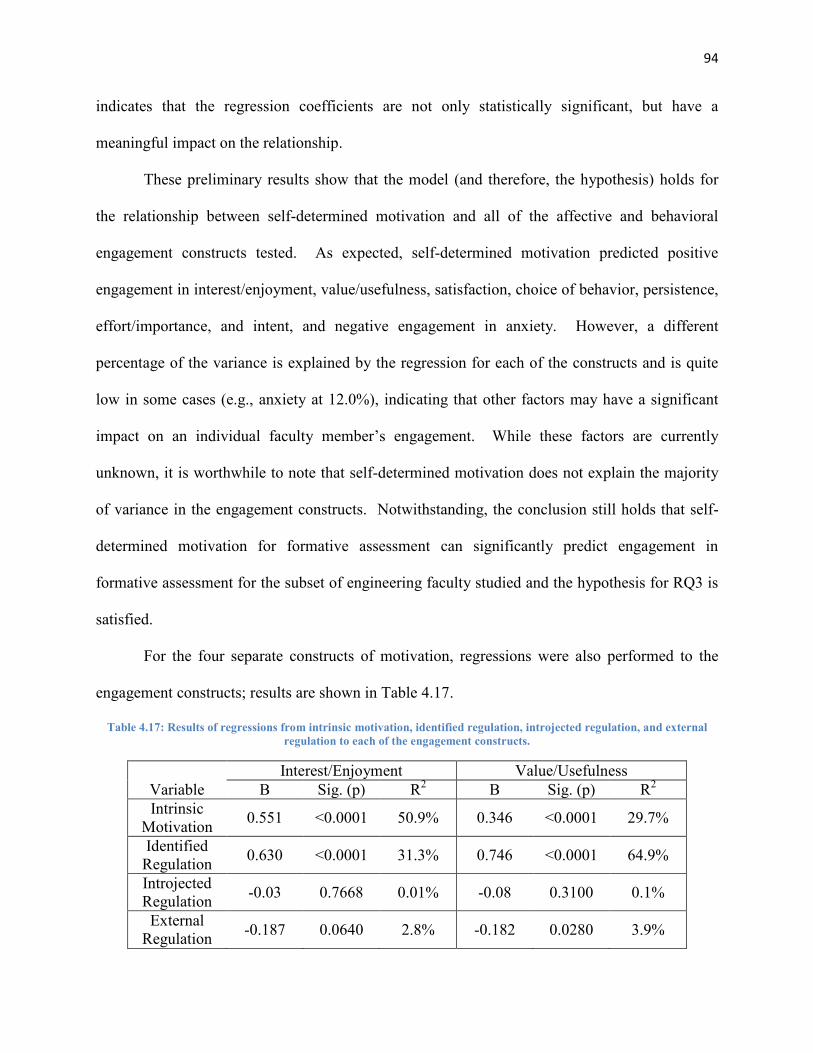
94
indicates that the regression coefficients are not only statistically significant, but have a
meaningful impact on the relationship.
These preliminary results show that the model (and therefore, the hypothesis) holds for
the relationship between self-determined motivation and all of the affective and behavioral
engagement constructs tested. As expected, self-determined motivation predicted positive
engagement in interest/enjoyment, value/usefulness, satisfaction, choice of behavior, persistence,
effort/importance, and intent, and negative engagement in anxiety. However, a different
percentage of the variance is explained by the regression for each of the constructs and is quite
low in some cases (e.g., anxiety at 12.0%), indicating that other factors may have a significant
impact on an individual faculty member’s engagement. While these factors are currently
unknown, it is worthwhile to note that self-determined motivation does not explain the majority
of variance in the engagement constructs. Notwithstanding, the conclusion still holds that self-
determined motivation for formative assessment can significantly predict engagement in
formative assessment for the subset of engineering faculty studied and the hypothesis for RQ3 is
satisfied.
For the four separate constructs of motivation, regressions were also performed to the
engagement constructs; results are shown in Table 4.17.
Table 4.17: Results of regressions from intrinsic motivation, identified regulation, introjected regulation, and externalregulation to each of the engagement constructs.
Interest/Enjoyment Value/UsefulnessVariable B Sig. (p) R2 B Sig. (p) R2
IntrinsicMotivation 0.551 <0.0001 50.9% 0.346 <0.0001 29.7%
IdentifiedRegulation 0.630 <0.0001 31.3% 0.746 <0.0001 64.9%
IntrojectedRegulation -0.03 0.7668 0.01% -0.08 0.3100 0.1%
ExternalRegulation -0.187 0.0640 2.8% -0.182 0.0280 3.9%

95
Satisfaction AnxietyVariable B Sig. (p) R2 B Sig. (p) R2
IntrinsicMotivation 0.474 <0.0001 41.8% -0.156 0.0535 3.0%
IdentifiedRegulation 0.733 <0.0001 47.0% -0.161 0.1750 1.5%
IntrojectedRegulation 0.03 0.7420 0.01% 0.293 0.0070 5.8%
ExternalRegulation -0.194 0.4250 3.3% 0.420 0.4250 3.3%
Choice of Behavior PersistenceVariable B Sig. (p) R2 B Sig. (p) R2
IntrinsicMotivation 0.463 <0.0001 40.7% 0.139 0.0006 9.3%
IdentifiedRegulation 0.603 <0.0001 32.3% 0.393 <0.0001 35.1%
IntrojectedRegulation 0.102 0.2490 1.1% -0.115 0.0370 3.5%
ExternalRegulation -0.009 0.9280 0.0% -0.168 0.0040 6.5%
Effort / Importance IntentVariable B Sig. (p) R2 B Sig. (p) R2
IntrinsicMotivation 0.416 <0.0001 39.2% 0.490 <0.0001 40.9%
IdentifiedRegulation 0.620 <0.0001 40.9% 0.745 <0.0001 44.4%
IntrojectedRegulation 0.010 0.9080 0.1% -0.02 0.8680 0.0%
ExternalRegulation -0.110 0.2060 1.3% -0.036 0.7220 0.1%

96
Chapter 5: Discussion
Since there hadn’t been any studies to date of engineering faculty’s perspectives or
engagement regarding formative assessment, this study collected data to provide a starting point
by exploring the motivational needs, self-determined motivation, and engagement for the subset
of the U.S. engineering faculty population who understand formative assessment. As well, a
motivational model was proposed and a preliminary validation conducted that presents the
predictive abilities of motivational needs to self-determined motivation, and of self-determined
motivation to engagement. Discussion of results follows for each of the three categories
individually – motivational needs, self-determined motivation, and engagement.
5.1 Motivational Needs
Faculty were surveyed on how they experienced autonomy, competence, and relatedness
with regards to formative assessment. Results showed that on average, the subset of engineering
faculty studied consider it to be “somewhat true” to “very true” that they are autonomous in their
decisions to use formative assessment, are competent in their ability to perform formative
assessment, and experience relatedness with other faculty and/or their students when using
formative assessment. With a standard deviation of about one point in a six point range (1-to-7),
this indicates that nearly 68% of respondents had autonomy, competence, and relatedness scores
near or above the “somewhat true” level. Together, this provides support for the conclusion
being “somewhat true” to “very true” that the subset of engineering faculty studied feel their
needs of autonomy, competence, and relatedness relevant to formative assessment are satisfied.
As well, confidence intervals suggest that if more samples of engineering faculty were taken that
nearly all of those samples should support the same conclusion.
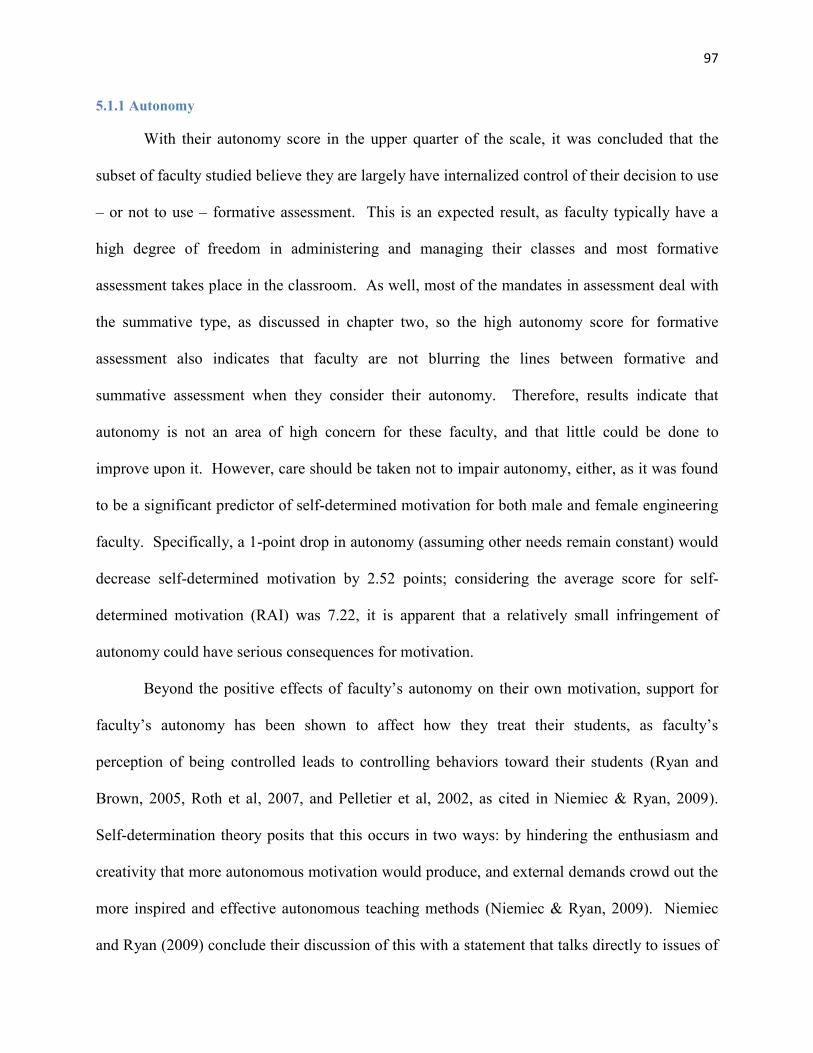
97
5.1.1 Autonomy
With their autonomy score in the upper quarter of the scale, it was concluded that the
subset of faculty studied believe they are largely have internalized control of their decision to use
– or not to use – formative assessment. This is an expected result, as faculty typically have a
high degree of freedom in administering and managing their classes and most formative
assessment takes place in the classroom. As well, most of the mandates in assessment deal with
the summative type, as discussed in chapter two, so the high autonomy score for formative
assessment also indicates that faculty are not blurring the lines between formative and
summative assessment when they consider their autonomy. Therefore, results indicate that
autonomy is not an area of high concern for these faculty, and that little could be done to
improve upon it. However, care should be taken not to impair autonomy, either, as it was found
to be a significant predictor of self-determined motivation for both male and female engineering
faculty. Specifically, a 1-point drop in autonomy (assuming other needs remain constant) would
decrease self-determined motivation by 2.52 points; considering the average score for self-
determined motivation (RAI) was 7.22, it is apparent that a relatively small infringement of
autonomy could have serious consequences for motivation.
Beyond the positive effects of faculty’s autonomy on their own motivation, support for
faculty’s autonomy has been shown to affect how they treat their students, as faculty’s
perception of being controlled leads to controlling behaviors toward their students (Ryan and
Brown, 2005, Roth et al, 2007, and Pelletier et al, 2002, as cited in Niemiec & Ryan, 2009).
Self-determination theory posits that this occurs in two ways: by hindering the enthusiasm and
creativity that more autonomous motivation would produce, and external demands crowd out the
more inspired and effective autonomous teaching methods (Niemiec & Ryan, 2009). Niemiec
and Ryan (2009) conclude their discussion of this with a statement that talks directly to issues of

98
formative and summative assessment: “Thus, to the extent that administrators and policy makers
fail to consider the motivation of both teachers and students alike, and instead rely on controlling
contingencies to produce ‘accountability’, the more all those involved in the learning process
will suffer decrements in motivation and learning outcomes” (p. 140). Therefore, this study’s
findings of high autonomy in the subset of engineering faculty show positive results for the
faculty and their students, alike.
5.1.2 Competence
Results of faculty competence data suggest that they have some confidence in their
effectiveness with formative assessment, but not a great deal. Survey items that comprised this
construct asked for faculty’s beliefs about how good they are at assessing their students’
learning, but in no way attempted to measure their actual ability. As such, the results indicate
that the subset of faculty studied are slightly doubting their ability to do formative assessment,
even though no one was evaluating it; this can be interpreted in a few ways. From one angle, it
could indicate that faculty have a good understanding of what formative assessment is and report
that they know they are not experts at using it; considering that these data came from faculty
whose examples of formative assessment were accepted, this seems like a reasonable conclusion.
If accurate, this indicates that faculty development efforts could have a significant impact on
competence. From another angle, these results could signal low faculty confidence in their
understanding of what formative assessment actually is. By this perspective, the moderate
competence scores indicate that faculty believe they are doing a good job assessing their
students, but aren’t entirely confident since they aren’t sure what all comprises it. Again, these
respondents’ data were used because they gave valid examples of formative assessment, but this
does not mean that faculty know they have a correct understanding of what it is; in fact, a few

99
participants’ comments indicated just that. If this is the case, improving faculty understanding of
what formative assessment is, through any means, would result in an immediate change in their
competence, with some increasing when they realize they do use formative assessment and do it
well, and others exactly the opposite. Also, while no data in this study can attest to this, it is also
possible that faculty’s confidence in their teaching abilities could influence their perceived
competence for formative assessment; this would be tested by measuring social factors that
influence satisfaction of motivational needs (i.e., competence), as demonstrated in Vallerand’s
Hierarchal Model. Overall, though it is already fairly good, there appears to be some opportunity
to improve upon engineering faculty’s perceived competence in formative assessment.
In the prediction of self-determined motivation, competence was found to be
insignificant. However, when data were separated by sex, it was found that competence was a
significant predictor of self-determined motivation in women, but not men. Further discussion of
this can be found in section 5.1.4.
5.1.3 Relatedness
Faculty reported their perceived relatedness to be even lower than their competence, on
average, indicating that they feel formative assessment has only a moderate impact on their
connections with other faculty members or with their students. With no previous knowledge of
faculty’s perspectives of relatedness regarding formative assessment, it was difficult to surmise
what outcomes should be expected. As such, interpretation of this result was complemented with
a review of responses to the individual relatedness survey items, which produced interesting
results. For example, faculty reported higher average scores on needs question 9 than the other
items, indicating that they feel formative assessment keeps them in touch with their students
and/or their students’ learning. On the other hand, when asked about how formative assessment

100
connected them with other educators in items 16 and 18 (which were removed from the construct
due to low reliability), scores were in the lower quarter of the scale, implying that formative
assessment is not highly valued amongst faculty. Therefore, there is evidence that the concept of
relatedness may need to be separated into different groups of people that faculty may feel
connections to, which are students and other faculty in this case. Further, from questions 2 and
11 it appears that faculty have no particular desire to share results of assessment with other
faculty unprovoked, but if it was brought up, they would be more willing to share, even if
assessment results were not positive. Overall, this review of faculty’s perceived relatedness
shows that there is still a lot to be understood about how connections with others materialize with
regard to formative assessment, which is necessary to address before attempting to change
relatedness scores.
In the prediction of self-determined motivation, relatedness was found to be significant.
Specifically, a one-point increase in relatedness led to a 1.79 point increase in self-determined
motivation. While not as high of an impact as autonomy, given the weaker understanding of
how this need is perceived by faculty, there is risk of affecting self-determined motivation
through unintentional changes in perceived relatedness; this presents an important motive for
future research on relatedness in formative assessment. Additionally, when data were separated
by sex, it was found that relatedness was a significant predictor of self-determined motivation in
men, but not women. Further discussion of this can be found in section 5.1.4.
Since relatedness is not yet well-understood in the context of formative assessment,
additional insight from the literature is added here, and since a connection was made in this study
between the motivation for teaching and motivation for formative assessment (identified
regulation), the literature on teaching can provide insight, as well. For example, a study of

101
survey responses by the SUCCEED Coalition found that the more teaching workshops faculty
had attended, the more they used interactive pedagogies and group activities in their classes and
the less they simply lectured (Brawner, Felder, Allen, & Brent, 2001). While speculative, it can
be reasonably argued that these types of interactions could increase relatedness experienced
between faculty and students, as compared to the typical lecture class. Further, the detailed
report from the SUCCEED study (Brawner, Felder, Allen, & Brent, 2002) showed that just over
¾ of engineering faculty members took assessment data of some kind beyond the required end-
of-course evaluations, showing a possible opportunity for a connection of assessment and
relatedness. Further, nearly half of all engineering faculty discuss teaching with colleagues or
graduate students less than 3 times per semester, but teaching workshops increased that
frequency significantly (Brawner et al., 2002). Another study conducted in 18 Scottish schools
found that introducing formative assessment led to more self-directed learning by students and
increased conceptual understanding of formative assessment by faculty. It also led to increased
use of learner-centered pedagogies, whereas direct interaction with students was greater and
formative assessment was conducted at a more personal and direct level (Kirton et al., 2007).
Additionally, Olds, Moskal, and Miller (Barbra M. Olds et al., 2005) suggest collaborations
between engineering professors and educational specialists as a means to improve understanding
and effectiveness of assessment efforts.
Relatedness for formative assessment may be built through various approaches, such as
those that enhance community and an environment of open discussion. At schools like James
Madison University and Appalachian State University, for example, there are dedicated
assessment days every term where both individual and collective assessment activities take place
(Swing, 2001). Positive relationships with students and colleagues may also facilitate the

102
reception of constructive feedback about assessment efforts, and in away such that competence
can be reinforced (Richer et al., 2002). As well, group dynamics, which can improve
relatedness, can be effective if well-managed by a facilitator or leader, by taking care to establish
clear values and common goals, and working as a group to refine those goals and taking
advantage of existing expertise and interests (Bird, 2001). However, collaborations and
discussions amongst faculty that may increase relatedness may be inhibited by pre-existing and
unrelated negative relationships (Richer et al., 2002). Nonetheless, people tend to internalize the
values and actions of others who they want to be connected to (Niemiec & Ryan, 2009), which
suggests a possible connection between the motivational need of relatedness and influences of
cultures present in academia. Therefore, it is also worth considering the impact of such cultures
on the satisfaction of motivational needs like relatedness, which subsequently affects the
motivation and engagement of engineering faculty, at least for males; Utschig (2006) suggests
many ways that a culture could be built that supports assessment. Altogether, this review of
studies related to the concept of relatedness show that a great deal more research is necessary to
fully understand the meaning and impact of the construct in formative assessment, perhaps via a
qualitative or ethnographic study.
5.1.4 Sex Differences in Motivational Needs
Using the preliminary data from this study, the ability of competence and relatedness to
predict self-determined motivation were found to differ for male and female engineering faculty,
at least in the subset studied who understand formative assessment. That is, according to results
here, competence is a significant predictor of self-determined motivation for female but not male
faculty, and relatedness is significant for males but not females. Specifically, if competence
satisfaction is changed for females, it will impact their self-determined motivation at a rate of

103
1.95 points per one point of competence (assuming other needs are held constant). For male
faculty, a 1-point change in relatedness predicts a 1.70-point change in self-determined
motivation (again, holding other needs constant). In a personal communication with one author
of self-determination theory, Dr. Richard Ryan (January 18, 2011), he stated that he has never
seen reliable, sex-typed differences in motivational needs in the related literature, but was unsure
if it may be different for a task such as formative assessment since it is highly identified with
teaching. As such, two approaches were explored to better understand this result.
First, before speculating about the significance of the result, it was important to rule out
possible statistical or bias issues that may have affected the regression and given a false result.
Two angles were evaluated: statistical variance and bias from ceiling or floor effects. The
concern with statistical variance was that if, for example, male faculty had very low variance in
their competence scores, it would offer practical explanations but also may have altered the
regression results. However, after comparing the sample standard deviations4 for male and
female scores of relatedness, competence, and self-determined motivation (RAI), the only
significant difference found at the p<0.05 level, as shown in Table 5.1, was between males and
females for competence. This may have helped to explain the sex differences for competence,
but would not explain them for relatedness. Therefore, there does not appear to be a bias in the
regression results due to variance.
4 The standard deviation is simply the square root of the variance, and was used here because it is easilycomparable to other standard deviations reported throughout the dissertation.

104
Table 5.1: Standard deviations for competence, relatedness, and self-determined motivation scores by sex, with p-valuesfor F-test comparison of the standard deviations.
Male FemaleVariable M SD M SD
Competence 4.83 0.97 4.72 1.32Relatedness 4.32 1.08 4.53 1.08
Relative Autonomy Index 6.99 4.46 7.63 5.02
F-test comparison of SDVariables Sig. (p)
Competence Male vs. Competence Female <0.01Relatedness Male vs. Relatedness Female 0.52
RAI Male vs. RAI Female 0.18Competence Male vs. Relatedness Male 0.13
Competence Female vs. Relatedness Female 0.11
Bias from floor and ceiling effects was also possible in this study, since survey responses
were limited to the range of one to seven on each individual item. However, mean scores of
competence, relatedness, and self-determined motivation for male and female faculty were well
within the bounds of the item response range, with almost two standard deviations between the
mean and the scale maximum for both competence and relatedness, and even more for self-
determined motivation. Therefore, it seems unlikely that any floor or ceiling effects were
experienced in these regressions.
Second, since the possibilities reviewed above didn’t provide explanation for the
differences in competence and relatedness by sex, some speculation is provided here to attempt
to understand its significance. The most plausible explanation for this result considers Occam’s
Razor, in that it is simply possible that male engineering faculty do not concern themselves
highly with their ability to do formative assessment effectively, and hence it does not have a
significant impact on their motivation, and likewise that feelings of connectedness with regard to
formative assessment may not be as important to female engineering faculty, and hence do not
have a significant impact on their motivation. That is, other factors may be influencing self-

105
determined motivation scores, such as the context of teaching or the situations where
assessments are actually used; this seems likely considering Vallerand’s Hierarchal Model
predicts this inter-level relationship (see section 2.4) and only about half of the regression
variance was explained by the variables of this study (see section 4.2.2). As well, the literature
shows some support for these possibilities. For example, Landino and Owen (1988) found that
female faculty members had lower self-efficacy for certain duties of faculty. Further, in a review
of the literature, Malicky (2003) saw that self-efficacy was consistently lower for female
engineering students versus male students, and others have corroborated these findings with
focus on specific aspects of these differences (e.g., Mary Besterfield-Sacre, Moreno, Shuman, &
Atman, 2001). As well, interpersonal relationships have been emphasized for female faculty
members (Hutchison-Green, Follman, & Bodner, 2008; Landino & Owen, 1988), altogether
supporting the possibility that there are external factors influencing the results of this study.
Overall, further research would be necessary to draw more definitive conclusions.
5.2 Self-Determined Motivation
In this work, faculty’s perspectives were also sought on what the basis of their motivation
is to perform formative assessment. The results show that the subset of engineering faculty who
understand formative assessment, on average, experience identified regulation and autonomous
(self-determined) motivation to perform formative assessment. The high score for identified
regulation indicates that engineering faculty identify formative assessment with the duty of
teaching, as was measured by the survey items for the construct (see Appendix D). Beyond
identified regulation, results show it is “somewhat true” that faculty experience some intrinsic
motivation to do formative assessment, but that experience is widely-varying across faculty.
Additionally, low average scores on both introjected and external regulation show it is “not very

106
true” that engineering faculty use formative assessment because they would feel guilt if they
didn’t or have external pressure to do so, respectively. In terms of self-determined motivation
(the composite score, RAI), results show that most faculty have an internalized drive of moderate
intensity (7.21 on the 18-point scale) to perform formative assessment. The conclusion that the
subset of engineering faculty studied largely perform formative assessment for internalized and
identified reasons is therefore well-supported, and further supported by the confidence intervals
of these constructs, which vary little.
5.2.1 Identified Regulation
The most pertinent inference from these results is that these faculty’s motivation to do
assessment is most strongly rooted in their motivation to teach effectively. This inference is
highly supported by research, as Vallerand (1997) found conclusively that motivation from each
level of his Hierarchal Model affects the levels above and below it. Recall that this study of
formative assessment does not qualify directly for any of Vallerand’s three levels of motivation
(global, contextual, and situational), but rather exists between the contextual and situational
levels. Therefore, it is not unexpected to find support for the notion that motivation for
formative assessment is driven by motivation for the context of education and situations of
teaching. This inference, however, has important implications. First, this suggests that changes
in motivation for formative assessment may be attained by changes in motivation for teaching
and learning, in addition to changes in faculty satisfaction of autonomy, competence, and
relatedness. This result is encouraging for positive changes, but it also indicates that decreases in
faculty motivation for education and teaching may lead to decreases in motivation to use
formative assessment; future work would need to establish these relationships more definitively.
For example, given the current struggle of engineering programs to secure research funding and

107
the debate over whether such demands take away from motivation for teaching (e.g., see S. R.
Turns, 1991), significant challenges are likely when trying to increase motivation for formative
assessment through teaching.
5.2.2 Intrinsic Motivation
Other than identified regulation, intrinsic motivation to do formative assessment showed
some impact. It may also be surmised that if identified regulation decreased for any reason, the
self-determined motivation to use formative assessment may actually not fall too drastically,
since a degree of intrinsic motivation is present (recall that intrinsic motivation has double the
positive weight of identified regulation in determining self-determined motivation). Central to
self-determination theory is the idea that motivation is dictated by the salience of internal and
external regulators (Deci & Ryan, 2000), and hence, if identified regulation decreased, it is
possible that faculty’s intrinsic motivation may increase; however, this is currently only
speculation, and further research would be necessary to make definitive inferences. If, however,
by any means possible, the intrinsic motivation of engineering faculty to perform formative
assessment were to increase, self-determination theory posits that many positive benefits would
be attained; some of these benefits were tested in this study as engagement constructs, and are
discussed in section 5.3. As well, studies have found that teaching is generally intrinsically
motivating (e.g., Deci et al., 1996), so the influence of motivation for teaching on motivation for
formative assessment is a plausible expectation.
5.2.3 External and Introjected Regulation
With regard to external and introjected regulation, faculty reported that external factors
had relatively low salience in their motivation to do formative assessment. Introjected factors
could become more salient if, for example, pressure to utilize formative assessment increased

108
from other educators or from students. This type of pressure would come from the culture, in
essence, as it would not come from superiors but rather those who are equals or inferiors5
engaged in the academic community. This introjected regulation is not, according to self-
determination theory, an optimal type of motivation; however, if experienced, self-determination
theory posits that competence and relatedness needs satisfaction may increase over time, which
would assist with internalization of the motivation (Deci & Ryan, 2000) and increase
engagement in formative assessment, which would subsequently decrease the necessity for the
cultural pressure. On the other hand, if superiors began requiring that faculty use formative
assessment, external regulation would likely become more salient. If external regulation became
dominant, it is theorized that the most negative engagement in formative assessment would be
experienced (Deci & Ryan, 2000), and research has shown that this control would likely impair
any internal motivation present to do formative assessment (e.g., see Assor, Kaplan, Kanat-
Maymon, & Roth, 2005).
Internalization of external motivation has been shown to operate by support of autonomy,
competence, and relatedness. Autonomy can be improved through actions such as minimizing
the salience of external pressures and coercion, maximizing the voice that individuals have in
decisions, and providing rationale for activities engaged in or suggested. Competence can be
supported by setting expectations at optimally challenging levels and providing feedback that
aims towards mastery. Relatedness can be supported by demonstrating caring and respect
(Niemiec & Ryan, 2009). In terms of assessment, Wallin (2003) offers some insight based on
her survey of college presidents:
5 The author wishes to note that while he does not see students as “inferior,” some faculty may, and the traditionalhierarchy in education has students below faculty.

109
First, let’s look at what administration should not do. Limiting faculty to rigid “carrot
and stick” faculty development programs will not produce any long term change in
faculty skills or attitudes. Extrinsic motivation will produce, at best, short term
compliance. At worst, it will enervate the faculty and lead to apathy and loss of interest
and enthusiasm. (p. 328)
Behaviors motivated by external regulation are poorly maintained once the external enforcement
is removed, and usually are not explored more deeply than is required, so relatively shallow
learning occurs. Only one step removed from this external regulation is introjected regulation,
where the behavior is engaged to avoid guilt or shame or to feel pride or boost ego (Niemiec &
Ryan, 2009). Therefore, the results of this study are further supported by the literature, and they
appear to be the ideal status for formative assessment.
5.2.4 Self-Determined Motivation
The positive self-determination score showed that the subset of engineering faculty
studied engage in formative assessment for internalized reasons. This denotes that the
motivation is self-determined, as opposed to controlled, though only 7.23 points up the 18-point
scale; as discussed above, there are opportunities to increase the internal forms of motivation for
formative assessment, and as such, this score could be improved. Increases in self-determined
motivation were expected to have positive impact on engagement in formative assessment, and
regression results from validation of the motivational model supported this outcome. This
impact is explored in more detail below, alongside the discussion of the status quo of
engagement in formative assessment.
While this variable has basic practical meaning, as just discussed, it is largely used as a
mediating variable for regression analysis. Therefore, very little extension of the results of self-

110
determined motivation scores are discussed here, beyond what has already been done, except for
a few quick notes. First, it is worth noting that a study of 132 female Jewish school teachers in
Israel produced very similar scores for self-determined motivation for teaching as this study
found in engineering faculty motivation for formative assessment: a mean score of 7.31 and
standard deviation of 3.08 in their study (Roth et al., 2007), compared to a mean of 7.23 and
standard deviation of 4.63 in this study. There was no interpretation of this result in their study,
but the similarity in scoring gives a general indication that this study’s score is reasonable.
Second, Niemiec and Ryan (2009) note some of the impacts of positive self-determination
scores, which they term self-regulation, in students:
Grolnick et al. (1991) found that elementary students who reported higher autonomous
self-regulation for learning were rated by their teachers as higher on both academic
achievement and adjustment in the class room. Niemiec et al. (2006) found that high-
school students who reported higher autonomous self-regulation for attending college
reported higher wellbeing (vitality, life satisfaction) and lower ill-being (depression,
externalizing problems). Black and Deci (2000) found that college students who reported
higher autonomous self-regulation for learning organic chemistry reported higher
perceived competence and interest/enjoyment for the course material, as well as lower
anxiety. (p. 138)
5.3 Engagement in Formative Assessment
In this work, faculty input was sought on how they experienced various affective and
behavioral aspects of engagement in formative assessment (cognitive aspects were also sought,
but the measures were not reliable). Results show that, for most aspects of affective and
behavioral engagement, it is largely true that the subset of engineering faculty studied experience

111
positive engagement in formative assessment. While they don’t rate it as a top priority or as their
first choice of behaviors, they do see value in it and find it useful to assist their teaching and
students’ learning. If things go wrong, these faculty report that they persist rather than dropping
the effort and experience very little anxiety either way. They put significant effort into
performing assessment, consider it important, and intend to continue in the future. Finally,
engineering faculty report that they experience satisfaction in the outcomes of their efforts, and
find it somewhat interesting and enjoyable, as well. Based on relatively narrow ranges in
confidence intervals, it appears that these conclusions hold well, even given the small chance that
the true means were not captured here.
From the results of the motivational model validation, regressions showed that a 1-point
increase in self-determined motivation is predicted to produce a positive impact on the
engagement variables with normalized magnitudes ranging from 0.44 to 1.03. The affective
constructs (interest/enjoyment, value/usefulness, anxiety, and satisfaction) were impacted the
most, with coefficient magnitudes falling in the range of 0.62 to 1.03, and the behavioral
constructs (choice of behavior, effort/importance, persistence, and intent) slightly less, in the
range of 0.44 to 0.79.
The smallest impact of changes in self-determined motivation scores would be on
engineering faculty persistence, and with 75% of variance in persistence left unexplained by
motivation, it may be difficult to reliably improve on the already-high dedication faculty show
when assessment doesn’t go as planned through motivation. Reducing anxiety isn’t much easier,
as self-determined motivation has a slightly larger impact on it than persistence but explains less
than one-eighth of the variance seen in anxiety scores. Faculty prioritization of formative
assessment over other tasks (i.e., choice of behavior) could be improved by ¾ point per
112
normalized point of self-determined motivation, but again 75% of the variance is unexplained,
leaving room for other unexplored variables to impact prioritization, too. The effort and
importance that faculty assign to formative assessment is quite dependent on self-determined
motivation, with over a third of variance explained by the relationship and almost 0.8 points per
normalized point impact, but scores show this is already high for faculty, on average. The value
that faculty see in formative assessment and the usefulness of it toward their goals are impacted
by self-determined motivation at about the same rate, with over 40% of the variance is explained;
this strong relationship is an expected result, as identified regulation and value/usefulness are
highly related conceptually. Intent to use formative assessment in the future also is greatly
impacted by changes in self-determined motivation, which affirms one of the most direct
implications of motivation: positive motivation indicates intent to engage in the future.
Somewhat unexpectedly, the satisfaction that faculty experience by using assessment to improve
their teaching is highly impacted by their self-determined motivation; while this was expected to
be positively affected, it was not anticipated that motivation would have such a high impact on
the satisfaction experienced. Finally, self-determined motivation was determined to have the
highest influence on the interest and enjoyment faculty experience with formative assessment,
with greater than a 1:1 ratio of influence on interest/enjoyment and almost half of the variance
explained by motivation alone; this indicates that the more internalized or self-determined
(intrinsic) the motivation, the more interesting and enjoyable formative assessment is, which
affirms one of the key influences of intrinsic motivation.
These results align with expectations put forth in this study, but also reflect the
expectations put forth in Vallerand’s 1997 book chapter that presented the model, and match the

113
findings of Miserandino (1996), which was a similar study to this one and that also tested
constructs from all three categories of engagement variables.

114
Chapter 6: Conclusions
If faculty professional development is to be a growth-enhancing experience, it needs to be
driven by an internal search for meaning, improved self-esteem and performance, and
more satisfying relationships. (Wallin, 2003, p. 320)
Overall, the results of this study produced many expected conclusions but also some
unexpected ones, in both desirable and undesirable ways. First, a study of current levels of
engagement in, motivation for, and satisfaction of motivational needs by formative assessment
largely produced expected outcomes. Results showed that engineering faculty who understand
formative assessment largely experience positive engagement in formative assessment, with little
anxiety, moderate interest, enjoyment, and prioritization of it, and a relatively high degree of
effort, importance, intent, satisfaction, value, usefulness, and persistence. As well, these
engineering faculty reported that their motivation to use formative assessment is highly related to
the fact that they identify such assessment as important to teaching and student learning, and to a
smaller degree that they find some intrinsic motivation in it, but that they have almost no feelings
of guilt from not doing it or external demands to use it. In terms of motivational needs,
engineering faculty reported that they feel largely autonomous in their decision to use formative
assessment, somewhat competent in their ability to use it, and somewhat related to others
through it.
Second, it was unexpected, but desirable, that the motivational model tested revealed a
strong and significant ability for all of the aspects of engagement, listed in the paragraph above,
in formative assessment to be predicted by engineering faculty’s self-determined motivation. In
this study, all of the aspects of engagement prescribed in Vallerand’s Hierarchal Model (1997)
were included for testing, but it was not expected that all of them would be significantly

115
predicted by motivation. This result showed that self-determined motivation is a strong and
reliable measure to use when trying to measure, predict, or improve engagement in formative
assessment by engineering faculty who understand formative assessment.
Third, it was unexpected, and undesirable, that the motivational needs of competence
and relatedness were found to not predict self-determined motivation in male and female
engineering faculty, respectively. According to self-determination theory, the motivation of all
people is affected by their satisfaction of the three needs of autonomy, competence, and
relatedness, and Vallerand’s Hierarchal Model says that these needs affect motivation for all
levels of motivation – global, contextual, situational, and those in between. Therefore, it was
undesirable to find that two of the needs’ ability to predict motivation were dependent on sex,
but there is the possibility that this will happen at different levels of motivation.
Fourth, it was unexpected, but desirable, to find that a large percentage of all engineering
faculty sampled were able to provide valid examples of what formative assessment is, when
requested to do so. The first question on the survey instrument developed in this study asked
faculty to provide two examples; data were used to extract respondents who provided valid
examples, such that conclusions of this study were not drawn from respondents who were
thinking of summative assessment or otherwise did not know what formative assessment is.
Since there had been no previous work that explored engineering faculty’s understanding of
formative assessment, it was encouraging to find that over 70% of respondents to this survey
showed evidence of understanding. Nonetheless, it should not be overlooked that about 90% of
faculty contacted did not respond to the survey, and hence self-selection bias may have played a
part in this result.

116
With the discoveries of this research, the knowledge-base of engineering education has
been expanded in the areas of motivation theory, engineering faculty motivation, and formative
assessment. The instrument developed in this study can be used to repeat this study on different
populations, or by engineering colleges or departments to explore the motivation for and
engagement in formative assessment. Further, the preliminary knowledge of the status quo of
engineering faculty motivation and engagement in formative assessment attained here can be
used, for example, as a comparison point for engineering colleges or departments who
implement the survey instrument. Subsequently, colleges and departments who wish to improve
the motivation for and engagement in formative assessment, perhaps based on a comparison to
the national sample reported here, can look to the motivational model validated in this study to
inform their interventions and policies.
Notwithstanding the positive and informative results of this study, a better understanding
of certain aspects of the variables and outcomes would be advantageous. For example, future
work could look to enhance the understanding of these results by conducting interviews focused
on certain groups. Since differences in the salience of certain motivational needs were found for
male and female engineering faculty, interviews of these groups may provide useful explanations
of the reasons for these differences. As well, contrasting the data from interviews of faculty who
score near the average results to those who score at the extremes may provide explanations for
this variance, to better inform interventions and policy changes. Knowledge from such
interviews are important to supplement the work here, as engineering faculty were treated
collectively for this large-scale, descriptive study but motivation theory clearly shows that all
individuals are unique in their motivation. Other areas for potential future work include:
attaining a better understanding of the motivational need relatedness in formative assessment,

117
broadening the study to explore confounding factors, exploring more of the postulates of
Vallerand’s Hierarchal Model with regards to formative assessment, and attaining a broader
sample of engineering faculty examples of formative assessment to better gauge understanding.

118
ReferencesABET. (2009). Criteria for Accrediting Engineering Programs: Effective for Evaluations During the
2009-2010 Accreditation Cycle Retrieved April 21, 2009, from http://abet.org/forms.shtmlAdsit, K. I. (2002). Student Assessment Techniques Retrieved March 28, 2010, from
http://www.utc.edu/Administration/WalkerTeachingResourceCenter/FacultyDevelopment/Assessment/assessment.html
Angelo, T. A. (1995). Assessing (and redefining) assessment. AAHE Bulletin, 48, 7-9.Angelo, T. A., & Cross, K. P. (1993). Classroom Assessment Techniques: A Handbook for College
Teachers. Second Edition.ASEE. (2009). Profiles of Engineering and Engineering Technology Colleges.Assor, A., Kaplan, H., Kanat-Maymon, Y., & Roth, G. (2005). Directly controlling teacher behaviors as
predictors of poor motivation and engagement in girls and boys: The role of anger and anxiety.Learning and Instruction, 15(5), 397-413.
Benware, C. A., & Deci, E. L. (1984). Quality of Learning with an Active versus Passive MotivationalSet. American Educational Research Journal, 21(4), 755-765.
Besterfield-Sacre, M., Gerchak, J., Lyons, M., Shuman, L. J., & Wolfe, H. (2004). Scoring ConceptMaps: An Integrated Rubric for Assessing Engineering Education. Journal of EngineeringEducation, 93(2), 105-115.
Besterfield-Sacre, M., Moreno, M., Shuman, L. J., & Atman, C. J. (2001). Gender and EthnicityDifferences in Freshmen Engineering Student Attitudes: A Cross-Institutional Study. [Article].Journal of Engineering Education, 90(4), 477-489.
Besterfield-Sacre, M., Shuman, L. J., Wolfe, H., Atman, C. J., McGourty, J., Miller, R. L., . . . Rogers, G.M. (2000). Defining the outcomes: a framework for EC-2000. Education, IEEE Transactions on,43(2), 100-110.
Bird, A. M. (2001). Faculty Buy-In to Assessment Activities: A Group Dynamics Approach. AssessmentUpdate, 13(1), 6.
Black, P., & Wiliam, D. (1998a). Assessment and classroom learning. Assessment in Education:Principles, Policy & Practice, 5(1), 7.
Black, P., & Wiliam, D. (1998b). Inside the Black Box: Raising Standards Through ClassroomAssessment. Phi Delta Kappan, 80(2).
Bond, L. (2009). Toward Informative Assessment and a Culture of Evidence: The Carnegie Foundationfor the Advancement of Teaching.
Bransford, J. D., Brown, A. L., Cocking, R. R., Donovan, M. S., & Pellegrino, J. W. (2000). How PeopleLearn (Expanded ed.): National Academy Press Washington, DC.
Brawner, C. E., Felder, R. M., Allen, R. H., & Brent, R. (2001). The Impact of Faculty DevelopmentActivities on Engineering Faculty Teaching Practices. Paper presented at the American Societyfor Engineering Education Annual Conference & Exposition, Albuquerque, New Mexico.
Brawner, C. E., Felder, R. M., Allen, R. H., & Brent, R. (2002). 2002 SUCCEED Faculty Survey ofTeaching Practices and Perceptions of Institutional Attitudes Toward Teaching.
Brookhart, S. M., & DeVoge, J. G. (1999). Testing a Theory About the Role of Classroom Assessment inStudent Motivation and Achievement. Applied Measurement in Education, 12(3), 409.
Brown, B. (2005). Strategies for Improving Faculty Morale in Times of Tight Budgets. Academic Leader,21(11), 5-8.
. The Carnegie Classification of Institutions of Higher Education. (2005) Retrieved October 1, 2010,from http://classifications.carnegiefoundation.org/
Chen, H. L., Lattuca, L. R., & Hamilton, E. R. (2008). Conceptualizing Engagement: Contributions ofFaculty to Student Engagement in Engineering. Journal of Engineering Education, 97(3), 339-353.

119
Clark, R. (2009). Engineering Education Research – Creating an Environment for Action. Paperpresented at the Research in Engineering Education Symposium, Palm Cove, QLD, Australia.http://rees2009.pbworks.com/f/rees2009_submission_53.pdf
Colton, D., & Covert, R. W. (2007). Designing and constructing instruments for social research andevaluation (1st ed.). San Francisco, CA: Jossey-Bass.
Coster, H. (2010). The 10 Hardest Jobs To Fill In America Retrieved Oct. 1, 2010, fromhttp://www.forbes.com/2010/05/28/jobs-demand-talent-leadership-careers-wanted.html
Creswell, J. W. (2002). Research Design: Qualitative, Quantitative, and Mixed Methods Approaches (2nded., pp. 27-69, 87-118, 153-178). Thousand Oaks: SAGE Publications.
Creswell, J. W., & Clark, V. L. P. (2007). Designing and Conducting Mixed Methods Research.Thousand Oaks: SAGE Publications.
Creswell, J. W., Plano Clark, V. L., Gutmann, M. L., & Hanson, W. E. (2003). Advanced Mixed MethodsResearch Designs (A. Tashakkori & C. Teddlie, Trans.). In A. Tashakkori & C. Teddlie (Eds.),Handbook of mixed methods in social & behavioral research (Vol. xv, 768 p. ;, pp. 209-240).Thousand Oaks, Calif. :: SAGE Publications.
Csikszentmihalyi, M. (1990). Flow: The psychology of optimal experience (pp. 43-93). New York:HarperPerennial.
de Winter, A., Oldehinkel, A., Veenstra, R., Brunnekreef, J., Verhulst, F., & Ormel, J. (2005). Evaluationof non-response bias in mental health determinants and outcomes in a large sample of pre-adolescents. European Journal of Epidemiology, 20(2), 173-181. doi: 10.1007/s10654-004-4948-6
Deci, E. L., Connell, J. P., & Ryan, R. M. (1989). Self-determination in a work organization. Journal ofApplied Psychology, 74(4), 580-590. doi: 10.1037/0021-9010.74.4.580
Deci, E. L., Kasser, T., & Ryan, R. M. (1996). Self-Determined Teaching: Opportunities and Obstacles.In J. L. Bess (Ed.), Teaching Well & Liking It: Motivating Faculty To Teach Effectively.
Deci, E. L., & Ryan, R. M. (2000). The "What" and "Why" of Goal Pursuits: Human Needs and the Self-Determination of Behavior. Psychological Inquiry, 11(4), 227-268.
Deci, E. L., & Ryan, R. M. (2010). Self-Determination Theory Questionnaires Retrieved Jan 28, 2010,from http://www.psych.rochester.edu/SDT/questionnaires.php
Deutskens, E., de Ruyter, K., Wetzels, M., & Oosterveld, P. (2004). Response Rate and Response Qualityof Internet-Based Surveys: An Experimental Study. Marketing Letters, 15(1), 21-36. doi:10.1023/b:mark.0000021968.86465.00
Dues, J., Fuehne, J., Cooley, T., Denton, N., & Kraebber, H. (2008). Assessment for ContinuousImprovement: Embedding It in the Culture. Journal of Engineering Technology, 25(2), 10-17.
Ecclestone, K. (2006). Making formative assessment work. Adults Learning, 18(4), 12-13.Fink, L. D., Ambrose, S., & Wheeler, D. (2005). Becoming a Professional Engineering Educator: A New
Role for a New Era. Journal of Engineering Education, 94(1), 185-194.Fisher, D., -. (2007). Checking for understanding : formative assessment techniques for your classroom
(N. Frey, Trans. Vol. x, 158 p. :). Alexandria, Va. :: Association for Supervision and CurriculumDevelopment.
Guay, F., Vallerand, R. J., & Blanchard, C. (2000). On the Assessment of Situational Intrinsic andExtrinsic Motivation: The Situational Motivation Scale (SIMS). [10.1023/A:1005614228250].Motivation and Emotion, 24(3), 175-213.
Hallinan, P., & Danaher, P. (1994). The effect of contracted grades on self-efficacy and motivation inteacher education courses. Educational Research, 36(1), 75.
Hancock, D. R. (2007). Effects of performance assessment on the achievement and motivation ofgraduate students. Active Learning in Higher Education, 8(3), 219-231.
Hutchison-Green, M. A., Follman, D. K., & Bodner, G. M. (2008). Providing a Voice: QualitativeInvestigation of the Impact of a First-Year Engineering Experience on Students' Efficacy Beliefs.[Article]. Journal of Engineering Education, 97(2), 177-190.
120
Jones, B. D., Paretti, M. C., Hein, S. F., & Knott, T. W. (2010). An Analysis of Motivation Constructswith First-Year Engineering Students: Relationships Among Expectancies, Values, Achievement,and Career Plans. Journal of Engineering Education, 99(4), 319-336.
Kaplowitz, M. D., Hadlock, T. D., & Levine, R. (2004). A Comparison of Web and Mail SurveyResponse Rates. Public Opinion Quarterly, 68(1), 94-101. doi: 10.1093/poq/nfh006
Kirton, A., Hallam, S., Peffers, J., Robertson, P., & Stobart, G. (2007). Revolution, evolution or a Trojanhorse? Piloting assessment for learning in some Scottish primary schools. British EducationalResearch Journal, 33(4), 605-627.
Korkeila, K., Suominen, S., Ahvenainen, J., Ojanlatva, A., Rautava, P., Helenius, H., & Koskenvuo, M.(2001). Non-response and related factors in a nation-wide health survey. European Journal ofEpidemiology, 17(11), 991-999. doi: 10.1023/a:1020016922473
Landino, R. A., & Owen, S. V. (1988). Self-efficacy in university faculty. Journal of VocationalBehavior, 33(1), 1-14. doi: Doi: 10.1016/0001-8791(88)90030-9
Levesque, C. S., Williams, G. C., Elliot, D., Pickering, M. A., Bodenhamer, B., & Finley, P. J. (2007).Validating the theoretical structure of the Treatment Self-Regulation Questionnaire (TSRQ)across three different health behaviors. Health Educ. Res., 22(5), 691-702. doi:10.1093/her/cyl148
Lindner, J. R., Briers, G. E., & Murphy, T. H. (2001). Handling nonresponse in social science research.Journal of agricultural education, 42(4), 43-53.
Malicky, D. (2003). A Literature Review on the Under-representation of Women in UndergraduateEngineering: Ability, Self-Efficacy, and the "Chilly Climate". Paper presented at the AmericanSociety for Engineering Education Annual Conference & Exposition.
Matusovich, H., Streveler, R., Miller, R. L., & Olds, B. M. (2009). I’m Graduating This Year! So What ISan Engineer Anyway? Paper presented at the American Society for Engineering EducationAnnual Conference & Exposition, Austin, Texas.
McAuley, E., Duncan, T., & Tammen, V. V. (1989). Psychometric properties of the Intrinsic MotivationInventory in a competitive sport setting: a confirmatory factor analysis. Research Quarterly ForExercise And Sport, 60(1), 48-58.
McKeachie, W. J. (1996). Wanting to be a Good Teacher: What Have We Learned to Date? In J. L. Bess(Ed.), Teaching Well & Liking It: Motivating Faculty To Teach Effectively.
McManus, S. (2008). Attributes of Effective Formative Assessment: NC Department of PublicInstruction.
McMillan, J. H., & Hearn, J. (2009). STUDENT SELF-ASSESSMENT. Education Digest, 74(8), 39-44.Messick, S. (1995). Validity of psychological assessment: Validation of inferences from persons'
responses and performances as scientific inquiry into score meaning. American Psychologist,50(9), 741-749.
Miserandino, M. (1996). Children who do well in school: Individual differences in perceived competenceand autonomy in above-average children. Journal of Educational Psychology, 88(2), 203-214.doi: 10.1037/0022-0663.88.2.203
Moskal, B. M. (2008). Using Assessment Results for Improving Student Learning. In J. E. Spurlin, S. A.Rajala & J. P. Lavelle (Eds.), Designing better engineering education through assessment : apractical resource for faculty and department chairs on using assessment and ABET criteria toimprove student learning (pp. 117-148). Sterling, Va.: Stylus Pub.
Moskal, B. M., Leydens, J. A., & Pavelich, M. J. (2002). Validity, Reliability and the Assessment ofEngineering Education. Journal of Engineering Education, 91(3), 351-354.
Motivation, emotion, and cognition : integrative perspectives on intellectual functioning anddevelopment. (2004). (D. Y. Dai & R. J. Sternberg, Trans. Vol. xiii, 455 p. :). Mahwah, N.J. ::Lawrence Erlbaum Associates.
Myers, C. B. (2008). Divergence in Learning Goal Priorities Between College Students and TheirFaculty: Implications for Teaching and Learning. College Teaching, 56(1), 53-58.

121
National Academy of Engineering. (2005). Educating the Engineer of 2020: Adapting EngineeringEducation to the New Century. Washington, DC: National Academies Press.
Niemiec, C. P., & Ryan, R. M. (2009). Autonomy, competence, and relatedness in the classroom:Applying self-determination theory to educational practice. Theory and Research in Education,7(2), 133-144. doi: 10.1177/1477878509104318
Ohland, M. W., Sheppard, S. D., Lichtenstein, G., Eris, O., Chachra, D., & Layton, R. A. (2008).Persistence, Engagement, and Migration in Engineering Programs. Journal of EngineeringEducation, 97(3), 259-278.
Olds, B. M., & Miller, R. L. (2008). Using Formative Assessment for Program Improvement. In J. E.Spurlin, S. A. Rajala & J. P. Lavelle (Eds.), Designing Better Engineering Education ThroughAssessment: A Practical Resource for Faculty and Department Chairs on Using Assessment andABET Criteria to Improve Student Learning. Sterling, VA: Stylus Pub.
Olds, B. M., Moskal, B. M., & Miller, R. L. (2005). Assessment in Engineering Education: Evolution,Approaches and Future Collaborations. Journal of Engineering Education, 94(1), 13-26.
Ormrod, J. E. (2008). Human learning (5th ed.). Upper Saddle River, N.J.: Pearson/Merrill Prentice Hall.Ott, L., & Longnecker, M. (2001). An Introduction to Statistical Methods and Data Analysis (Fifth
Edition ed.): Duxbury Press.Poulos, A., & Mahony, M. J. (2008). Effectiveness of feedback: the students' perspective. Assessment &
Evaluation in Higher Education, 33(2), 143-154.Prados, J. W., Peterson, G. D., & Lattuca, L. R. (2005a). Quality Assurance of Engineering Education
through Accreditation: The Impact of Engineering Criteria 2000 and Its Global Influence. Journalof Engineering Education, 94(1), 165-184.
Prados, J. W., Peterson, G. D., & Lattuca, L. R. (2005b). Quality Assurance of Engineering Educationthrough Accreditation: The Impact of Engineering Criteria 2000 and Its Global Influence. Journalof Engineering Education, 94(1), 165-183.
Rawlings, J. O., Pantula, S. G., & Dickey, D. A. (1998). Applied regression analysis : a research tool.New York: Springer.
Reeve, J. (2002). Self-Determination Theory Applied to Educational Settings. In E. L. Deci & R. M.Ryan (Eds.), Handbook of self-determination research (Vol. x, 470 p.). Rochester, NY:University of Rochester Press.
Richer, S. F., Blanchard, C., & Vallerand, R. J. (2002). A Motivational Model of Work Turnover.[Article]. Journal of Applied Social Psychology, 32(10), 2089-2113.
Roth, G., Assor, A., Kanat-Maymon, Y., & Kaplan, H. (2007). Autonomous motivation for teaching:How self-determined teaching may lead to self-determined learning. Journal of EducationalPsychology, 99(4), 761-774.
Rowntree, D. (1987). Assessing students : how shall we know them? (Vol. xiii, 273 p. :). London : NewYork :: K. Page ; Nichols Pub. Co.
Ryan, R. M., & Deci, E. L. (2000). Self-determination theory and the facilitation of intrinsic motivation,social development, and well-being. American Psychologist, 55, 68-78.
Ryan, R. M., & Niemiec, C. P. (2009). Self-determination theory in schools of education: Can anempirically supported framework also be critical and liberating? Theory and Research inEducation, 7(2), 263-272. doi: 10.1177/1477878509104331
Seale, J. K., Chapman, J., & Davey, C. (2000). The influence of assessment on students' motivation tolearn in a therapy degree course. Medical Education, 34(8), 614-621.
Sebire, S. J., Standage, M., & Vansteenkiste, M. (2009). Examining Intrinsic Versus Extrinsic ExerciseGoals: Cognitive, Affective, and Behavioral Outcomes. Journal of Sport & Exercise Psychology,31(2), 189-210.
Seymour, E., & Hewitt, N. M. (1997). Talking about leaving : Why undergraduates leave the sciences.Boulder, Colo.: Westview Press.
Shepard, L. A. (1995). Using assessment to improve learning. [Article]. Educational Leadership, 52(5),38.

122
Shuman, L. J., Besterfield-Sacre, M., & McGourty, J. (2005). The ABET “Professional Skills” - CanThey Be Taught? Can They Be Assessed? Journal of Engineering Education, 94(1), 41-56.
Splitt, F. G. (2002). Engineering Education Reform: A Trilogy: Northwestern University.Stiggins, R. (2006). Assessment for Learning: A Key to Motivation and Achievement. Edge: The Latest
Information for the Education Practitioner, 2(2), 1-19.Stiggins, R. (2007). Assessment Through the Student's Eyes. Educational Leadership, 64(8), 22.Stiggins, R. J. (1999). Assessment, Student Confidence, and School Success. Phi Delta Kappan, 81(3),
191.Stumpf, S. A., & Rindova, V. P. (1996). Assessment and Evaluation Techniques. In J. L. Bess (Ed.),
Teaching Well & Liking It: Motivating Faculty To Teach Effectively.Suskie, L. A. (1992). Questionnaire survey research : what works (Vol. iii, 107 p. :). Tallahassee, Fla. ::
Association for Institutional Research.Sutton, R. E. (2005). Assessment of Student Learning: Moving from Compliance to Internalization.
Assessment Update, 17(6), 4-12.Swann, W. B., & Pittman, T. S. (1977). Initiating Play Activity of Children: The Moderating Influence of
Verbal Cues on Intrinsic Motivation. [Article]. Child Development, 48(3), 1128-1132. doi:10.1111/1467-8624.ep10404249
Swing, R. L. (2001). Dedicated Assessment Days: Mobilizing a Campus's Efforts. Assessment Update,13(6), 1.
Turns, J., Eliot, M., Neal, R., & Linse, A. (2007). Investigating the Teaching Concerns of EngineeringEducators. [Article]. Journal of Engineering Education, 96(4), 295-308.
Turns, S. R. (1991). Faculty Research and Teaching--A View from the Trenches. Engineering Education,81(1), 23-25.
Utschig, T. (2006). Moving Towards an Assessment Culture Faculty Guidebook: A Comprehensive Toolfor Improving Faculty Performance (3rd Edition ed.): Pacific Crest.
Vallerand, R. J. (1997). Toward A Hierarchical Model of Intrinsic and Extrinsic Motivation. In P. Z.Mark (Ed.), Advances in Experimental Social Psychology (Vol. Volume 29, pp. 271-360):Academic Press.
Vallerand, R. J., Fortier, M. S., & Guay, F. (1997). Self-determination and persistence in a real-lifesetting: Toward a motivational model of high school dropout. Journal of Personality and SocialPsychology, 72, 1161-1176.
Vallerand, R. J., & Losier, G. F. (1999). An integrative analysis of intrinsic and extrinsic motivation insport. Journal of Applied Sport Psychology, 11(1), 142 - 169.
Vallerand, R. J., Pelletier, L. G., Blais, M. R., Briere, N. M., Senecal, C., & Vallerieres, E. F. (1993). Onthe Assessment of Intrinsic, Extrinsic, and Amotivation in Education: Evidence on the Concurrentand Construct Validity of the Academic Motivation Scale. Educational and PsychologicalMeasurement, 53, 159.
Vlachopoulos, S. P., & Michailidou, S. (2006). Development and Initial Validation of a Measure ofAutonomy, Competence, and Relatedness in Exercise: The Basic Psychological Needs inExercise Scale. Measurement in Physical Education and Exercise Science, 10(3), 179 - 201.
Volkwein, J. F., Lattuca, L. R., & Terenzini, P. T. (2008). Measuring the Impact of EngineeringAccreditation on Student Experiences and Learning Outcomes. In W. E. Kelly (Ed.), Assessmentin Engineering Programs: Evolving Best Practices (Vol. 3). Tallahassee, FL: Association forInstitutional Research.
Wallin, D. L. (2003). Motivation and Faculty Development: A Three-State Study of PresidentialPerceptions of Facult Professional Development Needs. Community College Journal of Research& Practice, 27(4), 317.
Walvoord, B. E. F. (2004). Assessment clear and simple : a practical guide for institutions, departments,and general education (1st ed.). San Francisco: Jossey-Bass.
Wigfield, A., & Eccles, J. S. (2000). Expectancy–Value Theory of Achievement Motivation.Contemporary Educational Psychology, 25, 68-81.

123
Woolston, D. C. (2008). Outcomes-Based Assessment in Engineering Education: A Critique of ItsFoundations and Practice. Paper presented at the Frontiers in Education Conference, SaratogaSprings, NY.
Yue, Y., Shavelson, R. J., Ayala, C. C., Ruiz-Primo, M. A., Brandon, P. R., Furtak, E. M., . . . Young, D.B. (2008). On the Impact of Formative Assessment on Student Motivation, Achievement, andConceptual Change. Applied Measurement in Education, 21(4), 335-359.
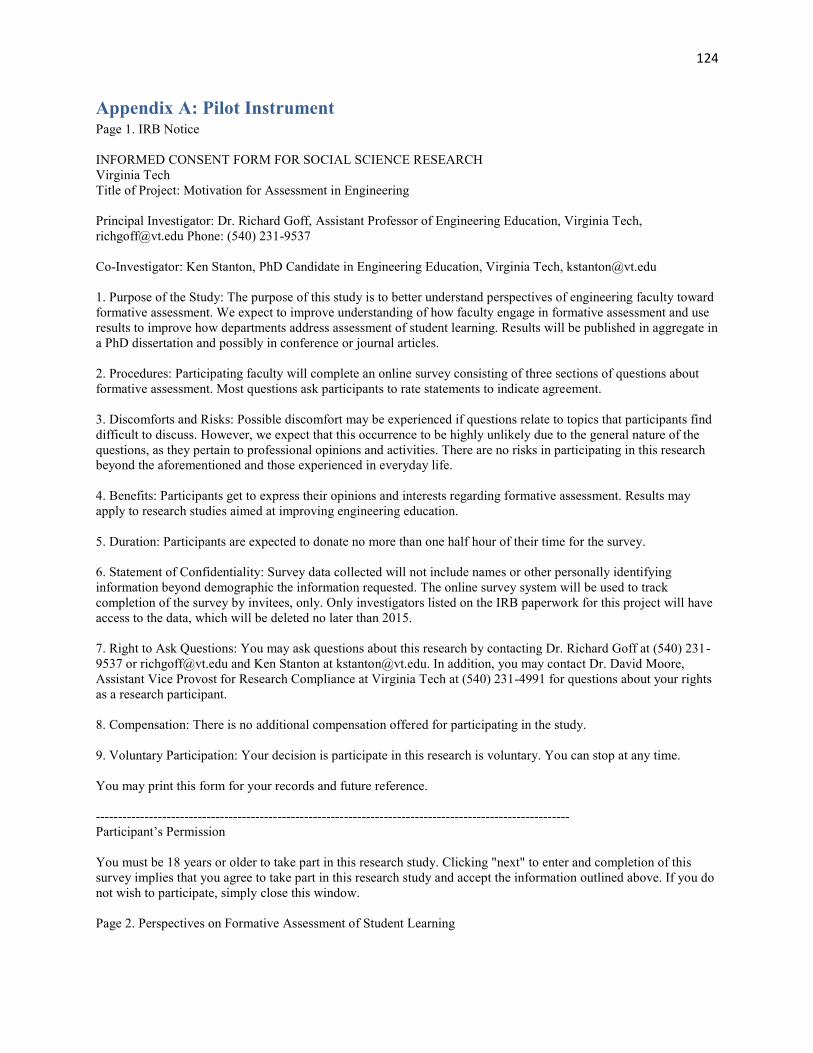
124
Appendix A: Pilot InstrumentPage 1. IRB Notice
INFORMED CONSENT FORM FOR SOCIAL SCIENCE RESEARCHVirginia TechTitle of Project: Motivation for Assessment in Engineering
Principal Investigator: Dr. Richard Goff, Assistant Professor of Engineering Education, Virginia Tech,[email protected] Phone: (540) 231-9537
Co-Investigator: Ken Stanton, PhD Candidate in Engineering Education, Virginia Tech, [email protected]
1. Purpose of the Study: The purpose of this study is to better understand perspectives of engineering faculty towardformative assessment. We expect to improve understanding of how faculty engage in formative assessment and useresults to improve how departments address assessment of student learning. Results will be published in aggregate ina PhD dissertation and possibly in conference or journal articles.
2. Procedures: Participating faculty will complete an online survey consisting of three sections of questions aboutformative assessment. Most questions ask participants to rate statements to indicate agreement.
3. Discomforts and Risks: Possible discomfort may be experienced if questions relate to topics that participants finddifficult to discuss. However, we expect that this occurrence to be highly unlikely due to the general nature of thequestions, as they pertain to professional opinions and activities. There are no risks in participating in this researchbeyond the aforementioned and those experienced in everyday life.
4. Benefits: Participants get to express their opinions and interests regarding formative assessment. Results mayapply to research studies aimed at improving engineering education.
5. Duration: Participants are expected to donate no more than one half hour of their time for the survey.
6. Statement of Confidentiality: Survey data collected will not include names or other personally identifyinginformation beyond demographic the information requested. The online survey system will be used to trackcompletion of the survey by invitees, only. Only investigators listed on the IRB paperwork for this project will haveaccess to the data, which will be deleted no later than 2015.
7. Right to Ask Questions: You may ask questions about this research by contacting Dr. Richard Goff at (540) 231-9537 or [email protected] and Ken Stanton at [email protected]. In addition, you may contact Dr. David Moore,Assistant Vice Provost for Research Compliance at Virginia Tech at (540) 231-4991 for questions about your rightsas a research participant.
8. Compensation: There is no additional compensation offered for participating in the study.
9. Voluntary Participation: Your decision is participate in this research is voluntary. You can stop at any time.
You may print this form for your records and future reference.
-----------------------------------------------------------------------------------------------------------Participant’s Permission
You must be 18 years or older to take part in this research study. Clicking "next" to enter and completion of thissurvey implies that you agree to take part in this research study and accept the information outlined above. If you donot wish to participate, simply close this window.
Page 2. Perspectives on Formative Assessment of Student Learning

125
Purpose:
This survey is designed to measure engineering educators’ perspectives on formative assessment of student learning,as defined below, and the ways in which they engage in it. Results will inform engineering education researchers,administrators, and faculty development personnel on educators’ views of formative assessment and how theseviews lead to engagement in it.
Instructions:
Please complete all questions on this survey. You will not be personally identifiable. Your responses are anonymousand will not be available to anyone other than the researchers.
Please answer questions by considering your current perspectives, unless asked otherwise. That is, please do notindicate what you think you should do but rather what you currently do.
In this study, formative assessment is considered from your perspective – that is, the things you do and think aboutmeasuring and improving student learning. You are not asked what your students think of assessment or how wellthey are doing. The focus here is on the attempts and efforts you make when teaching undergraduate engineeringclasses in four specific steps of formative assessment: • Using approaches that are intended/designed to measure student learning • Collecting data from assessments for analysis of student learning • Evaluating the data collected to make inferences about student learning • Applying results of evaluation to improve teaching, student learning, and future assessment efforts
This is different from summative assessment and accreditation in that: • Formative assessment is used to adjust teaching “on the fly” and before summative testing • Summative assessment and accreditation are typically requirements for educators to use • Formative assessment is often left to the educator to manage
Please provide two example formative assessment techniques that you feel fit the description above (you may useformal names or describe the techniques if you don’t know what they are called):1.2.
Page 3. Demographics
Please tell us a little about your background:
Sex:MaleFemale
Ethnicity:African-AmericanAsian-AmericanCaucasianForeign NationalHispanicNative AmericanOther (please specify)
My primary college or university is:Virginia TechOther (please specify)
126
The undergraduate engineering discipline I primarily teach in is:AerospaceArchitecturalBiological and AgriculturalBiomedicalChemicalCivilCivil/EnvironmentalComputer ScienceElectrical/ComputerEng. Science & Eng. PhysicsEngineering (general)Engineering ManagementEnvironmentalIndustrial/ManufacturingMechanicalMetallurgical & MaterialsMiningNuclearPetroleumOther (please specify)
Number of classes I have taught (total, graduate and undergraduate):0 - 56 - 1011 - 1516+
Academic Rank:Part-time instructor / adjunctFull-time, non-tenure track instructor / professorAssistant professor (tenure track)Associate professorFull professorOther (only if very different from above)
Page 4. Engagement in Formative Assessment
Remember that this is anonymous and no one will know how you responded to the questions.
The following questions pertain to your affective, behavioral, and cognitive engagement in formative assessment.Please indicate how true each of the following statement is for you given your experiences doing assessment or yourplans to do assessment. If you are not currently using and do not plan to use formative assessment, please answer thequestions the best you can – your answers will still be helpful.
Not very true (1) 2 3 Somewhat true (4) 5 6 Very true (7)
1. I enjoy doing formative assessment very much.2. I think that doing formative assessment is useful for improving my teaching.3. I am sometimes anxious while evaluating assessment results.4. I don't put much energy into finding other ways to assess my students.5. I really pay attention when my students express concerns about what they’re learning.6. When I'm evaluating student assessments, I find time goes by really slowly7. I get a sense of fulfillment from applying assessment results to improve my teaching.8. I intend to learn better ways to apply assessment results to improve my teaching.9. Sometimes I find myself doing assessment when I should be doing other things.10. When I come to an assessment issue I can't solve right away, I tend to concentrate on solving it.

127
Page 5. Engagement in Formative Assessment (page 2)
Remember that this is anonymous and no one will know how you responded to the questions.
The following questions pertain to your affective, behavioral, and cognitive engagement in formative assessment.Please indicate how true each of the following statement is for you given your experiences doing assessment or yourplans to do assessment. If you are not currently using and do not plan to use formative assessment, please answer thequestions the best you can – your answers will still be helpful.
Not very true (1) 2 3 Somewhat true (4) 5 6 Very true (7)
11. If I can't get students to get a problem right, I just keep trying.12. It is important to me that I do a good job assessing my students’ learning.13. When students don’t get what I’m teaching right away, I just move on.14. I feel very tense while giving my students assessments.15. I think doing this kind of assessment could help me to improve the way I teach engineering.16. I would describe formative assessment as very interesting.17. When I first try new assessment methods, I feel anxious.18. In the future, I intend to do a better job of evaluating the assessment data I collect.19. I wish I could do more assessment in my classes, but time doesn’t permit it.20. If I can't think of an assessment activity to use, I find that after a minute, something comes to me.
Page 6. Engagement in Formative Assessment (page 3)
Remember that this is anonymous and no one will know how you responded to the questions.
The following questions pertain to your affective, behavioral, and cognitive engagement in formative assessment.Please indicate how true each of the following statement is for you given your experiences doing assessment or yourplans to do assessment. If you are not currently using and do not plan to use formative assessment, please answer thequestions the best you can – your answers will still be helpful.
Not very true (1) 2 3 Somewhat true (4) 5 6 Very true (7)
21. I feel pressure to change my teaching when assessment results are negative.22. I would be willing to increase my use of formative assessment because it has value to me.23. I think formative assessment is a boring activity.24. I think measuring student learning is an important activity.25. I don't try very hard to do well at assessment.26. It is satisfying to find ways to improve my students’ learning.27. If I had an extra hour while at school, I would assess student work to see how they’re doing.28. It is my intent to collect more data from formative assessments in the future.29. When I have a hard time getting my class to learn something, I typically just quit trying.30. I think formative assessment is important to do because it can help students learn better.
Page 7. Engagement in Formative Assessment (page 4)
Remember that this is anonymous and no one will know how you responded to the questions.
The following questions pertain to your affective, behavioral, and cognitive engagement in formative assessment.Please indicate how true each of the following statement is for you given your experiences doing assessment or yourplans to do assessment. If you are not currently using and do not plan to use formative assessment, please answer thequestions the best you can – your answers will still be helpful.
Not very true (1) 2 3 Somewhat true (4) 5 6 Very true (7)
31. While I am doing formative assessment, I think about how much I enjoy it.32. I am very relaxed when it comes to assessing student learning.33. I believe doing formative assessment is beneficial to me and my goals.
128
34. I get a feeling of satisfaction from assessment even when results aren’t positive.35. Doing formative assessment does not hold my attention at all.36. If assessments show students aren’t learning, I keep working at it.37. I try very hard to use assessments whenever possible.38. I believe formative assessment could be of some value to me.39. I put a lot of effort into assessing my students.40. I intend to learn more ways to assess my students’ learning.41. I find myself choosing to do assessment over other teaching tasks.42. I do not feel nervous at all while assessing my students.43. I rarely prioritize assessment when planning my time.
Page 8. Perspectives on Formative Assessment
Remember that this is anonymous and no one will know how you responded to the questions.
There are a variety of reasons why people might use formative assessment. Please indicate how true each of thesereasons is for you.
I use formative assessment...:Not very true (1) 2 3 Somewhat true (4) 5 6 Very true (7)
1. because I would feel bad about myself if I did not.2. because others would be disappointed with me if I did not.3. because I enjoy assessing my students’ learning.4. because I would feel like a failure if I did not.5. because it's important to me to try to better teach topics that students are not learning well.6. because people would think I'm a not a caring person if I didn’t do it.7. because I feel like I have no choice about doing formative assessment; others make me do it.8. because I like the challenge of improving my teaching.9. because I believe using formative assessment helps me teach better.10. because it's fun.11. because I worry that I would get in trouble with others if I did not.12. because it feels important to me personally to improve how my students are learning.13. because I feel guilty if I do not do something to test my students’ learning.14. because I want others to acknowledge that I am doing what I have been told I should do.15. because it is interesting to see if my students are learning and improving.16. because improving student learning is an important value for me.
Page 9. When I assess my students
Remember that this is anonymous and no one will know how you responded to the questions.
The following questions concern your feelings about your formative assessment efforts or your plans to useformative assessment, as well as your connection with other educators you know who assess their students’ learning.If you are not currently using and do not plan to use formative assessment, please answer the questions the best youcan – your answers will still be helpful.
Not very true (1) 2 3 Somewhat true (4) 5 6 Very true (7)
1. I have learned the essential skills needed to assess student learning.2. I pretty much keep to myself with results from assessing my students’ learning.3. There is not much opportunity for me to decide for myself how to go about assessing my students.4. People at school tell me I am good at assessment.5. I really feel connected with other educators who I know assess their students’ learning.6. I am able to choose assessment methods based on my own goals for teaching and learning.7. I do not feel very competent when trying to assess my students’ learning.8. I am free to express my ideas and opinions on how assessment should be done.

129
9. I feel a connection to my students when I assess their learning.10. Most times, I feel a sense of accomplishment from assessing my students’ learning.11. I am willing to share both positive and negative assessment results with others.12. When it comes to assessment, I do not get much of a chance to show how capable I am.13. People at work appreciate me for my assessment efforts.14. I feel pressured to do assessment.15. When I think about assessment, I often do not feel very capable.16. Amongst other educators, I feel like doing assessment is necessary to fit in.17. I feel like I have a lot of control in deciding how I assess my students’ learning.18. I feel that my assessment efforts alienate me from other educators.19. When it comes to assessment, I have to do what I am told.20. I feel like I can pretty much be myself when assessing my students.
Page 10. Closing
Thank you for taking the time to fill out our survey. We rely on your feedback to help us improve engineeringeducation. Your input is greatly appreciated.
Please direct any comments or questions to Ken Stanton ([email protected]) and Dr. Richard Goff ([email protected]).In the space that follows, you may provide any feedback you wish to share with the researchers regarding formativeassessment, the quality or clarity of the survey, or the study in general:
130
Appendix B: Pilot Interview Questions and ProcedureThe following constitutes the Interview Question Sheet to be used in the pilot testing stages.
The goal of the survey piloting is to:
investigate how respondents understand the survey questions, find the types of information participants retrieve to answer questions, understand the types of socially acceptable answers that might be given and why, and evaluate whether participants performed the survey task the way that was intended.
The pilot testing will be conducted as brief interviews:
participants are first given a paper copy of the survey
participants are asked to fill it out, taking notes and/or vocalizing thoughts as theyproceed, such that they can give thoughts, concerns, or problems along with theirresponses. The following question should be addressed, as well:
On average, how long did it take to complete? What was the longest time andwhat was the shortest time it took to complete the instrument? How much of thattime was spent making notes or verbalizing thoughts?
following completion, the questions below will be posed to solicit qualitative feedbackon each quantitative survey item or block of items
after data are collected from the pilot testing, checks for validity and reliability will beperformed, aimed at attaining the goals above, through the following central questions:
What is the nature of the respondent’s statement? (uncertainty, confusion,objection, or disagreement with the item)
What is the root of the issue the respondent is discussing? (the instructions, theitem, the responses, etc.)
What may be changed about the instrument or item to resolve the issue? Which change would maximize the validity of this item, or should it be removed?
survey items or sections that have reliability or validity issues should be removed,revised, or reordered to complete the final instrument, per the questions above
Interview questions (from Colton & Covert, 2007, pp. 140-141):
1. What is your overall reaction to the questionnaire?
2. Was each set of directions clear (that is, the general directions at the beginning of thequestionnaire and any subsequent directions provided in the body of the instrument)?

131
3. Were there any spelling or grammatical problems? Were any items difficult to read due tothe sentence length, choice of words, or special terminology?
4. What suggestions do you have for making the questionnaire or individual items easier tounderstand and complete?
5. Did you experience any problems with the item format(s), and if so, do you have anysuggestions for alternate formats?
6. Did you encounter any problems as a result of the organization of the instrument, such ashow items flowed?
7. Did you have any concern about the length of the instrument or the time it took to complete?
8. Do you have any concerns about confidentiality or how the questionnaire would be used?
9. Do you have any other concerns?
10. [Give participants a transparency for each page of the survey that identifies which questionspertain to which constructs (e.g. those for autonomy).] How do you interpret each group ofitems? What do these items collectively mean to you? Do all of the items make sense forthat interpretation?
132
Appendix C: Research Question Breakdown and Construct ListThe following breakdown of the research question (RQ) shows inference questions (IQ) and subsequentsurvey items (SI) and statistical analyses (STAT):
RQ: To what degree does the Hierarchical Model of intrinsic and extrinsic motivation hold for formativeassessment of student learning by engineering faculty?
Summary Questions:o IQ1: To what degree are the motivational needs of autonomy, competence, and relatedness of
engineering faculty satisfied pertaining to formative assessment? SI: Motivational needs STAT: Mean, Std. Dev., Box plot
o IQ2: Which motivational types are engineering faculty most strongly experiencing withregard to formative assessment? SI: Motivation types STAT: Mean, Std. Dev., Box plot
o IQ3: What degree of self-determined motivation are engineering faculty experiencing withregard to formative assessment? SI: Self-determined motivation score STAT: Mean, Std. Dev., Box plot
o IQ4: To what extent do engineering faculty experience affective, behavioral, and cognitiveengagement in formative assessment? SI: Engagement in formative assessment STAT: Mean, Std. Dev., Box plot
Relationship questions:o IQ5: To what degree does satisfaction of self-determination needs lead to self-determined
motivation for formative assessment? SI: Motivational needs, Motivation types STAT: Simple linear regression (multiple runs)
o IQ6: To what degree does self-determined motivation lead to affective, behavioral, andcognitive engagement in formative assessment? SI: Motivation types, Engagement in formative assessment STAT: Simple linear regression (multiple runs)
o IQ7: Do either of these relationships vary with any demographic variables? SI: Motivational needs, Motivation types, Engagement in formative assessment STAT: ANOVA (multiple runs)
o IQ8: Are there any other unexpected relationships between variables or constructs? SI: All variables and constructs STAT: Correlation
The categories, constructs, and variables for the instrument are:
Motivational needs (3)o Autonomy, Competence, Relatednesso Pertaining to formative assessment

133
Motivation types (6)o Amotivation, Extrinsic motivation (broken down into External regulation, Introjected
regulation, Identified regulation, Integrated regulation), Intrinsic motivationo Combined into one self-determined motivation scoreo Pertaining to formative assessment
Engagement in formative assessmento Affective
Interest, Positive emotions, Satisfaction, Anxietyo Behavioral
Choice of behavior, Persistence, Intensity, Intento Cognitive
Concentration, Attention, Memory, Conceptual learning Demographics of participants
o Sex, Race, Academic rank, Institution, Department, Years teaching

134
Appendix D: Final Survey InstrumentPage 1: IRB Notice
INFORMED CONSENT FORM FOR SOCIAL SCIENCE RESEARCHVirginia TechTitle of Project: Motivation for Assessment in Engineering
Principal Investigator: Dr. Richard Goff, Assistant Professor of Engineering Education, Virginia Tech,[email protected] Phone: (540) 231-9537
Co-Investigator: Ken Stanton, PhD Candidate in Engineering Education, Virginia Tech, [email protected]
1. Purpose of the Study: The purpose of this study is to better understand perspectives of engineering faculty towardformative assessment. We expect to improve understanding of how faculty engage in formative assessment and useresults to improve how departments address assessment of student learning. Results will be published in aggregate ina PhD dissertation and possibly in conference or journal articles.
2. Procedures: Participating faculty will complete an online survey consisting of three sections of questions aboutformative assessment. Most questions ask participants to rate statements to indicate agreement.
3. Discomforts and Risks: Possible discomfort may be experienced if questions relate to topics that participants finddifficult to discuss. However, we expect that this occurrence to be highly unlikely due to the general nature of thequestions, as they pertain to professional opinions and activities. There are no risks in participating in this researchbeyond the aforementioned and those experienced in everyday life.
4. Benefits: Participants get to express their opinions and interests regarding formative assessment. Results mayapply to research studies aimed at improving engineering education.
5. Duration: Participants are expected to donate no more than one half hour of their time for the survey.
6. Statement of Confidentiality: Survey data collected will not include names or other personally identifyinginformation beyond demographic the information requested. The online survey system will be used to trackcompletion of the survey by invitees, only. Only investigators listed on the IRB paperwork for this project will haveaccess to the data, which will be deleted no later than 2015.
7. Right to Ask Questions: You may ask questions about this research by contacting Dr. Richard Goff at (540) 231-9537 or [email protected] and Ken Stanton at [email protected]. In addition, you may contact Dr. David Moore,Assistant Vice Provost for Research Compliance at Virginia Tech at (540) 231-4991 for questions about your rightsas a research participant.
8. Compensation: There is no additional compensation offered for participating in the study.
9. Voluntary Participation: Your decision is participate in this research is voluntary. You can stop at any time.
You may print this form for your records and future reference.
-----------------------------------------------------------------------------------------------------------Participant’s Permission
You must be 18 years or older to take part in this research study. Clicking "next" to enter and completion of thissurvey implies that you agree to take part in this research study and accept the information outlined above. If you donot wish to participate, simply close this window.
PAGE 2: Perspectives on Formative Assessment of Student Learning

135
Instructions:
Please complete all questions on this survey, unless it truly does not pertain to you. You will not be personallyidentifiable; your responses are anonymous and will not be available to anyone other than the researchers. Since allquestions are formatted the same way, responses are typically quick and require less than 15 minutes to complete.
Please answer questions by considering your current perspectives, unless asked otherwise. That is, please do notindicate what you think you should do but rather what you currently do.
In this study, formative assessment is considered from your perspective – that is, the things you do and think aboutmeasuring and improving student learning. You are not asked what your students think of assessment or how wellthey are doing. The focus here is on the attempts and efforts you make when teaching engineering classes in fourspecific steps of formative assessment:• Using approaches that are intended/designed to measure student learning• Collecting data from assessments for analysis of student learning• Evaluating the data collected to make inferences about student learning• Applying results of evaluation to improve teaching, student learning, and future assessment efforts
This is different from summative assessment and accreditation in that:• Formative assessment is used to adjust teaching “on the fly” and before summative testing• Summative assessment and accreditation are typically requirements of educators• Formative assessment is often left to the educator to manage
Please provide two example formative assessment techniques that you feel fit the description above (you may useformal names or describe the techniques if you don’t know what they are called):1.2.
PAGE 3: Engagement in Formative Assessment
Remember that this is anonymous and no one will know how you responded to the questions.
The following questions pertain to your engagement in formative assessment. Please indicate how true each of thefollowing statement is for you given your experiences doing assessment or your plans to do assessment. If you arenot currently using and do not plan to use formative assessment, please answer the questions the best you can – youranswers will still be helpful.
Not very true (1) 2 3 Somewhat true (4) 5 6 Very true (7)
1. I enjoy doing formative assessment very much.2. I think that doing formative assessment is useful for improving my teaching.3. I am sometimes anxious while reviewing assessment results.4. I make efforts to find other ways to assess my students.5. I pay attention and respond when assessment results show concern for student learning.6. When I'm evaluating student assessments, I find time goes by really slowly.7. I get a sense of fulfillment from applying assessment results to improve my teaching.8. I intend to learn better ways to apply assessment results to improve my teaching.9. When balancing my teaching duties, formative assessment is an important priority.10. When I come to an assessment issue I can't solve right away, I tend to concentrate on solving it.
PAGE 4: Engagement in Formative Assessment (page 2)
Remember that this is anonymous and no one will know how you responded to the questions.
The following questions pertain to your engagement in formative assessment. Please indicate how true each of thefollowing statement is for you given your experiences doing assessment or your plans to do assessment. If you are

136
not currently using and do not plan to use formative assessment, please answer the questions the best you can – youranswers will still be helpful. (continued)
Not very true (1) 2 3 Somewhat true (4) 5 6 Very true (7)
11. If I can't get students to get a problem right, I just keep trying different things.12. It is important to me that I do a good job assessing my students’ learning.13. When students don’t get what I’m teaching right away, I just move on.14. I feel very tense while giving my students assessments.15. I think that doing formative assessment helps me improve the way I teach engineering.16. I would describe formative assessment as very interesting.17. I intend to continue using formative assessment in my teaching.18. I would do more assessment in my classes, but time doesn’t permit it.19. If I can’t find the right technique to use, I just skip the assessment.20. I would be willing to increase my use of formative assessment because it has value to me.
PAGE 5: Engagement in Formative Assessment (page 3)
Remember that this is anonymous and no one will know how you responded to the questions.
The following questions pertain to your engagement in formative assessment. Please indicate how true each of thefollowing statement is for you given your experiences doing assessment or your plans to do assessment. If you arenot currently using and do not plan to use formative assessment, please answer the questions the best you can – youranswers will still be helpful. (continued)
Not very true (1) 2 3 Somewhat true (4) 5 6 Very true (7)
21. I rarely prioritize assessment when planning my time.22. I do not feel nervous at all while assessing my students.23. I think formative assessment is a boring activity.24. I think measuring student learning is an important activity.25. I try hard to make my assessments effective.26. It is satisfying to use formative assessment to improve my teaching.27. I make time to review formative assessment data from my students.28. It is my intent to collect data from formative assessments in the future.29. When I have a hard time getting my class to learn something, I try other approaches.30. I think formative assessment is important to do because it can help students learn better.
PAGE 6: Engagement in Formative Assessment (page 4)
Remember that this is anonymous and no one will know how you responded to the questions.
The following questions pertain to your engagement in formative assessment. Please indicate how true each of thefollowing statement is for you given your experiences doing assessment or your plans to do assessment. If you arenot currently using and do not plan to use formative assessment, please answer the questions the best you can – youranswers will still be helpful. (continued)
Not very true (1) 2 3 Somewhat true (4) 5 6 Very true (7)
31. While I am doing formative assessment, I think about how much I enjoy it.32. I am very relaxed when it comes to assessing student learning.33. I believe doing formative assessment is beneficial to me and my goals.34. I get a feeling of satisfaction just from trying to assess and improve my students’ learning.35. Doing formative assessment does not hold my attention at all.36. If assessments show students aren’t learning, I keep working at it.37. I try very hard to use assessments whenever possible.38. I believe formative assessment could be of some value to me.39. I put a lot of effort into assessing my students.40. I intend to learn more ways to assess my students’ learning.

137
41. I find myself choosing to do assessment over other teaching tasks.
PAGE 7: Perspectives on Formative Assessment
Remember that this is anonymous and no one will know how you responded to the questions.
There are a variety of reasons why people might use formative assessment. Please indicate how true each of thesereasons is for you.
I use formative assessment...:Not very true (1) 2 3 Somewhat true (4) 5 6 Very true (7)
1. because I would feel bad about myself if I did not.2. because others would be disappointed with me if I did not.3. because I enjoy assessing my students’ learning.4. because I would feel like a failure if I did not.5. because it's important to me to try to better teach topics that students are not learning well.6. because people might think I’m not a caring person if I didn’t do it.7. because I feel like I have no choice about doing formative assessment; others make me do it.8. because I like the challenge of it.9. because I believe using formative assessment helps me teach better.10. because it's fun.11. because I worry that I would get in trouble if I did not.12. because it feels important to me personally to improve how my students are learning.13. because I feel guilty if I do not do something to test my students’ learning.14. because I want others to see I’m doing what I’ve been told to do.15. because it’s interesting to do.16. because improving student learning is an important value for me.
PAGE 8: When I assess my students
Remember that this is anonymous and no one will know how you responded to the questions.
The following questions concern your feelings about your formative assessment efforts or your plans to useformative assessment, as well as your connection with other educators you know who assess their students’ learning.If you are not currently using and do not plan to use formative assessment, please answer the questions the best youcan – your answers will still be helpful.
Not very true (1) 2 3 Somewhat true (4) 5 6 Very true (7)
1. I have learned the essential skills needed to assess student learning.2. I would like to share assessment results with other educators.3. There is not much opportunity for me to decide for myself how to go about assessing my students.4. I have reason to believe I do a good job at assessment.5. I feel formative assessment is valued by my colleagues.6. I am able to choose assessment methods based on my own goals for teaching and learning.7. I do not feel very competent when trying to assess my students’ learning.8. I am free to express my ideas and opinions on how assessment should be done.9. I feel formative assessment keeps me in touch with my students and their education.10. Most times, I feel I’m effective at assessing my students’ learning.11. If it came up, I would be willing to share both positive and negative assessment results with other educators.12. When it comes to assessment, I get opportunities to show how capable I am.13. I believe people at work would appreciate me for my assessment efforts.14. I feel pressured to do assessment.15. When I think about assessment, I often do not feel very capable.16. Amongst other educators, I feel like doing assessment is important to fit in.17. I feel like I have a lot of control in deciding how I assess my students’ learning.

138
18. I feel that my assessment efforts alienate me from other educators.19. When it comes to assessment, I have to do what I am told.20. I feel like I can pretty much be myself when assessing my students.
PAGE 9: Demographics
Please tell us a little about your background (* = required):
Sex:MaleFemale
Ethnicity:African-AmericanAsian-AmericanCaucasianForeign NationalHispanicNative AmericanOther (please specify)
My primary college or university is:[List of schools]
The undergraduate engineering discipline I primarily teach in is:AerospaceArchitecturalBiological and AgriculturalBiomedicalChemicalCivilCivil/EnvironmentalComputer ScienceElectrical/ComputerEng. Science & Eng. PhysicsEngineering (general)Engineering ManagementEnvironmentalIndustrial/ManufacturingMechanicalMetallurgical & MaterialsMiningNuclearPetroleumOther (please specify)
Number of classes I have taught (total, graduate and undergraduate):0 - 56 - 1011 - 1516+
Academic Rank:Part-time instructor / adjunctFull-time, non-tenure track instructor / professorResearch professor

139
Assistant professor (tenure track)Associate professorFull professorOther (only if very different from above)
PAGE 10: Closing
Thank you for taking the time to fill out our survey. We rely on your feedback to help us improve engineeringeducation. Your input is greatly appreciated.
Please direct any comments or questions to Ken Stanton ([email protected]) and Dr. Richard Goff ([email protected]).
In the space that follows, you may provide any feedback you wish to share with the researchers regarding formativeassessment, the quality or clarity of the survey, or the study in general:

140
Appendix E: Survey Instrument with Final Constitution of Construct Items,for use in Future Studies
NOTICE: Use of this survey instrument is permissible for academic studies at no chargeunder the condition that this paper is cited in the work. Those wishing to use thisinstrument for commercial purposes should contact the author at [email protected].
PAGE 1: Engagement in Formative Assessment
Instructions:
Please complete all questions on this survey, unless it truly does not pertain to you. You will not be personallyidentifiable; your responses are anonymous and will not be available to anyone other than the researchers. Since allquestions are formatted the same way, responses are typically quick and require less than 15 minutes to complete.
Please answer questions by considering your current perspectives, unless asked otherwise. That is, please do notindicate what you think you should do but rather what you currently do.
In this study, formative assessment is considered from your perspective – that is, the things you do and think aboutmeasuring and improving student learning. You are not asked what your students think of assessment or how wellthey are doing. The focus here is on the attempts and efforts you make when teaching engineering classes in fourspecific steps of formative assessment:• Using approaches that are intended/designed to measure student learning• Collecting data from assessments for analysis of student learning• Evaluating the data collected to make inferences about student learning• Applying results of evaluation to improve teaching, student learning, and future assessment efforts
This is different from summative assessment and accreditation in that:• Formative assessment is used to adjust teaching “on the fly” and before summative testing• Summative assessment and accreditation are typically requirements of educators• Formative assessment is often left to the educator to manage
Please provide two example formative assessment techniques that you feel fit the description above (you may useformal names or describe the techniques if you don’t know what they are called):1.2.
PAGE 2: Engagement in Formative Assessment
Remember that this is anonymous and no one will know how you responded to the questions.
The following questions pertain to your engagement in formative assessment. Please indicate how true each of thefollowing statement is for you given your experiences doing assessment or your plans to do assessment. If you arenot currently using and do not plan to use formative assessment, please answer the questions the best you can – youranswers will still be helpful.
Not very true (1) 2 3 Somewhat true (4) 5 6 Very true (7)
1. I enjoy doing formative assessment very much.2. I think that doing formative assessment is useful for improving my teaching.3. I am sometimes anxious while reviewing assessment results.4. I find myself choosing to do assessment over other teaching tasks.5. I pay attention and respond when assessment results show concern for student learning.
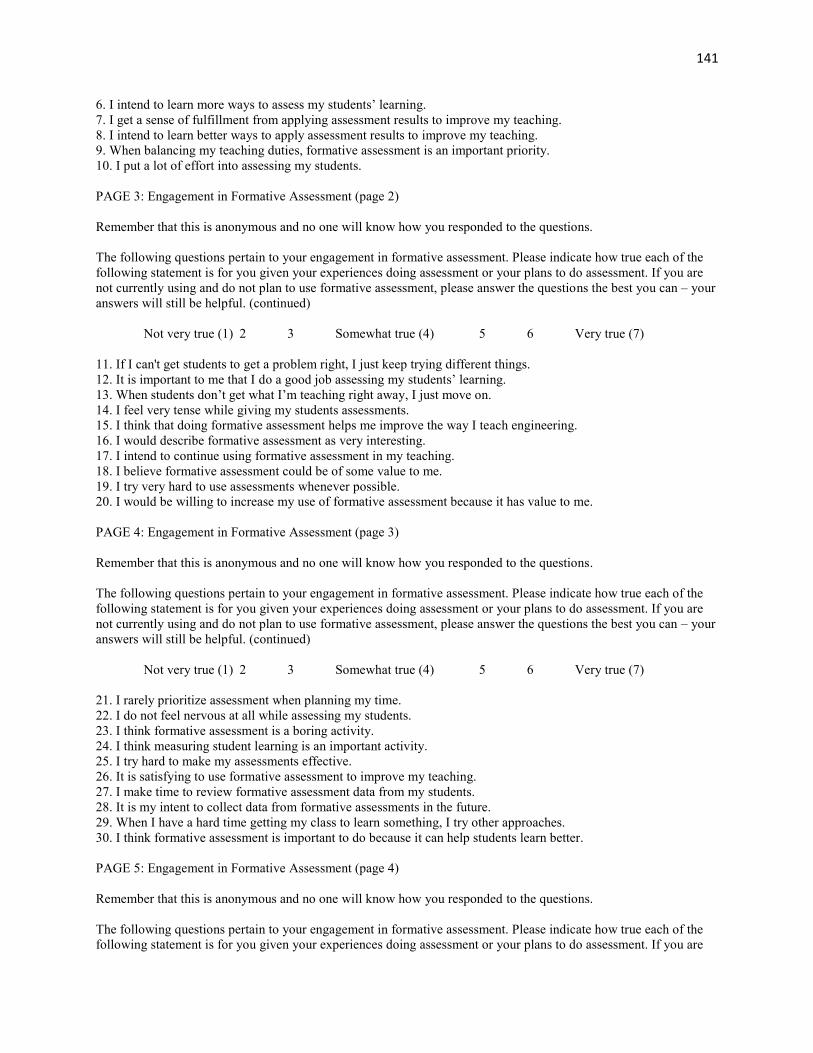
141
6. I intend to learn more ways to assess my students’ learning.7. I get a sense of fulfillment from applying assessment results to improve my teaching.8. I intend to learn better ways to apply assessment results to improve my teaching.9. When balancing my teaching duties, formative assessment is an important priority.10. I put a lot of effort into assessing my students.
PAGE 3: Engagement in Formative Assessment (page 2)
Remember that this is anonymous and no one will know how you responded to the questions.
The following questions pertain to your engagement in formative assessment. Please indicate how true each of thefollowing statement is for you given your experiences doing assessment or your plans to do assessment. If you arenot currently using and do not plan to use formative assessment, please answer the questions the best you can – youranswers will still be helpful. (continued)
Not very true (1) 2 3 Somewhat true (4) 5 6 Very true (7)
11. If I can't get students to get a problem right, I just keep trying different things.12. It is important to me that I do a good job assessing my students’ learning.13. When students don’t get what I’m teaching right away, I just move on.14. I feel very tense while giving my students assessments.15. I think that doing formative assessment helps me improve the way I teach engineering.16. I would describe formative assessment as very interesting.17. I intend to continue using formative assessment in my teaching.18. I believe formative assessment could be of some value to me.19. I try very hard to use assessments whenever possible.20. I would be willing to increase my use of formative assessment because it has value to me.
PAGE 4: Engagement in Formative Assessment (page 3)
Remember that this is anonymous and no one will know how you responded to the questions.
The following questions pertain to your engagement in formative assessment. Please indicate how true each of thefollowing statement is for you given your experiences doing assessment or your plans to do assessment. If you arenot currently using and do not plan to use formative assessment, please answer the questions the best you can – youranswers will still be helpful. (continued)
Not very true (1) 2 3 Somewhat true (4) 5 6 Very true (7)
21. I rarely prioritize assessment when planning my time.22. I do not feel nervous at all while assessing my students.23. I think formative assessment is a boring activity.24. I think measuring student learning is an important activity.25. I try hard to make my assessments effective.26. It is satisfying to use formative assessment to improve my teaching.27. I make time to review formative assessment data from my students.28. It is my intent to collect data from formative assessments in the future.29. When I have a hard time getting my class to learn something, I try other approaches.30. I think formative assessment is important to do because it can help students learn better.
PAGE 5: Engagement in Formative Assessment (page 4)
Remember that this is anonymous and no one will know how you responded to the questions.
The following questions pertain to your engagement in formative assessment. Please indicate how true each of thefollowing statement is for you given your experiences doing assessment or your plans to do assessment. If you are

142
not currently using and do not plan to use formative assessment, please answer the questions the best you can – youranswers will still be helpful. (continued)
Not very true (1) 2 3 Somewhat true (4) 5 6 Very true (7)
31. While I am doing formative assessment, I think about how much I enjoy it.32. I am very relaxed when it comes to assessing student learning.33. I believe doing formative assessment is beneficial to my goals and me.34. I get a feeling of satisfaction just from trying to assess and improve my students’ learning.35. If assessments show students aren’t learning, I keep working at it.
Construct Key:
Construct: Final construct items;construct score is average
Interest/Enjoyment 1, 16, 23(R), 31Value/Usefulness 2, 15, 18, 20, 24, 30, 33Satisfaction 7, 26, 34Anxiety 3, 14, 22(R), 32(R)Choice of Behavior 4, 9, 21(R), 27Persistence 5, 11, 13, 29, 35Effort/Importance 10, 12, 19, 25Intent 6, 8, 17, 28
PAGE 6: Perspectives on Formative Assessment
Remember that this is anonymous and no one will know how you responded to the questions.
There are a variety of reasons why people might use formative assessment. Please indicate how true each of thesereasons is for you.
I use formative assessment...:
Not very true (1) 2 3 Somewhat true (4) 5 6 Very true (7)
1. because I would feel bad about myself if I did not.2. because others would be disappointed with me if I did not.3. because I enjoy assessing my students’ learning.4. because I would feel like a failure if I did not.5. because it's important to me to try to better teach topics that students are not learning well.6. because people might think I’m not a caring person if I didn’t do it.7. because I feel like I have no choice about doing formative assessment; others make me do it.8. because I like the challenge of it.9. because I believe using formative assessment helps me teach better.10. because it's fun.11. because I worry that I would get in trouble if I did not.12. because it feels important to me personally to improve how my students are learning.13. because I feel guilty if I do not do something to test my students’ learning.14. because I want others to see I’m doing what I’ve been told to do.15. because it’s interesting to do.16. because improving student learning is an important value for me.
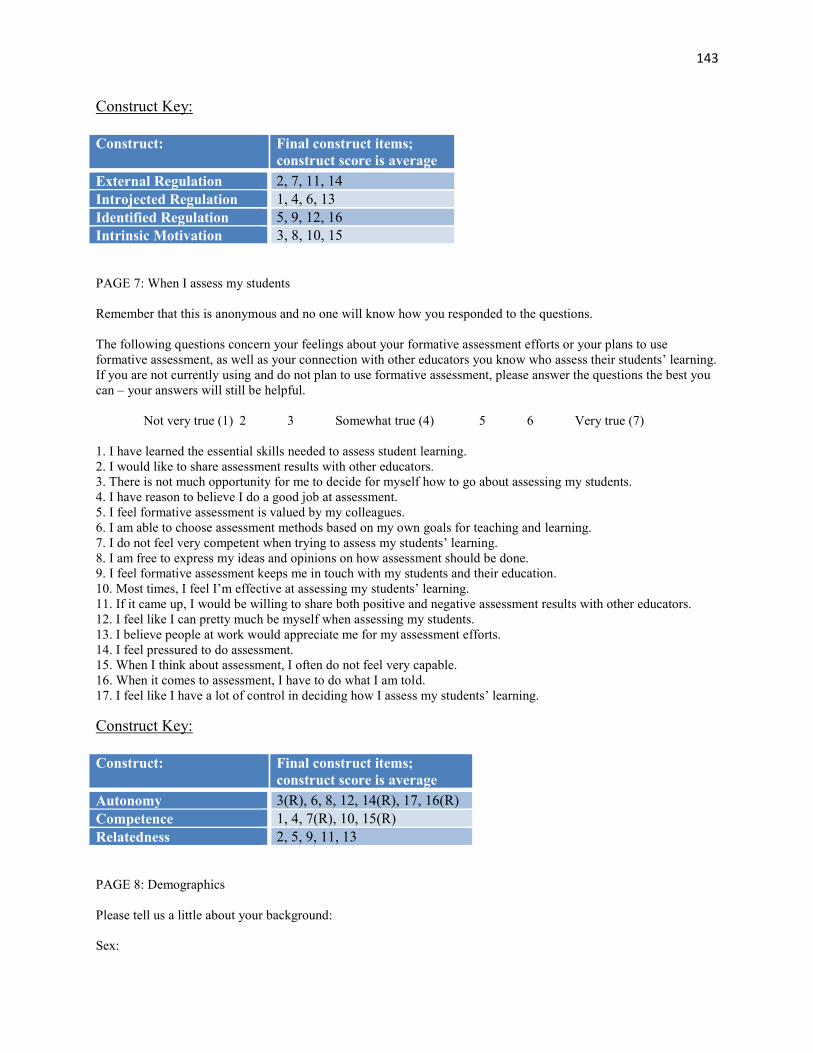
143
Construct Key:
Construct: Final construct items;construct score is average
External Regulation 2, 7, 11, 14Introjected Regulation 1, 4, 6, 13Identified Regulation 5, 9, 12, 16Intrinsic Motivation 3, 8, 10, 15
PAGE 7: When I assess my students
Remember that this is anonymous and no one will know how you responded to the questions.
The following questions concern your feelings about your formative assessment efforts or your plans to useformative assessment, as well as your connection with other educators you know who assess their students’ learning.If you are not currently using and do not plan to use formative assessment, please answer the questions the best youcan – your answers will still be helpful.
Not very true (1) 2 3 Somewhat true (4) 5 6 Very true (7)
1. I have learned the essential skills needed to assess student learning.2. I would like to share assessment results with other educators.3. There is not much opportunity for me to decide for myself how to go about assessing my students.4. I have reason to believe I do a good job at assessment.5. I feel formative assessment is valued by my colleagues.6. I am able to choose assessment methods based on my own goals for teaching and learning.7. I do not feel very competent when trying to assess my students’ learning.8. I am free to express my ideas and opinions on how assessment should be done.9. I feel formative assessment keeps me in touch with my students and their education.10. Most times, I feel I’m effective at assessing my students’ learning.11. If it came up, I would be willing to share both positive and negative assessment results with other educators.12. I feel like I can pretty much be myself when assessing my students.13. I believe people at work would appreciate me for my assessment efforts.14. I feel pressured to do assessment.15. When I think about assessment, I often do not feel very capable.16. When it comes to assessment, I have to do what I am told.17. I feel like I have a lot of control in deciding how I assess my students’ learning.
Construct Key:
Construct: Final construct items;construct score is average
Autonomy 3(R), 6, 8, 12, 14(R), 17, 16(R)Competence 1, 4, 7(R), 10, 15(R)Relatedness 2, 5, 9, 11, 13
PAGE 8: Demographics
Please tell us a little about your background:
Sex:

144
MaleFemale
Ethnicity:African-AmericanAsian-AmericanCaucasianForeign NationalHispanicNative AmericanOther (please specify)
My primary college or university is:[List of schools]
The undergraduate engineering discipline I primarily teach in is:AerospaceArchitecturalBiological and AgriculturalBiomedicalChemicalCivilCivil/EnvironmentalComputer ScienceElectrical/ComputerEng. Science & Eng. PhysicsEngineering (general)Engineering ManagementEnvironmentalIndustrial/ManufacturingMechanicalMetallurgical & MaterialsMiningNuclearPetroleumOther (please specify)
Number of classes I have taught (total, graduate and undergraduate):0 - 56 - 1011 - 1516+
Academic Rank:Part-time instructor / adjunctFull-time, non-tenure track instructor / professorResearch professorAssistant professor (tenure track)Associate professorFull professorOther (only if very different from above)
PAGE 9: Closing
Thank you for taking the time to fill out our survey. We rely on your feedback to help us improve engineeringeducation. Your input is greatly appreciated.

145
Please direct any comments or questions to [study PI(s) and email addresses].
In the space that follows, you may provide any feedback you wish to share with the researchers regarding formativeassessment, the quality or clarity of the survey, or the study in general:
_____________________________________________________________________________

146
Appendix F: Additional Data from Analysis of Regression AssumptionsTable F.1: Residuals from regression analyses
Residuals of regression from autonomy, competence, andrelatedness to composite self-determination score (RAI).
Residuals of regression from autonomy, competence, andrelatedness to external regulation.
Residuals of regression from autonomy, competence, andrelatedness to introjected regulation.
Residuals of regression from autonomy, competence, andrelatedness to identified regulation.
Residuals of regression from autonomy, competence, andrelatedness to intrinsic motivation.

147
Residuals of regression from composite self-determinedmotivation score (RAI) to interest/enjoyment.
Residuals of regression from composite self-determinedmotivation score (RAI) to value/usefulness.
Residuals of regression from composite self-determinedmotivation score (RAI) to satisfaction.
Residuals of regression from composite self-determinedmotivation score (RAI) to anxiety.
Residuals of regression from composite self-determinedmotivation score (RAI) to choice of behavior.
Residuals of regression from composite self-determinedmotivation score (RAI) to persistence.

148
Residuals of regression from composite self-determinedmotivation score (RAI) to effort/importance.
Residuals of regression from composite self-determinedmotivation score (RAI) to intent.
Residuals of regression from intrinsic motivation tointerest/enjoyment.
Residuals of regression from intrinsic motivation tovalue/usefulness.
Residuals of regression from intrinsic motivation tosatisfaction.
Residuals of regression from intrinsic motivation to anxiety.

149
Residuals of regression from intrinsic motivation to choice ofbehavior.
Residuals of regression from intrinsic motivation topersistence.
Residuals of regression from intrinsic motivation toeffort/importance.
Residuals of regression from intrinsic motivation to intent.
Residuals of regression from identified regulation tointerest/enjoyment.
Residuals of regression from identified regulation tovalue/usefulness.

150
Residuals of regression from identified regulation tosatisfaction.
Residuals of regression from identified regulation to anxiety.
Residuals of regression from identified regulation to choice ofbehavior.
Residuals of regression from identified regulation topersistence.
Residuals of regression from identified regulation toeffort/importance.
Residuals of regression from identified regulation to intent.
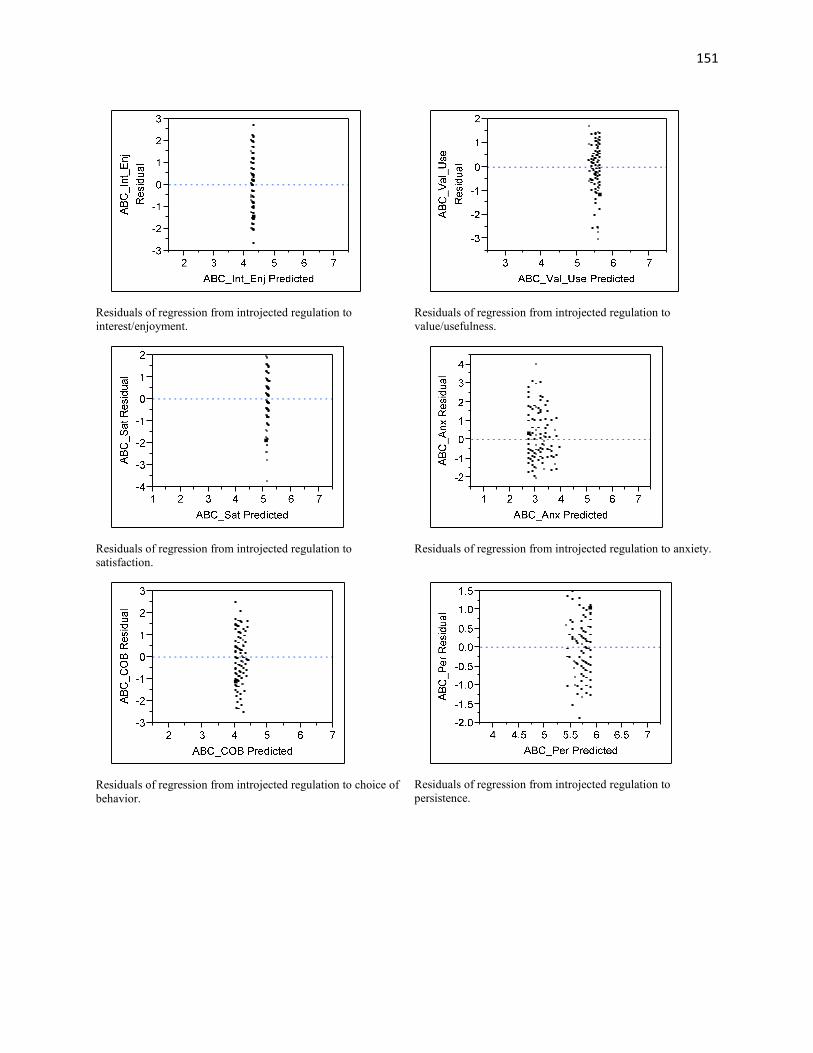
151
Residuals of regression from introjected regulation tointerest/enjoyment.
Residuals of regression from introjected regulation tovalue/usefulness.
Residuals of regression from introjected regulation tosatisfaction.
Residuals of regression from introjected regulation to anxiety.
Residuals of regression from introjected regulation to choice ofbehavior.
Residuals of regression from introjected regulation topersistence.

152
Residuals of regression from introjected regulation toeffort/importance.
Residuals of regression from introjected regulation to intent.
Residuals of regression from external regulation tointerest/enjoyment.
Residuals of regression from introjected regulation tovalue/usefulness.
Residuals of regression from introjected regulation tosatisfaction.
Residuals of regression from introjected regulation to anxiety.

153
Residuals of regression from introjected regulation to choice ofbehavior.
Residuals of regression from introjected regulation topersistence.
Residuals of regression from introjected regulation toeffort/importance.
Residuals of regression from introjected regulation to intent.

154
Appendix G: Individual Survey Item Average Scores
In the item reference column, the question number and section that it came from is given.
For example, “Needs #1” is the first question in the section of the survey that asked about
satisfaction of motivational needs. In the same manner, “motivation” refers to questions about
the motivation type, and “engagement” about engagement in formative assessment.
Item Reference: Item Content: Mean: Std Dev:Needs #1 I have learned the essential skills needed to assess student
learning.4.11 1.52
Needs #2 I would like to share assessment results with othereducators.
3.93 1.75
Needs #3 There is not much opportunity for me to decide for myselfhow to go about assessing my students.
2.27 1.49
Needs #4 I have reason to believe I do a good job at assessment. 4.49 1.27Needs #5 I feel formative assessment is valued by my colleagues. 3.68 1.70Needs #6 I am able to choose assessment methods based on my own
goals for teaching and learning.5.64 1.33
Needs #7 I do not feel very competent when trying to assess mystudents’ learning.
3.00 1.61
Needs #8 I am free to express my ideas and opinions on howassessment should be done.
5.66 1.34
Needs #9 I feel formative assessment keeps me in touch with mystudents and their education.
5.56 1.16
Needs #10 Most times, I feel I’m effective at assessing my students’learning.
4.95 1.21
Needs #11 If it came up, I would be willing to share both positive andnegative assessment results with other educators.
5.50 1.39
Needs #12 When it comes to assessment, I get opportunities to showhow capable I am.
3.48 1.71
Needs #13 I believe people at work would appreciate me for myassessment efforts.
3.27 1.69
Needs #14 I feel pressured to do assessment. 2.16 1.51Needs #15 When I think about assessment, I often do not feel very
capable.2.67 1.56
Needs #16 Amongst other educators, I feel like doing assessment isimportant to fit in.
2.50 1.61
Needs #17 I feel like I have a lot of control in deciding how I assessmy students’ learning.
5.96 1.12
Needs #18 I feel that my assessment efforts alienate me from othereducators.
1.73 1.28
Needs #19 When it comes to assessment, I have to do what I am told. 2.01 1.53Needs #20 I feel like I can pretty much be myself when assessing my
students.5.69 1.28
Motivation #1 because I would feel bad about myself if I did not. 2.32 1.55

155
Item Reference: Item Content: Mean: Std Dev:Motivation #2 because others would be disappointed with me if I did not. 2.05 1.25Motivation #3 because I enjoy assessing my students’ learning. 4.23 1.70Motivation #4 because I would feel like a failure if I did not. 2.23 1.44Motivation #5 because it's important to me to try to better teach topics that
students are not learning well.5.92 0.99
Motivation #6 because people might think I’m not a caring person if I didn’tdo it.
2.01 1.30
Motivation #7 because I feel like I have no choice about doing formativeassessment; others make me do it.
1.82 1.39
Motivation #8 because I like the challenge of it. 3.50 1.91Motivation #9 because I believe using formative assessment helps me teach
better.5.56 1.43
Motivation #10 because it's fun. 3.06 1.71Motivation #11 because I worry that I would get in trouble if I did not. 1.69 1.11Motivation #12 because it feels important to me personally to improve how
my students are learning.5.75 1.28
Motivation #13 because I feel guilty if I do not do something to test mystudents’ learning.
2.51 1.45
Motivation #14 because I want others to see I’m doing what I’ve been told todo.
1.69 1.22
Motivation #15 because it’s interesting to do. 3.81 1.78Motivation #16 because improving student learning is an important value for
me.6.06 1.00
Engagement #1 I enjoy doing formative assessment very much. 4.76 1.52Engagement #2 I think that doing formative assessment is useful for
improving my teaching.5.79 1.11
Engagement #3 I am sometimes anxious while reviewing assessment results. 3.70 1.81Engagement #4 I make efforts to find other ways to assess my students. 4.73 1.47Engagement #5 I pay attention and respond when assessment results show
concern for student learning.5.99 0.91
Engagement #6 When I'm evaluating student assessments, I find time goes byreally slowly
4.89 1.76
Engagement #7 I get a sense of fulfillment from applying assessment resultsto improve my teaching.
5.32 1.20
Engagement #8 I intend to learn better ways to apply assessment results toimprove my teaching.
5.03 1.43
Engagement #9 When balancing my teaching duties, formative assessmentis an important priority.
4.56 1.54
Engagement #10 When I come to an assessment issue I can't solve right away,I tend to concentrate on solving it.
3.59 1.52
Engagement #11 If I can't get students to get a problem right, I just keep tryingdifferent things.
5.18 1.16
Engagement #12 It is important to me that I do a good job assessing mystudents’ learning.
5.59 1.07
Engagement #13 When students don’t get what I’m teaching right away, I justmove on.
2.14 1.04
Engagement #14 I feel very tense while giving my students assessments. 2.24 1.31Engagement #15 I think that doing formative assessment helps me improve the
way I teach engineering.5.39 1.24
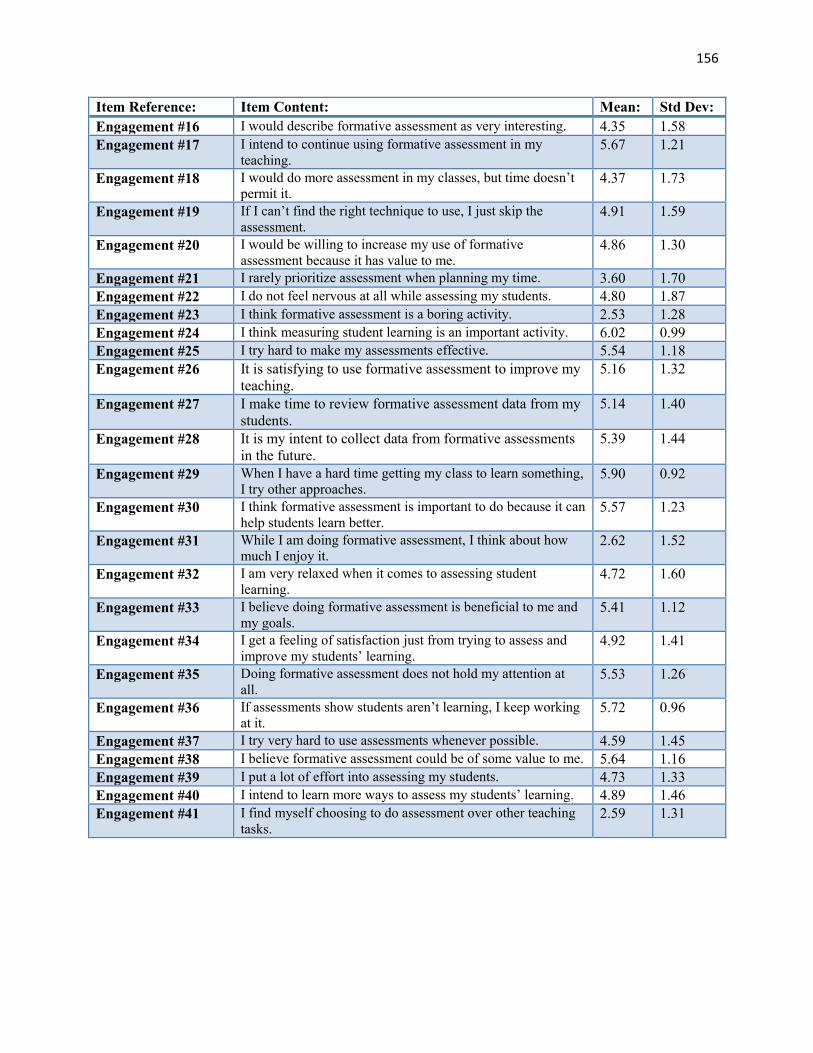
156
Item Reference: Item Content: Mean: Std Dev:Engagement #16 I would describe formative assessment as very interesting. 4.35 1.58Engagement #17 I intend to continue using formative assessment in my
teaching.5.67 1.21
Engagement #18 I would do more assessment in my classes, but time doesn’tpermit it.
4.37 1.73
Engagement #19 If I can’t find the right technique to use, I just skip theassessment.
4.91 1.59
Engagement #20 I would be willing to increase my use of formativeassessment because it has value to me.
4.86 1.30
Engagement #21 I rarely prioritize assessment when planning my time. 3.60 1.70Engagement #22 I do not feel nervous at all while assessing my students. 4.80 1.87Engagement #23 I think formative assessment is a boring activity. 2.53 1.28Engagement #24 I think measuring student learning is an important activity. 6.02 0.99Engagement #25 I try hard to make my assessments effective. 5.54 1.18Engagement #26 It is satisfying to use formative assessment to improve my
teaching.5.16 1.32
Engagement #27 I make time to review formative assessment data from mystudents.
5.14 1.40
Engagement #28 It is my intent to collect data from formative assessmentsin the future.
5.39 1.44
Engagement #29 When I have a hard time getting my class to learn something,I try other approaches.
5.90 0.92
Engagement #30 I think formative assessment is important to do because it canhelp students learn better.
5.57 1.23
Engagement #31 While I am doing formative assessment, I think about howmuch I enjoy it.
2.62 1.52
Engagement #32 I am very relaxed when it comes to assessing studentlearning.
4.72 1.60
Engagement #33 I believe doing formative assessment is beneficial to me andmy goals.
5.41 1.12
Engagement #34 I get a feeling of satisfaction just from trying to assess andimprove my students’ learning.
4.92 1.41
Engagement #35 Doing formative assessment does not hold my attention atall.
5.53 1.26
Engagement #36 If assessments show students aren’t learning, I keep workingat it.
5.72 0.96
Engagement #37 I try very hard to use assessments whenever possible. 4.59 1.45Engagement #38 I believe formative assessment could be of some value to me. 5.64 1.16Engagement #39 I put a lot of effort into assessing my students. 4.73 1.33Engagement #40 I intend to learn more ways to assess my students’ learning. 4.89 1.46Engagement #41 I find myself choosing to do assessment over other teaching
tasks.2.59 1.31

157
Appendix H: IRB Permission Letter