Embed Size (px)
Citation preview
Engineering DNA nanostructures for siRNAdelivery in plantsHuan Zhang 1,5, Honglu Zhang2,5, Gozde S. Demirer 1, Eduardo González-Grandío 1,Chunhai Fan3 and Markita P. Landry 1,2,4✉
Targeted downregulation of select endogenous plant genes is known to confer disease or pest resistance in crops and isroutinely accomplished via transgenic modification of plants for constitutive gene silencing. An attractive alternative tothe use of transgenics or pesticides in agriculture is the use of a ‘green’ alternative known as RNAi, which involves thedelivery of siRNAs that downregulate endogenous genes to confer resistance. However, siRNA is a molecule that is highlysusceptible to enzymatic degradation and is difficult to deliver across the lignin-rich and multi-layered plant cell wall thatposes the dominant physical barrier to biomolecule delivery in plants. We have demonstrated that DNA nanostructurescan be utilized as a cargo carrier for direct siRNA delivery and gene silencing in mature plants. The size, shape,compactness and stiffness of the DNA nanostructure affect both internalization into plant cells and subsequent genesilencing efficiency. Herein, we provide a detailed protocol that can be readily adopted with standard biology benchtopequipment to generate geometrically optimized DNA nanostructures for transgene-free and force-independent siRNAdelivery and gene silencing in mature plants. We further discuss how such DNA nanostructures can be rationally designedto efficiently enter plant cells and deliver cargoes to mature plants, and provide guidance for DNA nanostructurecharacterization, storage and use. The protocol described herein can be completed in 4 d.
Introduction
RNAi is sequence-specific catalytic inhibition of gene expression at the messenger RNA (mRNA)level, which was first observed in petunia plants in 1990 (ref. 1), and has since been shown to bepresent in all eukaryotic organisms2,3. RNAi, especially through the post-transcriptional gene silen-cing (PTGS) pathway, is a powerful tool in plant biotechnology research and practice as it (i) enableshigh-throughput plant genotype–phenotype mapping, (ii) can be used for rapid discovery of plantbiosynthetic pathways for pharmaceutical synthesis and lastly (iii) is a green alternative to chemicalpesticides as it can confer crop resistance to insects, bacteria, fungi and diverse plant viruses.
However, current biomolecule delivery tools to plants have certain limitations that prevent RNAifrom reaching its full potential in plants. Delivery challenges to plants mostly stem from the rigid andmultilayered plant cell wall with a strict size exclusion limit of ~5–20 nm (refs. 4,5). Therefore, fewdelivery tools exist that can transfer biomolecules into plant cells, each with considerable drawbacksthat either limit the range of transformable species (Agrobacterium) or exhibit low transformationefficiencies (biolistics). A common RNAi cargo for plant gene silencing is siRNA, and it is typicallydelivered to plants via agroinfiltration of viral vectors6–8. This method results in strong expression ofsiRNA, but siRNA needs to be coded as DNA in the viral vector. Additionally, due to the use ofpathogenic Agrobacterium, this method is useful for a limited range of plant species and has beenreported to silence off-target genes in some studies9,10. Importantly, the use of Agrobacterium forsiRNA delivery triggers public and regulatory concern as it creates genetically modified organisms.
Nanomaterials can offer solutions to plant biomolecule delivery challenges given their small sizeand tunable physical, chemical and mechanical properties. Previously, polymeric nanoparticles havebeen used to deliver siRNA into tobacco protoplasts, which are plant cells with removed cell walls11.This early study demonstrates the potential of nanomaterials in plant systems for RNAi, however, forfield applications of RNAi, delivery of siRNA will need to be accomplished in intact plant systems.Another notable study has shown passive delivery of pathogen-specific double-stranded RNA with
1Department of Chemical and Biomolecular Engineering, University of California Berkeley, Berkeley, CA, USA. 2California Institute for QuantitativeBiosciences (QB3), University of California Berkeley, Berkeley, CA, USA. 3School of Chemistry and Chemical Engineering, and Institute of MolecularMedicine, Renji Hospital, School of Medicine, Shanghai Jiao Tong University, Shanghai, China. 4Chan-Zuckerberg Biohub, San Francisco, CA, USA.5These authors contributed equally: Huan Zhang, Honglu Zhang. ✉e-mail: [email protected]
NATURE PROTOCOLS |www.nature.com/nprot 1
PROTOCOLhttps://doi.org/10.1038/s41596-020-0370-0
1234
5678
90():,;
1234567890():,;
clay nanosheets into intact tobacco leaves for insect resistance applications12, which is a promisinguse of nanoparticles for topical application of RNAi cargoes on plants. Lastly, a recent study hasdemonstrated that single-walled carbon nanotubes (SWNTs) can deliver a different RNAi cargo,siRNA, into intact plant leaves without biolistic force, for silencing of transgenes and disease-relevantendogenous plant genes13.
The emergence of DNA nanotechnology has provided a promising and highly tunable platformwith which to design, synthesize and utilize DNA nanostructures to deliver cargoes to mammaliancells14–19. Herein, we focus on a recent development demonstrating that DNA nanostructures canalso be made to passively bypass the plant cell wall for gene silencing applications. DNA nano-technology leverages the programmability of DNA Watson–Crick base pairing to assemble nanos-tructures into custom predesigned shapes, along with precisely tunable mechanical properties.Although a plethora of different DNA nanostructures of variable sizes and shapes have been syn-thesized and have been utilized in biotechnology for drug, DNA, RNA and protein delivery appli-cations in animal systems16–21, until our work, DNA nanostructures had not been explored fordelivery applications in plant systems despite their utility in other sectors of biotechnology.
In this protocol, we focus on two recent developments in plant bionanotechnology for siRNA-based RNAi applications. First, the unprecedented programmability of nucleic acids can endow DNAnanostructures with prescribed geometrical and mechanical properties22,23, which can be employed asa potential carrier platform for biological cargoes21,24. Second, this advance in DNA nanotechnologyhas enabled the demonstration that DNA nanostructures can force-independently internalize intointact plant cells of many plant species and deliver siRNA for efficient gene silencing. As not allnanostructure physiochemical parameters are conducive to plant cell internalization, we also deter-mined the optimal nanoparticle parameters for maximum plant cell uptake and gene silencing25,which enables the rational design of nanoparticles for previously mentioned RNAi applications inplants.
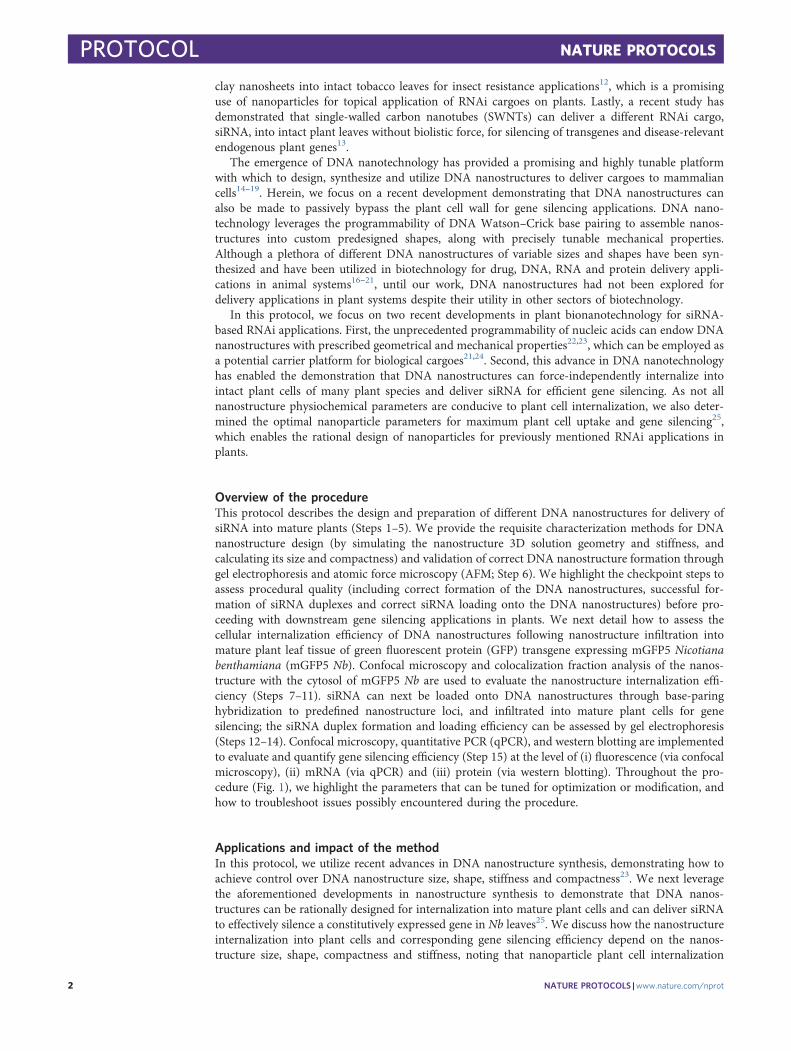
Overview of the procedureThis protocol describes the design and preparation of different DNA nanostructures for delivery ofsiRNA into mature plants (Steps 1–5). We provide the requisite characterization methods for DNAnanostructure design (by simulating the nanostructure 3D solution geometry and stiffness, andcalculating its size and compactness) and validation of correct DNA nanostructure formation throughgel electrophoresis and atomic force microscopy (AFM; Step 6). We highlight the checkpoint steps toassess procedural quality (including correct formation of the DNA nanostructures, successful for-mation of siRNA duplexes and correct siRNA loading onto the DNA nanostructures) before pro-ceeding with downstream gene silencing applications in plants. We next detail how to assess thecellular internalization efficiency of DNA nanostructures following nanostructure infiltration intomature plant leaf tissue of green fluorescent protein (GFP) transgene expressing mGFP5 Nicotianabenthamiana (mGFP5 Nb). Confocal microscopy and colocalization fraction analysis of the nanos-tructure with the cytosol of mGFP5 Nb are used to evaluate the nanostructure internalization effi-ciency (Steps 7–11). siRNA can next be loaded onto DNA nanostructures through base-paringhybridization to predefined nanostructure loci, and infiltrated into mature plant cells for genesilencing; the siRNA duplex formation and loading efficiency can be assessed by gel electrophoresis(Steps 12–14). Confocal microscopy, quantitative PCR (qPCR), and western blotting are implementedto evaluate and quantify gene silencing efficiency (Step 15) at the level of (i) fluorescence (via confocalmicroscopy), (ii) mRNA (via qPCR) and (iii) protein (via western blotting). Throughout the pro-cedure (Fig. 1), we highlight the parameters that can be tuned for optimization or modification, andhow to troubleshoot issues possibly encountered during the procedure.
Applications and impact of the methodIn this protocol, we utilize recent advances in DNA nanostructure synthesis, demonstrating how toachieve control over DNA nanostructure size, shape, stiffness and compactness23. We next leveragethe aforementioned developments in nanostructure synthesis to demonstrate that DNA nanos-tructures can be rationally designed for internalization into mature plant cells and can deliver siRNAto effectively silence a constitutively expressed gene in Nb leaves25. We discuss how the nanostructureinternalization into plant cells and corresponding gene silencing efficiency depend on the nanos-tructure size, shape, compactness and stiffness, noting that nanoparticle plant cell internalization
PROTOCOL NATURE PROTOCOLS
2 NATURE PROTOCOLS |www.nature.com/nprot
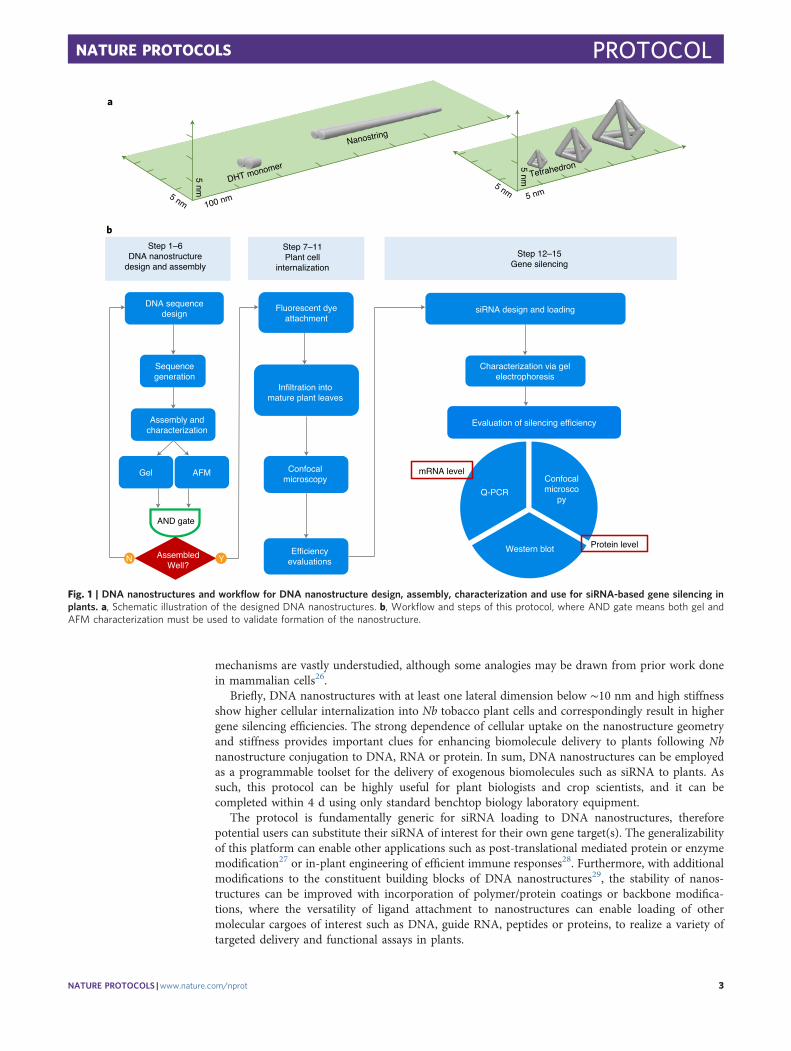
mechanisms are vastly understudied, although some analogies may be drawn from prior work donein mammalian cells26.
Briefly, DNA nanostructures with at least one lateral dimension below ∼10 nm and high stiffnessshow higher cellular internalization into Nb tobacco plant cells and correspondingly result in highergene silencing efficiencies. The strong dependence of cellular uptake on the nanostructure geometryand stiffness provides important clues for enhancing biomolecule delivery to plants following Nbnanostructure conjugation to DNA, RNA or protein. In sum, DNA nanostructures can be employedas a programmable toolset for the delivery of exogenous biomolecules such as siRNA to plants. Assuch, this protocol can be highly useful for plant biologists and crop scientists, and it can becompleted within 4 d using only standard benchtop biology laboratory equipment.
The protocol is fundamentally generic for siRNA loading to DNA nanostructures, thereforepotential users can substitute their siRNA of interest for their own gene target(s). The generalizabilityof this platform can enable other applications such as post-translational mediated protein or enzymemodification27 or in-plant engineering of efficient immune responses28. Furthermore, with additionalmodifications to the constituent building blocks of DNA nanostructures29, the stability of nanos-tructures can be improved with incorporation of polymer/protein coatings or backbone modifica-tions, where the versatility of ligand attachment to nanostructures can enable loading of othermolecular cargoes of interest such as DNA, guide RNA, peptides or proteins, to realize a variety oftargeted delivery and functional assays in plants.
DNA sequencedesign
Sequencegeneration
Assembly andcharacterization
Gel AFM
AND gate
AssembledWell?
N Y
Fluorescent dyeattachment
Confocalmicroscopy
Infiltration intomature plant leaves
siRNA design and loading
Characterization via gelelectrophoresis
Confocalmicrosco
py
Western blot
Q-PCR
mRNA level
Evaluation of silencing efficiency
Protein level
Step 1–6DNA nanostructure
design and assembly
Step 7–11Plant cell
internalization
Step 12–15Gene silencing
5 nm5 nm
5 nm
100 nm5 nm
5 nm
Efficiencyevaluations
a
b
DHT monomer
Nanostring
Tetrahedron
Fig. 1 | DNA nanostructures and workflow for DNA nanostructure design, assembly, characterization and use for siRNA-based gene silencing inplants. a, Schematic illustration of the designed DNA nanostructures. b, Workflow and steps of this protocol, where AND gate means both gel andAFM characterization must be used to validate formation of the nanostructure.
NATURE PROTOCOLS PROTOCOL
NATURE PROTOCOLS |www.nature.com/nprot 3
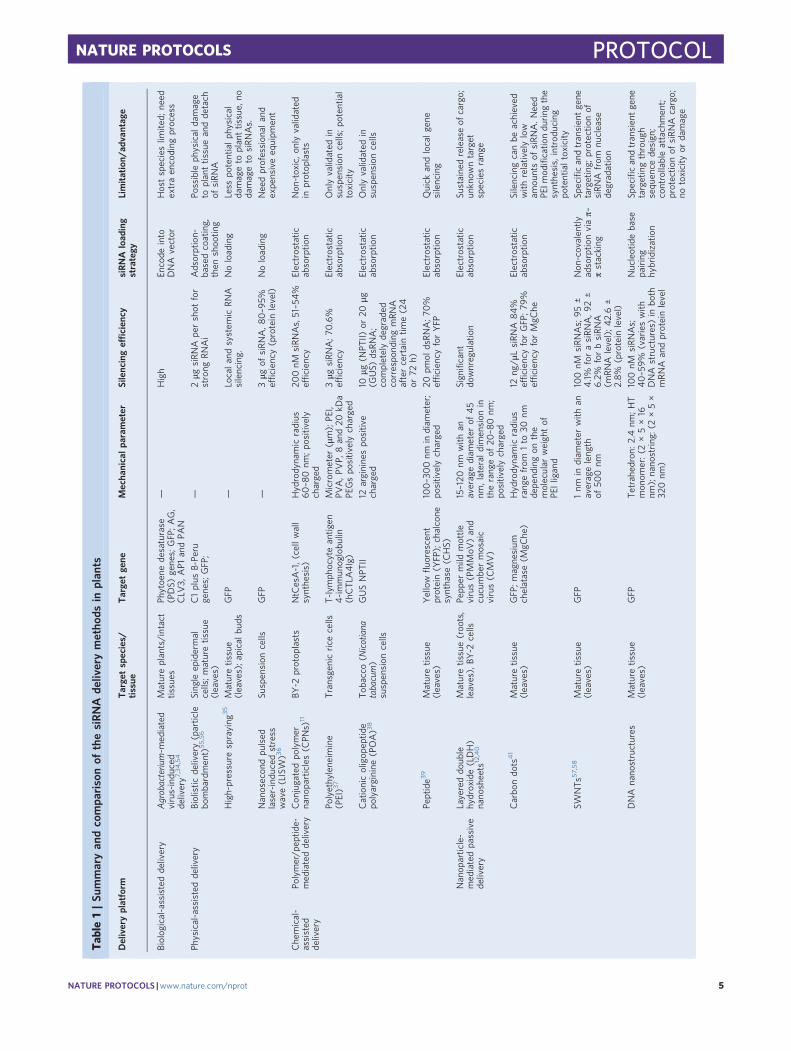
Comparison with other methodsDespite the utility of plant biotechnology, many plant species and tissue types remain difficult toengineer30 and are subject to species- or tissue-dependent optimizations for genetic engineeringprocedures. The challenge of delivering genetic cargoes to plant systems is due mainly to the presenceof a rigid cell wall that has a relatively small (~20 nm) size exclusion limit31, which makes it difficultfor biomolecules such as DNA, RNA or protein to cross unassisted. Among the aforementionedcargoes, siRNAs are a promising tool that can suppress expression of specific genes by triggeringsequence-specific target gene silencing followed by mRNA degradation or translational inhibi-tion32,33. To date, several methods have been established to deliver siRNA into plant protoplasts,intact plant cells, or tissues (Table 1). The conventional biotic method of Agrobacterium-mediateddelivery encodes the RNA into a DNA vector7,34 and thus suffers from host species limitations thatcan also result in off-target effects such as random site integration and endogenous gene disruption.Other methods, which employ external forces (for example, high pressure or laser power), such asbiolistic delivery and high-pressure spraying may cause variable extents of damage35,36.
Nanomaterials have emerged as promising carriers for delivery of genetic cargoes to intact plantcells and tissues. Recently, several studies have reported the use of synthetic polymers or peptides todeliver siRNA into protoplasts11, suspension plant cells37,38 and tissues39. These methods have shownthe possibility of nanoparticle internalization into walled plant cells and have thus shown thatnanomaterials can serve as carriers to deliver functional siRNA cargoes and achieve various genesilencing efficiencies (Table 1). However, the morphology of such polymer-based carriers is difficultto control and manipulate, and their adaptability for use in mature plants is understudied. Recently,several groups have studied other types of nanomaterials, such as clay nanosheets12,40 carbonnanotubes13, and carbon dots41, to deliver siRNA into intact mature tissues (leaves and roots) forgene silencing, some of which have demonstrated better controllability and increased silencing effi-ciency compared with polymeric systems.
The DNA nanostructure-based siRNA delivery platform we present herein enables siRNA deliveryand gene silencing without transgene integration, with high efficiency, and without toxicity or tissuedamage25. The DNA nanostructures described herein can enter plant cells without force, and uptakeis plant species independent. More importantly, the siRNA targeting sequence and attachment locican be easily tuned for various gene targeting applications. This technology is easy, fast, cost-effective,nondestructive and scalable. Additionally, DNA nanostructures protect siRNA against nucleasedegradation inside plant cells, which indicates the possibility to extend this platform to other bio-logical cargoes of interest.
LimitationsThe limitations of this technique include adapting, testing and optimizing nanostructures for use inother plant species and tissues. Variations in nanostructure size, shape, stiffness or compactness maybe required to identify maximal nanostructure internalization upon exposure to different plantspecies and tissues, which may have different morphologies. In such cases, testing several nanos-tructures with variable structural parameters may first be required, before selecting the nanostructureof choice for subsequent gene silencing applications via siRNA delivery. As shown previously for non-plant systems18–20,24, with additional nanostructure modification, it may also be possible to attachdifferent cargoes to nanostructures (DNA, RNA and protein) for delivery to plants. For proteinloading, optimization of the protein conjugation chemistry would be needed. Additionally, loading ofdifferent cargoes may also affect the final properties of nanostructures, in which case systematictesting of several candidate nanostructures may be needed as well. While this protocol demonstratesDNA nanostructure use for gene silencing in mature plant leaves, we recommend that the parameterswe discuss—size, shape and stiffness—can be modified to optimize nanostructures for efficientinternalization and delivery to other plant samples such as embryonic tissue, germline cells and callus.The aforementioned optimizations might be needed for different plant species or tissue samples thatare different in tissue morphology from the plant leaf tissues assayed herein.
Experimental designTo systematically study how the structural and mechanical parameters (size, geometry and stiffness/compactness) of DNA nanostructures impact their internalization into plant cells, a variety of DNAnanostructures with different dimensions and geometries are designed (Supplementary Discussion
PROTOCOL NATURE PROTOCOLS
4 NATURE PROTOCOLS |www.nature.com/nprot
Tab
le1|Su
mmaryan
dcompa
risonof
thesiRNA
deliverymetho
dsin
plan
ts
Deliveryplatform
Targe
tspecies/
tissue
Targe
tge
neMecha
nicalpa
rameter
Silencingefficien
cysiRNA
load
ing
strategy
Limitation/
advantag
e
Biolog
ical-assistedde
livery
Agrobacteriu
m-m
ediated
virus-indu
ced
delivery7
,34,54
Matureplants/intact
tissues
Phytoe
nede
saturase
(PDS)
gene
s;GFP;AG,
CLV
3,AP1
andPA
N
—High
Encode
into
DNA
vector
Hostspecieslim
ited;
need
extraen
coding
process
Physical-assistedde
livery
Biolistic
delivery(partic
lebo
mbardmen
t)55,56
Sing
leep
idermal
cells;maturetissue
(leaves)
C1plus
B‐Pe
rugene
s;GFP;
—2μg
siRNA
pershot
for
strong
RNAi
Adsorption-
basedcoating,
then
shoo
ting
Possible
physical
damage
toplanttissueandde
tach
ofsiRNA
High-pressure
spraying
35
Maturetissue
(leaves);apical
buds
GFP
—Localandsystem
icRNA
silencing.
Noloading
Less
potentialph
ysical
damageto
planttissue,
nodamageto
siRNAs.
Nanosecon
dpu
lsed
laser-indu
cedstress
wave(LISW
)36
Suspen
sion
cells
GFP
—3μg
ofsiRNA,80–9
5%efficien
cy(protein
level)
Noloading
Needprofession
aland
expe
nsiveeq
uipm
ent
Che
mical-
assisted
delivery
Polymer/p
eptid
e-med
iatedde
livery
Con
jugatedpo
lymer
nano
particles(C
PNs)
11BY
-2protop
lasts
NtCesA-1,(cellwall
synthe
sis)
Hydrodynamic
radius
60–8
0nm
;po
sitiv
ely
charged
200nM
siRNAs,51–54%
efficien
cyElectrostatic
absorptio
nNon
-toxic,on
lyvalidated
inprotop
lasts
Polyethylene
imine
(PEI)3
7Transgenicrice
cells
T-lym
phocyteantig
en4-immun
oglobu
lin(hCTLA
4Ig)
Micrometer
(μm);PE
I,PV
A,PV
P,8and20
kDa
PEGspo
sitiv
elycharged
3μg
siRNA;70
.6%
efficien
cyElectrostatic
absorptio
nOnlyvalidated
insuspen
sion
cells;po
tential
toxicity
Cationicoligop
eptid
epo
lyarginine
(POA)3
8Tob
acco
(Nicotiana
tabacum)
suspen
sion
cells
GUSNPT
II12
arginine
spo
sitiv
echarged
10μg
(NPT
II)or
20μg
(GUS)
dsRNA;
completelyde
graded
correspo
ndingmRNA
aftercertaintim
e(24
or72
h)
Electrostatic
absorptio
nOnlyvalidated
insuspen
sion
cells
Peptide3
9Maturetissue
(leaves)
Yellow
fluo
rescen
tprotein(Y
FP);chalcone
synthase
(CHS)
100–300nm
indiam
eter;
positiv
elycharged
20pm
oldsRNA;70
%efficien
cyforYFP
Electrostatic
absorptio
nQuick
andlocalgene
silencing
Nanop
artic
le-
med
iatedpassive
delivery
Layereddo
uble
hydroxide(LDH)
nano
sheets
12,40
Maturetissue(roo
ts,
leaves),BY
-2cells
Pepp
ermild
mottle
virus(PMMoV
)and
cucumbe
rmosaic
virus(C
MV)
15–120
nmwith
anaveragediam
eter
of45
nm,lateraldimen
sion
intherang
eof
20–8
0nm
;po
sitiv
elycharged
Sign
ificant
downregulation
Electrostatic
absorptio
nSu
staine
dreleaseof
cargo;
unknow
ntarget
speciesrang
e
Carbo
ndo
ts41
Maturetissue
(leaves)
GFP;magne
sium
chelatase(M
gChe
)Hydrodynamic
radius
rang
efrom
1to
30nm
depe
ndingon
the
molecular
weigh
tof
PEIligand
12ng
/μLsiRNA
84%
efficien
cyforGFP;79
%efficien
cyforMgC
he
Electrostatic
absorptio
nSilencingcanbe
achieved
with
relativ
elylow
amou
ntsof
siRNA.Need
PEIm
odificatio
ndu
ring
the
synthe
sis,
introd
ucing
potentialtoxicity
SWNTs5
7,58
Maturetissue
(leaves)
GFP
1nm
indiam
eter
with
anaverageleng
thof
500nm
100nM
siRNAs;95±
4.1%
forasiRNA,92±
6.2%
forbsiRNA
(mRNA
level);42.6±
2.8%
(protein
level)
Non
-covalen
tlyadsorptio
nviaπ–
πstacking
Specificandtransien
tgene
targeting;
protectio
nof
siRNA
from
nuclease
degradation
DNA
nano
structures
Maturetissue
(leaves)
GFP
Tetrahe
dron
:2.4nm
;HT
mon
omer:(2
×5×16
nm);nano
string
:(2×5×
320nm
)
100nM
siRNAs;
40–59%
(varieswith
DNA
structures)in
both
mRNA
andproteinlevel
Nucleotidebase
pairing
hybridization
Specificandtransien
tgene
targetingthroug
hsequ
ence
design
;controllableattachmen
t;protectio
nof
siRNA
cargo;
notoxicity
ordamage
NATURE PROTOCOLS PROTOCOL
NATURE PROTOCOLS |www.nature.com/nprot 5
and Supplementary Tables 1 and 2). Specifically, here we outline how to design DNA hairpin tiles(DHTs), DNA nanostrings and DNA tetrahedra.
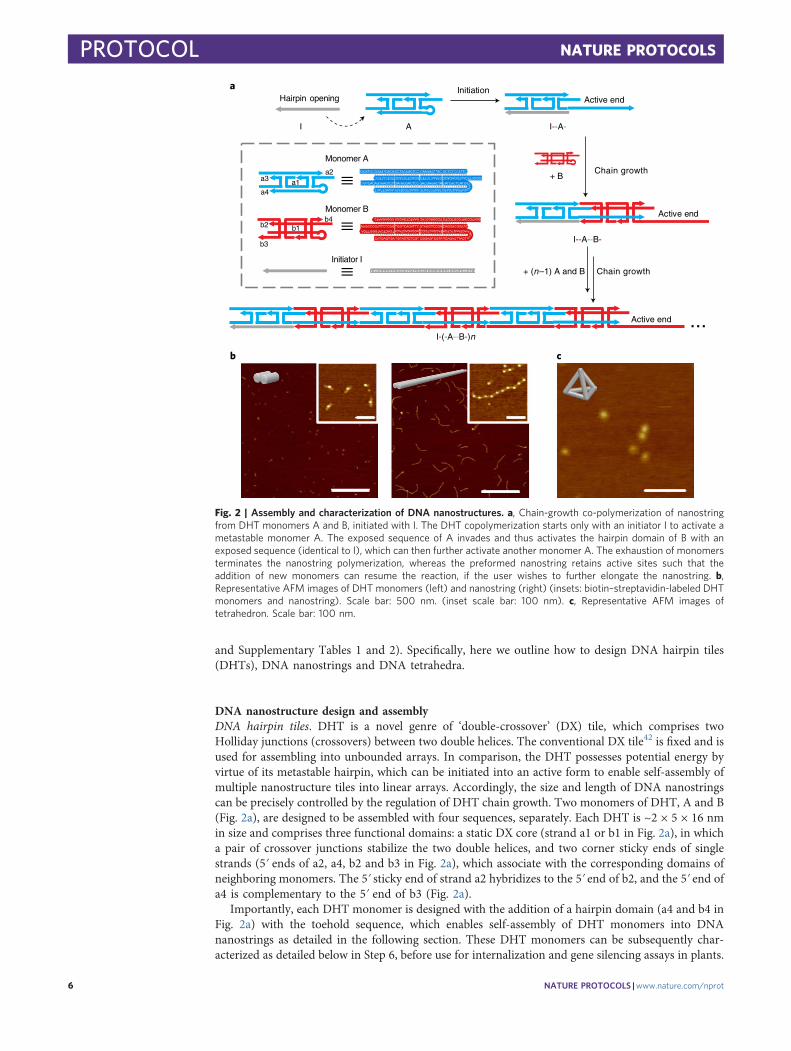
DNA nanostructure design and assemblyDNA hairpin tiles. DHT is a novel genre of ‘double-crossover’ (DX) tile, which comprises twoHolliday junctions (crossovers) between two double helices. The conventional DX tile42 is fixed and isused for assembling into unbounded arrays. In comparison, the DHT possesses potential energy byvirtue of its metastable hairpin, which can be initiated into an active form to enable self-assembly ofmultiple nanostructure tiles into linear arrays. Accordingly, the size and length of DNA nanostringscan be precisely controlled by the regulation of DHT chain growth. Two monomers of DHT, A and B(Fig. 2a), are designed to be assembled with four sequences, separately. Each DHT is ~2 × 5 × 16 nmin size and comprises three functional domains: a static DX core (strand a1 or b1 in Fig. 2a), in whicha pair of crossover junctions stabilize the two double helices, and two corner sticky ends of singlestrands (5ʹ ends of a2, a4, b2 and b3 in Fig. 2a), which associate with the corresponding domains ofneighboring monomers. The 5ʹ sticky end of strand a2 hybridizes to the 5ʹ end of b2, and the 5ʹ end ofa4 is complementary to the 5ʹ end of b3 (Fig. 2a).
Importantly, each DHT monomer is designed with the addition of a hairpin domain (a4 and b4 inFig. 2a) with the toehold sequence, which enables self-assembly of DHT monomers into DNAnanostrings as detailed in the following section. These DHT monomers can be subsequently char-acterized as detailed below in Step 6, before use for internalization and gene silencing assays in plants.
a
cb
I A
+ B
Initiation
Chain growth
Chain growth+ (n–1) A and B
Active end
Active end
Active end
I-(-A--B-)n
I--A-
Hairpin opening
I--A--B-
Monomer A
Initiator I
Monomer B
a1
b2
a4
a3a2
b1
b3
b4
Fig. 2 | Assembly and characterization of DNA nanostructures. a, Chain-growth co-polymerization of nanostringfrom DHT monomers A and B, initiated with I. The DHT copolymerization starts only with an initiator I to activate ametastable monomer A. The exposed sequence of A invades and thus activates the hairpin domain of B with anexposed sequence (identical to I), which can then further activate another monomer A. The exhaustion of monomersterminates the nanostring polymerization, whereas the preformed nanostring retains active sites such that theaddition of new monomers can resume the reaction, if the user wishes to further elongate the nanostring. b,Representative AFM images of DHT monomers (left) and nanostring (right) (insets: biotin–streptavidin-labeled DHTmonomers and nanostring). Scale bar: 500 nm. (inset scale bar: 100 nm). c, Representative AFM images oftetrahedron. Scale bar: 100 nm.
PROTOCOL NATURE PROTOCOLS
6 NATURE PROTOCOLS |www.nature.com/nprot
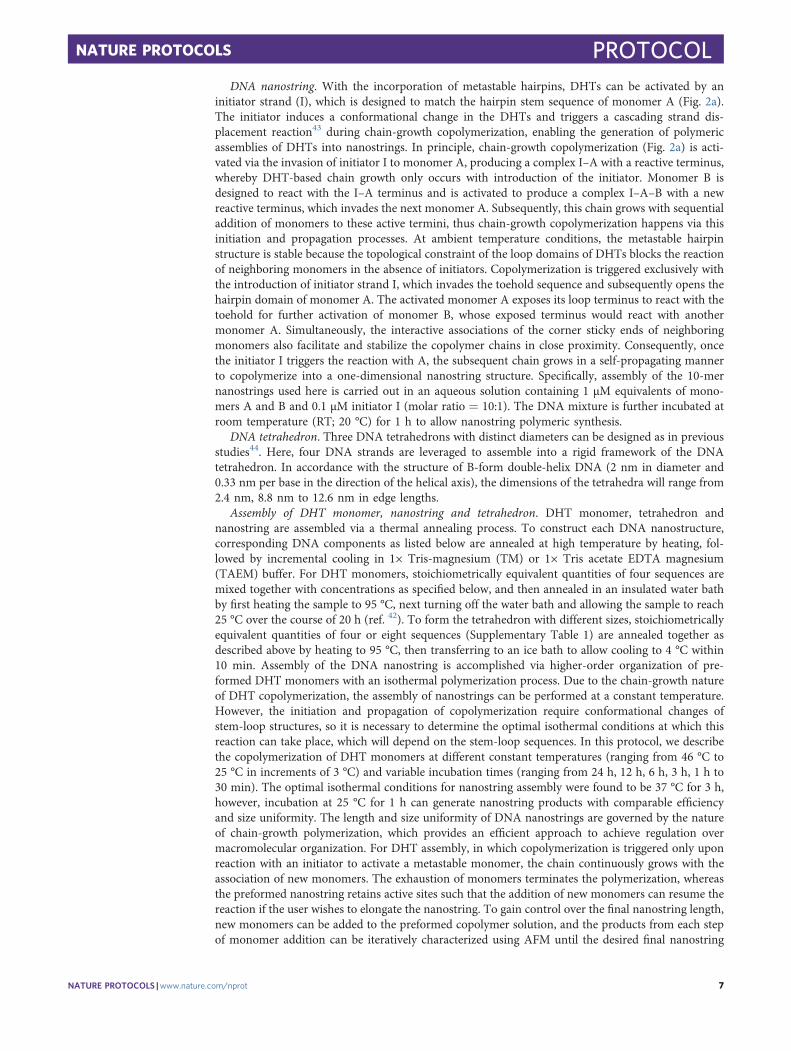
DNA nanostring. With the incorporation of metastable hairpins, DHTs can be activated by aninitiator strand (I), which is designed to match the hairpin stem sequence of monomer A (Fig. 2a).The initiator induces a conformational change in the DHTs and triggers a cascading strand dis-placement reaction43 during chain-growth copolymerization, enabling the generation of polymericassemblies of DHTs into nanostrings. In principle, chain-growth copolymerization (Fig. 2a) is acti-vated via the invasion of initiator I to monomer A, producing a complex I–A with a reactive terminus,whereby DHT-based chain growth only occurs with introduction of the initiator. Monomer B isdesigned to react with the I–A terminus and is activated to produce a complex I–A–B with a newreactive terminus, which invades the next monomer A. Subsequently, this chain grows with sequentialaddition of monomers to these active termini, thus chain-growth copolymerization happens via thisinitiation and propagation processes. At ambient temperature conditions, the metastable hairpinstructure is stable because the topological constraint of the loop domains of DHTs blocks the reactionof neighboring monomers in the absence of initiators. Copolymerization is triggered exclusively withthe introduction of initiator strand I, which invades the toehold sequence and subsequently opens thehairpin domain of monomer A. The activated monomer A exposes its loop terminus to react with thetoehold for further activation of monomer B, whose exposed terminus would react with anothermonomer A. Simultaneously, the interactive associations of the corner sticky ends of neighboringmonomers also facilitate and stabilize the copolymer chains in close proximity. Consequently, oncethe initiator I triggers the reaction with A, the subsequent chain grows in a self-propagating mannerto copolymerize into a one-dimensional nanostring structure. Specifically, assembly of the 10-mernanostrings used here is carried out in an aqueous solution containing 1 μM equivalents of mono-mers A and B and 0.1 μM initiator I (molar ratio = 10:1). The DNA mixture is further incubated atroom temperature (RT; 20 °C) for 1 h to allow nanostring polymeric synthesis.
DNA tetrahedron. Three DNA tetrahedrons with distinct diameters can be designed as in previousstudies44. Here, four DNA strands are leveraged to assemble into a rigid framework of the DNAtetrahedron. In accordance with the structure of B-form double-helix DNA (2 nm in diameter and0.33 nm per base in the direction of the helical axis), the dimensions of the tetrahedra will range from2.4 nm, 8.8 nm to 12.6 nm in edge lengths.
Assembly of DHT monomer, nanostring and tetrahedron. DHT monomer, tetrahedron andnanostring are assembled via a thermal annealing process. To construct each DNA nanostructure,corresponding DNA components as listed below are annealed at high temperature by heating, fol-lowed by incremental cooling in 1× Tris-magnesium (TM) or 1× Tris acetate EDTA magnesium(TAEM) buffer. For DHT monomers, stoichiometrically equivalent quantities of four sequences aremixed together with concentrations as specified below, and then annealed in an insulated water bathby first heating the sample to 95 °C, next turning off the water bath and allowing the sample to reach25 °C over the course of 20 h (ref. 42). To form the tetrahedron with different sizes, stoichiometricallyequivalent quantities of four or eight sequences (Supplementary Table 1) are annealed together asdescribed above by heating to 95 °C, then transferring to an ice bath to allow cooling to 4 °C within10 min. Assembly of the DNA nanostring is accomplished via higher-order organization of pre-formed DHT monomers with an isothermal polymerization process. Due to the chain-growth natureof DHT copolymerization, the assembly of nanostrings can be performed at a constant temperature.However, the initiation and propagation of copolymerization require conformational changes ofstem-loop structures, so it is necessary to determine the optimal isothermal conditions at which thisreaction can take place, which will depend on the stem-loop sequences. In this protocol, we describethe copolymerization of DHT monomers at different constant temperatures (ranging from 46 °C to25 °C in increments of 3 °C) and variable incubation times (ranging from 24 h, 12 h, 6 h, 3 h, 1 h to30 min). The optimal isothermal conditions for nanostring assembly were found to be 37 °C for 3 h,however, incubation at 25 °C for 1 h can generate nanostring products with comparable efficiencyand size uniformity. The length and size uniformity of DNA nanostrings are governed by the natureof chain-growth polymerization, which provides an efficient approach to achieve regulation overmacromolecular organization. For DHT assembly, in which copolymerization is triggered only uponreaction with an initiator to activate a metastable monomer, the chain continuously grows with theassociation of new monomers. The exhaustion of monomers terminates the polymerization, whereasthe preformed nanostring retains active sites such that the addition of new monomers can resume thereaction if the user wishes to elongate the nanostring. To gain control over the final nanostring length,new monomers can be added to the preformed copolymer solution, and the products from each stepof monomer addition can be iteratively characterized using AFM until the desired final nanostring
NATURE PROTOCOLS PROTOCOL
NATURE PROTOCOLS |www.nature.com/nprot 7
length is achieved (here, ten monomeric units or 320 nm). DNA sequences from which DHTmonomers, tetrahedrons and nanostring are synthesized are listed in Supplementary Table 1.
Characterizations of DNA nanostructuresGel electrophoresis. Following annealing, the DHT monomers and tetrahedrons can be characterizedby native PAGE analysis (see images in Supplementary Fig. 1), and the nanostring can be char-acterized by agarose gel electrophoresis.
AFM imaging. The products of DNA assembly, including DHT monomers, nanostrings andtetrahedrons, can be directly visualized by AFM. Additionally, to confirm (i) the attachment locusonto which siRNA will be attached or (ii) the precise number of DHT monomers that copolymerizedonto nanostrings, biotin–streptavidin (bio–STV) interactions can be leveraged to provide a structurallabel for high-contrast AFM imaging. To confirm correct placement of siRNA attachment loci, abiotin-modified DNA strand can be designed into the tetrahedron or DHT monomer at the positionalong the nanostructure where one wishes to subsequently attach siRNA. Similarly, to assess nano-string length and proper DHT monomeric composition, a biotin-modified DNA strand can bedesigned into the construction of each monomer. Nanostructures can then be thermodynamicallyassembled as described above, for which there will be an accessible biotin to bind streptavidin protein.After assembly of nanostructures, biotinylated nanostructures can be incubated with 5 nM strepta-vidin for 10 min at 37 °C before AFM imaging. Through AFM imaging, discrete patterns of anchoredSTVs will allow direct visualization of nanostructure products in which the siRNA attachment locusor number of DHT monomeric subunits in each nanostring can be determined with high accuracy(see representative images in Fig. 2b insert).
Plant growthPlants should be cultivated using optimal conditions for the particular species being used forexperimentation. For the examples shown in this protocol, transgenic mGFP5 Nb (from the Stas-kawicz Lab, University of California, Berkeley—used herein for internalization and gene silencingstudies), tobacco, arugula and watercress (used herein for internalization studies) seeds were ger-minated and kept in SunGro Sunshine LC1 Grower soil mixture within the growth chamber (740FHLED). The plants were grown at 25 °C, 60% humidity, with an 8-h light cycle per 24 h, and werewatered twice a week. Plants 3–4 weeks of age were chosen for experimental use, and infiltrationswere performed by gently infiltrating nanostructures with a 1-ml needleless syringe (Step 8, Sup-plementary Fig. 2) and without using any surfactant.
Nanostructure internalization and silencing efficiency evaluations and controlsTo assess nanostructure internalization, we use a Cy3-labeled single-stranded DNA to assemble thenanostructure itself, instead of tagging a preformed DNA nanostructure with a Cy3 overhang. Thisapproach ensures that the final concentration of Cy3 dye and the total amount of DNA are the samefor all nanostructures, thus we can evaluate nanostructure internalization based on Cy3 fluorescencethat colocalizes with the cytosol, and assess nanostructure internalization efficiency based onnanostructure properties. To assess silencing efficiency, we employ several methods to quantify boththe change in mRNA (qPCR) and the protein change (confocal microscopy and western blotting). ForqPCR, EF1 (elongation factor 1) was chosen as our housekeeping (reference) gene, which has beenshown to be a stable internal control for gene expression as its expression does not fluctuate under arange of treatments45. Meanwhile, leaves infiltrated with just buffer (control), siRNA only or DNAnanostructures only are also listed as further control groups to verify that the silencing was caused bythe siRNA delivered by the DNA nanostructures, and not by the DNA nanostructures themselves.For confocal microscopy, non-treated Nb leaves serve as controls, for which the GFP fluorescenceintensity is defined as 1 in the subsequent statistical analyses to determine the silencing efficiency forexperimental groups, which are normalized to 1. For western blotting assays to determine GFPprotein expression, non-treated Nb leaves serve as controls, for which the band intensity is defined as1 in the subsequent statistical analyses.
Internalization study of DNA nanostructuresTo identify which nanostructures internalize into plant cells most effectively, DNA nanostructureswith different sizes, shapes and stiffnesses are labeled with Cy3 fluorophores via labeling of the DNAstrand used to form the nanostructure, and infiltrated into transgenic mGFP5 Nb plants at a con-centration of 400 nM. Transgenic mGFP5 Nb plants have been engineered to constitutively express
PROTOCOL NATURE PROTOCOLS
8 NATURE PROTOCOLS |www.nature.com/nprot
GFP proteins (see GFP expression confirmation in Supplementary Fig. 3). Because GFP localizes inthe cytosol, its expression is therefore used as a fluorescent marker for the cell cytosol to calculatecolocalization efficiencies in nanostructure internalization studies, and separately serves as thetransgene target for siRNA-based gene silencing studies as detailed below. In this manner, forinternalization and silencing quantification, colocalization analysis of Cy3-tagged nanostructures withthe GFP-labeled cytosol provides a relative measure of nanostructure internalization, and a decreasein GFP fluorescence and expression provides a measure of siRNA-based gene silencing efficiency. Inthis protocol, plant cell internalization of DNA nanostructures with different sizes, shapes andstiffness/compactness (see details in Supplementary Table 2) are investigated, and their siRNA-basedsilencing efficiencies are compared. Together with simulation and calculation of DNA nanostructuremechanical parameters based on Cando software46–48, we find that smaller-sized nanostructures withhigher stiffness/compactness can enter the plant cell more efficiently and can silence genes moreeffectively. Moreover, we show in Supplementary Fig. 4 that DNA nanostructures can enter differentplant species (tobacco, arugula and watercress). As such, our study provides guidance on the para-meters of importance for designing DNA nanostructures as biomolecule delivery tools for plants, andthis protocol can be repeated to test optimal plant cell internalization in different plant species ortissue types. We also investigated the mechanism of DNA nanostructure internalization into plantcells. Results summarized in Supplementary Fig. 5 show a noticeable decrease in DHT monomerinternalization when incubated at 4 °C post-infiltration, or if the leaf is pretreated with 33 µMwortmannin49, a chemical inhibitor of endocytosis, relative to leaves infiltrated with the DHTmonomer in the absence of cold or wortmannin. Both of these assays suggest that nanostructureinternalization occurs predominantly through an active endocytosis pathway.
Cargo attachment of DNA nanostructuresEach DNA nanostructure can be designed to attach biological or non-biological cargoes, for example,DNA, RNA or fluorescent dyes, to the predefined loci. A DHT monomer as described above containsone attachment locus at either its center (DHT-c) or side (DHT-s). Multiple DHT-c monomers areassembled into one nanostring with corresponding cargo attachment loci. The tetrahedron has oneattachment locus at one of its apexes.
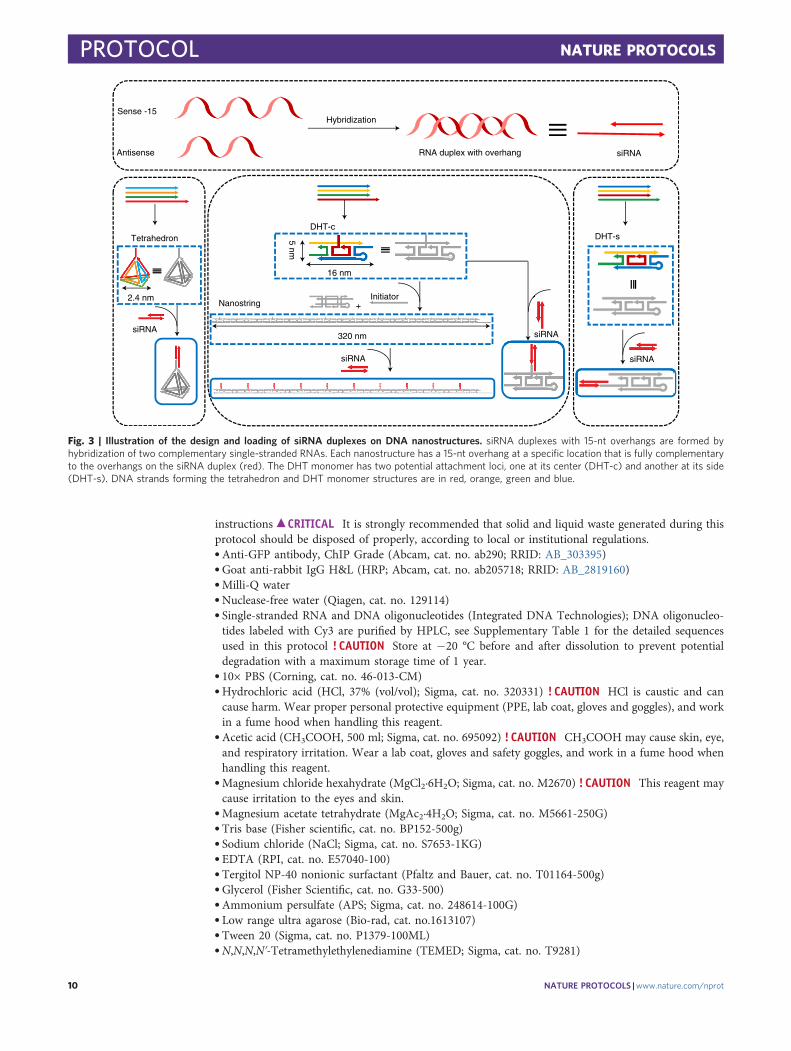
Gene silencing efficiency of DNA nanostructuresTetrahedron, DHT monomer and nanostring nanostructures can be loaded with siRNA via hybri-dization of single-stranded sRNA complementary to the nanostructure locus or loci, as describedabove, and infiltrated into transgenic mGFP5 Nb plants at an siRNA concentration of 100 nM. A 21-bp siRNA sequence that inhibits GFP expression in a variety of monocot and dicot plants50 wasdesigned, and this duplex siRNA oligonucleotide was hybridized to a complementary strand pro-grammed into the site-specific loci on the DNA nanostructures (Fig. 3; see Supplementary Table 1 forsequences). Next, infiltration of siRNA-loaded nanostructures into mGFP5 Nb is performed, and genesilencing efficiency is assessed 1 or 3 d later through three orthogonal methods: qPCR is performed tocheck the GFP mRNA level after 1 d, where the change in GFP mRNA levels will reflect variations inGFP expression, confocal microscopy (after 3 d) is performed to directly image and compare GFPfluorescence intensity change, and western blotting (after 3 d) is utilized to further quantify GFPexpression changes in the infiltrated leaf tissues by directly quantifying the amount of GFP extractedfrom treated leaves. With these three methods of evaluating gene silencing, we can design and loaddifferent kinds of siRNA to target various genes and compare silencing efficiencies when deliveredwith different DNA nanostructures. We can also explore the endogenous silencing pathways bywhich siRNA-loaded nanostructures accomplish gene silencing in plants.
Materials
Biological materials● In the example described in this protocol, we use transgenic mGFP5 Nb plants (seeds obtained fromthe Staskawicz lab at UC Berkeley).
Reagents! CAUTION All of the reagents and solvents used in the protocol require the use of protective goggles,gloves and lab coats. All reagents should be stored and prepared according to the manufacturer’s
NATURE PROTOCOLS PROTOCOL
NATURE PROTOCOLS |www.nature.com/nprot 9
instructions c CRITICAL It is strongly recommended that solid and liquid waste generated during thisprotocol should be disposed of properly, according to local or institutional regulations.● Anti-GFP antibody, ChIP Grade (Abcam, cat. no. ab290; RRID: AB_303395)● Goat anti-rabbit IgG H&L (HRP; Abcam, cat. no. ab205718; RRID: AB_2819160)● Milli-Q water● Nuclease-free water (Qiagen, cat. no. 129114)● Single-stranded RNA and DNA oligonucleotides (Integrated DNA Technologies); DNA oligonucleo-tides labeled with Cy3 are purified by HPLC, see Supplementary Table 1 for the detailed sequencesused in this protocol ! CAUTION Store at −20 °C before and after dissolution to prevent potentialdegradation with a maximum storage time of 1 year.
● 10× PBS (Corning, cat. no. 46-013-CM)● Hydrochloric acid (HCl, 37% (vol/vol); Sigma, cat. no. 320331) ! CAUTION HCl is caustic and cancause harm. Wear proper personal protective equipment (PPE, lab coat, gloves and goggles), and workin a fume hood when handling this reagent.
● Acetic acid (CH3COOH, 500 ml; Sigma, cat. no. 695092) ! CAUTION CH3COOH may cause skin, eye,and respiratory irritation. Wear a lab coat, gloves and safety goggles, and work in a fume hood whenhandling this reagent.
● Magnesium chloride hexahydrate (MgCl2·6H2O; Sigma, cat. no. M2670) ! CAUTION This reagent maycause irritation to the eyes and skin.
● Magnesium acetate tetrahydrate (MgAc2·4H2O; Sigma, cat. no. M5661-250G)● Tris base (Fisher scientific, cat. no. BP152-500g)● Sodium chloride (NaCl; Sigma, cat. no. S7653-1KG)● EDTA (RPI, cat. no. E57040-100)● Tergitol NP-40 nonionic surfactant (Pfaltz and Bauer, cat. no. T01164-500g)● Glycerol (Fisher Scientific, cat. no. G33-500)● Ammonium persulfate (APS; Sigma, cat. no. 248614-100G)● Low range ultra agarose (Bio-rad, cat. no.1613107)● Tween 20 (Sigma, cat. no. P1379-100ML)● N,N,N,Nʹ-Tetramethylethylenediamine (TEMED; Sigma, cat. no. T9281)
320 nm
16 nm
5 nm
2.4 nm
Tetrahedron DHT-s
Nanostring
DHT-c
+Initiator
siRNA
siRNA
siRNA
siRNA
Sense -15
Antisense
Hybridization
RNA duplex with overhang siRNA
Fig. 3 | Illustration of the design and loading of siRNA duplexes on DNA nanostructures. siRNA duplexes with 15-nt overhangs are formed byhybridization of two complementary single-stranded RNAs. Each nanostructure has a 15-nt overhang at a specific location that is fully complementaryto the overhangs on the siRNA duplex (red). The DHT monomer has two potential attachment loci, one at its center (DHT-c) and another at its side(DHT-s). DNA strands forming the tetrahedron and DHT monomer structures are in red, orange, green and blue.
PROTOCOL NATURE PROTOCOLS
10 NATURE PROTOCOLS |www.nature.com/nprot
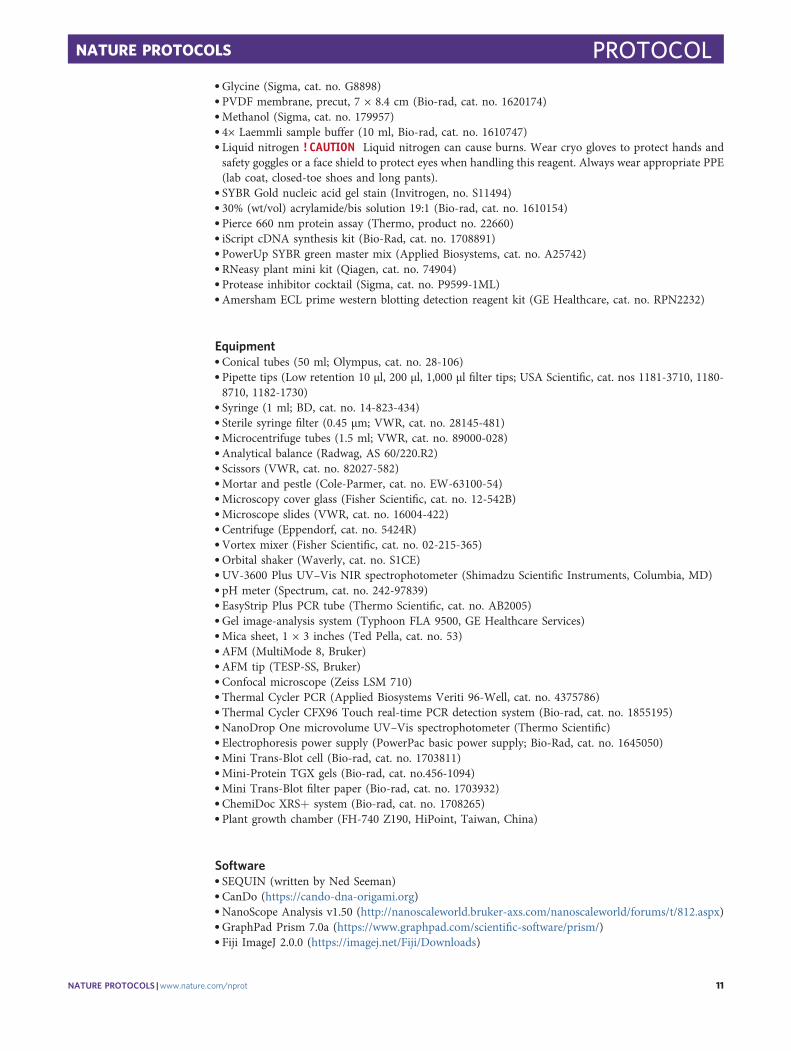
● Glycine (Sigma, cat. no. G8898)● PVDF membrane, precut, 7 × 8.4 cm (Bio-rad, cat. no. 1620174)● Methanol (Sigma, cat. no. 179957)● 4× Laemmli sample buffer (10 ml, Bio-rad, cat. no. 1610747)● Liquid nitrogen ! CAUTION Liquid nitrogen can cause burns. Wear cryo gloves to protect hands andsafety goggles or a face shield to protect eyes when handling this reagent. Always wear appropriate PPE(lab coat, closed-toe shoes and long pants).
● SYBR Gold nucleic acid gel stain (Invitrogen, no. S11494)● 30% (wt/vol) acrylamide/bis solution 19:1 (Bio-rad, cat. no. 1610154)● Pierce 660 nm protein assay (Thermo, product no. 22660)● iScript cDNA synthesis kit (Bio-Rad, cat. no. 1708891)● PowerUp SYBR green master mix (Applied Biosystems, cat. no. A25742)● RNeasy plant mini kit (Qiagen, cat. no. 74904)● Protease inhibitor cocktail (Sigma, cat. no. P9599-1ML)● Amersham ECL prime western blotting detection reagent kit (GE Healthcare, cat. no. RPN2232)
Equipment● Conical tubes (50 ml; Olympus, cat. no. 28-106)● Pipette tips (Low retention 10 μl, 200 μl, 1,000 μl filter tips; USA Scientific, cat. nos 1181-3710, 1180-8710, 1182-1730)
● Syringe (1 ml; BD, cat. no. 14-823-434)● Sterile syringe filter (0.45 μm; VWR, cat. no. 28145-481)● Microcentrifuge tubes (1.5 ml; VWR, cat. no. 89000-028)● Analytical balance (Radwag, AS 60/220.R2)● Scissors (VWR, cat. no. 82027-582)● Mortar and pestle (Cole-Parmer, cat. no. EW-63100-54)● Microscopy cover glass (Fisher Scientific, cat. no. 12-542B)● Microscope slides (VWR, cat. no. 16004-422)● Centrifuge (Eppendorf, cat. no. 5424R)● Vortex mixer (Fisher Scientific, cat. no. 02-215-365)● Orbital shaker (Waverly, cat. no. S1CE)● UV-3600 Plus UV–Vis NIR spectrophotometer (Shimadzu Scientific Instruments, Columbia, MD)● pH meter (Spectrum, cat. no. 242-97839)● EasyStrip Plus PCR tube (Thermo Scientific, cat. no. AB2005)● Gel image-analysis system (Typhoon FLA 9500, GE Healthcare Services)● Mica sheet, 1 × 3 inches (Ted Pella, cat. no. 53)● AFM (MultiMode 8, Bruker)● AFM tip (TESP-SS, Bruker)● Confocal microscope (Zeiss LSM 710)● Thermal Cycler PCR (Applied Biosystems Veriti 96-Well, cat. no. 4375786)● Thermal Cycler CFX96 Touch real-time PCR detection system (Bio-rad, cat. no. 1855195)● NanoDrop One microvolume UV–Vis spectrophotometer (Thermo Scientific)● Electrophoresis power supply (PowerPac basic power supply; Bio-Rad, cat. no. 1645050)● Mini Trans-Blot cell (Bio-rad, cat. no. 1703811)● Mini-Protein TGX gels (Bio-rad, cat. no.456-1094)● Mini Trans-Blot filter paper (Bio-rad, cat. no. 1703932)● ChemiDoc XRS+ system (Bio-rad, cat. no. 1708265)● Plant growth chamber (FH-740 Z190, HiPoint, Taiwan, China)
Software● SEQUIN (written by Ned Seeman)● CanDo (https://cando-dna-origami.org)● NanoScope Analysis v1.50 (http://nanoscaleworld.bruker-axs.com/nanoscaleworld/forums/t/812.aspx)● GraphPad Prism 7.0a (https://www.graphpad.com/scientific-software/prism/)● Fiji ImageJ 2.0.0 (https://imagej.net/Fiji/Downloads)
NATURE PROTOCOLS PROTOCOL
NATURE PROTOCOLS |www.nature.com/nprot 11
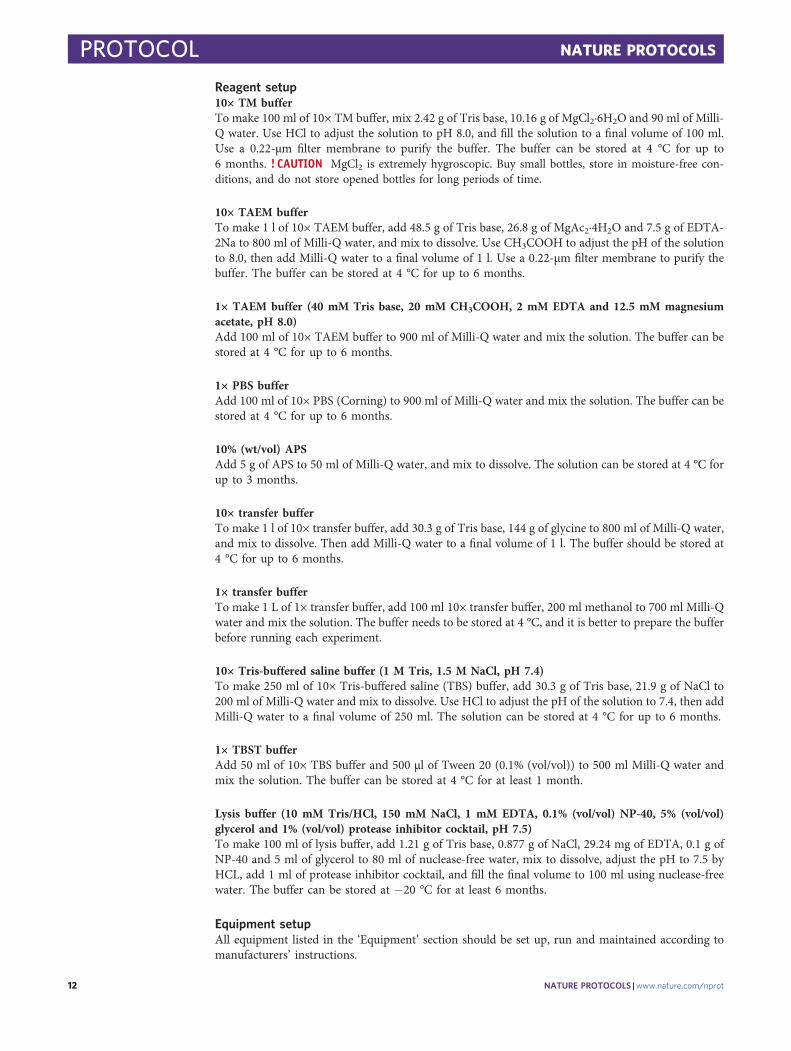
Reagent setup10× TM bufferTo make 100 ml of 10× TM buffer, mix 2.42 g of Tris base, 10.16 g of MgCl2·6H2O and 90 ml of Milli-Q water. Use HCl to adjust the solution to pH 8.0, and fill the solution to a final volume of 100 ml.Use a 0.22-μm filter membrane to purify the buffer. The buffer can be stored at 4 °C for up to6 months. ! CAUTION MgCl2 is extremely hygroscopic. Buy small bottles, store in moisture-free con-ditions, and do not store opened bottles for long periods of time.
10× TAEM bufferTo make 1 l of 10× TAEM buffer, add 48.5 g of Tris base, 26.8 g of MgAc2·4H2O and 7.5 g of EDTA-2Na to 800 ml of Milli-Q water, and mix to dissolve. Use CH3COOH to adjust the pH of the solutionto 8.0, then add Milli-Q water to a final volume of 1 l. Use a 0.22-μm filter membrane to purify thebuffer. The buffer can be stored at 4 °C for up to 6 months.
1× TAEM buffer (40 mM Tris base, 20 mM CH3COOH, 2 mM EDTA and 12.5 mM magnesiumacetate, pH 8.0)Add 100 ml of 10× TAEM buffer to 900 ml of Milli-Q water and mix the solution. The buffer can bestored at 4 °C for up to 6 months.
1× PBS bufferAdd 100 ml of 10× PBS (Corning) to 900 ml of Milli-Q water and mix the solution. The buffer can bestored at 4 °C for up to 6 months.
10% (wt/vol) APSAdd 5 g of APS to 50 ml of Milli-Q water, and mix to dissolve. The solution can be stored at 4 °C forup to 3 months.
10× transfer bufferTo make 1 l of 10× transfer buffer, add 30.3 g of Tris base, 144 g of glycine to 800 ml of Milli-Q water,and mix to dissolve. Then add Milli-Q water to a final volume of 1 l. The buffer should be stored at4 °C for up to 6 months.
1× transfer bufferTo make 1 L of 1× transfer buffer, add 100 ml 10× transfer buffer, 200 ml methanol to 700 ml Milli-Qwater and mix the solution. The buffer needs to be stored at 4 °C, and it is better to prepare the bufferbefore running each experiment.
10× Tris-buffered saline buffer (1 M Tris, 1.5 M NaCl, pH 7.4)To make 250 ml of 10× Tris-buffered saline (TBS) buffer, add 30.3 g of Tris base, 21.9 g of NaCl to200 ml of Milli-Q water and mix to dissolve. Use HCl to adjust the pH of the solution to 7.4, then addMilli-Q water to a final volume of 250 ml. The solution can be stored at 4 °C for up to 6 months.
1× TBST bufferAdd 50 ml of 10× TBS buffer and 500 µl of Tween 20 (0.1% (vol/vol)) to 500 ml Milli-Q water andmix the solution. The buffer can be stored at 4 °C for at least 1 month.
Lysis buffer (10 mM Tris/HCl, 150 mM NaCl, 1 mM EDTA, 0.1% (vol/vol) NP-40, 5% (vol/vol)glycerol and 1% (vol/vol) protease inhibitor cocktail, pH 7.5)To make 100 ml of lysis buffer, add 1.21 g of Tris base, 0.877 g of NaCl, 29.24 mg of EDTA, 0.1 g ofNP-40 and 5 ml of glycerol to 80 ml of nuclease-free water, mix to dissolve, adjust the pH to 7.5 byHCL, add 1 ml of protease inhibitor cocktail, and fill the final volume to 100 ml using nuclease-freewater. The buffer can be stored at −20 °C for at least 6 months.
Equipment setupAll equipment listed in the ‘Equipment’ section should be set up, run and maintained according tomanufacturers’ instructions.
PROTOCOL NATURE PROTOCOLS
12 NATURE PROTOCOLS |www.nature.com/nprot
Procedure
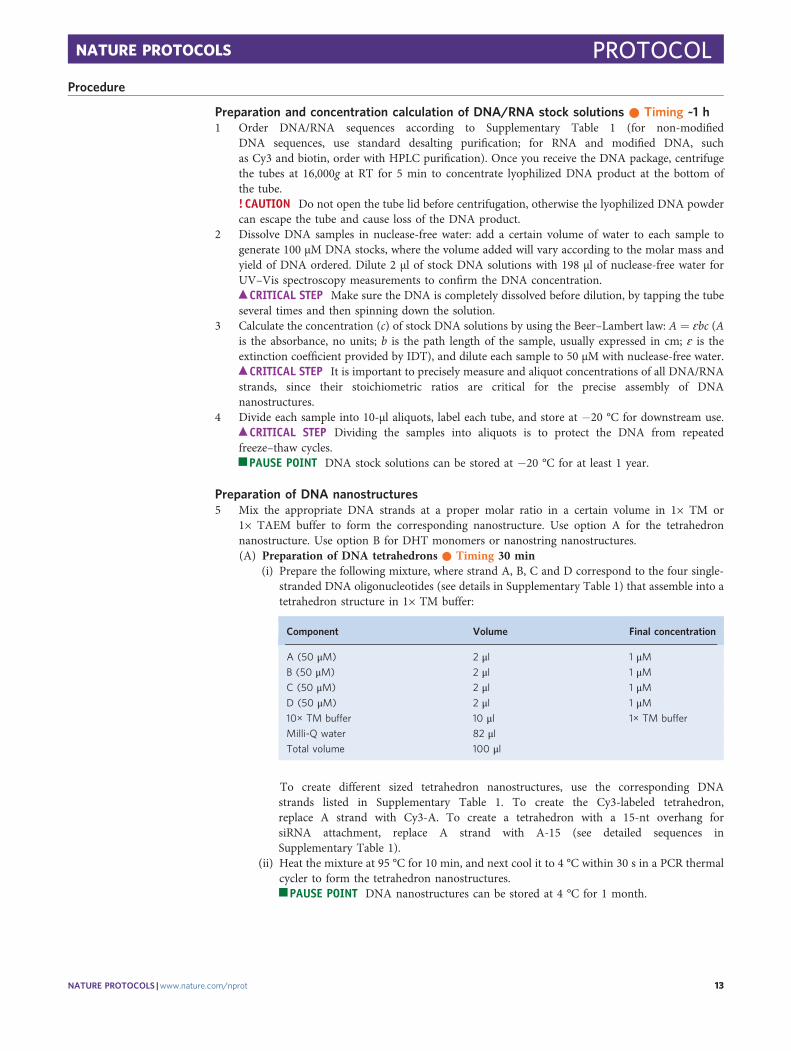
Preparation and concentration calculation of DNA/RNA stock solutions ● Timing ~1 h1 Order DNA/RNA sequences according to Supplementary Table 1 (for non-modified
DNA sequences, use standard desalting purification; for RNA and modified DNA, suchas Cy3 and biotin, order with HPLC purification). Once you receive the DNA package, centrifugethe tubes at 16,000g at RT for 5 min to concentrate lyophilized DNA product at the bottom ofthe tube.! CAUTION Do not open the tube lid before centrifugation, otherwise the lyophilized DNA powdercan escape the tube and cause loss of the DNA product.
2 Dissolve DNA samples in nuclease-free water: add a certain volume of water to each sample togenerate 100 μM DNA stocks, where the volume added will vary according to the molar mass andyield of DNA ordered. Dilute 2 μl of stock DNA solutions with 198 μl of nuclease-free water forUV–Vis spectroscopy measurements to confirm the DNA concentration.
c CRITICAL STEP Make sure the DNA is completely dissolved before dilution, by tapping the tubeseveral times and then spinning down the solution.
3 Calculate the concentration (c) of stock DNA solutions by using the Beer–Lambert law: A = ɛbc (Ais the absorbance, no units; b is the path length of the sample, usually expressed in cm; ɛ is theextinction coefficient provided by IDT), and dilute each sample to 50 μM with nuclease-free water.
c CRITICAL STEP It is important to precisely measure and aliquot concentrations of all DNA/RNAstrands, since their stoichiometric ratios are critical for the precise assembly of DNAnanostructures.
4 Divide each sample into 10-μl aliquots, label each tube, and store at −20 °C for downstream use.
c CRITICAL STEP Dividing the samples into aliquots is to protect the DNA from repeatedfreeze–thaw cycles.
j PAUSE POINT DNA stock solutions can be stored at −20 °C for at least 1 year.
Preparation of DNA nanostructures5 Mix the appropriate DNA strands at a proper molar ratio in a certain volume in 1× TM or
1× TAEM buffer to form the corresponding nanostructure. Use option A for the tetrahedronnanostructure. Use option B for DHT monomers or nanostring nanostructures.(A) Preparation of DNA tetrahedrons ● Timing 30 min
(i) Prepare the following mixture, where strand A, B, C and D correspond to the four single-stranded DNA oligonucleotides (see details in Supplementary Table 1) that assemble into atetrahedron structure in 1× TM buffer:
Component Volume Final concentration
A (50 μM) 2 μl 1 μMB (50 μM) 2 μl 1 μMC (50 μM) 2 μl 1 μMD (50 μM) 2 μl 1 μM10× TM buffer 10 μl 1× TM buffer
Milli-Q water 82 μlTotal volume 100 μl
To create different sized tetrahedron nanostructures, use the corresponding DNAstrands listed in Supplementary Table 1. To create the Cy3-labeled tetrahedron,replace A strand with Cy3-A. To create a tetrahedron with a 15-nt overhang forsiRNA attachment, replace A strand with A-15 (see detailed sequences inSupplementary Table 1).
(ii) Heat the mixture at 95 °C for 10 min, and next cool it to 4 °C within 30 s in a PCR thermalcycler to form the tetrahedron nanostructures.
j PAUSE POINT DNA nanostructures can be stored at 4 °C for 1 month.
NATURE PROTOCOLS PROTOCOL
NATURE PROTOCOLS |www.nature.com/nprot 13
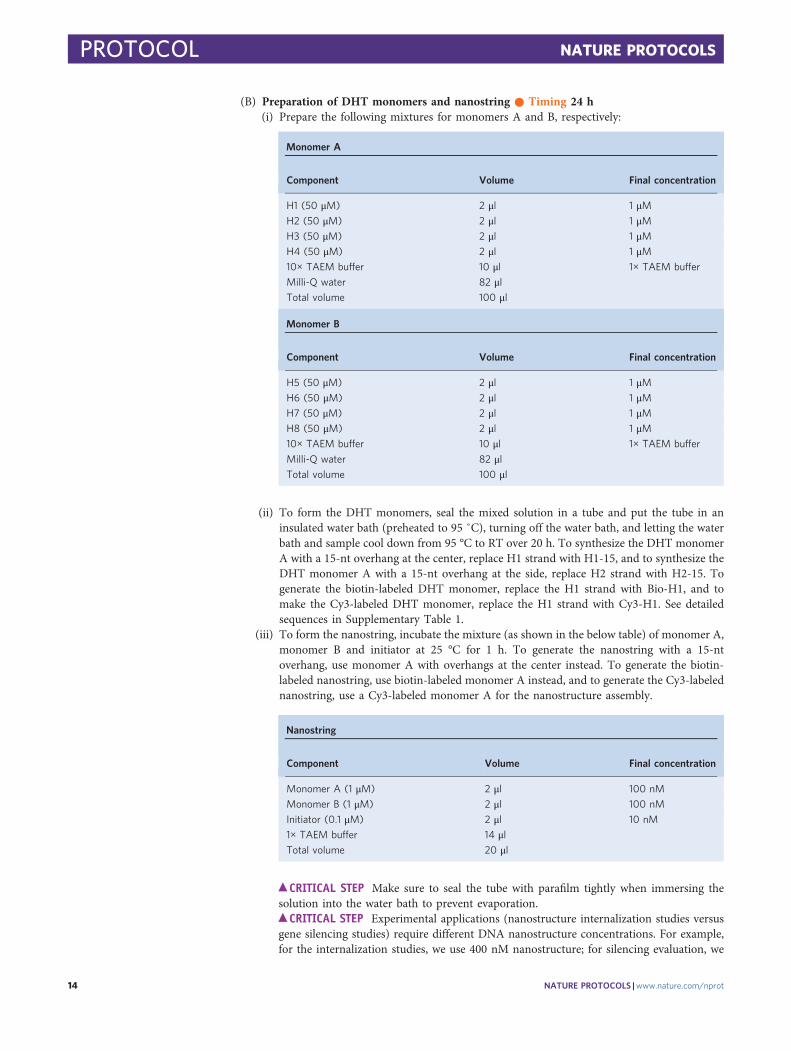
(B) Preparation of DHT monomers and nanostring ● Timing 24 h(i) Prepare the following mixtures for monomers A and B, respectively:
Monomer A
Component Volume Final concentration
H1 (50 μM) 2 μl 1 μMH2 (50 μM) 2 μl 1 μMH3 (50 μM) 2 μl 1 μMH4 (50 μM) 2 μl 1 μM10× TAEM buffer 10 μl 1× TAEM buffer
Milli-Q water 82 μlTotal volume 100 μl
Monomer B
Component Volume Final concentration
H5 (50 μM) 2 μl 1 μMH6 (50 μM) 2 μl 1 μMH7 (50 μM) 2 μl 1 μMH8 (50 μM) 2 μl 1 μM10× TAEM buffer 10 μl 1× TAEM buffer
Milli-Q water 82 μlTotal volume 100 μl
(ii) To form the DHT monomers, seal the mixed solution in a tube and put the tube in aninsulated water bath (preheated to 95 ˚C), turning off the water bath, and letting the waterbath and sample cool down from 95 °C to RT over 20 h. To synthesize the DHT monomerA with a 15-nt overhang at the center, replace H1 strand with H1-15, and to synthesize theDHT monomer A with a 15-nt overhang at the side, replace H2 strand with H2-15. Togenerate the biotin-labeled DHT monomer, replace the H1 strand with Bio-H1, and tomake the Cy3-labeled DHT monomer, replace the H1 strand with Cy3-H1. See detailedsequences in Supplementary Table 1.
(iii) To form the nanostring, incubate the mixture (as shown in the below table) of monomer A,monomer B and initiator at 25 °C for 1 h. To generate the nanostring with a 15-ntoverhang, use monomer A with overhangs at the center instead. To generate the biotin-labeled nanostring, use biotin-labeled monomer A instead, and to generate the Cy3-labelednanostring, use a Cy3-labeled monomer A for the nanostructure assembly.
Nanostring
Component Volume Final concentration
Monomer A (1 μM) 2 μl 100 nM
Monomer B (1 μM) 2 μl 100 nM
Initiator (0.1 μM) 2 μl 10 nM
1× TAEM buffer 14 μlTotal volume 20 μl
c CRITICAL STEP Make sure to seal the tube with parafilm tightly when immersing thesolution into the water bath to prevent evaporation.
c CRITICAL STEP Experimental applications (nanostructure internalization studies versusgene silencing studies) require different DNA nanostructure concentrations. For example,for the internalization studies, we use 400 nM nanostructure; for silencing evaluation, we
PROTOCOL NATURE PROTOCOLS
14 NATURE PROTOCOLS |www.nature.com/nprot
use 100 nM nanostructure. The final concentration of the DNA tetrahedron, monomersand nanostring can be adjusted by changing the quantities of DNA stock solutions used fornanostructure assembly.
j PAUSE POINT DNA nanostructures can be stored at 4 °C for 1 month.
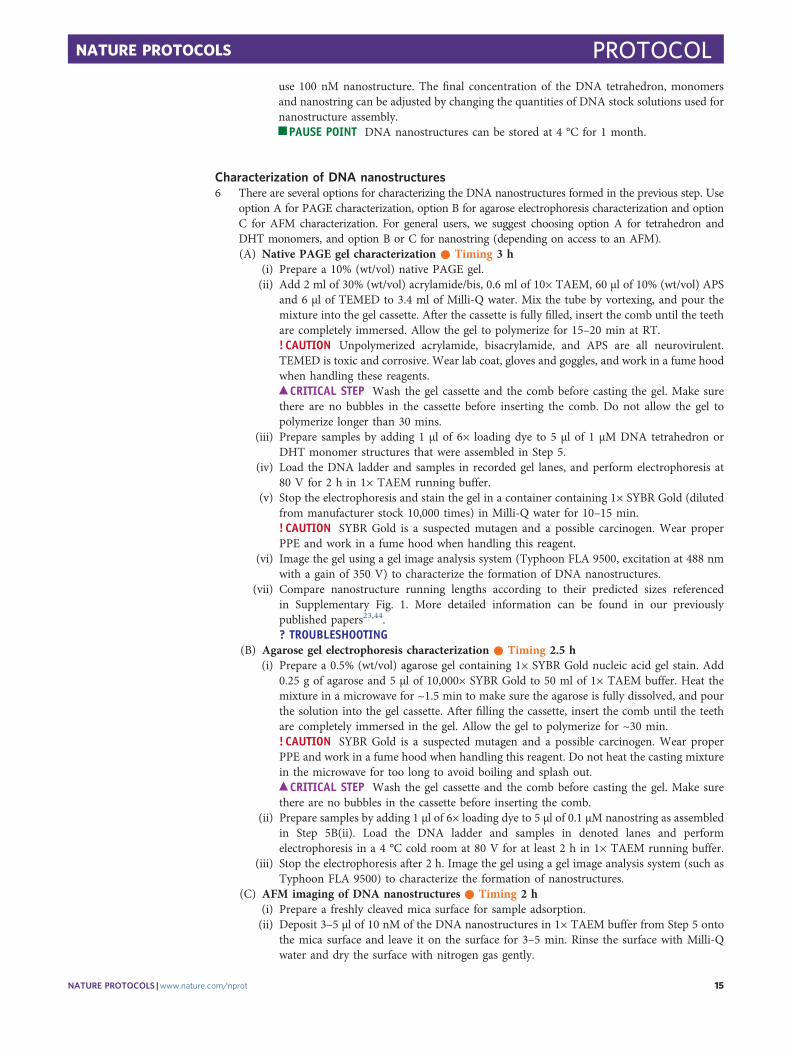
Characterization of DNA nanostructures6 There are several options for characterizing the DNA nanostructures formed in the previous step. Use
option A for PAGE characterization, option B for agarose electrophoresis characterization and optionC for AFM characterization. For general users, we suggest choosing option A for tetrahedron andDHT monomers, and option B or C for nanostring (depending on access to an AFM).(A) Native PAGE gel characterization ● Timing 3 h
(i) Prepare a 10% (wt/vol) native PAGE gel.(ii) Add 2 ml of 30% (wt/vol) acrylamide/bis, 0.6 ml of 10× TAEM, 60 μl of 10% (wt/vol) APS
and 6 μl of TEMED to 3.4 ml of Milli-Q water. Mix the tube by vortexing, and pour themixture into the gel cassette. After the cassette is fully filled, insert the comb until the teethare completely immersed. Allow the gel to polymerize for 15–20 min at RT.! CAUTION Unpolymerized acrylamide, bisacrylamide, and APS are all neurovirulent.TEMED is toxic and corrosive. Wear lab coat, gloves and goggles, and work in a fume hoodwhen handling these reagents.
c CRITICAL STEP Wash the gel cassette and the comb before casting the gel. Make surethere are no bubbles in the cassette before inserting the comb. Do not allow the gel topolymerize longer than 30 mins.
(iii) Prepare samples by adding 1 μl of 6× loading dye to 5 μl of 1 μM DNA tetrahedron orDHT monomer structures that were assembled in Step 5.
(iv) Load the DNA ladder and samples in recorded gel lanes, and perform electrophoresis at80 V for 2 h in 1× TAEM running buffer.
(v) Stop the electrophoresis and stain the gel in a container containing 1× SYBR Gold (dilutedfrom manufacturer stock 10,000 times) in Milli-Q water for 10–15 min.! CAUTION SYBR Gold is a suspected mutagen and a possible carcinogen. Wear properPPE and work in a fume hood when handling this reagent.
(vi) Image the gel using a gel image analysis system (Typhoon FLA 9500, excitation at 488 nmwith a gain of 350 V) to characterize the formation of DNA nanostructures.
(vii) Compare nanostructure running lengths according to their predicted sizes referencedin Supplementary Fig. 1. More detailed information can be found in our previouslypublished papers23,44.? TROUBLESHOOTING
(B) Agarose gel electrophoresis characterization ● Timing 2.5 h(i) Prepare a 0.5% (wt/vol) agarose gel containing 1× SYBR Gold nucleic acid gel stain. Add
0.25 g of agarose and 5 μl of 10,000× SYBR Gold to 50 ml of 1× TAEM buffer. Heat themixture in a microwave for ~1.5 min to make sure the agarose is fully dissolved, and pourthe solution into the gel cassette. After filling the cassette, insert the comb until the teethare completely immersed in the gel. Allow the gel to polymerize for ~30 min.! CAUTION SYBR Gold is a suspected mutagen and a possible carcinogen. Wear properPPE and work in a fume hood when handling this reagent. Do not heat the casting mixturein the microwave for too long to avoid boiling and splash out.
c CRITICAL STEP Wash the gel cassette and the comb before casting the gel. Make surethere are no bubbles in the cassette before inserting the comb.
(ii) Prepare samples by adding 1 μl of 6× loading dye to 5 μl of 0.1 μM nanostring as assembledin Step 5B(ii). Load the DNA ladder and samples in denoted lanes and performelectrophoresis in a 4 °C cold room at 80 V for at least 2 h in 1× TAEM running buffer.
(iii) Stop the electrophoresis after 2 h. Image the gel using a gel image analysis system (such asTyphoon FLA 9500) to characterize the formation of nanostructures.
(C) AFM imaging of DNA nanostructures ● Timing 2 h(i) Prepare a freshly cleaved mica surface for sample adsorption.(ii) Deposit 3–5 μl of 10 nM of the DNA nanostructures in 1× TAEM buffer from Step 5 onto
the mica surface and leave it on the surface for 3–5 min. Rinse the surface with Milli-Qwater and dry the surface with nitrogen gas gently.
NATURE PROTOCOLS PROTOCOL
NATURE PROTOCOLS |www.nature.com/nprot 15
c CRITICAL STEP It is critical to rinse the surface with water to wash off the salt in thesample, otherwise the salts can influence the image and potentially break or foul the AFMtip. Be careful not to damage the samples when gently rinsing and drying the surface.
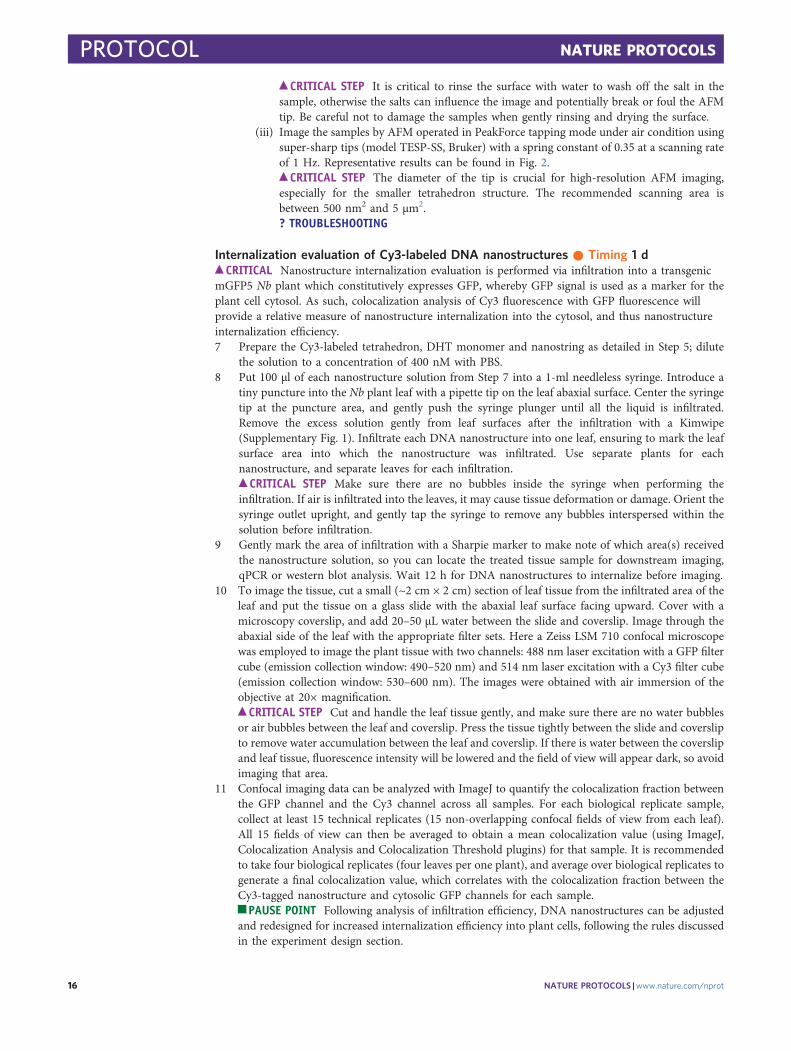
(iii) Image the samples by AFM operated in PeakForce tapping mode under air condition usingsuper-sharp tips (model TESP-SS, Bruker) with a spring constant of 0.35 at a scanning rateof 1 Hz. Representative results can be found in Fig. 2.
c CRITICAL STEP The diameter of the tip is crucial for high-resolution AFM imaging,especially for the smaller tetrahedron structure. The recommended scanning area isbetween 500 nm2 and 5 μm2.? TROUBLESHOOTING
Internalization evaluation of Cy3-labeled DNA nanostructures ● Timing 1 d
c CRITICAL Nanostructure internalization evaluation is performed via infiltration into a transgenicmGFP5 Nb plant which constitutively expresses GFP, whereby GFP signal is used as a marker for theplant cell cytosol. As such, colocalization analysis of Cy3 fluorescence with GFP fluorescence willprovide a relative measure of nanostructure internalization into the cytosol, and thus nanostructureinternalization efficiency.7 Prepare the Cy3-labeled tetrahedron, DHT monomer and nanostring as detailed in Step 5; dilute
the solution to a concentration of 400 nM with PBS.8 Put 100 μl of each nanostructure solution from Step 7 into a 1-ml needleless syringe. Introduce a
tiny puncture into the Nb plant leaf with a pipette tip on the leaf abaxial surface. Center the syringetip at the puncture area, and gently push the syringe plunger until all the liquid is infiltrated.Remove the excess solution gently from leaf surfaces after the infiltration with a Kimwipe(Supplementary Fig. 1). Infiltrate each DNA nanostructure into one leaf, ensuring to mark the leafsurface area into which the nanostructure was infiltrated. Use separate plants for eachnanostructure, and separate leaves for each infiltration.
c CRITICAL STEP Make sure there are no bubbles inside the syringe when performing theinfiltration. If air is infiltrated into the leaves, it may cause tissue deformation or damage. Orient thesyringe outlet upright, and gently tap the syringe to remove any bubbles interspersed within thesolution before infiltration.
9 Gently mark the area of infiltration with a Sharpie marker to make note of which area(s) receivedthe nanostructure solution, so you can locate the treated tissue sample for downstream imaging,qPCR or western blot analysis. Wait 12 h for DNA nanostructures to internalize before imaging.
10 To image the tissue, cut a small (~2 cm × 2 cm) section of leaf tissue from the infiltrated area of theleaf and put the tissue on a glass slide with the abaxial leaf surface facing upward. Cover with amicroscopy coverslip, and add 20–50 μL water between the slide and coverslip. Image through theabaxial side of the leaf with the appropriate filter sets. Here a Zeiss LSM 710 confocal microscopewas employed to image the plant tissue with two channels: 488 nm laser excitation with a GFP filtercube (emission collection window: 490–520 nm) and 514 nm laser excitation with a Cy3 filter cube(emission collection window: 530–600 nm). The images were obtained with air immersion of theobjective at 20× magnification.
c CRITICAL STEP Cut and handle the leaf tissue gently, and make sure there are no water bubblesor air bubbles between the leaf and coverslip. Press the tissue tightly between the slide and coverslipto remove water accumulation between the leaf and coverslip. If there is water between the coverslipand leaf tissue, fluorescence intensity will be lowered and the field of view will appear dark, so avoidimaging that area.
11 Confocal imaging data can be analyzed with ImageJ to quantify the colocalization fraction betweenthe GFP channel and the Cy3 channel across all samples. For each biological replicate sample,collect at least 15 technical replicates (15 non-overlapping confocal fields of view from each leaf).All 15 fields of view can then be averaged to obtain a mean colocalization value (using ImageJ,Colocalization Analysis and Colocalization Threshold plugins) for that sample. It is recommendedto take four biological replicates (four leaves per one plant), and average over biological replicates togenerate a final colocalization value, which correlates with the colocalization fraction between theCy3-tagged nanostructure and cytosolic GFP channels for each sample.
j PAUSE POINT Following analysis of infiltration efficiency, DNA nanostructures can be adjustedand redesigned for increased internalization efficiency into plant cells, following the rules discussedin the experiment design section.
PROTOCOL NATURE PROTOCOLS
16 NATURE PROTOCOLS |www.nature.com/nprot
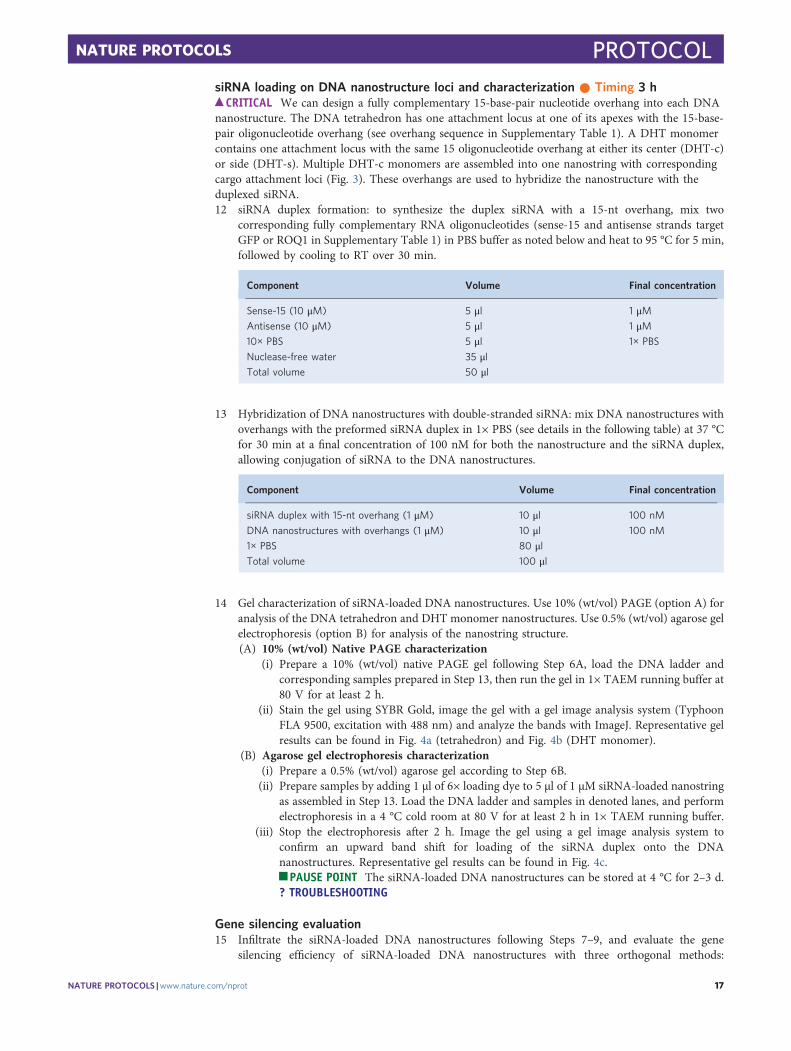
siRNA loading on DNA nanostructure loci and characterization ● Timing 3 h
c CRITICAL We can design a fully complementary 15-base-pair nucleotide overhang into each DNAnanostructure. The DNA tetrahedron has one attachment locus at one of its apexes with the 15-base-pair oligonucleotide overhang (see overhang sequence in Supplementary Table 1). A DHT monomercontains one attachment locus with the same 15 oligonucleotide overhang at either its center (DHT-c)or side (DHT-s). Multiple DHT-c monomers are assembled into one nanostring with correspondingcargo attachment loci (Fig. 3). These overhangs are used to hybridize the nanostructure with theduplexed siRNA.12 siRNA duplex formation: to synthesize the duplex siRNA with a 15-nt overhang, mix two
corresponding fully complementary RNA oligonucleotides (sense-15 and antisense strands targetGFP or ROQ1 in Supplementary Table 1) in PBS buffer as noted below and heat to 95 °C for 5 min,followed by cooling to RT over 30 min.
Component Volume Final concentration
Sense-15 (10 μM) 5 μl 1 μMAntisense (10 μM) 5 μl 1 μM10× PBS 5 μl 1× PBS
Nuclease-free water 35 μlTotal volume 50 μl
13 Hybridization of DNA nanostructures with double-stranded siRNA: mix DNA nanostructures withoverhangs with the preformed siRNA duplex in 1× PBS (see details in the following table) at 37 °Cfor 30 min at a final concentration of 100 nM for both the nanostructure and the siRNA duplex,allowing conjugation of siRNA to the DNA nanostructures.
Component Volume Final concentration
siRNA duplex with 15-nt overhang (1 μM) 10 μl 100 nM
DNA nanostructures with overhangs (1 μM) 10 μl 100 nM
1× PBS 80 μlTotal volume 100 μl
14 Gel characterization of siRNA-loaded DNA nanostructures. Use 10% (wt/vol) PAGE (option A) foranalysis of the DNA tetrahedron and DHT monomer nanostructures. Use 0.5% (wt/vol) agarose gelelectrophoresis (option B) for analysis of the nanostring structure.(A) 10% (wt/vol) Native PAGE characterization
(i) Prepare a 10% (wt/vol) native PAGE gel following Step 6A, load the DNA ladder andcorresponding samples prepared in Step 13, then run the gel in 1× TAEM running buffer at80 V for at least 2 h.
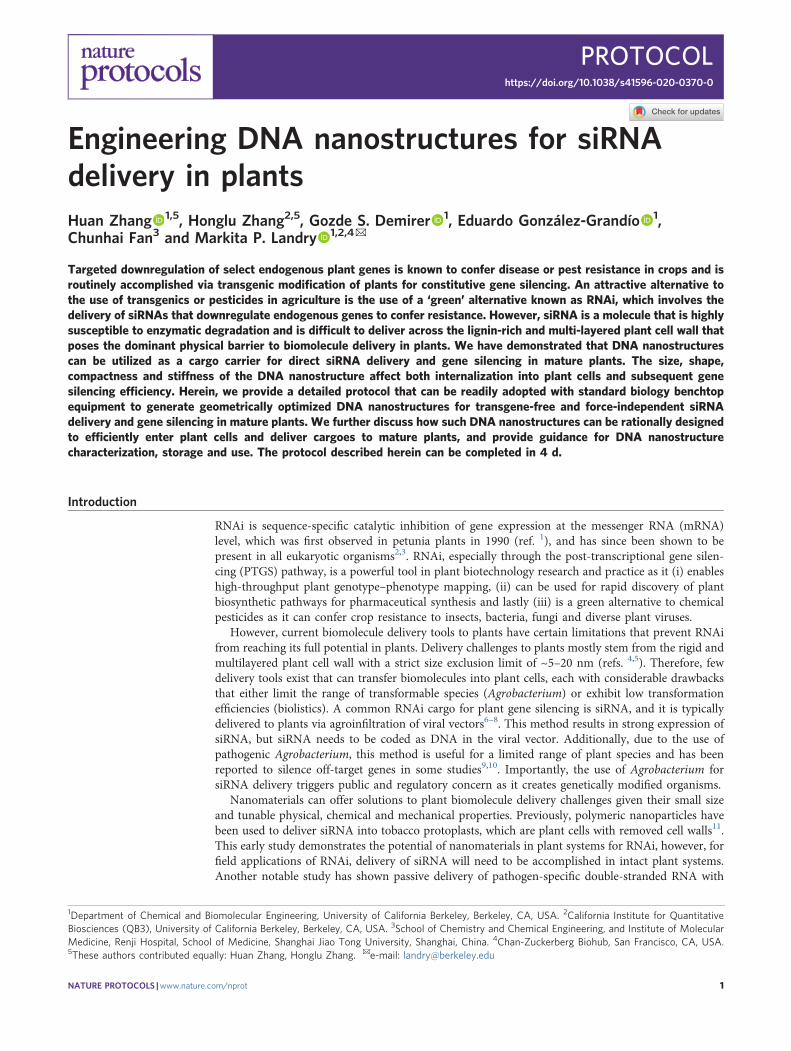
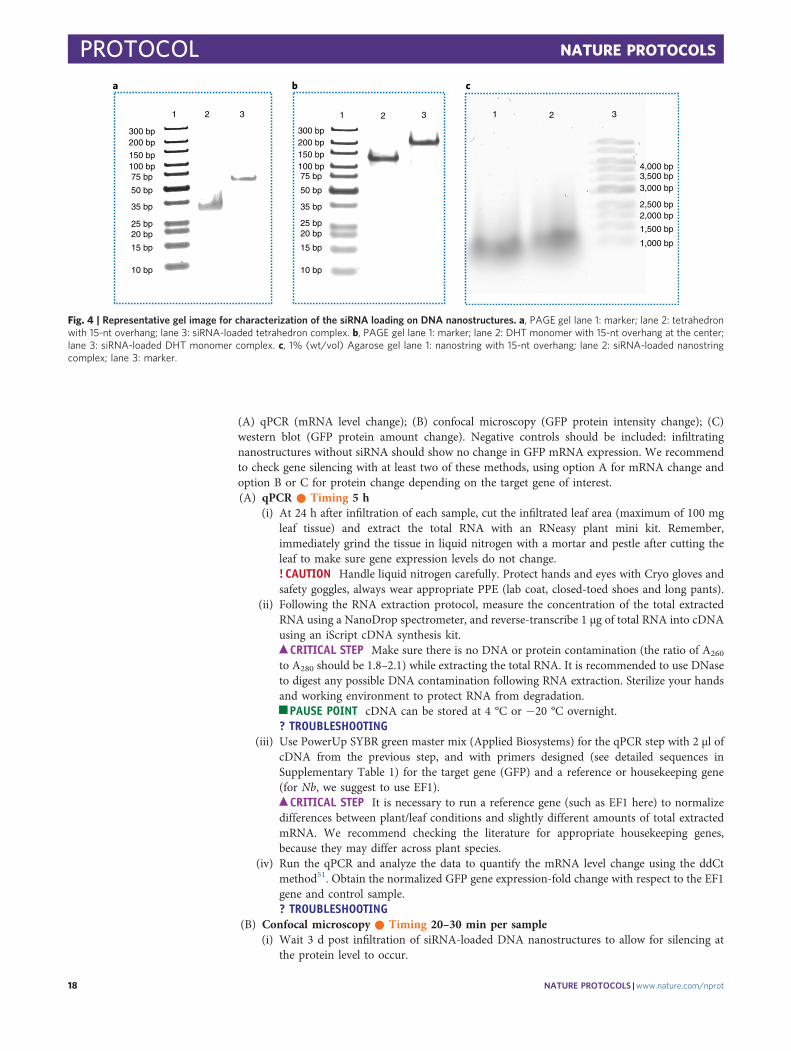
(ii) Stain the gel using SYBR Gold, image the gel with a gel image analysis system (TyphoonFLA 9500, excitation with 488 nm) and analyze the bands with ImageJ. Representative gelresults can be found in Fig. 4a (tetrahedron) and Fig. 4b (DHT monomer).
(B) Agarose gel electrophoresis characterization(i) Prepare a 0.5% (wt/vol) agarose gel according to Step 6B.(ii) Prepare samples by adding 1 μl of 6× loading dye to 5 μl of 1 μM siRNA-loaded nanostring
as assembled in Step 13. Load the DNA ladder and samples in denoted lanes, and performelectrophoresis in a 4 °C cold room at 80 V for at least 2 h in 1× TAEM running buffer.
(iii) Stop the electrophoresis after 2 h. Image the gel using a gel image analysis system toconfirm an upward band shift for loading of the siRNA duplex onto the DNAnanostructures. Representative gel results can be found in Fig. 4c.
j PAUSE POINT The siRNA-loaded DNA nanostructures can be stored at 4 °C for 2–3 d.? TROUBLESHOOTING
Gene silencing evaluation15 Infiltrate the siRNA-loaded DNA nanostructures following Steps 7–9, and evaluate the gene
silencing efficiency of siRNA-loaded DNA nanostructures with three orthogonal methods:
NATURE PROTOCOLS PROTOCOL
NATURE PROTOCOLS |www.nature.com/nprot 17
(A) qPCR (mRNA level change); (B) confocal microscopy (GFP protein intensity change); (C)western blot (GFP protein amount change). Negative controls should be included: infiltratingnanostructures without siRNA should show no change in GFP mRNA expression. We recommendto check gene silencing with at least two of these methods, using option A for mRNA change andoption B or C for protein change depending on the target gene of interest.(A) qPCR ● Timing 5 h
(i) At 24 h after infiltration of each sample, cut the infiltrated leaf area (maximum of 100 mgleaf tissue) and extract the total RNA with an RNeasy plant mini kit. Remember,immediately grind the tissue in liquid nitrogen with a mortar and pestle after cutting theleaf to make sure gene expression levels do not change.! CAUTION Handle liquid nitrogen carefully. Protect hands and eyes with Cryo gloves andsafety goggles, always wear appropriate PPE (lab coat, closed-toed shoes and long pants).
(ii) Following the RNA extraction protocol, measure the concentration of the total extractedRNA using a NanoDrop spectrometer, and reverse-transcribe 1 μg of total RNA into cDNAusing an iScript cDNA synthesis kit.
c CRITICAL STEP Make sure there is no DNA or protein contamination (the ratio of A260
to A280 should be 1.8–2.1) while extracting the total RNA. It is recommended to use DNaseto digest any possible DNA contamination following RNA extraction. Sterilize your handsand working environment to protect RNA from degradation.
j PAUSE POINT cDNA can be stored at 4 °C or −20 °C overnight.? TROUBLESHOOTING
(iii) Use PowerUp SYBR green master mix (Applied Biosystems) for the qPCR step with 2 μl ofcDNA from the previous step, and with primers designed (see detailed sequences inSupplementary Table 1) for the target gene (GFP) and a reference or housekeeping gene(for Nb, we suggest to use EF1).
c CRITICAL STEP It is necessary to run a reference gene (such as EF1 here) to normalizedifferences between plant/leaf conditions and slightly different amounts of total extractedmRNA. We recommend checking the literature for appropriate housekeeping genes,because they may differ across plant species.
(iv) Run the qPCR and analyze the data to quantify the mRNA level change using the ddCtmethod51. Obtain the normalized GFP gene expression-fold change with respect to the EF1gene and control sample.? TROUBLESHOOTING
(B) Confocal microscopy ● Timing 20–30 min per sample(i) Wait 3 d post infiltration of siRNA-loaded DNA nanostructures to allow for silencing at
the protein level to occur.
1
1 2 3
10 bp
20 bp
15 bp
25 bp
35 bp
50 bp
75 bp100 bp150 bp200 bp300 bp
1 2 3 51 2 3
10 bp
20 bp
15 bp
25 bp
35 bp
50 bp
75 bp100 bp150 bp
200 bp300 bp
1 2 3 4 5
1 2 3
1,000 bp
2,000 bp
1,500 bp
2,500 bp
3,000 bp 3,500 bp 4,000 bp
a b c
Fig. 4 | Representative gel image for characterization of the siRNA loading on DNA nanostructures. a, PAGE gel lane 1: marker; lane 2: tetrahedronwith 15-nt overhang; lane 3: siRNA-loaded tetrahedron complex. b, PAGE gel lane 1: marker; lane 2: DHT monomer with 15-nt overhang at the center;lane 3: siRNA-loaded DHT monomer complex. c, 1% (wt/vol) Agarose gel lane 1: nanostring with 15-nt overhang; lane 2: siRNA-loaded nanostringcomplex; lane 3: marker.
PROTOCOL NATURE PROTOCOLS
18 NATURE PROTOCOLS |www.nature.com/nprot
(ii) Cut a small (~2 cm × 2 cm) area of the infiltrated leaf tissue and put the cut tissue on aglass slide with the abaxial leaf surface facing upward. Cover with coverslip, and add20–50 μL water between the slide and coverslip. Image through the abaxial side of the leafwith the appropriate filter sets. Here, a Zeiss LSM 710 confocal microscope was employedto image the plant tissue and collect all the GFP fluorescence intensity by Z-stack scanningwith 488 nm laser excitation by a GFP filter cube (emission collecting window:490–520 nm).
(iii) Analyze the data (GFP fluorescence intensity) using ImageJ software.(C) Western blot ● Timing 24 h
(i) Harvest plant leaves 3 d post infiltration with siRNA-loaded DNA nanostructures andgrind them in liquid nitrogen to recover dry frozen powder.
(ii) Transfer the frozen powder to a tube with prechilled lysis buffer containing 10 mM Tris/HCl (pH 7.5), 150 mM NaCl, 1 mM EDTA, 0.1% (vol/vol) NP-40, 5% (vol/vol) glyceroland 1% (vol/vol) protease inhibitor cocktail.
c CRITICAL STEP Immerse the tube in liquid nitrogen before use, and always put the tubeand buffer on ice to protect proteins. Volumes of lysis buffer must be determined inrelation to the amount of tissue present. Here, for 50–100 mg tissue, we recommend300–400 µl lysis buffer. Samples can be stored at −80 °C for later use, or kept on ice forimmediate homogenization.
(iii) Lyse tissue on ice for 1–2 h, then centrifuge the tubes at 15,000g at 4 °C for 20 min.Following centrifugation, gently transfer the supernatants containing whole proteins to anew clean tube. Quantify total extracted proteins with a Pierce 660 nm protein assay(Thermo Fisher).
c CRITICAL STEP The protein extract should not be too dilute to avoid loss of protein.Dilute as needed for loading into the gel wells. The minimum recommended proteinconcentration is 0.1 mg/ml, and the optimal protein concentration is 1–5 mg/ml.
(iv) Mix the samples with a loading buffer (Laemmli Sample Buffer, containing 1% (vol/vol) of2-mercaptoethanol) appropriate for gel electrophoresis, and boil the mixture at 95–100 °Cfor 5 min. Load 0.5 µg of normalized total proteins from each sample and analyze withSDS–PAGE gel (Bio-Rad precast tris/glycine gel, 4–20% gradient); run at 120 V for 60 min.
c CRITICAL STEP The amount of loaded proteins can vary and may need optimizationaccording to the target proteins. The sample should be mixed by vortexing before and afterthe heating step to obtain the best resolution.
(v) Transfer the gel to a PVDF membrane in cold transfer buffer and run at 400 mA in 1×transfer buffer with methanol for no more than 60 min in a cold room with an ice block.
c CRITICAL STEP Rinse the gel 1–2 times using transfer buffer before performing thetransfer, to wash off any residual SDS from running the gel. Activate the PVDF membranein methanol for a few minutes. Perform the assembly in prechilled running buffer, and donot touch surface of the membrane. With a pencil, mark the membrane corner forthe following staining step. Do not run the transfer longer than 1 h to avoid running out ofprotein.
(vi) Block the membrane for 1 h using 7.5% (wt/vol) BSA in 1× TBST buffer followed byovernight incubation at 4 °C with the primary GFP antibody as required (1:2,000 dilution).After washing with 1× TBST buffer three times (5 min each time), the correspondingprotein bands can be probed with a goat anti-rabbit horseradish peroxidase-conjugatedantibody (1:5,000 dilution; Abcam, cat. no. ab205718) for 30 min. After washing, the bandcan be developed by incubation with chemiluminescence (Amersham ECL prime kit) in<2 min and imaged with a ChemiDoc XRS+ system.
c CRITICAL STEP The primary GFP antibody can be reused in these 4 °C overnightconditions. You can also incubate the membrane with the primary antibody at RT for 1 hto save time without further reuse of the antibody. The dilution ratio of the primary andsecondary antibody needs to be optimized depending on the protein. Do not incubate withthe detection kit for more than 2 min.
(vii) Quantify the intensity of GFP bands with ImageJ software.? TROUBLESHOOTING
NATURE PROTOCOLS PROTOCOL
NATURE PROTOCOLS |www.nature.com/nprot 19
Troubleshooting
Troubleshooting advice can be found in Table 2.
Timing
Steps 1–4, DNA strand stock solution preparation: 1 hStep 5A, DNA tetrahedron nanostructure construction: 30 minStep 5B, HT monomer and nanostring nanostructure assembly: 24 hStep 6, characterization of DNA nanostructures: 6 hSteps 7–11, internalization study of Cy3-labeled DNA nanostructures: 20–30 min per sample +overnightSteps 12–14, siRNA loading on the specific loci of the DNA nanostructures and characterization: 4 hStep 15A, qPCR analysis: 5 h
Table 2 | Troubleshooting table
Step Problem Possible reason Solution
6A(vii) Free DNA single strands and lowyield of DNA nanostructures
The strands used for the formation ofthe nanostructure are not inequimolar ratios
Quantify the DNA strand concentration using the UVspectrophotometer more precisely (A value isbetween 0.1 to 0.8), measure three times and use theaverage value to calculate the concentration
6C(iii) Too many deposited nanostructuresthat are not clearly distinguishedfrom each other; too fewnanostructures observed in AFM
The sample concentration is too highor too low; adsorption time of sampleon mica is too long or too short
Increase or decrease the sample concentrationaccordingly, a final nanostructure concentration of5–10 nM is recommended; increase or decrease theadsorption time for sample preparation, 3–5 min isrecommended
AFM image background is dirty Salt in the buffer deposits and dries onthe mica surface; AFM tip is dirty
Rinse the mica surface after nanostructure adsorptionusing Milli-Q water more times, and gently dry thesurface; double check the tip, replace with new tip
14 Nanostructure not fully loaded withsiRNA duplex, several bandsobserved in the gel
The concentration of siRNA and DNAnanostructures is not at the equalstoichiometry
Make sure to calculate the concentration of both RNAand DNA precisely, double check the formation of thesiRNA duplex and DNA nanostructures separatelybefore attempting their hybridization
siRNA duplex is not formed well orpartial degradation of RNA
Remeasure the concentration of the two RNA strand,and keep the single-strand RNA at −20 °C or −80 °C.
15A(ii) Not enough total RNA extracted,RNA degradation, RNAcontamination with DNA
Unhealthy leaf tissue, contaminationduring the extraction, genomic DNA inthe extraction
Use healthy leaf tissue for maximal RNA extraction.Infiltrate larger volume of the sample, or do multipleleaf infiltrations at one time. Keep a sterile workenvironment during the extraction process. Treatextracted RNA with DNAse following RNA extraction
15A(iv) No read or substantial variation inthe quantification cycle (Cq) readcopy number for the GFP geneduring qPCR analysis
Missing primers or incorrectprimer design
Review the primer design and qPCR process. Becareful when mixing the qPCR solutions and makesure every component is added in correct amounts.Perform multiple replicates of each sample. Check thereference gene readout to make sure the process isperformed correctly
15C(vii) No protein band is observed afterthe blotting
Gel is running too long, and proteinsare running out of the gel
Check the molecular weight of the target protein, usea colored protein marker that can be seen by eye
Blot membrane quality is poor,blotting process is unsuccessful
Remember to activate the membrane before doing theblot; make sure there are no bubbles between the geland the membrane; double check the detection kit,and the imaging system setup
Antibody cannot probe the protein Double check the target protein detection range andspecificity with the manufacturer, double check yourtarget protein sequence to ensure the antibody canbind the target protein
The gel band overflows, or anonspecific band is observed
Too much protein was loaded; theprobing antibody was loaded inexcess, or the incubation time was toolong; incubation with the detection kitsolution was performed for too long
Always quantify the protein before loading; optimizethe dilution ratio of antibodies; limit the incubationtime with the detection kit to <2 min. Wash themembrane at least three times for 5 min each washfollowing incubation with antibodies
PROTOCOL NATURE PROTOCOLS
20 NATURE PROTOCOLS |www.nature.com/nprot
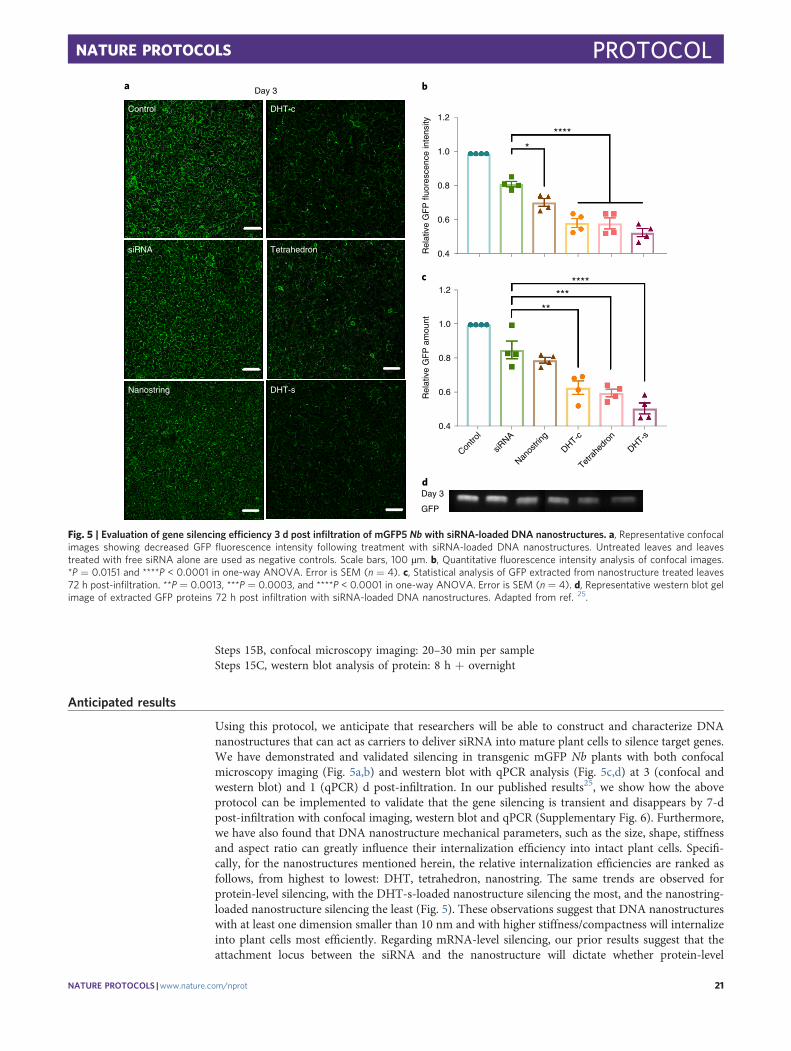
Steps 15B, confocal microscopy imaging: 20–30 min per sampleSteps 15C, western blot analysis of protein: 8 h + overnight
Anticipated results
Using this protocol, we anticipate that researchers will be able to construct and characterize DNAnanostructures that can act as carriers to deliver siRNA into mature plant cells to silence target genes.We have demonstrated and validated silencing in transgenic mGFP Nb plants with both confocalmicroscopy imaging (Fig. 5a,b) and western blot with qPCR analysis (Fig. 5c,d) at 3 (confocal andwestern blot) and 1 (qPCR) d post-infiltration. In our published results25, we show how the aboveprotocol can be implemented to validate that the gene silencing is transient and disappears by 7-dpost-infiltration with confocal imaging, western blot and qPCR (Supplementary Fig. 6). Furthermore,we have also found that DNA nanostructure mechanical parameters, such as the size, shape, stiffnessand aspect ratio can greatly influence their internalization efficiency into intact plant cells. Specifi-cally, for the nanostructures mentioned herein, the relative internalization efficiencies are ranked asfollows, from highest to lowest: DHT, tetrahedron, nanostring. The same trends are observed forprotein-level silencing, with the DHT-s-loaded nanostructure silencing the most, and the nanostring-loaded nanostructure silencing the least (Fig. 5). These observations suggest that DNA nanostructureswith at least one dimension smaller than 10 nm and with higher stiffness/compactness will internalizeinto plant cells most efficiently. Regarding mRNA-level silencing, our prior results suggest that theattachment locus between the siRNA and the nanostructure will dictate whether protein-level
c
a b
Day 3
DHT-s
Tetra
hedr
on
DHT-c
Nanos
tring
siRNA
Contro
lR
elat
ive
GF
P a
mou
ntR
elat
ive
GF
P fl
uore
scen
ce in
tens
ity
GFP
Control
siRNA
Nanostring
Tetrahedron
DHT-c
DHT-s
Day 3
d
1.2
1.0
0.8
0.6
0.4
1.2
1.0
0.8
*****
****
*****
0.6
0.4
Fig. 5 | Evaluation of gene silencing efficiency 3 d post infiltration of mGFP5 Nb with siRNA-loaded DNA nanostructures. a, Representative confocalimages showing decreased GFP fluorescence intensity following treatment with siRNA-loaded DNA nanostructures. Untreated leaves and leavestreated with free siRNA alone are used as negative controls. Scale bars, 100 µm. b, Quantitative fluorescence intensity analysis of confocal images.*P = 0.0151 and ****P < 0.0001 in one-way ANOVA. Error is SEM (n = 4). c, Statistical analysis of GFP extracted from nanostructure treated leaves72 h post-infiltration. **P = 0.0013, ***P = 0.0003, and ****P < 0.0001 in one-way ANOVA. Error is SEM (n = 4). d, Representative western blot gelimage of extracted GFP proteins 72 h post infiltration with siRNA-loaded DNA nanostructures. Adapted from ref. 25.
NATURE PROTOCOLS PROTOCOL
NATURE PROTOCOLS |www.nature.com/nprot 21
silencing is accomplished via transcriptional or post-transcriptional gene silencing. Specifically,siRNA delivered to mGFP5 Nb via attachment to the apex of the tetrahedron nanostructure shows astrong decrease in the GFP mRNA as measured by qPCR, suggesting that the silencing mechanism isthrough the canonical degradation of transcriptional mRNA. However, siRNA delivered viaattachment to either locus of the DHT or the nanostring shows an increase in GFP mRNA, suggestingthat the silencing mechanism is through translational repression but not mRNA degradation(Supplementary Fig. 7). Because all nanostructures show protein-level silencing, we propose that theattachment locus may affect the endogenous gene silencing mechanism undertaken by the plant, as afunction of the siRNA steric accessibility: siRNA is more accessible when on the vertex of thetetrahedron, and less accessible when attached to the surface of DHTs or nanostrings. Researchersshould therefore consider the steric accessibility of the siRNA based on its attachment point to theDNA nanostructure if a specific gene silencing mechanism is desired. Furthermore, we show thatDNA nanostructures do not induce upregulation of plant biotic and abiotic stress genes as measuredwith qPCR (Supplementary Figs. 8 and 9), and that we can also target silencing of an endogenousgene (ROQ1) that confers resistance against many pathogens52,53 (Supplementary Fig. 10). We alsotested the stability and likely intracellular fate of DNA nanostructures by incubating the samequantity of DNA nanostructures we employed for RNA delivery (0.01 nmol) with plant cell lysate fora range of times (0–96 h). Results in Supplementary Fig. 11 indicate that DHT nanostructures arestable for ~24 h and then are gradually degraded over time.
Reporting SummaryFurther information on research design is available in the Nature Research Reporting Summarylinked to this article.
Data availabilityAll materials are available from commercial sources or can be derived using methods described in thisstudy. All data and controls relevant to the protocol have been included in the SupplementaryInformation. Raw data such as unprocessed image files can be obtained from the correspondingauthor upon reasonable request.
References
1. Napoli, C., Lemieux, C. & Jorgensen, R. Introduction of a chimeric chalcone synthase gene into petuniaresults in reversible co-suppression of homologous genes in trans. Plant Cell 2, 279–289 (1990).
2. Davis, M. E. et al. Evidence of RNAi in humans from systemically administered siRNA via targeted nano-particles. Nature 464, 1067–U1140 (2010).
3. Fire, A. et al. Potent and specific genetic interference by double-stranded RNA in Caenorhabditis elegans.Nature 391, 806–811 (1998).
4. Cunningham, F. J., Goh, N. S., Demirer, G. S., Matos, J. L. & Landry, M. P. Nanoparticle-mediated deliverytowards advancing plant genetic engineering. Trends Biotechnol. 36, 882–897 (2018).
5. Demirer, G. S. & Landry, M. P. Delivering genes to plants. Chem. Eng. Prog. 113, 40–45 (2017).6. Pereira, A. Plant Reverse Genetics: Methods and Protocols (Humana Press, 2011).7. Zhang, J. et al. Vacuum and co-cultivation agroinfiltration of (germinated) seeds results in tobacco rattle
virus (TRV) mediated whole-plant virus-induced gene silencing (VIGS) in wheat and maize. Front. Plant Sci.8, 393 (2017).
8. da Cunha, N. B. et al. The next generation of antimicrobial peptides (AMPs) as molecular therapeutic toolsfor the treatment of diseases with social and economic impacts. Drug Discov. Today 22, 234–248 (2017).
9. Xu, P., Zhang, Y. J., Kang, L., Roossinck, M. J. & Mysore, K. S. Computational estimation and experimentalverification of off-target silencing during posttranscriptional gene silencing in plants. Plant Physiol. 142,429–440 (2006).
10. Kodama, H. & Komamine, A. RNAi and Plant Gene Function Analysis: Methods and Protocols(Springer, 2011).
11. Silva, A. T., Nguyen, A., Ye, C., Verchot, J. & Moon, J. H. Conjugated polymer nanoparticles for effectivesiRNA delivery to tobacco BY-2 protoplasts. BMC Plant Biol. 10, 291 (2010).
12. Mitter, N. et al. Clay nanosheets for topical delivery of RNAi for sustained protection against plant viruses.Nat. Plants 3, 16207 (2017).
13. Demirer, G. S. et al. Carbon nanocarriers deliver siRNA to intact plant cells for efficient gene knockdown. Sci.Adv. 6, eaaz0495 (2020).
14. Sun, W. J. et al. Cocoon-like self-degradable DNA nanoclew for anticancer drug delivery. J. Am. Chem. Soc.136, 14722–14725 (2014).
15. Ruan, W. M. et al. DNA nanoclew templated spherical nucleic acids for siRNA delivery. Chem. Commun. 54,3609–3612 (2018).
PROTOCOL NATURE PROTOCOLS
22 NATURE PROTOCOLS |www.nature.com/nprot
16. Hu, Q. Q., Li, H., Wang, L. H., Gu, H. Z. & Fan, C. H. DNA nanotechnology-enabled drug delivery systems.Chem. Rev. 119, 6459–6506 (2019).
17. Kostiainen, M. & Linko, V. DNA nanostructures as innovative vehicles for smart drug delivery. Eur. J. Hum.Genet. 27, 768–769 (2019).
18. Jiang, Q., Liu, S. L., Liu, J. B., Wang, Z. G. & Ding, B. Q. Rationally designed DNA-origami nanomaterials fordrug delivery in vivo. Adv. Mater. 31, 1804781–1804786 (2019).
19. Sun, W. et al. Self-assembled DNA nanoclews for the efficient delivery of CRISPR–Cas9 for genome editing.Ang. Chem. Int. Ed. 54, 12029–12033 (2015).
20. Madhanagopal, B. R., Zhang, S., Demirel, E., Wady, H. & Chandrasekaran, A. R. DNA nanocarriers: pro-grammed to deliver. Trends Biochem. Sci. 43, 997–1013 (2018).
21. Linko, V., Ora, A. & Kostiainen, M. A. DNA nanostructures as smart drug-delivery vehicles and moleculardevices. Trends Biotechnol. 33, 586–594 (2015).
22. Li, J., Fan, C., Pei, H., Shi, J. & Huang, Q. Smart drug delivery nanocarriers with self-assembled DNAnanostructures. Adv. Mater. 25, 4386–4396 (2013).
23. Zhang, H. et al. Programming chain-growth copolymerization of DNA hairpin tiles for in-vitro hierarchicalsupramolecular organization. Nat. Commun. 10, 1006 (2019).
24. Li, J. et al. Self-assembled multivalent DNA nanostructures for noninvasive intracellular delivery of immu-nostimulatory CpG oligonucleotides. Acs Nano 5, 8783–8789 (2011).
25. Zhang, H. et al. DNA nanostructures coordinate gene silencing in mature plants. Proc. Natl Acad. Sci. USA116, 7543–7548 (2019).
26. Bastings, M. M. C. et al. Modulation of the cellular uptake of DNA origami through control over mass andshape. Nano Lett. 18, 3557–3564 (2018).
27. Webster, D. E. & Thomas, M. C. Post-translational modification of plant-made foreign proteins; glycosy-lation and beyond. Biotechnol. Adv. 30, 410–418 (2012).
28. Withers, J. & Dong, X. N. Post-translational regulation of plant immunity. Curr. Opin. Plant Biol. 38,124–132 (2017).
29. Bila, H., Kurisinkal, E. E. & Bastings, M. M. C. Engineering a stable future for DNA-origami as a biomaterial.Biomater Sci. 7, 532–541 (2019).
30. Altpeter, F. et al. Advancing crop transformation in the era of genome editing. Plant Cell 28,1510–1520 (2016).
31. Wang, P., Lombi, E., Zhao, F. J. & Kopittke, P. M. Nanotechnology: a new opportunity in plant sciences.Trends Plant Sci. 21, 699–712 (2016).
32. Baulcombe, D. RNA silencing in plants. Nature 431, 356–363 (2004).33. Meister, G. & Tuschl, T. Mechanisms of gene silencing by double-stranded RNA. Nature 431,
343–349 (2004).34. Johansen, L. K. & Carrington, J. C. Silencing on the spot. Induction and suppression of RNA silencing in the
Agrobacterium-mediated transient expression system. Plant Physiol. 126, 930–938 (2001).35. Dalakouras, A. et al. Induction of silencing in plants by high-pressure spraying of in vitro-synthesized small
RNAs. Front. Plant Sci. 7, 1327 (2016).36. Tang, W., Weidner, D. A., Hu, B. Y., Newton, R. J. & Hu, X. H. Efficient delivery of small interfering RNA to
plant cells by a nanosecond pulsed laser-induced stress wave for posttranscriptional gene silencing. Plant Sci.171, 375–381 (2006).
37. Cheon, S. H. et al. Effective delivery of siRNA to transgenic rice cells for enhanced transfection using PEI-based polyplexes. Biotechnol. Bioproc. E 22, 577–585 (2017).
38. Unnamalai, N., Kang, B. G. & Lee, W. S. Cationic oligopeptide-mediated delivery of dsRNA for post-transcriptional gene silencing in plant cells. FEBS Lett. 566, 301–310 (2004). 307.
39. Numata, K., Ohtani, M., Yoshizumi, T., Demura, T. & Kodama, Y. Local gene silencing in plants via syntheticdsRNA and carrier peptide. Plant Biotechnol. J. 12, 1027–1034 (2014).
40. Bao, W. L., Wang, J. Y., Wang, Q., O’Hare, D. & Wan, Y. L. Layered double hydroxide nanotransporter formolecule delivery to intact plant cells. Sci. Rep. 6, 26738 (2016).
41. Schwartz, S. H., Hendrix, B., Hoffer, P., Sanders, R. A. & Zheng, W. Carbon dots for efficient siRNA deliveryand gene silencing in plants. Preprint at https://www.biorxiv.org/content/10.1101/722595v1 (2019).
42. Winfree, E., Liu, F., Wenzler, L. A. & Seeman, N. C. Design and self-assembly of two-dimensional DNAcrystals. Nature 394, 539–544 (1998).
43. Dirks, R. M. & Pierce, N. A. Triggered amplification by hybridization chain reaction. Proc. Natl Acad. Sci.USA 101, 15275–15278 (2004).
44. Lin, M. H. et al. Programmable engineering of a biosensing interface with tetrahedral DNA nanostructuresfor ultrasensitive DNA detection. Angew. Chem. Int. Ed. 54, 2151–2155 (2015).
45. Nicot, N., Hausman, J. F., Hoffmann, L. & Evers, D. Housekeeping gene selection for real-time RT-PCRnormalization in potato during biotic and abiotic stress. J. Exp. Bot. 56, 2907–2914 (2005).
46. Kim, H. et al. ‘Shotgun DNA synthesis’ for the high-throughput construction of large DNA molecules.Nucleic Acids Res. 40, e140 (2012).
47. Castro, C. E. et al. A primer to scaffolded DNA origami. Nat. Methods 8, 221–229 (2011).48. Douglas, S. M. et al. Rapid prototyping of 3D DNA-origami shapes with caDNAno. Nucleic Acids Res. 37,
5001–5006 (2009).
NATURE PROTOCOLS PROTOCOL
NATURE PROTOCOLS |www.nature.com/nprot 23
49. Liu, Q. et al. Carbon nanotubes as molecular transporters for walled plant cells. Nano Lett. 9,1007–1010 (2009).
50. Tang, W. et al. Post-transcriptional gene silencing induced by short interfering RNAs in cultured transgenicplant cells. Genomics Proteomics Bioinformatics 2, 97–108 (2004).
51. Schmittgen, T. D. & Livak, K. J. Analyzing real-time PCR data by the comparative CT method. Nat. Prot. 3,1101–1108 (2008).
52. Thomas, N. C. et al. Roq1 confers resistance to Xanthomonas, Pseudomonas syringae and Ralstonia sola-nacearum in tomato. Preprint at https://www.biorxiv.org/content/10.1101/813758v2 (2020).
53. Schultink, A., Qi, T. C., Lee, A., Steinbrenner, A. D. & Staskawicz, B. Roq1 mediates recognition of theXanthomonas and Pseudomonas effector proteins XopQ and HopQ1. Plant J. 92, 787–795 (2017).
54. Chuang, C. F. & Meyerowitz, E. M. Specific and heritable genetic interference by double-stranded RNA inArabidopsis thaliana. Proc. Natl Acad. Sci. USA 97, 4985–4990 (2000).
55. Schweizer, P., Pokorny, J., Schulze-Lefert, P. & Dudler, R. Double-stranded RNA interferes with genefunction at the single-cell level in cereals. Plant J. 24, 895–903 (2000).
56. Klahre, U., Crete, P., Leuenberger, S. A., Iglesias, V. A. & Meins, F. High molecular weight RNAs and smallinterfering RNAs induce systemic posttranscriptional gene silencing in plants. Proc. Natl Acad. Sci. USA 99,11981–11986 (2002).
57. Kwak, S.-Y. et al. Chloroplast-selective gene delivery and expression in planta using chitosan-complexedsingle-walled carbon nanotube carriers. Nat. Nanotechnol. 14, 447–455 (2019).
58. Demirer, G. S. et al. High aspect ratio nanomaterials enable delivery of functional genetic material withoutDNA integration in mature plants. Nat. Nanotechnol. 14, 456–464 (2019).
AcknowledgementsHu. Z. acknowledges the support of the Chinese National Natural Science Foundation (21605153). The authors acknowledge supportfrom a Burroughs Wellcome Fund Career Award at the Scientific Interface (CASI), a Stanley Fahn PDF Junior Faculty Grant under awardno. PF-JFA-1760, a Beckman Foundation Young Investigator Award, a USDA AFRI award, a grant from the Gordon and Betty MooreFoundation, a USDA NIFA award, a USDA-BBT EAGER award, support from the Chan-Zuckerberg Foundation and an FFAR NewInnovator Award (to M.P.L.). G.S.D. is supported by a Schlumberger Foundation Faculty for the Future Fellowship. The authors alsoacknowledge support from UC Berkeley Molecular Imaging Center (supported by the Gordon and Betty Moore Foundation), the QB3Shared Stem Cell Facility and the Innovative Genomics Institute (IGI).
Author contributionsHu. Z. and M.P.L designed the experiments, and C.F. helped with the experimental design. Hu. Z. and Ho. Z. performed the simulationsand experiments. Hu. Z. and G.S.D analyzed the data and created the figures. Hu. Z., Ho. Z., G.S.D, and E.G.-G. wrote the manuscript. Allauthors revised and approved the manuscript.
Competing interestsThe authors declare no competing interests.
Additional informationSupplementary information is available for this paper at https://doi.org/10.1038/s41596-020-0370-0.
Correspondence and requests for materials should be addressed to M.P.L.
Peer review information Nature Protocols thanks Veikko Linko and the other, anonymous, reviewer(s) for their contribution to the peerreview of this work.
Reprints and permissions information is available at www.nature.com/reprints.
Publisher’s note Springer Nature remains neutral with regard to jurisdictional claims in published maps and institutional affiliations.
Received: 14 December 2019; Accepted: 29 May 2020;
Related linksKey references using this protocolZhang, H. et al. Proc. Natl Acad. Sci. USA 116, 7543–7548 (2019): https://doi.org/10.1073/pnas.1818290116Zhang, H. et al. Nat. Commun. 10, 1006 (2019): https://doi.org/10.1038/s41467-019-09004-4
PROTOCOL NATURE PROTOCOLS
24 NATURE PROTOCOLS |www.nature.com/nprot

1
nature research | reporting summ
aryO
ctober 2018
Corresponding author(s): Markita Landry
Last updated by author(s): Apr 24, 2020
Reporting SummaryNature Research wishes to improve the reproducibility of the work that we publish. This form provides structure for consistency and transparency in reporting. For further information on Nature Research policies, see Authors & Referees and the Editorial Policy Checklist.
StatisticsFor all statistical analyses, confirm that the following items are present in the figure legend, table legend, main text, or Methods section.
n/a Confirmed
The exact sample size (n) for each experimental group/condition, given as a discrete number and unit of measurement
A statement on whether measurements were taken from distinct samples or whether the same sample was measured repeatedly
The statistical test(s) used AND whether they are one- or two-sided Only common tests should be described solely by name; describe more complex techniques in the Methods section.
A description of all covariates tested
A description of any assumptions or corrections, such as tests of normality and adjustment for multiple comparisons
A full description of the statistical parameters including central tendency (e.g. means) or other basic estimates (e.g. regression coefficient) AND variation (e.g. standard deviation) or associated estimates of uncertainty (e.g. confidence intervals)
For null hypothesis testing, the test statistic (e.g. F, t, r) with confidence intervals, effect sizes, degrees of freedom and P value noted Give P values as exact values whenever suitable.
For Bayesian analysis, information on the choice of priors and Markov chain Monte Carlo settings
For hierarchical and complex designs, identification of the appropriate level for tests and full reporting of outcomes
Estimates of effect sizes (e.g. Cohen's d, Pearson's r), indicating how they were calculated
Our web collection on statistics for biologists contains articles on many of the points above.
Software and codePolicy information about availability of computer code
Data collection N/A
Data analysis N/A
For manuscripts utilizing custom algorithms or software that are central to the research but not yet described in published literature, software must be made available to editors/reviewers. We strongly encourage code deposition in a community repository (e.g. GitHub). See the Nature Research guidelines for submitting code & software for further information.
DataPolicy information about availability of data
All manuscripts must include a data availability statement. This statement should provide the following information, where applicable: - Accession codes, unique identifiers, or web links for publicly available datasets - A list of figures that have associated raw data - A description of any restrictions on data availability
The data that support this study are available within the paper and its Supplementary Information. All primary data underlying the figures reported in the article can be obtained from the corresponding author upon reasonable request.
Field-specific reportingPlease select the one below that is the best fit for your research. If you are not sure, read the appropriate sections before making your selection.
Life sciences Behavioural & social sciences Ecological, evolutionary & environmental sciences

2
nature research | reporting summ
aryO
ctober 2018
For a reference copy of the document with all sections, see nature.com/documents/nr-reporting-summary-flat.pdf
Life sciences study designAll studies must disclose on these points even when the disclosure is negative.
Sample size No statistical measures were used to predetermine sample size. We typically performed three or four biological replicates for each experiment.
Data exclusions None
Replication All statistical data shown in this paper are based on the two paper we published in Nature Communications [2019, 10 (1), 1006] and PNAS [2019, 116 (15) 7543-7548]
Randomization images all collected randomly for the internalization study and silencing evaluation
Blinding No. For internalization study, we collect the image in two separate channels with the GFP as reference channel, of which the fluorescence is continuous and everywhere in the cell. There is no bias for the image we take and the further analysis is through image J, and the values are generated automatically by the software, with no interference by the person who did the analysis.
Reporting for specific materials, systems and methodsWe require information from authors about some types of materials, experimental systems and methods used in many studies. Here, indicate whether each material, system or method listed is relevant to your study. If you are not sure if a list item applies to your research, read the appropriate section before selecting a response.
Materials & experimental systemsn/a Involved in the study
Antibodies
Eukaryotic cell lines
Palaeontology
Animals and other organisms
Human research participants
Clinical data
Methodsn/a Involved in the study
ChIP-seq
Flow cytometry
MRI-based neuroimaging
AntibodiesAntibodies used Anti-GFP antibody - ChIP Grade (ab290), Rabbit polyclonal to GFP; Goat Anti-Rabbit IgG H&L (HRP) (ab205718)
Validation Anti-GFP antibody - ChIP Grade (ab290) is a highly versatile antibody that gives a stronger signal than other anti-GFP antibodies available. On Western blot the antibody detects the GFP fraction from cell extracts expressing recombinant GFP fusion proteins and has also been shown to be useful on mouse sections fixed with formalin. In Immunocytochemistry, the antibody gives a very good signal on recombinant YES-GFP chimeras expressed in COS cells (McCabe et al. 1999 and figure below). It is routinely used in Immunoprecipitation (IP) and IP-Western protocols and has been used successfully in HRP Immunohistochemistry at 1:200 on whole-mount mouse embryos. This anti-GFP antibody recognizes the enhanced form of GFP as well (https://www.abcam.com/gfp-antibody-chip-grade-ab290.html#top-640). The antibody used for conjugation reacts with rabbit immunoglobulins of all classes. Cross-reactions as determined by ELISA for the unconjugated antibody (ab182016): Mouse IgG, rat IgG, and chicken IgY, less than 2%. Human IgG, less than 7% (https://www.abcam.com/goat-rabbit-igg-hl-hrp-ab205718.html).