Embed Size (px)
Citation preview

RE DEVELOPMENT OF KIDWAI NAGAR (EAST) IS A PRESTIGIOUS PROJECT UNDER MINISTRY OF URBAN DEVELOPMENT, GOVT. OF INDIA
NBCC, A NAVRATANA CPSE UNDER MOUD, IS THE IMPLEMENTING AGENCY FOR THIS PRESTIGIOUS PROJECT
TRAFFIC CONSULTANTS
Engineering and Planning Consultants
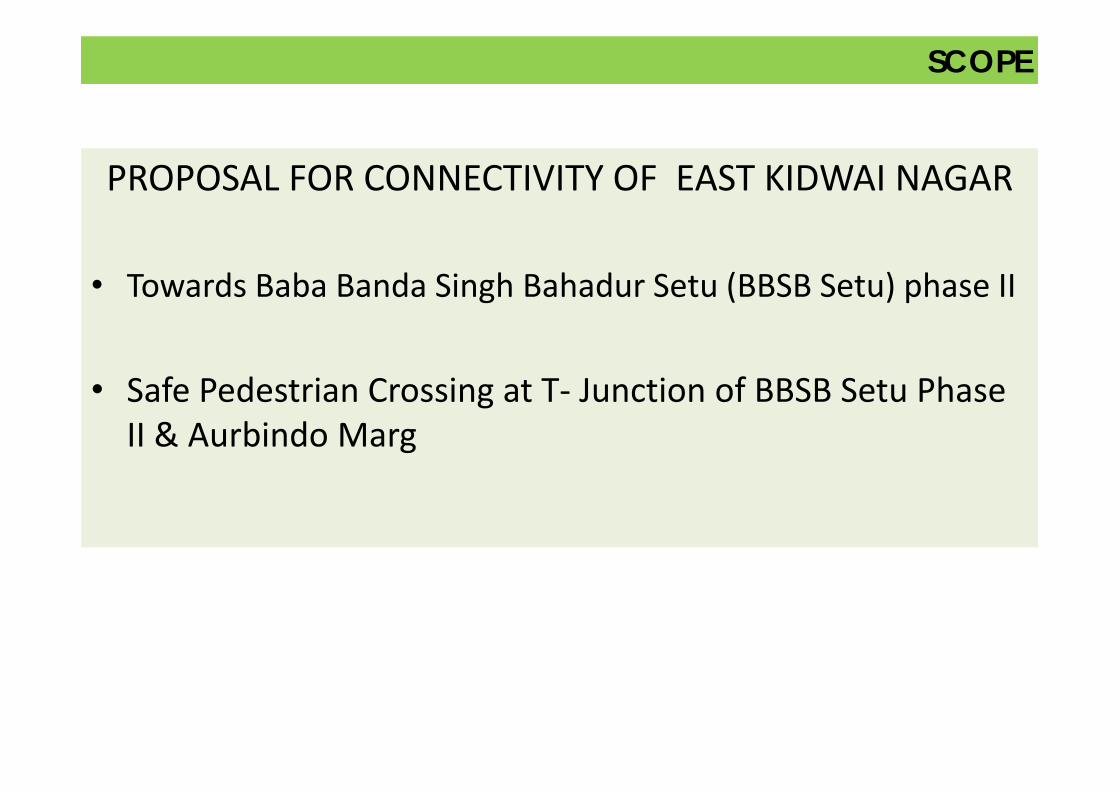
SCOPESCOPE
PROPOSAL FOR CONNECTIVITY OF EAST KIDWAI NAGAR
• Towards Baba Banda Singh Bahadur Setu (BBSB Setu) phase II
• Safe Pedestrian Crossing at T‐ Junction of BBSB Setu Phase II & Aurbindo Marg

• Kidwai Nagar (East) has been identified as one of the colonies for redevelopment as General
Pool Residential Accommodation (GPRA) on 27/07/1993 under Approved Zone D in Master
Plan of Delhi by DDA .
PROJECT STATISTICSPROJECT STATISTICS
Existing structures(in 2013)
2444 nos. (Type‐I, Type II & Type V quarters ) 3 Schools, Some local shopping markets, Religious structures, etc.
Plot Area • 86 Acres (3,48,029 Sqm)
Area under Darya Khan Tomb (schedule B) • 14 acres
Area under Redevelopment • 72 acres
FAR permissible as per MPD 2021 • 300 (10,44,087 sqm)
FAR achieved • 203 (6,96,167 sqm)
Office / commercial complex as permissible • 10% (1,04,412 sqm)
Car parking provided in basement • 10639 nos
Total Density Achieved • 134 DU/ Ha
Total Ground Coverage Achieved • 23.43%
Existing green area • 13% (47,000 sq M )
Green area provided • 47% (1,65,000 sq M)

Sl No HOUSING TYPE Existing(IN 2013) PROPOSED
1 Type I 1336 Nil
2 Type II 1000 780
3 Type III 1025
4 Type IV 1472
5 Type V 108 1078
6 Type VI 192
7 Type VII 61
Total Nos. of Units 2444 4608
PROJECT STATISTICSPROJECT STATISTICS

TOWARDS SARAI KALE KHAN
SITE AND ENVIRONSSITE AND ENVIRONS
VIKAS SADAN
DILLI HAAT
AIIMS SAFDARJANG HOSPITAL
SOUTH EXT.
TO DHAULA KUAN
PROJECT SITE
RING ROAD

ACCESS‐1ACCESS‐
2
ACCESS ‐3
ACCESS ‐4
ACCESS‐5
ACCESS‐6 ACCESS‐7 ACCESS‐8
EARLIER APPROVED ACCESS SYSTEMEARLIER APPROVED ACCESS SYSTEM

In earlier approved access system 4 nos entry/exit (namely 1 to 4 ) were present towards upcoming Baba
Banda Singh Bahadur Setu (BBSB Setu) Phase II road/flyover construction. Same was to be incorporated by
PWD in their connectivity drawing
While PWD submitted the connectivity drawing to UTTIPEC entry/exit no 1 & 2 were incorporated but
entry/exit 3 & 4 were not incorporated due to some technical reason (presence of JJ cluster).
For entry/exit 3 & 4 joint survey was conducted by UTTIPEC/PWD/DMRC/NBCC In the joint survey it was
observed that entry/exit 3 & 4 was not possible due to presence of JJ cluster, hence NBCC was advised to
carry out the feasibility study with alternate plan
NBCC appointed M/s EPC to carried out feasibility study and prepared alternate plan in concurrence with
PWD and DMRC
The feasibility report was submitted to UTTIPEC which was reviewed in Working Group‐II A , 34th meeting
held on 07.04.2016. In this meeting, group members had certain observations which were incorporated
and presented in 35th Working Group Meeting held on 25.05.2016.
Back ground/ChronologyBack ground/Chronology

In 35th Working Group meeting of UTTIPEC held on 25.05.2016 in which it was recommended that
PWD & NBCC will integrate the safe pedestrian crossing at Aurobindo Marg T‐ Junction and will
submit the road safety audit report for further discussion in working group meeting
M/s EPC and M/s RITES was engaged by NBCC to prepare proposal for Safe Pedestrian Crossing and
Conduct Traffic Safety audit at T‐ Junction of BBSB Setu Phase II road/flyover & Aurbindo Marg.
Same was presented in 39th Working Group Meeting held on 07.02.2017.
The proposals of signalized at grade crossing at T Junction and underpass across Aurbindo Marg for
safe pedestrian crossing was recommended by Working Group and it was advised that NBCC should
submit it with the comments of all stakeholders for further consideration by Governing Body.
Proposed connectivity no 3 & 4, prepared in concurrence with NBCC, PWD & DMRC and Proposal of
safe pedestrian crossing at T‐ Junction is being submitted for further consideration of Governing
Body.
Contd.Contd.
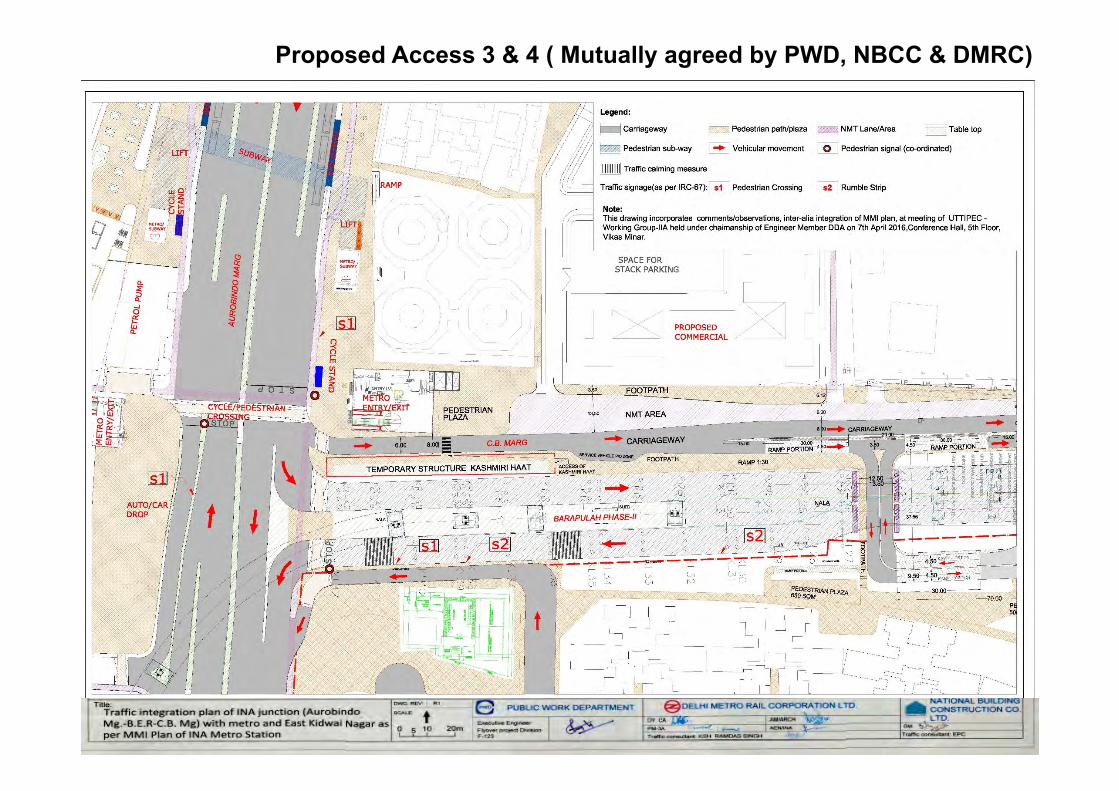
Proposed Access 3 & 4 ( Mutually agreed by PWD, NBCC & DMRC)

DETAIL OF MODIFIED ACCESSESDETAIL OF MODIFIED ACCESSES
BUS STOP AS PER MMI PLAN
TWO LANE ONEWAY CB MARG
SUGGESTIVE KASHMIRI MARKET ACCESS
Pedestrian plaza
CRITICAL PEDESTRIANAREA
RUMBLE STRIPS OR ANY TRAFFIC CALMING MEASURES

VIEW OF PROPOSED ACCESS NO 3VIEW OF PROPOSED ACCESS NO 3

NALA
DETAIL OF AFFECTED ACCESSES (ACCESS NO 3)DETAIL OF AFFECTED ACCESSES (ACCESS NO 3)

NALA
VIEWS OF PROPOSED ACCESS ‐3 FROM NMT AREA VIEWS OF PROPOSED ACCESS ‐3 FROM NMT AREA
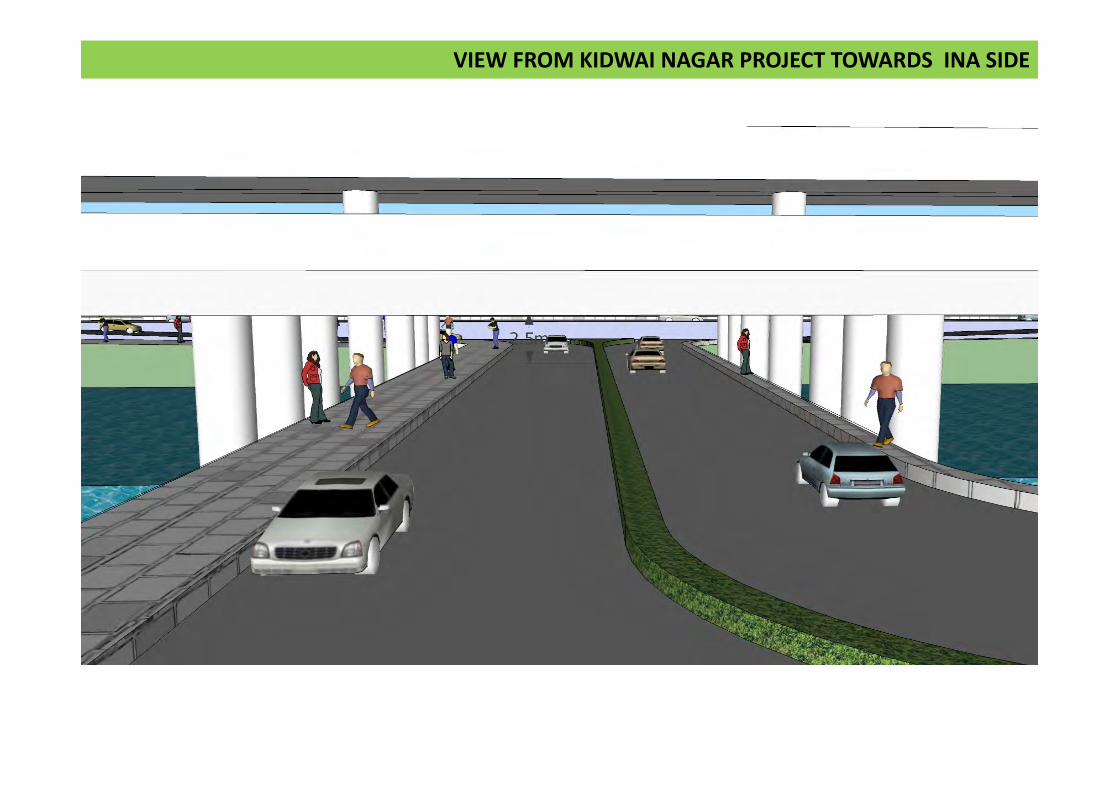
VIEW FROM KIDWAI NAGAR PROJECT TOWARDS INA SIDEVIEW FROM KIDWAI NAGAR PROJECT TOWARDS INA SIDE

EAST KIDWAI NAGAR BONDARY
INSIDE
EAST KIDWAI NAGAR BONDARY
INSIDE
BACK
VIEW FROM KIDWAI NAGAR PROJECT TOWARDS INA SIDEVIEW FROM KIDWAI NAGAR PROJECT TOWARDS INA SIDE

SAFETY AUDIT OF PEDESTRIAN SAFETY MEASURES AT T-JUNCTION OF BABA BANDA SINGH BAHADUR SETU WITH
AUROBINDO MARG

STUDY LOCATIONSTUDY LOCATION
Metro entry/exit
Metro entry/exit

SITE APPRECIATIONSITE APPRECIATION
Downstream Ramp of BBSB Setu (Gradient 2.56%) Upstream Ramp of BBSB Setu (Gradient 2.5%)
View of study location for pedestrian crossing View of Study location from Delhi haat

SITE APPRECIATIONSITE APPRECIATION
U/C ramp of BSSB setu in Barapullah Drain (Gradient 3.8%) INA market
U/C INA Interchange entry/exit Existing Pedestrian activity on Aurobindo Marg

SITE APPRECIATIONSITE APPRECIATION
View of Aurobindo Marg (near Petrol Pump) Traffic waiting on pedestrian signal on Aurobindo Marg
Pedestrians at INA metro station NMT vehicles on C.B. Marg

SITE APPRECIATIONSITE APPRECIATION
Queue of Vehicles at Petrol Pump on Aurobindo marg
A panoramic view of Aurobindo Marg with BBSB Setu and NBCC complex on LHS and Delhi haat and U/C INA metro entry/exit on RHS
Pedestrian Plaza of Delhi Haat
Aurobindo marg
NBCC Complex U/C
Delhi haat Metro U/CBBSB Setu U/C

CHECKLIST 16 – SAFETY AUDIT FOR VULNERABLE ROAD USERSCHECKLIST 16 – SAFETY AUDIT FOR VULNERABLE ROAD USERS
Sl # DESCRIPTION OBSERVATIONS
1 Has there been a survey of non-motorised vehicleand pedestrian flows?
Details not available
2 Will there be any major conflicts between motorizedtraffic and pedestrians and other disabled /handicapped road users?
Yes, Pedestrians willhave conflict with trafficon elevated road whilecrossing the road
3 Have pedestrians need for crossing the road andwalking safely alongside it been adequatelyprovided for?
Zebra Crossings withPelican signals proposed
4 Have measures been taken to reduce the accidentrisk for children going to and from roadside schools(Pedestrian guardrail may be needed to preventchildren from running out into the road)?
Details not shown

CHECKLIST 16 – SAFETY AUDIT FOR VULNERABLE ROAD USERSCHECKLIST 16 – SAFETY AUDIT FOR VULNERABLE ROAD USERS
Sl. # DESCRIPTION OBSERVATIONS
5. Have the need of cyclists and other non-motorised vehicles been provided
Cyclist will cross the roadalong with pedestrian
6. Where necessary, is fencing installed to guidepedestrians and cyclists at crossings oroverpasses?
Details not available

SAFETY AUDIT FOR VULNERABLE ROAD USERSSAFETY AUDIT FOR VULNERABLE ROAD USERS
Sl # SAFETY ISSUES/CONCERNS OBSERVATIONS
1 Zebra crossing proposed at the merging of 2.56%down gradient / 2.5% up gradient
Two sets of Raised Barmarkings proposed ondown gradients to warnthe drivers
2 It will be difficult for the speeding vehicle to stop ondown gradient
Pelican signal have beenproposed to stop thetraffic

Design speed at the intersection shall be 40% ofapproach speed
As elevated highway design speed is 80 km/hr, speedintersection shall be 32 km/hr
A reverse curve of 60m radius provided 200m beforeintersection i.e. a design speed of 30 km/hr
A 15m curve provided at intersection with AurbindoMarg i.e. a design speed of 15 km/hr
SAFETY ENHANCMENT –SPEED REDUCTION BY HORIZONTAL GEOMETRYSAFETY ENHANCMENT –SPEED REDUCTION BY HORIZONTAL GEOMETRY

STOPPING SIGHT DISTANCE (IRC 66-1976)STOPPING SIGHT DISTANCE (IRC 66-1976)

SAFETY ENHANCMENT –RAISED BAR MARKINGS AS PER IRC 35 (2015)SAFETY ENHANCMENT –RAISED BAR MARKINGS AS PER IRC 35 (2015)
SAFETY ENHANCMENT –RAISED TABLE TOP CROSSING AS PER IRC 103(2012)SAFETY ENHANCMENT –RAISED TABLE TOP CROSSING AS PER IRC 103(2012)
Signalized turning pockets may be provided where left-
turning volumes are high. Raised table top crossings may
also be introduced and shall invariably be provided at slip
roads, with a minimum 20-seoond pedestrian signal, to allow
pedestrian and cyclists to cross the road safely and
comfortably at the same level. Table top with flat surface will
be preceded followed by the gradient at 1:15

SAFETY ENHANCMENT –RAISED TABLE TOP CROSSING AS PER IRC 103(2012)SAFETY ENHANCMENT –RAISED TABLE TOP CROSSING AS PER IRC 103(2012)

ESTIMATION OF PEDESTRIAN TRIPSESTIMATION OF PEDESTRIAN TRIPS
Zoning of Project Site
(INA Metro stn.)
(AIIMS Metro stn.)(South-ex Metro stn.)

ESTIMATION OF PEDESTRIAN TRIPSESTIMATION OF PEDESTRIAN TRIPS
Zone‐wise distribution of Housing units and office complex
FLAT TYPENO. OF DWELLING UNITS
ZONE 1 ZONE 2 ZONE 3Type 2 355 - 425Type 3 683 - 342Type 4 779 - 606Type 5 504 630 -Type 6 - 192 -Type 7 - 61 -Total 2361 883 1373
Zone No. Office Complex (in sqm)2 52,0003 52,000

ESTIMATION OF PEDESTRIAN TRIPSESTIMATION OF PEDESTRIAN TRIPS
Assumptions for Daily Trip Estimation
Trip Factor Assumption
Average house hold size 4 Per Capita Trip Rate (PCTR) 2Peak Hour Trip Share 10% of Daily Trips

ESTIMATION OF PEDESTRIAN TRIPSESTIMATION OF PEDESTRIAN TRIPS
Assumptions for PT Trip EstimationType of Housing PT Share (%)
Type 2 and Type 3 80%Type 4, Type 5, Type 6 & Type 7 40%Office complex 70%
Estimated Trips
Zone Daily PT Trips Peak PT Trips Influence Metro Station
1 11280 1128 INA 2 8660 866 South‐ex3 12784 1278 AIIMS

ESTIMATED TRAFFIC VOLUME ON MAJOR ROADS ESTIMATED TRAFFIC VOLUME ON MAJOR ROADS
Road Name
Direction of Traffic
Peak Hour Traffic (No. of Vehicles) growth @5%
2016 2021 2022 2023 2024 2025 2026 2027
Baba Banda Singh
BahadurSetu
To Aurobindo marg 2882 3679 3863 4056 4259 4472 4695 4930
From Aurobindo marg 1275 1627 1708 1793 1883 1977 2076 2180
From AIIMS Ramp 1275 1627 1708 1793 1883 1977 2076 2180
Aurobindo Marg
AIIMS to INA 5758 7349 7717 8102 8507 8933 9380 9848
INA to AIIMS 5506 7027 7379 7748 8135 8542 8969 9417
C.B. Marg To Thyagraj stadium 1386 1769 1857 1950 2047 2150 2257 2370
Source: Barapullah Phase‐1 traffic data (2013), PWD, Aurobindo Marg and CB marg traffic data (2015), RITES

ALTERNATIVE OPTION EVALUATIONALTERNATIVE OPTION EVALUATION
1. AT-GRADE PEDESTRIAN CROSSING FACILITY
2. FOOT OVER BRIDGE OVER BBSB SETU
3. SUBWAY UNDER AUROBINDO MARG

WALKING DISTANCE MEASUREMENT FOR ALL OPTIONSWALKING DISTANCE MEASUREMENT FOR ALL OPTIONS
AT-GRADEFOOT OVER BRIDGESUBWAY
FOB95 -110 Meter

ALTERNATIVE OPTION EVALUATIONALTERNATIVE OPTION EVALUATION
AT-GRADE PEDESTRIAN CROSSING FACILITY

STUDY OBJECTIVESSTUDY OBJECTIVES
• Evaluation of pedestrian/vehicular delay and queue lengths for different scenarios to analyse the requirement of pedestrian facilities for safe crossing of pedestrians

Simulation Model Development

NEED FOR SIMULATIONNEED FOR SIMULATION
The micro-simulation models not only build confidence in the proposal but also:
• Model vehicular/pedestrian conflict realistically for accessing impact of various scenarios on delay/queue lengths to evaluate guidelines as per IRC 103-2012
Software Used: PTV VISSIM is a microscopic, time step and behavior based simulation model and it is the most powerful tool available for simulating multi-modal traffic flows, including cars, trucks, buses, heavy rail, trams, LRT, bicyclists and pedestrians.
• Models vehicular and pedestrian behaviour accurately with scientifically calibrated models
• Provides credibility on the estimated delays and queues, considering various dynamic factors such as arrival rates, speeds/accelerations/
• Helps model scenarios such as violations and assessment of Intelligent transport systems efficacy such as push button signals.

SIMULATION METHODOLOGY SIMULATION METHODOLOGY
Traffic/Pedestrian Data
(Volumes, Composition)
Observations and Inferences
Geometric Data
(Road Network)Data Processing & Analysis
Data Collection and Compilation
Evaluation and comparison of Proposed Models
Calibration and Validation of the
Simulation Model for peak hour Use calibrated parameters
Network Setup in VISSIM (Simulation Software)
• AM Peak Controlled and Uncontrolled Scenario year 2016
• AM Peak Controlled Scenario and violations year 2021
• Capacity Analysis with grade separated options

MODEL INPUT PARAMETERSMODEL INPUT PARAMETERS
Parameters• Warm up period of
900secs• Driver Behavior• Conflict areas• Reduced speed area• Give way coding• Lateral gap• Vehicle speed• Lane changing
distance• Gap Acceptance
Model Inputs• Vehicular Volume
Input• Pedestrian Volume
Input• Signal timings• Vehicle /Pedestrian
classification and related properties
Evaluations• Base Model• Proposed Scenario

SIMULATION GLOBAL PARAMETERSSIMULATION GLOBAL PARAMETERS
The simulation model is set to simulate 15 Minutes + 1 Hour of which first15 minutes are modelled as buffer time for the build of the simulation modeland last 1 hour is the peak hour. All observations were taken 3600simulation seconds of the peak hour operations.
As all micro-simulation models are stochastic in nature, there is a degree ofrandomness associated with all distributions. The random seed parametercontrols the random number generator in the simulation. Simulation runswith identical input files and random seeds generate identical results. Amicro-simulation model must therefore be run with different random seedvalues to average the stochastic variations in the model. The model runswith five different random seed values, from which the results are taken andaveraged before presentation.

ASSUMPTIONSASSUMPTIONS
Pedestrian speed -1.2 m/sec (as per IRC 103-2012)
Pedestrian Peak Composition :
60% Men, 30% Women, 10% Child
Effects of pedestrian grouping, gap acceptance response to approaching
vehicle, pedestrian crossing speed variations, compliance to signals
For all scenarios with signalized crossing for pedestrians, the green time
is kept at 20 seconds for pedestrians phase as per IRC 103-2012
guidelines
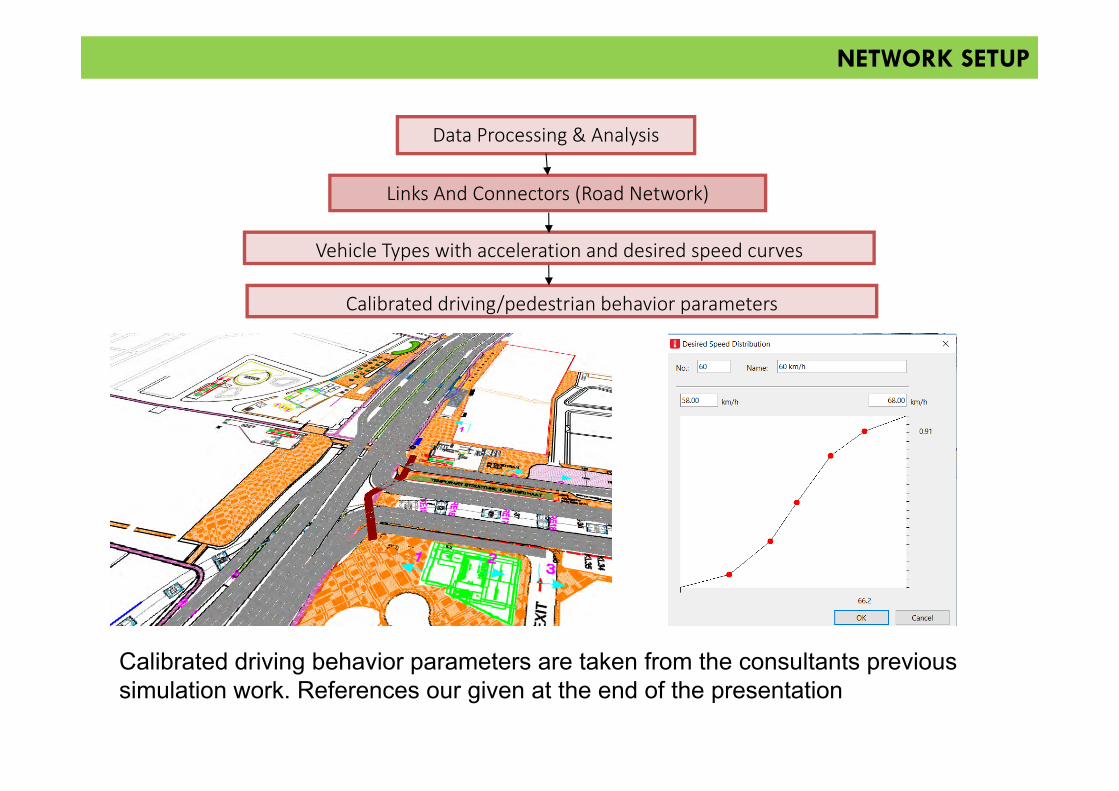
NETWORK SETUPNETWORK SETUP
Links And Connectors (Road Network)
Data Processing & Analysis
Calibrated driving/pedestrian behavior parameters
Vehicle Types with acceleration and desired speed curves
Calibrated driving behavior parameters are taken from the consultants previous simulation work. References our given at the end of the presentation

AVERAGE TRAFFIC COMPOSITION (BARAPULLAH DOWNSTREAM)AVERAGE TRAFFIC COMPOSITION (BARAPULLAH DOWNSTREAM)
Vehicle type Mean Desired Speed Range
Car 65 Km/Hr 45‐100 Km/hr
Two Wheeler 45 Km/Hr 30‐80 Km/hr
Desired Speed range
Traffic Composition

LITERATURE REVIEW | CRITICAL GAPLITERATURE REVIEW | CRITICAL GAP
• Average gap accepted by the pedestrians : 5.02 s to 7.19 sbased on gender and 4.73 s to 7.76 s based on age.
• Priority rules are used in Vissimto model gap acceptance behaviour
Min. Gap Acceptance Time: The vehicle/pedestrian must wait at red bar if the current time gap is less than the value which has been entered.

EVALUATION CRITERIA UNCONTROLLED CROSSING EVALUATION CRITERIA UNCONTROLLED CROSSING
Uncontrolled Crossing Scenario with No Signals
As per IRC 103-2012, for providing controlled crossing following criteria needs to be evaluated:
• Peak Hour volume of pedestrians(P) and Vehicles(V) : PV2 > 2x10⁸
• Speed of approaching vehicles is more than 65kph• Waiting time for pedestrians/vehicles becomes too long (evaluated using simulation)• Accident data indicating more than 5 accidents per year due to vehicle collision
Table below indicate the level of service limits as per IRC 103-2012

EVALUATION CRITERIA FOR CONTROLLED CROSSING EVALUATION CRITERIA FOR CONTROLLED CROSSING
Controlled Crossing Scenario with No Signals
As per IRC 103-2012
• High pedestrians/vehicular volume increase cycle timebeyond 120 seconds (Evaluated using Micro simulation)
• Vehicular traffic demands uninterrupted flow• At-grade crossing fails to mitigation problems related to
accident.

DELAY AND QUEUE MEASUREMENT SECTIONSDELAY AND QUEUE MEASUREMENT SECTIONS
Queue counter locations
Queue Counter

TERMINOLOGYTERMINOLOGY
• Vehicle delay: Average delay of all vehicles/Pedestrians
The delay of a vehicle in leaving a travel time measurement is obtained by subtracting the theoretical (ideal) travel time from the actual travel time.
• Average/Maximum queue length

Observations | Base Year 2016 | AM Peak Uncontrolled Scenario

AM PEAK UNCONTROLLED SCENARIO | MODEL SNAPSHOTAM PEAK UNCONTROLLED SCENARIO | MODEL SNAPSHOT
No Signals
• Model evaluated for 3 gap acceptance levels, of 4 seconds, 5.5 seconds and 7 seconds, with 4 seconds representing most aggressive pedestrian behaviour

AM PEAK UNCONTROLLED SCENARIO | ESTIMATED DELAYAM PEAK UNCONTROLLED SCENARIO | ESTIMATED DELAY

AM Peak Uncontrolled Scenario | Estimated Delay | ObservationsAM Peak Uncontrolled Scenario | Estimated Delay | Observations
• Average Vehicular delay for all critical gap acceptance value is more than95 seconds, with maximum estimated average delay of 111 seconds forcritical gap acceptance value of 4 seconds.
• For pedestrian movement average delay at critical gap values of 4seconds, 5.5 seconds, 7 seconds, are 24 seconds, 26 seconds and 48seconds respectively, for the movement from NBCC Complex to Metrostation and 24 seconds, 26 seconds and 39 seconds respectively, for themovement from Metro station to NBCC Complex, indicating level ofservice C-D
• Maximum pedestrian delay are estimated at 87 seconds for NBCCComplex to metro station movement and 70 seconds for Metro Station toNBCC Complex movement

AM Peak Uncontrolled Scenario | Percentile Delay ValuesAM Peak Uncontrolled Scenario | Percentile Delay Values
• For gap acceptance of 4 seconds and 5.5 seconds, 90% of the delay values are lessthan 43 sec and 42 sec.
• For gap acceptance of 7 seconds, only 50% of the delay values are fit in the rangefor LOS C for the movement for the side.

Average queue lengths for Vehicles at Pedestrian Crossing (in mts)Critical Gap Acceptance
(4 Seconds)Critical Gap Acceptance (5.5
Seconds)Critical Gap Acceptance (7
Seconds)351.90 m 325.55 m 268.60 m
AM Peak Uncontrolled Scenario | Estimated Vehicular Queue LengthAM Peak Uncontrolled Scenario | Estimated Vehicular Queue Length

Observations | Base Year 2016 | AM Peak Controlled Scenario

AM Peak Controlled Scenario | Model SnapshotAM Peak Controlled Scenario | Model Snapshot
With Signals
• Model evaluated for cycle time 90 seconds and 120 seconds

AM Peak Controlled Scenario | Estimated DelayAM Peak Controlled Scenario | Estimated Delay
• Average Vehicular delay for both cycle time is less than 21 seconds, which issignificant improvement from value of more than 95 seconds estimated inuncontrolled scenario

AM Peak Controlled Scenario | Estimated Delay | ObservationsAM Peak Controlled Scenario | Estimated Delay | Observations
• For cycle time of 90 seconds is average delay is 29 second for bothmovements
• For cycle time of 120 seconds, average delay increases to 37 seconds fortowards metro station movement and 41 seconds for opposite movement.
• Maximum Pedestrian delay is estimated at 54 seconds with cycle time120 seconds,
• maximum vehicular delay at 40 seconds for cycle time 90 seconds
• It is further observed that average values indicate the 90% percentiledelay values for all the movements,

AM Peak Controlled Scenario | Estimated Vehicular Queue LengthAM Peak Controlled Scenario | Estimated Vehicular Queue Length
Cycle time 90 seconds Cycle time 120 secondsAverage Queue
LengthsMaximum Queue
LengthAverage Queue
LengthsMaximum Queue
Length
23.39m 120.55m 13.77m 95m

AM Peak Controlled Scenario | Estimated Queues | ObservationsAM Peak Controlled Scenario | Estimated Queues | Observations
• Average queue lengths is estimated at more than 24m for cycle time 90seconds
• Average queue lengths reduced to 13m for cycle time 120 seconds,
• Maximum queue length is estimated with cycle time 90 seconds at 120m
• Cycle time of 120 seconds provided overall better level of servicefor vehicles,
• Cycle time 90 seconds provided better LOS for pedestrians

Comparison of Uncontrolled & Controlled Scenarios – Base year 2016

Comparing Average Queue Lengths for VehiclesComparing Average Queue Lengths for Vehicles
• Average queue lengths with uncontrolled scenario are very high ascompared with controlled scenario
• It is recommended to evaluate only controlled scenarios for horizon years

Comparing Average DelayComparing Average Delay
• Average delay for pedestrians is similar in both scenarios, but for vehicles average delayreduces significantly in the controlled scenario
• Further, recommended to evaluate only controlled scenarios for horizon years

Observations | Horizon Year 2021 | AM Peak Controlled Scenario

AM Peak Controlled Scenario | Year 2021 AM Peak Controlled Scenario | Year 2021
With Signals and Barapullah Downstream Volume 3679 PCU’s
• Model evaluated for cycle time 90 seconds and 120 seconds

Controlled AM Peak| Horizon Year 2021 | Estimated DelaysControlled AM Peak| Horizon Year 2021 | Estimated Delays
The graph above shows the average and maximum estimated delay for bothpedestrian movement and vehicular movement for the controlled scenario

AM Peak Controlled Scenario | Estimated Delays | ObservationsAM Peak Controlled Scenario | Estimated Delays | Observations
• With cycle time of 90 seconds the average estimated delayfor vehicular movement is 86 seconds, which reduces to 37seconds with cycle time of 120 seconds.
• Maximum delay is estimated at 142 seconds for vehiculartraffic with cycle time 90 seconds
• For pedestrian movement, the average delay is highest withvalue of 42 seconds with cycle time of 120 seconds, whichindicate level of service C-D.

Controlled AM Peak | Estimated Queue Length Controlled AM Peak | Estimated Queue Length
• Average estimated queue lengths are 175m & 60m with cycle time of 90 seconds& 120 sec.
• Recommended to have a cycle time of 120 seconds, with 20 secondspedestrians phase,

Observations | Horizon Year 2021 AM Peak | Violations Scenario

Estimated Delay Controlled AM Peak Estimated Delay Controlled AM Peak
Cycle time : 120 seconds
It is observed with cycle time 120 seconds, that as violations increase the average delay forvehicles increase, at level of 20% average estimated delay is 70 seconds which is 30 secondshigher if no violations are observed.

Observations | Horizon Year | Capacity Analysis

OBSERVATIONS WITH CONTROLLED SCENARIOOBSERVATIONS WITH CONTROLLED SCENARIO
• Need for grade separated option for the horizon years 2022-2027• Cycle time of 120 seconds is used.
YearEstimated
Downstream VolumesVeh/Hr (PCUS)
Average queue length(m)
Average Maximum Queue Length(m)
2022 3863(3442) 69 1802023 4056 (3615) 139 2742024 4259 (3795) 184 3252025 4472 (3975) 235 3782026 4184 (4695) 249 3902027 4393 (4930) 266 395
• The road capacity of the section is estimated near 3800 PCU/Hour with cycletime 120 seconds
• In 2024, estimated volumes near capacity and the average queue lengths areestimated at 184m which indicate the controlled scenario is no more suitable at-grade pedestrian controlled crossing as higher green phase would be requiredfor vehicles

OBSERVATIONS WITH CONTROLLED SCENARIOOBSERVATIONS WITH CONTROLLED SCENARIO
• Need for grade separated option for the horizon years 2022-2027
• Cycle time of 150 seconds is used.
YearEstimated
Downstream VolumesPCU’S and (Veh/Hr)
Average queue length(m) Average Maximum Queue Length(m)
2022 3863(3442) 34 1282023 4056 (3615) 65 2042024 4259 (3795) 114 2832025 4472 (3975) 164 3522026 4184 (4695) 182 3582027 4393 (4930) 226 415

CONCLUSION AND RECOMMENDATIONSCONCLUSION AND RECOMMENDATIONS
Control Type Year 2016 Traffic(Level of service (LOS))
Year 2021 Traffic (Level of service (LOS))
Year 2024 and Beyond
Uncontrolled Pedestrian LOS : CVehicle LOS: Poor
- -
Controlled Cycletime 90 seconds
Pedestrians: LOS BVehicles LOS : GoodRecommended Option
Pedestrians: LOS C-DVehicles LOS: Poor
LOS very PoorVehicular Traffic
Cycle Time 120 Seconds
Pedestrians: LOS BVehicles LOS : Poor
Pedestrians: LOS C-DVehicles LOS: GoodRecommended Option
LOS very PoorVehicular Traffic
GradeSeparated
- - Recommended Option

CONCLUSION AND RECOMMENDATIONSCONCLUSION AND RECOMMENDATIONS
• Uncontrolled crossing is not recommended due to high vehicular delays available
• Violations by pedestrians have significant effect on the delay for the vehiculartraffic
• Controlled crossing is required for providing better LOS for upstream volumesmore than 2400 PCU/hr on BBSB setu
• In this case, while proposing signals, the queue length for vehicles needs to beconsidered as it may extend on the main carriageway of Aurbindo marg
• Continuous increase in queue length on BBSB setu (downstream traffic) forHorizon years.
• Need for grade separated pedestrian facility after Horizon year 2024

PEDESTRIAN VULNERABILITYPEDESTRIAN VULNERABILITY
As per IRC code IRC‐103‐2012, to qualify as a grade separated pedestrian crossing facility, a location should have:
Where, P = Peak hour pedestrian flow and V = Peak hour vehicularvolumeThe value of PV2/108 higher than or equals to 2 for any locationindicates high conflict between pedestrian across movement and flowof traffic.Thus, need for a grade separated pedestrian facility.

COMPREHENSIVE PLAN INCLUDING ACCESS 3 AND 4 WITH PEDESTRIAN CONNECTIVITYCOMPREHENSIVE PLAN INCLUDING ACCESS 3 AND 4 WITH PEDESTRIAN CONNECTIVITY
Access-4
Access-3
PEDESTRIAN SUBWAY DETAILS
ACCESS -4 DETAILS

ALTERNATIVE OPTION EVALUATIONALTERNATIVE OPTION EVALUATION
FOOT OVER BRIDGE ACROSS BBSB SETU

The high value of PV2/108 shows the need of grade separatedpedestrian facility.
F.O.B ACROSS BBSB SETUF.O.B ACROSS BBSB SETU
Metro Station
NBCC COMPLEX
PED
ESTR
IAN
MO
VEM
ENT
Location Peak hour Pedestrian Across Volume (2021)
Peak hour Vehicular Volume (2021) PV2/108
Across BBSB SETU 1128 6828 526

CROSS-SECTION OF FOB OPTIONCROSS-SECTION OF FOB OPTION
Option for F.O.B over the BBSB Setu require minimum height of 14‐15 meters to maintain the vertical clearance of 5.5 m free aboveroadway.

The high value of PV2/108 shows the need of grade separatedpedestrian facility.
Proposal may be adopted as per conclusion of all scenarios.
SUBWAY BELOW AUROBINDO MARGSUBWAY BELOW AUROBINDO MARG
Metro Station
NBCC COMPLEX
Location Peak hour Pedestrian Across Volume (2021)
Peak hour Vehicular Volume (2021) PV2/108
Across Aurobindo marg 1128 18055 3677
Metro Station

CROSS-SECTION OF SUBWAY OPTIONCROSS-SECTION OF SUBWAY OPTION
Access to Delhi Haat and INA Metro station entry/exit Land requirement for Subway entry/exit

REFERENCESREFERENCES
1: *Marisamynathan ., Vedagiri Perumal “Study on pedestrian crossing behavior at signalized
intersections”, Journal of Traffic and Transportation Engineering 2014
2: *Chaudhari, Shah, Arkatkar “Examining Effect Of Individual Characteristics On Walking
Speed 1 At Un-signalized Mid-block Crossings”, 96th Annual Transportation Research
Board meeting, Washington D.C.
3. Bains M S, Ponnu B, Arkatkar S S (2012). Modelling of traffic flow on Indian expressways
49 using simulation technique. Procedia - Social and Behavioral Sciences, 43, 475 493
4. Bains M S, Anshuman Bhardwaj, Shriniwas Arkatkar , S. Velmurugan (2013) Effect of 1
Speed Limit Compliance on Roadway Capacity of Indian Expressways, 2nd Conference 2
of Transportation Research Group of India (2nd CTRG)
5. Arasan, V.T., and Koshy, R. Z. (2005). Methodology for modelling highly heterogeneous
traffic flow. J. of Transp. Engg., 131, 544 551.
6. Velmurugan, S., Errampalli, M., Ravinder, K., Sitaramanjaneyulu, K. and Gangopadhyay,
S. 2010. Critical evaluation of roadway capacity of multi-lane high speed corridors under
heterogeneous traffic conditions through traditional and microscopic simulation models.
Journal of Indian Roads Congress, 71 (3), 235-264.