Embed Size (px)
Citation preview
Chapter 2
Engine performance parameters
2.1 The definition of thrust
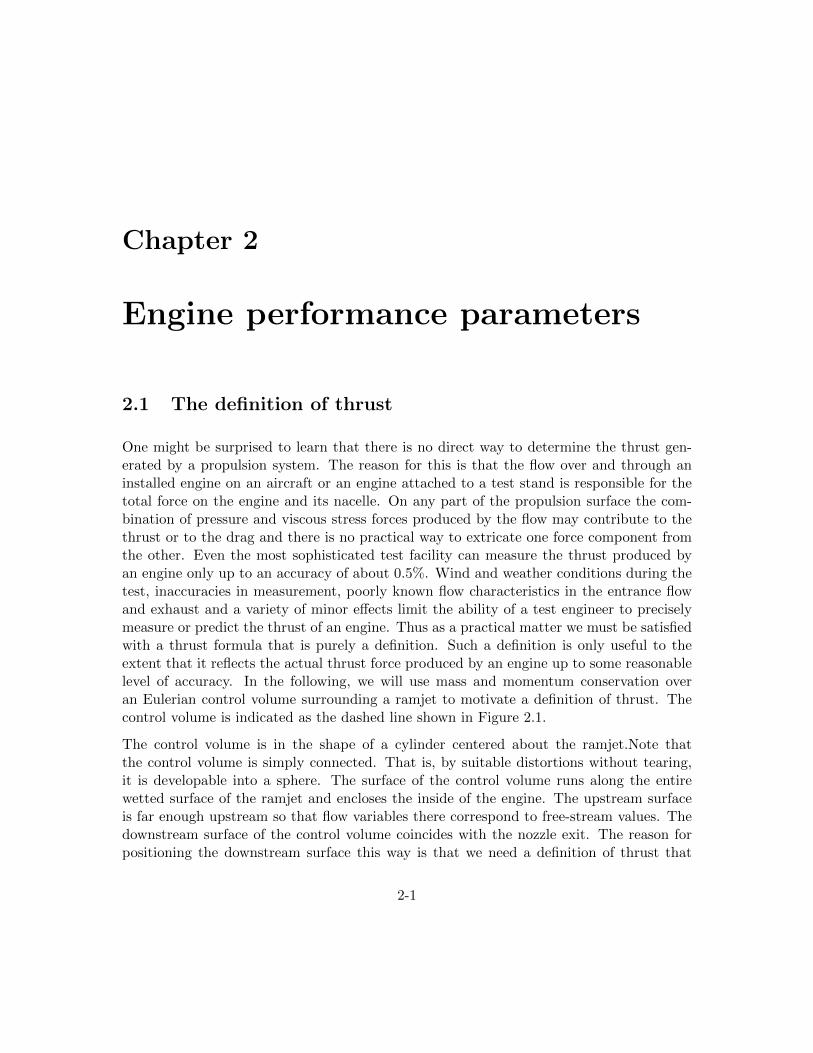
One might be surprised to learn that there is no direct way to determine the thrust gen-erated by a propulsion system. The reason for this is that the flow over and through aninstalled engine on an aircraft or an engine attached to a test stand is responsible for thetotal force on the engine and its nacelle. On any part of the propulsion surface the com-bination of pressure and viscous stress forces produced by the flow may contribute to thethrust or to the drag and there is no practical way to extricate one force component fromthe other. Even the most sophisticated test facility can measure the thrust produced byan engine only up to an accuracy of about 0.5%. Wind and weather conditions during thetest, inaccuracies in measurement, poorly known flow characteristics in the entrance flowand exhaust and a variety of minor e↵ects limit the ability of a test engineer to preciselymeasure or predict the thrust of an engine. Thus as a practical matter we must be satisfiedwith a thrust formula that is purely a definition. Such a definition is only useful to theextent that it reflects the actual thrust force produced by an engine up to some reasonablelevel of accuracy. In the following, we will use mass and momentum conservation overan Eulerian control volume surrounding a ramjet to motivate a definition of thrust. Thecontrol volume is indicated as the dashed line shown in Figure 2.1.
The control volume is in the shape of a cylinder centered about the ramjet.Note thatthe control volume is simply connected. That is, by suitable distortions without tearing,it is developable into a sphere. The surface of the control volume runs along the entirewetted surface of the ramjet and encloses the inside of the engine. The upstream surfaceis far enough upstream so that flow variables there correspond to free-stream values. Thedownstream surface of the control volume coincides with the nozzle exit. The reason forpositioning the downstream surface this way is that we need a definition of thrust that
2-1
CHAPTER 2. ENGINE PERFORMANCE PARAMETERS 2-2
Figure 2.1: Ramjet control volume for developing a definition of thrust
is expressed in terms of flow variables that can be determined relatively easily in termsof the thermodynamic and geometrical properties of the engine internal gas flow. Notethat the velocity profile in the wake cannot be used to determine thrust since the profile ismomentum-less. An integral over the wake profile is proportional to the sum of thrust plusdrag and since the engine is not accelerating this sum is zero. We will assume that withinthe engine all flow variables are area averaged (averaged in the y-z plane) and that theflow is steady. Fuel from an onboard tank is injected through the control volume surface.The mass flows through the engine are
ma = air mass flow rate
mf = fuel mass flow rate.(2.1)
The fuel mixes and reacts with the incoming air flow releasing heat and the heat is assumedto be uniformly distributed over the engine cross section downstream of the region ofcombustion. The integrated form of the conservation equations for steady flow with nobody forces on an Eulerian control volume is
CHAPTER 2. ENGINE PERFORMANCE PARAMETERS 2-3
Z
A
⇢U · ndA = 0
Z
A
⇣
⇢U U + PI � ⌧⌘
· ndA = 0
Z
A
�
⇢htU � ⌧ · U + Q�
· ndA = 0.
(2.2)
where ht is the stagnation enthalpy of the gas flow.
ht = e+ Pv + k (2.3)
Mass Balance
The continuity equation integrated over the control volume leads to
Z
A
⇢U · ndA =
Z
A2
⇢2
U2
dA+ ⇢eUeAe � ⇢0
U0
(A2
+Ae)� mf +
Z
A1
⇢1
V1
dA = 0.
(2.4)
The first integral in (2.4) involving a flux of mass out of the control volume is carried outover the annular area labeled A
2
in Figure 2.1. It is a complicated integral in that it involvesthe wake velocity profile which is not accurately known without a direct measurement.In fact the nozzle exit flow is assumed to be an area averaged plug flow and so all thecomplexity of the wake profile is thrown into this integral. The last integral in (2.4) iscarried out over the outer surrounding surface of the control volume and involves a flux ofmass leaving the control volume due to the outward displacement of air produced by theblockage e↵ect of the engine. It too is a complicated integral but one we will be able toeasily approximate. Note that this part of the control volume is taken to be straight. Itdoes not follow a streamline. Thus the area of the upstream face of the control volume isequal to A
2
+Ae.
Momentum Balance
Now integrate the x-momentum equation over the control volume.
CHAPTER 2. ENGINE PERFORMANCE PARAMETERS 2-4
Z
A
⇣
⇢U U + PI � ⌧⌘
· ndA
�
�
�
�
�
�
x
=
Z
A2
�
⇢2
U2
2 + P2
�
dA+�
⇢eUe2Ae + PeAe
�
��
⇢0
U0
2 + P0
�
(A2
+Ae)+
Z
A1
⇢1
U1
V1
dA+
Z
Aw
⇣
PI � ⌧⌘
· ndA
�
�
�
�
�
�
x
= 0
(2.5)
Note that the x-momentum of the injected fuel mass has been neglected. The first integralinvolves a complicated distribution of pressure and momentum over the area A
2
and thereis little we can do with it. The last integral involves the pressure and stress forces actingover the entire wetted surface of the engine and although the kernel of this integral maybe an incredibly complicated function, the integral itself must be zero since the engine isnot accelerating or decelerating (the free stream speed is not a function of time).
Z
Aw
⇣
PI � ⌧⌘
· ndA
�
�
�
�
�
�
x
= Thrust�Drag = 0 (2.6)
The second to last integral in (2.5) can be approximated as follows.
Z
A1
⇢1
U1
V1
dA ⇠=Z
A1
⇢1
U0
V1
dA (2.7)
The argument for this approximation is that at the outside surface of the control volumethe x-component of the fluid velocity is very close to the free stream value. This is a goodapproximation as long as the control volume surface is reasonably far away from the engine.This approximation allows us to use the mass balance to get rid of this integral. Multiply(2.4) by U
0
. and subtract from (2.5). The result is
⇢eUe (Ue � U0
)Ae+(Pe � P0
)Ae+ mfU0
+
Z
A2
(⇢2
U2
(U2
� U0
) + (P2
� P0
)) dA = 0. (2.8)
This is as far as we can go with our analysis and at this point we have to make an arbitrarychoice. We will define the drag of the engine as
CHAPTER 2. ENGINE PERFORMANCE PARAMETERS 2-5
Drag =
Z
A2
(⇢2
U2
(U0
� U2
) + (P0
� P2
)) dA (2.9)
and the thrust as
Thrust = ⇢eUe (Ue � U0
)Ae + (Pe � P0
)Ae + mfU0
. (2.10)
This is a purely practical choice where the thrust is defined in terms of flow variablesthat can be determined from a thermo-gas-dynamic analysis of the area-averaged engineinternal flow. All the complexity of the flow over the engine has been thrown into the dragintegral (2.9) which of course could very well have contributions that could be negative.This would be the case, for example, if some part of the pressure profile had P
2
�P0
> 0 .The exit mass flow is the sum of the air mass flow plus the fuel mass flow.
⇢eUeAe = ma + mf (2.11)
Using (2.11) the thrust definition (2.10) can be written in the form
T = ma (Ue � U0
) + (Pe � P0
)Ae + mfUe. (2.12)
In this form the thrust definition can be interpreted as the momentum change of the airmass flow across the engine plus the momentum change of the fuel mass flow. The pressureterm reflects the acceleration of the exit flow that occurs as the jet exhaust eventuallymatches the free stream pressure in the far wake. Keep in mind that the fuel is carried onboard the aircraft, and in the frame of reference attached to the engine, the fuel has zerovelocity before it is injected and mixed with the air.
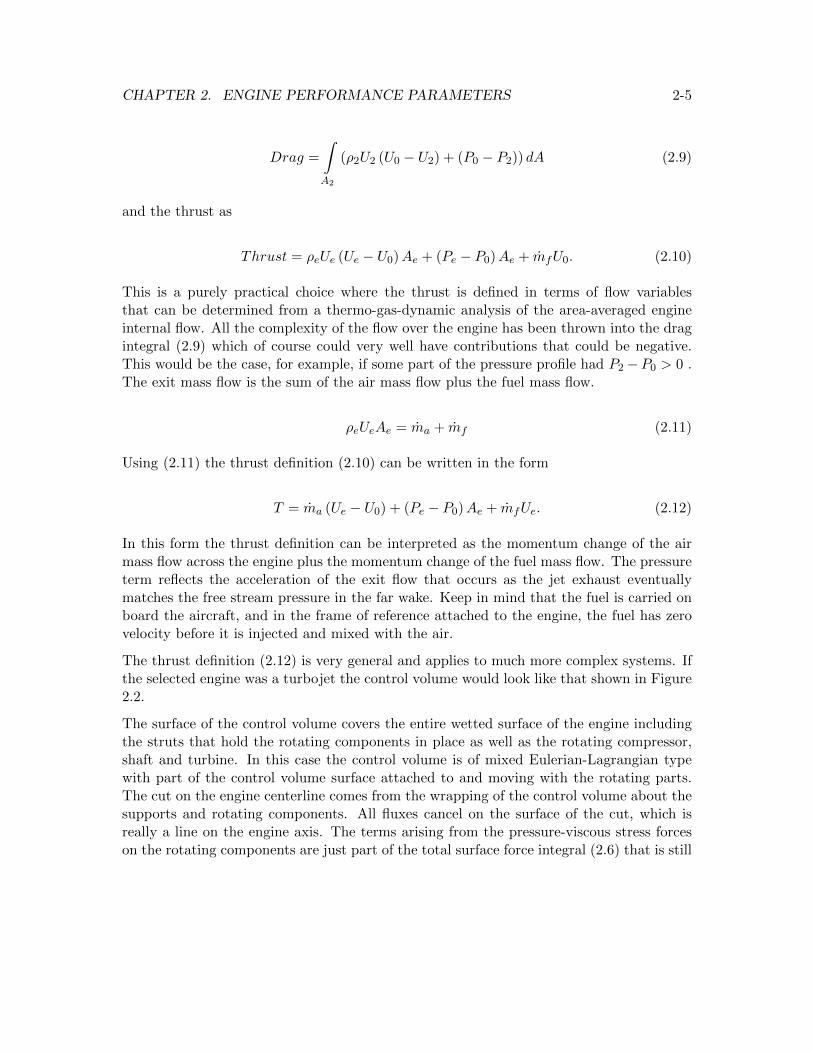
The thrust definition (2.12) is very general and applies to much more complex systems. Ifthe selected engine was a turbojet the control volume would look like that shown in Figure2.2.
The surface of the control volume covers the entire wetted surface of the engine includingthe struts that hold the rotating components in place as well as the rotating compressor,shaft and turbine. In this case the control volume is of mixed Eulerian-Lagrangian typewith part of the control volume surface attached to and moving with the rotating parts.The cut on the engine centerline comes from the wrapping of the control volume about thesupports and rotating components. All fluxes cancel on the surface of the cut, which isreally a line on the engine axis. The terms arising from the pressure-viscous stress forceson the rotating components are just part of the total surface force integral (2.6) that is still
CHAPTER 2. ENGINE PERFORMANCE PARAMETERS 2-6
Figure 2.2: Turbojet control volume.
zero. A mass and momentum balance over the control volume shown in Figure 2.2 wouldlead to the same result (2.12).
2.2 Energy balance
The energy balance across the engine is very simple. The energy equation integratesto
Z
A
�
⇢htU � ⌧ · U + Q�
· ndA = 0
Z
A2
(⇢2
ht2U2
) dA+ ⇢ehteUeAe � ⇢0
ht0U0
(A2
+Ae)� mfhf +
Z
A1
⇢1
ht1V1
dA = 0.
(2.13)
Here the viscous and heat conduction terms across the boundaries of the control volumehave been neglected and the flow over the inside and outside surface of the ramjet isassumed to be adiabatic (or at least the temperature of the engine is assumed to be atsteady state where any heat conducted into the engine is conducted out elsewhere). Thisis a very reasonable though not an exact assumption. Some heat is always lost throughthe engine nacelle but this is a tiny fraction of the enthalpy flow in the exhaust. Theviscous power term on the wetted surface is zero due to the no-slip condition. The onlycontribution over the wetted surface is from the flux of fuel which carries with it its fuelenthalpy hf .
CHAPTER 2. ENGINE PERFORMANCE PARAMETERS 2-7
A typical value of fuel enthalpy for JP-4 jet fuel is
hf |JP�4
= 4.28⇥ 107 J/kg. (2.14)
As a comparison, the enthalpy of Air at sea level static conditions is
h|Airat288.15K = CpTSL = 1005⇥ 288.15 = 2.896⇥ 105 J/kg. (2.15)
The ratio is
hf |JP�4
h|Airat288.15K
= 148. (2.16)
The energy content of a kilogram of hydrocarbon fuel is remarkably large and constitutesone of the important facts of nature that makes extended powered flight possible.
If the flow over the outside of the engine is adiabatic then the stagnation enthalpy of flowover the outside control volume surfaces is equal to the free-stream value and we can writethe energy balance as
Z
A2
(⇢2
ht0U2
) dA+ ⇢ehteUeAe � ⇢0
ht0U0
(A2
+Ae)� mfhf +
Z
A1
⇢1
ht0V1
dA = 0. (2.17)
Now multiply the continuity equation (2.4) by ht0 and subtract from (2.17). The resultis
⇢ehteUeAe � ⇢eht0UeAe � mf (hf � ht0) = 0. (2.18)
Using (2.11) the energy balance across the engine can be written as
(ma + mf )hte = maht0 + mfhf . (2.19)
The energy balance boils down to a simple algebraic relationship that states that the changein the stagnation enthalpy per second of the gas flow between the exit and entrance of theengine is equal to the added chemical enthalpy per second of the injected fuel flow.
CHAPTER 2. ENGINE PERFORMANCE PARAMETERS 2-8
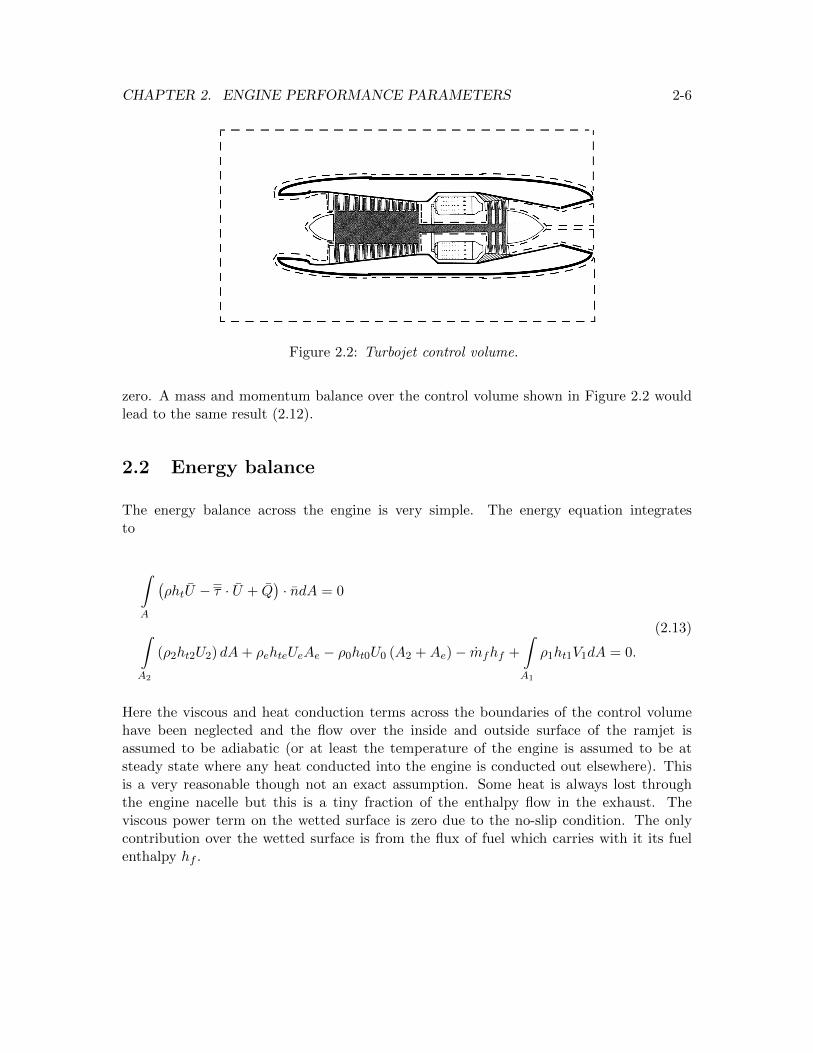
2.3 Capture area
As the operating point of an engine changes, the amount of air passing through the enginemay also vary. This is typically the case for an engine operating at subsonic Mach numbers.The capture area of the engine A
0
is defined in terms of the air mass flow rate.
ma = ⇢0
U0
A0
(2.20)
The sketches below depict the variation in capture area that can occur as the engine flightMach number changes from low subsonic to near sonic flight. The geometric entrancearea of the engine is A
1
. Similar changes can occur at a fixed flight Mach number, forexample as the engine throttle is changed leading to changes in the demand of the enginefor air. More will be said on this topic in a later chapter when we examine how a jet engineoperates.
Figure 2.3: Variation of inlet capture area with engine operating point.
2.4 Overall e�ciency
The overall e�ciency of a propulsion system is defined as
CHAPTER 2. ENGINE PERFORMANCE PARAMETERS 2-9
⌘ov =The power delivered to the vehicle
The total energy released per second through combustion. (2.21)
That is
⌘ov =TU
0
mfhf. (2.22)
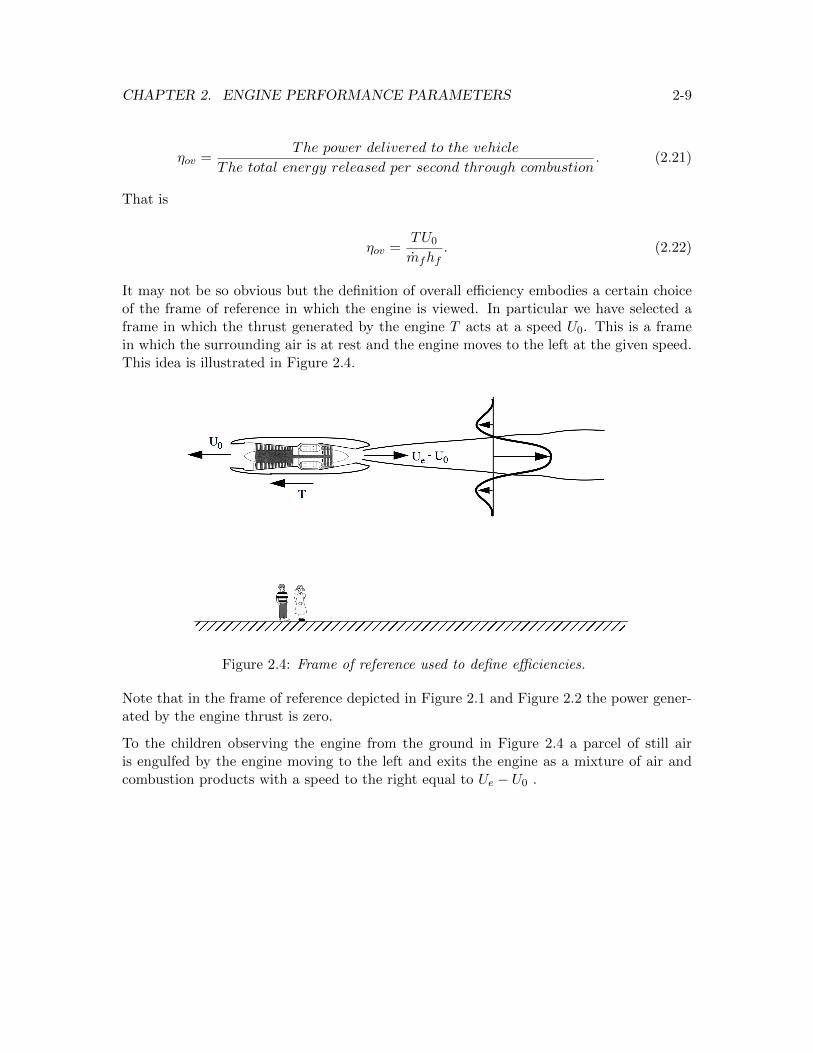
It may not be so obvious but the definition of overall e�ciency embodies a certain choiceof the frame of reference in which the engine is viewed. In particular we have selected aframe in which the thrust generated by the engine T acts at a speed U
0
. This is a framein which the surrounding air is at rest and the engine moves to the left at the given speed.This idea is illustrated in Figure 2.4.
Figure 2.4: Frame of reference used to define e�ciencies.
Note that in the frame of reference depicted in Figure 2.1 and Figure 2.2 the power gener-ated by the engine thrust is zero.
To the children observing the engine from the ground in Figure 2.4 a parcel of still airis engulfed by the engine moving to the left and exits the engine as a mixture of air andcombustion products with a speed to the right equal to Ue � U
0
.
CHAPTER 2. ENGINE PERFORMANCE PARAMETERS 2-10
2.5 Breguet aircraft range equation
There are a number of models of aircraft range. The simplest assumes that the aircraftflies at a constant value of lift to drag ratio and constant engine overall e�ciency. Therange is
R =
Z
U0
dt =
Z
mfhf⌘ovT
dt. (2.23)
The fuel mass flow is directly related to the change in aircraft weight, w , per second.
mf = �1
g
dw
dt(2.24)
Since thrust equals drag and aircraft weight equals lift we can write
T = D =
✓
D
L
◆
L =
✓
D
L
◆
w. (2.25)
Now the range integral becomes
R = �⌘ovhfg
✓
L
D
◆
Z wfinal
winitial
dw
w. (2.26)
The result is
R = ⌘ovhfg
✓
L
D
◆
Ln
✓
winitial
wfinal
◆
. (2.27)
The range formula (2.27) is generally attributed to the great French aircraft pioneer LouisCharles Breguet who in 1919 founded a commercial airline company that would eventuallybecome Air France. This result highlights the key role played by the engine overall e�ciencyin determining aircraft range. Note that as the aircraft burns fuel it must increase altitudeto maintain constant L/D . and the required thrust decreases. The small, time dependente↵ects due to the upward acceleration are neglected.
CHAPTER 2. ENGINE PERFORMANCE PARAMETERS 2-11
2.6 Propulsive e�ciency
It is instructive to decompose the overall e�ciency into an aerodynamic factor and athermal factor. To accomplish this, the overall e�ciency is written as the product of apropulsive and thermal e�ciency.
⌘ov = ⌘pr ⇥ ⌘th (2.28)
The propulsive e�ciency is
⌘pr =Power delivered to the vehicle
Power delivered to the vehicle + � kinetic energy of airsecond + � kinetic energy of fuel
second(2.29)
or
⌘pr =TU
0
TU0
+⇣
ma(Ue�U0
)
2
2
� ma(0)2
2
⌘
+⇣
mf (Ue�U0
)
2
2
� mf (U0
)
2
2
⌘ . (2.30)
If the exhaust is fully expanded so that Pe = P0
and the fuel mass flow is much less thanthe air mass flow mf ⌧ ma, the propulsive e�ciency reduces to
⌘pr =2U
0
Ue + U0
. (2.31)
This is quite a general result and shows the fundamentally aerodynamic nature of thepropulsive e�ciency. It indicates that for maximum propulsive e�ciency we want to gen-erate thrust by moving as much air as possible with as little a change in velocity across theengine as possible. We shall see later that this is the basis for the increased e�ciency of aturbofan over a turbojet with the same thrust. This is also the basis for comparison of awide variety of thrusters. For example, the larger the area of a helicopter rotor the moree�cient the lift system tends to be.
2.7 Thermal e�ciency
The thermal e�ciency is defined as
CHAPTER 2. ENGINE PERFORMANCE PARAMETERS 2-12
⌘th =Power delivered to the vehicle + � kinetic energy of air
second + � kinetic energy of fuelsecond
mfhf(2.32)
or
⌘th =TU
0
+⇣
ma(Ue�U0
)
2
2
� ma(0)2
2
⌘
+⇣
mf (Ue�U0
)
2
2
� mf (U0
)
2
2
⌘
mfhf. (2.33)
If the exhaust is fully expanded so that Pe = P0
the thermal e�ciency reduces to
⌘th =(ma + mf )
Ue2
2
� maU0
2
2
mfhf. (2.34)
The thermal e�ciency directly compares the change in gas kinetic energy across the engineto the energy released through combustion.
The thermal e�ciency of a thermodynamic cycle compares the work out of the cycle to theheat added to the cycle.
⌘th =W
Qinput during the cycle=
Qinput during the cycle �Qrejected during the cycle
Qinput during the cycle= 1�
Qrejected during the cycle
Qinput during the cycle
(2.35)
We can compare (2.34) and (2.35) by rewriting (2.34) as
⌘th = 1�
mfhf + maU0
2
2
� (ma + mf )Ue
2
2
mfhf
!
. (2.36)
This equation for the thermal e�ciency can also be expressed in terms of the gas enthalpies.Recall that
hte = he +Ue
2
2
ht0 = h0
+U0
2
2.
(2.37)
CHAPTER 2. ENGINE PERFORMANCE PARAMETERS 2-13
Replace the velocities in (2.36).
⌘th = 1�✓
mfhf + ma (ht0 � h0
)� (ma + mf ) (hte � he)
mfhf
◆
(2.38)
Use (2.19) to replace mfhf in (2.38). The result is
⌘th = 1�Qrejected during the cycle
Qinput during the cycle= 1�
✓
(ma + mf ) (he � h0
) + mfh0mfhf
◆
. (2.39)
According to (2.39) the heat rejected during the cycle is
Qrejected during the cycle = (ma + mf ) (he � h0
) + mfh0. (2.40)
This expression deserves some discussion. Strictly speaking the engine is not a closedsystem because of the fuel mass addition across the burner. So the question is; How doesthe definition of thermal e�ciency account for this mass exchange within the concept of thethermodynamic cycle? The answer is that the heat rejected from the exhaust is comprisedof two distinct parts. There is the heat rejected by conduction from the nozzle flow to thesurrounding atmosphere plus physical removal from the thermally equilibrated nozzle flowof a portion equal to the added fuel mass flow. From this perspective, the fuel mass flowcarries its fuel enthalpy into the system by injection in the burner and the exhaust fuelmass flow carries its ambient enthalpy out of the system by mixing with the surroundings.There is no net mass increase or decrease to the system.
Note that there is no assumption that the compression or expansion process operatesisentropically, only that the exhaust is fully expanded.
2.8 Specific impulse, specific fuel consumption
An important measure of engine performance is the amount of thrust produced for a givenamount of fuel burned. This leads to the definition of specific impulse
Isp =Thrust force
Weight flow of fuel burned=
T
mfg(2.41)
with units of seconds. The specific fuel consumption is essentially the inverse of the specificimpulse.
CHAPTER 2. ENGINE PERFORMANCE PARAMETERS 2-14
SFC =Pounds of fuel burned per hour
Pounds of thrust=
3600
Isp(2.42)
The specific fuel consumption is a relatively easy to remember number of order one. Sometypical values are
SFC|JT9D�takeoff⇠= 0.35
SFC|JT9D�cruise⇠= 0.6
SFC|militaryengine⇠= 0.9to1.2
SFC|militaryenginewithafterburning⇠= 2.
(2.43)
The SFC generally goes up as an engine moves from takeo↵ to cruise, as the energyrequired to produce a pound of thrust goes up with increased percentage of stagnationpressure losses and with the increased momentum of the incoming air.
2.9 Dimensionless forms
We have already noted the tendency to use both Metric and English units in dealing withpropulsion systems. Unfortunately, despite great e↵ort, the US propulsion industry hasbeen unable to move away from the clumsy system of English units. Whereas the restof the world, including the British, has gone fully metric. This is a real headache andsomething we will just have to live with, but the problem is vastly reduced by expressingall of our equations in dimensionless form.
Dimensionless forms of the Thrust.
T
P0
A0
= �M0
2
✓
(1 + f)Ue
U0
� 1
◆
+Ae
A0
✓
Pe
P0
� 1
◆
T
maa0=
✓
1
�M0
◆
T
P0
A0
(2.44)
Normalizing the thrust by P0
A0
produces a number that compares the thrust to a forceequal to the ambient pressure multiplied by the capture area. In order to overcome dragit is essential that this be a number considerably larger than one.
Dimensionless Specific impulse.
CHAPTER 2. ENGINE PERFORMANCE PARAMETERS 2-15
Ispg
a0
=
✓
1
f
◆
T
maa0(2.45)
The quantity f is the fuel/air ratio defined as
f =mf
ma. (2.46)
Overall e�ciency.
⌘ov =
✓
� � 1
�
◆✓
1
f⌧f
◆✓
T
P0
A0
◆
(2.47)
The ratio of fuel to ambient enthalpy appears in this definition.
⌧f =hf
CpT0
(2.48)
And T0
is the temperature of the ambient air. Note that the fuel/air ratio is relatively smallwhereas ⌧f is rather large (See (2.16)). Thus 1/ (f⌧f ) is generally a fraction somewhat lessthan one.
2.10 Engine notation
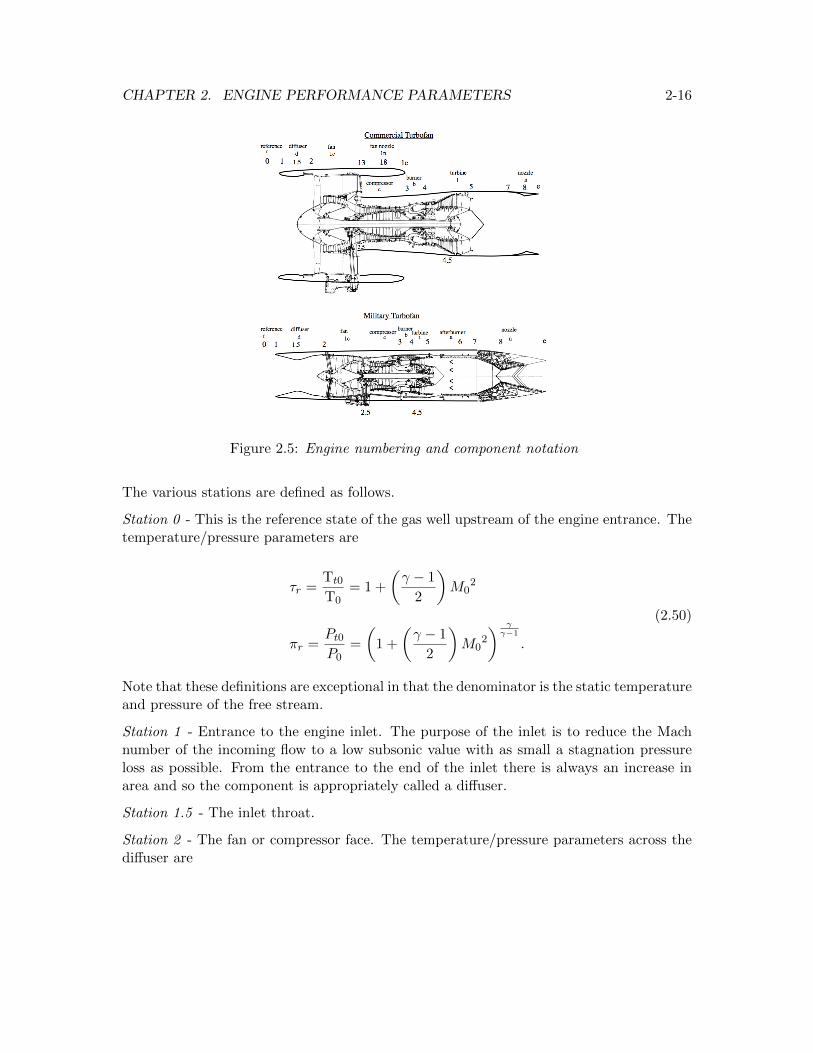
An important part of analyzing the performance of a propulsion system has to do withbeing able to determine how each component of the engine contributes to the overall thrustand specific impulse. To accomplish this, we will use a standard notation widely used inindustry for characterizing the pressure and temperature change across each component.First we need to adopt a standard system for numbering the engine components. Considerthe generic engine cross sections shown in Figure 2.5.
The performance of each component is defined in terms of the stagnation pressure andtemperature entering and leaving the component. A widely accepted notation is
⌧ =The stagnation temperature leaving the component
The stagnation temperature entering the component
⇡ =The stagnation pressure leaving the component
The stagnation pressure entering the component.
(2.49)
CHAPTER 2. ENGINE PERFORMANCE PARAMETERS 2-16
Figure 2.5: Engine numbering and component notation
The various stations are defined as follows.
Station 0 - This is the reference state of the gas well upstream of the engine entrance. Thetemperature/pressure parameters are
⌧r =Tt0
T0
= 1 +
✓
� � 1
2
◆
M0
2
⇡r =Pt0
P0
=
✓
1 +
✓
� � 1
2
◆
M0
2
◆
���1
.
(2.50)
Note that these definitions are exceptional in that the denominator is the static temperatureand pressure of the free stream.
Station 1 - Entrance to the engine inlet. The purpose of the inlet is to reduce the Machnumber of the incoming flow to a low subsonic value with as small a stagnation pressureloss as possible. From the entrance to the end of the inlet there is always an increase inarea and so the component is appropriately called a di↵user.
Station 1.5 - The inlet throat.
Station 2 - The fan or compressor face. The temperature/pressure parameters across thedi↵user are
CHAPTER 2. ENGINE PERFORMANCE PARAMETERS 2-17
⌧d =Tt2
Tt1
⇡d =Pt2
Pt1.
(2.51)
In the absence of an upstream shock wave the flow from the reference state is regarded asadiabatic and isentropic so that
Tt1 = Tt0
Pt1 = Pt0.(2.52)
The inlet is usually modeled as an adiabatic flow so the stagnation temperature is approx-imately constant, however the stagnation pressure decreases due to the presence of viscousboundary layers and possibly shock waves.
Station 2.5 - All turbofan engines comprise at least two spools. The fan is usually ac-companied by a low pressure compressor driven by a low pressure turbine through a shaftalong the centerline of the engine. A concentric shaft connects the high pressure turbineand high pressure compressor. Station 2.5 is generally taken at the interface between thelow and high pressure compressor. Roll Royce turbofans commonly employ three spoolswith the high pressure compressor broken into two spools.
Station 13 - This is a station in the bypass stream corresponding to the fan exit ahead ofthe entrance to the fan exhaust nozzle. The temperature/pressure parameters across thefan are
⌧1c =
Tt13
Tt2
⇡1c =
Pt13
Pt2.
(2.53)
Station 18 - The fan nozzle throat.
Station 1e - The fan nozzle exit. The temperature/pressure parameters across the fannozzle are
CHAPTER 2. ENGINE PERFORMANCE PARAMETERS 2-18
⌧1n =
Tt1e
Tt13
⇡1n =
Pt1e
Pt13.
(2.54)
Station 3 - The exit of the high pressure compressor. The temperature/pressure parametersacross the compressor are
⌧c =Tt3
Tt2
⇡c =Pt3
Pt2.
(2.55)
Note that the compression includes that due to the fan. From a cycle perspective it isusually not necessary to distinguish the high and low pressure sections of the compressor.The goal of the designer is to produce a compression system that is as near to isentropicas possible.
Station 4 - The exit of the burner. The temperature/pressure parameters across the burnerare
⌧b =Tt4
Tt3
⇡b =Pt4
Pt3.
(2.56)
The temperature at the exit of the burner is regarded as the highest temperature in theBrayton cycle although generally higher temperatures do occur at the upstream end of theburner where combustion takes place. The burner is designed to allow an influx of coolercompressor air to mix with the combustion gases bringing the temperature down to a levelthat the high pressure turbine structure can tolerate. Modern engines use sophisticatedcooling methods to enable operation at values of Tt4 that approach 3700R(2050K), wellabove the melting temperature of the turbine materials.
Station 4.5 - This station is at the interface of the high and low pressure turbines.
Station 5 - The exit of the turbine. The temperature/pressure parameters across theturbine are
CHAPTER 2. ENGINE PERFORMANCE PARAMETERS 2-19
⌧t =Tt5
Tt4
⇡t =Pt5
Pt4.
(2.57)
As with the compressor the goal of the designer is to produce a turbine system that operatesas isentropically as possible.
Station 6 - The exit of the afterburner if there is one. The temperature/pressure parametersacross the afterburner are
⌧a =Tt6
Tt5
⇡a =Pt6
Pt5.
(2.58)
The Mach number entering the afterburner is fairly low and so the stagnation pressureratio of the afterburner is fairly close to, and always less than, one.
Station 7 - The entrance to the nozzle.
Station 8 - The nozzle throat. Over the vast range of operating conditions of modernengines the nozzle throat is choked or very nearly so.
Station e - The nozzle exit. The temperature/pressure component parameters across thenozzle are
⌧n =Tte
Tt7
⇡n =Pte
Pt7.
(2.59)
In the absence of the afterburner, the nozzle parameters are generally referenced to theturbine exit condition so that
⌧n =Tte
Tt5
⇡n =Pte
Pt5.
(2.60)
CHAPTER 2. ENGINE PERFORMANCE PARAMETERS 2-20
In general the goal of the designer is to minimize heat loss and stagnation pressure lossthrough the inlet, burner and nozzle.
There are two more very important parameters that need to be defined. The first is one weencountered before when we compared the fuel enthalpy to the ambient air enthalpy.
⌧f =hf
CpT0
(2.61)
The second parameter is, in a sense, the most important quantity needed to characterizethe performance of an engine.
⌧� =Tt4
T0
(2.62)
In general every performance measure of the engine gets better as ⌧� is increased and atremendous investment has been made over the years to devise turbine cooling and ceramiccoating schemes that permit ever higher turbine inlet temperatures, Tt4.
2.11 Problems
Problem 1 - Suppose 10% of the heat generated in a ramjet combustor is lost throughconduction to the surroundings. How would this change the energy balance (2.19)? Howwould it a↵ect the thrust?
Problem 2 - Write down the appropriate form of the thrust definition (2.12) for a turbofanengine with two independent streams. Suppose 5% of the air from the high pressurecompressor is to be used to power aircraft systems. What would be the appropriate thrustformula?
Problem 3 - Consider the flow through a turbojet. The energy balance across the burneris
(ma + mf )ht4 = maht3 + mfhf . (2.63)
The enthalpy rise across the compressor is equal to the enthalpy decrease across the turbine.Show that the energy balance (2.63) can also be written
(ma + mf )ht5 = maht2 + mfhf . (2.64)
CHAPTER 2. ENGINE PERFORMANCE PARAMETERS 2-21
The inlet and nozzle are usually assumed to operate adiabatically. Show that (2.64) canbe expressed as
(ma + mf )hte = maht0 + mfhf (2.65)
which is the same as the overall enthalpy balance for a ramjet (2.19).
Problem 4 - Work out the dimensionless forms in Section 2.9.