Embed Size (px)
Citation preview

08/05/2021
ENGIE Brasil EnergiaResults Presentation
2Q21August 05, 2021

ENGIE Brasil Energia S.A. Results Presentation 2Q21
08/05/2021
This publication may include forward-looking statements on events or
results pursuant to Brazilian and international securities’ regulations.
These forward-looking statements are based on certain assumptions and
analyzes made by ENGIE Brasil Energia S.A. (“ENGIE Brasil Energia” or
“Company”), - previously denominated Tractebel Energia S.A. -, in
accordance with its experience and the economic scenario, market
conditions and expected events, many of which are outside the control of
ENGIE Brasil Energia. Important factors which can lead to significant
differences between effective results and the forward-looking statements
with respect to events or results, include the business strategy of ENGIE
Brasil Energia, economic and international conditions, technology,
financial strategy, development of the government services industry,
hydrological conditions, conditions in the financial markets, uncertainty
surrounding the results of its future operations, plans, objectives,
expectations and intentions and other factors. In the light of these factors,
the effective results of ENGIE Brasil Energia may differ significantly from
those indicated or implicit in the forward-looking statements with respect
to events or results.
The information and opinions contained herein should not be
understood as a recommendation to potential investors and no
investment decision should be based on the veracity, topicality or
completeness of this information or these opinions. None of the
advisors to ENGIE Brasil Energia or the parties related thereto or
their representatives shall accept responsibility for any losses,
which may occur as a result of the use or the content in this
presentation.
This material includes forward-looking statements as to events
subject to risks and uncertainties, which based on existing
expectations and forecasts on future events and tendencies, may
affect the businesses of ENGIE Brasil Energia. These forward-
looking statements include forecasts of economic growth and
energy supply and demand as well as information on competitive
position, the regulatory environment, growth potential opportunities
and other matters. Innumerous factors can affect adversely the
estimates and assumptions on which these statements are based.

ENGIE Brasil Energia S.A. Results Presentation 2Q21
08/05/2021
Highlights
Energy Sales
Expansion
Financial Performance
Supporting Data1.
2.
3.
4.
5.

ENGIE Brasil Energia S.A. Results Presentation 2Q21
08/05/2021
Highlights

ENGIE Brasil Energia S.A. Results Presentation 2Q21
08/05/20215
Adjusted Ebitda1
(R$ million)Adjusted Ebitda vs 2Q20:
• Transmission: + R$ 138 million
• Energy purchases: + R$ 129 million
• Average sales price: + R$ 77 million
• Concession assets: + R$ 67 million
• TAG: + R$ 57 million
• Short term/CCEE: - R$ 59 million
• Fuel: - R$ 56 million
Net Income(R$ million)
Note:1 Adjusted Ebitda: net income + income tax and social contribution + financial result + depreciation and amortization + impairment + non-recurring.
Net income vs 2Q20:
• Adjusted Ebitda: + R$ 252 million
• Impact of the increase in inflation rates on monetary
restatement :
•Debt: - R$ 231 million
•Concessions payable: - R$ 223 million
• IGP-M: - R$ 181 million
2Q20
2,612
2Q21 6M20 6M21
1,2801,532
3,218
+19.7%
+23.2%
766
319
848
2Q20 6M212Q21 6M20
1,278
-58.4%
-33.6%
Main drivers during the quarter
Positive:
• Greater generation from wind sources: + 20%
• Reduction in PPAs for potfolio management
• Contribution of energy transmission segment
• Average energy sales price: +4.9%
• Pampa Sul greater availability
Negative:
• Impact of monetary restatement (IGPM and IPCA) on
concessions payable and on debts
• CCEE Result
• Higher fuel consumption
Non-recurrings:
• 2Q21 impairment: - R$ 163 million
• Gain in lawsuit in 2Q20: ICMS
• Extemporaneous tax credits in 2Q20 (TAG).
ENGIE Brasil Energia S.A. Results Presentation 2Q21
08/05/20216
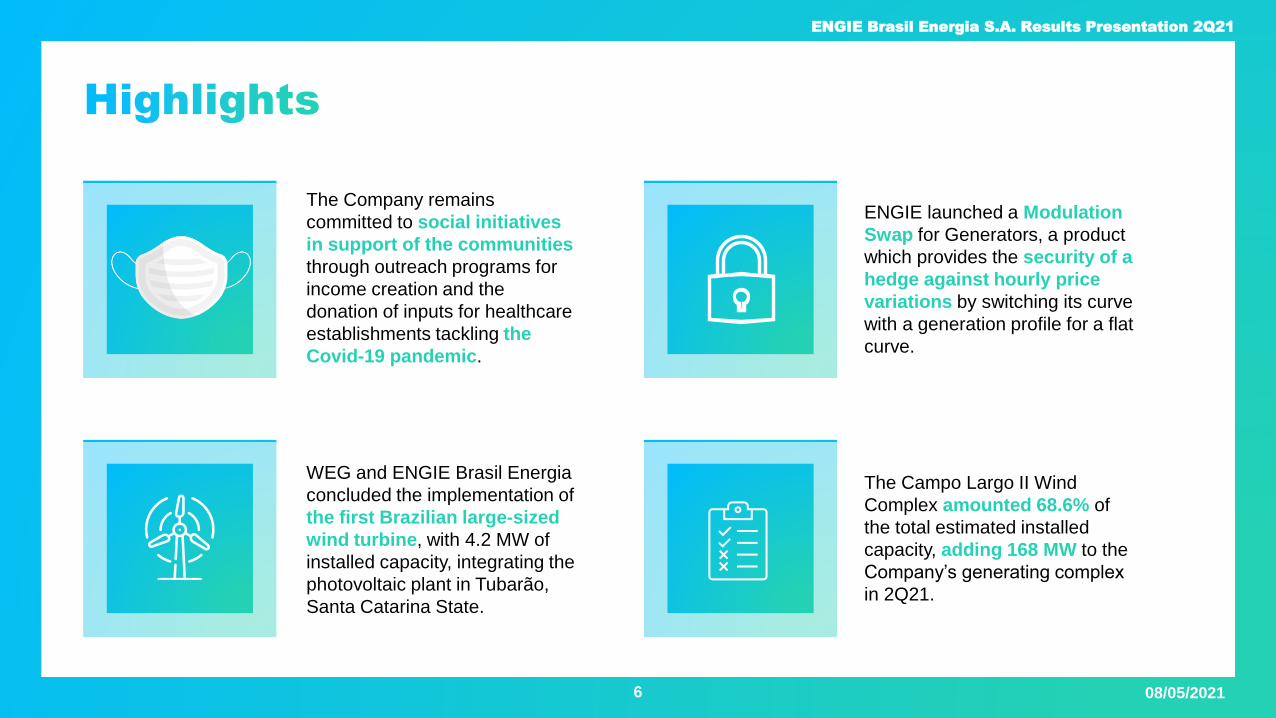
ENGIE launched a Modulation
Swap for Generators, a product
which provides the security of a
hedge against hourly price
variations by switching its curve
with a generation profile for a flat
curve.
The Campo Largo II Wind
Complex amounted 68.6% of
the total estimated installed
capacity, adding 168 MW to the
Company’s generating complex
in 2Q21.
The Company remains
committed to social initiatives
in support of the communities
through outreach programs for
income creation and the
donation of inputs for healthcare
establishments tackling the
Covid-19 pandemic.
WEG and ENGIE Brasil Energia
concluded the implementation of
the first Brazilian large-sized
wind turbine, with 4.2 MW of
installed capacity, integrating the
photovoltaic plant in Tubarão,
Santa Catarina State.

ENGIE Brasil Energia S.A. Results Presentation 2Q21
08/05/20217
With progress in negotiations
with FRAM Capital, the
Company expects to sign the
contract for the sale of the
Jorge Lacerda Thermoelectric
Complex, by the end of
August 2021, with conditions
precedent still to be met.
Law 14.182/21 was approved
extending reimbursement for
GSF hydrological losses (i) for
plants which renegotiated the
hydrological risk, prior to 2015
and (ii) for the large, strategic
hydroelectric plants. ENGIE is
expected booking the effects in
the upcoming quarter.
ENGIE reported, on July 22,
an all-time record for wind
generation (five minutes
average), with a total of
1,105.19 MW, equivalent to a
capacity factor of 89.2%.
As a result of the accident on July 16
at the Novo Estado works, the
Company is demanding the
inspection and testing of 100% of the
foundations of its transmission
towers to ensure the best safety
practices and prevent risks of
accidents in the future.

ENGIE Brasil Energia S.A. Results Presentation 2Q21
08/05/20218
Approved the distribution of
R$ 789,5 million as
intermediate dividends
(R$ 0.9676/share). Shares will
become ex-dividend as from
08/17/2021 and will be paid on
a date to be determined later
by the Management Board.
In order to promote the
replacement of thermal capacity,
was installed a Special
Independent Committee for
Transactions with Related
Parties to evaluate the potential
acquisition of the Paracatu
and Floresta Photovoltaic
Complexes, with total installed
capacity of 259.8 MWp.

ENGIE Brasil Energia S.A. Results Presentation 2Q21
08/05/2021
Energy Sales

ENGIE Brasil Energia S.A. Results Presentation 2Q21
08/05/202110
Portfolio diversification and gradual sale of future energy availability
Energy Balance (% of total; average MW) Free customers total sales volume for 2021: 2,359 aMW
Uncontracted energy compared to the availability of a given year
2021 Contracted Energy Breakdown by Market
as of June 30, 2021
2022
2,01235%
5,728
2,01234%
2,05938%
2021
93217%
3,18154%
2,95352%
71312%
76313%
2,01236%
2,50044%
1,13620%
2023
2,00736%
1,99436%
1,98236%
1,54128%
2024
1,41326%
2025
1,98437%
2,50246%
2026
5,9065,648 5,530 5,466 5,418
Regulated Market AvailableFree Market
61% Free Market 39% Regulated Market
Source: Internal study based on IBGE’s classification.
26
%
36%
43
%
50
% 54%
13%
20%
33%
44%
52%
12% 1
7%
26%
38
%
45%
12% 14% 1
9%
29%
38
%
2021 2022 2023 2024 2025
28012/31/2017 12/31/201912/31/2018 12/31/2020

ENGIE Brasil Energia S.A. Results Presentation 2Q21
08/05/202111
Evolution of Free Customers1
Note: ¹ Net of trading operations.
621
Number of free customers Free customers contracted volume (aMW)
280
515
621
720687
660
2Q20 2Q2120182017 2019 2020
2,366 2,293
2,603 2,656 2,625
2,359 1,742 (+13% compared to 2Q20)
Commercial & Industrial sites
served in 2Q21
10.9% (-2.3 p.p compared to 2Q20)
Market share ACL in 2Q21
(of total energy in Free Market)
ML
37.5% Participation of Free Clients out
of total net operating revenue
40.4%Participation of Free Clients out
of total physical sales
418 tCO2
CERs sold in 1Q21
(Certified Emission Reduction)
1,092 GWh
RECs sold in 1Q21
(Renewable Energy Certificates)

ENGIE Brasil Energia S.A. Results Presentation 2Q21
08/05/2021
Expansion

ENGIE Brasil Energia S.A. Results Presentation 2Q21
08/05/202113
Campo Largo II Wind Complex
Accumulated progress of approximately 97% of the work at the end of 2Q21.
• 8 out of 11 wind farms started commercial operations and the last 3 farms began
operations on a test basis during 2Q21.
• At the end of 2Q21, out of a total of 86 machines, 71 wind generators were
completely assembled and 66 had been commissioned.
• Full commercial operation expected for August 2021.Total Installed Capacity:
361.2 MW
Commercial Capacity (gross):
192.5 aMW
Start of
construction: 2019
Start of
operation: 1Q21
Nº of wind turbines: 86 (~ 4.2 MW each)
Note: 1 Value as of January 2019.
Investment (R$mm)1: ~R$ 1,600
Wind turbines comissioning evolution
as of March 31, 2021
54
13
19
86
Mar 31, 2021
Under constructionTest operationCommercial operation
10
17
59
Jun 30, 2021
86
Assembly of wind turbines
27
59
Aug 4, 2021
86
Campo Largo II WCSento Sé and
Umburanas (BA)
BA

ENGIE Brasil Energia S.A. Results Presentation 2Q21
08/05/202114
Santo Agostinho Wind Complex (Phase I)
Total Installed Capacity:
434 MW
Commercial Capacity (gross):
218 aMW
Start of
construction: 2021
Start of operation :
Up to Mar/2023
Nº of wind turbines : 70 (6.2 MW each)
Note: 1 Value as of December 2020.
Investment (R$mm)1: ~R$ 2,300
New wind project made feasible in the Free Contracting
Environment (ACL) of energy.
• The earthworks at the collector substation site have started.
• Execution of the topographic, drilling and vegetation suppression.
• Development of the engineering project and progress in the
acquisition of the project's main equipment.
• The companies engaged at the mobilization stage prior to the start of
construction.
Santo Agostinho WCLajes and Pedro
Avelino (RN) - Phase I
RN

ENGIE Brasil Energia S.A. Results Presentation 2Q21
08/05/202115
Gralha Azul Transmission System
15 lines
totaling around
1,000 km
and five
substations
Contracted RAP (R$ mm): 231.71
RAP by section (%)
9.8%
68.5%
6.3%
10.1%
5.3%
Section 1
Section 2
Section 3
Section 4
Section 5
Line tension:
525 kV
(around 526 Km)
230 kV
(around 474 Km)
Estimated Capex1: ~R$ 1.7 billion
Deadline to start
operation: March 2023Concession period:
30 years
Substation capacity:
1 substation from
525 to 230 kV:
2,016 MVA
4 substations from
230 to 138 kV:
1,350 MVA
Note: 1 Value as of August 2017.
Assembly of Gralha Azul
Transmission System
Overall work have reached 89%, meeting the physical-financial deadlines.
• The 230kV – Ponta Grossa – São Mateus do Sul transmission line received the
Release Agreement for Tests from the ONS, valid from July 18, 2021.
• The plan for anticipating the entry into commercial operations was maintained:
expected to occur gradually from August 2021.
Gralha Azul
Transmission
Line (PR)
PR
ENGIE Brasil Energia S.A. Results Presentation 2Q21
08/05/202116
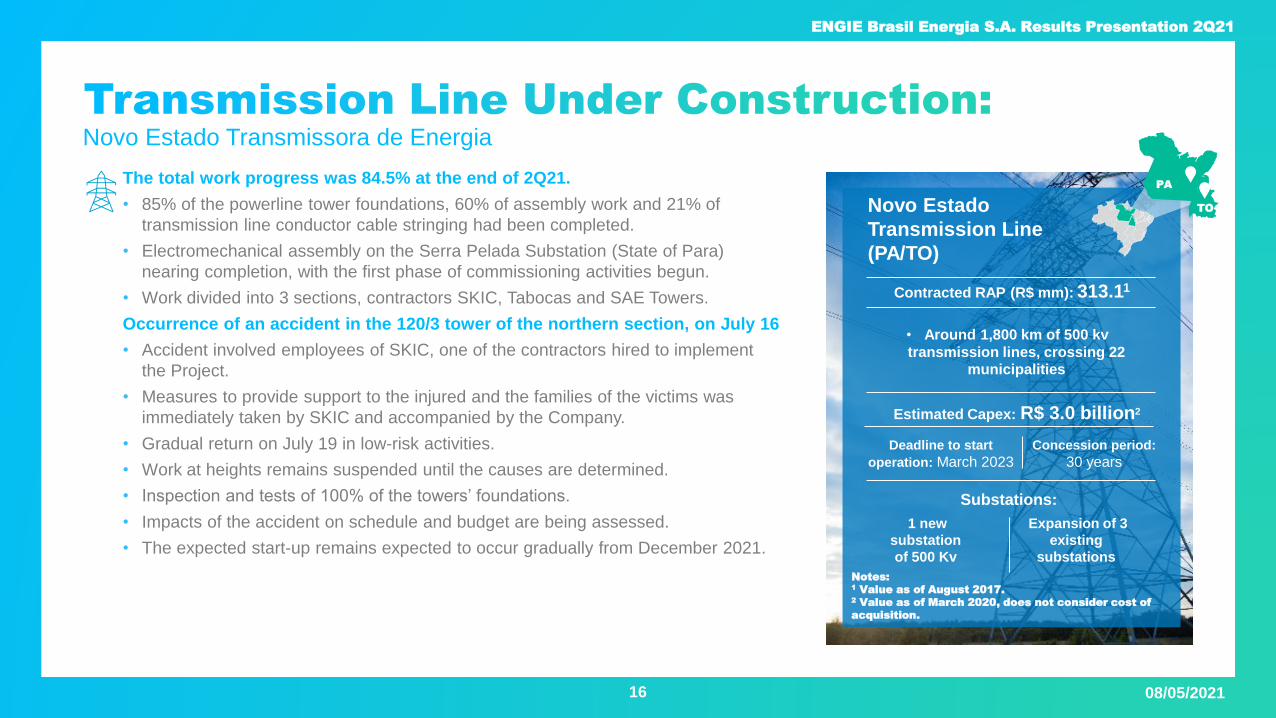
Novo Estado Transmissora de Energia
Estimated Capex: R$ 3.0 billion2
Contracted RAP (R$ mm): 313.11
Deadline to start
operation: March 2023
Concession period:
30 years
Substations:
1 new
substation
of 500 Kv
Expansion of 3
existing
substations
Notes: 1 Value as of August 2017.2 Value as of March 2020, does not consider cost of
acquisition.
• Around 1,800 km of 500 kv
transmission lines, crossing 22
municipalities
The total work progress was 84.5% at the end of 2Q21.
• 85% of the powerline tower foundations, 60% of assembly work and 21% of
transmission line conductor cable stringing had been completed.
• Electromechanical assembly on the Serra Pelada Substation (State of Para)
nearing completion, with the first phase of commissioning activities begun.
• Work divided into 3 sections, contractors SKIC, Tabocas and SAE Towers.
Occurrence of an accident in the 120/3 tower of the northern section, on July 16
• Accident involved employees of SKIC, one of the contractors hired to implement
the Project.
• Measures to provide support to the injured and the families of the victims was
immediately taken by SKIC and accompanied by the Company.
• Gradual return on July 19 in low-risk activities.
• Work at heights remains suspended until the causes are determined.
• Inspection and tests of 100% of the towers’ foundations.
• Impacts of the accident on schedule and budget are being assessed.
• The expected start-up remains expected to occur gradually from December 2021.
Novo Estado
Transmission Line
(PA/TO)
PA
TO

ENGIE Brasil Energia S.A. Results Presentation 2Q21
08/05/2021
Paracatu and Floresta Photovoltaic Complexes
17
Special Independent Committee for Transactions with Related Parties
(CRP) Installed.
• The Paracatu and Floresta Photovoltaic Complexes sold for the term of 20
years a total of 59.1 average MW of solar energy at the Second Reserve
Energy Auction of 2015, by Solaire Direct, company acquired by the
ENGIE Group that year.
• The COD of Paracatu and Floresta have occurred in February 2019 and in
December 2017, respectively.
• Pursuant to the Regulations, the CRP will be composed of members of the
Board of Directors, the majority of them Independent Directors, the
remainder being drawn from the Company’s Officers.
Total Installed Capacity:
259.8 MWp
Total Commercial Capacity:
59.1 aMW
Paracatu’s PPA:
34 aMW
R$ 364.13/MWh1
Note: 1 Value as of November of 2020.
MG
RN
Floresta’s PPA:
25.1 aMW
R$ 357.78/MWh1
Paracatu Photovoltaic
ComplexFloresta Photovoltaic
Complex
Paracatu (MG) and
Floresta (RN) Photovoltaic
Complexes

ENGIE Brasil Energia S.A. Results Presentation 2Q21
08/05/2021
aMW
2,212PHYSICAL
GUARANTEE
MW
3,750INSTALLED
CAPACITY
50GENERATING
UNITS
75MW
EACH
ESBR - estrutura acionária
40%
20%
20%
20%
2Q20 2Q21
2,199
2,792
+27.0%
2021-2034
1,565
538 538
14 95
2,212
14
95
2,212
1,565
2035-2043
Uptime
operating
factor in 2Q21:
99.2%1
Note: 1 Subject to final CCEE booking.
Regulated
Partners
Bilateral
Uncontracted
Losses
Jirau HPP | Update
Production (MW average)1 PPA’s portfolio (MW average) Shareholding Structure
18

ENGIE Brasil Energia S.A. Results Presentation 2Q21
08/05/2021
ENGIE Brasil Energia has also a portfolio of assets under development. Some of them are presented below.
Assú I, II, III and IV Photovoltaic Centrals - RN
Installed Capacity: 120 MW
Sto. Agostinho Wind Cimplex (Phase II) - RN
Installed Capacity: 366 MW
Umburanas Wind Complex (Phase II) – BA
Installed Capacity: 250 MW
Alvorada Photovoltaic Complex - BA
Installed Capacity: 90 MW
Campo Largo Wind Complex (Phase III) – BA
Installed Capacity: 250 MW
Campo Largo Photovoltaic Complex – BA
Installed Capacity: 400 MW
19
866 MW 610 MW+ = 1,476 MW

ENGIE Brasil Energia S.A. Results Presentation 2Q21
08/05/2021
Financial
Performance

ENGIE Brasil Energia S.A. Results Presentation 2Q21
08/05/202121
Creation of shareholder value: financial discipline and efficient capital allocation.
ROE1 - Return on Equity (%)
ROIC2 - Return Over Invested Capital (%)
Notes: ENGIE Brasil Energia internal study based on the Company’s Financial Statements.1 ROE: net income of the past 4 quarters / shareholders’ equity.2 ROIC: effective tax rate x EBIT / invested capital (invested capital: debt – cash and cash equivalents – deposits earmarked for debt servicing + SE).3 Nominal amount.4 Net of GSF repactuation.
From 2016 – 20203:
• Investments amounted to: ~R$ 19 billion, with 82%leverage
• Proprietary installed capacity rose +24%
• Acquistion of 32.5% stake in TAG
• Entry into transmission: 2,800 km under construction
• Ebitda4: +74%
• Net income4: +66%
• Dividends and IOC: R$ 9.1 billion
2Q20 2Q212020
33.0
2018 2019
36.6 36.1 35.5
29.0
2018 2Q202019 2020
20.822.723.0
2Q21
19.1
23.4

ENGIE Brasil Energia S.A. Results Presentation 2Q21
08/05/202122
Net operating revenue (R$ million)
Generation and portfolio’s sale Trading Transmission Photovoltaic panels
342
Price and
sales volume
Financial
asset
remuneration
12
CCEE
32,68777
(20)
Fines and
indemnities
2Q20
(80)
Trading Transmission
3,1331
Solar
67
16.2%
74.1%
9.5%
24.8%
NOR 2Q21
0.3%
Other
44
9.5%
Tax recovery
2Q20
0.3%
NOR 2Q21
65.4%
16.6%

ENGIE Brasil Energia S.A. Results Presentation 2Q21
08/05/202123
Stake of 32.5% in TAG contributed with R$ 147 million via equity income to the Company’s Ebitda in the 2Q21.
Income Statement TAG (R$ million)
Contribution of the Result from Transportadora Associada de Gás (TAG) to the EBITDA of the Company
Contribution to Ebitda
453
NOR TAG 2Q21
-440
Financial results
-549
-51
Cost of services General and
administrative
expenses
-237
Income
taxes
Net income
TAG 2Q21
1,730
147
ENGIE Brasil Energia S.A. Results Presentation 2Q21
08/05/202124
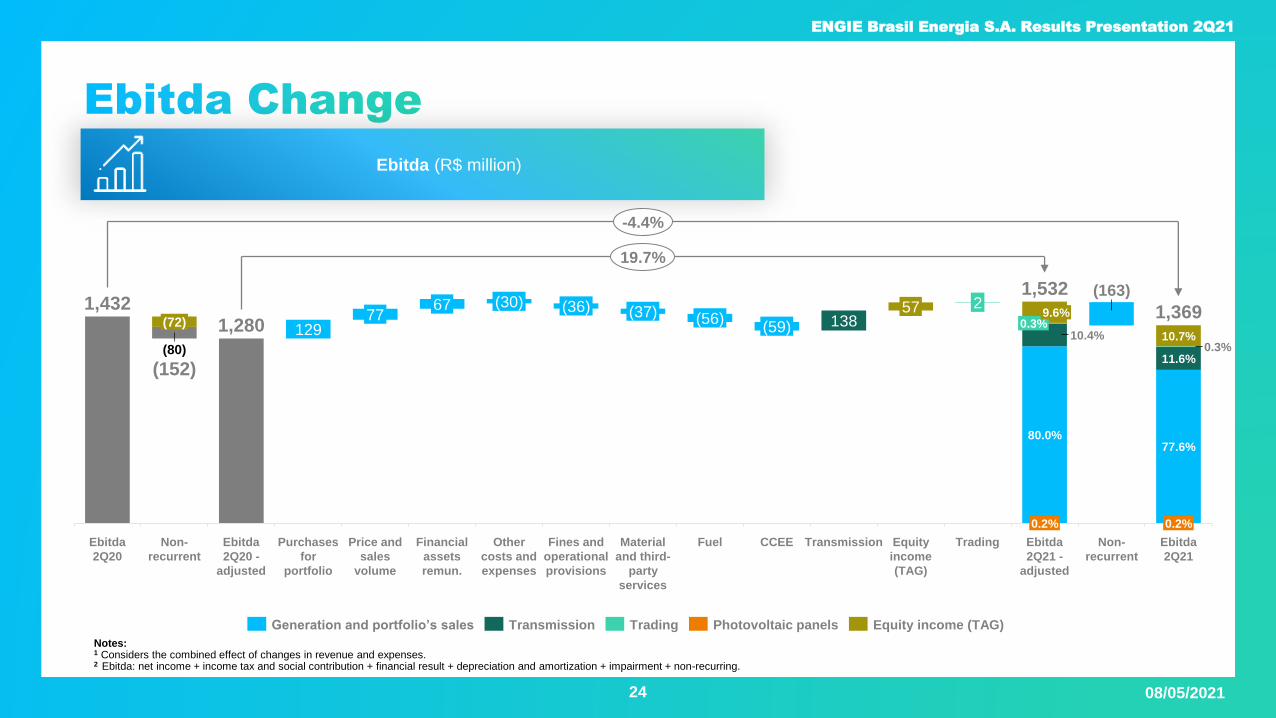
Ebitda (R$ million)
Notes: 1 Considers the combined effect of changes in revenue and expenses.2 Ebitda: net income + income tax and social contribution + financial result + depreciation and amortization + impairment + non-recurring.
129138
Trading
(72)
(80)
Material
and third-
party
services
Other
costs and
expenses
77
Non-
recurrent
Fuel
(163)
CCEEPrice and
sales
volume
Ebitda
2Q21 -
adjusted
670.3%
0.2%
Non-
recurrent
Ebitda
2Q21
77.6%
Transmission
0.3%11.6%
Ebitda
2Q20
Purchases
for
portfolio
80.0%
Equity
income
(TAG)
9.6%
Ebitda
2Q20 -
adjusted
0.2%
57
10.7%(59)
(37)
Fines and
operational
provisions
(36)
10.4%
(30) 2
Financial
assets
remun.
1,432
(152)
1,280
1,532
1,369(56)
19.7%
-4.4%
TransmissionGeneration and portfolio’s sales Equity income (TAG)Trading Photovoltaic panels

ENGIE Brasil Energia S.A. Results Presentation 2Q21
08/05/202125
Net Income (R$ million)
766
319
252
101
Non-recurrent
2Q20
Income
taxes
(5)
Adjusted
financial result
Net income
2Q20
Ajusted Ebitda Depreciation
and
amortization
(108)
Impairment
(173)(514)
Net income
2Q21
-514
-58%
(181)
IGP-M

ENGIE Brasil Energia S.A. Results Presentation 2Q21
08/05/202126
Balanced leverage, at competitive cost, fostering growth opportunities.
Debt Overview (R$ million)
With no currency exposure
Notes:1 Gross debt, net of hedge operations.2 Funds from Operations, net from impact of the transmission lines (Contract Assets).3 Ebitda in the past 12 months.
Local Currency Debt FFO2 / Total Debt Net debt / LTM Ebitda3Total Debt / LTM Ebitda3
To
tal D
eb
t / Eb
itda
3
(R$ m
illio
n)
13,078
9.4981
14,4371
16,672118,4991 5,074
346
2018 2019 2020 2Q21 Cash and
equivalents
Escrow
deposits
Net debt
2Q21
1.6x
2.0x1.8x
1.9x
2.2x
2.8x
2.6x 2.6x
0.380.30
0.27 0.28

ENGIE Brasil Energia S.A. Results Presentation 2Q21
08/05/202127
AAA rating and robust cash generation translate into competitive costs of debt for financing growth.
Maturity debt schedule (R$ million)
Competitive costs and defensive indexes
Breakdown of debt
Indexation of energy sales contracts mitigates exposure of debt to IPCA.
Nominal cost of debt: 11.2% p.y.
(5.8% in 2Q20)Average debt term: 6.9 years
Fixed
CDI
TJLP
IPCA
ENGIE Brasil Energia S.A. Results Presentation 2Q21
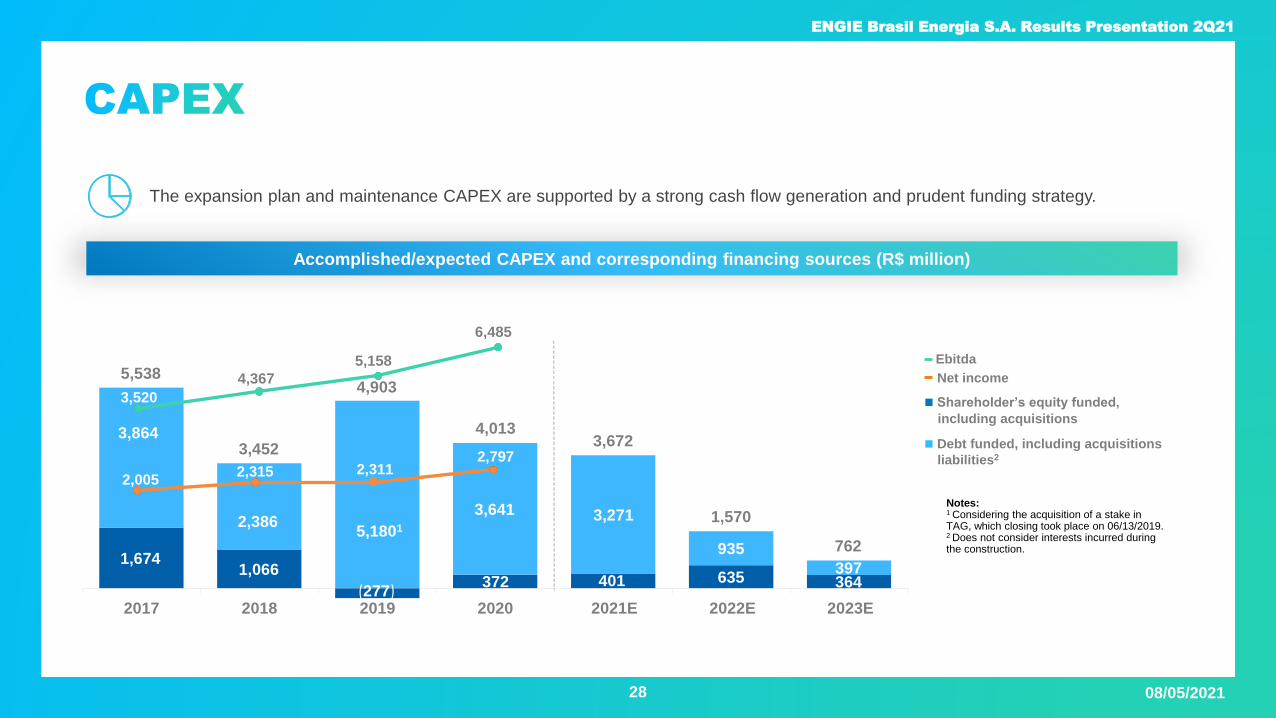
08/05/202128
Ebitda
Net income
Shareholder’s equity funded,
including acquisitions
Debt funded, including acquisitions
liabilities2
The expansion plan and maintenance CAPEX are supported by a strong cash flow generation and prudent funding strategy.
Accomplished/expected CAPEX and corresponding financing sources (R$ million)
Notes:1 Considering the acquisition of a stake in TAG, which closing took place on 06/13/2019. 2 Does not consider interests incurred during the construction.
1,6741,066
(277)372 401 635 364
3,864
2,3865,1801
3,641 3,271
935
397
5,538
3,452
4,903
4,0133,672
1,570
762
2017 2018 2019 2020 2021E 2022E 2023E
3,520
4,367
5,158
6,485
2,0052,315 2,311
2,797
ENGIE Brasil Energia S.A. Results Presentation 2Q21
08/05/202129
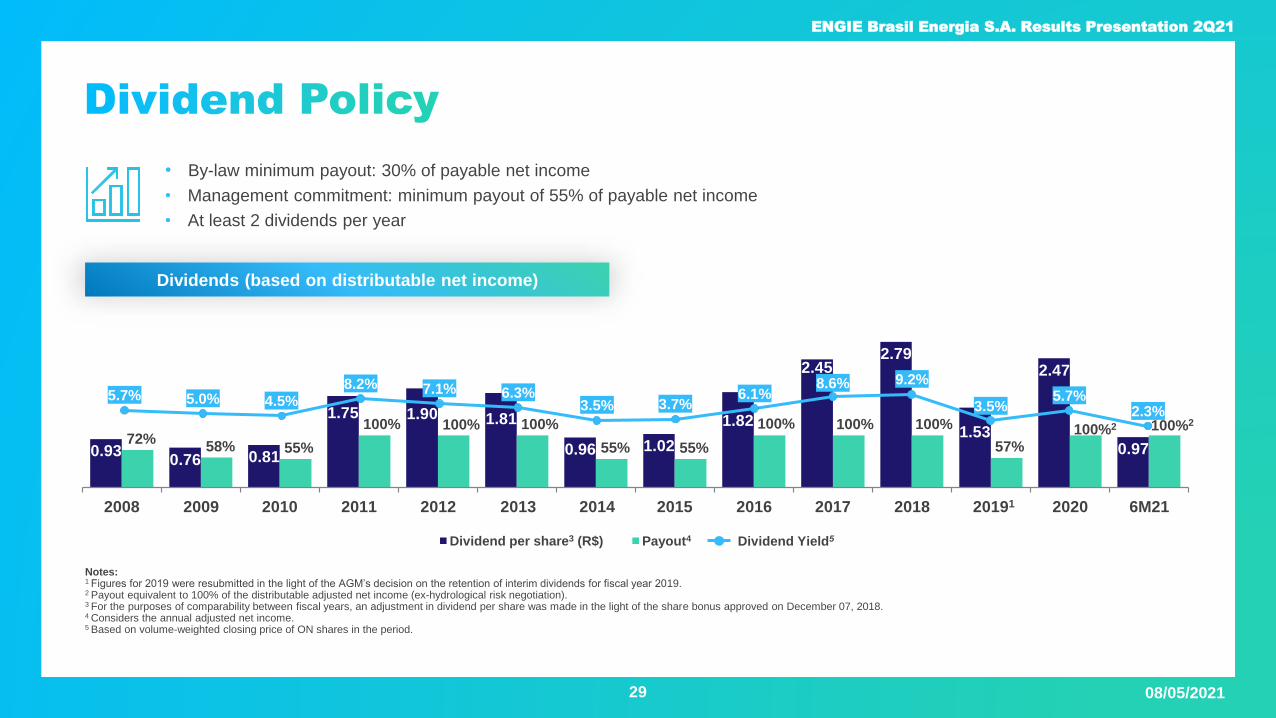
Notes: 1 Figures for 2019 were resubmitted in the light of the AGM’s decision on the retention of interim dividends for fiscal year 2019.2 Payout equivalent to 100% of the distributable adjusted net income (ex-hydrological risk negotiation). 3 For the purposes of comparability between fiscal years, an adjustment in dividend per share was made in the light of the share bonus approved on December 07, 2018.4 Considers the annual adjusted net income.5 Based on volume-weighted closing price of ON shares in the period.
• By-law minimum payout: 30% of payable net income
• Management commitment: minimum payout of 55% of payable net income
• At least 2 dividends per year
Dividends (based on distributable net income)
Dividend per share3 (R$) Payout4 Dividend Yield5
0.930.76 0.81
1.75 1.90 1.81
0.96 1.02
1.82
2.452.79
1.53
2.47
0.9772%
58% 55%
100% 100% 100%
55% 55%
100% 100% 100%
57%100%2 100%2
2008 2009 2010 2011 2012 2013 2014 2015 2016 2017 2018 20191 2020 6M21
5.7% 5.0% 4.5%8.2% 7.1% 6.3%
3.5% 3.7%6.1%
8.6% 9.2%
3.5%5.7%
2.3%

ENGIE Brasil Energia S.A. Results Presentation 2Q21
08/05/2021
Supporting Data

ENGIE Brasil Energia S.A. Results Presentation 2Q21
08/05/2021
Main Financial and Operational Indexes
Notes:1 Ebitda represents: net income + income tax and social contribution + financial result + depreciation and amortization. 2 ROE: net income of the past 4 quarters/shareholders’ equity.3 ROIC: effective tax rate x EBIT / invested capital (invested capital: debt – cash and cash equivalents – deposits earmarked for debt servicing + SE).4 Adjusted amount, net of gains from hedge operations.5 Total gross electricity output from the plants operated by ENGIE Brasil Energia.6 Disregarding sales for quotas regime (Jaguara and Miranda HPPs).7 Net of taxes and trading operations.
31
Consolidated (In millions of R$) 2Q21 2Q20 Chg. 6M21 6M20 Chg.
Net Operating Revenue (NOR) 3,133 2,687 16.6% 6,383 5,281 20.9%
Results from Operations (EBIT) 1,132 1,199 -5.6% 2,639 2,295 15.0%
Ebitda (1) 1,369 1,432 -4.4% 3,107 2,764 12.4%
Adjusted Ebitda (2) 1,532 1,280 19.7% 3,218 2,612 23.2%
Ebitda / NOR - (%) (1) 43.7 53.3 -9.6 p.p. 48.7 52.3 -3.6 p.p.
Adjusted Ebitda / NOR - (%) (2) 48.9 49.1 -0.2 p.p. 50.4 50.2 0.2 p.p.
Net Income 319 766 -58.4% 848 1,278 -33.6%
Return On Equity (ROE) (3) 29.0 35.5 -6.5 p.p. 29.0 35.5 -6.5 p.p.
Return On Invested Capital (ROIC) (4) 23.4 19.1 4.3 p.p. 23.4 19.1 4.3 p.p.
Net Debt (5) 13,078 10,772 21.4% 13,078 10,772 21.4%
Gross Power Production (avg MW) (6) 3,316 2,190 51.4% 3,955 2,901 36.3%
Energy Sold (avg MW) (7) 4,055 4,073 -0.4% 4,130 4,205 -1.8%
Average Net Sales Price (R$/MWh) (8) 205.35 195.79 4.9% 205.24 193.92 5.8%
Number of Employees - Total 1,598 1,645 -2.9% 1,598 1,645 -2.9%
EBE Employees 1,473 1,575 -6.5% 1,473 1,575 -6.5%
Employees on Under Construction Plants 125 70 78.6% 125 70 78.6%

ENGIE Brasil Energia S.A. Results Presentation 2Q21
08/05/2021
Diversified Portfolio of Assets
32
Notes:1 Considers the physical guarantee revision in effect from January 1, 2018, pursuant to MME Ordinance 178/2017.2 Portion owned by ENGIE Brasil Energia.3 Complex comprised by three power plants.4 Complex comprised by 18 wind farms.5 Complex comprised by 11 wind farms.6 Complex comprised by 11 wind farms, of which 8 in commercial operations as of June 30, 2021. 7 Complex comprised by eight wind farms 8 The transfer of the 40% stake of ENGIE Brasil Part. in Jirau HPP to the Company should be examined timely.
Installed capacity of 8,958.3 MW
(5,100.4 aMW), 4,500 Km of
operating pipelines and ~2,800 Km of
transmission lines under
implementation.
Gas Pipelines Size Compression Stations
26 Transportadora Associada de Gás (TAG) 4,500 Km 11
Hydro Power PlantsInstalled
Capacity (MW)
Commercial
Capacity (aMW)1
1 Salto Santiago 1,420.0 733.3
2 Itá 1,126.92 564.72
3 Salto Osório 1,078.0 502.6
4 Cana Brava 450.0 260.8
5 Estreito 435.62 256.92
6 Jaguara 424.0 341.0
7 Miranda 408.0 198.2
8 Machadinho 403.92 165.32
9 São Salvador 243.2 148.2
10 Passo Fundo 226.0 113.1
11 Ponte de Pedra 176.1 133.6
Total 6,391.7 3,417.7
Thermal Power PlantsInstalled
Capacity (MW)Commercial
Capacity (aMW)
12 Jorge Lacerda Complex3 857.0 649.9
13 Pampa Sul 345.0 323.5
Total 1,202.0 973.4
Complementary P. PlantsInstalled
Capacity (MW)Commercial
Capacity (aMW)
14 Umburanas Complex (Wind)4 360.0 213.3
15 Campo Largo I Complex (Wind)5 326.7 166.5
16 Campo Largo II Complex (Wind)6 247.8 133.7
17 Trairi Complex (Wind)7 212.6 97.2
18 Ferrari (Biomass) 80.5 35.6
19 Assú V (Solar) 30.0 9.2
20 Lages (Biomass) 28.0 13.7
21 Rondonópolis (SHP) 26.6 14.0
22 José G. da Rocha (SHP) 24.4 11.9
23 Ibitiúva (Biomass) 22.92 13.62
24 Nova Aurora (Solar) 3.0 0.3
25 Tubarão (Wind) 2.1 0.3
Total 1,364.6 709.3
GenerationInstalled Capacity
(MW)Commercial Capacity
(aMW)
27 Jirau (Hydro)8 1,500.0 884.6
28 Santo Agostinho I Complex (Wind) 434.0 218.0
29 Paracatu and Floresta Complex (Solar) 259.8 59.1
30 Campo Largo II Complex (Wind) 113.4 58.8
Total 2,307.2 1,220.5
Transmission Size Substations
31 Gralha Azul ~ 1,000 km 5
32 Novo Estado ~ 1,800 km1 new and expansion of
3 existing
Total ~ 2,800 km
Expansion
Legenda
TermelétricaHidrelétrica
ComplementarEm Construção
Key
ThermalHydro
ComplementaryExpansionTransmissionTAG
1
2
3
810
1220
9
5
11
2221
23
17
24
18
30
25
27
4
67
1514
19
26
26
13
32
32
31
28
16
29
29

ENGIE Brasil Energia S.A. Results Presentation 2Q21
08/05/2021
Transportadora Associada de Gás – TAG
33
Contracts breakdown and indebtedness
High level of contracted volume in the regulated market, for an average term of approximately 10 years.
Financing structure with competitive cost and protected from exchange variation - Rating AAA by Fitch Ratings.
Gas
Pipelines
Approx.
size
(km)
Agreement
Maturity1
Termination
of
Authorization
Contracted
Volumes
(MM m³/day)
% of the Net
Operating
Revenue2
Readjustment
index
Gasene 1,400 Nov-2033 Mar-2039 30.3 37.8% IGPM/CPI/FX
Malha NE 2,000 Dez-2025 Mar-2039 21.6 22.4% IGPM
Pilar-Ipojuca 200 Nov-2031 Nov-2041 15.0 5.9% IGPM
Urucu-Coari-
Manaus800 Nov-2030 Nov-2040 6.7 33.9% IGPM/IPCA
Lagoa Parda
Vitória100 Under negotiation - IGPM
Total ~4,500 73.6 100.0%
Notes: 1 Following the expiry of the agreements, a five-year tariff revision cycle will be triggered, which will decide the
revised maximum permitted revenue flow (RAP).2 Variations in revenue representativeness between GTAs may occur.
Debt profile – TAG
as of June 30, 2021
Domestic market: ~CDI + 1.80% p.y., with semi-annual amortizations
and maturing in June 2026.
Foreign market2: Libor + initial spread of 2.3%, with semi-annual
amortizations and maturing June 2027.
Contracts breakdown
Foreign market
Domestic market
R$ 10.9 billion1
R$ 12.4 billion1
Notes: 1 The presented values do not consider the debt swaps.2 The portion of the debt denominated in foreign currency was converter by Ptax of R$ 5.0022 as of
June 30, 2021 and is linked to US Dollar sales under part of the Gasene agreement, thus being a
symmetry between revenue and debt servicing.

ENGIE Brasil Energia S.A. Results Presentation 2Q21
08/05/2021
Energy Balance as of June 30, 2021
2 XXXX-YY-WWWW-ZZ, where:
XXXX -> year of auction
YY -> EE = existing energy or NE = new energy
WWWW -> year of delivery start
ZZ -> supply contract duration (in years)
1 Average term weighted by the amount of energy sold, including trading operations.3 Sales price, including trading operations, net of ICMS and taxes over revenue (PIS/Cofins, R&D), i.e. future inflation is not being considered.4 Disregarding sales for quotas regime (Jaguara and Miranda HPPs).5 Purchase net price, considering trading operations and benefits from PIS/Cofins credits, i.e. future inflation is not being considered.
Notes: - The balance refers to the settlement point (net of losses and internal consumption of the plants).- The average prices are considered simply estimates and are based on financial planning revisions, not capturing volume changes, which are updated quarterly.
Diversified contracting with duration of about 16 years in ACR and 4 years in ACL1
34
(in average MW) 2021 2022 2023 2024 2025 2026
Own Resources 4,821 4,899 5,061 5,117 5,113 5,111 Auction Reference Gross Price Net Price of
+ Purchases for Resale 1,085 829 587 413 353 307 Gross Price Date Adjusted PIS/COFINS/P&D
= Total Resources (A) 5,906 5,728 5,648 5,530 5,466 5,418 (R$/MWh) (R$/MWh) (R$/MWh)
Government Auction Sales2
2,012 2,012 2,012 2,007 1,994 1,984
2005-NE-2010-30 200 200 200 200 200 200 115.1 Dec-05 249.4 224.1
2006-NE-2009-30 493 493 493 493 493 493 128.4 Jun-06 274.1 246.3
2006-NE-2011-30 148 148 148 148 148 148 135.0 Nov-06 286.0 256.9
2007-NE-2012-30 256 256 256 256 256 256 126.6 Oct-07 257.8 231.6
Proinfa 19 19 19 19 19 19 147.8 Jun-04 418.4 403.1
1st Reserve Energy Auction 14 14 14 14 2 - 158.1 Aug-08 311.5 300.1
Auction Mix (New Energy / Reserve / DG) 14 14 14 9 8 - - - 301.0 290.0
2014-NE-2019-25 295 295 295 295 295 295 183.5 Mar-14 270.0 242.6
2014-NE-2019-25 10 10 10 10 10 10 206.2 Nov-14 283.8 273.4
2014-NE-2019-20 82 82 82 82 82 82 139.3 Nov-14 192.3 174.5
2015-NE-2018-20 46 46 46 46 46 46 188.5 Aug-15 241.1 218.8
8th Reserve Energy Auction 9 9 9 9 9 9 303.0 Nov-15 370.2 336.0
2014-EN-2019-20 48 48 48 48 48 48 136.4 Nov-14 220.5 200.1
Government Auction - Quotas regime
2018 - Quotas (UHJA) - 2018-30 239 239 239 239 239 239 - Jul-17 153.4 146.3
2018 - Quotas (UHMI) - 2018-30 139 139 139 139 139 139 - Jul-17 174.0 166.0
+ Bilateral Sales 3,181 2,953 2,500 1,982 1,413 932
= Total Sales (B) 5,193 4,965 4,512 3,989 3,407 2,916
Balance (A - B) 713 763 1,136 1,541 2,059 2,502
Sales Average Price (R$/MWh) (net)3,4: 202.3 206.9 204.1
Purchases Average Price (R$/MWh) (net)5: 190.5 184.4 168.3

ENGIE Brasil Energia S.A. Results Presentation 2Q21
08/05/2021
Headcount1
2Q21
45%
31%31%
45%
29%
2Q20
41%
28%
26%
1,5751,473
17%
34%
48%
1%
12%
1,085
388
Operations
53%
47%
Administrative
88%
Note:1 Does not consider employees posted to projects under construction.
79%
21%
35%
39%
15%
8% 3%
Administrative
Renewables
Thermal
Less than 25
35 to 44
25 to 34
45 to 54
More than 55 Primary School
High School
University-educated
Post-Graduate
Female
Male
Number of employees By gender
By age group By academic qualifications
35

ENGIE Brasil Energia S.A. Results Presentation 2Q21
08/05/2021
Sustainability KPIs1
Notes:1 Additional indices are available at Sustainability Report
(www.engie.com.br/investors/financial-information).2 Reference: ENGIE Sustainable Management Policy.3 The Health and Safety indicators underwent a methodologicalchange at the beginning of 2021, which is why there are nocomparisons with previous periods.4 GRI: Global Reporting Initiative, Standards version and sectorsupplement version G4.5 FR = number of occupational accidents for every million hours of
exposure to hazards.6 SR = number of days lost due to occupational accidents for every
one thousand hours of exposure to hazards.7 Amounts in thousand of reais (R$).
36
Item Dimension2 Index Material themes GRI disclosure4 2Q21 2Q20 Change 6M21 6M20 Change
1 Operating plants 102-7, EU1 68 60 8 68 60 8
2 Installed capacity 102-7, EU1 10,679 10,431 2.4% 10,679 10,431 2.4%
3 Proprietary capacity 102-7, EU1 8,958 8,710 2.8% 8,958 8,710 2.8%
4 Number of certified plants 102-16, EU6 12 12 0 12 12 0
5 Certified installed capacity (MW) 102-16, EU6 8,127 8,127 0.0% 8,127 8,127 0.0%
6 Certified installed capacity in relation to the total 102-16, EU6 76.1% 77.9% -1.8 p.p. 76.1% 77.9% -1.8 p.p.
7 Installed capacity from renewable sources 102-7, EU1 9,477 9,229 2.7% 9,477 9,229 2.7%
8 Installed capacity from renewable sources in relation to the total 102-7, EU1 88.7% 88.5% 0.3 p.p. 88.7% 88.5% 0.3 p.p.
9 Energy generation (GWh) EU2 7,242 4,784 51.4% 17,179 12,669 35.6%
10 Certified energy generation 102-16, EU6 4,672 2,813 66.1% 12,703 8,879 43.1%
11 Certified energy generation in relation to the total 102-16, EU6 64.5% 58.8% 5.7 p.p. 73.9% 70.1% 3.9 p.p.
12 Energy generation from renewable sources (GWh) EU2 5,776 3,892 48.4% 14,006 10,284 36.2%
13 Energy generation from renewable sources in relation to the total EU2 79.8% 81.4% -1.6 p.p. 81.5% 81.2% 0.4 p.p.
14 Uptime ratio, excluding scheduled stoppages EU30 97.3% 96.7% 0.6 p.p. 96.2% 96.8% -0.6 p.p.
15 Uptime ratio, including scheduled stoppages EU30 87.7% 91.8% -4.0 p.p. 88.7% 91.4% -2.7 p.p.
16Saplings donated and planted (sum-total of planted and
donated saplings)304-2, 413-1 65,954 3,917 1583.8% 166,169 27,746 498.9%
17 Number of visitors at the plants and environmental education 413-1 13,891 340 3985.6% 35,018 3,113 1024.9%
18 CO2 Emissions (fossil fuel plants) (t/MWh) D305-1, D305-2, D305-3 1.080 0.920 17.4% 1.090 0.935 16.5%
19CO2 Emissions from ENGIE Brasil Energia's generation
complex(t/MWh)D305-1, D305-2, D305-3 0.200 0.171 16.7% 0.180 0.176 2.2%
20 Frequency Rate (FR) operation and maintenance 5 403-2 0.423 0.000 0.262 0.851
21 Severity Rate (SR)) own employees6 403-2 0.000 0.000 - 0.000 0.000 -
22 Frequency Rate (FR) construction5 403-2 0.966 0.425 0.859 0.257
23 Managerial Safety Visits - VGS 403-2 426 257 Not applic 890 458 Not applic
24 Registry of Risky and Near Accident Situation 403-2 1,561 808 Not applic 2,989 1,825 Not applic
25 Non-incentivized investments 203-2, 413-1 2,010.4 2,593.8 -22.5% 3,635.7 3,090.5 17.6%
26 Investments through the Infancy and Adolescence Fund (FIA) 203-2, 413-1 245.0 0.0 - 584.2 596.4 -2.0%
27 Investments through the Culture Incentive Law (Rouanet) 203-2, 413-1 1,426.0 318.0 348.4% 2,236.8 2,525.4 -11.4%
28 Investments through the Sport Incentive Law 203-2, 413-1 265.1 0.0 - 412.2 184.0 124.0%
29Investments through National Program of Support to Oncology
Care (Pronon)203-2, 413-1 0.0 0.0 - 0.0 0.0 -
30Investments through the National Care Support Program for
People with Special Needs (Pronas/PCD)203-2, 413-1 0.0 0.0 - 0.0 0.0 -
31 Investments through the Municipal Fund for the Elderly 203-2, 413-1 30.0 0.0 - 30.0 300.8 -90.0%
Quality
Environment
and climate
change
Occupatio-
nal Heath
and Safety
(OH&S)3
Social
Responsibi-
lity7
- Prioritization of
renewable sources for
energy generation
- Emissions
Management
- Emissions
Management
- Boost of prosperity on
local communities
- Biodiversity
- Teams and community
safety
- Foster good social
and environmental
practices between
suppliers and customers.
- Generation of
economic result and
value sharing with
society
- Boost of prosperity on
local communities
ENGIE Brasil Energia S.A. Results Presentation 2Q21
08/05/2021
Contacts
Eduardo SattaminiChief Executive and Investor Relations Officer
Investor Relations Team:
Rafael BósioInvestor Relations Manager
(48) 3221 7225
Adriana Wagner Caio Miralles
Investor Relations Analyst Sustainability Analyst
[email protected] [email protected]
Ivani Angeli Mariana Puricelli
Investor Relations Analyst Investor Relations Analyst
[email protected] [email protected]
www.engie.com.br/investidores
37