Embed Size (px)
Citation preview
EducationNRMwater food air waste transport purchasingbiodiversityclimate change
Engaging with Nature
Freshwater Water Quality MonitoringTeacher Information Pack
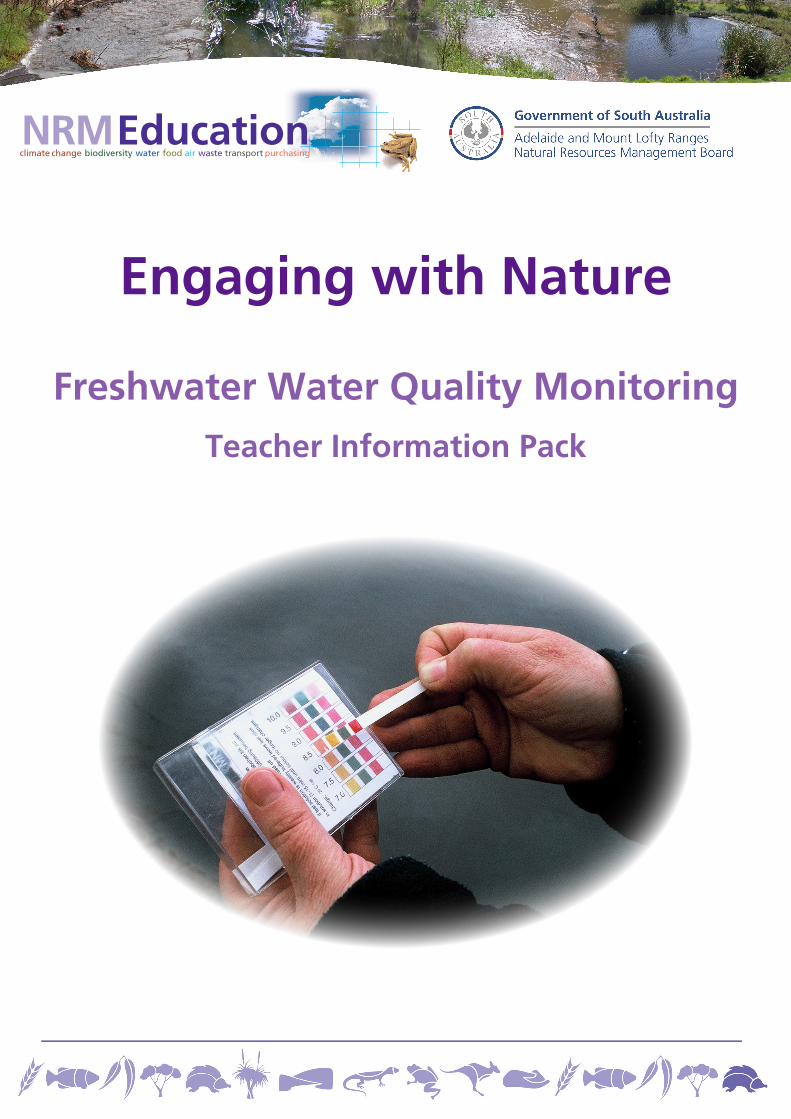
Water quality monitoring teaching notesIntroductory Lessons
To provide students with a focus for involvement in the water quality monitoring program, we suggest teachers conduct introductory lessons prior to water testing. The following questions provide a general starting point. These may be explored through teacher instruction, group discussions or a visit to our website.
Monitoring site• Where does your group monitor water quality? Use street directory / GoogleEarth /
map.• What is the name of the river, creek or wetland and which catchment area is it in?• What is your site code? (e.g. BRO030)• List the plants and animals that might live at the site. (follow up at each visit)
Could your waterway have pollution problems?Consider land uses in the area and types of stormwater pollution that may enter the waterway.
How can we tell if the waterway is polluted or healthy? Students divide a page in half and draw what might be seen at healthy and polluted sites. Then list some things we can’t see. (eg: Healthy = hear frogs or birds, safe for drinking, see fish. Polluted = rotting rubbish, smelly, high salinity, no animals)
Monitoring• Draw a pH scale. What is a healthy pH range in freshwater?• What is salinity? How does salinity differ in freshwater and seawater?• What can cause an increase in freshwater salinity levels?• What is turbidity? Name things that can make water more turbid.• Why is high turbidity a problem to plants, fish and other water creatures?
Why is monitoring the health of our waterways important?Students work in pairs to answer the above question:
Answers may include:• By monitoring regularly, you can determine if the health of your waterway is improving, declining or
staying the same.• You are the ‘watchdogs’ of our waterways, often being the first to notice and report pollution incidents.• You are spokespeople for the frogs, fish, birds and bugs that live at your site.• As a result of regular monitoring, groups can initiate many positive actions to improve the quality of their
waterways, by fencing areas of riverbanks, re-vegetation and the eradication of weeds, and by letting people know about pollution and other environmental issues.
Scientific MethodologyIntroduce the water monitoring program as a scientific means of investigating the health of our waterways, through observation, experiment and recording. Use ‘Water Testing Explained’ to outline water sampling and the parameters: Salinity, pH & Turbidity.
HEALTHY POLLUTEDWhat you can see
What you can’t see
Our loan library has many resources to support an inquiry into water quality.
See https://www.naturalresources.sa.gov.au/adelaidemtloftyranges/education/for-
educators/loan-library for more information
Collecting a water sampleThe collection of a high quality water sample is the first and most important step in your water testing.
A good quality sample will be representative of the waterway being tested, and will help provide you with an accurate set of results.
Instructions • Make sure you collect your water sample from exactly the same location and in the same way each time you test the water.
• Your water sample should be collected from as close to the centre of the water body as practical, to ensure a representative sample.
• If you are using a bucket or bottle for collection, rinse it out THREE TIMES with the water to be tested. This will remove any contamination from the container.
• If collecting your water sample whilst standing in the river, always take your sample UPSTREAM from where you are standing.
• If you are standing on the bank, do not disturb the bottom of the waterway when collecting your sample, as this may affect turbidity and salinity results.
• When collecting your sample, submerge your container BENEATH the water surface if possible. Try not to collect surface water.
Handy Hints
If you cannot safely reach the water from the bank, use a bucket attached to a rope or a sampling pole with a
bottle to obtain your water sample.
TemperatureThe temperature of a waterbody directly affects many physical, biological and chemical characteristics. Warm waters are more susceptible to a build-up of nutrients and possible algal blooms because photosynthesis and bacterial decomposition both work faster at higher temperatures. Oxygen is less soluble in warmer water and this can affect aquatic life. By contrast, salts are more soluble in warmer water, so temperature can affect the water’s salinity.
Temperature directly affects the metabolic rate of plants and animals. Aquatic species have evolved to live in water of specific temperatures. If the water becomes colder or warmer, the organisms do not function as effectively and become more susceptible to toxic wastes, parasites and diseases. With extreme temperature change, many organisms will die.
InstructionsRecord air temperature using your thermometer or EC Meter; wait one minute, until the reading stabilises and record the temperature to the nearest 0.5°C. If using a thermometer, ensure that you take the reading as close as possible to eye level.
Step 1 Place the thermometer a few centimetres into the waterway or immediately into the water sample as soon as it has been collected. If possible, take the temperature directly in the water. Measuring the temperature of a water sample in a bucket or jar is not quite as good.
Step 2 Wait one minute, until the reading stabilises.
Step 3 Record the temperature to the nearest 0.5°C while the thermometer bulb or temperature probe is still immersed in the water.
Step 4 Repeat steps 1-3 at least once. If the results vary significantly, take up to 10 measurements and average.
Step 5 Record your results on the water quality data sheet.
Step 6 Observe trends in temperature variation over the seasons and note any temperature that is unusually high or low.
Handy Hints
Your EC meter also records temperature - you may need to press the MODE button to switch between EC and temperature.
Record the air temperature BEFORE you record the water temperature.
Water Testing Explained
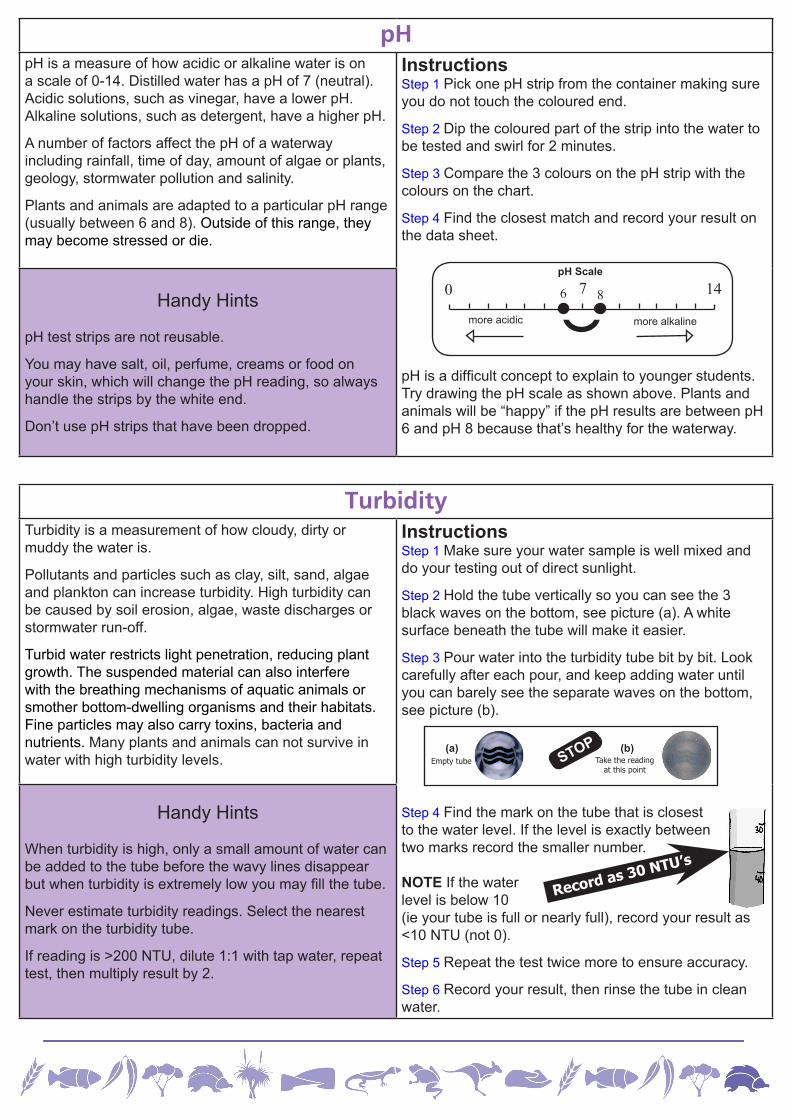
pHpH is a measure of how acidic or alkaline water is on a scale of 0-14. Distilled water has a pH of 7 (neutral). Acidic solutions, such as vinegar, have a lower pH. Alkaline solutions, such as detergent, have a higher pH.
A number of factors affect the pH of a waterway including rainfall, time of day, amount of algae or plants, geology, stormwater pollution and salinity.
Plants and animals are adapted to a particular pH range (usually between 6 and 8). Outside of this range, they may become stressed or die.
InstructionsStep 1 Pick one pH strip from the container making sure you do not touch the coloured end.
Step 2 Dip the coloured part of the strip into the water to be tested and swirl for 2 minutes.
Step 3 Compare the 3 colours on the pH strip with the colours on the chart.
Step 4 Find the closest match and record your result on the data sheet.
pH is a difficult concept to explain to younger students. Try drawing the pH scale as shown above. Plants and animals will be “happy” if the pH results are between pH 6 and pH 8 because that’s healthy for the waterway.
Handy Hints
pH test strips are not reusable.
You may have salt, oil, perfume, creams or food on your skin, which will change the pH reading, so always handle the strips by the white end.
Don’t use pH strips that have been dropped.
TurbidityTurbidity is a measurement of how cloudy, dirty or muddy the water is.
Pollutants and particles such as clay, silt, sand, algae and plankton can increase turbidity. High turbidity can be caused by soil erosion, algae, waste discharges or stormwater run-off.
Turbid water restricts light penetration, reducing plant growth. The suspended material can also interfere with the breathing mechanisms of aquatic animals or smother bottom-dwelling organisms and their habitats. Fine particles may also carry toxins, bacteria and nutrients. Many plants and animals can not survive in water with high turbidity levels.
Instructions Step 1 Make sure your water sample is well mixed and do your testing out of direct sunlight.
Step 2 Hold the tube vertically so you can see the 3 black waves on the bottom, see picture (a). A white surface beneath the tube will make it easier.
Step 3 Pour water into the turbidity tube bit by bit. Look carefully after each pour, and keep adding water until you can barely see the separate waves on the bottom, see picture (b).
Step 4 Find the mark on the tube that is closestto the water level. If the level is exactly betweentwo marks record the smaller number.
NOTE If the waterlevel is below 10(ie your tube is full or nearly full), record your result as <10 NTU (not 0).
Step 5 Repeat the test twice more to ensure accuracy.
Step 6 Record your result, then rinse the tube in clean water.
Handy Hints
When turbidity is high, only a small amount of water can be added to the tube before the wavy lines disappear but when turbidity is extremely low you may fill the tube.
Never estimate turbidity readings. Select the nearest mark on the turbidity tube.
If reading is >200 NTU, dilute 1:1 with tap water, repeat test, then multiply result by 2.
0 76 8
more acidic more alkaline
pH Scale
14
Take the reading at this point
Empty tube(a) (b)
STOP
Record as 30 NTU’s
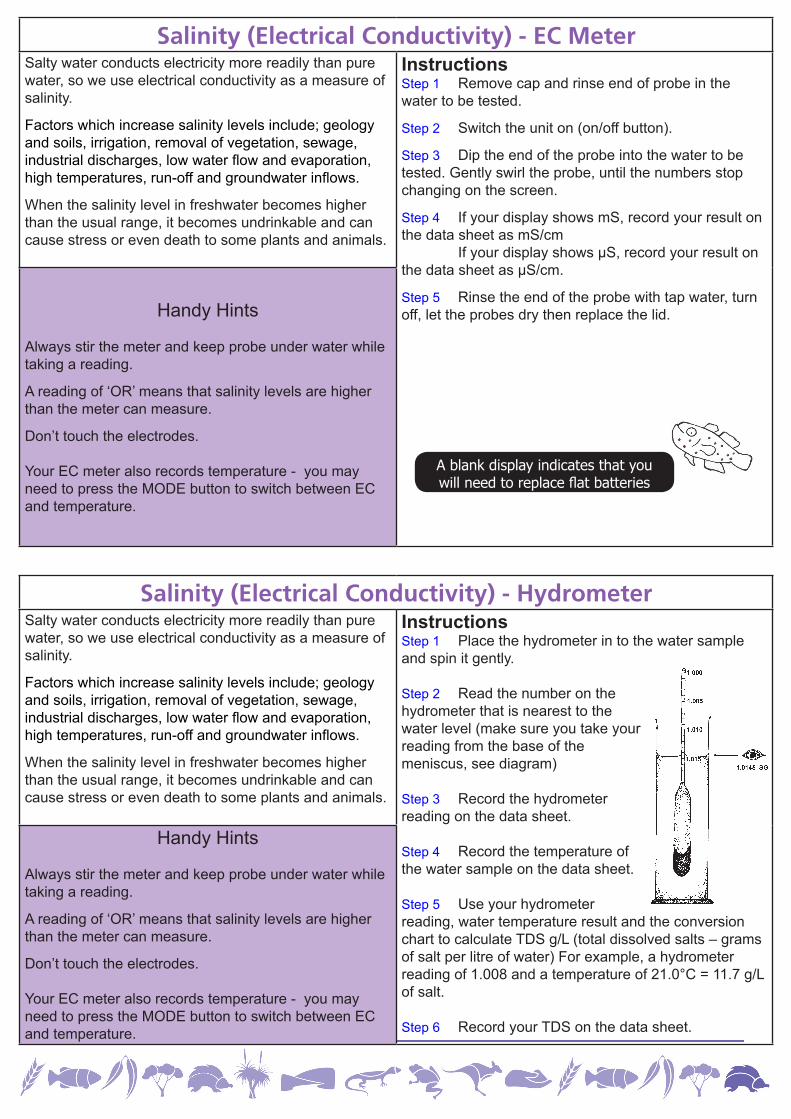
Salinity (Electrical Conductivity) - EC MeterSalty water conducts electricity more readily than pure water, so we use electrical conductivity as a measure of salinity.
Factors which increase salinity levels include; geology and soils, irrigation, removal of vegetation, sewage, industrial discharges, low water flow and evaporation, high temperatures, run-off and groundwater inflows.
When the salinity level in freshwater becomes higher than the usual range, it becomes undrinkable and can cause stress or even death to some plants and animals.
InstructionsStep 1 Remove cap and rinse end of probe in the water to be tested.
Step 2 Switch the unit on (on/off button).
Step 3 Dip the end of the probe into the water to be tested. Gently swirl the probe, until the numbers stop changing on the screen.
Step 4 If your display shows mS, record your result on the data sheet as mS/cm If your display shows μS, record your result on the data sheet as μS/cm.
Step 5 Rinse the end of the probe with tap water, turn off, let the probes dry then replace the lid.Handy Hints
Always stir the meter and keep probe under water while taking a reading.
A reading of ‘OR’ means that salinity levels are higher than the meter can measure.
Don’t touch the electrodes.
Your EC meter also records temperature - you may need to press the MODE button to switch between EC and temperature.
Salinity (Electrical Conductivity) - HydrometerSalty water conducts electricity more readily than pure water, so we use electrical conductivity as a measure of salinity.
Factors which increase salinity levels include; geology and soils, irrigation, removal of vegetation, sewage, industrial discharges, low water flow and evaporation, high temperatures, run-off and groundwater inflows.
When the salinity level in freshwater becomes higher than the usual range, it becomes undrinkable and can cause stress or even death to some plants and animals.
InstructionsStep 1 Place the hydrometer in to the water sample and spin it gently.
Step 2 Read the number on thehydrometer that is nearest to thewater level (make sure you take yourreading from the base of themeniscus, see diagram)
Step 3 Record the hydrometerreading on the data sheet.
Step 4 Record the temperature ofthe water sample on the data sheet.
Step 5 Use your hydrometerreading, water temperature result and the conversion chart to calculate TDS g/L (total dissolved salts – grams of salt per litre of water) For example, a hydrometer reading of 1.008 and a temperature of 21.0°C = 11.7 g/L of salt.
Step 6 Record your TDS on the data sheet.
Handy Hints
Always stir the meter and keep probe under water while taking a reading.
A reading of ‘OR’ means that salinity levels are higher than the meter can measure.
Don’t touch the electrodes.
Your EC meter also records temperature - you may need to press the MODE button to switch between EC and temperature.
A blank display indicates that you will need to replace flat batteries
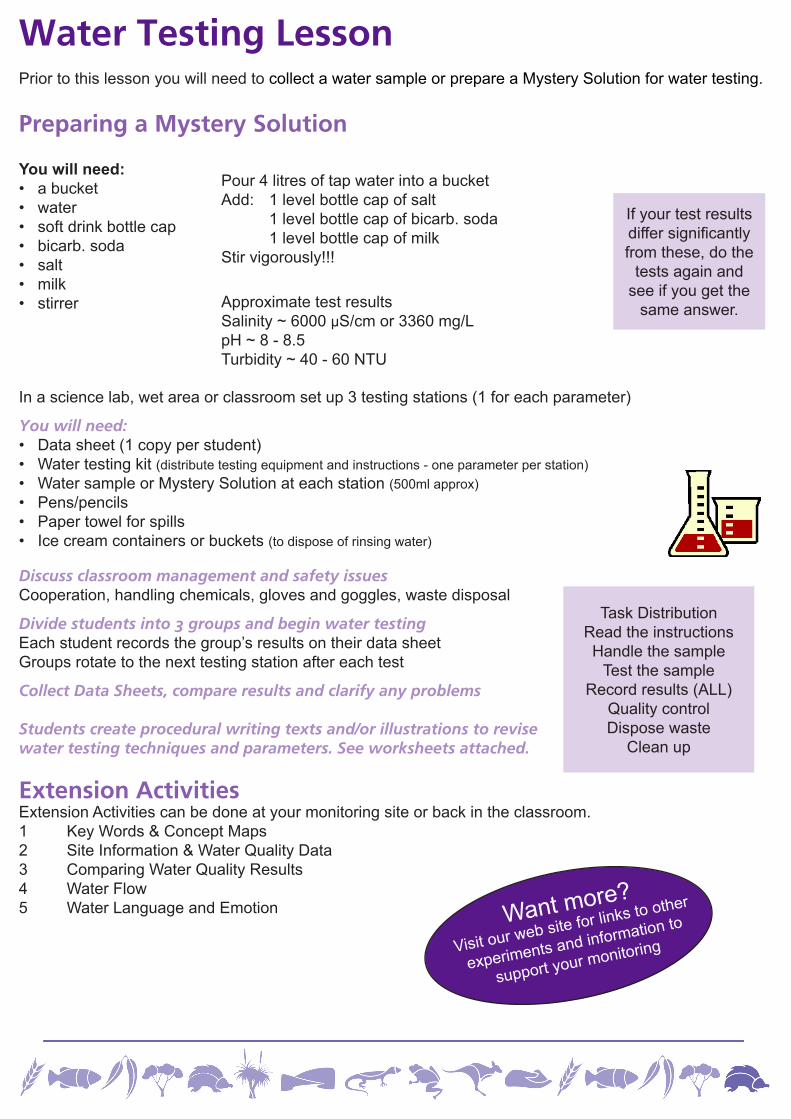
In a science lab, wet area or classroom set up 3 testing stations (1 for each parameter)
You will need:• Data sheet (1 copy per student)• Water testing kit (distribute testing equipment and instructions - one parameter per station) • Water sample or Mystery Solution at each station (500ml approx) • Pens/pencils• Paper towel for spills• Ice cream containers or buckets (to dispose of rinsing water)
Discuss classroom management and safety issuesCooperation, handling chemicals, gloves and goggles, waste disposal
Divide students into 3 groups and begin water testingEach student records the group’s results on their data sheetGroups rotate to the next testing station after each test
Collect Data Sheets, compare results and clarify any problems
Students create procedural writing texts and/or illustrations to revise water testing techniques and parameters. See worksheets attached.
Extension ActivitiesExtension Activities can be done at your monitoring site or back in the classroom.1 Key Words & Concept Maps2 Site Information & Water Quality Data3 Comparing Water Quality Results4 Water Flow5 Water Language and Emotion
Water Testing LessonPrior to this lesson you will need to collect a water sample or prepare a Mystery Solution for water testing.
Preparing a Mystery Solution
Pour 4 litres of tap water into a bucketAdd: 1 level bottle cap of salt 1 level bottle cap of bicarb. soda 1 level bottle cap of milkStir vigorously!!!
You will need:• a bucket• water• soft drink bottle cap• bicarb. soda• salt• milk• stirrer Approximate test results
Salinity ~ 6000 μS/cm or 3360 mg/L pH ~ 8 - 8.5Turbidity ~ 40 - 60 NTU
If your test results differ significantly from these, do the
tests again and see if you get the
same answer.
Task DistributionRead the instructionsHandle the sample
Test the sampleRecord results (ALL)
Quality controlDispose waste
Clean up
Want more?
Visit our web site for links to other
experiments and information to
support your monitoring
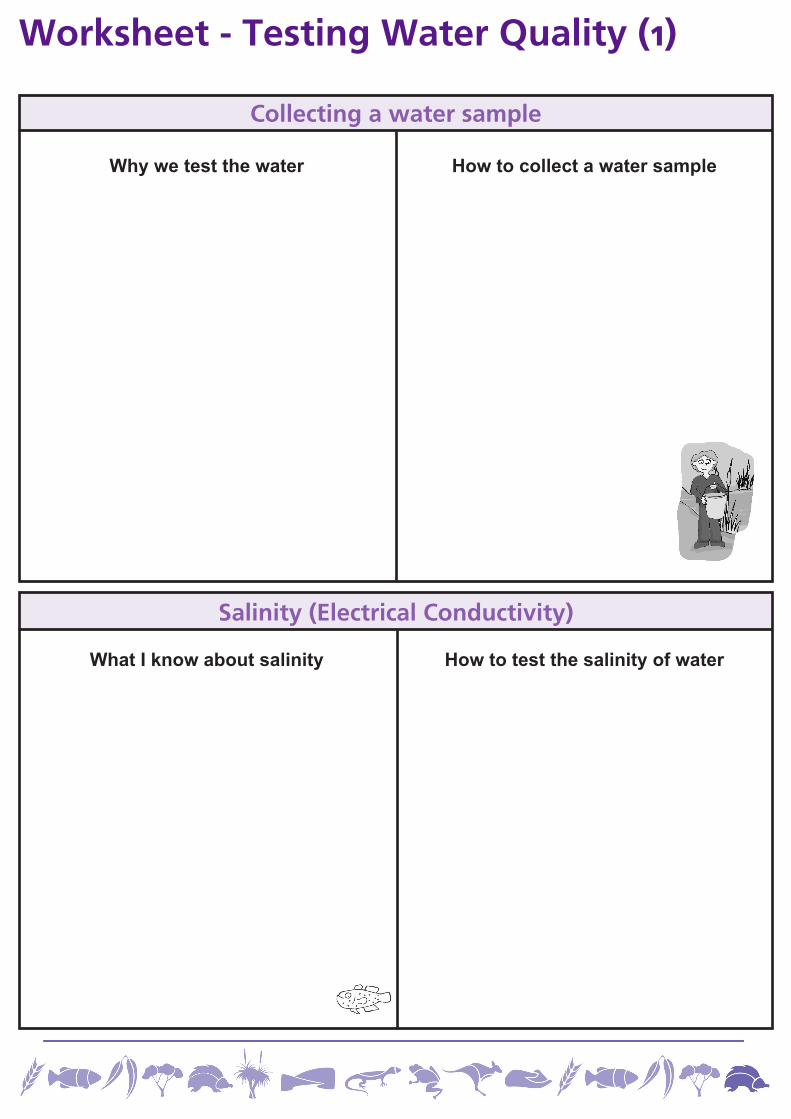
Salinity (Electrical Conductivity)
Collecting a water sample
Worksheet - Testing Water Quality (1)
How to test the salinity of waterWhat I know about salinity
How to collect a water sampleWhy we test the water
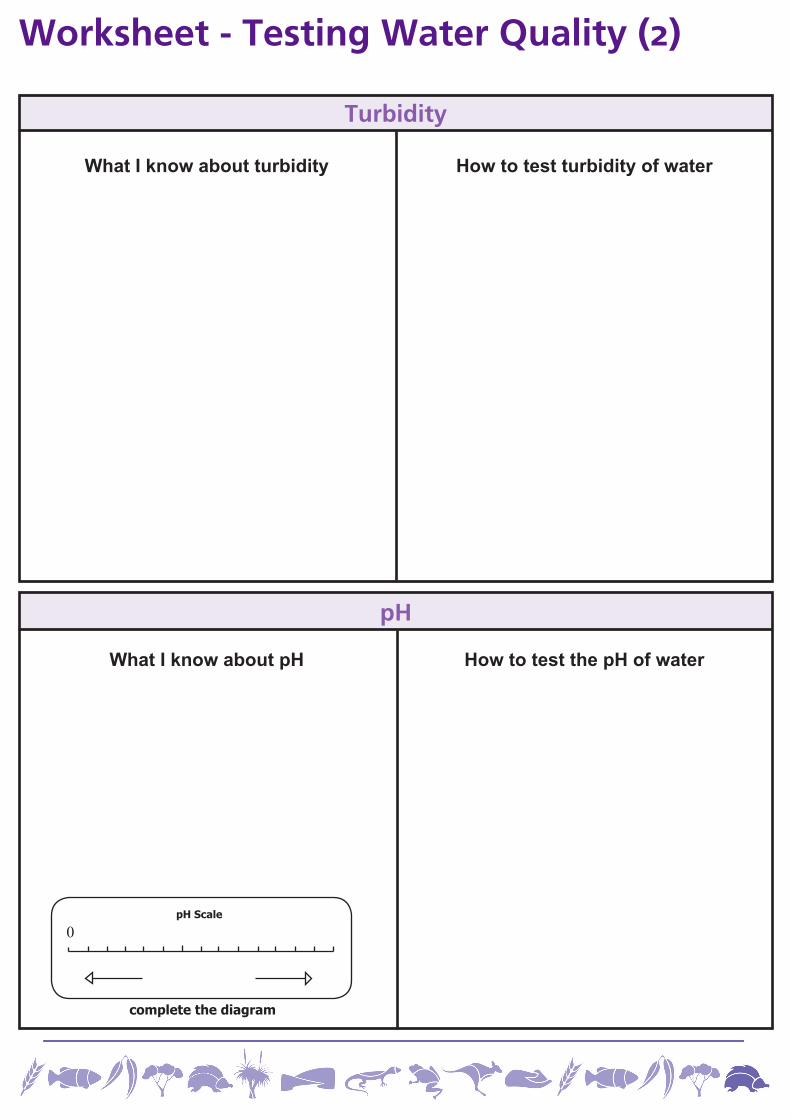
pH
Turbidity
Worksheet - Testing Water Quality (2)
How to test the pH of waterWhat I know about pH
How to test turbidity of waterWhat I know about turbidity
complete the diagram
0pH Scale
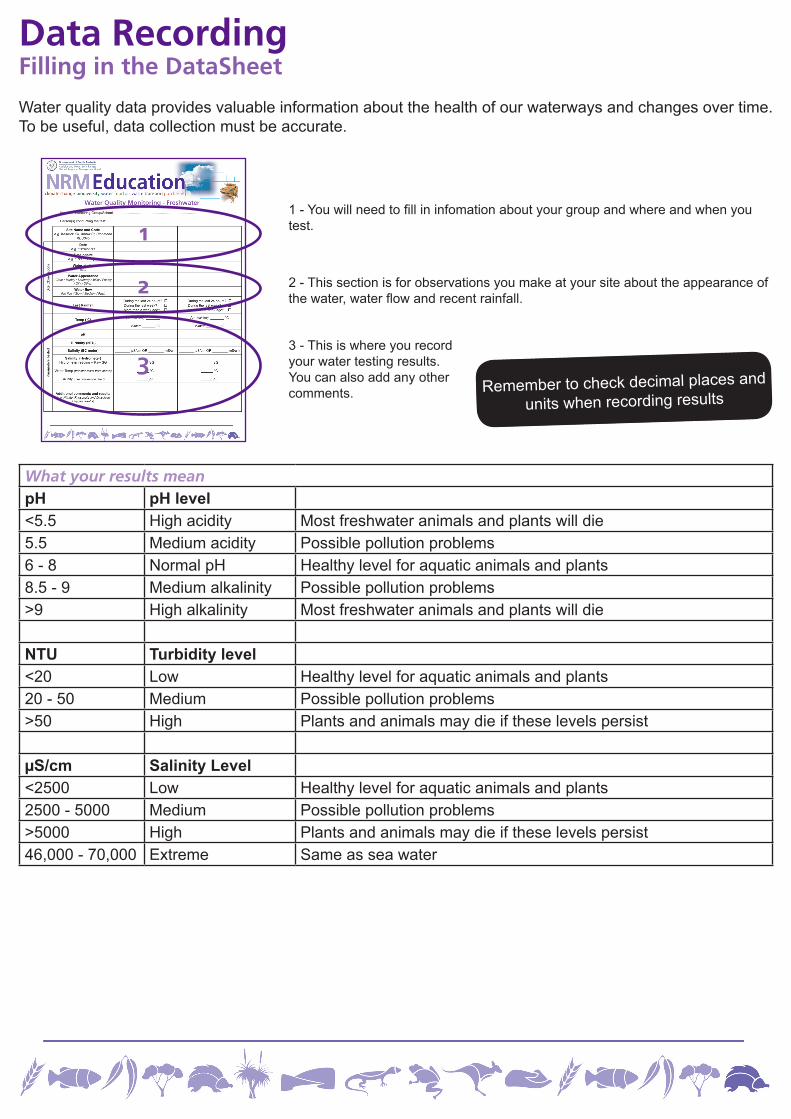
What your results meanpH pH level<5.5 High acidity Most freshwater animals and plants will die5.5 Medium acidity Possible pollution problems6 - 8 Normal pH Healthy level for aquatic animals and plants8.5 - 9 Medium alkalinity Possible pollution problems>9 High alkalinity Most freshwater animals and plants will die
NTU Turbidity level<20 Low Healthy level for aquatic animals and plants20 - 50 Medium Possible pollution problems>50 High Plants and animals may die if these levels persist
µS/cm Salinity Level<2500 Low Healthy level for aquatic animals and plants2500 - 5000 Medium Possible pollution problems>5000 High Plants and animals may die if these levels persist46,000 - 70,000 Extreme Same as sea water
Data RecordingFilling in the DataSheet
Water quality data provides valuable information about the health of our waterways and changes over time. To be useful, data collection must be accurate.
2 - This section is for observations you make at your site about the appearance of the water, water flow and recent rainfall.
3 - This is where you record your water testing results. You can also add any other comments.
1 - You will need to fill in infomation about your group and where and when you test.
Remember to check decimal places and units when recording results
1
2
3
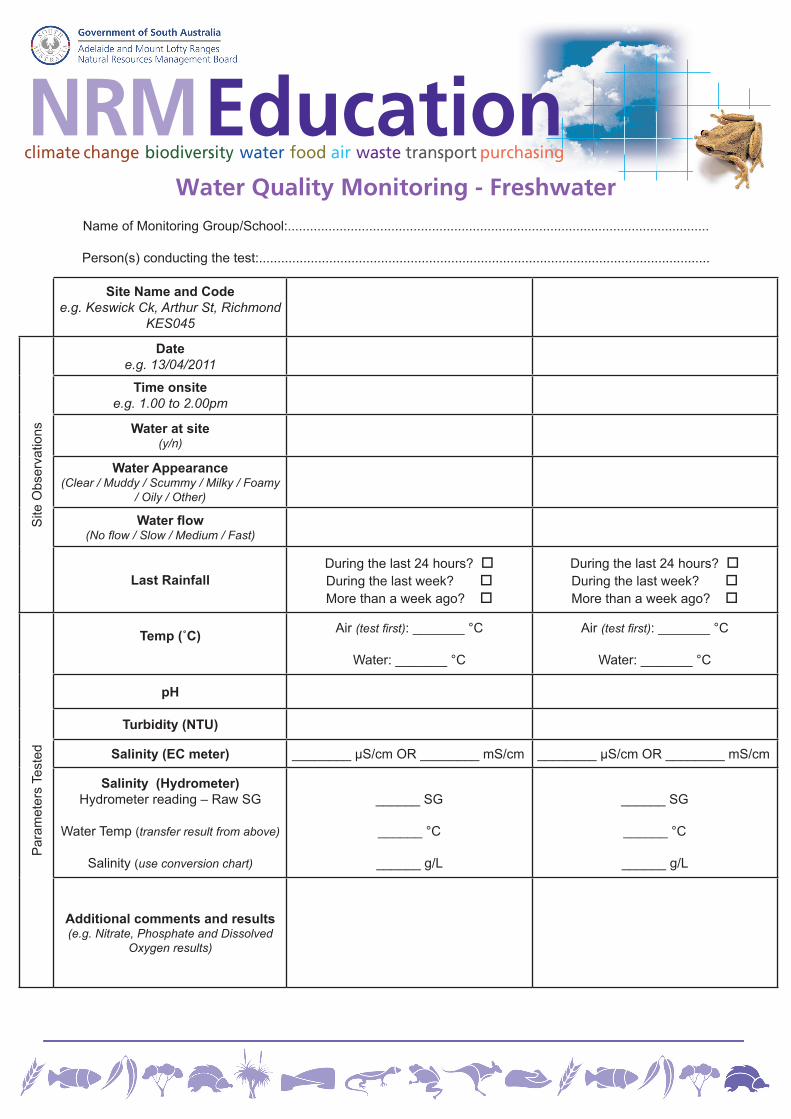
EducationNRMwater food air waste transport purchasingbiodiversityclimate change
Water Quality Monitoring - FreshwaterName of Monitoring Group/School:..................................................................................................................
Person(s) conducting the test:..........................................................................................................................
Site Name and Codee.g. Keswick Ck, Arthur St, Richmond
KES045
Site
Obs
erva
tions
Datee.g. 13/04/2011
Time onsitee.g. 1.00 to 2.00pm
Water at site(y/n)
Water Appearance(Clear / Muddy / Scummy / Milky / Foamy
/ Oily / Other)
Water flow(No flow / Slow / Medium / Fast)
Last RainfallDuring the last 24 hours? During the last week? More than a week ago?
During the last 24 hours? During the last week? More than a week ago?
Par
amet
ers
Test
ed
Temp (˚C) Air (test first): _______ °C
Water: _______ °C
Air (test first): _______ °C
Water: _______ °C
pH
Turbidity (NTU)
Salinity (EC meter) ________ μS/cm OR ________ mS/cm ________ μS/cm OR ________ mS/cm
Salinity (Hydrometer)Hydrometer reading – Raw SG
Water Temp (transfer result from above)
Salinity (use conversion chart)
______ SG
______ °C
______ g/L
______ SG
______ °C
______ g/L
Additional comments and results(e.g. Nitrate, Phosphate and Dissolved
Oxygen results)
Extension Activities 1Key Words & Concept Maps
turbiditysalinity
pHdatamap
pollution
catchment areawater qualitystormwater
drainswaste water
litterprevention
monitoringsite
metersample
chemicalbiological
habitat
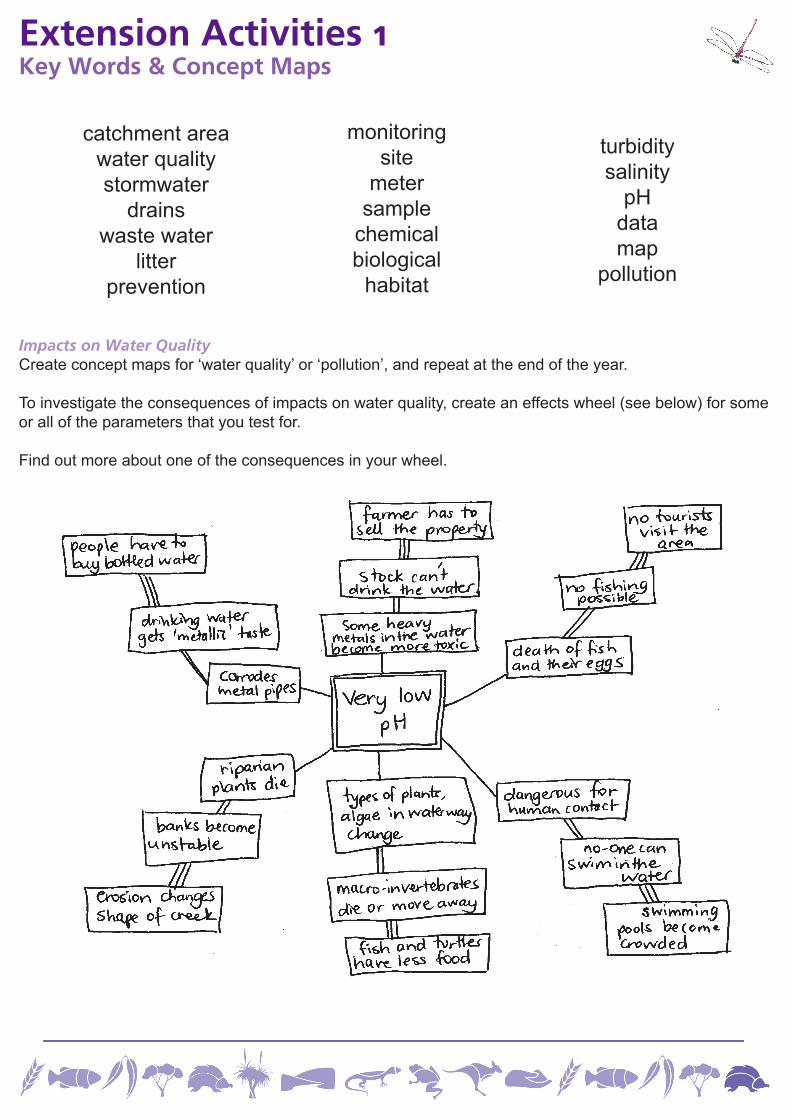
Impacts on Water QualityCreate concept maps for ‘water quality’ or ‘pollution’, and repeat at the end of the year.
To investigate the consequences of impacts on water quality, create an effects wheel (see below) for some or all of the parameters that you test for.
Find out more about one of the consequences in your wheel.
Extension Activities 2Site Information & Water Quality Data
Educate the wider community and raise awareness of water issues by sharing information about your monitoring site and water quality data:• Create a permanent display in your school, write articles for your newsletter or include water quality
information on the school’s website.• Consider submitting articles to the press or setting up a display in the local library.
Site InformationUse photographs, drawings, maps and written descriptions to describe your site and how to get there.• Explain where the water at the site has come from and where it travels to.• Describe the importance of your site in terms of ecosystems. Include features such as; fauna,
surrounding vegetation, rocks, paths and human impacts.• What will visitors to the site see, hear, smell, feel and taste?
Water Quality DataWrite explanations of the water quality testing parameters; Turbidity, pH and Salinity.• What do they tell us about water quality?• What are the normal ranges at your site and what factors influence these levels in water?The instruction cards and the NRM Education website can help.
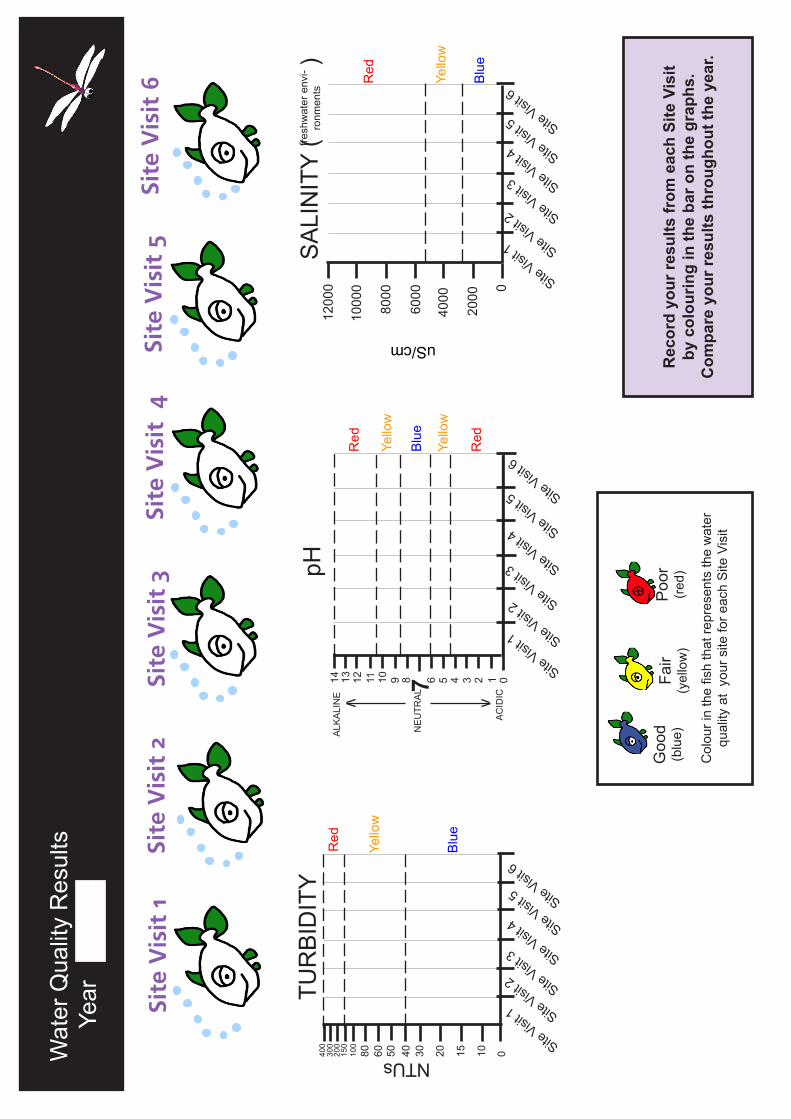
Display your test results in graph form and update after each Site Visit.
Create a column graph template (example overleaf ). You may like to photocopy this sheet for each student in your class or enlarge it for the classroom wall.
Wat
er Q
ualit
y R
esul
ts
Yea
r
Red
Blu
e
Yello
w
uS/cm
SA
LIN
ITY
(
)
Blu
e
Yello
w
Yello
w
Red
Red
2468101214 7 13591113
NE
UTR
AL
AC
IDIC
ALK
ALI
NE
0
pH
Rec
ord
your
resu
lts fr
om e
ach
Site
Vis
it by
col
ourin
g in
the
bar o
n th
e gr
aphs
.C
ompa
re y
our r
esul
ts th
roug
hout
the
year
.
1200
0
1000
0
8000
6000
4000
2000
fresh
wat
er e
nvi-
ronm
ents
0
Yello
w
TUR
BID
ITY
400
100
200
300
1015203040506080150
NTUs
Blu
e
Red
0
Col
our i
n th
e fis
h th
at re
pres
ents
the
wat
er
qual
ity a
t yo
ur s
ite fo
r eac
h S
ite V
isit
Goo
d(b
lue)
Fair
(yel
low
)P
oor
(red
)
Site Visit 1 Site Visit 2
Site Visit 5
Site Visit 4
Site Visit 3
Site Visit 6
Site Visit 1 Site Visit 2
Site Visit 5
Site Visit 4
Site Visit 3
Site Visit 6
Site Visit 1 Site Visit 2
Site Visit 5
Site Visit 4
Site Visit 3
Site Visit 6
Site
Vis
it 1
Site
Vis
it 2
Site
Vis
it 3
Site
Vis
it 4
Site
Vis
it 5
Site
Vis
it 6
Extension Activities 3Comparing Water Quality Results
Seasonal changes such as, temperature, rainfall, drought and Autumn leaf fall can influence water quality across catchment areas. Factors such as land use change, revegetation, earthworks or pollution incidents may have a more localised impact on water quality. Comparing your results across the year, and with sites up and down stream of your own, can help you to determine whether changes in water quality are seasonal or localised.
Analyse general trends and changes in water quality by comparing your graphed results with previous water quality results. Formulate reasons for trends and changes.
Consider the following:• How have results changed over time? • How do results change along the water course?
Formulate explanations for the following examples:• Salinity levels could have decreased during the middle of the year.• Nutrient levels may be higher in the winter months.• Turbidity levels may be higher at downstream sites.
Past DataTo conduct a full analysis of water quality results you might like to access water quality data from previous monitoring, other areas of the catchment and/or around the State check our website for historic water quality data.
Examine previous results maps and formulate reasons
for any changes in water quality.
How can flow rate affect water quality? Slow Flow - sediments settle quickly to the bottom• salinity may increase• temperature may increase• water may become stagnant, leading to low disolved oxygen
levels• increased nutrient levels• possibility of algal blooms
Medium Flow - dilution and flushing of pollutants• good mixing of oxygen with water• ideal conditions for aquatic macro invertebrates
Fast Flow - heavy rainfall = greater stormwater load• increased turbidity• fluctuating levels of nutrients, pH, salinity, and oxygen
Recording water flow at your monitoring siteWater velocity is relatively easy to work out and provides a rough measure of the likely effects of pollutants on a waterbody. By recording and comparing water flow at your site, over time you will be able to identify low, medium and high flows.
This can help you to interpret your results as you may find corresponding changes in other water quality test results. For example, turbidity tends to increase with higher water flow or salinity levels increase during times of low water flow.
Extension Activities 4Water Flow
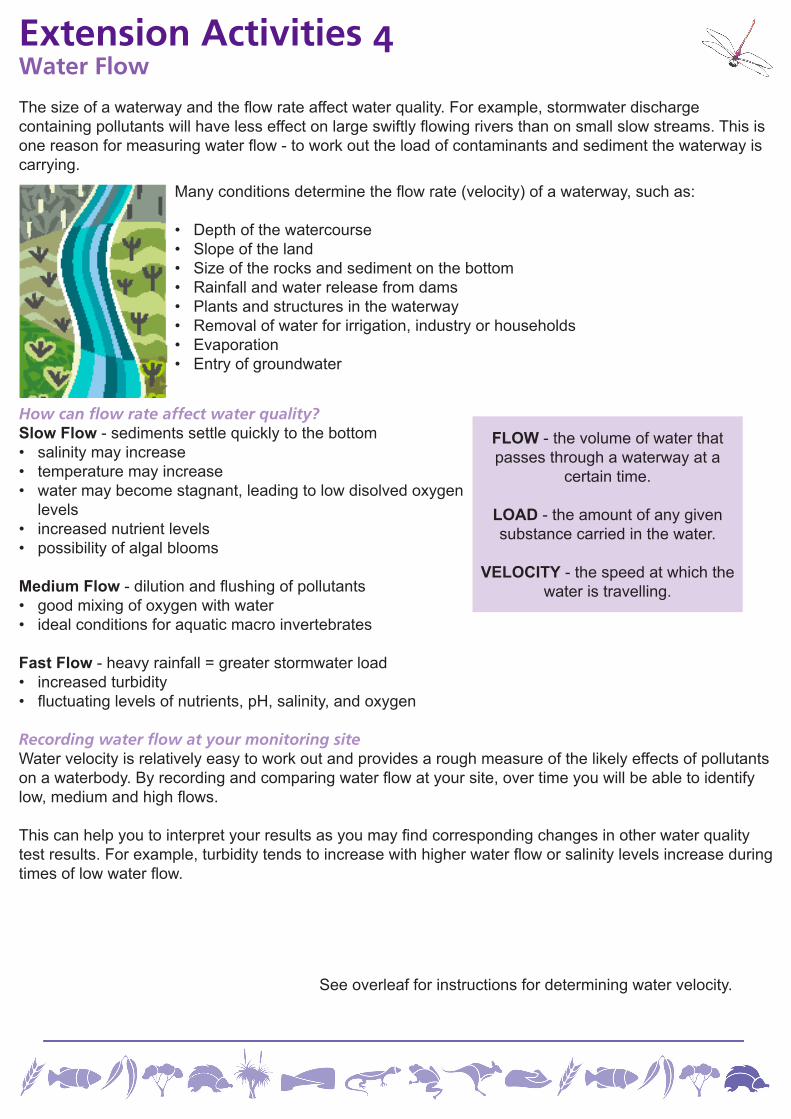
The size of a waterway and the flow rate affect water quality. For example, stormwater discharge containing pollutants will have less effect on large swiftly flowing rivers than on small slow streams. This is one reason for measuring water flow - to work out the load of contaminants and sediment the waterway is carrying.
Many conditions determine the flow rate (velocity) of a waterway, such as:
• Depth of the watercourse• Slope of the land• Size of the rocks and sediment on the bottom• Rainfall and water release from dams• Plants and structures in the waterway• Removal of water for irrigation, industry or households• Evaporation• Entry of groundwater
FLOW - the volume of water that passes through a waterway at a
certain time.
LOAD - the amount of any given substance carried in the water.
VELOCITY - the speed at which the water is travelling.
See overleaf for instructions for determining water velocity.
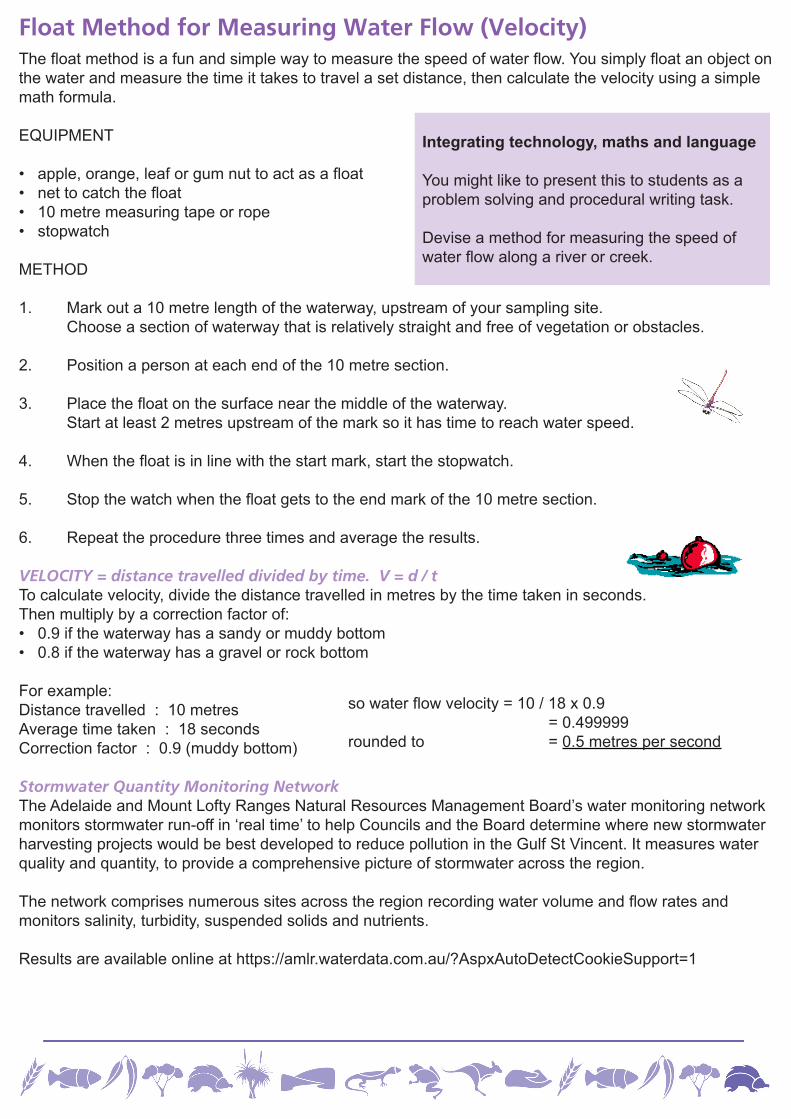
Float Method for Measuring Water Flow (Velocity) The float method is a fun and simple way to measure the speed of water flow. You simply float an object on the water and measure the time it takes to travel a set distance, then calculate the velocity using a simple math formula.
EQUIPMENT
• apple, orange, leaf or gum nut to act as a float• net to catch the float• 10 metre measuring tape or rope• stopwatch
METHOD
1. Mark out a 10 metre length of the waterway, upstream of your sampling site. Choose a section of waterway that is relatively straight and free of vegetation or obstacles.
2. Position a person at each end of the 10 metre section.
3. Place the float on the surface near the middle of the waterway. Start at least 2 metres upstream of the mark so it has time to reach water speed.
4. When the float is in line with the start mark, start the stopwatch.
5. Stop the watch when the float gets to the end mark of the 10 metre section.
6. Repeat the procedure three times and average the results.
VELOCITY = distance travelled divided by time. V = d / t To calculate velocity, divide the distance travelled in metres by the time taken in seconds. Then multiply by a correction factor of: • 0.9 if the waterway has a sandy or muddy bottom• 0.8 if the waterway has a gravel or rock bottom
For example: Distance travelled : 10 metresAverage time taken : 18 secondsCorrection factor : 0.9 (muddy bottom)
Stormwater Quantity Monitoring NetworkThe Adelaide and Mount Lofty Ranges Natural Resources Management Board’s water monitoring network monitors stormwater run-off in ‘real time’ to help Councils and the Board determine where new stormwater harvesting projects would be best developed to reduce pollution in the Gulf St Vincent. It measures water quality and quantity, to provide a comprehensive picture of stormwater across the region.
The network comprises numerous sites across the region recording water volume and flow rates and monitors salinity, turbidity, suspended solids and nutrients.
Results are available online at https://amlr.waterdata.com.au/?AspxAutoDetectCookieSupport=1
Integrating technology, maths and language
You might like to present this to students as a problem solving and procedural writing task.
Devise a method for measuring the speed of water flow along a river or creek.
so water flow velocity = 10 / 18 x 0.9 = 0.499999rounded to = 0.5 metres per second
Extension Activities 5Water Language and Emotion
Story WritingSelect a pollutant and write a story to describe how it arrived in the creek and the next part of its journey. The story may be a recount, adventure, mystery, science fiction or comic strip.
When water goes badCreate an illustrated storyline entitled ‘When water goes bad’ that highlights some of the problems that pollution creates in freshwater.
Letter to CouncilImagine your local council is about to create an artificial wetland and have asked for public comment. Research artificial wetlands, then write a letter to the Town Planner telling them what you think about their decision and the reasons for your opinion.
Create a pollution profile bookletSelect a pollutant found in your local waterway and gather as much information as you can about it: what kind of pollutant it is, where does it come from, what impacts may it have? Explain what it looks like to someone who hasn’t seen it (factual or poetic) and describe why it is bad. Use a range of media to illustrate your point.
Pollution identification guideDevelop a catalogue that can be used to identify pollution and or impacts on the environment. The guide should inform future students of their features, possible impacts and other interesting characteristics. The guide could include illustrations and photographs.
Life in the waterImagine that you are a freshwater animal. Describe the influences that water has on your life. How does your life change throughout the year?
Go with the flowImagine you are a fish. Describe how changing water flows make you feel. How do you cope with flooding and drought events.
Class discussion and debateMany farm animals are allowed access to creeks for drinking water. Organise a debate arguing for and against.
PhotographyDevelop a photographic record of your monitoring site. Create a timeline to demonstrate the seasonal changes that occur. The timeline could be a series of static images or an animation or PowerPoint presentation. Show off your timeline to other classes, a school assembly or invite parents to come in for a special presentation.
DanceCreate an interpretive dance to demonstrate the changes to the creek across the year.
Appendix
Additional ‘Water Testing Explained’ cards for parameters that are not included in the Engaging with Nature water quality monitoring kit.
• Nitrate• Phosphate-P MB (0.07 - 2.3 mg/L P)• Phosphate-P MBHS (0.025 - 0.4 mg/L P)• Dissolved Oxygen
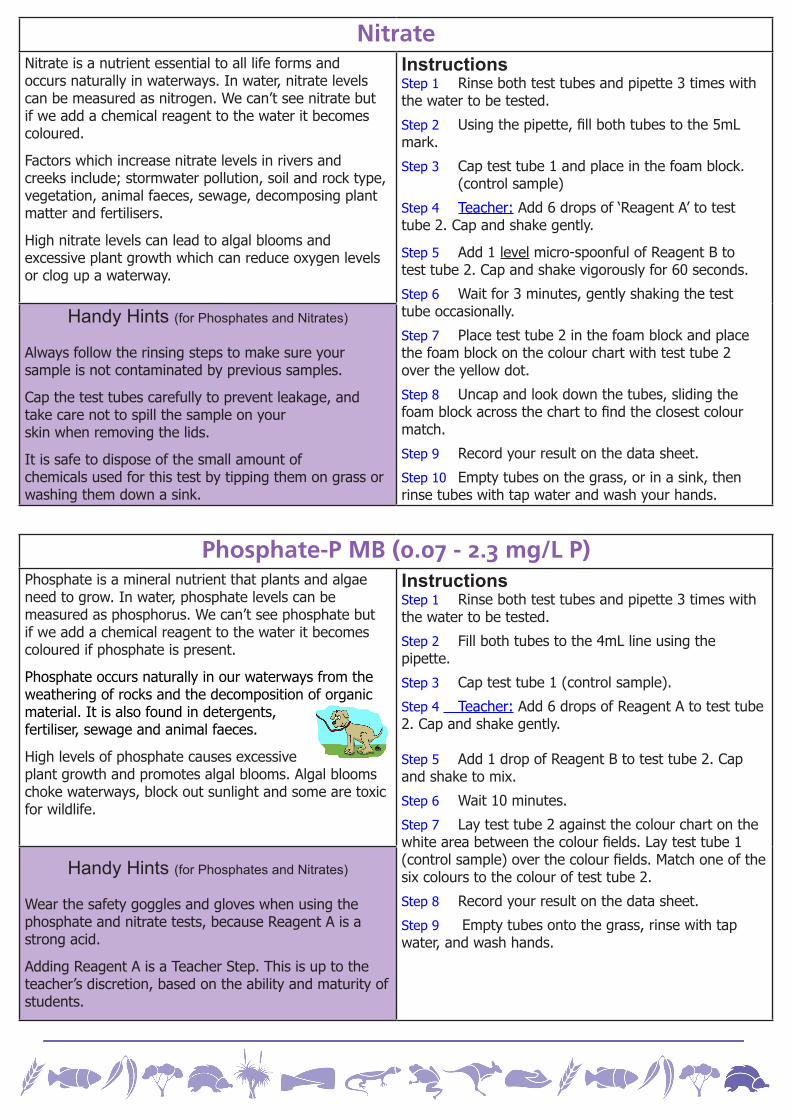
NitrateNitrate is a nutrient essential to all life forms and occurs naturally in waterways. In water, nitrate levels can be measured as nitrogen. We can’t see nitrate but if we add a chemical reagent to the water it becomes coloured.
Factors which increase nitrate levels in rivers and creeks include; stormwater pollution, soil and rock type, vegetation, animal faeces, sewage, decomposing plant matter and fertilisers.
High nitrate levels can lead to algal blooms and excessive plant growth which can reduce oxygen levels or clog up a waterway.
Instructions Step 1 Rinse both test tubes and pipette 3 times with the water to be tested.
Step 2 Using the pipette, fill both tubes to the 5mL mark.
Step 3 Cap test tube 1 and place in the foam block. (control sample)
Step 4 Teacher: Add 6 drops of ‘Reagent A’ to test tube 2. Cap and shake gently.
Step 5 Add 1 level micro-spoonful of Reagent B to test tube 2. Cap and shake vigorously for 60 seconds.
Step 6 Wait for 3 minutes, gently shaking the test tube occasionally.
Step 7 Place test tube 2 in the foam block and place the foam block on the colour chart with test tube 2 over the yellow dot.
Step 8 Uncap and look down the tubes, sliding the foam block across the chart to find the closest colour match.
Step 9 Record your result on the data sheet.
Step 10 Empty tubes on the grass, or in a sink, then rinse tubes with tap water and wash your hands.
Handy Hints (for Phosphates and Nitrates)
Always follow the rinsing steps to make sure your sample is not contaminated by previous samples.
Cap the test tubes carefully to prevent leakage, and take care not to spill the sample on your skin when removing the lids.
It is safe to dispose of the small amount of chemicals used for this test by tipping them on grass or washing them down a sink.
Phosphate-P MB (0.07 - 2.3 mg/L P)Phosphate is a mineral nutrient that plants and algae need to grow. In water, phosphate levels can be measured as phosphorus. We can’t see phosphate but if we add a chemical reagent to the water it becomes coloured if phosphate is present.
Phosphate occurs naturally in our waterways from the weathering of rocks and the decomposition of organic material. It is also found in detergents,fertiliser, sewage and animal faeces.
High levels of phosphate causes excessiveplant growth and promotes algal blooms. Algal blooms choke waterways, block out sunlight and some are toxic for wildlife.
InstructionsStep 1 Rinse both test tubes and pipette 3 times with the water to be tested.
Step 2 Fill both tubes to the 4mL line using the pipette.
Step 3 Cap test tube 1 (control sample).
Step 4 Teacher: Add 6 drops of Reagent A to test tube 2. Cap and shake gently.
Step 5 Add 1 drop of Reagent B to test tube 2. Cap and shake to mix.
Step 6 Wait 10 minutes.
Step 7 Lay test tube 2 against the colour chart on the white area between the colour fields. Lay test tube 1 (control sample) over the colour fields. Match one of the six colours to the colour of test tube 2.
Step 8 Record your result on the data sheet.
Step 9 Empty tubes onto the grass, rinse with tap water, and wash hands.
Handy Hints (for Phosphates and Nitrates)
Wear the safety goggles and gloves when using the phosphate and nitrate tests, because Reagent A is a strong acid.
Adding Reagent A is a Teacher Step. This is up to the teacher’s discretion, based on the ability and maturity of students.
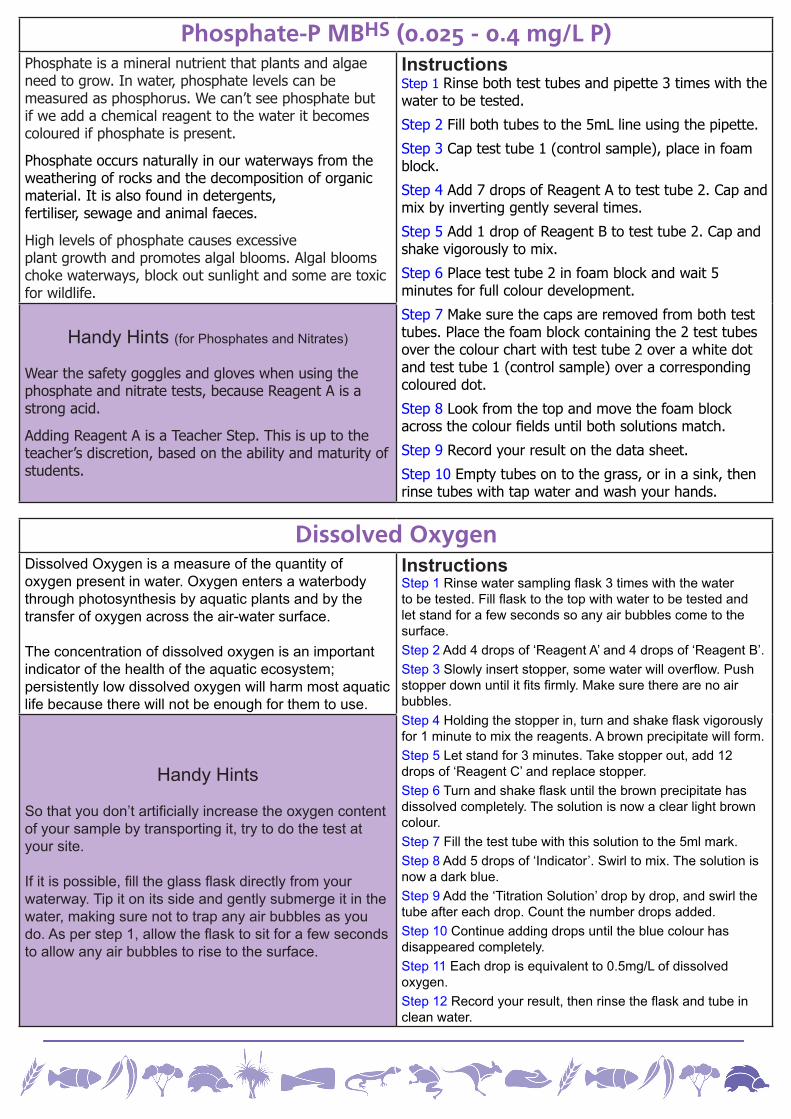
Phosphate-P MBHS (0.025 - 0.4 mg/L P)Phosphate is a mineral nutrient that plants and algae need to grow. In water, phosphate levels can be measured as phosphorus. We can’t see phosphate but if we add a chemical reagent to the water it becomes coloured if phosphate is present.
Phosphate occurs naturally in our waterways from the weathering of rocks and the decomposition of organic material. It is also found in detergents,fertiliser, sewage and animal faeces.
High levels of phosphate causes excessiveplant growth and promotes algal blooms. Algal blooms choke waterways, block out sunlight and some are toxic for wildlife.
InstructionsStep 1 Rinse both test tubes and pipette 3 times with the water to be tested.
Step 2 Fill both tubes to the 5mL line using the pipette.
Step 3 Cap test tube 1 (control sample), place in foam block.
Step 4 Add 7 drops of Reagent A to test tube 2. Cap and mix by inverting gently several times.
Step 5 Add 1 drop of Reagent B to test tube 2. Cap and shake vigorously to mix.
Step 6 Place test tube 2 in foam block and wait 5 minutes for full colour development.
Step 7 Make sure the caps are removed from both test tubes. Place the foam block containing the 2 test tubes over the colour chart with test tube 2 over a white dot and test tube 1 (control sample) over a corresponding coloured dot.
Step 8 Look from the top and move the foam block across the colour fields until both solutions match.
Step 9 Record your result on the data sheet.
Step 10 Empty tubes on to the grass, or in a sink, then rinse tubes with tap water and wash your hands.
Handy Hints (for Phosphates and Nitrates)
Wear the safety goggles and gloves when using the phosphate and nitrate tests, because Reagent A is a strong acid.
Adding Reagent A is a Teacher Step. This is up to the teacher’s discretion, based on the ability and maturity of students.
Dissolved OxygenDissolved Oxygen is a measure of the quantity of oxygen present in water. Oxygen enters a waterbody through photosynthesis by aquatic plants and by the transfer of oxygen across the air-water surface.
The concentration of dissolved oxygen is an important indicator of the health of the aquatic ecosystem; persistently low dissolved oxygen will harm most aquatic life because there will not be enough for them to use.
Instructions Step 1 Rinse water sampling flask 3 times with the water to be tested. Fill flask to the top with water to be tested and let stand for a few seconds so any air bubbles come to the surface.Step 2 Add 4 drops of ‘Reagent A’ and 4 drops of ‘Reagent B’.Step 3 Slowly insert stopper, some water will overflow. Push stopper down until it fits firmly. Make sure there are no air bubbles.Step 4 Holding the stopper in, turn and shake flask vigorously for 1 minute to mix the reagents. A brown precipitate will form.Step 5 Let stand for 3 minutes. Take stopper out, add 12 drops of ‘Reagent C’ and replace stopper.Step 6 Turn and shake flask until the brown precipitate has dissolved completely. The solution is now a clear light brown colour.Step 7 Fill the test tube with this solution to the 5ml mark.Step 8 Add 5 drops of ‘Indicator’. Swirl to mix. The solution is now a dark blue.Step 9 Add the ‘Titration Solution’ drop by drop, and swirl the tube after each drop. Count the number drops added.Step 10 Continue adding drops until the blue colour has disappeared completely.Step 11 Each drop is equivalent to 0.5mg/L of dissolved oxygen.Step 12 Record your result, then rinse the flask and tube in clean water.
Handy Hints
So that you don’t artificially increase the oxygen content of your sample by transporting it, try to do the test at your site.
If it is possible, fill the glass flask directly from your waterway. Tip it on its side and gently submerge it in the water, making sure not to trap any air bubbles as you do. As per step 1, allow the flask to sit for a few seconds to allow any air bubbles to rise to the surface.