Embed Size (px)
Citation preview
Engaging Data Displays
John Muffo
Jacki Stirn
SSBTN Consultants

GOALS• Review best practices
• Work with examples
• Provide additional resources
ConsiderationsKnow your audience
BoardFacultyStaffStudentsPublicMedia
Tell the Story You Want To Tell
• Choose your medium
• Choose your tool
• Be Goldilocks– Not too much data– Just the right amount
• Pick an appropriate display
Caveats
Don’t use yellow for a text color
Just because there are a lot of fonts doesn’t mean you should use them all

• How many places before and after a decimal point ?
• Use currency or percent symbols on each number or in the heading?
• Other considerations ?
NumbersUse an appropriate number format

Examples for Discussion
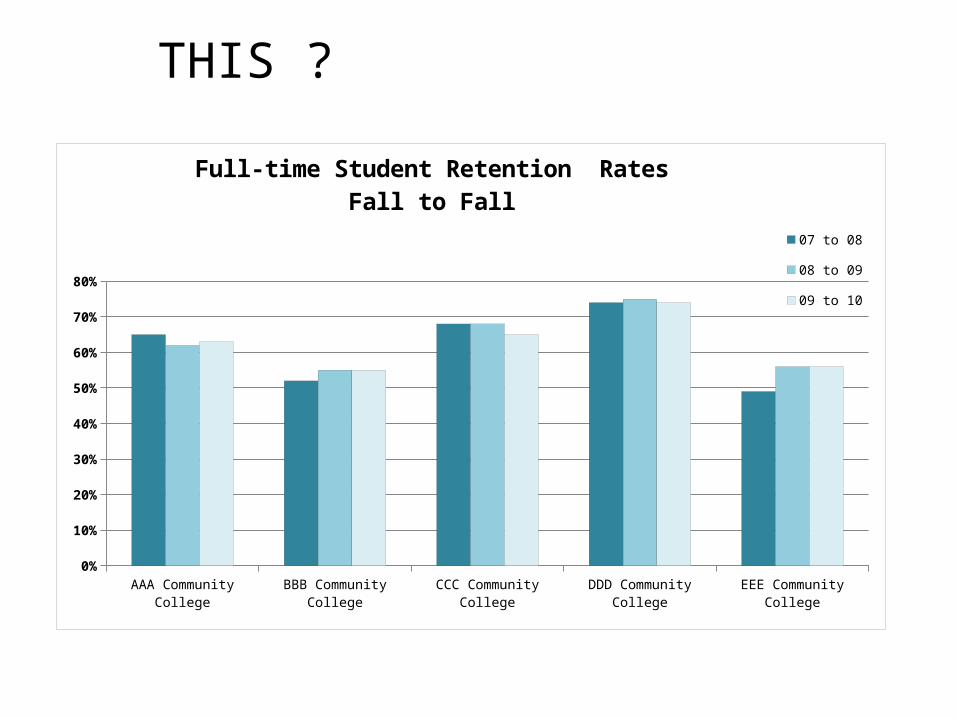
THIS ?
AAA Community College BBB Community College CCC Community College DDD Community College EEE Community College0%
10%
20%
30%
40%
50%
60%
70%
80%
Full-time Student Retention RatesFall to Fall
07 to 08
08 to 09
09 to 10
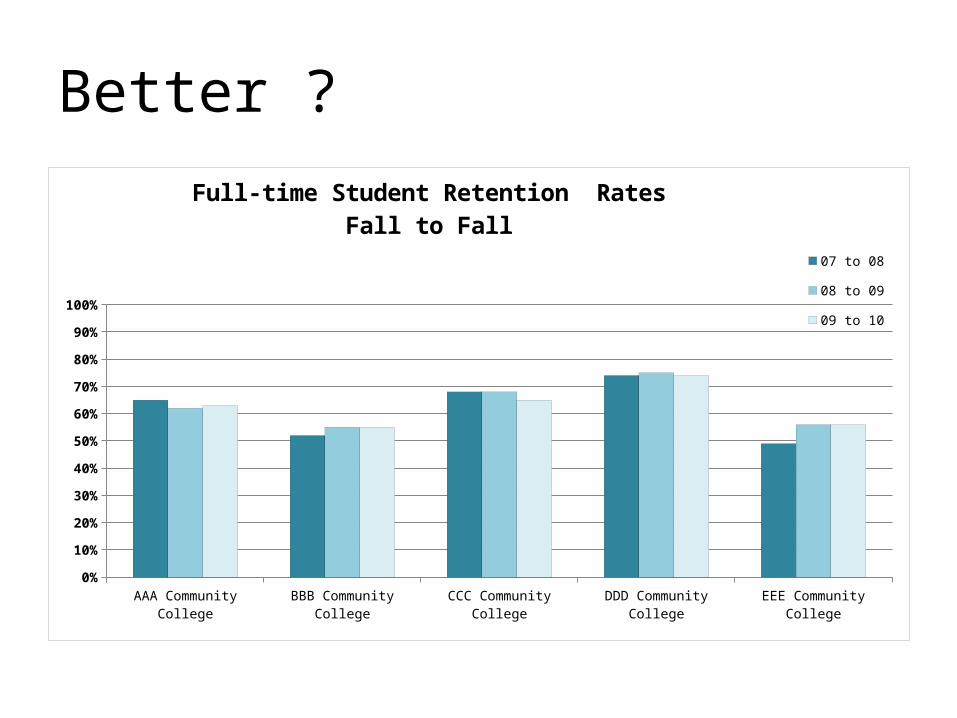
Better ?
AAA Community College BBB Community College CCC Community College DDD Community College EEE Community College0%
10%
20%
30%
40%
50%
60%
70%
80%
90%
100%
Full-time Student Retention RatesFall to Fall
07 to 08
08 to 09
09 to 10
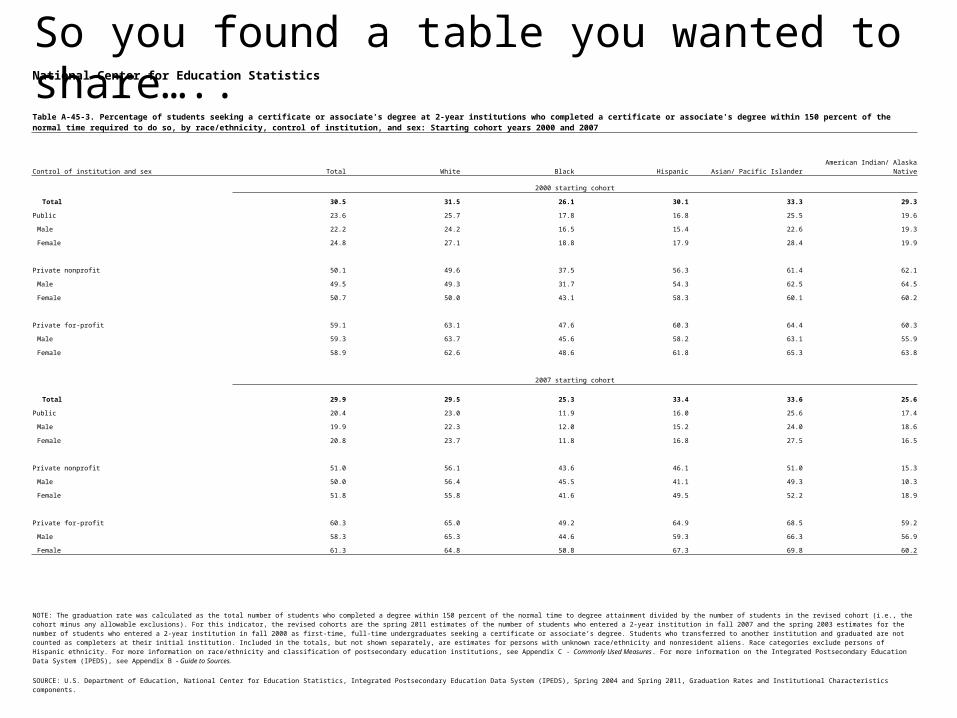
National Center for Education Statistics
Table A-45-3. Percentage of students seeking a certificate or associate's degree at 2-year institutions who completed a certificate or associate's degree within 150 percent of the normal time required to do so, by race/ethnicity, control of institution, and sex: Starting cohort years 2000 and 2007
Control of institution and sex Total White Black Hispanic Asian/ Pacific Islander American Indian/ Alaska Native
2000 starting cohort
Total 30.5 31.5 26.1 30.1 33.3 29.3
Public 23.6 25.7 17.8 16.8 25.5 19.6
Male 22.2 24.2 16.5 15.4 22.6 19.3
Female 24.8 27.1 18.8 17.9 28.4 19.9
Private nonprofit 50.1 49.6 37.5 56.3 61.4 62.1
Male 49.5 49.3 31.7 54.3 62.5 64.5
Female 50.7 50.0 43.1 58.3 60.1 60.2
Private for-profit 59.1 63.1 47.6 60.3 64.4 60.3
Male 59.3 63.7 45.6 58.2 63.1 55.9
Female 58.9 62.6 48.6 61.8 65.3 63.8
2007 starting cohort
Total 29.9 29.5 25.3 33.4 33.6 25.6
Public 20.4 23.0 11.9 16.0 25.6 17.4
Male 19.9 22.3 12.0 15.2 24.0 18.6
Female 20.8 23.7 11.8 16.8 27.5 16.5
Private nonprofit 51.0 56.1 43.6 46.1 51.0 15.3
Male 50.0 56.4 45.5 41.1 49.3 10.3
Female 51.8 55.8 41.6 49.5 52.2 18.9
Private for-profit 60.3 65.0 49.2 64.9 68.5 59.2
Male 58.3 65.3 44.6 59.3 66.3 56.9
Female 61.3 64.8 50.8 67.3 69.8 60.2
NOTE: The graduation rate was calculated as the total number of students who completed a degree within 150 percent of the normal time to degree attainment divided by the number of students in the revised cohort (i.e., the cohort minus any allowable exclusions). For this indicator, the revised cohorts are the spring 2011 estimates of the number of students who entered a 2-year institution in fall 2007 and the spring 2003 estimates for the number of students who entered a 2-year institution in fall 2000 as first-time, full-time undergraduates seeking a certificate or associate’s degree. Students who transferred to another institution and graduated are not counted as completers at their initial institution. Included in the totals, but not shown separately, are estimates for persons with unknown race/ethnicity and nonresident aliens. Race categories exclude persons of Hispanic ethnicity. For more information on race/ethnicity and classification of postsecondary education institutions, see Appendix C - Commonly Used Measures. For more information on the Integrated Postsecondary Education Data System (IPEDS), see Appendix B - Guide to Sources.
SOURCE: U.S. Department of Education, National Center for Education Statistics, Integrated Postsecondary Education Data System (IPEDS), Spring 2004 and Spring 2011, Graduation Rates and Institutional Characteristics components.
So you found a table you wanted to share…..
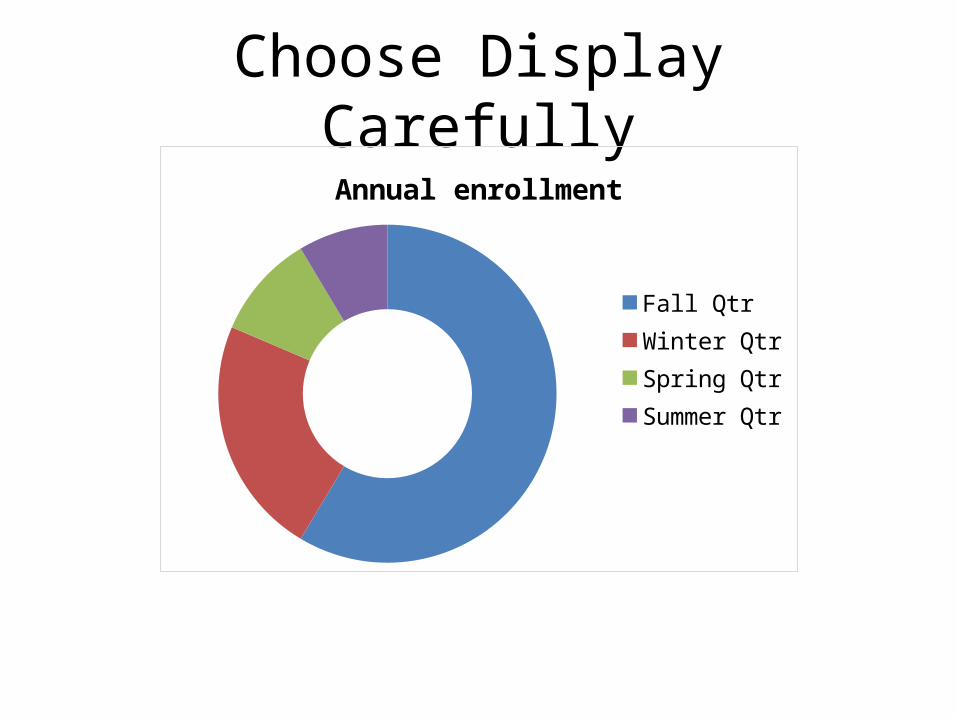
Choose Display CarefullyAnnual enrollment
Fall QtrWinter QtrSpring QtrSummer Qtr
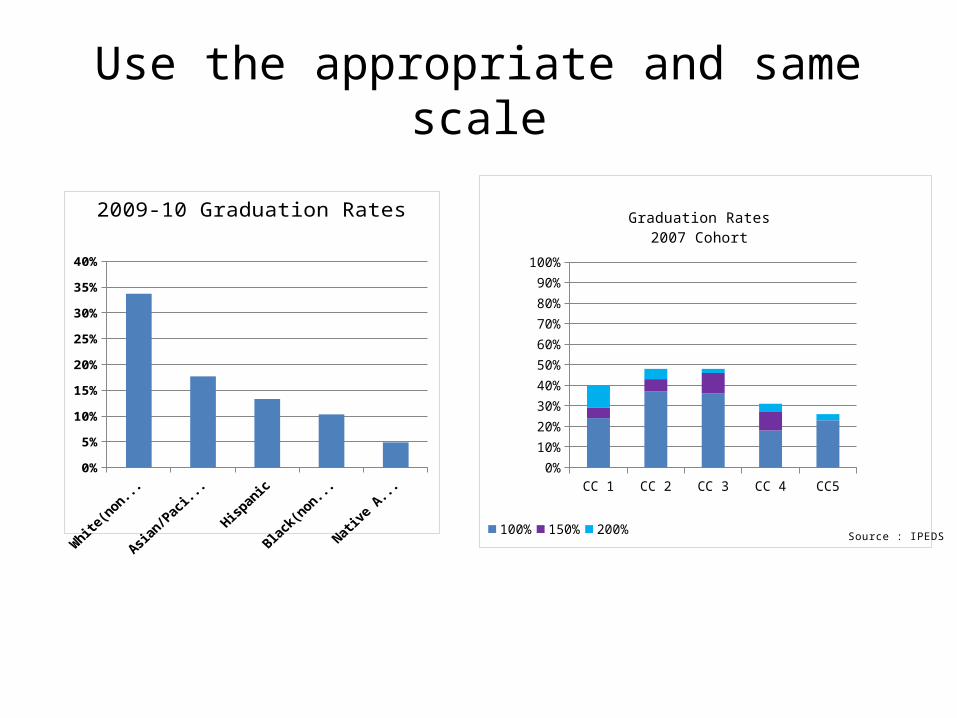
Use the appropriate and same scale
0%
5%
10%
15%
20%
25%
30%
35%
40%
2009-10 Graduation Rates
CC 1 CC 2 CC 3 CC 4 CC50%
10%
20%
30%
40%
50%
60%
70%
80%
90%
100%
100% 150% 200%
Graduation Rates2007 Cohort
Source : IPEDS
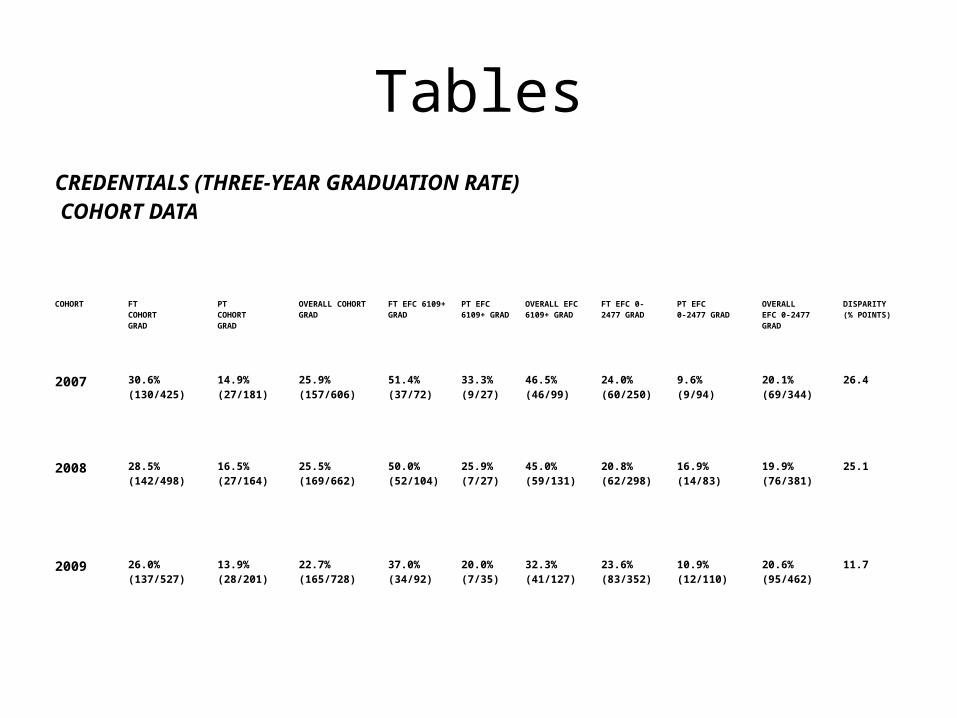
TablesCREDENTIALS (THREE-YEAR GRADUATION RATE) COHORT DATA
COHORT FT COHORT GRAD
PT COHORT GRAD
OVERALL COHORT GRAD
FT EFC 6109+ GRAD
PT EFC 6109+ GRAD
OVERALL EFC 6109+ GRAD
FT EFC 0-2477 GRAD
PT EFC 0-2477 GRAD
OVERALL EFC 0-2477 GRAD
DISPARITY (% POINTS)
2007 30.6% (130/425)
14.9% (27/181)
25.9% (157/606)
51.4% (37/72)
33.3% (9/27)
46.5% (46/99)
24.0% (60/250)
9.6% (9/94)
20.1% (69/344)
26.4
2008 28.5% (142/498)
16.5% (27/164)
25.5% (169/662)
50.0% (52/104)
25.9% (7/27)
45.0% (59/131)
20.8% (62/298)
16.9% (14/83) 19.9% (76/381)
25.1
2009 26.0% (137/527)
13.9% (28/201)
22.7% (165/728)
37.0% (34/92)
20.0% (7/35)
32.3% (41/127)
23.6% (83/352)
10.9% (12/110)
20.6% (95/462)
11.7
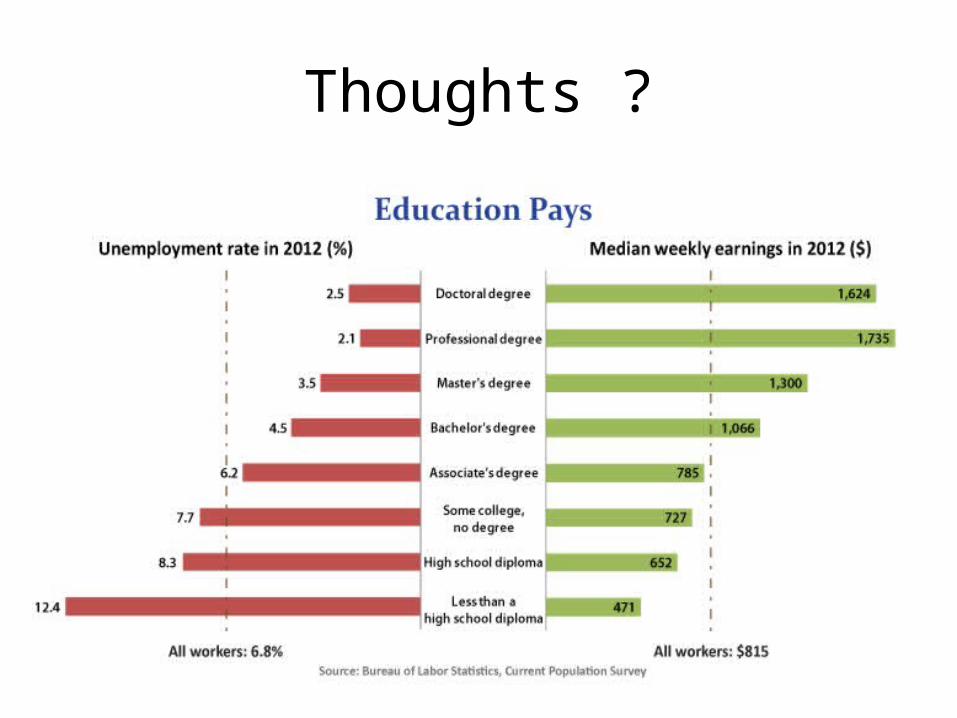
Thoughts ?

Just for fun
Your Data Part and full time students on track