Embed Size (px)
Citation preview

1
Engagement of the B-cell receptor of chronic lymphocytic leukemia cells drivesglobalRNAtranslationandtranslationofMYCRNAAlisonYeomans1,2*,StevenThirdborough1,2,BeatrizValle-Argos1,2,AdamLinely1,2,SergeKrysov1,2#,MarinaSanchezHidalgo1,2#,ElodieLeonard1,2#,MohammadIshfaq1,2,AnneEWillis3,AndrewJSteele1,2,FredaKStevenson1,2,FrancescoForconi1,2,MarkJColdwell5,GrahamPackham1,21Cancer Research UK Centre, Faculty of Medicine, University of Southampton,Southampton,UK.2ExperimentalCancerMedicineCentre,FacultyofMedicine,UniversityofSouthampton,Southampton,UK.3MRCToxicologyUnit,LancasterRoad,Leicester,UK4Department of Haematology, University Hospital Southampton NHS Trust,Southampton,UK5Centre for Biological Sciences, Faculty of Natural and Environmental Sciences,UniversityofSouthampton,Southampton,UK.*CommunicatingAuthor.#CurrentAddresses.MSH.Department of Pharmacology, Faculty of Pharmacy,University of Seville, 41012,Seville,SpainEL.XPEPharma&Science,AvenueEdison19,1300Wavre,Belgium.SK.Bart’sCancerInstitute,QueenMary,UniversityofLondon,London,EC1M6BQ.Abstract=244wordsMaintext=3983wordsFigures=5

2
AbstractAntigenicstimulationviatheB-cellreceptor(BCR)isamajordriveroftheproliferationand survival of chronic lymphocytic leukemia (CLL) cells. However, the precisemechanismsbywhichBCRstimulationleadstoaccumulationofmalignantcellsremainincompletely understood. Here, we investigated the ability of BCR stimulation toincreaseRNA translationwhich can promote carcinogenesis by effects on both globalprotein synthesis and upregulation of expression of specific oncoproteins. Integratedbioinformatics analysis revealed that antigenic stimulation was associated with astrikingup-regulationofpathwayslinkedtoproteinsynthesisinCLLcellsinvivo.Anti-IgMsignificantlyincreasedRNAtranslationinprimaryCLLcellsinvitro,measuredusingbothbulkmetaboliclabellingandanovelflowcytometryassaytoquantifyresponsesata single cell level. Anti-IgM-induced RNA translation was associated with increasedexpressionoftranslationinitiationfactorseIF4AandeIF4GI,andreducedexpressionoftheeIF4AinhibitorPDCD4.Anti-IgMalsoincreasedRNAtranslationinnormalbloodBcells; this was associated with reduced PDCD4 expression, but without substantialchangesineIF4AandeIF4GI.Inadditiontoeffectsonglobalproteinsynthesis,anti-IgMincreased translationofRNAencodingMYC.Translational responseswere suppressedbyinhibitorsofBTK(ibrutinib)andSYK(tamatinib).RNAtranslationis likelytobeanimportant mediator of the growth-promoting effects of antigen stimulation acting, atleast in part, via translational induction of MYC. Differences in mechanisms oftranslational regulation in CLL and normal B cells may provide opportunities forselectivetherapeuticattack.KeywordsChronic lymphocytic leukaemia (CLL), anti-IgM, B-cell receptor (BCR), translation,ibrutinib,tamatinib,MYCPhrases

3
INTRODUCTIONB-cellreceptor(BCR)signalingisamajordriverofmalignantbehaviorinB-cellcancers.BCR signaling has been relativelywell studied in chronic lymphocytic leukemia (CLL)and, here, the balance between antigen-induced anergy and positive (growth-promoting)signalingisakeydeterminantofvariableclinicalbehavior.1CLLcellanergyisassociatedwithstronglyreducedsurfaceIgMexpressionandsignalingcapacity.2Itisobserved at variable levels in all CLL samples, but is most prominent in samplesexpressing mutated IGHV genes (M-CLL) and is associated with indolent disease. Bycontrast, samples expressing unmutated IGHV genes (U-CLL) tend to retain sIgMsignaling capacity and positive signaling is associated with more aggressive disease.These findings, and others, provided a strong impetus for clinical testing of newinhibitorsofBCR-associatedsignalingkinases.ThesehaveshownimpressiveresponsesandtheBTKinhibitor, ibrutinib, isnowapprovedfortreatmentofCLLandmantlecelllymphoma.3,4Despite intense interest in the biology and drug-targeting of BCR pathways in B-cellmalignancies,understandingofthemechanismswhichdriveaccumulationofmalignantcells remains incomplete. One important responsemay be increasedRNA translation.RNA translation is subject to tight control and recent studies performed usingmousefibroblasts indicated that modulation of RNA translation may play a role as great astranscriptionindeterminingoverallvariationinproteinexpression.5,6Althoughrelativelywellstudiedinsolidtumors,comparativelylittleisknownaboutthecontrol of RNA translation in B-cell malignancies. Two recent studies identifiedincreased expression/phosphorylation of specific RNA translation initiation factors(eIFs), eIF4B and eIF4E, in diffuse large B-cell lymphoma.7,8 In CLL, stimulation ofmalignantcellsbyCD40L-expressingstromalcellsincreasedglobalRNAtranslationandformation of the eIF4F complexwhich binds the 5’CAP ofmRNAs and enhances RNAtranslation.9 Previous comparisons of gene expression profiling (GEP) and proteomicanalysis revealed differences in the transcriptomic and proteomic response followingsurface IgM (sIgM) stimulation of CLL cells pointing to post-transcriptionalregulation.10,11However,whetherRNAtranslationismodulatedbyBCRsignalinginCLL,where it is such a critical determinant of tumor behavior and target for therapy, isunknown.Increased RNA translation plays important roles in carcinogenesis, via both globaleffectstosupportincreasedcellgrowth,andup-regulationofspecificoncoproteins.12,13MYC RNA has a highly structured 5’-untranslated region and is one of a family ofmalignancy-associated RNAs for which translation is tightly dependent on eIFactivity.14,15 In our previous studies we demonstrated that MYC protein was inducedfollowing stimulationof sIgMofCLLcells invitro and thatMYC ishighlyexpressed inproliferation centers in CLL lymphnodes (LN)16which are presumed to be themajorsitesofantigen-inducedcelldivisioninvivo.17Therefore,wehypothesizedthatMYCmaybeanimportanttargetfortranslationalregulationinCLL.Inthiswork,weinvestigatedeffectsofBCRstimulationonRNAtranslationinvitroandinvivo.BioinformaticalanalysisofGEPrevealedthatantigenstimulationofCLLcellsinLN in vivo was associated with strong induction of multiple components of the RNAtranslation machinery. Anti-IgM stimulation of primary CLL cells in vitro resulted inincreasedRNAtranslation,measuredusingbothbulkmetaboliclabellingandatasinglecell levelusinganew flow-cytometerbasedassay.Anti-IgMalso resulted in increasedtranslationofMYCRNA.TheseresponseswereassociatedwithincreasedexpressionofthetranslationinitiationfactorseIF4GIandeIF4A1andwereinhibitedbyibrutiniband
4
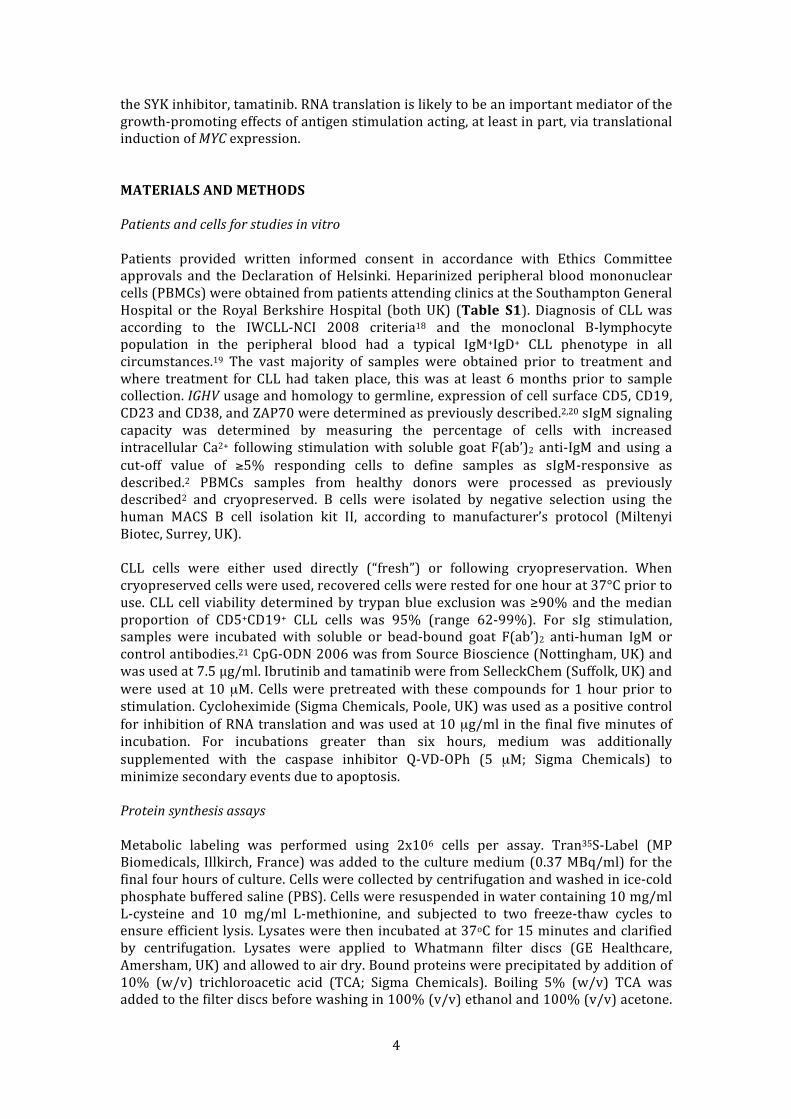
theSYKinhibitor,tamatinib.RNAtranslationislikelytobeanimportantmediatorofthegrowth-promotingeffectsofantigenstimulationacting,atleastinpart,viatranslationalinductionofMYCexpression.MATERIALSANDMETHODSPatientsandcellsforstudiesinvitroPatients provided written informed consent in accordance with Ethics Committeeapprovals and theDeclaration ofHelsinki.Heparinizedperipheral bloodmononuclearcells(PBMCs)wereobtainedfrompatientsattendingclinicsattheSouthamptonGeneralHospital or theRoyal BerkshireHospital (bothUK) (Table S1). Diagnosis of CLLwasaccording to the IWCLL-NCI 2008 criteria18 and the monoclonal B-lymphocytepopulation in the peripheral blood had a typical IgM+IgD+ CLL phenotype in allcircumstances.19 The vast majority of samples were obtained prior to treatment andwhere treatment for CLL had taken place, thiswas at least 6months prior to samplecollection.IGHVusageandhomologytogermline,expressionofcellsurfaceCD5,CD19,CD23andCD38,andZAP70weredeterminedaspreviouslydescribed.2,20sIgMsignalingcapacity was determined by measuring the percentage of cells with increasedintracellular Ca2+ following stimulationwith soluble goat F(ab’)2 anti-IgM and using acut-off value of ≥5% responding cells to define samples as sIgM-responsive asdescribed.2 PBMCs samples from healthy donors were processed as previouslydescribed2 and cryopreserved. B cells were isolated by negative selection using thehuman MACS B cell isolation kit II, according to manufacturer’s protocol (MiltenyiBiotec,Surrey,UK).CLL cells were either used directly (“fresh”) or following cryopreservation. Whencryopreservedcellswereused,recoveredcellswererestedforonehourat37°Cpriortouse.CLLcellviabilitydeterminedby trypanblueexclusionwas≥90%and themedianproportion of CD5+CD19+ CLL cells was 95% (range 62-99%). For sIg stimulation,samples were incubated with soluble or bead-bound goat F(ab’)2 anti-human IgM orcontrolantibodies.21CpG-ODN2006wasfromSourceBioscience(Nottingham,UK)andwasusedat7.5μg/ml.IbrutinibandtamatinibwerefromSelleckChem(Suffolk,UK)andwereusedat10µM.Cellswerepretreatedwith these compounds for1hourprior tostimulation.Cycloheximide(SigmaChemicals,Poole,UK)wasusedasapositivecontrolfor inhibitionofRNAtranslationandwasusedat10µg/ml inthefinal fiveminutesofincubation. For incubations greater than six hours, medium was additionallysupplemented with the caspase inhibitor Q-VD-OPh (5 µM; Sigma Chemicals) tominimizesecondaryeventsduetoapoptosis.ProteinsynthesisassaysMetabolic labeling was performed using 2x10⁶ cells per assay. Tran35S-Label (MPBiomedicals, Illkirch,France)wasaddedtotheculturemedium(0.37MBq/ml) forthefinalfourhoursofculture.Cellswerecollectedbycentrifugationandwashedinice-coldphosphatebufferedsaline(PBS).Cellswereresuspendedinwatercontaining10mg/mlL-cysteine and 10 mg/ml L-methionine, and subjected to two freeze-thaw cycles toensureefficientlysis.Lysateswerethenincubatedat37oCfor15minutesandclarifiedby centrifugation. Lysates were applied to Whatmann filter discs (GE Healthcare,Amersham,UK)andallowedtoairdry.Boundproteinswereprecipitatedbyadditionof10% (w/v) trichloroacetic acid (TCA; Sigma Chemicals). Boiling 5% (w/v) TCA wasaddedtothefilterdiscsbeforewashingin100%(v/v)ethanoland100%(v/v)acetone.

5
The filter discs were air-dried prior to scintillation counting using OptiScint ‘HiSafe’scintillation fluid (PerkinElmer, Cambridgeshire, UK) and a WALLAC 1409 liquidscintillationcounter(PerkinElmer).Allassayswereperformedinduplicate.Asacontrol,cellswere treatedwithcycloheximideandcounts fromcycloheximide-treatedsamplesweresubtractedfromexperimentalvalues.Click-iT assays were performed using 1x10⁶ cells per assay. O-propargyl-puromycin(OPP;20μM)(LifeTechnologies)wasaddedtothecellsand incubatedfor30minutes.Cells were washed in ice-cold PBS and then fixed and permeabilized using theCytofix/CytopermFixationPermeabilizationKit(BDBiosciences).Alexa-Fluor-647(LifeTechnologies)was conjugated to OPP as described in themanufacturer’s instructionsand cellswere stainedwith anti-CD5-PerCyP5.5 andanti-CD19-pacific blue antibodies(BD Biosciences) for 15 minutes on ice. Cells were washed in Cytoperm buffer (BDBiosciences) and resuspended in FACS buffer prior to data acquisition using a FACSCantoII flow cytometer (BD Biosciences). Data analysis was performed using FlowJov9.7.6(FlowJo,Ashland,OR,USA).Asacontrol,aproportionofcellsweretreatedwithcycloheximide (10 μg/ml) for fiveminutes prior to OPP addition and fluorescence ofcycloheximide-treatedcellswassubtractedfromallexperimentalvalues.StatisticsStatistical comparisons were performed using Student’s t-tests (Prism 6 software,GraphPadSoftware,LaJolla,CA,USA).Experimentaldetails for analysisofGEPdata, immunoblotting andpolysomeprofilingareprovidedinSupplementaryMaterials.RESULTSGene expression network analysis reveals increased RNA translation as a prominentresponsetoantigenengagementinvivoWe used unsupervised consensus weighted gene co-expression network analysis(WGCNA)22 of two published GEP datasets to identify growth-promoting pathwaysactivated followingantigen stimulationofCLL cells invivo.ThedatasetswerederivedfromthestudyofHerishanuetalwhichcomparedgeneexpressionofmatchedsamplesofCLLcellsderivedfromLN,bloodandbonemarrow(BM)17andthestudyofVallatetalwhichinvestigatedeffectsofanti-IgMonCLLcellgeneexpressioninvitro.10WGCNAidentified14modulesofgeneswhichhadsimilarpatternsofexpressionacrossthe11conditions comprising the twodata sets (Figure S1A,B).Thebluemodulewasparticularly interesting since expression of this module’s eigengene (the geneconsideredtobemostrepresentativeoftheoverallmodule)22correlatedverystronglywithbothanti-IgMstimulation(especiallyat210and390minutes)andLNderivation(Figure 1A). There was also a very strong positive correlation between the kME (aconnectivity measure which reflects the “centrality” of each gene to the module) ofindividualgenescomprisingthebluemoduleandvariationingeneexpressionbetweenLNandother tissues, and followinganti-IgMstimulation invitro (Figure 1B).Overall,WGCNA identified amodule of genes (the bluemodule)with very strong co-ordinateregulation in vitro following sIgM stimulation, and in LN samples compared to other

6
tissues, indicating that thismodule comprises genesmost strongly induced followingantigenengagementinvivo.To probe the biological pathways represented by the blue module, we identifiedenriched gene ontology terms and organized these into a “TreeMap” using REVIGO(Figure1C).23Enrichedtermsincluded“regulationofcellcycle”consistentwiththeideathat the LN is the major site for CLL cell proliferation in vivo. However, the mostcommonly over-represented ontologies were associated with stress responses,including the endoplasmic reticulum-located unfolded protein response (UPR),metabolismandRNAtranslation.Weperformeda similar analysisusing IngenuityPathwayAnalysis (IPA) (Figure S2).This revealed that the blue module comprised networks linked to protein synthesis,energy production and amino-acid/nucleic acid metabolism. For example, network 3comprisedmultiple eIFs (eg, eIF3B, eIF4A1, eIF4E) and factors involved in ribosomebiogenesis(eg,NOLC1,NOP10).IPA“upstreamanalysis”identifiedMYCasthestrongestdriverofthebluemodule(P=1.91x10⁻³⁰)andthehighestscoringnetwork(network1)was a MYC-centered network with linkage to metabolism (eg, LDHA, ENO1, MCT1,IDH3A)andRNAtranslation(eg,ABCE1,NPM1),includingDDX21,recentlyidentifiedascentralcoordinatorofribosomebiogenesis.24Finally, we examined the functions of individual genes comprising the blue module(Table S2). Nearly half of the 50 highest kME genes with known function hadestablishedorpotential linkstoproteinsynthesis, includingfactorsinvolvedinamino-acid transport (SLC3A2, SLC7A5), ribosome biosynthesis (BYSL, RRP12, RPF2) andtranslationinitiation/termination(eIF3B,ABCE1andBZW2).Overall, network analysis revealed prominent regulation of biosynthetic and stressresponsepathwaysfollowingBCRengagementinvivo.RegulationoftheUPRandMYCisconsistentwithourpreviousreportsdemonstratinginductionofapartialUPRandMYCinCLLcellsfollowingsIgMstimulation invitro,andinCLLcellsinLN.16,25However,animportantnew findingwas theparticularlystrongregulationofgenesassociatedwithRNAtranslation.SincenetworkanalysissuggestedaprominentroleforincreasedRNAtranslationfollowingengagementoftheBCRofCLLcellsinvivowenextinvestigateditspotentialregulationbyanti-IgMinvitro.sIgM stimulation increases global protein synthesis in signal-responsive CLL samples invitroWeusedmetaboliclabelingtoquantifyeffectsofsIgMstimulationonRNAtranslationinCLL samples. sIgM signaling capacity is variable in CLL and we therefore selected acohortofsamples(n=21),allclassifiedassIgMsignalcompetentbasedonCa2+responsefollowing soluble anti-IgM stimulation.2 This cohort comprised U-CLL samples andrepresentatives of the smaller proportion of signal-responsiveM-CLL. Effects on RNAtranslationwereanalyzedusingabead-boundformofanti-IgMwhichinducesrelativelystrong signaling responses compared to soluble antibody,21,25 andwith “fresh” (n=11)andcryopreserved(n=10)samples tocontrol forpotentialeffectsofstorage.CLLcellsundergo variable levels of spontaneous apoptosis in vitro so cells were additionallytreatedwithacaspaseinhibitor(Q-VD-OPh)tominimizepotentiallyconfoundingeffectsofapoptosis.Metabolic labeling demonstrated that anti-IgM beads increased RNA translation in allsamples (Figure 2A,Figure S3A).Asexpected for thiscohortselectedon thebasisof

7
retainedsignal-responsiveness,thefoldincreaseinanti-IgM-inducedmetaboliclabelingwas not significantly different between U-CLL and M-CLL (Figure S3B). Anti-IgM-responses were also not significantly influenced by cryopreservation (Figure S3C).Therefore,allsubsequentexperimentswereperformedusingfrozensamples.We also investigated anti-IgM-induced RNA translation in four additional M-CLLsamples which were considered as sIgM non-responsive based on Ca2+ mobilizationanalysis.2Anti-IgMbeadsincreasedmetaboliclabelinginthesesamplesbuttheoverallresponse (~2-fold mean induction) was clearly lower than for signaling responsivesamples(~6-fold)(FigureS3D).EffectofSYKandBTKkinaseinhibitiononanti-IgM-inducedRNAtranslationWeusedtamatiniband ibrutinib to investigatepotentialrolesofSYKandBTK inanti-IgM-induced RNA translation. SYK is one of the first kinases activated following BCRstimulation and co-ordinates activation of downstream signaling within thesignalosome,includingBTK.Inhibitoryeffectsofibrutinibwerepartial,decreasinganti-IgM-inducedmetabolic labelling by ~60%whereas tamatinib completely blocked theresponse (Figure 2B). Tamatinib also modestly reduced “basal” protein synthesis incellstreatedwithcontrolbeads.Analysisofcelldeathdemonstratedthattamatinibandibrutinib did not significantly reduce cell viability under our experimental conditionswhereQ-VD-OPhwasaddedtodecreasecaspaseactivation(FigureS4).Parallel analysis of signaling confirmed inhibition of anti-IgM-induced ERK1/2phosphorylationintheseexperiments(Figure2C,D).Inaddition,ibrutinibortamatinibeffectively inhibitedanti-IgM-inducedphosphorylationofp70S6K, apositive regulatorofRNAtranslationwhichisphosphorylatedbymTORC1downstreamofthePI3KàAKTpathway(Figure2C,D).26SinglecellanalysisofRNAtranslationWe extended analysis by using a recently described flow cytometry assay to quantifyRNA translation on a single cell basis.27 In this assay, cells were incubated with apuromycinanalogue (OPP)which is incorporated intonascentpolypeptidechainsandthen fluorescently labeled via “Click Chemistry” (Figure 3A). OPP-labelling wascombined with staining with anti-CD19 and anti-CD5 antibodies to enable separatequantificationofproteinsynthesisinCLLcellsandnon-malignantTcellswhicharealsopresentatvariablelevelsinPBMCsamplesfromCLLpatients(FigureS5).InCLLcells,anti-IgMbeadssignificantlyincreasedOPP-labelingby~3-foldonaverage(Figure 3B). We also tested responses to CpG-ODN which is a relatively strongstimulating agent for CLL cells.28 CpG-ODN increasedOPP-labeling to a greater extentthananti-IgM(~8-foldonaverage).Weuseda“B-cellspecific”CpG-ODN(2006)intheseexperimentsand,asexpected,neitherCpG-ODN,oranti-IgM,increasedOPP-labelinginTcells(Figure3B)demonstratingspecificityoftheresponse.29Similar tometabolic labelling, OPP-labelling in CLL cellswas significantly reduced byibrutinibandtamatinib(Figure3D).Tamatinibreducedanti-IgM-inducedOPP-labelingbelowthelevelofunstimulatedcells.Effectsofibrutinibwerepartial(~50%reduction).ThedrugshadnosignificanteffectonOPP-labelinginTcells(Figure3C).AnalysisusingOPP-labellingconfirmsthatsIgMstimulationofCLLcellsincreasesRNAtranslationanddemonstratesthatthisoccurswithinthemalignantclone.

8
WealsousedtheOPP-labelingassaytoinvestigatetheeffectsofvaryingBCRsignalingstrengthby comparing responses toanti-IgMbeadsandsolubleanti-IgM. InCLLcells,responses to soluble anti-IgM are generallyweak and short-lived, even in responsivesamples.Solubleanti-IgMsignificantlyincreasedRNAtranslation,buttoalowerextentthan bead-bound antibody (Figure 3B). Therefore, increased RNA translation in CLLcellsissensitivetosignalstrengthandefficientactivationrequiresprotracted/strongersIgM-inducedsignaling.RegulationofeIFsandPDCD4inCLLandnormalBcellsWe investigated the mechanisms that mediated anti-IgM-induced RNA translation inCLL cells by analyzing expression of key RNA translation initiation factors. DirectanalysisoftheVallatdataset10confirmedthatanti-IgMincreasedexpressionofeIF4A1,eIF4G1 andeIF3bRNAs (Figure S6), as initially revealedbynetworkanalysis (FigureS2).Immunoblotanalysisdemonstratedthatbead-boundanti-IgMincreasedexpressionof eIF4A and eIF4G1 at the protein level. However,we did not detect any changes ineIF3b protein expression.We also showed that anti-IgM significantly down-regulatedexpressionofPDCD4,anegativeregulatorofeIF4A(Figure4A,B)30althoughtherewasnochangeinPDCD4RNAexpressionfollowinganti-IgMtreatment(FigureS6).We also investigated RNA translation and protein modulation in normal cells usingperipheralBcells from two independentdonorsasadirect comparator forCLLbloodsamples. As expected the vast majority of naïve (CD27-), and a major proportion ofmemory(CD27+)BcellsexpressedIgM31and,overall,theproportionofIgM-expressingCD19+ cells was 75 and 85% for donor 1 and 2, respectively (Figure S7). Anti-IgMincreasedOPP-labellingofnormal(CD19+CD5-)Bcellsinbothsamples,withnoeffectonCD19-CD5+Tcells(Figure4C).IncontrasttoCLLcells,solubleanti-IgMwasaneffectiveinducerofRNAtranslationinnormalBcells.To investigate protein expression, we isolated CD19+ B cells (>99% purity) andstimulatedthesecellswithsolubleanti-IgM.Anti-IgMdecreasedexpressionofPDCD4inbothsamples,butincontrasttoCLLcells,therewerenosubstantialchangesineIF4A1oreIF4G1expression(Figure 4D).Analysisofphospho-ERK1/2andphospho-p70S6Kconfirmed activation of signaling pathways. Thus, sIgM stimulation increases RNAtranslationinbothnormalBcellsandCLLcells.However,responsesinCLLcellsappeartoinvolveabroaderreprogrammingofthetranslationmachinerycomparedtonormalBcells.Increased RNA translation contributes to increased MYC expression following sIgMstimulationWeinvestigatedtheeffectofbead-boundanti-IgMontranslationofRNAencodingMYC.WeselectedMYCasatargetsincewehaveshownpreviouslythatMYCisexpressedinproliferation centers (PC)ofCLLLNsand is induced followinganti-IgMstimulationofCLLcellsinvitro.16MYChasalsobeenshowntobesubjecttotighttranslationcontrolinothercellsystems.14,15AnalysisofMYCRNAtranslationwasbasedonpolysomeprofiling.Analysisofsucrosegradients revealed that the overall abundance of polysome-associatedRNAswas verylowinun-stimulatedCLLcells(FigureS7).ConsistentwithmetaboliclabelingandOPP

9
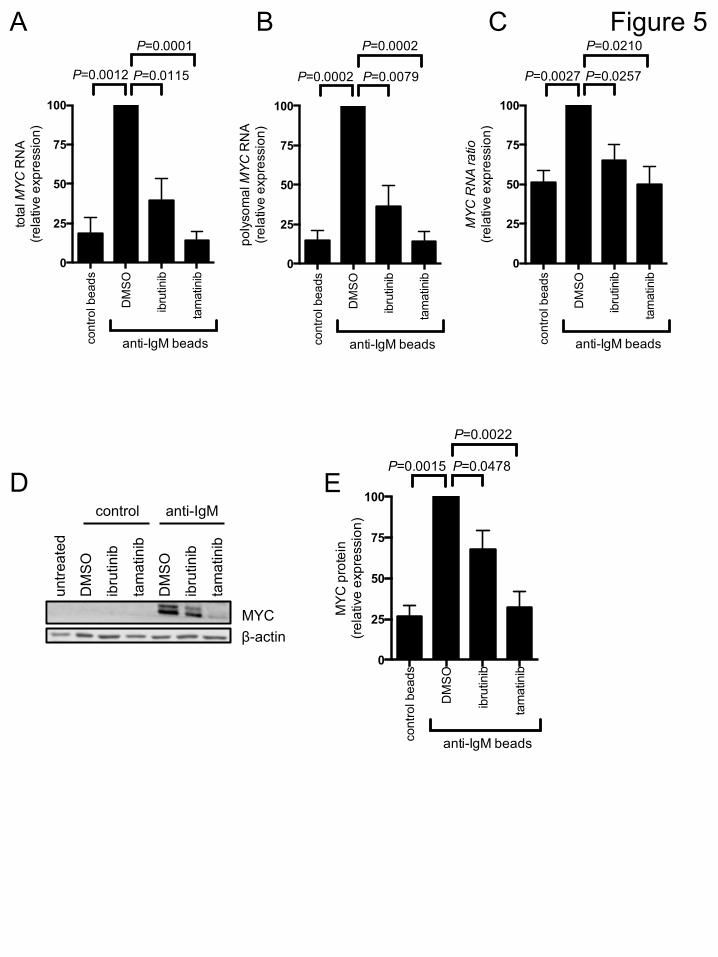
assays,therewasanincreaseintheabundanceofpolysome-associatedRNAsfollowingsIgMstimulationalthoughthiswasmodestandnotclearlyobservedinallsamples.To analyze MYC expression, we quantifiedMYC RNA in fractions from the polysomeprofiles using Q-PCR. Consistent with previous studies demonstrating transcriptionalincreases10,16,anti-IgMincreasedthetotalamountofMYCRNAdetectedinallfractions(comparefirsttwobarsinFigure5A).TherewasalsoaclearincreaseintheamountofMYC RNApresent in polysomes demonstrating that anti-IgM also increasedMYC RNAtranslation. This was observed regardless of whether we determined the absoluteamountofMYCRNAinpolysomefractions(Figure5B)ortheproportionofpolysome-associatedMYCRNA(Figure 5C)whichmeasures translationchanges, independentofchangesintheoveralllevelsofMYCRNA.ConsistentwithincreasedMYCtranslationandtranscription, anti-IgM significantly increasedMYC protein expression (Figure 5D,E).Ibrutinib and tamatinib significantly reduced anti-IgM-inducedMYC RNA translation(andtranscription)(Figure5A-C).SimilartoeffectsonoverallRNAtranslation,effectsof ibrutinib were partial, whereas tamatinib had more pronounced effects. Thecompounds also significantly inhibited anti-IgM-induced MYC protein expression(Figure5D,E).DISCUSSIONRNAtranslationisakeycancer-associatedpathwaybuthasbeenrelativelylittlestudiedinB-cellmalignancies.HereweshowforthefirsttimethatstimulationoftheBCRofCLLcellspromotesRNAtranslationinvitroandinvivo.IncreasedRNAtranslationislikelytocontribute toantigen-inducedCLLcell accumulationviaeffectsonbothglobalproteinsynthesisandexpressionofspecificoncoproteins, includingMYC.Thisstudythereforereveals an important new pro-malignancy pathway with clear relevance for drugtargeting.We used an integrated bioinformatical approach to probe transcriptional signaturesinduced by antigen engagement of CLL cells in LN in vivo. Previous analysis of cellsisolated from different compartments highlighted BCR and NF-κB signaling, andmodulation of cell cycle, as key pathways activated in LN.17 As expected, there wasoverlap between the genes and pathways identified in our analysis and this previouswork, including identification of MYC as a key driver of transcriptional responses.However, the important new finding from our analysis was the extent to which theresponseinvivowasdominatedbygeneslinkedtoRNAtranslation.Forexample,manyofthe“top50”bluemodulegeneshaveclearlinkstotranslationinitiationorribosomeassembly.Ourstudies invitro focusedonsignal-responsivesamples,demonstratingthatanti-IgMincreasedRNAtranslationinsamplesfromboththeU-CLLandM-CLLsubsets.Althoughanalysis was restricted to a few samples, anti-IgM-induced RNA translation wassubstantially lower in samples that were considered non-responsive on the basis ofcalciummobilization. Similar to other signaling readouts,25 RNA translation was alsolower incells treatedwithsolubleanti-IgM.Furtherstudiesare required toprobe therelationshipbetweenincreasedRNAtranslationandothersIgMsignalingresponses,butincreased RNA translation is likely to be part of a constellation of responses co-regulated downstream of sIgM in signal-responsive samples and sensitive to signalstrength.1Inadditiontoanalyzingglobalproteinsynthesis,wealsoshowedforthefirsttimethatMYCisatargetfortranslationalregulationinCLL.WeconfirmedinductionofMYCRNA

10
following sIgM stimulation,10,16 but also showed that increased RNA translationcontributed to induction of MYC protein. Interestingly, in addition to beingtranslationally regulated, MYCmay also play a role in up-regulation of translation aspartof apositive feedback loop.15 For example,MYC is amajor regulatorof ribosomebiosynthesis32andcanalso induceeIFexpression.33,34MYC-mediatedeffectscouldalsoinvolve translational modulation via miRNAs; BCR stimulation modulates miRNAexpressioninCLLcellsandMYCisamasterregulatorofmiRNAnetworks.35,36Results with inhibitors are consistent with a pivotal role for SYK in mediatingtranslationalinductiondownstreamoftheBCRsincetamatinibveryeffectivelyblockedanti-IgM-inducedtranslation,includingofMYCRNA.Responsestoibrutinibwerepartial,perhaps indicating bifurcation of translation-promoting pathways between SYK andBTK. However, these results should be interpreted with caution and further work isrequired to “map” translational regulation signalingpathways.Forexample, tamatiniband ibrutinibmayhave “off-target”effects.37,38Although in linewithotherstudies, thedrug concentrations used for our studies exceed plasma concentrations followingadministration to patients. Thus, furtherwork is also required to determinewhetheribrutinib,forexample,resultsindecreasedRNAtranslationinpatients.We investigated the mechanisms by which sIgM stimulation caused increased RNAtranslation in CLL and normal B cells. A recent study demonstrated that anti-IgM-inducedtranslationinnormalsplenicBcellswasassociatedwithdecreasedexpressionoftheeIF4AinhibitorPDCD4andincreasedeIF4AandeIF4E5’CAPcomplexformation,but without changes in the overall expression of these eIFs.39 Similarly, in our studyusing normal blood B cells, increased translation was associated with PDCD4 down-modulation, without changes in eIF4A1 or eIF4GI. By contrast, in CLL cells, anti-IgMresulted in clear increases in expression of eIF4A and eIF4G1, as well as decreasedPDCD4(confirmingpreviousobservationsinCLLcellsbyPerrotetal).11Thus,althoughBCRstimulationincreasedRNAtranslationinbothCLLandnormalBcells,mechanismsof regulation appear to differ between these cell typeswithCLL responses associatedwithbroadermodulationofthetranslationmachinery.In conclusion, BCR stimulation of CLL cells triggers a profound increase in RNAtranslation in vitro and in vivo. This response is likely to be important for cellaccumulation (via effects on both global protein synthesis and expression ofoncoproteins, includingMYC) and its inhibitionmight contribute to clinical effects ofkinase inhibitors, such as ibrutinib. Direct inhibition of protein synthesis has beenproposed as a therapeutic approach for hematologicalmalignancies and various RNAtranslation inhibitors accelerate apoptosis of CLL cells in vitro.9,40,41 However,development of this approach will require targeting of cancer-critical pathways tominimize toxicity towards normal cells. Differences in mechanisms of translationalregulationdownstreamoftheBCRinCLLandnormalBcellsmayprovideopportunitiesforsuchselectivetherapeuticattack.ConflictofInterestTheauthorsdeclarenocompetingfinancialinterests.Acknowledgements

11
We thank the patients involved in this study for the kind gift of samples. We thankProfessorSimonMorley(UniversityofSussex,UK) forthekindgiftofanti-eIF4G1andanti-eIF4A antibodies.We are also very grateful for the support of Kathy Potter, IslaHenderson,IanTracy,JoanneCowanandValentinaIadevaia.Thisstudywassupportedby the Gerald Kerkut Charitable Trust, Leukemia and Lymphoma Research, CancerResearch UK, Worldwide Cancer Research, CLL Global Research Foundation and theExperimental Cancer Medicine Centre. MSH gratefully acknowledges financialsponsorshipfromtheJoseCastillejoNationalProgrammefromtheSpanishMinistryofEducation.AuthorcontributionsAY, ST, BVA, AL, SK,MSH, EL andMI performed research and analyzed data; AY, AT,SDW, AEW, AJS, FKS, FF, MJC and GP designed the research and analyzed data; FFprovidedpatientsamplesandanalyzedclinicaldata;AYandGPwrotetheinitialdraftofthe manuscript; and all authors contributed to the modification of the draft andapprovedthefinalsubmission.References1. PackhamG,KrysovS,AllenA,etal.TheoutcomeofB-cellreceptorsignalinginchronic lymphocytic leukemia: proliferation or anergy. Haematologica.2014;99(7):1138-1148.2. Mockridge CI, Potter KN, Wheatley I, Neville LA, Packham G, Stevenson FK.ReversibleanergyofsIgM-mediatedsignalinginthetwosubsetsofCLLdefinedbyVH-genemutationalstatus.Blood.2007;109(10):4424-4431.3. Byrd JC,FurmanRR,CoutreSE,etal.TargetingBTKwith ibrutinib in relapsedchroniclymphocyticleukemia.NEnglJMed.2013;369(1):32-42.4. WiestnerA.Emergingroleofkinase-targetedstrategies inchronic lymphocyticleukemia.Blood.2012;120(24):4684-4691.5. SchwanhausserB,BusseD,LiN,etal.Globalquantificationofmammaliangeneexpressioncontrol.Nature.2011;473(7347):337-342.6. Li JJ, Bickel PJ, BigginMD. Systemwide analyses have underestimated proteinabundancesandtheimportanceoftranscriptioninmammals.PeerJ.2014;2:e270.7. LandonAL,MuniandyPA,ShettyAC,etal.MNKsactasaregulatoryswitch foreIF4E1andeIF4E3drivenmRNAtranslationinDLBCL.NatCommun.2014;5:5413.8. HorvilleurE, SbarratoT,Hill K, et al. A role for eukaryotic initiation factor 4BoverexpressioninthepathogenesisofdiffuselargeB-celllymphoma.Leukemia.2013.9. Willimott S, Beck D, Ahearne MJ, Adams VC, Wagner SD. Cap-translationinhibitor,4EGI-1,restoressensitivitytoABT-737apoptosisthroughcap-dependentand-independent mechanisms in chronic lymphocytic leukemia. Clin Cancer Res.2013;19(12):3212-3223.10. Vallat LD, Park Y, Li C, Gribben JG. Temporal genetic program followingB-cellreceptorcross-linking:alteredbalancebetweenproliferationanddeath inhealthyandmalignantBcells.Blood.2007;109(9):3989-3997.11. PerrotA,PionneauC,NadaudS,etal.AuniqueproteomicprofileonsurfaceIgMligationinunmutatedchroniclymphocyticleukemia.Blood.2011;118(4):e1-15.12. Ruggero D, Montanaro L, Ma L, et al. The translation factor eIF-4E promotestumor formation and cooperates with c-Myc in lymphomagenesis. Nat Med.2004;10(5):484-486.13. PickeringBM,WillisAE.The implicationsofstructured5'untranslatedregionsontranslationanddisease.SeminCellDevBiol.2005;16(1):39-47.

12
14. De Benedetti A, Graff JR. eIF-4E expression and its role in malignancies andmetastases.Oncogene.2004;23(18):3189-3199.15. Pelletier J, Graff J, Ruggero D, Sonenberg N. Targeting the eIF4F translationinitiationcomplex:acriticalnexusforcancerdevelopment.CancerRes.2015;75(2):250-263.16. Krysov S, Dias S, Paterson A, et al. Surface IgM stimulation induces MEK1/2-dependent MYC expression in chronic lymphocytic leukemia cells. Blood.2012;119(1):170-179.17. Herishanu Y, Perez-Galan P, Liu D, et al. The lymph node microenvironmentpromotes B-cell receptor signaling, NF-kappaB activation, and tumor proliferation inchroniclymphocyticleukemia.Blood.2011;117(2):563-574.18. Hallek M, Cheson BD, Catovsky D, et al. Guidelines for the diagnosis andtreatmentofchronic lymphocytic leukemia:areport fromthe InternationalWorkshopon Chronic Lymphocytic Leukemia updating the National Cancer Institute-WorkingGroup1996guidelines.Blood.2008;111(12):5446-5456.19. Matutes E, Catovsky D. The value of scoring systems for the diagnosis ofbiphenotypic leukemia and mature B-cell disorders. Leuk Lymphoma. 1994;13 Suppl1:11-14.20. LanhamS,HamblinT,OscierD,IbbotsonR,StevensonF,PackhamG.Differentialsignaling via surface IgM is associated with VH gene mutational status and CD38expressioninchroniclymphocyticleukemia.Blood.2003;101(3):1087-1093.21. CoelhoV,KrysovS,SteeleA,etal.IdentificationinCLLofcirculatingintraclonalsubgroups with varying B-cell receptor expression and function. Blood.2013;122(15):2664-2672.22. LangfelderP,HorvathS.WGCNA:anRpackageforweightedcorrelationnetworkanalysis.BMCBioinformatics.2008;9:559.23. SupekF,BosnjakM,SkuncaN,SmucT.REVIGOsummarizesandvisualizeslonglistsofgeneontologyterms.PLoSOne.2011;6(7):e21800.24. CaloE,FlynnRA,MartinL,SpitaleRC,ChangHY,WysockaJ.RNAhelicaseDDX21coordinatestranscriptionandribosomalRNAprocessing.Nature.2015;518(7538):249-253.25. Krysov S SA, Coelho V, Sanchez Hidalgo M, Carter M, Potter KN, Kennedy B,Duncombe AS, Ashton-Key M, Forconi F, Stevenson FK, Packham G. Stimulation ofsurfaceIgMofchroniclymphocyticleukemiacellsinducesanunfoldedproteinresponsedependentonBTKandSYK.Blood.2014;Inpress.26. Wullschleger S, LoewithR,HallMN. TOR signaling in growth andmetabolism.Cell.2006;124(3):471-484.27. LiuJ,XuY,StoleruD,SalicA.Imagingproteinsynthesisincellsandtissueswithanalkyneanalogofpuromycin.ProcNatlAcadSciUSA.2012;109(2):413-418.28. LongoPG,LaurentiL,GobessiS,etal.TheAktsignalingpathwaydeterminesthedifferent proliferative capacity of chronic lymphocytic leukemia B-cells from patientswithprogressiveandstabledisease.Leukemia.2007;21(1):110-120.29. IhoS,YamamotoT,TakahashiT,YamamotoS.Oligodeoxynucleotidescontainingpalindromesequenceswithinternal5'-CpG-3'actdirectlyonhumanNKandactivatedTcellstoinduceIFN-gammaproductioninvitro.JImmunol.1999;163(7):3642-3652.30. YangHS,Knies JL, StarkC,ColburnNH.Pdcd4suppresses tumorphenotype inJB6cellsbyinhibitingAP-1transactivation.Oncogene.2003;22(24):3712-3720.31. KleinU,RajewskyK,KuppersR.Humanimmunoglobulin(Ig)M+IgD+peripheralblood B cells expressing the CD27 cell surface antigen carry somatically mutatedvariable regiongenes:CD27asageneralmarker for somaticallymutated (memory)Bcells.JExpMed.1998;188(9):1679-1689.32. vanRiggelen J,YetilA,FelsherDW.MYCasa regulatorof ribosomebiogenesisandproteinsynthesis.NatRevCancer.2010;10(4):301-309.

13
33. LinCJ,CencicR,MillsJR,RobertF,PelletierJ.c-MycandeIF4Farecomponentsofa feedforward loop that links transcription and translation. Cancer Res.2008;68(13):5326-5334.34. SchmidtEV.The roleof c-myc in regulationof translation initiation.Oncogene.2004;23(18):3217-3221.35. Mraz M, Kipps TJ. MicroRNAs and B cell receptor signaling in chroniclymphocyticleukemia.LeukLymphoma.2013;54(8):1836-1839.36. Bui TV,Mendell JT.Myc:Maestro ofMicroRNAs.GenesCancer. 2010;1(6):568-575.37. Dubovsky JA, Beckwith KA, Natarajan G, et al. Ibrutinib is an irreversiblemolecular inhibitor of ITK driving a Th1-selective pressure in T lymphocytes. Blood.2013;122(15):2539-2549.38. GaoW,WangM,WangL,etal.SelectiveantitumoractivityofibrutinibinEGFR-mutantnon-smallcelllungcancercells.JNatlCancerInst.2014;106(9).39. Steinhardt JJ, Peroutka RJ, Mazan-Mamczarz K, et al. Inhibiting CARD11translation during BCR activation by targeting the eIF4A RNA helicase. Blood.2014;124(25):3758-3767.40. Chen R, Guo L, Chen Y, Jiang Y, Wierda WG, Plunkett W. Homoharringtoninereduced Mcl-1 expression and induced apoptosis in chronic lymphocytic leukemia.Blood.2011;117(1):156-164.41. Lucas DM, Edwards RB, Lozanski G, et al. The novel plant-derived agentsilvestrol has B-cell selective activity in chronic lymphocytic leukemia and acutelymphoblasticleukemiainvitroandinvivo.Blood.2009;113(19):4656-4666.

14
FigurelegendsFigure1.AnalysisofgeneexpressionnetworksusingWGCNA(A) Correlations between consensus modules identified by WGCNA and specificexperimental conditions. The y-axis shows the 14 consensus modules and the x-axisshowsthe11experimentalconditionsdefinedwithinthetwoGEPstudies.10,17Theheatmap shows the correlation between the expression of each module’s eigengene andexperimental condition; cells show correlation coefficient (top) and corresponding P-value(bottom).Cellsarecolor-codedusingcorrelationvaluesaccordingtoscaleontheright.FortheVallatetalstudy;US=nostimulationandS=anti-IgMstimulated.Timeofstimulation (60,90,210and390minutes) is indicated.For theHerishanuet al study,sourceofsampleisshown;peripheralblood(PB),bonemarrow(BM),lymphnode(LN).(B)CorrelationsbetweenkMEandfolddifferenceinexpressionbetweenLNcomparedto other sites (top) and following anti-IgM stimulation in vitro (bottom) for the 344genescomprisingthebluemodule.(C)“TreeMap”viewofover-representedGOtermsinthebluemodule,generatedusingREVIGO.EachrectanglerepresentsaclusterofrelatedGOterms.Therepresentativesare joined into“superclusters”of looselyrelatedterms,visualizedwithdifferentcolours.SizeoftherectanglesreflectsBHadjustedp-values.Figure2.Effectofanti-IgMonRNAtranslationinCLLcells(A) Signaling responsive CLL samples (n=21) were incubatedwith anti-IgM beads orcontrolbeads,orleftuntreatedasacontrolfor24hours.RNAtranslationwasanalyzedbyquantifyingmetaboliclabeling.(B)Asin(A),exceptcellswerepretreatedfor1hourwithibrutinib(n=5)ortamatinib(n=4),orDMSOasacontrol,priortoadditionofanti-IgM or control beads. Graphs show fold increase inmetabolic labeling (means±SEM)compared to untreated cells (set to 1.0). (C,D) Immunoblot analysis ofphosphorylated/total p70S6K and ERK1/2 expression at 30 and 60 minutes post-stimulation with anti-IgM beads (ibrutinib, n=6; tamatinib, n=5). (C) Representativeimmunoblots.(D)Quantitationofmultipleexperiments;graphsshowp70S6K/ERK1/2phosphorylation (means ±SEM) as a percentage of control (DMSO) anti-IgM-treatedcells.Statisticalcomparisonsbetweengroupsareshown(Student’st-test).Figure3.AnalysisofRNAtranslationusingOPP-labeling(A)OverviewofexperimentalprocedureforOPP-labeling.(B)CLLsamples(n=13)weretreatedwith soluble anti-IgM or anti-IgM beads, control antibodies, CpG-ODN2006 orleft untreated for 24 hours prior to OPP-labeling. Graphs show fold increase in OPP-labeling (means ±SEM) in CLL (CD19+CD5+) and T cells (CD19-CD5+) with values foruntreated CLL cells set to 1.0. Statistical comparisons between untreated CLL and Tcells, andbetweencontrolandanti-IgM treatedCLLcellsareshown(Student’s t-test).(C,D)Asin(B),exceptcellswerepretreatedfor1hourwithibrutinib(n=5)ortamatinib(n=5), or DMSO as a control, prior to addition of anti-IgM/control antibodies. GraphsshowfoldincreaseinOPP-labeling(means±SEM)forTcells(C)andCLLcells(D)withvaluesforuntreatedcellssetto1.0.Statisticalcomparisonsbetweengroupsareshown(Student’st-test).Figure4.Effectofanti-IgMoneIFexpressionandcomparisontonormalBcells(A,B) CLL samples (n=12)were stimulatedwith anti-IgM beads, control beads or leftuntreated. After 24 hours, expression of eIF4A, eIF4G1, eIF3B, PDCD4 and HSC70(loadingcontrol)wasanalyzedbyimmunoblotting.(A)Representativeimmunoblot.(B)Quantitationofmultipleexperiments;graphshowsexpression(means±SEM)relativetocontrolbeads.Statisticalcomparisonsbetweengroupsareshown(Student’st-test).(C)PBMCs from healthy donors were treated with soluble anti-IgM or anti-IgM beads,controlantibodies,CpG-ODN2006or leftuntreated for24hoursprior toOPP-labeling.

15
GraphsshowfoldincreaseinOPP-labeling(means±SEM)inB(CD19+CD5-)andTcells(CD19-CD5+)withvalues foruntreatedBcells set to1.0 foreachdonor. (D)NormalBcellswereisolatedfromPBMCsbynegativeselectionandstimulatedwithsolubleanti-IgMorcontrolantibody,ofleftuntreatedasacontrol,for24hours.ExpressionofeIF4A,eIF4G1, eIF3B, PDCD4, phospho/total-P70S6K and phospho/total-ERK1/2 wereanalyzed by immunoblotting. Quantification of relative expression/phosphorylation isshownundertheblotimages.Figure5.Anti-IgMregulationofMYCRNAtranscriptionandtranslationCLL samples were pretreated for 1 hour with ibrutinib or tamatinib, or DMSO as acontrol, and then incubated with anti-IgM or control beads for 24 hours. (A-C)Monosome- and polysome-associatedMYC RNA was quantified using Q-PCR; Graphsshow totalMYCRNA (monosomalpluspolysomal) (A),polysome-associatedMYCRNA(B)andpolysome/monosomeratio forMYCRNA (C) for ibrutinb (n=5)and tamatinib(n=6).(D,E)MYCandβ-actin(loadingcontrol)proteinanalysisbyimmunoblotting.(D)Representative immunoblots and (E) quantitation of multiple experiments for 4samples. Graphs show mean fold increases (±SEM) with values for anti-IgM/DMSO-treated cells set 100%. Statistical comparisons between anti-IgM/DMSO-treated cellsareshown(Student’st-test).

Vallatetal Herishanuetal
- 1 . 0 - 0 . 5 0 . 0 0 . 5 1 . 0
- 2 0
- 1 0
0
1 0
2 0
G S . L N C L L
Z.k
ME
blu
e
- 1 . 0 - 0 . 5 0 . 0 0 . 5 1 . 0
- 2 0
- 1 0
0
1 0
2 0
G S . a n t i - I g M ( 3 9 0 m i n )
Z.k
ME
blu
e
r=0.59, P<2x10-16
r=0.76, P<2x10-16
Zk.M
Ebl
ue
Zk.M
Ebl
ue
GS.LN CLL
GS.anti-IgM (390min)
A
B C
Figure 1

Figure 2
untre
ated
cont
rol b
eads
anti-
IgM
bea
ds
012345678
met
abol
ic la
belin
g (fo
ld c
hang
e)P<0.0001
met
abol
ic la
belin
g (c
pm/1
x106
cells
)
513
505
566
583
526
594
348
494
558
561
483
523
351B
280B 66
448
2C 610
495B 66
864
1C50
1C59
5B
0
5000
10000
15000
20000 untreated
control beads
anti-IgM beads
untre
ated
cont
rol b
eads
anti-
IgM
bea
ds
012345678
met
abol
ic la
belin
g (fo
ld c
hang
e)
P=0.3125
untre
ated
DM
SO
ibru
tinib
tam
atin
ib
DM
SO
ibru
tinib
tam
atin
ib
0
1
2
3
4
5
6
met
abol
ic la
belin
g (fo
ld c
hang
e)
control beads anti-IgM beads
P=0.1870
P=0.0178 P=0.0434
P=0.0287
P=0.0387A B
Unt
reat
ed
cont
rol b
eads
DM
SO
ibru
tinib
tam
atin
ib
0
20
40
60
80
100
p70S
6K p
hosp
hory
latio
n(re
lativ
e ex
pres
sion
)
anti-IgM beads
P=0.0067 P<0.0001
P=0.0082
Unt
reat
ed
cont
rol b
eads
DM
SO
ibru
tinib
tam
atin
ib
0
20
40
60
80
100
pER
K ph
osph
oryl
atio
n(re
lativ
e ex
pres
sion
)
anti-IgM beads
P<0.0001 P=0.0026
P=0.0231
30 minutes
untre
ated
cont
rol b
eads
DM
SO
ib
rutin
ib
tam
atin
ib
anti-IgM beads
untre
ated
co
ntro
l bea
ds
DM
SO
ib
rutin
ib
tam
atin
ib
phospho-p70S6K
total p70S6K
phospho-ERK1/2
total ERK1/2
60 minutes
anti-IgM beads
C
D

Figure 3 Incubate cells with anti-IgM/control
antibodies ±drug pre-treatment
Flow cytometry
Incubate cells with OPP for 30 minutes
Wash and fix cells
Conjugate incorporated OPP with Alexa-Fluor-647
Stain cells with anti-CD19 and anti-CD5
C
A B
untre
ated
solu
ble
cont
rol
solu
ble
anti-
IgM
cont
rol b
eads
anti-
IgM
bea
dsC
pG-O
DN
untre
ated
solu
ble
cont
rol
solu
ble
anti-
IgM
cont
rol b
eads
anti-
IgM
bea
dsC
pG-O
DN
0
1
2
3
4
51015
OPP
-labe
ling
(fold
cha
nge)
CD19+CD5+
CD19-CD5+
P=0.0390
P=0.
0013
P=0.0017
P=0.
0116
untre
ated
untre
ated
DM
SO
ibru
tinib
tam
atin
ib
untre
ated
DM
SO
ibru
tinib
tam
atin
ib
0
1
2
3
4
5
OPP
-labe
ling
(fold
cha
nge)
control beads anti-IgM beads
P=0.0193 P=0.0372
P=0.0004
untre
ated
untre
ated
DM
SO
ibru
tinib
tam
atin
ib
untre
ated
DM
SO
ibru
tinib
tam
atin
ib
0
1
2
3
4
5
OPP
-labe
ling
(fold
cha
nge)
control beads anti-IgM beads

untre
ated
solu
ble
cont
rol
solu
ble
anti-
IgM
cont
rol b
eads
anti-
IgM
bea
dsC
pG-O
DN
untre
ated
solu
ble
cont
rol
solu
ble
anti-
IgM
cont
rol b
eads
anti-
IgM
bea
dsC
pG-O
DN
0
2
4
6
8
OPP
-labe
ling
(fold
cha
nge)
untre
ated
solu
ble
cont
rol
solu
ble
anti-
IgM
cont
rol b
eads
anti-
IgM
bea
dsC
pG-O
DN
untre
ated
solu
ble
cont
rol
solu
ble
anti-
IgM
cont
rol b
eads
anti-
IgM
bea
dsC
pG-O
DN
0
2
4
6
8
10O
PP-la
belin
g (fo
ld c
hang
e)
CD19-CD5+
CD19+CD5-
Figure 4
D
C
Donor2
untreated
untreated
control
an3-IgM
P70S6K
phospho-ERK
ERK
phospho-P70S6K
β-ac3n
11.201.60
11.556.00
control
An3-IgM
eIF4GI
PDCD4
eIF4A
HSC70
eIF3b11.091.06
10.670.92
11.670.74
11.671.26
untreated
control
an3-IgM
P70S6K
phospho-ERK
ERK
phospho-P70S6K
β-ac3n
Donor1
11.341.47
11.227.57
untreated
control
an3-IgM
eIF4GI
PDCD4
eIF4A
HSC70
eIF3b11.141.26
10.710.67
11.030.57
10.980.87
A
eIF3b eIF4A eIF4G1 PDCD40.0
0.5
1.0
1.5
2.0
rela
tive
expr
essi
on
untreatedcontrol beadsanti-IgM beads
P=0.0201
P=0.0013
P=0.0105un
treated
control
an3-IgM
eIF4GI
PDCD4eIF4AHSC70
eIF3b
B
Donor2Donor1
untre
ated
DM
SO
ibru
tinib
tam
atin
ib
DM
SO
ibru
tinib
tam
atin
ib
control anti-IgM
MYC β-actin
cont
rol b
eads
DM
SO
ibru
tinib
tam
atin
ib
0
25
50
75
100
MYC
pro
tein
(re
lativ
e ex
pres
sion
)
P=0.0478
P=0.0022
P=0.0015
anti-IgM beads
cont
rol b
eads
DM
SO
ibru
tinib
tam
atin
ib
0
25
50
75
100
tota
l MY
C R
NA
(rela
tive
expr
essi
on)
P=0.0012 P=0.0115
P=0.0001
anti-IgM beads cont
rol b
eads
DM
SO
ibru
tinib
tam
atin
ib
0
25
50
75
100
poly
som
al M
YC
RN
A (re
lativ
e ex
pres
sion
)
P=0.0002 P=0.0079
P=0.0002
anti-IgM beads cont
rol b
eads
DM
SO
ibru
tinib
tam
atin
ib
0
25
50
75
100
MY
C R
NA
ratio
(rela
tive
expr
essi
on)
P=0.0027 P=0.0257
P=0.0210
anti-IgM beads
Figure 5 C
E D
A B