Embed Size (px)
Citation preview
ENG.20080828.0016
1. QA: QA Design Calculation or Analysis Cover Sheet esc Complete only applicable items. 2. Page 1
3. System 14. Document Identifier
Subsurface Investigations IOO-SOC-CYOO-oO I 00-000-00E
5. Title Supplemental Soils Report
6. Group Geotechnical (C/SIA) 7. Document Status Designation
0 Preliminary I8l Committed 0 Confirmed 0 Cancelled/Superseded
8. Notes/Comments
Total Number of Attachments Pages
Appendix A-Not Used 1 Appendix B-Bearing Capacity and Settlement 56 Appendix C-Lateral Earth Pressures and Resistance to Lateral Loads 26
RECORD OF REVISIONS
11. 12. 13. 14. 15. 16. 9. 10. Total # Last Originator Checker EGS Approved/Accepted No. Reason For Revision of Pgs. Pg.# (Print/Sign/Date) (Print/Sign/Date) (Print/Sign/Date) (Print/Sign/Date)
OOA Initial Issue 243 C-26 PeterChiu James T. Cameron --- Farhang Ostadan 10/27104 10127/04 1111104
R. E. Pemisi 11/4104
OOB Complele Revision: fl.-vised fonnat to COnlClITIl to EG 255 C-26 Jam~'S T Cameron Nan Deng --~ .. Farhang Ostadan DSK-3003; revised contents of 6.4.2.3 (lonnerly 10.2.3) 811 5/06 8115/06 8/16J06 and 7.1.11 (fonm:rly 1\.11) and fl.-placed ligun; 7-1 (fonnerly II-I) to rcsolve CR5565 concerns. Also Raj S. Rajagopal addr~'Sses issues raised in CR8288 rt:garding consistency 8/21106 with Ground Motion Report (Section 6.4.2). N(lte: the layout of the facilities is cUlTently under revision. Evcn though Ihe exact number and contigumtion of facilities will change. the d~"Sign philosophy will cOlllinue to use multiple facilities of different sizc:s located within the North Portal area similar to that shown on Figure I-I. The calculation will be updated when the layout ti,r the facilitic.~ is revised.
OOC Compkle Revision: 1'~'Placed Figs. 1·1 and 6-7: n1<,dified 265 C-26 Jan1L'S T. Cameron Nan Deng Richard Kotas Farhang Ostadan Section 7.1.7 and title to Fig 7-1: revised organintion of 2/21;07 J 21,07 2'22;07 2122107 Scction2. Raj S. Rajagopal
2/22 )7
000 Complete Revision: Replaced Figure I-I. Added 272 C-26 James T. Cameron Nan Deng James DockeT) Farhang Ostadan discussion in Section 1.3 regarding revised building P 1707 12118107 1120/07 12;1 8/07 layout. Added references. tables and ligures in Section 6 regarding additional field and laboratory studies done in Raj Rajagopal 2005 and 2006. Moditkd App. C to I\:/le.;[ revised I 12,22/07 building dimensions. Added 10 S,;ction 7.1.9. Percolation Ratc:s. Modi fied Tabks 2-1 and 2-2 to re/lcet revised I dt-'Sign parnmeters. Modified S.:ction 3.2 to alert to additional assumptions not requiring v~..-ilication in Appendices Band C.
August 2008

Design Calculation or Analysis Cover Sheet 1. QA: QA
BSC Complete only applicable items.
OOE Complete Revision: Addresses CRI2357 to incorporate infonnation contained in the Supplemental Ground Motion Report (MDL-MGR-GS-000007), issued Feb. 2008. Addresses CR12206, which involved misnumbered figures. Addresses DOEIRW-0585 comments of March 2008. Includes CACNOOI and CACN002 into main report. Incorporates 2008 geotechnical data and seismic reports. Replaces Section 6.4.2. Removes Figs. 6-\8 through 6.39, and renumbers Figs 6-40 and 6-4\ to 6-18 and 6-\9, respectively. Removes App. A and its associated references from main text and App. B. Modifies Table 2-1 to reflect changes in references. Updates various DTN's to latest revisions.
192 C-26 James T. Cameron Nan Deng
Raj S. Rajagopal
2 August 2008
't<\~ '8/'1.-'1 /D~ /00 - SOC - c YOo- C:>O 'oc:> - 000 _ ooE

Supplemental Soils Report 100-S0C-CY00-00100-000-00E
DISCLAIMER
The calculations contained in this document were developed by Bechtel SAIC Company, LLC(BSC) and are intended solely for the use of BSC in its work for the Yucca Mountain Project.
3 August 2008
Supplemental Soils Report 100-S0C-CY00-00100-000-00E
CONTENTS
1 PURPOSE................................................................................................................................17 1.1 PURPOSE.......................................................................................................................17 1.2 SCOPE ............................................................................................................................17 1.3 PROJECT DESCRIPTION.............................................................................................17 1.4 LIMITATIONS...............................................................................................................20
2 REFERENCES ........................................................................................................................20 2.1 PROCEDURES/DIRECTIVES ......................................................................................20 2.2 DESIGN INPUTS...........................................................................................................21
2.2.1 Input Documents................................................................................................ 21 2.2.2 Standards............................................................................................................ 26 2.2.3 Data Tracking Numbers (DTNs) ....................................................................... 28 2.2.4 Drawings ............................................................................................................ 30
2.3 DESIGN CONSTRAINTS .............................................................................................31 2.4 DESIGN OUTPUTS.......................................................................................................31 2.5 INPUTS FROM CANCELLED/SUPERCEDED DOCUMENTS.................................31
2.5.1 Procedures/Directives ........................................................................................ 31 2.5.2 Data Tracking Numbers (DTNs) ....................................................................... 31
3 ASSUMPTIONS......................................................................................................................34 3.1 ASSUMPTIONS REQUIRING VERIFICATION.........................................................34 3.2 ASSUMPTIONS NOT REQUIRING VERIFICATION................................................34
4 METHODOLOGY ..................................................................................................................34 4.1 QUALITY ASSURANCE..............................................................................................34 4.2 USE OF SOFTWARE ....................................................................................................34 4.3 CALCULATION APPROACH......................................................................................34 4.4 DESIGN CRITERIA ......................................................................................................35
5 LIST OF ATTACHMENTS ....................................................................................................35 5.1 APPENDICES ................................................................................................................35
6 BODY OF CALCULATION...................................................................................................35 6.1 SITE DESCRIPTION .....................................................................................................35
6.1.1 Location ............................................................................................................. 35 6.1.2 Summary of Site Geology.................................................................................. 37 6.1.3 Existing Conditions and Surface Features ......................................................... 38 6.1.4 Subsurface Conditions ....................................................................................... 38
6.2 FIELD EXPLORATION AND TESTING.....................................................................45 6.2.1 Field Exploration ............................................................................................... 45 6.2.2 Field Tests.......................................................................................................... 57
6.3 LABORATORY TESTING............................................................................................63 6.3.1 Static Testing ..................................................................................................... 63 6.3.2 Dynamic Testing................................................................................................ 66
4 August 2008
Supplemental Soils Report 100-S0C-CY00-00100-000-00E
6.4 MATERIAL PROPERTIES ...........................................................................................67 6.4.1 Static Soil Properties.......................................................................................... 67 6.4.2 Dynamic Soil Properties .................................................................................... 77 6.4.3 Roller Compacted Soil Cement ......................................................................... 77
7 RESULTS AND CONCLUSIONS..........................................................................................81 7.1 ENGINEERING DESIGN PARAMETERS ..................................................................81
7.1.1 Material Properties............................................................................................. 81 7.1.2 Foundation Pressures ......................................................................................... 81 7.1.3 Settlement .......................................................................................................... 82 7.1.4 Coefficient of Subgrade Reaction and Equivalent Soil Springs ........................ 83 7.1.5 Lateral Earth Pressures ...................................................................................... 84 7.1.6 Resistance to Lateral Loads ............................................................................... 84 7.1.7 Slope Considerations ......................................................................................... 85 7.1.8 Pavements .......................................................................................................... 87 7.1.9 Percolation Rates ............................................................................................... 87 7.1.10 2000 International Building Code (IBC) Soil Type........................................... 88 7.1.11 Frost Penetration ................................................................................................ 88 7.1.12 Liquefaction Potential ........................................................................................ 88
7.2 CONSTRUCTION CONSIDERATIONS ....................................................................104 7.2.1 Stripping and Site Preparation ......................................................................... 104 7.2.2 Foundations...................................................................................................... 104 7.2.3 Excavation, Backfill and Temporary Shoring ................................................. 104 7.2.4 Excavations for Underground Utilities ............................................................ 105 7.2.5 Temporary and Permanent Slopes ................................................................... 105 7.2.6 Compaction ...................................................................................................... 105 7.2.7 Suitability of On-site Materials........................................................................ 106 7.2.8 Concrete Aggregates ........................................................................................ 106 7.2.9 Volume Coefficients ........................................................................................ 106 7.2.10 Surface and Storm Water Drainage ................................................................. 106 7.2.11 Septic System Drain Field ............................................................................... 107 7.2.12 Wet Weather Construction............................................................................... 107 7.2.13 Dewatering....................................................................................................... 107
7.3 ADDITIONAL I NVESTIGATIONS/TESTING..........................................................107 7.3.1 Test Pits and Geologic Reconnaissance........................................................... 107 7.3.2 Borings............................................................................................................. 108 7.3.3 Laboratory Testing........................................................................................... 108 7.3.4 CBR Testing..................................................................................................... 108 7.3.5 Field Plate Load Tests...................................................................................... 108 7.3.6 Resistivity Testing ........................................................................................... 108 7.3.7 Aggregate Testing............................................................................................ 108 7.3.8 Ballast Testing ................................................................................................. 108 7.3.9 Chemical Testing ............................................................................................. 108 7.3.10 Test Fill Program ............................................................................................. 109 7.3.11 Pavement and Railroad Subgrade Design........................................................ 109 7.3.12 RCSC Testing .................................................................................................. 109
5 August 2008

Supplemental Soils Report 100-S0C-CY00-00100-000-00E
APPENDICES:
Appendix A. Not used
Appendix B. Bearing Capacity and Settlement
Appendix C. Lateral Earth Pressures and Resistance to Lateral Loads
6 August 2008
Supplemental Soils Report 100-S0C-CY00-00100-000-00E
LIST OF FIGURES
Figure 1-1. Location Map Showing Geotechnical Boreholes from pre-2005, 2005, and 2006
to 2007 Drilling Programs (SNL 2008, Figure 6.2-1) 19
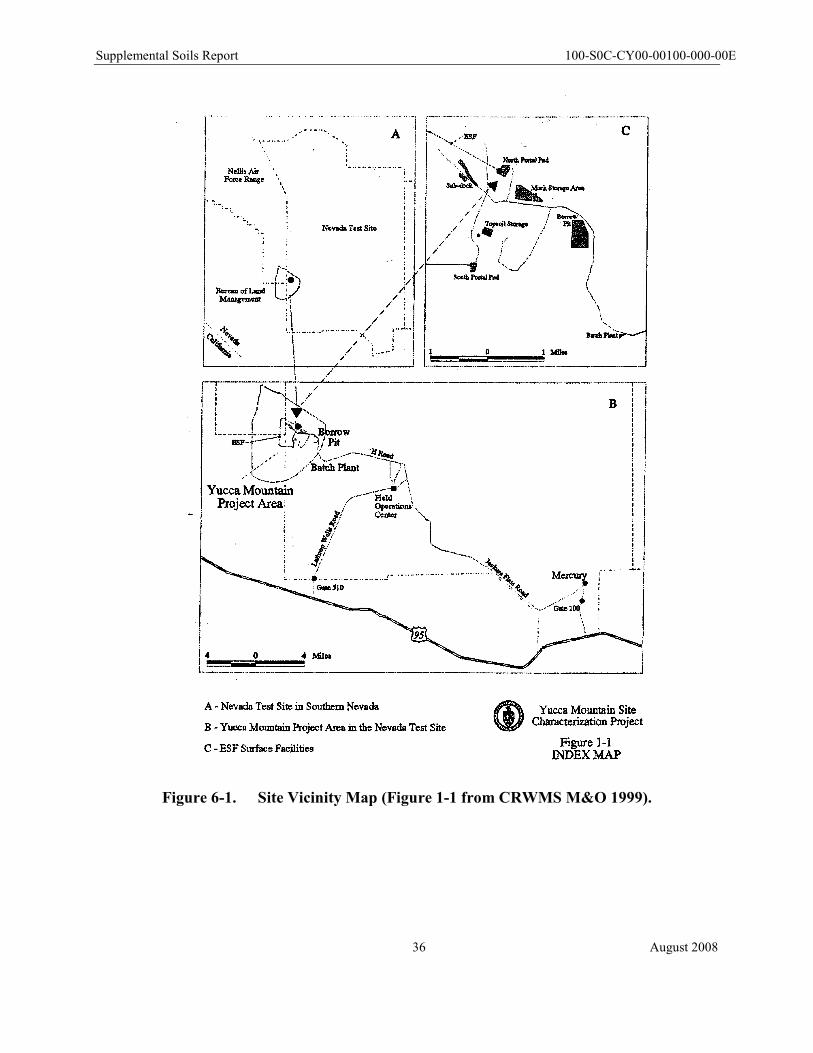
Figure 6-1. Site Vicinity Map (Figure 1-1 from CRWMS M&O 1999). 36
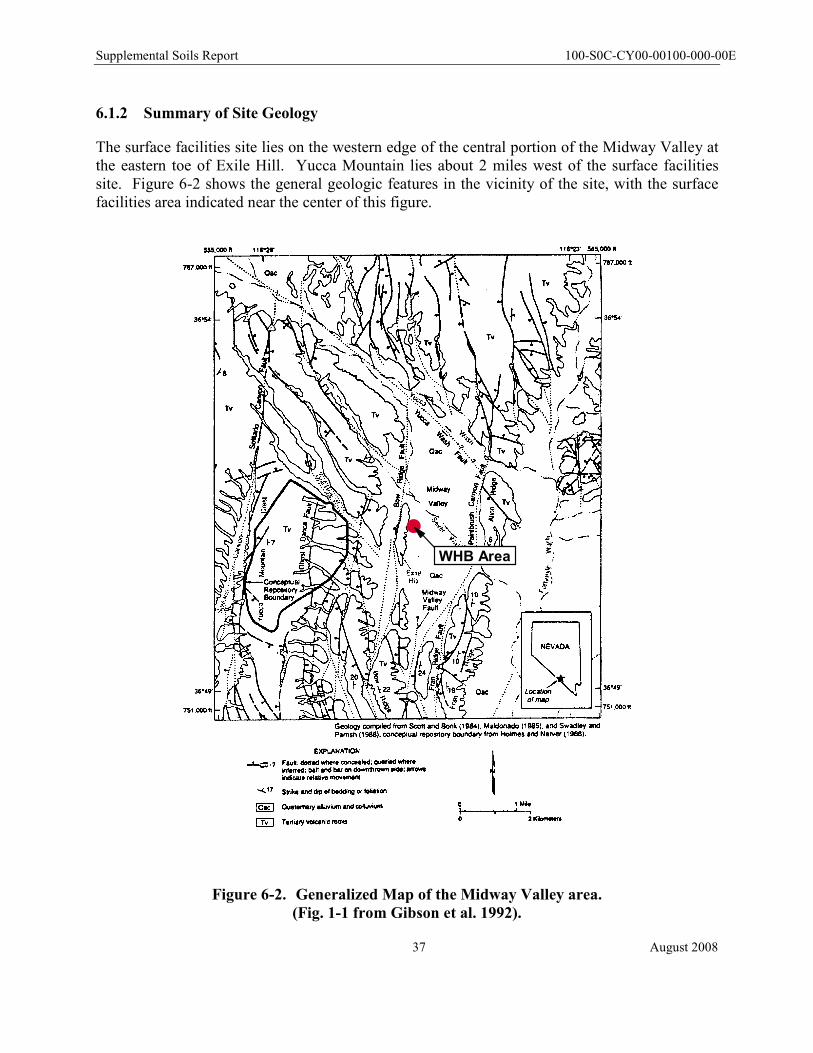
Figure 6-2. Generalized Map of the Midway Valley area. (Fig. 1-1 from Gibson et al. 1992). 37
Figure 6-3. Elevation Contours for Top-of-Bedrock Encountered in Boreholes (Figure 232 of
BSC 2002a) 40
Figure 6-4. Surface Facilities Area Geologic Cross Section A-A’ (see Figure 6-7 for location
of cross-section ). 42
Figure 6-5. Surface Facilities Area Geologic Cross Section B-B’ (see Figure 6-7 for location
of cross-section ) 43
Figure 6-6. Sketch of Stratigraphy Underlying Typical Surface Facility (not to scale). 44
Figure 6-7. Locations of Soil Exploration in the Surface Facilities Area (only pre-2005
borings shown). Cross-Sections shown in Figure 6-4, Figure 6-5, and Figure 7-1.
Excerpted from Figure 224, BSC (2002a). 51
Figure 6-8. Locations of Borings in Surface Facilities Area with respect to Building
Footprints. 52
Figure 6-9. Depth to Rock in Building Area. 53
Figure 6-10. Depth of Fill Encountered in Building Area. 54
Figure 6-11. Locations of Test Pits in Surface Facilities Area with respect to Building
Footprints. 55
Figure 6-12. Location of Fran Ridge Borrow Pit #1 Samples. 56
Figure 6-13. Locations of SASW lines at the surface facilities site (Figure 6.2-7 of SNL 2008) 62
Figure 6-14. Particle-Size Distribution Curves for Alluvium for TP-WHB-1 to TP-WHB-4 70
Figure 6-15. Particle-Size Distribution Curves for Alluvium for TP-WHB-5 to TP-WHB-7 70
Figure 6-16. Particle-Size Distribution Curves for Sonic Borings RF-47 and RF-52 71
Figure 6-17. Strength envelopes fitted to triaxial tests on engineered fill. 75
Figure 6-18. Normalized shear modulus reduction curves for cement treated soils. 79
Figure 6-19. Damping ratio degradation curves for cement treated soils. 80
Figure 7-1. WHB Area Geologic Cross Section E-E’, looking South. Excerpt from BSC
(2002a), 86
Figure 7-2. Allowable foundation pressure for square and strip footings on alluvium vs.
foundation width and foundation embedment (1-inch design settlement). 89
7 August 2008
Supplemental Soils Report 100-S0C-CY00-00100-000-00E
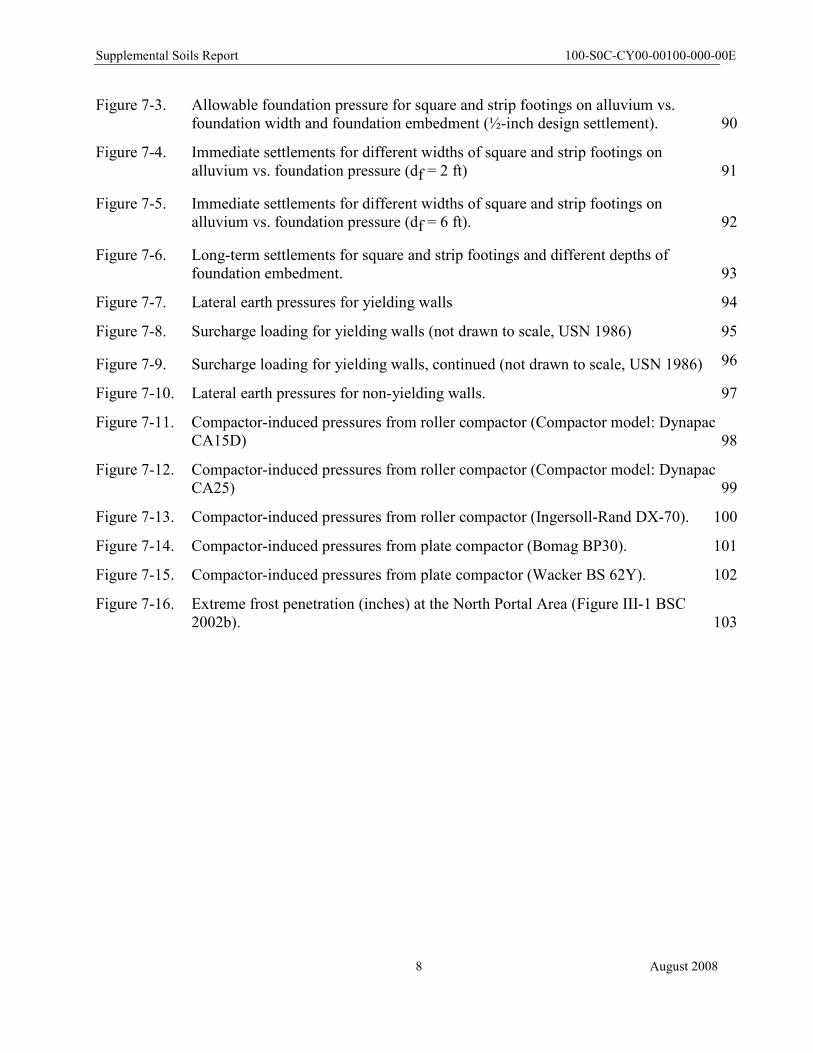
Figure 7-3. Allowable foundation pressure for square and strip footings on alluvium vs. foundation width and foundation embedment (½-inch design settlement). 90
Figure 7-4. Immediate settlements for different widths of square and strip footings on alluvium vs. foundation pressure (d = 2 ft) 91 f
Figure 7-5. Immediate settlements for different widths of square and strip footings on alluvium vs. foundation pressure (d = 6 ft). 92 f
Figure 7-6. Long-term settlements for square and strip footings and different depths of foundation embedment. 93
Figure 7-7. Lateral earth pressures for yielding walls 94
Figure 7-8. Surcharge loading for yielding walls (not drawn to scale, USN 1986) 95
96 Figure 7-9. Surcharge loading for yielding walls, continued (not drawn to scale, USN 1986)
Figure 7-10. Lateral earth pressures for non-yielding walls. 97
Figure 7-11. Compactor-induced pressures from roller compactor (Compactor model: Dynapac CA15D) 98
Figure 7-12. Compactor-induced pressures from roller compactor (Compactor model: Dynapac CA25) 99
Figure 7-13. Compactor-induced pressures from roller compactor (Ingersoll-Rand DX-70). 100
Figure 7-14. Compactor-induced pressures from plate compactor (Bomag BP30). 101
Figure 7-15. Compactor-induced pressures from plate compactor (Wacker BS 62Y). 102
Figure 7-16. Extreme frost penetration (inches) at the North Portal Area (Figure III-1 BSC 2002b). 103
8 August 2008
Supplemental Soils Report 100-S0C-CY00-00100-000-00E
LIST OF TABLES
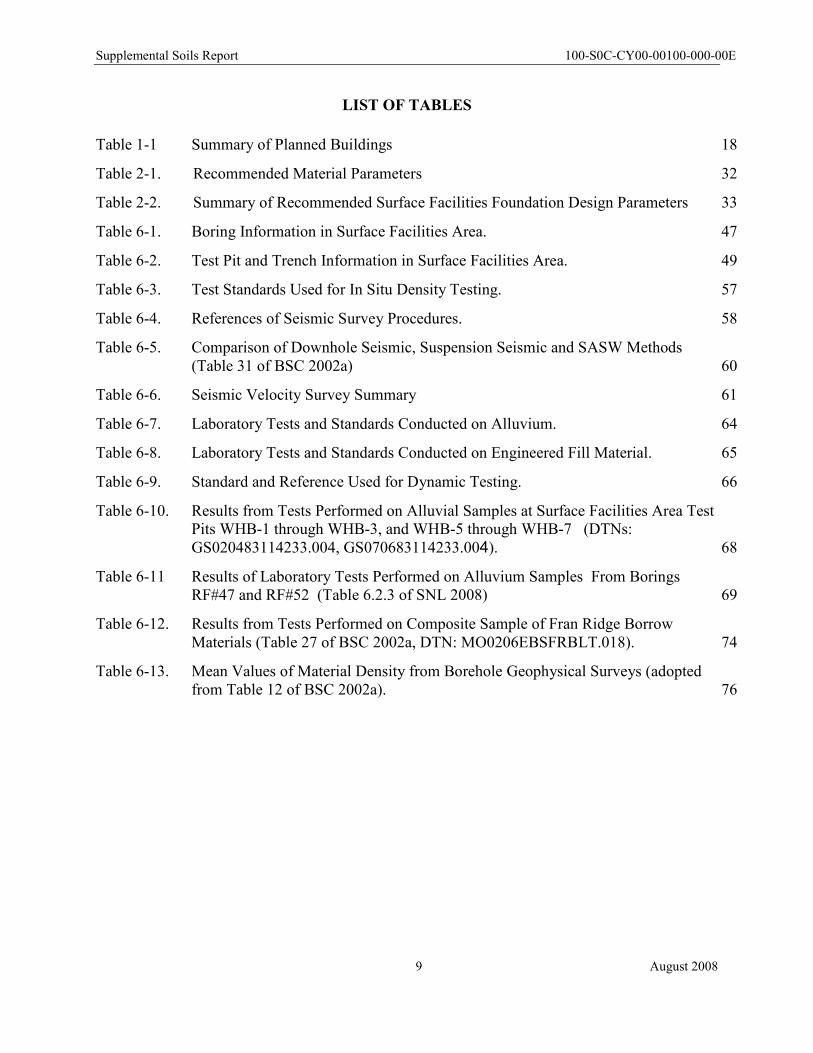
Table 1-1 Summary of Planned Buildings 18
Table 2-1. Recommended Material Parameters 32
Table 2-2. Summary of Recommended Surface Facilities Foundation Design Parameters 33
Table 6-1. Boring Information in Surface Facilities Area. 47
Table 6-2. Test Pit and Trench Information in Surface Facilities Area. 49
Table 6-3. Test Standards Used for In Situ Density Testing. 57
Table 6-4. References of Seismic Survey Procedures. 58
Table 6-5. Comparison of Downhole Seismic, Suspension Seismic and SASW Methods (Table 31 of BSC 2002a) 60
Table 6-6. Seismic Velocity Survey Summary 61
Table 6-7. Laboratory Tests and Standards Conducted on Alluvium. 64
Table 6-8. Laboratory Tests and Standards Conducted on Engineered Fill Material. 65
Table 6-9. Standard and Reference Used for Dynamic Testing. 66
Table 6-10. Results from Tests Performed on Alluvial Samples at Surface Facilities Area Test Pits WHB-1 through WHB-3, and WHB-5 through WHB-7 (DTNs:
GS020483114233.004, GS070683114233.004). 68
Table 6-11 Results of Laboratory Tests Performed on Alluvium Samples From Borings RF#47 and RF#52 (Table 6.2.3 of SNL 2008) 69
Table 6-12. Results from Tests Performed on Composite Sample of Fran Ridge Borrow Materials (Table 27 of BSC 2002a, DTN: MO0206EBSFRBLT.018). 74
Table 6-13. Mean Values of Material Density from Borehole Geophysical Surveys (adopted from Table 12 of BSC 2002a). 76
9 August 2008
Supplemental Soils Report 100-S0C-CY00-00100-000-00E
ACRONYMS AND ABBREVIATIONS
ACC Accession Number
ACI American Concrete Institute
ASCE American Society of Civil Engineers
ASTM American Society for Testing and Materials
BLM U.S. Bureau of Land Management
BSC Bechtel SAIC Company
c cohesion
CBR California Bearing Ratio
Cc coefficient of curvature
CCCF Central Control Center Facility
CF fines content
CPT Cone penetrometer test
CRCF Canister Receipt and Closure Facility
CRWMS Civilian Radioactive Waste Management System
Cu coefficient of uniformity
D10 grain diameter (in mm) corresponding to 10% passing, by weight (or mass)
D30 grain diameter (in mm) corresponding to 30% passing, by weight (or mass)
D60 grain diameter (in mm) corresponding to 60% passing, by weight (or mass)
df depth of footing
DH downhole
DIRS Document Input Reference System
DOE U.S. Department of Energy
DTN Data Tracking Number
E Young’s modulus or secant Young’s modulus
elev. elevation
EMWB Equipment Maintenance/Warehouse Building
EPRI Electrical Power Research Institute
Eq. equation
ESF Exploratory Studies Facility
Fpm feet per minute
fps feet per second
ft foot, feet (unit of measurement)
ft/s feet per second
ft2
feet squared
ft3
feet cubed
G shear modulus
GM silty gravel
Gmax small-strain (maximum) shear modulus
GP poorly-graded gravels or gravel-sand mixtures, little or no fines
10 August 2008
Supplemental Soils Report 100-S0C-CY00-00100-000-00E
ACRONYMS AND ABBREVIATIONS (CONTINUED)
GSF Ground Surface Facility
GW well-graded gravels or gravel-sand mixtures, little or no fines
H:V Horizontal:Vertical
HEMF Heavy Equipment Maintenance Facility
IBC International Building Code
ICC International Code Council
ID identification
IHF Initial Handling Facility
in. inch, inches
KA coefficient of active earth pressure
KP coefficient of passive earth pressure
kip 1,000 pounds (kilopound)
kips/ft2
kips per square foot
kips/ft3
kips per cubic foot
Ko coefficient of at-rest soil pressure
kcf kips per cubic foot
ksf kips per square foot
lb/ft2
pounds per square foot
lb/ft3
pounds per cubic foot
lbf pounds force
lb pounds (usually pounds-force)
LL liquid limit
MC moisture content
mm millimeter
M&O Management and Operating Contractor
MWV Midway Valley
N SPT penetration resistance (blow count)
N60 SPT penetration resistance corrected to 60% efficiency
NNWSI Nevada Nuclear Waste Site Investigation
NRG North Ramp Geotechnical
NRSF North Ramp Surface Facilities
NTS Nevada Test Site
ORD Office of Repository Development
p page
PC personal computer
pcf pounds per cubic foot
11 August 2008
Supplemental Soils Report 100-S0C-CY00-00100-000-00E
ACRONYMS AND ABBREVIATIONS (CONTINUED)
pci pounds per cubic inch
PGA peak ground acceleration
PI plasticity index
pp pages
psf pounds per square foot
psi pounds per square inch
“Q” “quality”
QA quality assurance
Qal Quaternary alluvium
RCSC roller compacted soil cement
RCTS Resonant Column & Torsional Shear
Rev. revision
RF Receipt Facility
SASW spectral analysis of surface waves
SFS Surface Facility System
SM silty sands, sand-silt mixtures
SN Scientific Notebook
SNL Sandia National Laboratory
SP poorly-graded sand or gravelly sands, little or no fines
SPT Standard Penetration Test
SSI soil structure interaction
SW well-graded sand or gravelly sands, little or no fines
tcf tons (American) per cubic foot
TIC Technical Information Center
Tmbtl pre-Rainier Mesa Tuff bedded tuff
Tmr Rainer Mesa Tuff of the Timber Mountain Group
tons/ft3
tons (American) per cubic foot
Tpbt5 pre-Tuff unit ”x” bedded tuffs (also known as post-Tiva Canyon Tuff bedded
tuffs)
Tpcpll Tiva Canyon Tuff: crystal-poor member, lower lithophysal zone
Tpcpln Tiva Canyon Tuff: crystal-poor member, lower nonlithophysal zone
Tpcpmn Tiva Canyon Tuff: crystal-poor member, middle nonlithophysal zone
Tpcpul Tiva Canyon Tuff: crystal-poor member, upper lithophysal zone
Tpcpun Tiva Canyon Tuff: crystal-poor member, upper nonlithophysal zone
Tpcrn Tiva Canyon Tuff: crystal-rich member, nonlithophysal zone, but used in BSC
(2002) to mean the Tpcr member
Tpki Tuff unit ”x”
tsf tons (American) per square foot
URS URS Corporation
USBR U.S. Bureau of Reclamation
12 August 2008
Supplemental Soils Report 100-S0C-CY00-00100-000-00E
ACRONYMS AND ABBREVIATIONS (CONTINUED)
USN U.S. Department of the Navy
USS United States Steel
UTA University of Texas, Austin
Vp compression-wave seismic velocity
Vs shear-wave seismic velocity
WHB waste handling surface facilities formally designated as WHB or Waste Handling
Building
WHF Wet Handling Facility
WNNRF Warehouse and Non-Nuclear Receipt Facility
YMP Yucca Mountain Project
13 August 2008
Supplemental Soils Report 100-S0C-CY00-00100-000-00E
GLOSSARY
This glossary presents definitions for geologic and geotechnical terms as used in this report.
Other definitions may be used in other disciplines o r in other contexts.
bedded tuff–a rock unit composed of volcanic ejecta that was deposited in layers and that
exhibits distinct planes of weakness (bedding planes) parallel to layering; deposited either by
water or by compositional sorting by air fall.
coefficient of uniformity–the ratio of D60 to D10, where Dn is the sieve opening that would allow
n percent of the soil particles (on a dry mass basis) to pass. In practice, Dn is determined by
interpolation of the results of a particle-size distribution test.
coefficient of vertical subgrade reaction, k (mass per length squared per time squared, 3 3
e.g., pound-force/ft or kN/m )–the ratio of the vertical pressure acting at the
foundation/subgrade interface at a point to the settlement at the same point.
compressionwave velocity–velocity of the compression (P) wave from a seismic energy source.
3 3 density, ρ ρρρ (mass per length cubed, e.g., pound-mass/ft or kg/m )–the total mass (solids plus
liquid plus gas) per total volume. Synonyms: bulk density, total bulk density, moist density, total
density, wet density.
ρρρρ 3 3density of solid particles, s (mass per length cubed, e.g., pound-mass/ft or kg/m )–the mass of
solid particles divided by the volume of solid particles.
y 3 3 dr density, ρρρρd (mass per length cubed, e.g., pound-mass/ft or kg/m )–the mass of solid
particles per the total volume of soil or rock.
embedment–the depth at which the base of a foundation is situated below the ground surface.
engineered fill–a fill placed by man that meets several criteria, including: (1) the fill is designed
to meet established criteria (e.g., bearing capacity, settlement) for a particular purpose (building,
embankment, etc.); (2) criteria are established on drawings and in a written specification for the
material placed in the fill; (3) the fill is placed in accordance with drawings and written
specifications; (4) the fill placement operations are observed by a geotechnical engineer (usually
a geotechnical technician working under the geotechnical engineer’s supervision); (5) the
material being placed in the fill is sufficiently tested to establish its geotechnical
characteristics(6) the degree of compaction of the fill is verified by either (a) in situ density tests
and compaction tests if relative compaction or relative density is specified, or (b) documenting
adherence to a method specification, depending on which acceptance criteria is stipulated in the
construction contract documents; (7) all fill material and all compacted fill that do not meet the
contract requirements is either removed and replaced or reworked in an appropriate manner;
(8) the geotechnical engineer prepares detailed written daily reports stating the geotechnical
engineer’s observations for the day, which are distributed on a daily basis; and (9) the
geotechnical engineer writes and files a report at the conclusion of earthwork construction
summarizing the geotechnical engineer’s observations and testing made during construction and
14 August 2008
Supplemental Soils Report 100-S0C-CY00-00100-000-00E
providing his opinion that the fill was or was not constructed in accordance with the
specifications and is suited or not for its intended use.
fines content–the percent of a materials’ particles, on a dry weight basis, that pass through a
U.S. Standard No. 200 sieve.
kip–a unit of force (weight) equal to one thousand pounds-force (1000 lbf).
lithophysae–hollow, bubble-like structures composed of concentric shells formed by the
concentration of gasses during cooling of portions of a volcanic flow deposit.
lithophysal–containing lithophysae.
lowamplitude shear modulus–see shear modulus, low-amplitude.
moist density–synonym of density.
nonengineered fill–an artificial (man-made) fill that does not meet the definition of engineered
fill.
nonwelded tuff–a volcanic rock consisting of fragments that were deposited with insufficient
heat to have become fused.
d
overburden pressure–at point A at depth, d, σv = ∫ γ dz where γ is unit weight and z is depth 0
below the point on the ground surface directly above Point A. Note: For this report,
groundwater is not a consideration, so effective overburden pressure is taken to be the same as
total overburden pressure.
percent core recovery–in a given cored interval, the ratio of the length of core recovered to the
length of the interval, expressed as a percentage.
Poisson’s ratio, υυυυ–in Hooke’s Law for isotropic materials, for a material subjected to a stress in
some direction, the ratio of the strain in the transverse direction to the strain in the direction of
stress application.
relative compaction–the ratio, expressed as a percentage, of the dry unit weight of a soil mass to
the reference maximum dry unit weight of the material as determined by a test, such as ASTM D
1557, Standard Test Methods for Laboratory Compaction Characteristics of Soil Using Modified 3 3
Effort (56,000ftlbf/ft (2,700kNm/m )).
relative density–the ratio of (1) the difference between the void ratio of a cohesionless soil in
the loosest state and its actual void ratio, to (2) the difference between the void ratios in the
loosest and in the densest states.
15 August 2008
Supplemental Soils Report 100-S0C-CY00-00100-000-00E
shear modulus–the stiffness factor for a material under shear stress, expressed by the
relationship of the applied shear force to the change in position produced by this force, calculated
as the product of the total mass density (total unit weight divided by gravity) and the square of
the shear wave velocity. Symbol: G.
shear modulus, lowamplitude–shear modulus determined as the ratio of the shearing stress
divided by the shearing strain at low strain values (< 0.001%). Symbol: G. Synonym: small-
strain shear modulus.
shearwave velocity–velocity of the shear (S) wave from a seismic energy source.
shearwave velocity, lowamplitude -the velocity of a seismic body wave propagating with a
shearing motion that oscillates particles at right angles to the direction of propagation measured
at low strain values (< 0.001%). Synonym: small-strain shear-wave velocity.
smallstrain shear modulus–synonym of low-amplitude shear modulus
smallstrain shearwave velocity–synonym of low-amplitude shear-wave velocity.
total density–synonym of density.
total unit weight–synonym of unit weight.
nit 3 3u weight, γγ γγ (mass per length squared per time squared, e.g., pound-force/ft or kN/m )–the
total weight (solids plus liquid plus gas) per total volume. This parameter is also referred to as
“moist unit weight,” “wet unit weight,” or “total unit weight.”
3 3unit weight, dry, γγγγd (mass per length squared per time squared, e.g., pound-force/ft or kN/m )–
the total weight of solid particles per total volume.
unit weight, total–synonym of unit weight.
vitric tuff–an indurated deposit of volcanic ash composed mainly of glassy fragments blown out
of a volcano during a volcanic eruption.
water content–the ratio of the mass of water contained in the pore spaces of soil or rock
material, to the solid mass of particles in that material, expressed as a percentage. Also referred
to as gravimetric water content. Note that adsorbed water is not considered part of the water in
the pore spaces but as water bound to the solid particles–synonym of moisture content.
welded tuff–a rock consisting of volcanic fragments that has been indurated by the heat retained
by particles and the enveloping gases.
wet density–synonym of density.
16 August 2008
Supplemental Soils Report 100-S0C-CY00-00100-000-00E
1 PURPOSE
1.1 PURPOSE
This report is written as a companion report to Soils Report for North Portal Area, Yucca Mountain Project, BSC (2002b). The primary purpose of the current report is to adopt, clarify,
and summarize the findings and recommendations of BSC (2002a) and BSC (2002b) into design
charts and tables to be used for the design of surface facilities at the Yucca Mountain Project Site
(YMP). The surface facilities include all associated surface structures for the nuclear waste
handling and support facilities. This report also recommends additional soils investigation and
testing for the non-waste handling facilities. These recommendations have been developed for
use in design of the surface facilities to a level suitable to support the License Application
process.
Subsequent to the issuance of Revision 00A of this calculation additional field and laboratory
studies were performed (SNL 2008) and ground motion reports for the site were written (BSC
2004a and BSC 2008a) that more thoroughly address dynamic properties and other seismic
considerations, including shear and compression wave velocities and material degradation
relationships. This current calculation revision includes consideration of these additional studies
and analyses.
1.2 SCOPE
The scope of this report is to provide simplified charts and recommendations of geotechnical
parameters to be used for the design and analysis of the surface facilities. Where pertinent, the
recommendations provided in BSC (2002b) are used. The current report summarizes the
pertinent field and laboratory investigations, the results of material property tests, and provides
engineering design parameters including allowable bearing capacity, settlement, lateral earth
pressures on retaining walls, and slope evaluation based on site-specific subsurface soil
information. Additional recommendations provided include pavement design parameters,
percolation rates, and frost penetration. Construction considerations and additional investigations
and testing are also discussed.
1.3 PROJECT DESCRIPTION
The configuration of the nuclear waste handling surface facilities area has changed over much
iteration from a single building encompassing all aspects of the waste handling process to the
configuration used herein, which consists of several major storage and process facilities. The
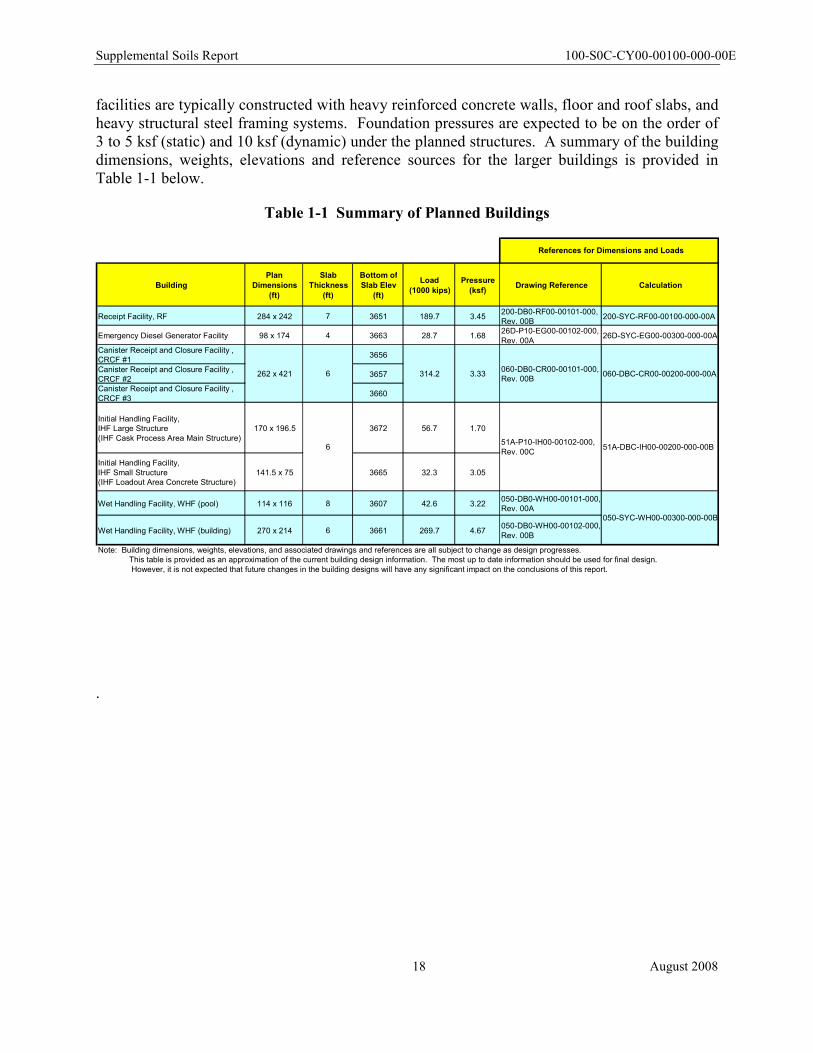
facility layout is shown in Figure 1-1 (Figure 6.2-1 in SNL 2008, see also BSC 2007f). The
largest structures are the two aging pads to the north of the building cluster (see also BSC
2007h). The largest buildings are the Canister Receipt and Closure Facilities (Building Nos.
080, 070, and 060). Other major structures include the Wet Handling Facility (050); Initial
Handling Facility (51A); Receipt Facility (200); and the Emergency Diesel Generator Facility
(26D). The southeast portion of the site area contains an evaporation pond and a
stormwater/retention pond. Several smaller facilities (administration, fire rescue, medical,
storage, etc.) are located in the southern portion of the site. The nuclear handling surface
17 August 2008
Supplemental Soils Report 100-S0C-CY00-00100-000-00E
18 August 2008
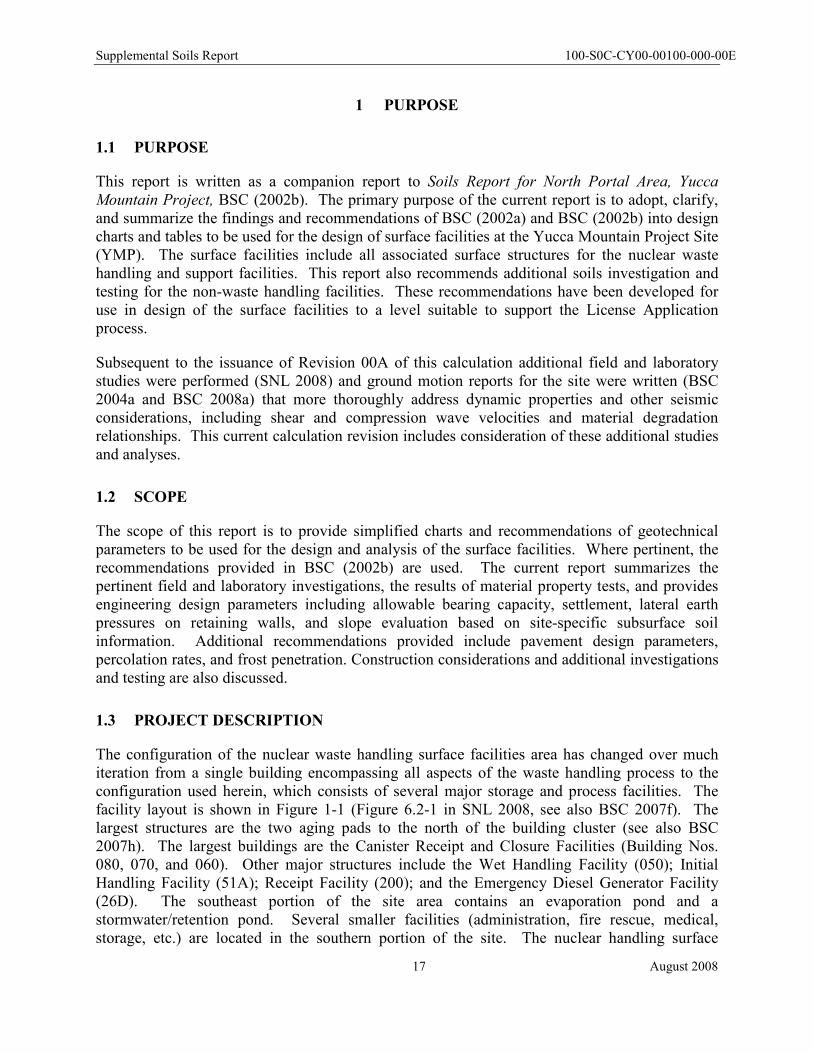
facilities are typically constructed with heavy reinforced concrete walls, floor and roof slabs, and
heavy structural steel framing systems. Foundation pressures are expected to be on the order of
3 to 5 ksf (static) and 10 ksf (dynamic) under the planned structures. A summary of the building
dimensions, weights, elevations and reference sources for the larger buildings is provided in
Table 1-1 below.
Table 11 Summary of Planned Buildings
References for Dimensions and Loads
Building Plan
Dimensions (ft)
Slab Thickness
(ft)
Bottom of Slab Elev
(ft)
Load (1000 kips)
Pressure (ksf) Drawing Reference Calculation
Receipt Facility, RF 284 x 242 7 3651 189.7 3.45 200DB0RF0000101000, Rev. 00B 200SYCRF000010000000A
Emergency Diesel Generator Facility 98 x 174 4 3663 28.7 1.68 26DP10EG0000102000, Rev. 00A 26DSYCEG000030000000A
Canister Receipt and Closure Facility , CRCF #1 Canister Receipt and Closure Facility , CRCF #2 Canister Receipt and Closure Facility , CRCF #3
262 x 421 6
3656
314.2 3.33 060DB0CR0000101000, Rev. 00B 060DBCCR000020000000A 3657
3660
Initial Handling Facility, IHF Large Structure (IHF Cask Process Area Main Structure)
170 x 196.5
6
3672 56.7 1.70
51AP10IH0000102000, Rev. 00C 51ADBCIH000020000000B
Initial Handling Facility, IHF Small Structure 141.5 x 75 3665 32.3 3.05 (IHF Loadout Area Concrete Structure)
Wet Handling Facility, WHF (pool) 114 x 116 8 3607 42.6 3.22 050DB0WH0000101000, Rev. 00A
050SYCWH000030000000B Wet Handling Facility, WHF (building) 270 x 214 6 3661 269.7 4.67 050DB0WH0000102000,
Rev. 00B
Note: Building dimensions, weights, elevations, and associated drawings and references are all subject to change as design progresses. This table is provided as an approximation of the current building design information. The most up to date information should be used for final design. However, it is not expected that future changes in the building designs will have any significant impact on the conclusions of this report.
.
Supplemental Soils Report 100-S0C-CY00-00100-000-00E
Source: DTNs: GS030783114233.001, GS070683114233.005, GS931008314211.036, MO0707RFGNPMV1.000,
MO0706ABRTP567.000, MO0612SMFGLGIB.000, for boreholes, test pits; BSC 2007e, BSC 2007g for ITS facilities.
Figure 11. Location Map Showing Geotechnical Boreholes from pre2005, 2005, and 2006 to 2007 Drilling Programs (SNL 2008, Figure 6.21)
19 August 2008
Supplemental Soils Report 100-S0C-CY00-00100-000-00E
1.4 LIMITATIONS
Limitations stated in Section 1.3 of BSC (2002b) apply to this report and are briefly summarized
below (refer to BSC 2002b for full descriptions):
1. These recommendations are intended to provide geotechnical input for the surface
facilities to support the License Application process.
2. When the final building configuration and borrow source are defined the
recommendations should be reviewed to evaluate whether any changes or additional
confirmatory borings or field tests are needed (These items are addressed in Section 7.3
of this report.).
3. The bases for the recommendations are limited to the borings, field tests, and laboratory
tests performed in the vicinity of the site to date. Although not likely, unanticipated
subsurface conditions may be present. The recommendations provided in this report are
based on no major deviations occurring from what was observed in the studies to date.
4. The recommended bearing capacities and lateral earth pressures are for near horizontal
ground conditions (i.e., less than or equal to a 3% slope). However, modifications to the
recommendations can be made on a case-by-case basis for any specific conditions that
vary appreciably from the near horizontal ground condition.
5. Any person using this report for bidding purposes should perform independent
investigations, as they deem necessary to satisfy themselves that the surface and
subsurface conditions are suitably accurate to determine construction procedures and
methods.
2 REFERENCES
2.1 PROCEDURES/DIRECTIVES
EG-PRO-3DP-G04B-00037, Rev. 12. Calculations and Analyses. Las Vegas, Nevada: Bechtel
SAIC Company. ACC: ENG.20080519.0005.
IT-PRO-0011, Rev. 9. Software Management. Las Vegas, Nevada: Bechtel SAIC Company.
ACC: DOC.20080416.0010.
ORD (Office of Repository Development) 2007. Repository Project Management Automation Plan. 000-PLN-MGR0-00200-000, Rev. 00E. Las Vegas, Nevada: U.S. Department of Energy,
Office of Repository Development. ACC: ENG.20070326.0019.
20 August 2008
21 August 2008
Supplemental Soils Report 100-S0C-CY00-00100-000-00E
2.2 DESIGN INPUTS
The input data used or considered in the calculation herein are primarily adopted from the
following references (for the surface facilities area):
•� Geotechnical Data for Potential Waste Handling Building and for Ground Motion
Analyses for the Yucca Mountain Site Characterization Project, BSC (2002a)
•� Soils Report for North Portal Area, Yucca Mountain P roject, BSC (2002b)
•� Geotechnical Data for a Geological Repository at Yucca Mountain, SNL (2008)
•� Development of Earthquake Ground Motion Input for Preclosure Seismic Design and
Postclosure Performance Assessment of a Geologic Repository at Yucca Mountain, BSC
(2004a)
•� Supplemental Earthquake Ground Motion Input for a Geologic Repository at Yucca
Mountain, BSC (2008a)
Input data taken from other sources are indicated where they are used.
2.2.1 Input Documents
ACI 230.1R-90. 1991. State-of-the-Art Report on Soil Cement. Detroit, Michigan: American
Concrete Institute. TIC: 231738. (DIRS 165763)
ASCE 4-98. 2000. Seismic Analysis of SafetyRelated Nuclear Structures and Commentary. Reston, Virginia: American Society of Civil Engineers. TIC: 253158. (DIRS 159618)
Bowles, J.E. 1996. Foundation Analysis and Design. 5th Edition. New York, New York:
McGraw-Hill. TIC: 247039. (DIRS 157929)
BSC (Bechtel SAIC Company) 2002a. Geotechnical Data for a Potential Waste Handling Building and for Ground Motion Analyses for the Yucca Mountain Site Characterization Project. ANL-MGR-GE-000003 REV 00. Las Vegas, Nevada: Bechtel SAIC Company. ACC:
MOL.20021004.0078. (DIRS 157829)
BSC (Bechtel SAIC Company) 2002b. Soils Report for North Portal Area, Yucca Mountain Project. 100-00C-WRP0-00100-000-000. Las Vegas, Nevada: Bechtel SAIC Company. ACC:
MOL.20021015.0323; ENG.20050823.0018. (DIRS 159262)
BSC (Bechtel SAIC Company) 2002c. Preliminary Hydrologic Engineering Studies for the
North Portal Pad and Vicinity. ANL-EBS-MD-000060 REV 00. Las Vegas, Nevada: Bechtel
SAIC Company. ACC: MOL.20021028.0123. (DIRS 157928)
BSC (Bechtel SAIC Company) 2004a. Development of Earthquake Ground Motion Input for
Preclosure Seismic Design and Postclosure Performance Assessment of a Geologic Repository at
Supplemental Soils Report 100-S0C-CY00-00100-000-00E
Yucca Mountain, NV. MDL-MGR-GS-000003 REV 01. Las Vegas, Nevada: Bechtel SAIC Company. ACC: DOC.20041111.0006. (DIRS 170027)
BSC (Bechtel SAIC Company) 2004b. Preliminary Dynamic Design Parameters for RollerCompacted SoilCement. 100-S0C-CY00-00200-000-00A. Las Vegas, Nevada: Bechtel SAIC Company. ACC: ENG.20040205.0008. (DIRS 166066)
BSC (Bechtel SAIC Company) 2004c. Geologic Framework Model (GFM2000). MDL-NBS-
GS-000002 REV 02. Las Vegas, Nevada: Bechtel SAIC Company. ACC: DOC.20040827.0008. (DIRS 170029)
BSC (Bechtel SAIC Company) 2006. Receipt Facility (RF) Mass Properties. 200-SYC-RF00-
00100-000-00A. Las Vegas, Nevada: Bechtel SAIC Company. ACC: ENG.20061206.0001. (DIRS 178795)
BSC (Bechtel SAIC Company) 2007a. Project Design Criteria Document. 000-3DR-MGR0-
00100-000-007. Las Vegas, Nevada: Bechtel SAIC Company. ACC: ENG.20071016.0005. (DIRS 179641)
BSC (Bechtel SAIC Company) 2007b. CRCF Foundation Design. 060-DBC-CR00-00200-000-
00A. Las Vegas, Nevada: Bechtel SAIC Company. ACC: ENG.20070322.0005. (DIRS 184027).
BSC (Bechtel SAIC Company) 2007c. Emergency Diesel Generator Facility – Mass Analysis & Moments of Inertia. 26D-SYC-EG00-00300-000-00A. Las Vegas, Nevada: Bechtel SAIC Company. ACC: ENG.20070323.0003. (DIRS 184115)
BSC (Bechtel SAIC Company) 2007d. Wet Handling Facility (WHF) Mass Properties. 050-
SYC-WH00-00300-000-00B. Las Vegas, Nevada: Bechtel SAIC Company. ACC: ENG.20070326.0001. (DIRS 184008)
BSC (Bechtel SAIC Company) 2008a. Supplemental Earthquake Ground Motion Input for a Geologic Repository at Yucca Mountain, NV. MDL-MGR-GS-000007 REV 00. Las Vegas, Nevada: Bechtel SAIC Company. ACC: DOC.20080221.0001. (DIRS 183776)
BSC (Bechtel SAIC Company) 2008b. Basis of Design for the TAD Canister-Based Repository Design Concept. 000-3DR-MGR0-00300-000-002. Las Vegas, Nevada: Bechtel SAIC Company. ACC: ENG.20080229.0007. (DIRS 185025)
BSC (Bechtel SAIC Company) 2008c. Initial Handling Facility (IHF) Foundation Design. 51A-
DBC-IH00-00200-000-00B. Las Vegas, Nevada: Bechtel SAIC Company. ACC: ENG.20080221.0005. (DIRS 185085)
Bureau of Reclamation (USBR) 1992. Logs of Test Pit or Auger Hole: Access Road, Ground Surface Facility, Hole Nos. GSF-TP-1 through GSF-TP-39. [Denver, Colorado]: U.S. Department of the Interior, Bureau of Reclamation. ACC: NNA.19930614.0010. (DIRS 103599)
22 August 2008
Supplemental Soils Report 100-S0C-CY00-00100-000-00E
Bureau of Reclamation (USBR) 1993. Electrical Resistivity Data for YMP North Portal Grounding Mat. [Denver, Colorado: U.S. Department of the Interior, Bureau of Reclamation]. ACC: MOL.19980115.0161. (DIRS 103589)
CRWMS M&O 1999. Preliminary Geotechnical Investigation for Waste Handling Building, Yucca Mountain Site Characterization Project. BCB000000-01717-5705-00016 REV 00. Las Vegas, Nevada: CRWMS M&O. ACC: MOL.19990625.0182. (DIRS 109209)
DOE 1995. Yucca Mountain Site Characterization Project Site Atlas 1995. Two volumes. Washington, D.C.: U.S. Department of Energy. ACC: MOL.19960311.0262. (DIRS 102884)
Duncan, J.M. and Seed, R.B. 1986. “Compaction-Induced Earth Pressures under K(sub0)-
Conditions.” Journal of Geotechnical Engineering, 112, (1), 1-22. [New York, New York]: American Society of Civil Engineers. TIC: 243244. (DIRS 102359)
Duncan, J.M.; Williams, G.W.; Sehn, A.L.; and Seed, R.B. 1991. “Estimation Earth Pressures Due to Compaction.” Journal of Geotechnical Engineering, 117, (12), 1833-1847. [New York, New York]: American Society of Civil Engineers. TIC: 252185. (DIRS 157870)
Dupas, J-M. and Pecker, A. 1979. “Static and Dynamic Properties of Sand-Cement.” Journal of the Geotechnical Engineering Division, 105, (GT3), 419-436. [Reston, Virginia]: American Society of Civil Engineers. TIC: 254534. (DIRS 165770)
EPRI 1993. Method and Guidelines for Estimating Earthquake Ground Motion in Eastern North America. Volume 1 of Guidelines for Determining Design Basis Ground Motions. EPRI TR-102293. Palo Alto, California: Electric Power Research Institute. TIC: 226495. (DIRS 103319)
Fang, H-Y., ed. 1991. Foundation Engineering Handbook. 2nd Edition. Boston, Massachusetts: Kluwer Academic Publishers. TIC: 245696. (DIRS 135068)
Gibson, J.D.; Swan, F.H.; Wesling, J.R.; Bullard, T.F.; Perman, R.C.; Angell, M.M.; and DiSilvestro, L.A. 1992. Summary and Evaluation of Existing Geological and Geophysical Data Near Prospective Surface Facilities in Midway Valley, Yucca Mountain Project, Nye County, Nevada. SAND90-2491. Albuquerque, New Mexico: Sandia National Laboratories. ACC: NNA.19910709.0001. (DIRS 102323)
Ho, D.M.; Sayre, R.L.; and Wu, C.L. 1986. Suitability of Natural Soils for Foundations for Surface Facilities at the Prospective Yucca Mountain Nuclear Waste Repository. SAND85-7107. Albuquerque, New Mexico: Sandia National Laboratories. ACC: NNA.19890327.0053. (DIRS 102324)
Holmes & Narver 1983. Soils Investigation for Sandia Laboratories NNWSI Area 25 Nevada Test Site. Report #ES 133. Las Vegas, Nevada: Holmes & Narver. ACC: MOL.19961113.0080. (DIRS 102299)
23 August 2008
Supplemental Soils Report 100-S0C-CY00-00100-000-00E
ICC 2000. International Building Code 2000. Falls Church, Virginia: International Code
Council. TIC: 251054. (DIRS 159179)
Kohata, Y.; Muramoto, K.; Maekawa, H.; Yajima, J.; and Babasaki, R. 1997. “JGS TC Report:
Deformation and Strength Properties of DM Cement-Treated Soils.” Grouting and Deep Mixing, Proceedings of ISTokyo '96, the Second International Conference on Ground Improvement Geosystems, Tokyo, 1417 May 1996. Yonekura, R.; Terashi, M.; and Shibazaki, M., eds. 2, 905-911. Brookfield, Vermont: A.A. Balkema. TIC: 254764.(DIRS 165771)
Ladd, R.S. 1978. “Preparing Test Specimens Using Undercompaction.” Geotechnical Testing Journal, 1, (1), 16-23. New York, New York: American Society for Testing and Materials.
TIC: 243278. (DIRS 102326)
Luebbers, M.J. 2002a. Borehole Suspension Seismic Component of Geotechnical Investigation
for a Potential Waste Handling Building. Scientific Notebook SN-M&O-SCI-024-V1.
ACC: MOL.20020509.0127; MOL.20020509.0129; MOL.20020509.0130;
MOL.20020509.0132.(DIRS 157252)
Luebbers, M.J. 2002b. Borehole Suspension Seismic Component of Geotechnical Investigation
for a Potential Waste Handling Building. Scientific Notebook SN-M&O-SCI-024-V2.
ACC: MOL.20020509.0128; MOL.20020509.0130; MOL.20020509.0131;
MOL.20020509.0132; MOL.20020509.0133. (DIRS 157253)
Luebbers, M.J. 2002c. Downhole Seismic Component of Geotechnical Investigation for a
Potential Waste Handling Building. Scientific Notebook SN-M&O-SCI-025-V1.
ACC: MOL.20020228.0297. (DIRS 157288)
McGinn, A.J. and O’Rourke, T.D. 2003. Performance of Deep Mixing Methods at Fort Point Channel. Ithaca, New York: Cornell University, School of Civil and Environmental
Engineering. TIC: 254802. (DIRS 165772)
McKeown, M. 1992. Soil and Rock Geotechnical Investigations Field and Laboratory Studies, North Ramp Surface Facility Exploratory Studies Facility, Yucca Mountain Project, Nevada. Technical Memorandum 3610-92-35. Denver, Colorado: U.S. Department of Interior, Bureau
of Reclamation. ACC: NNA.19930607.0020. (DIRS 102330)
Neal, J.T. 1985. Location Recommendation for Surface Facilities for the Prospective Yucca Mountain Nuclear Waste Repository. SAND84-2015. Albuquerque, New Mexico: Sandia
National Laboratories. ACC: NNA.19870406.0061. (DIRS 101618)
Neal, J.T. 1986. Preliminary Validation of Geology at Site for Repository Surface Facilities, Yucca Mountain, Nevada. SAND85-0815. Albuquerque, New Mexico: Sandia National
Laboratories. ACC: NNA.19870824.0060. (DIRS 102331)
Peck, R.B.; Hansen, W.E.; and Thornburn, T.H. 1974. Foundation Engineering. New York,
New York: John Wiley & Sons. TIC: 240098. (DIRS 166319)
24 August 2008
Supplemental Soils Report 100-S0C-CY00-00100-000-00E
Poulos, H.G. and Davis, E.H. 1991. Elastic Solutions for Soil and Rock Mechanics. Series in
Soil Engineering. Lambe, T.W., and Whitman, R.V., eds. New York, New York: Center for
Geotechnical Research. TIC: 252578. (DIRS 157885)
Sato, H.; Tanaka, Y.; Kanatani, M.; Tamari, Y.; and Sugisawa, M. 1995. “An Experimental and
Numerical Study on the Behaviour of Improved Ground by D.M.M. Against Liquefaction.”
Proceedings of ISTokyo '95, The First International Conference on Earthquake Geotechnical Engineering, Tokyo, 1416 November 1995. Ishihara, K., ed. 2, 767-772. Brookfield, Vermont:
A.A. Balkema. TIC: 254515.(DIRS 165774)
Seed, H.B. and Idriss, I.M. 1970. Soil Moduli and Damping Factors for Dynamic Response Analyses. EERC 70-10. Berkeley, California: University of California, Earthquake Engineering
Research Center. TIC: 241070. (DIRS 103324)
Seed, H.B. and Whitman, R.V. 1970. “Design of Earth Retaining Structures for Dynamic
Loads.” Lateral Stresses in the Ground and Design of EarthRetaining Structures, StateoftheArt Papers Presented at 1970 Specialty Conference, June 2224, 1970, Ithaca, N.Y. Pages 103-147. New York, New York: American Society of Civil Engineers. TIC: 243358.
(DIRS 102360)
Seed, H.B.; Wong, R.T.; Idriss, I.M.; and Tokimatsu, K. 1986. "Moduli and Damping Factors for
Dynamic Analyses of Cohesionless Soils." Journal of Geotechnical Engineering, 112, (11),
1016-1033. New York, New York: American Society of Civil Engineers. TIC: 243355 (DIRS
157263)
Sherard, J.L.; Dunnigan, L.P.; and Talbot, J.R. 1984. "Basic Properties of Sand and Gravel
Filters." Journal of Geotechnical Engineering, 110, (6), 684-700. [Reston, Virginia]: American
Society of Civil Engineers. TIC: 255343. (DIRS 165508)
SNL (Sandia National Laboratories) 2008. Technical Report: Geotechnical Data for a Geologic
Repository at Yucca Mountain, Nevada. TDR-MGR-GE-000010 REV 00. Las Vegas, Nevada:
Sandia National Laboratories. ACC: DOC.20080206.0001. (DIRS 183779)
Terzaghi, K. 1955. “Evaluation of Coefficients of Subgrade Reaction.” Geotechnique, V, 297-326. London, [England]: [Thomas Telford]. TIC: 243253. (DIRS 102363)
Terzaghi, K.; Peck, R.B.; and Mesri, G. 1996. Soil Mechanics in Engineering Practice. 3rd
Edition. New York, New York: John Wiley & Sons. TIC: 255131. (DIRS 165965)
USN 1986. Foundations and Earth Structures. Design Manual 7.02. NAVFAC 0525-LP-300-
7070. Alexandria, Virginia: U.S. Department of the Navy, Naval Facilities Engineering
Command. TIC: 207993. (DIRS 102312)
Vucetic, M. and Dobry, R. 1988. “Degradation of Marine Clays Under Cyclic Loading.”
Journal of Geotechnical Engineering, 114, (2), 133-149. American Society of Civil Engineers,
New York, New York. TIC:255461. (DIRS 166683)
25 August 2008
Supplemental Soils Report 100-S0C-CY00-00100-000-00E
Wang, Y.D. 1986. Investigation of Constitutive Relations for Weakly Cemented Sands. Ph.D.
dissertation. Berkeley, California: University of California, Berkeley. TIC: 254462.
(DIRS 165775)
Wong, I.G. 2002a. SASW Measurements Near the Top of Yucca Mountain and in the Potential
Repository Block. Scientific Notebook SN-M&O-SCI-040-V1, Pages: 1-115. ACC:
MOL.20020619.0461; MOL.20020619.0462. (DIRS 157292)
Wong, I.G. 2002b. Downhole Seismic Measurements at the Potential Waste Handling Building
Site [final submittal]. Scientific Notebook SN-M&O-SCI-030-V1. Pages: Title page-138. ACC:
MOL.20020227.0168 (DIRS 157332)
Wong, I.G. 2002c. SASW Measurements at Waste Handling Building Site [final submittal].
Scientific Notebook SN-M&O-SCI-022-V1. Pages: Cover-152. ACC: MOL.20020520.0222;
MOL.20020520.0223; MOL.20020520.0225; MOL.20020520.0226. (DIRS 157269)
Wong, I.G. 2002d. Laboratory Dynamic Testing of Rock and Soil Specimens for the Potential
Waste Handling Building Site [final submittal]. Scientific Notebook SN-M&O-SCI-033-V1.
Pages: Cover-115. ACC: MOL.20020508.0336; MOL.20020528.0392; MOL.20020508.0337;
MOL.20020528.0394. (DIRS 159423)
2.2.2 Standards
ASTM C 136-01. 2001. Standard Test Method for Sieve Analysis of Fine and Coarse Aggregates. West Conshohocken, Pennsylvania: American Society for Testing and Materials.
TIC: 253074. (DIRS 159570)
ASTM D 1557-02. 2003. Standard Test Methods for Laboratory Compaction Characteristics of Soil Using Modified Effort (56,000 ftlbf/ft{superscript 3} (2,700 kNm/m{superscript 3})). West
Conshohocken, Pennsylvania: American Society for Testing and Materials. TIC: 254263.
(DIRS 164216)
ASTM D 2434-68 (Reapproved 2000). 2000. Standard Test Method for Permeability of Granular Soils (Constant Head). West Conshohocken, Pennsylvania: American Society for
Testing and Materials. TIC: 255907. (DIRS 166311)
ASTM D 4718-87 (Reapproved 2001). 2001. Standard Practice for Correction of Unit Weight and Water Content for Soils Containing Oversize Particles. West Conshohocken, Pennsylvania:
American Society for Testing and Materials. TIC: 253066. (DIRS 159581)
ASTM D 5126-90 (Reapproved 1998). 1998. Standard Guide for Comparison of Field Methods for Determining Hydraulic Conductivity in the Vadose Zone. West Conshohocken,
Pennsylvania: American Society for Testing and Materials. TIC: 255906. (DIRS 166313)
26 August 2008
Supplemental Soils Report 100-S0C-CY00-00100-000-00E
ASTM D 558-82. 1982. Standard Test Methods for MoistureDensity Relations of SoilCement Mixtures. Philadelphia, Pennsylvania: American Society of Testing and Materials. TIC:
254760. (DIRS 165764)
USBR 5000-86. Procedure for Determining Unified Soil Classification (Laboratory Method). Denver, Colorado: U.S. Department of the Interior, Bureau of Reclamation. TIC: 232041.
(DIRS 158737)
USBR 5300-89. Procedure for Determining Moisture Content of Soil and Rock by the Oven Method. Denver, Colorado: U.S. Department of the Interior, Bureau of Reclamation.
TIC: 232041.(DIRS 158740)
USBR 5320-89. Procedure for Determining Specific Gravity of Soils. Denver, Colorado:
U.S. Department of the Interior, Bureau of Reclamation. TIC: 232041. (DIRS 158741)
USBR 5325-89. Procedure for Performing Gradation Analysis of Gravel Size Fraction of Soils. Denver, Colorado: U.S. Department of the Interior, Bureau of Reclamation. TIC: 232041.
(DIRS 158742)
USBR 5330-89. Procedure for Performing Gradation Analysis of Fines and Sand Size Fraction of Soils, Including Hydrometer Analysis. Denver, Colorado: U.S. Department of the Interior,
Bureau of Reclamation. TIC: 232041. (DIRS 158743)
USBR 5335-89. Procedure for Performing Gradation Analysis of Soils Without Hydrometer
Wet Sieve. Denver, Colorado: U.S. Department of the Interior, Bureau of Reclamation.
TIC: 232041. (DIRS 158744)
USBR 5350-89. Procedure for Determining the Liquid Limit of Soils by the OnePoint Method. Denver, Colorado: U.S. Department of the Interior, Bureau of Reclamation. TIC: 232041.
(DIRS 158745)
USBR 5360-89. Procedure for Determining the Plastic Limit and Plasticity Index of Soils. Denver, Colorado: U.S. Department of the Interior, Bureau of Reclamation. TIC: 232041.
(DIRS 158746)
USBR 5525-89. Procedure for Determining the Minimum Index Unit Weight of Cohesionless Soils. Denver, Colorado: U.S. Department of the Interior, Bureau of Reclamation.
TIC: 232041. (DIRS 158748)
USBR 5530-89. Procedure for Determining the Maximum Index Unit Weight of Cohesionless Soils. Denver, Colorado: U.S. Department of the Interior, Bureau of Reclamation.
TIC: 232041. (DIRS 158749)
USBR 7205-89. Procedure for Determining Unit Weight of Soils InPlace by the SandCone Method. Denver, Colorado: U.S. Department of the Interior, Bureau of Reclamation.
TIC: 232041. (DIRS 158752)
27 August 2008
Supplemental Soils Report 100-S0C-CY00-00100-000-00E
USBR 7221-89. Procedure for Determining Unit Weight of Soils InPlace by the Water Replacement Method in a Test Pit. Denver, Colorado: U.S. Department of the Interior, Bureau
of Reclamation. TIC: 232041. (DIRS 102405)
2.2.3 Data Tracking Numbers (DTNs)
GS020383114233.001. Waste Handling Building Test Pit Logs with Photomosaic Test Pit
Maps. Submittal date: 03/28/2002. (DIRS 157982).
GS020383114233.003. Geotechnical Borehole Logs for the Waste Handling Building, Yucca
Mountain Project, Nevada Test Site, Nevada. Submittal date: 03/28/2002. (DIRS 157980)
GS020483114233.004. Geotechnical Field and Laboratory Test Results from Waste Handling
Building Foundation Investigation. Submittal date: 04/15/2002. (DIRS 158242)
GS020783114233.005. Gradation Analysis Test Results and Graphical Plots from Tests
Performed on Materials Excavated from In-Situ Density Test Locations in Test Pits from the
Waste Handling Building Foundation Investigations. Submittal date: 07/23/2002. (DIRS 159542)
GS030783114233.001. Geotechnical Borehole Logs for the Waste Handling Building, Yucca
Mountain Project, Nevada Test Site, Nevada, Version 7/16/03. Submittal date: 07/23/2003.
(DIRS 164561)
GS070483114233.001. Index Properties of Alluvium Soils from Two Sonic Drill Core Holes
Obtained at Yucca Mountain Project, 07/20/2006 to 09/28/2006. Submittal date: 04/06/2007.
(DIRS 183298)
GS070583114233.002. Geologic Descriptive Logs of Fill and Quaternary Alluvium Material in
19 Repository Facilities Geotechnical Investigations Boreholes for the Yucca Mountain Waste
Handling Building, 04/12/2005 - 09/12/2005. Submittal date: 05/22/2007. (DIRS 183302)
GS070583114233.003. Geologic Descriptive Logs and Photomosaic Maps of Three Test Pits
(TP-WHB-5, TP-WHB-6, and TP-WHB-7) for the Yucca Mountain Waste Handling Building,
10/10/2006 - 11/07/2006. Submittal date: 05/31/2007. (DIRS 183296)
GS070683114233.004. Index Properties and in Place Unit Weight Test Results from Soils from
Nine Ring Density Excavations Performed at Yucca Mountain Project, 8/3/2006 to 9/27/2006.
Submittal date: 06/15/2007. (DIRS 183297)
GS070683114233.005. Geotechnical Borehole Logs of 18 Repository Facilities Geotechnical
Investigations Boreholes for the Yucca Mountain Waste Handling Building, 05/18/2007 -
06/20/2007. Submittal date: 06/20/2007. (DIRS 182109)
GS080183114233.001. Index Properties of Alluvium Soils from Two Sonic Drill Core Holes
Obtained at Yucca Mountain Project, 07/20/2006 to 09/28/2006. Submittal date: 01/08/2008.
(DIRS 184671)
28 August 2008
Supplemental Soils Report 100-S0C-CY00-00100-000-00E
GS950308312213.004. Cumulative Infiltration and Surface Flux Rates Conducted in Fortymile
Wash and Near UE-25 UZN#7. Submittal date: 03/27/1995. (DIRS 158474)
GS960908312212.009. Cumulative Infiltration and Surface Flux Rates Calculated on Raw
Millivolt Readings for FY95. Submittal date: 09/12/1996. (DIRS 158473)
GS931008314211.036. Graphical Lithologic Log of Borehole RF-3 (UE-25 RF#3), Version 1.0.
Submittal date: 10/07/1993. (DIRS 150006)
MO0008GSC00286.000. Exploratory Studies Facility (ESF) North Portal Pad, Waste Handling
Building (WHB) Profile Sections #3, #4, #5, #6, #7, and #8. Submittal date: 08/17/2000.
(DIRS 157306)
MO0112GSC01170.000. Borrow Pit #1 (Fran Ridge), USBR Sample Locations, for WHB
Investigations. Submittal date: 12/04/2001. (DIRS 157302)
MO0203DHRSSWHB.001. Dynamic Laboratory Test Data for Rock and Soil Samples from the
Waste Handling Building Site Characterization Area. Submittal date: 03/19/2002. (DIRS
158082)
MO0203EBSCTCTS.016. Compaction and Triaxial Compression Tests of Soil Sample.
Submittal date: 04/01/2002. (DIRS 157970)
MO0206EBSFRBLT.018. Fran Ridge Borrow Lab Testing. Submittal date: 06/10/2002.
(DIRS 158767)
MO0609SASWSEDC.001, Surface Spectral Analysis of Surface Waves (SASW) Experimental
Dispersion Curves for FY04 and FY05 for YMP. Submittal Date: 09/19/2006. (DIRS 183293)
MO0609SASWSTDC.003, Surface Spectral Analysis of Surface Waves (SASW) Theoretical
Dispersion Curves and VS Profiles for FY04 and FY05 for YMP. Submittal Date: 09/19/2006.
(DIRS 182125)
MO0612SMFGLGIB.000. Sample Management Facility Geologic Logs for the Repository
Facilities Geotechnical Investigations Boreholes. Submittal date: 12/18/2006. (DIRS 183648)
MO0701ABSRFLL2.000. SASW Investigations for Repository Facilities, As-Built SASW RF
Line Locations-2. Submittal date: 01/11/2007. (DIRS 182483)
MO0706ABRTP567.000. As-Built Proposed Repository Facility Test Pits 5, 6 & 7. Submittal
date: 07/10/2007. (DIRS 183301)
MO0707RFGNPMV1.000. Repository Facility (RF) Geotechnical Investigations North Portal &
Midway Valley - Part 1. Submittal date: 07/24/2007. (DIRS 183189)
29 August 2008
Supplemental Soils Report 100-S0C-CY00-00100-000-00E
MO0708SMFGLGIB.000. Sample Management Facility Geologic Logs for the Repository
Facilities Geotechnical Investigations Boreholes. Submittal date: 08/10/2007. (DIRS 183304)
SNF29041993001.002. Percolation Test Data, EFS Muck Storage Area. Submittal date:
12/21/1994. (DIRS 156087)
2.2.4 Drawings
BSC (Bechtel SAIC Company) 2007e. Geologic Repository Operations Area North Portal Site
Plan. 100-C00-MGR0-00501-000 REV 00D. Las Vegas, Nevada: Bechtel SAIC Company.
ACC: ENG.20070925.0003. (DIRS 183259) – Historic basis for Figure 1-1.
BSC (Bechtel SAIC Company) 2007f. Geologic Repository Operations Area North Portal Site
Plan. 100-C00-MGR0-00501-000 REV 00F. Las Vegas, Nevada: Bechtel SAIC Company.
ACC: ENG.20071116.0004. (DIRS 184014)
BSC (Bechtel SAIC Company) 2007g. Geologic Repository Operations Area Aging Pad Site
Plan. 170-C00-AP00-00101-000 REV 00A. Las Vegas, Nevada: Bechtel SAIC Company. ACC:
ENG.20070926.0008. (DIRS 180072) - Historic basis for Figure 1-1.
BSC (Bechtel SAIC Company) 2007h. Geologic Repository Operations Area Aging Pad Site
Plan. 170-C00-AP00-00101-000 REV 00C. Las Vegas, Nevada: Bechtel SAIC Company. ACC:
ENG.20071116.0005. (DIRS 184057)
BSC (Bechtel SAIC Company) 2007i. Emergency Diesel Generator Facility General
Arrangement Ground Floor Plan. 26D-P10-EG00-00102-000, Rev. 00A. Las Vegas, Nevada:
Bechtel SAIC Company. ACC: ENG.20071026.0009. (DIRS 183585)
BSC (Bechtel SAIC Company) 2007j. Initial Handling Facility General Arrangement Ground
Floor Plan. 51A-P10-IH00-00102-000 REV 00C. Las Vegas, Nevada: Bechtel SAIC Company.
ACC: ENG.20071226.0017. (DIRS 184529)
BSC (Bechtel SAIC Company) 2007k. Nuclear Facilities Buildings, Wet Handling Facility,
Forming Plan at TOC El. (-)34’-0” and (-)52’-0”, 050-DB0-WH00-00101-000, Rev 00A, Las
Vegas, Nevada: Bechtel SAIC Company. ACC: ENG.20070731.0003.
BSC (Bechtel SAIC Company) 2008d. Nuclear Facilities Buildings Canister Receipt and Closure
Facility #1 Forming Plan at TOC EL 0’-0”, 060-DB0-CR00-00101-000, Rev. 00B. Las Vegas,
Nevada: Bechtel SAIC Company. ACC: ENG.20080117.0025.
BSC (Bechtel SAIC Company) 2008e. Nuclear Facilities Buildings Receipt Facility Forming
Plan at TOC EL 0’-0”, 200-DB0-RF00-00101-000, Rev. 00B. Las Vegas, Nevada: Bechtel SAIC
Company. ACC: ENG.20080205.0002.
BSC (Bechtel SAIC Company) 2008f. Nuclear Facilities Buildings Wet Handling Facility
Forming Plan at TOC EL 0’-0”, 050-DB0-WH00-00102-000, Rev. 00B. Las Vegas, Nevada:
Bechtel SAIC Company. ACC: ENG.20080107.0004. 30 August 2008
Supplemental Soils Report 100-S0C-CY00-00100-000-00E
2.3 DESIGN CONSTRAINTS
None.
2.4 DESIGN OUTPUTS
This calculation will be used as input for other calculations. Summaries of material properties
and design parameters derived from this calculation are provided in Tables 2-1 and 2-2.
2.5 INPUTS FROM CANCELLED/SUPERCEDED DOCUMENTS
The following cancelled and superseded documents were used in the preparation of this report
and are identified herein as historical information. At the time of use, the cancelled and
superseded procedures were appropriate procedures to follow for the work performed. In
addition, the quality of the work, the results, recommendations and conclusions were not
impacted by the cancellation of these procedures.
DTN:GS020383114233.003 was superseded by DTN:GS030783114233.001 to account for
bedrock corrections. However, the differences were relatively minor and did not affect the
conclusions and recommendations of this report.
Therefore, these documents remain in this calculation for historical traceability purposes.
2.5.1 Procedures/Directives
PA-PRO-0310, Rev 0. Laboratory Dynamic Rock/Soil Testing, Las Vegas, Nevada: Bechtel
SAIC Company. Effective date: 03/31/2006 (Cancelled: 10/02/2006).
PA-PRO-0312, Rev. 0. The Preparation, Planning, and Field Verification of SurfaceBased Geophysical Logging Operations, Las Vegas, Nevada: Bechtel SAIC Company. Effective date:
02/28/2006 (Cancelled: 10/02/2006).
AP-SIII.6Q, Rev. 0, ICN 0. Geophysical Logging Programs for SurfaceBased Testing Program Boreholes, Las Vegas, Nevada: Department of Energy, Office of Civilian Radioactive Waste
Management (OCRWM). Effective date: 05/23/2001. Superseded by AP-SIII-8Q, Effective
date: 10/26/2001 (Cancelled: 01/27/2005).
2.5.2 Data Tracking Numbers (DTNs)
GS020383114233.003. Geotechnical Borehole Logs for the Waste Handling Building, Yucca
Mountain Project, Nevada Test Site, Nevada. Submittal date: 03/28/2002 (DIRS 157980).
Superseded by GS030783114233.001 (DIRS 164561) on 07/24/2003.
31 August 2008
Supplemental Soils Report 100-S0C-CY00-00100-000-00E
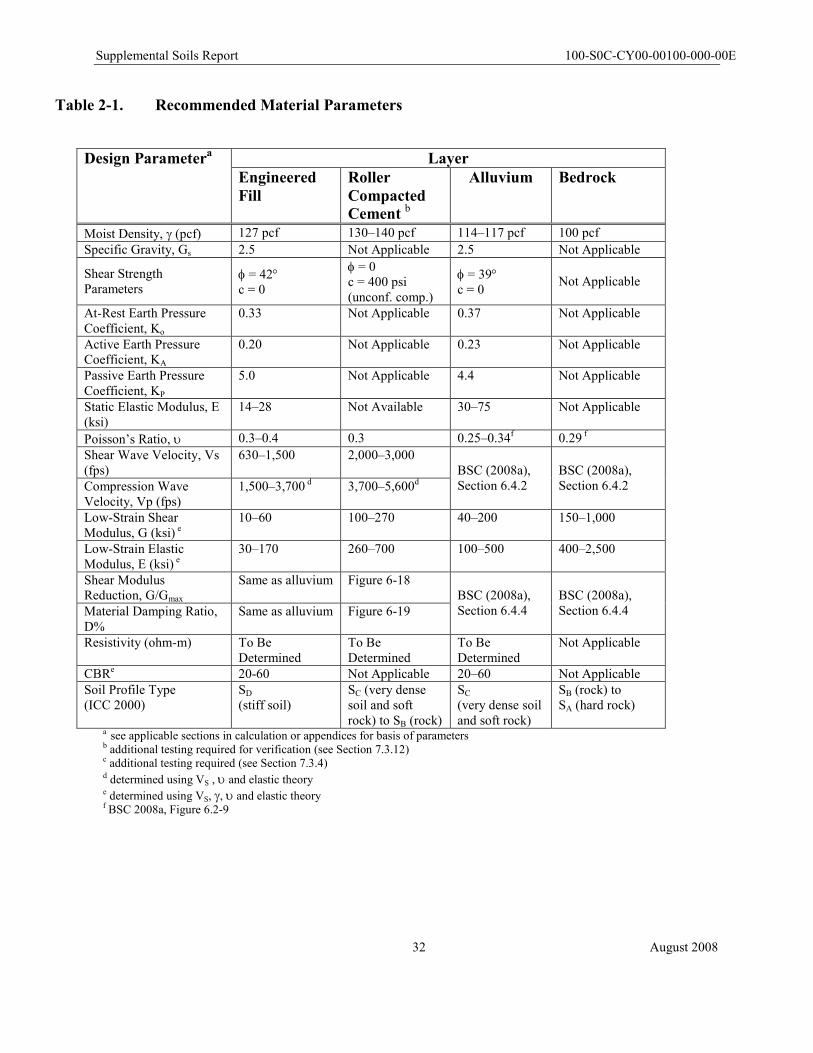
Table 21. Recommended Material Parameters
Design Parametera
Layer Engineered Fill
Roller Compacted Cement b
Alluvium Bedrock
Moist Density, γ (pcf) 127 pcf 130–140 pcf 114–117 pcf 100 pcf
Specific Gravity, Gs 2.5 Not Applicable 2.5 Not Applicable
Shear Strength
Parameters φ = 42° c = 0
φ = 0
c = 400 psi
(unconf. comp.)
φ = 39° c = 0
Not Applicable
At-Rest Earth Pressure
Coefficient, Ko
0.33 Not Applicable 0.37 Not Applicable
Active Earth Pressure
Coefficient, KA
0.20 Not Applicable 0.23 Not Applicable
Passive Earth Pressure
Coefficient, KP
5.0 Not Applicable 4.4 Not Applicable
Static Elastic Modulus, E
(ksi)
14–28 Not Available 30–75 Not Applicable
Poisson’s Ratio, υ 0.3–0.4 0.3 0.25–0.34f
0.29 f
Shear Wave Velocity, Vs
(fps)
630–1,500 2,000–3,000
BSC (2008a),
Section 6.4.2
BSC (2008a),
Section 6.4.2 Compression Wave
Velocity, Vp (fps)
1,500–3,700 d
3,700–5,600d
Low-Strain Shear
Modulus, G (ksi) e
10–60 100–270 40–200 150–1,000
Low-Strain Elastic
Modulus, E (ksi) e
30–170 260–700 100–500 400–2,500
Shear Modulus
Reduction, G/Gmax
Same as alluvium Figure 6-18
BSC (2008a),
Section 6.4.4
BSC (2008a),
Section 6.4.4 Material Damping Ratio,
D%
Same as alluvium Figure 6-19
Resistivity (ohm-m) To Be
Determined
To Be
Determined
To Be
Determined
Not Applicable
CBRe
20-60 Not Applicable 20–60 Not Applicable
Soil Profile Type
(ICC 2000)
SD
(stiff soil)
SC (very dense
soil and soft
rock) to SB (rock)
SC
(very dense soil
and soft rock)
SB (rock) to
SA (hard rock)
a see applicable sections in calculation or appendices for basis of parametersb additional testing required for verification (see Section 7.3.12)c additional testing required (see Section 7.3.4)d determined using VS , υ and elastic theory e determined using VS, γ, υ and elastic theory f BSC 2008a, Figure 6.2-9
32 August 2008
Supplemental Soils Report 100-S0C-CY00-00100-000-00E
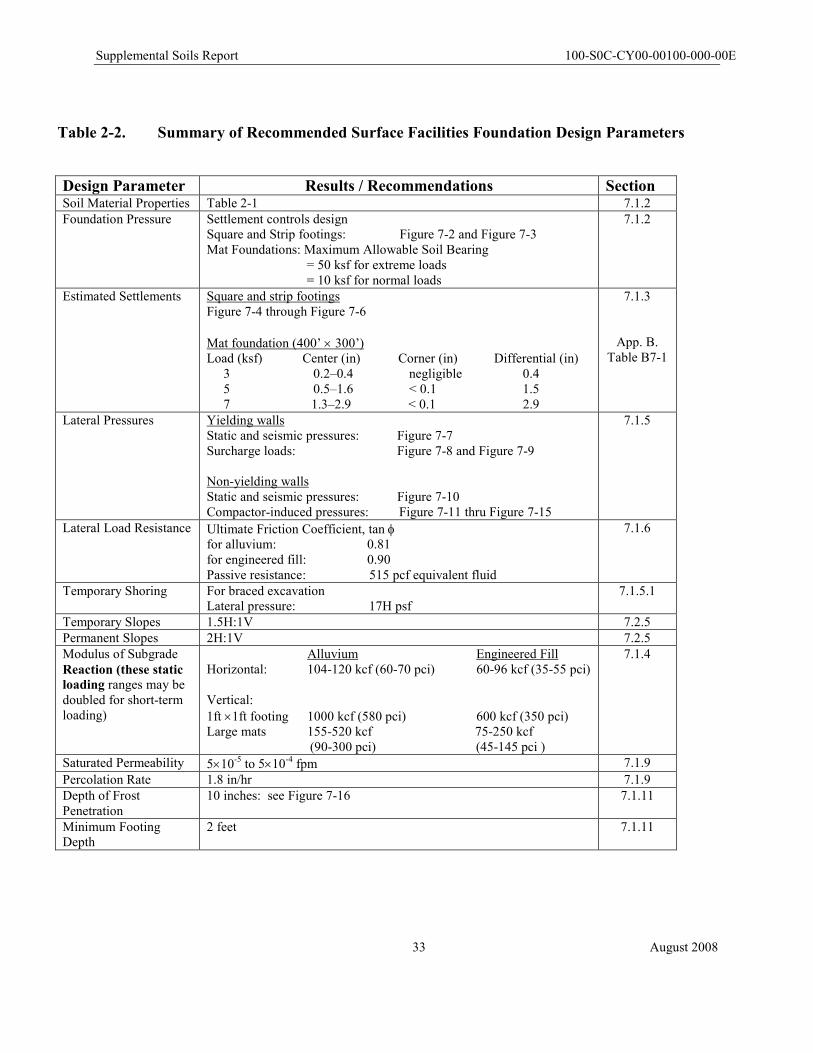
Table 22. Summary of Recommended Surface Facilities Foundation Design Parameters
Design Parameter Results / Recommendations Section Soil Material Properties Table 2-1 7.1.2
Foundation Pressure Settlement controls design
Square and Strip footings: Figure 7-2 and Figure 7-3
Mat Foundations: Maximum Allowable Soil Bearing
= 50 ksf for extreme loads
= 10 ksf for normal loads
7.1.2
Estimated Settlements Square and strip footings
Figure 7-4 through Figure 7-6
Mat foundation (400’ × 300’)
Load (ksf) Center (in) Corner (in) Differential (in)
3 0.2–0.4 negligible 0.4
5 0.5–1.6 < 0.1 1.5
7 1.3–2.9 < 0.1 2.9
7.1.3
App. B.
Table B7-1
Lateral Pressures Yielding walls
Static and seismic pressures: Figure 7-7
Surcharge loads: Figure 7-8 and Figure 7-9
Non-yielding walls
Static and seismic pressures: Figure 7-10
Compactor-induced pressures: Figure 7-11 thru Figure 7-15
7.1.5
Lateral Load Resistance Ultimate Friction Coefficient, tan φ for alluvium: 0.81
for engineered fill: 0.90
Passive resistance: 515 pcf equivalent fluid
7.1.6
Temporary Shoring For braced excavation
Lateral pressure: 17H psf
7.1.5.1
Temporary Slopes 1.5H:1V 7.2.5
Permanent Slopes 2H:1V 7.2.5
Modulus of Subgrade
Reaction (these static loading ranges may be
doubled for short-term
loading)
Alluvium Engineered Fill
Horizontal: 104-120 kcf (60-70 pci) 60-96 kcf (35-55 pci)
Vertical:
1ft ×1ft footing 1000 kcf (580 pci) 600 kcf (350 pci)
Large mats 155-520 kcf 75-250 kcf
(90-300 pci) (45-145 pci )
7.1.4
Saturated Permeability 5×10⁻⁵
to 5×10⁻⁴
fpm 7.1.9
Percolation Rate 1.8 in/hr 7.1.9
Depth of Frost
Penetration
10 inches: see Figure 7-16 7.1.11
Minimum Footing
Depth
2 feet 7.1.11
33 August 2008
Supplemental Soils Report 100-S0C-CY00-00100-000-00E
3 ASSUMPTIONS
This calculation is a compilation of available geotechnical information for use in design of
surface facilities. It is written to adopt, clarify, and summarize findings and recommendations of
BSC (2002a) and BSC (2002b) into design charts and tables. The same assumptions as listed in
Section 5 of BSC (2002b) have been used in this calculation. There were no assumptions
requiring verification in BSC, 2002b.
3.1 ASSUMPTIONS REQUIRING VERIFICATION
There are no assumptions used in this calculation requiring verification.
3.2 ASSUMPTIONS NOT REQUIRING VERIFICATION
Appendices B (Section B5) and C (Section C5) include additional assumptions not requiring
verification specific to their subject matter. There are no additional assumptions (other than
those listed in BSC, 2002b) used in this calculation.
4 METHODOLOGY
4.1 QUALITY ASSURANCE
This calculation was prepared in accordance with procedure EG-PRO-3DP-G04B-00037,
Calculation and Analyses. The Basis of Design for the TAD CanisterBased Repository Design Concept (BSC 2008b) classifies the nuclear waste handling surface facilities as Important to
Safety. Hence, the approved version of this document is designed as QA:QA.
4.2 USE OF SOFTWARE
Excel 2003 and Word 2003, which are part of this Microsoft Office 2003 suite of programs, were
used in this report. Microsoft Office 2003 as used in this calculation is classified as Level 2
software usage as defined in IT-PRO-0011, Software Management and is listed on ORD (2007),
Repository Project Management Automation Plan.
Mathcad, Version 13 was utilized in this calculation. Mathcad was operated on a PC system
running the Window 2003 operating system. Mathcad as used in this calculation is considered as
Level 2 software usage as defined in IT-PRO-0011, Software Management. Mathcad, Version
13 is listed on the ORD (2007), Repository Project Management Automation Plan.
4.3 CALCULATION APPROACH
This calculation reviews existing analyses, reports, drawings, and other documents to determine
relevant aspects that have the potential to contribute to and enhance the evaluation of soil
34 August 2008
Supplemental Soils Report 100-S0C-CY00-00100-000-00E
materials present at the site. Analytical methods of relevant engineering concepts with
arithmetic computation and logic are used.
4.4 DESIGN CRITERIA
The criteria itemized in Section 4.2 of BSC (2002b) are, in general, applicable for this
calculation. The current project design criteria are contained in BSC (2007a).
5 LIST OF ATTACHMENTS
5.1 APPENDICES
Analyses performed for use in the study herein are documented in the following attached
appendices:
Appendix A: Not Used
Appendix B: Bearing Capacity and Settlement
Appendix C: Lateral Earth Pressures and Resistance to Lateral Loads
6 BODY OF CALCULATION
6.1 SITE DESCRIPTION
6.1.1 Location
The YMP site is situated in the southwestern part of U.S. Department of Energy (DOE) Nevada
Test Site (NTS), and on parts of adjacent Nellis Air Force Range and U.S. Bureau of Land
Management (BLM) lands (See Section 1.2.2 of CRWMS M&O 1999). The site of the potential
surface facilities is totally within Area 25 of the NTS. The surface facilities site extends east
from the North Portal Pad, which is the fill pad that was constructed for the Exploratory Studies
Facility (ESF). A small portion of the site in the northwest corner lies within undocumented fill.
The site is approximately 27 miles west-northwest of Mercury, Nevada (Figure 6-1) and is
located in Nye County, Nevada approximately 100 miles northwest of the city of Las Vegas.
The approximate northing and easting coordinate ranges of the proposed site are N760,000 to
N772,000 and E570,000 to E574,000, respectively (Nevada State Plane). The latitudinal and
longitudinal coordinates are 36° 50’ and 116° 26.5’, respectively.
35 August 2008
Supplemental Soils Report 100-S0C-CY00-00100-000-00E
Figure 61. Site Vicinity Map (Figure 11 from CRWMS M&O 1999).
36 August 2008
WHB Area
Supplemental Soils Report 100-S0C-CY00-00100-000-00E
6.1.2 Summary of Site Geology
The surface facilities site lies on the western edge of the central portion of the Midway Valley at
the eastern toe of Exile Hill. Yucca Mountain lies about 2 miles west of the surface facilities
site. Figure 6-2 shows the general geologic features in the vicinity of the site, with the surface
facilities area indicated near the center of this figure.
Figure 62. Generalized Map of the Midway Valley area. (Fig. 11 from Gibson et al. 1992).
37 August 2008
Supplemental Soils Report 100-S0C-CY00-00100-000-00E
The generalized geology of the site consists of alluvial and colluvial deposits overlying tuff
bedrock. Volcanic rocks of Miocene age dominate the area. Small, intermittent flood-type
drainage deposits cross the site area from west to east. The alluvial and colluvial deposits, which
originated from Yucca Mountain on the west, vary from about 60 to 190 feet thick under the
current building layout and deepen to several hundred feet in the center of the Midway Valley.
Thorough descriptions of the geologic settings in the area can be found in Section 2 of CRWMS
M&O (1999) and Section 6.6 of BSC (2002a) and their corresponding references.
6.1.3 Existing Conditions and Surface Features
The existing surface conditions and features are succinctly summarized in the following
paragraphs, which were excerpted from Section 1.2.2 of CRWMS M&O (1999):
The ground surface elevation in the vicinity of the WHB [surface facilities] site ranges
from about 3,000 feet in the lower reaches of Forty Mile Wash, southeast of the site, to
over 6,000 feet in the closer areas of Timber Mountain Caldera, about 4 miles to the
north.
The crest of Yucca Mountain averages roughly 4,900 feet in elevation. Relief near the
site of the WHB [surface facilities] site is approximately 250 feet, from roughly 3,850 feet
elevation at the crest of Exile Hill, immediately west of the site, to roughly 3,600 feet
elevation at the center of Midway Valley, east of the site.
The North Portal Pad is located along the western margin of Midway Valley, at the
eastern base of Exile Hill. It is an area of approximately 800 to 1,200 feet by 600 to 700
feet of man-made fill sloping roughly 2 degrees to the east, and is situated at
approximately 3,670 to 3,683 feet elevation. Muck piles along the eastern side of the
North Portal Pad rise to approximately 3,700 feet elevation. The eastern part of the
surface facilities footprint is in the area of the present muck piles.
Beneath fill placed for the North Portal Pad is a variable thickness of colluvial and
alluvial material overlying Tertiary volcanic bedrock units. The North Portal Pad is the
surface at which the ESF tunnel portal was constructed. The pad supports the muck-
handling facilities for the tunnel excavation, as well as offices, shops and rail equipment
supporting the boring of the ESF tunnel, and facilities for engineering and scientific
testing in the ESF.
6.1.4 Subsurface Conditions
This section provides a general description of some of the subsurface conditions at the surface
facilities area. The descriptions of the subsurface conditions are based on information obtained
from existing boreholes in the area. Refer to BSC (2002a) Section 6.6.2 and BSC (2002b)
Section 6 for more detail. Figure 6-4 and Figure 6-5 show existing geologic cross-sections near
the site. The cross-sections are taken from Figures 225, cross-section A-A’ and 226, cross-
section B-B’ of BSC (2002a) and span in the NW-SE and NE-SW directions, respectively.
Figure 6-7 shows the cross-section and pre-2005 boring locations. Although these cross-sections
38 August 2008
Supplemental Soils Report 100-S0C-CY00-00100-000-00E
do not span through the area of the current layout of the proposed facilities, they present a
general summary of the expected subsurface conditions. It should be noted that these cross-
sections were based on data tracking numbers GS020383114233.003 and
MO0008GSC00286.000. GS020383114233.003 is historical information (see Section 2.5.2),
and has been superseded by GS030783114233.001 to account for bedrock depth corrections.
The revisions in GS030783114233.001 are not reflected in Figure 6-4 and Figure 6-5. However,
the differences are relatively minor and will not affect the recommendations of this calculation.
A sketch of the stratigraphy beneath a typical surface facility is shown in Figure 6-6.
6.1.4.1 Existing Fill
Non-engineered fill, varying in thickness from 5 to 50 feet (refer to DTNs -
GS030783114233.001, GS070683114233.005, MO0707RFGNPMV1.000, and
MO0708SMFGLGIB.000, and Figure 6-10 for fill contact depths), covers the surface of the
western edge of the proposed structures at the site. The existing fill is planned to be removed
prior to the construction of the surface facilities (see BSC 2002b, Section 6.1) and be replaced by
an engineered fill. Section 3.7 of CRWMS M&O (1999) provides more information about the
existing fill. It is understood that the fill consists of tunnel muck material from the Exile Hill,
and from borrow areas of Fran Ridge and Forty-mile Wash. Note that Section 5, Assumption 10
of BSC (2002b) states that 28 feet of existing fill was initially logged in one of the borings at the
surface facilities area (UE-25 RF#20) and may have been misidentified during field exploration.
For that location, the existing fill may, instead, have been only 9 feet thick.
6.1.4.2 Alluvium
Beneath the existing fill there is a layer of alluvial material, consisting of interbedded calcite-
cemented (caliche) and non-cemented poorly sorted, coarse-grained gravel with sand and some
fines, cobbles, and boulders (refer to Tables 4 and 5 of BSC 2002a and Table 6-1, for alluvium
contact depths). Available information indicates that the thickness of the alluvium is likely to
vary considerably at some locations due to irregular erosion of the current surface and the depth
to bedrock. Furthermore, cemented and un-cemented soil layers appear randomly within this soil
unit. The alluvium generally ranges in thickness from 2 ft to 192 ft over the site (see Figure 6.2-
4 of SNL 2008). Under the major building footprints, the alluvium thickness ranges from about
57 feet to 192 feet with the thickness increasing eastward from Exile Hill (see Figure 6-9). Note
that Section 5, Assumption 9 of BSC (2002b) states that alluvium logged in borehole UE-25
RF#21 between 70 and 115 feet may have been misidentified and may, in fact, be bedrock.
6.1.4.3 Bedrock
As Section 6.3 of BSC (2002b) asserts, there are non-welded and welded tuffs from the units of
Timber Mountain and Paintbrush groups underlying the surface deposits of fill and alluvium.
The non-welded units include the following:
• Pre-Rainier Mesa Tuff bedded tuffs (Tmbt1) of the Timber Mountain Group
39 August 2008
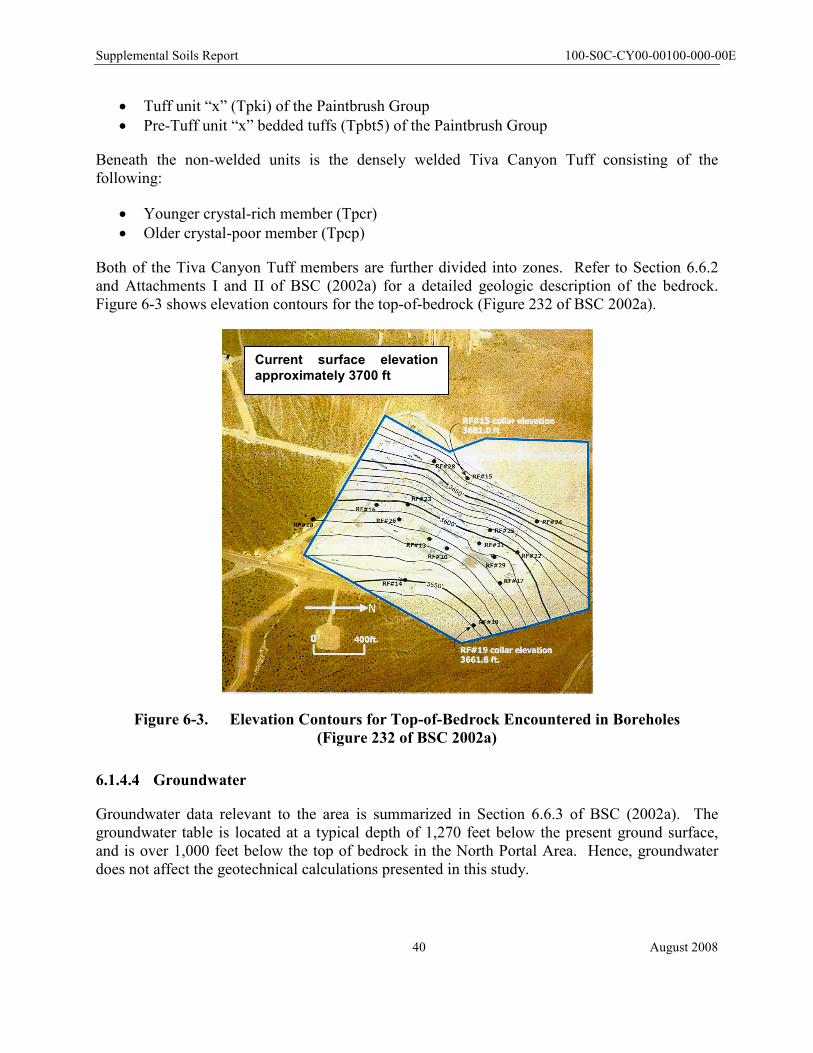
Supplemental Soils Report 100-S0C-CY00-00100-000-00E
• Tuff unit “x” (Tpki) of the Paintbrush Group
• Pre-Tuff unit “x” bedded tuffs (Tpbt5) of the Paintbrush Group
Beneath the non-welded units is the densely welded Tiva Canyon Tuff consisting of the
following:
• Younger crystal-rich member (Tpcr)
• Older crystal-poor member (Tpcp)
Both of the Tiva Canyon Tuff members are further divided into zones. Refer to Section 6.6.2
and Attachments I and II of BSC (2002a) for a detailed geologic description of the bedrock.
Figure 6-3 shows elevation contours for the top-of-bedrock (Figure 232 of BSC 2002a).
Current surface elevation approximately 3700 ft
Figure 63. Elevation Contours for TopofBedrock Encountered in Boreholes (Figure 232 of BSC 2002a)
6.1.4.4 Groundwater
Groundwater data relevant to the area is summarized in Section 6.6.3 of BSC (2002a). The
groundwater table is located at a typical depth of 1,270 feet below the present ground surface,
and is over 1,000 feet below the top of bedrock in the North Portal Area. Hence, groundwater
does not affect the geotechnical calculations presented in this study.
40 August 2008
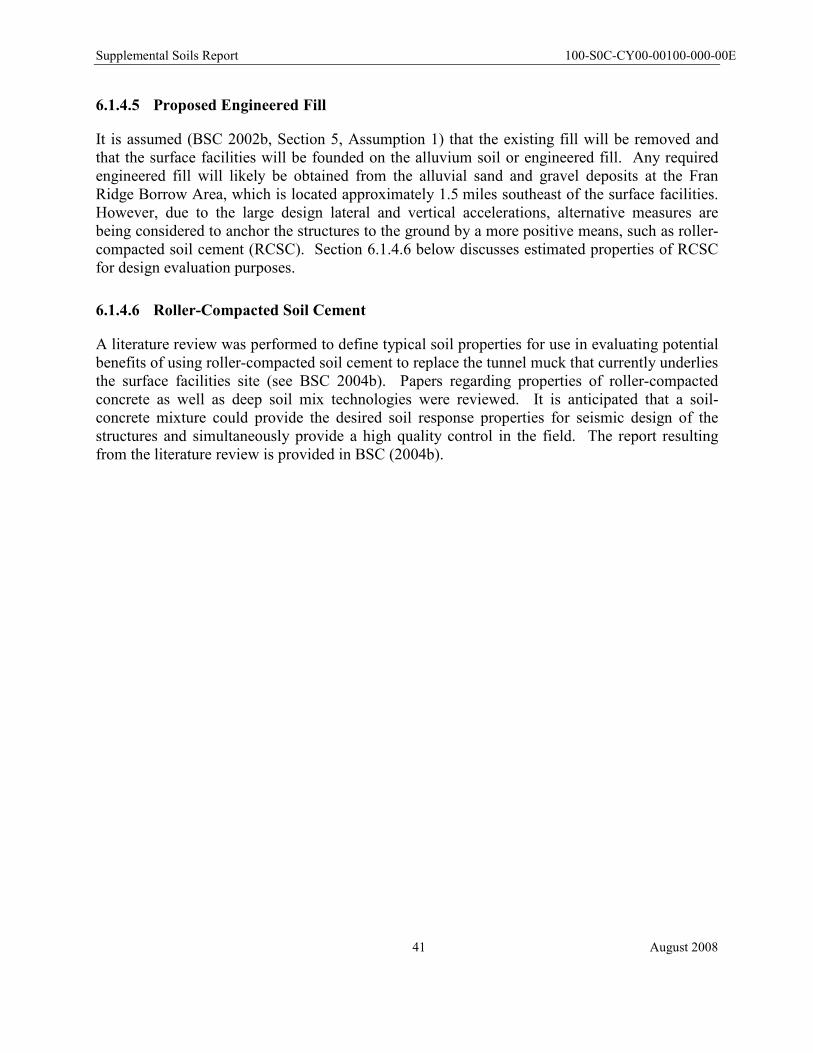
Supplemental Soils Report 100-S0C-CY00-00100-000-00E
6.1.4.5 Proposed Engineered Fill
It is assumed (BSC 2002b, Section 5, Assumption 1) that the existing fill will be removed and
that the surface facilities will be founded on the alluvium soil or engineered fill. Any required
engineered fill will likely be obtained from the alluvial sand and gravel deposits at the Fran
Ridge Borrow Area, which is located approximately 1.5 miles southeast of the surface facilities.
However, due to the large design lateral and vertical accelerations, alternative measures are
being considered to anchor the structures to the ground by a more positive means, such as roller-
compacted soil cement (RCSC). Section 6.1.4.6 below discusses estimated properties of RCSC
for design evaluation purposes.
6.1.4.6 RollerCompacted Soil Cement
A literature review was performed to define typical soil properties for use in evaluating potential
benefits of using roller-compacted soil cement to replace the tunnel muck that currently underlies
the surface facilities site (see BSC 2004b). Papers regarding properties of roller-compacted
concrete as well as deep soil mix technologies were reviewed. It is anticipated that a soil-
concrete mixture could provide the desired soil response properties for seismic design of the
structures and simultaneously provide a high quality control in the field. The report resulting
from the literature review is provided in BSC (2004b).
41 August 2008
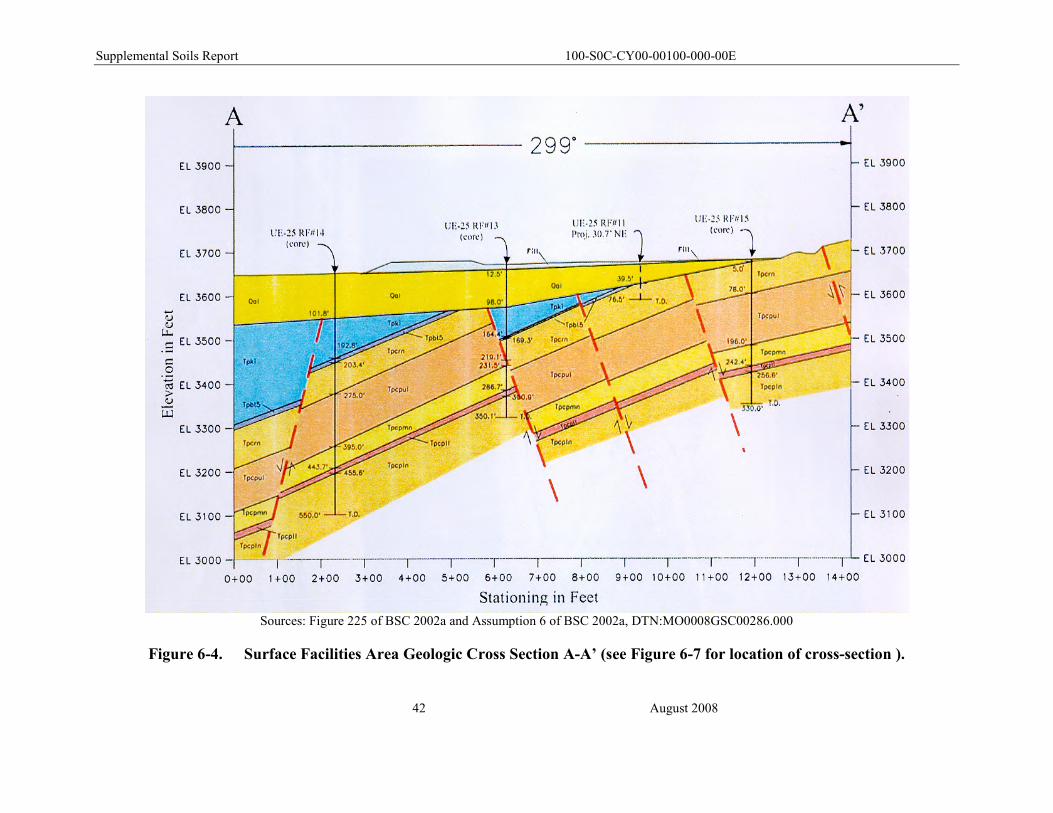
Supplemental Soils Report 100-S0C-CY00-00100-000-00E
Sources: Figure 225 of BSC 2002a and Assumption 6 of BSC 2002a, DTN:MO0008GSC00286.000
Figure 64. Surface Facilities Area Geologic Cross Section AA’ (see Figure 67 for location of crosssection ).
42 August 2008
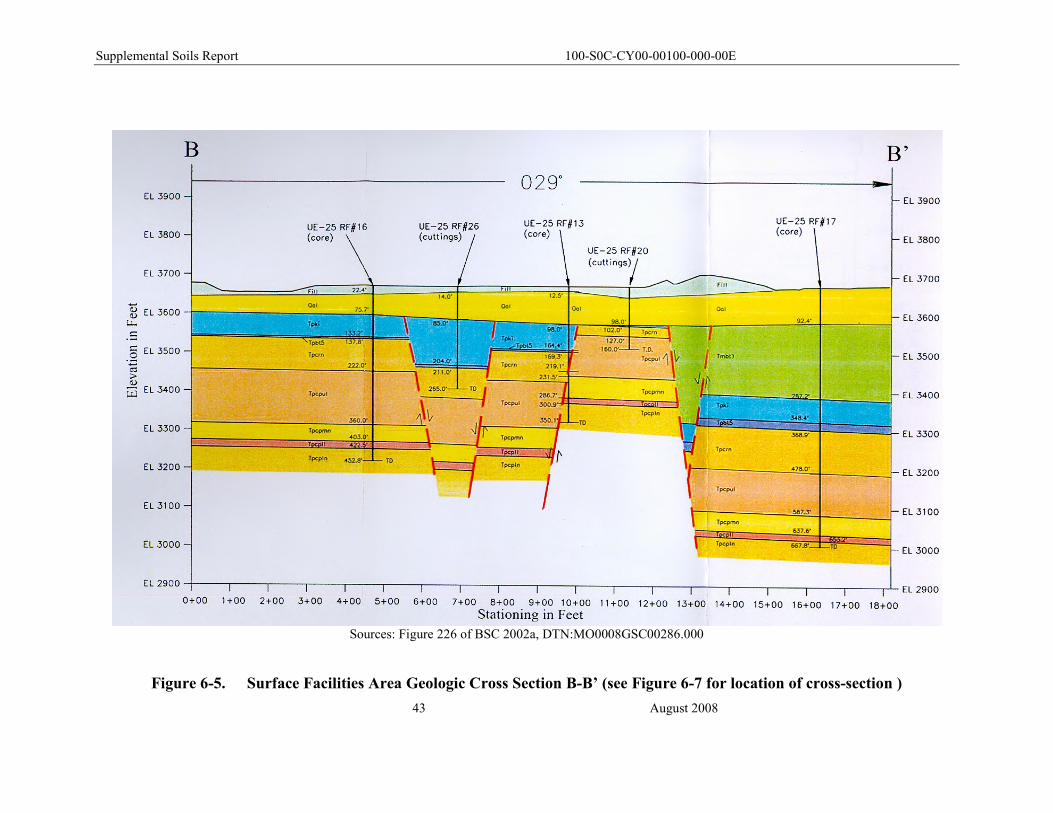
Supplemental Soils Report 100-S0C-CY00-00100-000-00E
Sources: Figure 226 of BSC 2002a, DTN:MO0008GSC00286.000
Figure 65. Surface Facilities Area Geologic Cross Section BB’ (see Figure 67 for location of crosssection )
43 August 2008
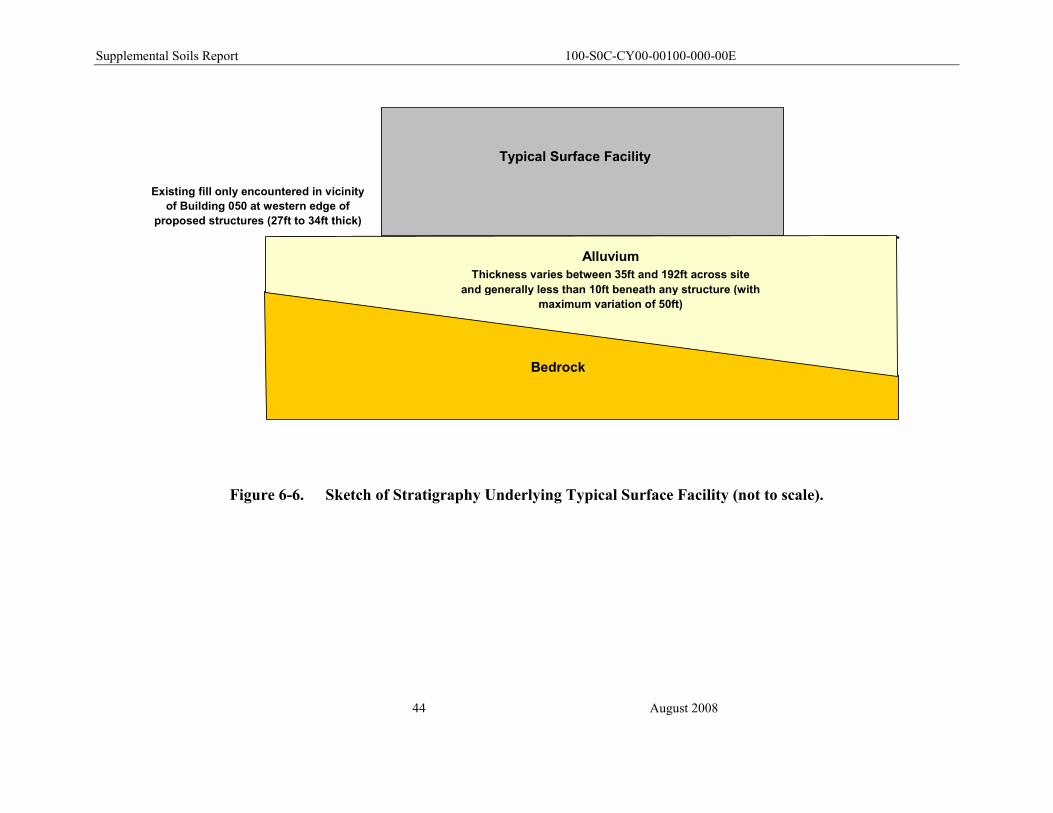
Supplemental Soils Report 100-S0C-CY00-00100-000-00E
Typical Surface Facility
Alluvium
Thickness varies between 35ft and 192ft across site and generally less than 10ft beneath any structure (with
maximum variation of 50ft) Bedrock
Existing fill only encountered in vicinity
of Building 050 at western edge of
proposed structures (27ft to 34ft thick)
Figure 66. Sketch of Stratigraphy Underlying Typical Surface Facility (not to scale).
44 August 2008
Supplemental Soils Report 100-S0C-CY00-00100-000-00E
6.2 FIELD EXPLORATION AND TESTING
The following sections summarize the soil investigations and field tests performed in the surface
facilities area. Soil investigations in the surface facilities area have been conducted since the
mid-1980s. Data obtained at the site (as presented in the BSC 2002a and BSC 2002b references)
is primarily relied upon as the direct input for the analyses contained in this report. The
subsurface investigations for BSC (2002a) and BSC (2002b) were performed in 2000 and 2001.
Additional investigations were performed in 2005 and 2006 (SNL 2008) that included borings
and test pits with associated field and laboratory testing, and SASW measurements. These latter
investigations were performed to augment and confirm the previously existing information and
to investigate subsurface conditions in new areas resulting from building layout reconfigurations.
Other data acquired from explorations prior to those covered in the BSC (2002a) and BSC
(2002b) investigations are used as corroborative information.
6.2.1 Field Exploration
6.2.1.1 Borings
Within the surface facilities area, 15 total boreholes (UE-25 RF#14 to RF#26, RF#28, and
RF#29) were drilled in 2000 using core hole and mud rotary drilling techniques. Depths of the
borings ranged from approximately 100 to 670 feet below top of bedrock (Table 4, BSC 2002a).
A previous boring (UE-25 RF#13) was cored in 1998 to a depth of approximately 350 feet
(Table 5, BSC 2002a).
Nineteen additional shallow borings were drilled in 2005 using the sonic coring technique to
depths varying between 104 feet and 417 feet, primarily to determine the depth of alluvium in
the surface facilities area and to augment the geologic understanding of the area. In addition, a
series of laboratory gradation tests were performed on selected samples of the alluvial material
obtained from two of the sonic cores. This information is provided in SNL (2008). SNL (2008)
also includes the depth of alluvium from twenty three additional boreholes drilled in 2006 and
the early part of 2007.
A boring designated as NRG#1 was drilled at the top of the nearby Exile Hill in 1992 (McKeown
1992). Studies performed between 1984 and 1985 (Neal 1985, and Neal 1986) produced
4 borings located within the surface facilities area (UE-25 RF#3, RF#3b, RF#9, and RF#11).
The coordinates of all borings drilled in the surface facilities area are provided in Table 6-1.
Their locations are shown in Figure 1-1. Figure 6-8 shows nearby boring locations, including
those drilled in 2005 and in 2006-2007, with respect to the planned building footprints. Note that
the full depth of some of the borings drilled in the 2006-2007 timeframe are not shown, as only
the upper portion of the boring logs was fully reviewed and qualified for use in this report.
However, the omission of the data from the lower portions of the boring logs has no effect on the
results, conclusions or recommendations of this report. As seen in the figure, numerous borings
were drilled northwest of the most recent proposed building layout due to changes in the building
arrangement during the course of the investigative studies. The depth of rock encountered in
45 August 2008
Supplemental Soils Report 100-S0C-CY00-00100-000-00E
each of the borings is indicated in Figure 6-9. In general, the rock depth increases from about 35
ft at the southwest end of the building area to as much as 192 ft at the northeast end. The depth
of fill encountered at each of the boring locations is depicted in Figure 6-10.
6.2.1.2 Test Pits and Trenches
Previous investigations in the surface facilities area during the 1980s and 1990s included
numerous excavations of shallow test pits (designated as NNWSI, SFS, NRSF, GSF and
MWV-P) and trenches (MWV-T). Documentation of these test pits is provided in Holmes &
Narver 1983, Ho et al. 1986, McKeown 1992, and Map ID SA95-9-15 of DOE 1995.
Investigations performed from 2000 to 2001 included four test pits (TP-WHB-1 to –4) excavated
in the surface facilities area. The test pits were each excavated to a depth of approximately
20 feet into the alluvial material. No fill was encountered in these test pits. A total of 22
samples of the alluvium were obtained from the four test pits for laboratory testing. The
locations of these 4 test pits are shown in Figure 1 in BSC (2002b).
In 2006 three additional test pits (TP-WHB-5, TP-WHB-6, and TP-WHB-7) were excavated in
the surface facilities area to observe subsurface conditions, to perform in situ density tests, and to
obtain both disturbed and undisturbed samples for laboratory testing. Each excavation extended
to about a 20-foot depth entirely within alluvium material well above bedrock. The 2006 test pit
locations are shown in Figure 1-1.
All test pit locations excavated within the site vicinity are shown in Figure 6-11 in relation to the
planned building footprints. Table 6-2 provides a summary of all known test pits and trenches
excavated in the surface facilities area.
Four disturbed samples of material to be potentially used as engineered fill were obtained from
the existing borrow area (Fran Ridge Borrow Area) at widely spaced locations. The location of
Fran Ridge is shown in Figure 6-12. Figure 6-12 (taken from Figure 213 of BSC 2002a) also
shows the sampling locations taken from the Fran Ridge Borrow Area. These samples were
combined into a composite sample and taken to offsite laboratory facilities for testing.
46 August 2008
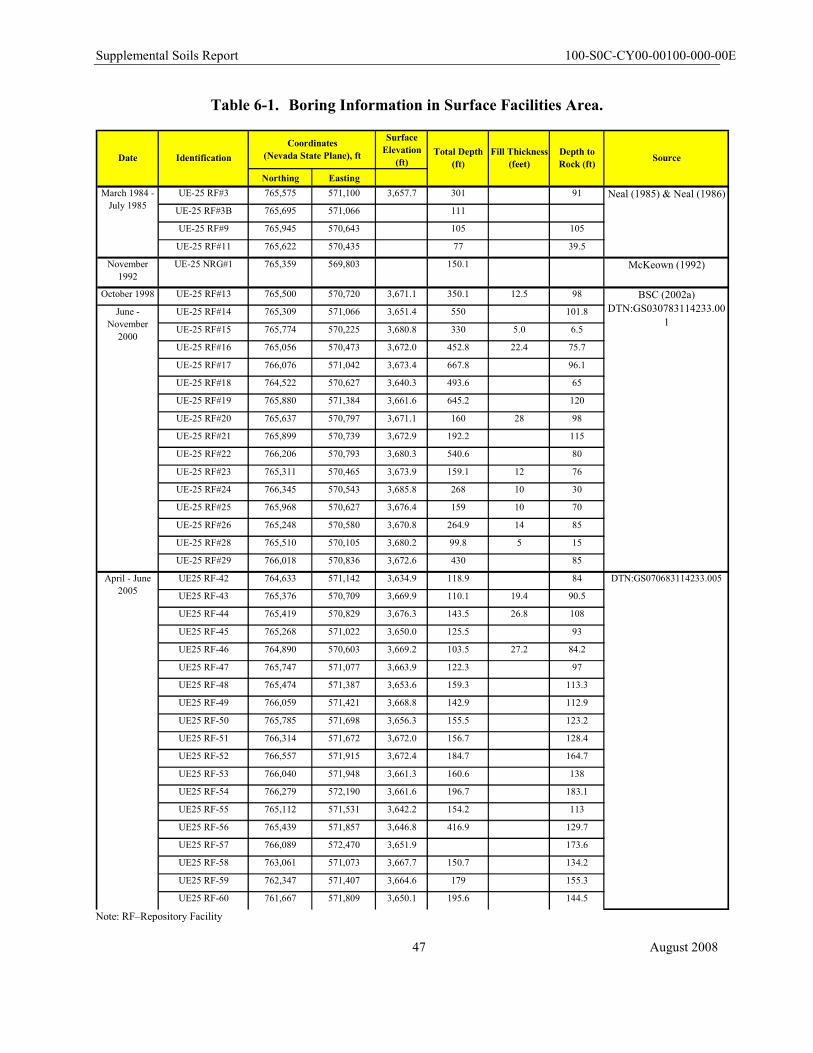
Supplemental Soils Report 100-S0C-CY00-00100-000-00E
Table 61. Boring Information in Surface Facilities Area.
Date Identification Coordinates
(Nevada State Plane), ft
Surface
Elevation (ft)
Total Depth (ft)
Fill Thickness (feet)
Depth to Rock (ft) Source
Northing Easting March 1984 -
July 1985
UE-25 RF#3 765,575 571,100 3,657.7 301 91 Neal (1985) & Neal (1986)
UE-25 RF#3B 765,695 571,066 111
UE-25 RF#9 765,945 570,643 105 105
UE-25 RF#11 765,622 570,435 77 39.5
November
1992
UE-25 NRG#1 765,359 569,803 150.1 McKeown (1992)
October 1998 UE-25 RF#13 765,500 570,720 3,671.1 350.1 12.5 98 BSC (2002a)
DTN:GS030783114233.00
1 June -
November
2000
UE-25 RF#14 765,309 571,066 3,651.4 550 101.8
UE-25 RF#15 765,774 570,225 3,680.8 330 5.0 6.5
UE-25 RF#16 765,056 570,473 3,672.0 452.8 22.4 75.7
UE-25 RF#17 766,076 571,042 3,673.4 667.8 96.1
UE-25 RF#18 764,522 570,627 3,640.3 493.6 65
UE-25 RF#19 765,880 571,384 3,661.6 645.2 120
UE-25 RF#20 765,637 570,797 3,671.1 160 28 98
UE-25 RF#21 765,899 570,739 3,672.9 192.2 115
UE-25 RF#22 766,206 570,793 3,680.3 540.6 80
UE-25 RF#23 765,311 570,465 3,673.9 159.1 12 76
UE-25 RF#24 766,345 570,543 3,685.8 268 10 30
UE-25 RF#25 765,968 570,627 3,676.4 159 10 70
UE-25 RF#26 765,248 570,580 3,670.8 264.9 14 85
UE-25 RF#28 765,510 570,105 3,680.2 99.8 5 15
UE-25 RF#29 766,018 570,836 3,672.6 430 85
April - June
2005
UE25 RF-42 764,633 571,142 3,634.9 118.9 84 DTN:GS070683114233.005
UE25 RF-43 765,376 570,709 3,669.9 110.1 19.4 90.5
UE25 RF-44 765,419 570,829 3,676.3 143.5 26.8 108
UE25 RF-45 765,268 571,022 3,650.0 125.5 93
UE25 RF-46 764,890 570,603 3,669.2 103.5 27.2 84.2
UE25 RF-47 765,747 571,077 3,663.9 122.3 97
UE25 RF-48 765,474 571,387 3,653.6 159.3 113.3
UE25 RF-49 766,059 571,421 3,668.8 142.9 112.9
UE25 RF-50 765,785 571,698 3,656.3 155.5 123.2
UE25 RF-51 766,314 571,672 3,672.0 156.7 128.4
UE25 RF-52 766,557 571,915 3,672.4 184.7 164.7
UE25 RF-53 766,040 571,948 3,661.3 160.6 138
UE25 RF-54 766,279 572,190 3,661.6 196.7 183.1
UE25 RF-55 765,112 571,531 3,642.2 154.2 113
UE25 RF-56 765,439 571,857 3,646.8 416.9 129.7
UE25 RF-57 766,089 572,470 3,651.9 173.6
UE25 RF-58 763,061 571,073 3,667.7 150.7 134.2
UE25 RF-59 762,347 571,407 3,664.6 179 155.3
UE25 RF-60 761,667 571,809 3,650.1 195.6 144.5
Note: RF–Repository Facility
47 August 2008
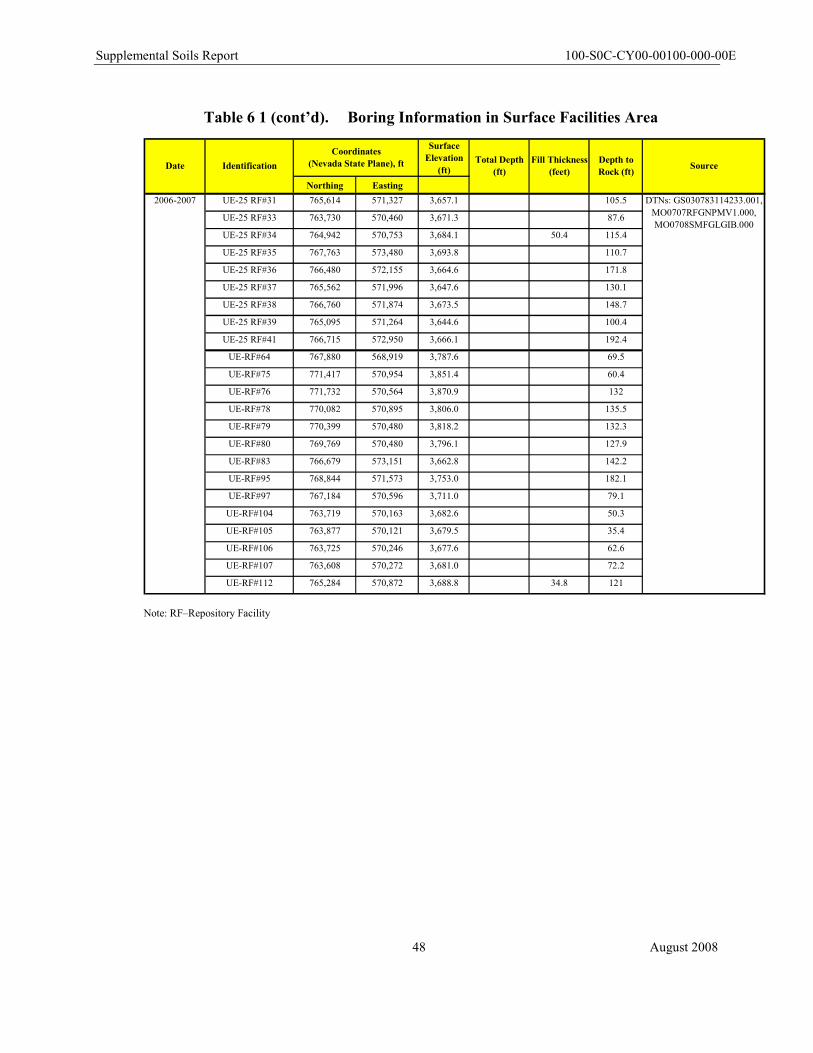
Supplemental Soils Report 100-S0C-CY00-00100-000-00E
Table 6 1 (cont’d). Boring Information in Surface Facilities Area
Date Identification Coordinates
(Nevada State Plane), ft
Surface Elevation
(ft) Total Depth
(ft) Fill Thickness
(feet) Depth to Rock (ft) Source
Northing Easting 2006-2007 UE-25 RF#31 765,614 571,327 3,657.1 105.5 DTNs: GS030783114233.001,
MO0707RFGNPMV1.000,
MO0708SMFGLGIB.000 UE-25 RF#33 763,730 570,460 3,671.3 87.6
UE-25 RF#34 764,942 570,753 3,684.1 50.4 115.4
UE-25 RF#35 767,763 573,480 3,693.8 110.7
UE-25 RF#36 766,480 572,155 3,664.6 171.8
UE-25 RF#37 765,562 571,996 3,647.6 130.1
UE-25 RF#38 766,760 571,874 3,673.5 148.7
UE-25 RF#39 765,095 571,264 3,644.6 100.4
UE-25 RF#41 766,715 572,950 3,666.1 192.4
UE-RF#64 767,880 568,919 3,787.6 69.5
UE-RF#75 771,417 570,954 3,851.4 60.4
UE-RF#76 771,732 570,564 3,870.9 132
UE-RF#78 770,082 570,895 3,806.0 135.5
UE-RF#79 770,399 570,480 3,818.2 132.3
UE-RF#80 769,769 570,480 3,796.1 127.9
UE-RF#83 766,679 573,151 3,662.8 142.2
UE-RF#95 768,844 571,573 3,753.0 182.1
UE-RF#97 767,184 570,596 3,711.0 79.1
UE-RF#104 763,719 570,163 3,682.6 50.3
UE-RF#105 763,877 570,121 3,679.5 35.4
UE-RF#106 763,725 570,246 3,677.6 62.6
UE-RF#107 763,608 570,272 3,681.0 72.2
UE-RF#112 765,284 570,872 3,688.8 34.8 121
Note: RF–Repository Facility
48 August 2008
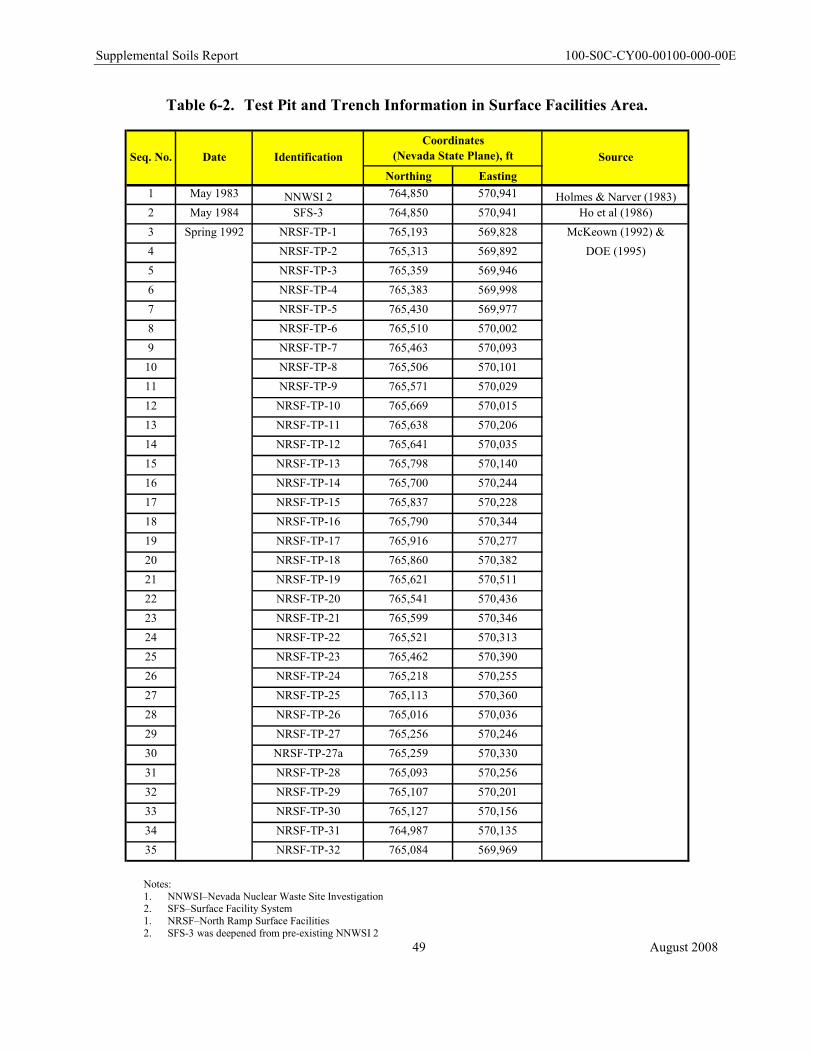
Supplemental Soils Report 100-S0C-CY00-00100-000-00E
Table 62. Test Pit and Trench Information in Surface Facilities Area.
Seq. No. Date Identification Coordinates
(Nevada State Plane), ft Source Northing Easting
1 May 1983 NNWSI 2 764,850 570,941 Holmes & Narver (1983)
2 May 1984 SFS-3 764,850 570,941 Ho et al (1986)
3 Spring 1992 NRSF-TP-1 765,193 569,828 McKeown (1992) &
DOE (1995) 4 NRSF-TP-2 765,313 569,892
5 NRSF-TP-3 765,359 569,946
6 NRSF-TP-4 765,383 569,998
7 NRSF-TP-5 765,430 569,977
8 NRSF-TP-6 765,510 570,002
9 NRSF-TP-7 765,463 570,093
10 NRSF-TP-8 765,506 570,101
11 NRSF-TP-9 765,571 570,029
12 NRSF-TP-10 765,669 570,015
13 NRSF-TP-11 765,638 570,206
14 NRSF-TP-12 765,641 570,035
15 NRSF-TP-13 765,798 570,140
16 NRSF-TP-14 765,700 570,244
17 NRSF-TP-15 765,837 570,228
18 NRSF-TP-16 765,790 570,344
19 NRSF-TP-17 765,916 570,277
20 NRSF-TP-18 765,860 570,382
21 NRSF-TP-19 765,621 570,511
22 NRSF-TP-20 765,541 570,436
23 NRSF-TP-21 765,599 570,346
24 NRSF-TP-22 765,521 570,313
25 NRSF-TP-23 765,462 570,390
26 NRSF-TP-24 765,218 570,255
27 NRSF-TP-25 765,113 570,360
28 NRSF-TP-26 765,016 570,036
29 NRSF-TP-27 765,256 570,246
30 NRSF-TP-27a 765,259 570,330
31 NRSF-TP-28 765,093 570,256
32 NRSF-TP-29 765,107 570,201
33 NRSF-TP-30 765,127 570,156
34 NRSF-TP-31 764,987 570,135
35 NRSF-TP-32 765,084 569,969
Notes:
1. NNWSI–Nevada Nuclear W aste Site Investigation 2. SFS–Surface Facility System
1. NRSF–North Ramp Surface Facilities
2. SFS-3 was deepened from pre-existing NNWSI 2
49 August 2008
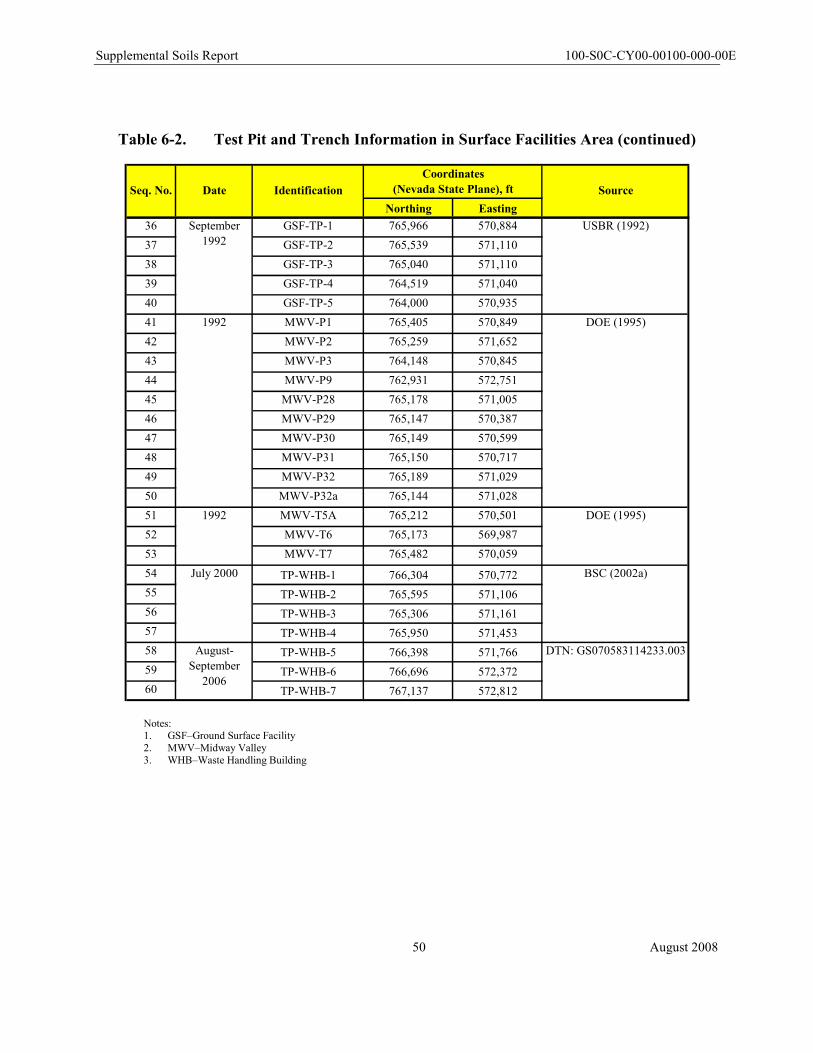
Supplemental Soils Report 100-S0C-CY00-00100-000-00E
Table 62. Test Pit and Trench Information in Surface Facilities Area (continued)
Seq. No. Date Identification Coordinates
(Nevada State Plane), ft Source Northing Easting
36 September
1992
GSF-TP-1 765,966 570,884 USBR (1992)
37 GSF-TP-2 765,539 571,110
38 GSF-TP-3 765,040 571,110
39 GSF-TP-4 764,519 571,040
40 GSF-TP-5 764,000 570,935
41 1992 MWV-P1 765,405 570,849 DOE (1995)
42 MWV-P2 765,259 571,652
43 MWV-P3 764,148 570,845
44 MWV-P9 762,931 572,751
45 MWV-P28 765,178 571,005
46 MWV-P29 765,147 570,387
47 MWV-P30 765,149 570,599
48 MWV-P31 765,150 570,717
49 MWV-P32 765,189 571,029
50 MWV-P32a 765,144 571,028
51 1992 MWV-T5A 765,212 570,501 DOE (1995)
52 MWV-T6 765,173 569,987
53 MWV-T7 765,482 570,059
54 July 2000 TP-WHB-1 766,304 570,772 BSC (2002a)
55 TP-WHB-2 765,595 571,106
56 TP-WHB-3 765,306 571,161
57 TP-WHB-4 765,950 571,453
58 August-
September
2006
TP-WHB-5 766,398 571,766 DTN: GS070583114233.003
59 TP-WHB-6 766,696 572,372
60 TP-WHB-7 767,137 572,812
Notes: 1. GSF–Ground Surface Facility
2. MWV–Midway Valley
3. WHB–Waste Handling Building
50 August 2008
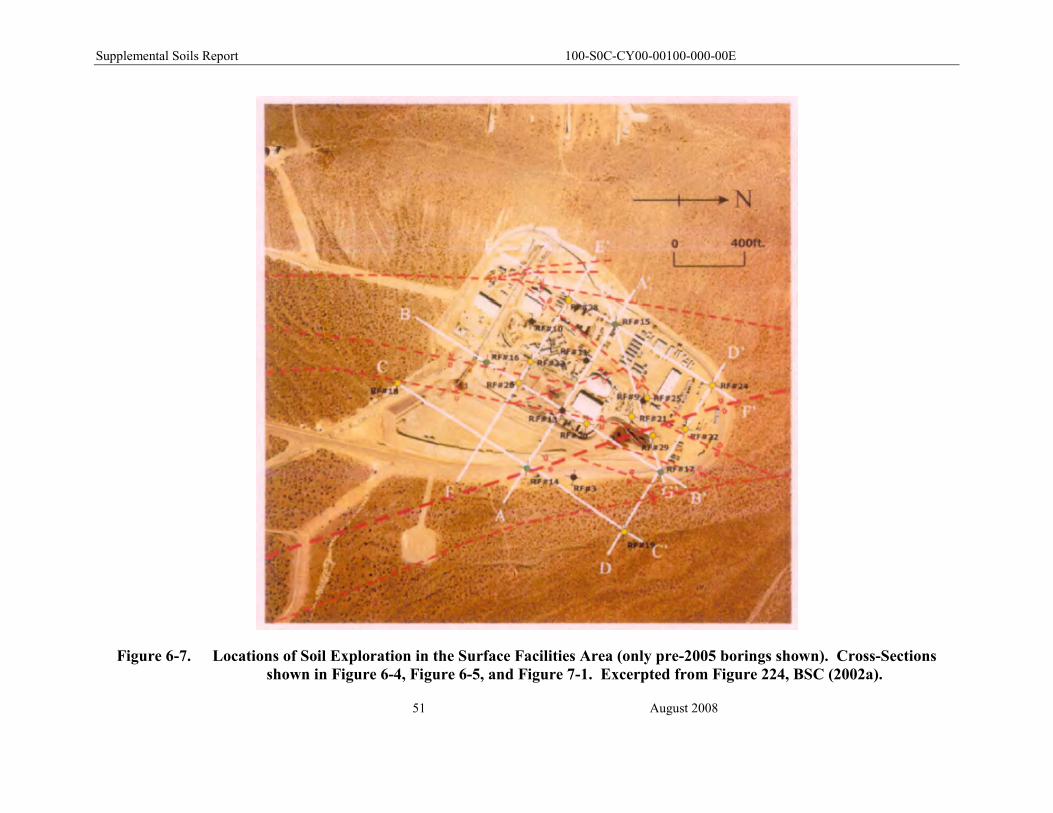
Supplemental Soils Report 100-S0C-CY00-00100-000-00E
Figure 67. Locations of Soil Exploration in the Surface Facilities Area (only pre2005 borings shown). CrossSections
shown in Figure 64, Figure 65, and Figure 71. Excerpted from Figure 224, BSC (2002a).
51 August 2008
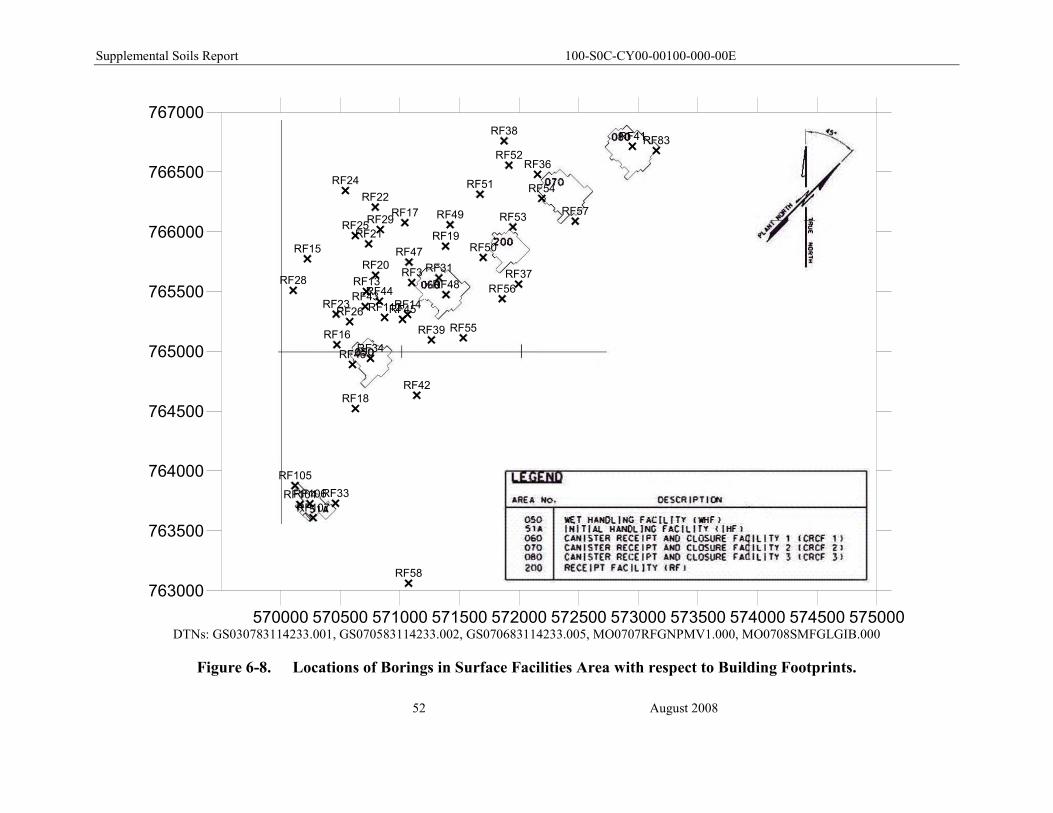
Supplemental Soils Report 100-S0C-CY00-00100-000-00E
767000
766500
766000
765500
765000
764500
764000
763500
763000
570000 570500 571000 571500 572000 572500 573000 573500 574000 574500 575000
RF3
RF13
RF14
RF15
RF16
RF17
RF18
RF19
RF20
RF21
RF22
RF23
RF24
RF25
RF26
RF28
RF29
RF31
RF33
RF34
RF36
RF37
RF38
RF39
RF41
RF42
RF43RF44
RF45
RF46
RF47
RF48
RF49
RF50
RF51
RF52
RF53
RF54
RF55
RF56
RF57
RF58
RF83
RF104
RF105
RF106
RF107
RF112 DTNs: GS030783114233.001, GS070583114233.002, GS070683114233.005, MO0707RFGNPMV1.000, MO0708SMFGLGIB.000
Figure 68. Locations of Borings in Surface Facilities Area with respect to Building Footprints.
52 August 2008
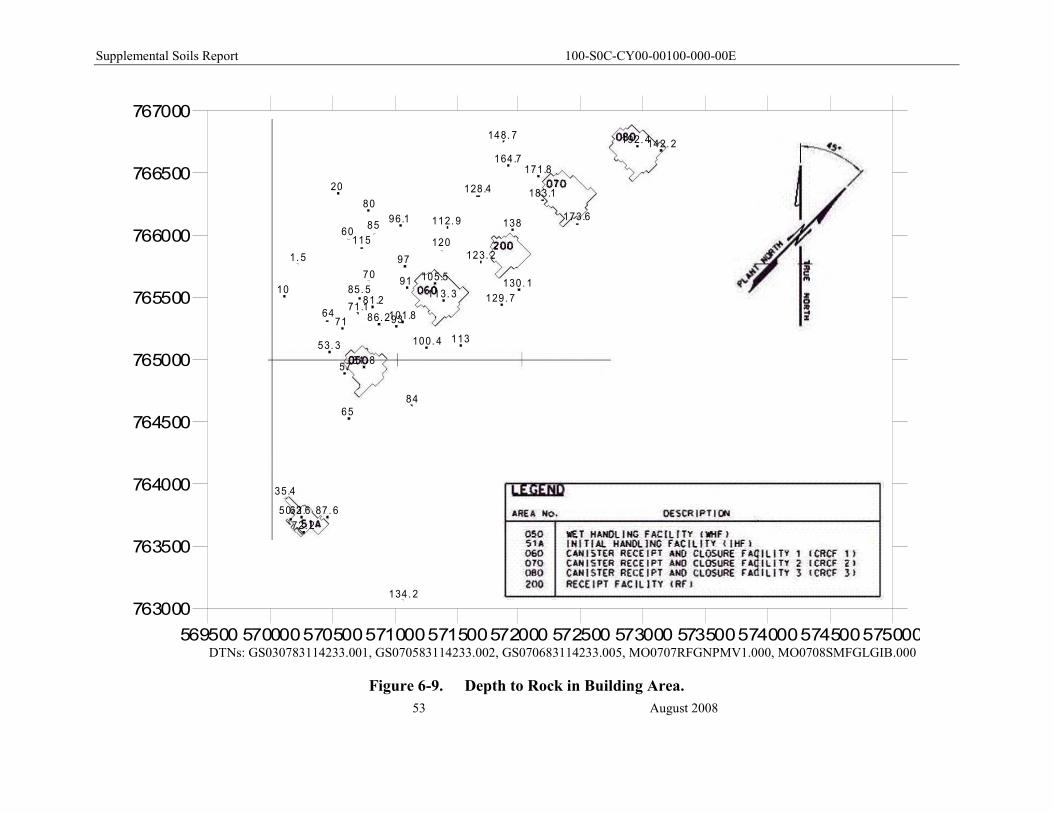
53 August 2008
Supplemental Soils Report 100-S0C-CY00-00100-000-00E
767000
766500
766000
765500
765000
764500
764000
763500
763000
91
85 . 5
1 01 .8
1. 5
5 3. 3
9 6.1
6 5
12 0
7 0
11 5
8 0
6 4
20
6 0
71
10
8 5
10 5.5
87 . 6
81 . 8
17 1.8
1 30 . 1
14 8. 7
10 0. 4
19 2. 4 8 4
71 .1 8 1.2
93
57
9 7
11 3. 3
11 2. 9
12 3. 2
1 28 .4
1 64 .7
1 38
18 3.1
1 13
1 29 . 7
17 3.6
1 34 . 2
14 2. 2
5 0. 3
3 5.4
62 .6
7 2. 2
8 6. 2
569500 570000570500571000571500572000 572500 573000 573500574000574500575000
DTNs: GS030783114233.001, GS070583114233.002, GS070683114233.005, MO0707RFGNPMV1.000, MO0708SMFGLGIB.000
Figure 69. Depth to Rock in Building Area.
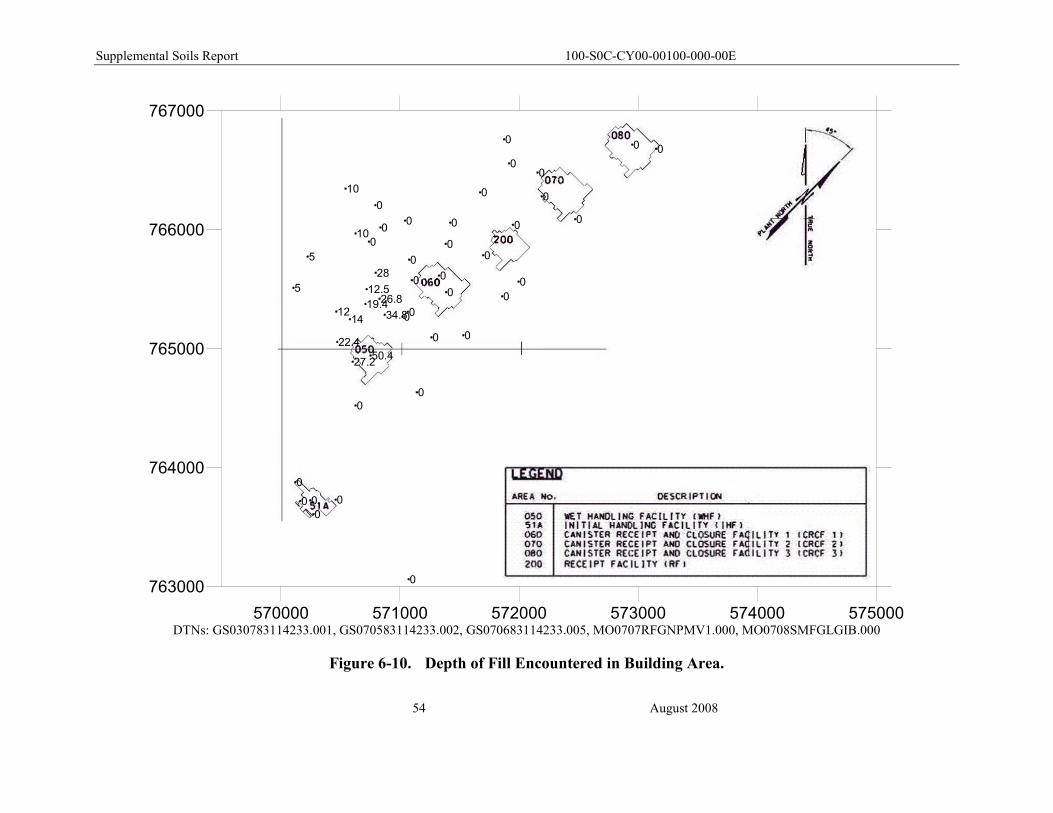
Supplemental Soils Report 100-S0C-CY00-00100-000-00E
767000
766000
765000
764000
763000
0
12.5
0
5
22.4
0
0
0
28
0
0
12
10
10
14
5
0
0
0
50.4
0
0
0
0
0 0
19.426.8
0
27.2
0
0
0
0
0
0
0
0
0
0
0
0
0
0
0
0
0
34.8
570000 571000 572000 573000 574000 575000
DTNs: GS030783114233.001, GS070583114233.002, GS070683114233.005, MO0707RFGNPMV1.000, MO0708SMFGLGIB.000
Figure 610. Depth of Fill Encountered in Building Area.
54 August 2008
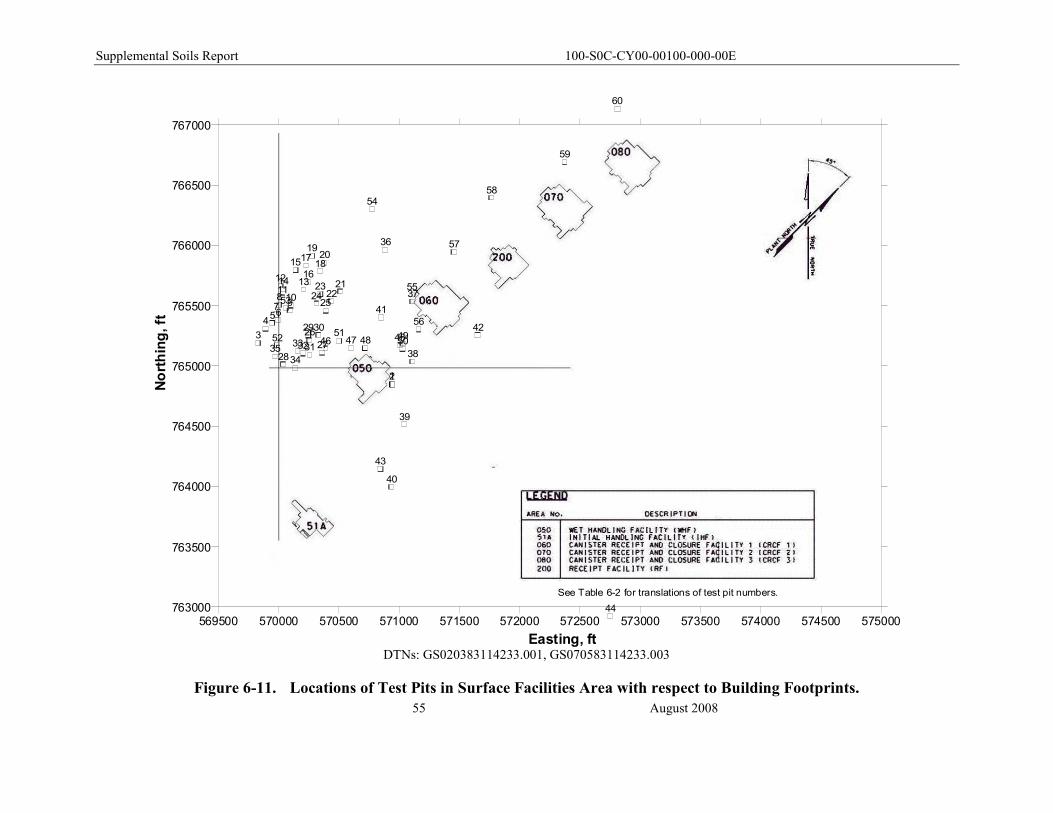
60
Nort
hin
g, f
t
767000
766500
766000
765500
765000
764500
764000
763500
763000
569500 570000 570500 571000 571500 572000 572500 573000 573500 574000 574500 575000
12
3
456 7
8
910
11
12 1314
15
16
17
18
19
20
21
22
23
24
25
26
27
28
2930
313233
34
35
36
37
38
39
40
41
42
43
44
4546 47 48 504951
52
53
54
55
56
57
58
59
See Table 62 for translations of test pit numbers.
Easting, ft
Supplemental Soils Report 100-S0C-CY00-00100-000-00E
DTNs: GS020383114233.001, GS070583114233.003
Figure 611. Locations of Test Pits in Surface Facilities Area with respect to Building Footprints.
55 August 2008
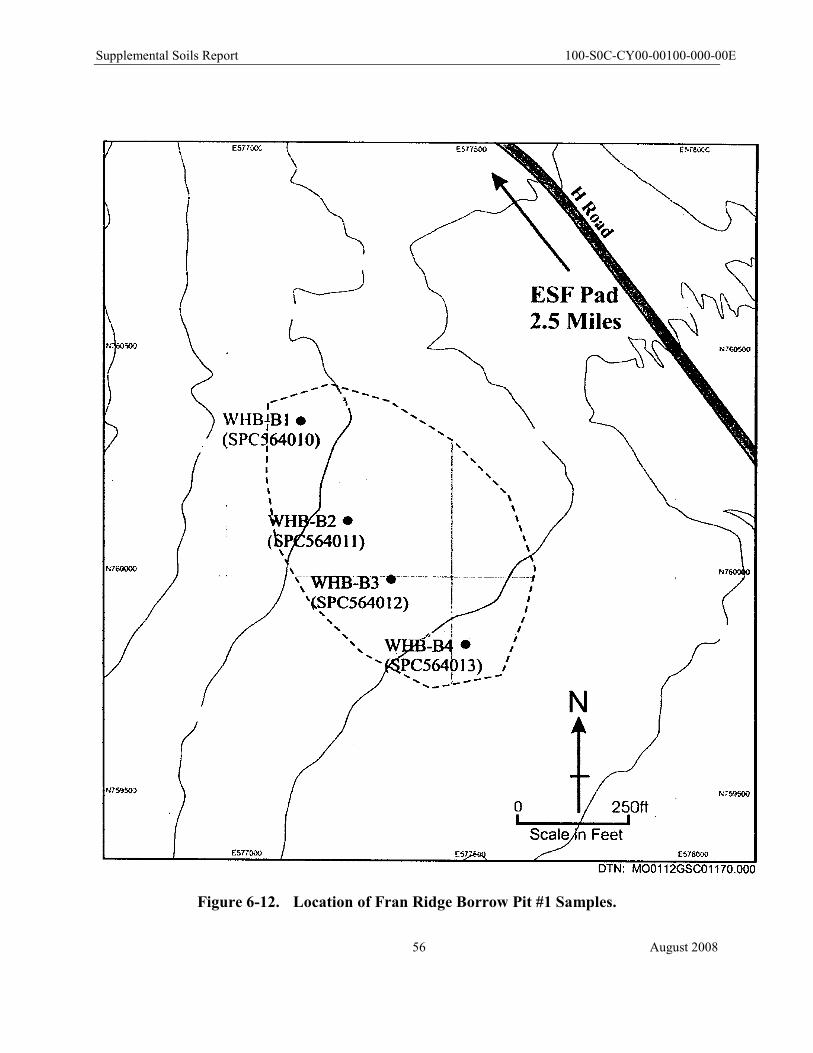
Supplemental Soils Report 100-S0C-CY00-00100-000-00E
Figure 612. Location of Fran Ridge Borrow Pit #1 Samples.
56 August 2008
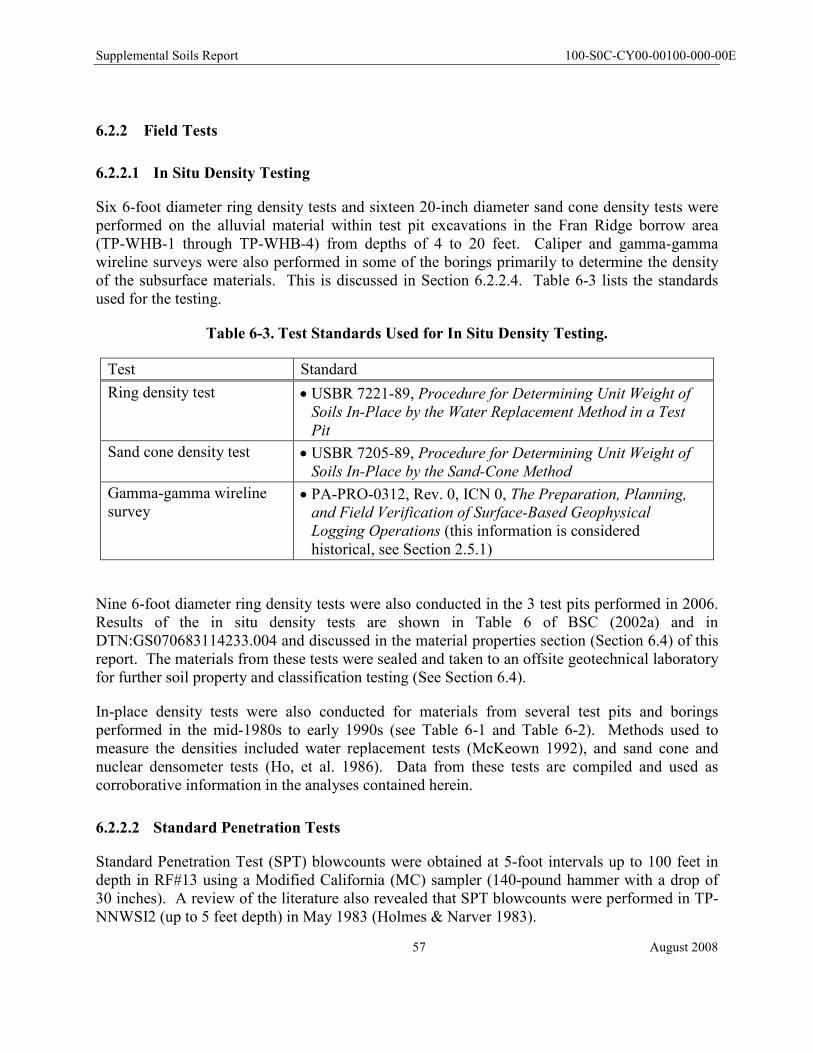
Supplemental Soils Report 100-S0C-CY00-00100-000-00E
6.2.2 Field Tests
6.2.2.1 In Situ Density Testing
Six 6-foot diameter ring density tests and sixteen 20-inch diameter sand cone density tests were
performed on the alluvial material within test pit excavations in the Fran Ridge borrow area
(TP-WHB-1 through TP-WHB-4) from depths of 4 to 20 feet. Caliper and gamma-gamma
wireline surveys were also performed in some of the borings primarily to determine the density
of the subsurface materials. This is discussed in Section 6.2.2.4. Table 6-3 lists the standards
used for the testing.
Table 63. Test Standards Used for In Situ Density Testing.
Test Standard
Ring density test • USBR 7221-89, Procedure for Determining Unit Weight of Soils InPlace by the Water Replacement Method in a Test Pit
Sand cone density test • USBR 7205-89, Procedure for Determining Unit Weight of Soils InPlace by the SandCone Method
Gamma-gamma wireline
survey • PA-PRO-0312, Rev. 0, ICN 0, The Preparation, Planning,
and Field Verification of SurfaceBased Geophysical
Logging Operations (this information is considered
historical, see Section 2.5.1)
Nine 6-foot diameter ring density tests were also conducted in the 3 test pits performed in 2006.
Results of the in situ density tests are shown in Table 6 of BSC (2002a) and in
DTN:GS070683114233.004 and discussed in the material properties section (Section 6.4) of this
report. The materials from these tests were sealed and taken to an offsite geotechnical laboratory
for further soil property and classification testing (See Section 6.4).
In-place density tests were also conducted for materials from several test pits and borings
performed in the mid-1980s to early 1990s (see Table 6-1 and Table 6-2). Methods used to
measure the densities included water replacement tests (McKeown 1992), and sand cone and
nuclear densometer tests (Ho, et al. 1986). Data from these tests are compiled and used as
corroborative information in the analyses contained herein.
6.2.2.2 Standard Penetration Tests
Standard Penetration Test (SPT) blowcounts were obtained at 5-foot intervals up to 100 feet in
depth in RF#13 using a Modified California (MC) sampler (140-pound hammer with a drop of
30 inches). A review of the literature also revealed that SPT blowcounts were performed in TP-
NNWSI2 (up to 5 feet depth) in May 1983 (Holmes & Narver 1983).
57 August 2008
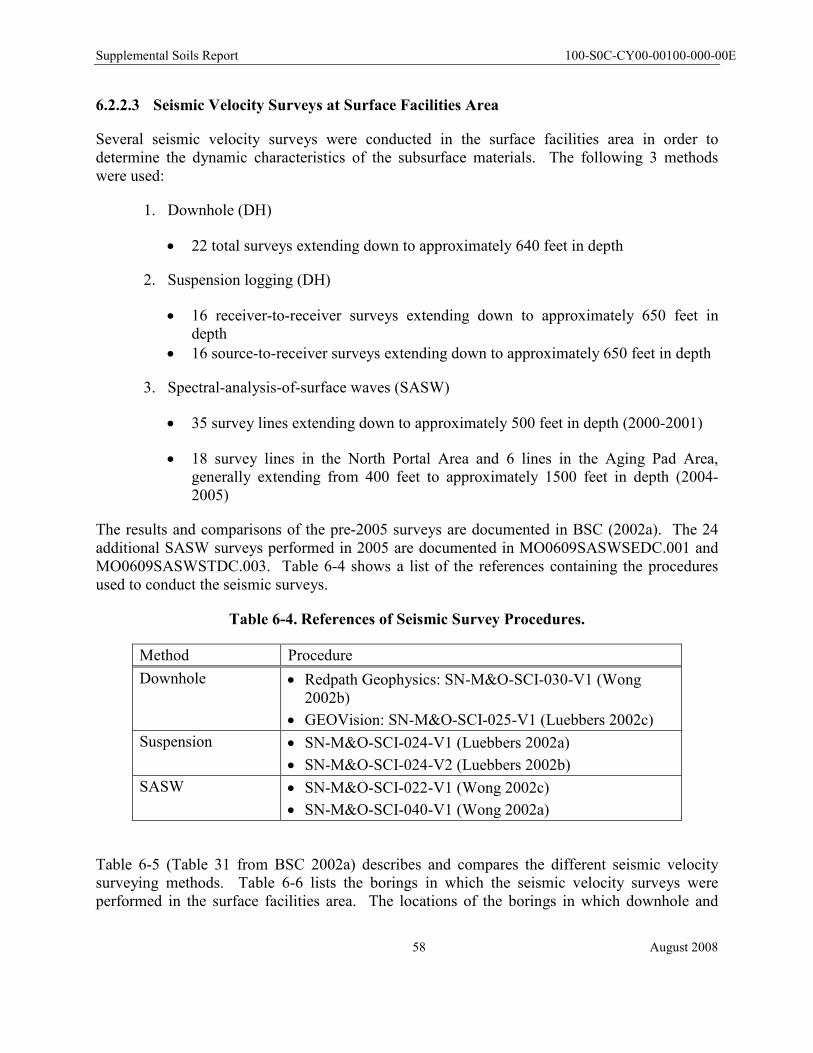
Supplemental Soils Report 100-S0C-CY00-00100-000-00E
6.2.2.3 Seismic Velocity Surveys at Surface Facilities Area
Several seismic velocity surveys were conducted in the surface facilities area in order to
determine the dynamic characteristics of the subsurface materials. The following 3 methods
were used:
1. Downhole (DH)
• 22 total surveys extending down to approximately 640 feet in depth
2. Suspension logging (DH)
•� 16 receiver-to-receiver surveys extending down to approximately 650 feet in
depth
•� 16 source-to-receiver surveys extending down to approximately 650 feet in depth
3. Spectral-analysis-of-surface waves (SASW)
•� 35 survey lines extending down to approximately 500 feet in depth (2000-2001)
•� 18 survey lines in the North Portal Area and 6 lines in the Aging Pad Area,
generally extending from 400 feet to approximately 1500 feet in depth (2004-
2005)
The results and comparisons of the pre-2005 surveys are documented in BSC (2002a). The 24
additional SASW surveys performed in 2005 are documented in MO0609SASWSEDC.001 and
MO0609SASWSTDC.003. Table 6-4 shows a list of the references containing the procedures
used to conduct the seismic surveys.
Table 64. References of Seismic Survey Procedures.
Method Procedure
Downhole • Redpath Geophysics: SN-M&O-SCI-030-V1 (Wong
2002b)
• GEOVision: SN-M&O-SCI-025-V1 (Luebbers 2002c)
Suspension • SN-M&O-SCI-024-V1 (Luebbers 2002a)
• SN-M&O-SCI-024-V2 (Luebbers 2002b)
SASW • SN-M&O-SCI-022-V1 (Wong 2002c)
• SN-M&O-SCI-040-V1 (Wong 2002a)
Table 6-5 (Table 31 from BSC 2002a) describes and compares the different seismic velocity
surveying methods. Table 6-6 lists the borings in which the seismic velocity surveys were
performed in the surface facilities area. The locations of the borings in which downhole and
58 August 2008

Supplemental Soils Report 100-S0C-CY00-00100-000-00E
suspension seismic surveys were performed are shown in Figure 1-1. Figure 6-13 (Figure 6.2-7
of SNL 2008) shows the locations of SASW lines at the surface facilities site.
59 August 2008
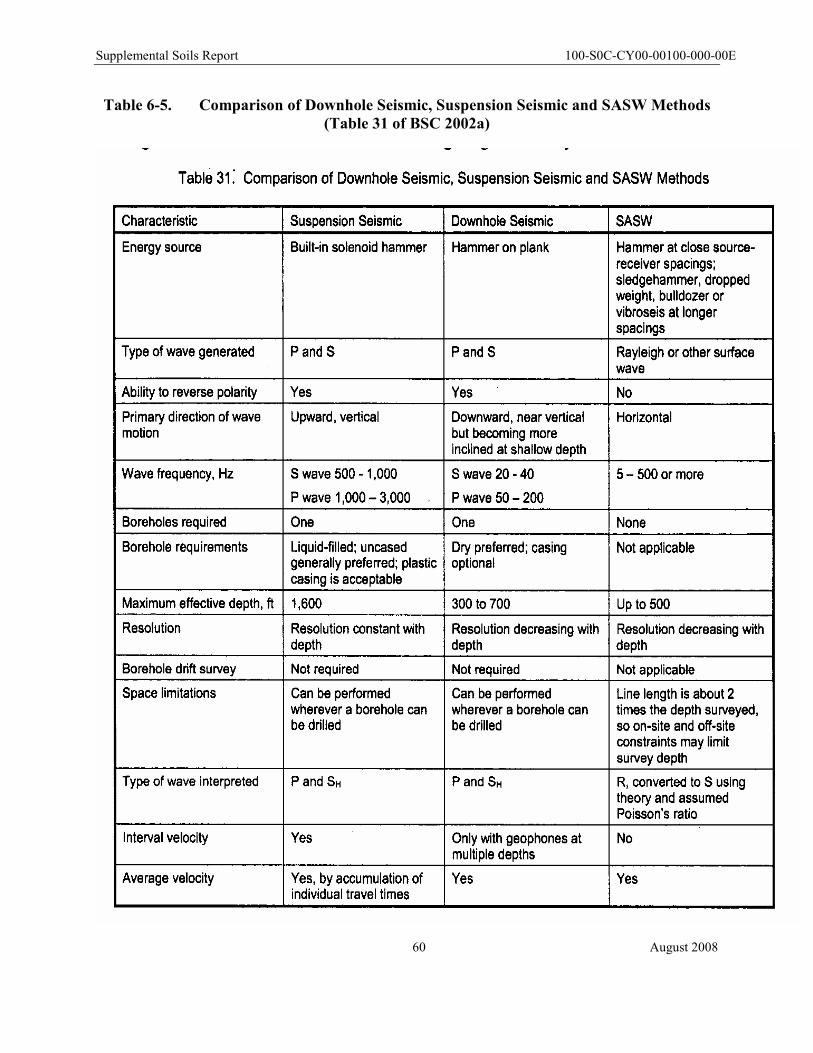
Supplemental Soils Report 100-S0C-CY00-00100-000-00E
Table 65. Comparison of Downhole Seismic, Suspension Seismic and SASW Methods (Table 31 of BSC 2002a)
60 August 2008
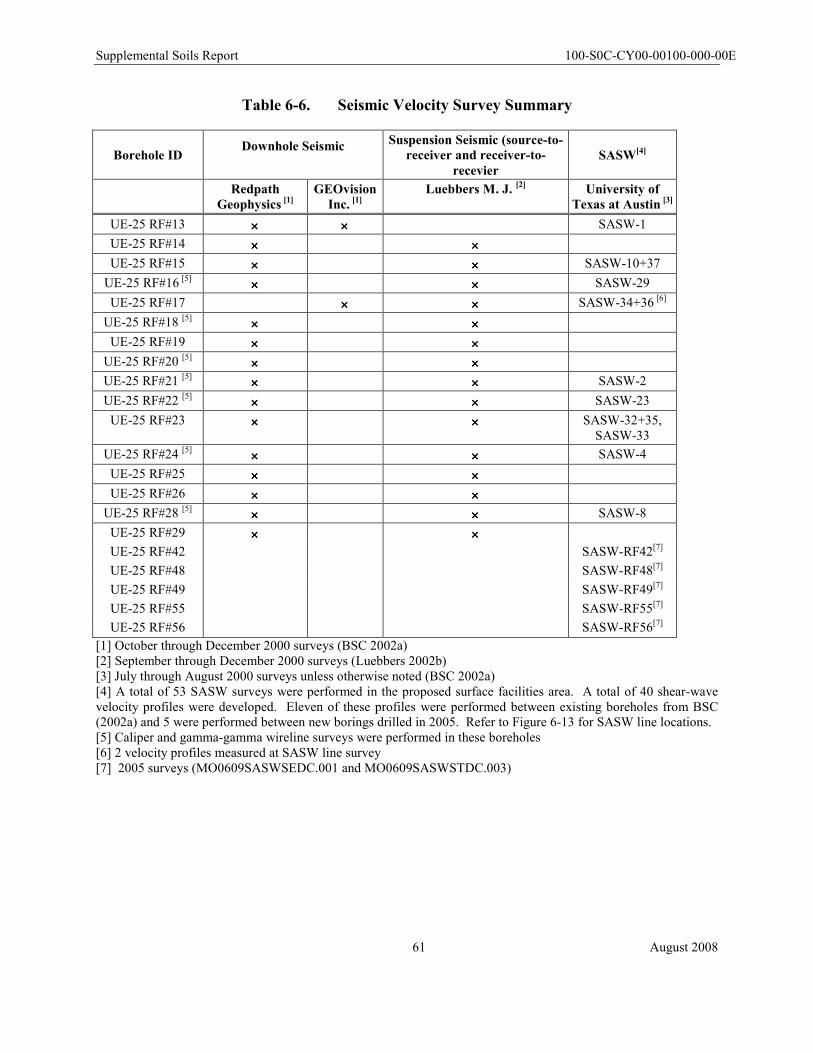
Supplemental Soils Report 100-S0C-CY00-00100-000-00E
Table 66. Seismic Velocity Survey Summary
Borehole ID Downhole Seismic Suspension Seismic (sourceto
receiver and receivertorecevier
SASW[4]
Redpath Geophysics [1]
GEOvision Inc. [1]
Luebbers M. J. [2] University of Texas at Austin [3]
UE-25 RF#13 ×××× ×××× SASW-1
UE-25 RF#14 ×××× ×××× UE-25 RF#15 ×××× ×××× SASW-10+37
UE-25 RF#16 [5] ×××× ×××× SASW-29
UE-25 RF#17 ×××× ×××× SASW-34+36 [6]
UE-25 RF#18 [5] ×××× ××××
UE-25 RF#19 ×××× ×××× UE-25 RF#20
[5] ×××× ×××× UE-25 RF#21
[5] ×××× ×××× SASW-2
UE-25 RF#22 [5] ×××× ×××× SASW-23
UE-25 RF#23 ×××× ×××× SASW-32+35,
SASW-33
UE-25 RF#24 [5] ×××× ×××× SASW-4
UE-25 RF#25 ×××× ×××× UE-25 RF#26 ×××× ××××
UE-25 RF#28 [5] ×××× ×××× SASW-8
UE-25 RF#29
UE-25 RF#42
UE-25 RF#48
UE-25 RF#49
UE-25 RF#55
UE-25 RF#56
×××× ×××× SASW-RF42
[7]
SASW-RF48[7]
SASW-RF49[7]
SASW-RF55[7]
SASW-RF56[7]
[1] October through December 2000 surveys (BSC 2002a)
[2] September through December 2000 surveys (Luebbers 2002b)
[3] July through August 2000 surveys unless otherwise noted (BSC 2002a)
[4] A total of 53 SASW surveys were performed in the proposed surface facilities area. A total of 40 shear-wave
velocity profiles were developed. Eleven of these profiles were performed between existing boreholes from BSC
(2002a) and 5 were performed between new borings drilled in 2005. Refer to Figure 6-13 for SASW line locations.
[5] Caliper and gamma-gamma wireline surveys were performed in these boreholes
[6] 2 velocity profiles measured at SASW line survey
[7] 2005 surveys (MO0609SASWSEDC.001 and MO0609SASWSTDC.003)
61 August 2008
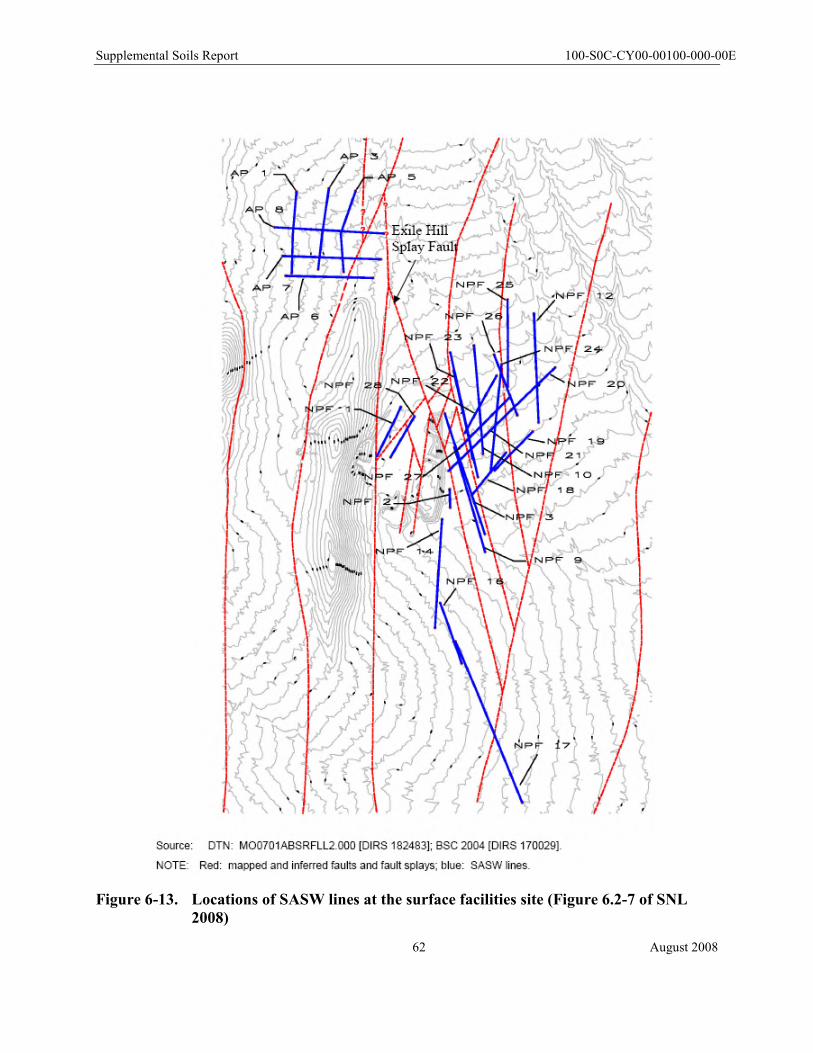
Supplemental Soils Report 100-S0C-CY00-00100-000-00E
Figure 613. Locations of SASW lines at the surface facilities site (Figure 6.27 of SNL 2008)
62 August 2008
Supplemental Soils Report 100-S0C-CY00-00100-000-00E
6.2.2.4 Borehole Wireline
Caliper and gamma-gamma wireline surveys were performed in 7 boreholes (RF#16, #18, #20,
#21, #22, #24, and #28.). Caliper measurements were performed in order to assess the extent of
erosion of the borehole walls by the drilling fluid and its potential effects on the suspension
seismic results. The main purpose of performing the gamma-gamma measurements was to
evaluate the density of the subsurface materials.
The process established in PA-PRO-0312, Yucca Mountain Site Characterization Project Field
Verification of Geophysical Operation, and AP-SIII.6Q, Geophysical Logging Programs for
Surface-Based Testing Program Boreholes, were followed for both the caliper and gamma-
gamma wireline surveys. The information in these cancelled or superseded documents is
considered historical (see Section 2.5.1).
6.3 LABORATORY TESTING
This section discusses laboratory testing conducted on samples taken during 2000 to 2007 from
the borings and test pits performed at the surface facilities area.
6.3.1 Static Testing
Documentation of all static laboratory testing prior to 2005 is found in Sections 6.2.9 and 6.5.2
of BSC (2002a) for the alluvial and borrow pit materials, respectively. More recent test results
are provided in Section 6.2 of SNL (2008). A summary of the static laboratory test results is
presented in Section 6.4 of this report.
6.3.1.1 Alluvium
Static tests were performed on 22 samples of alluvial material obtained from test pits TP-WHB-1
through TP-WHB-4, and on 9 samples from TP-WHB-5 through TP-WHB-7. The tests
conducted and the testing standards used are listed in Table 6-7.
63 August 2008
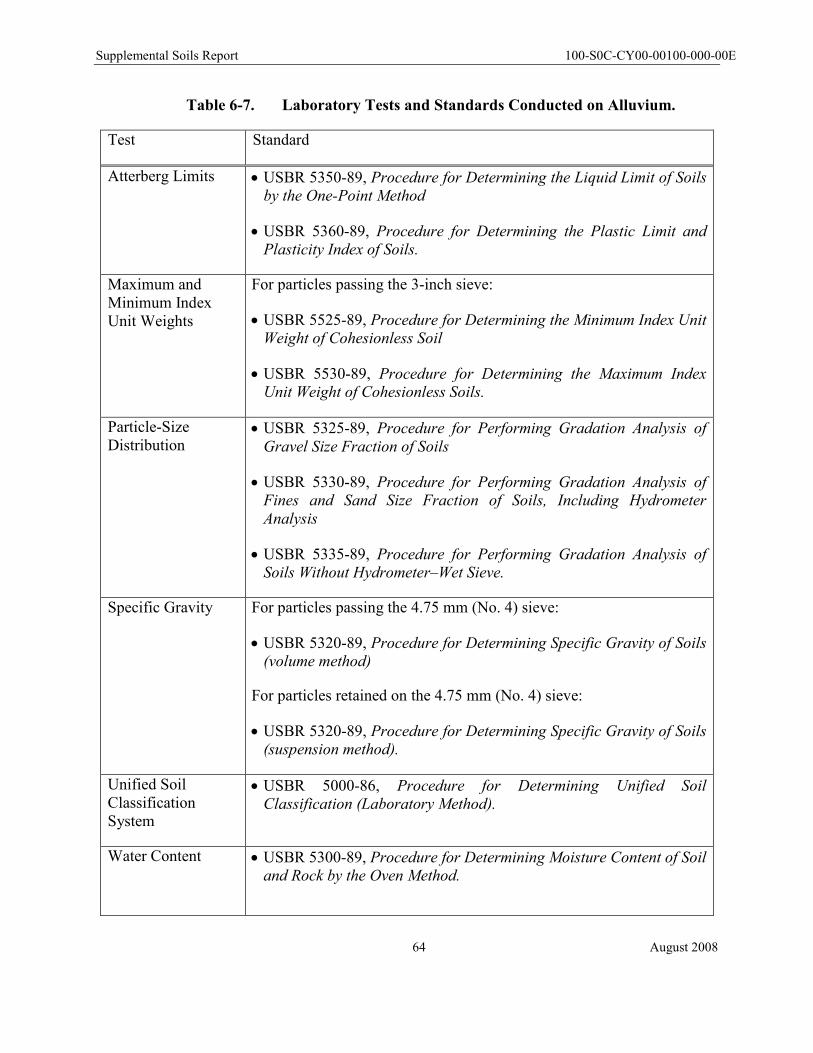
Supplemental Soils Report 100-S0C-CY00-00100-000-00E
Table 67. Laboratory Tests and Standards Conducted on Alluvium.
Test Standard
Atterberg Limits • USBR 5350-89, Procedure for Determining the Liquid Limit of Soils by the OnePoint Method
• USBR 5360-89, Procedure for Determining the Plastic Limit and Plasticity Index of Soils.
Maximum and For particles passing the 3-inch sieve:
Minimum Index
Unit Weights • USBR 5525-89, Procedure for Determining the Minimum Index Unit Weight of Cohesionless Soil
• USBR 5530-89, Procedure for Determining the Maximum Index Unit Weight of Cohesionless Soils.
Particle-Size • USBR 5325-89, Procedure for Performing Gradation Analysis of Distribution Gravel Size Fraction of Soils
• USBR 5330-89, Procedure for Performing Gradation Analysis of Fines and Sand Size Fraction of Soils, Including Hydrometer Analysis
• USBR 5335-89, Procedure for Performing Gradation Analysis of Soils Without Hydrometer–Wet Sieve.
Specific Gravity For particles passing the 4.75 mm (No. 4) sieve:
• USBR 5320-89, Procedure for Determining Specific Gravity of Soils
(volume method)
For particles retained on the 4.75 mm (No. 4) sieve:
• USBR 5320-89, Procedure for Determining Specific Gravity of Soils
(suspension method).
Unified Soil
Classification
System
• USBR 5000-86, Procedure for Determining Unified Soil Classification (Laboratory Method).
Water Content • USBR 5300-89, Procedure for Determining Moisture Content of Soil and Rock by the Oven Method.
64 August 2008
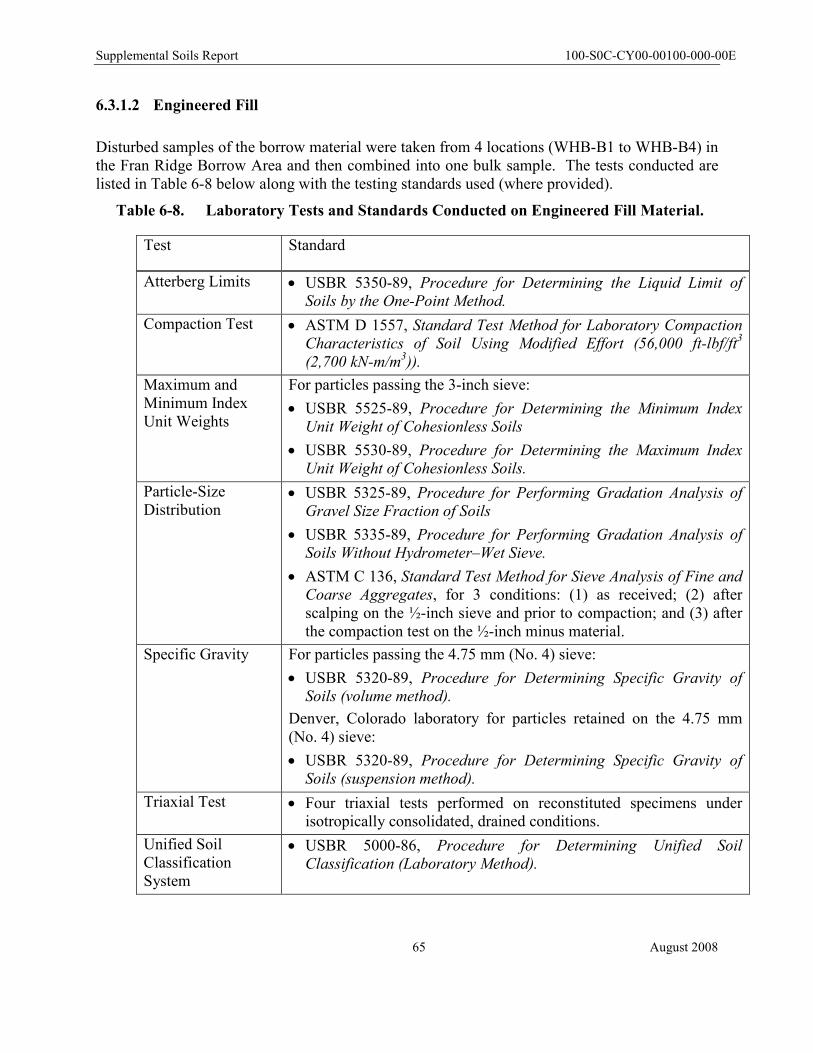
Supplemental Soils Report 100-S0C-CY00-00100-000-00E
6.3.1.2 Engineered Fill
Disturbed samples of the borrow material were taken from 4 locations (WHB-B1 to WHB-B4) in
the Fran Ridge Borrow Area and then combined into one bulk sample. The tests conducted are
listed in Table 6-8 below along with the testing standards used (where provided).
Table 68. Laboratory Tests and Standards Conducted on Engineered Fill Material.
Test Standard
Atterberg Limits • USBR 5350-89, Procedure for Determining the Liquid Limit of Soils by the OnePoint Method.
Compaction Test • ASTM D 1557, Standard Test Method for Laboratory Compaction Characteristics of Soil Using Modified Effort (56,000 ftlbf/ft
3
(2,700 kNm/m3)).
Maximum and For particles passing the 3-inch sieve:
Minimum Index • USBR 5525-89, Procedure for Determining the Minimum Index Unit Weights Unit Weight of Cohesionless Soils
• USBR 5530-89, Procedure for Determining the Maximum Index Unit Weight of Cohesionless Soils.
Particle-Size • USBR 5325-89, Procedure for Performing Gradation Analysis of Distribution Gravel Size Fraction of Soils
• USBR 5335-89, Procedure for Performing Gradation Analysis of Soils Without Hydrometer–Wet Sieve.
• ASTM C 136, Standard Test Method for Sieve Analysis of Fine and Coarse Aggregates, for 3 conditions: (1) as received; (2) after
scalping on the ½-inch sieve and prior to compaction; and (3) after
the compaction test on the ½-inch minus material.
Specific Gravity For particles passing the 4.75 mm (No. 4) sieve:
• USBR 5320-89, Procedure for Determining Specific Gravity of Soils (volume method).
Denver, Colorado laboratory for particles retained on the 4.75 mm
(No. 4) sieve:
• USBR 5320-89, Procedure for Determining Specific Gravity of Soils (suspension method).
Triaxial Test • Four triaxial tests performed on reconstituted specimens under
isotropically consolidated, drained conditions.
Unified Soil
Classification
System
• USBR 5000-86, Procedure for Determining Unified Soil Classification (Laboratory Method).
65 August 2008
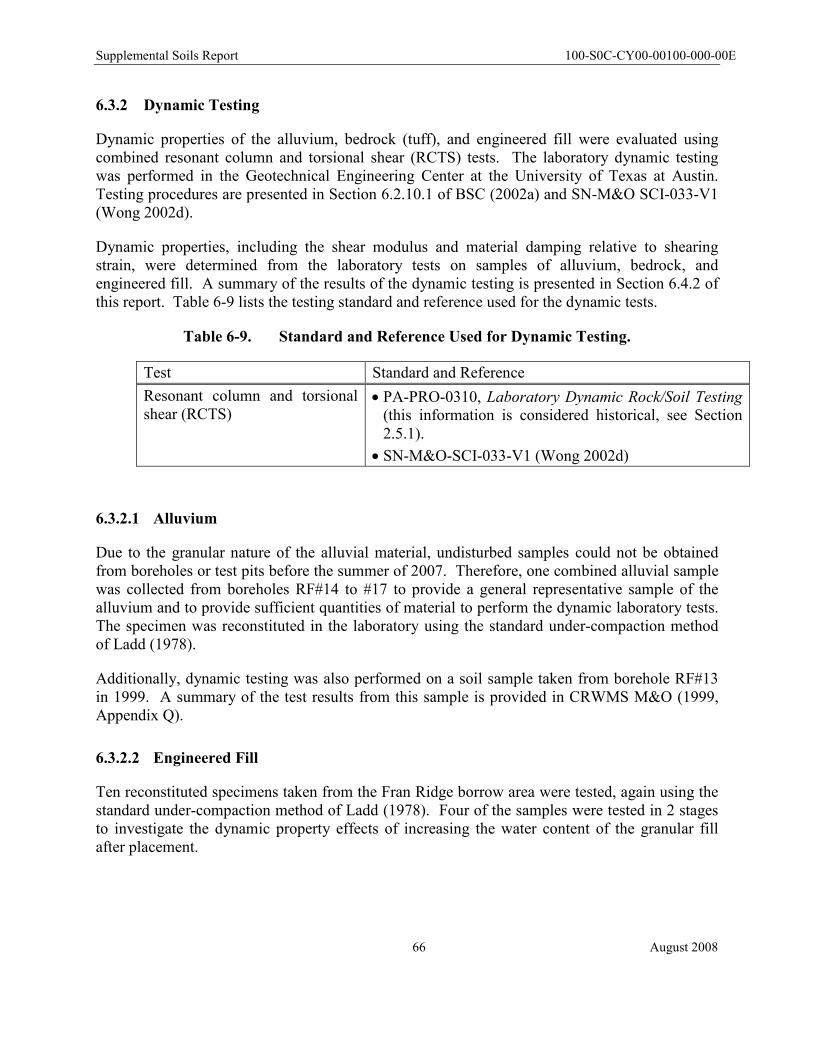
Supplemental Soils Report 100-S0C-CY00-00100-000-00E
6.3.2 Dynamic Testing
Dynamic properties of the alluvium, bedrock (tuff), and engineered fill were evaluated using
combined resonant column and torsional shear (RCTS) tests. The laboratory dynamic testing
was performed in the Geotechnical Engineering Center at the University of Texas at Austin.
Testing procedures are presented in Section 6.2.10.1 of BSC (2002a) and SN-M&O SCI-033-V1
(Wong 2002d).
Dynamic properties, including the shear modulus and material damping relative to shearing
strain, were determined from the laboratory tests on samples of alluvium, bedrock, and
engineered fill. A summary of the results of the dynamic testing is presented in Section 6.4.2 of
this report. Table 6-9 lists the testing standard and reference used for the dynamic tests.
Table 69. Standard and Reference Used for Dynamic Testing.
Test Standard and Reference
Resonant column
shear (RCTS)
and torsional • PA-PRO-0310, Laboratory Dynamic Rock/Soil Testing (this information is considered historical, see Section
2.5.1).
• SN-M&O-SCI-033-V1 (Wong 2002d)
6.3.2.1 Alluvium
Due to the granular nature of the alluvial material, undisturbed samples could not be obtained
from boreholes or test pits before the summer of 2007. Therefore, one combined alluvial sample
was collected from boreholes RF#14 to #17 to provide a general representative sample of the
alluvium and to provide sufficient quantities of material to perform the dynamic laboratory tests.
The specimen was reconstituted in the laboratory using the standard under-compaction method
of Ladd (1978).
Additionally, dynamic testing was also performed on a soil sample taken from borehole RF#13
in 1999. A summary of the test results from this sample is provided in CRWMS M&O (1999,
Appendix Q).
6.3.2.2 Engineered Fill
Ten reconstituted specimens taken from the Fran Ridge borrow area were tested, again using the
standard under-compaction method of Ladd (1978). Four of the samples were tested in 2 stages
to investigate the dynamic property effects of increasing the water content of the granular fill
after placement.
66 August 2008
Supplemental Soils Report 100-S0C-CY00-00100-000-00E
6.3.2.3 Bedrock (Tuff)
Eighteen undisturbed specimens taken from boreholes RF#14 to #17 were tested. During testing,
the specimens were divided into three groups based on their dry unit weight, γd:
• Group 1: γd from 133 pcf to 147 pcf
• Group 2: γd from 117 pcf to 132 pcf
• Group 3: γd from 78 pcf to 94 pcf
6.4 MATERIAL PROPERTIES
This section presents a summary and discussion of the results of both static and dynamic
laboratory tests on the soil units at the site. All information presented in the following sections is
based on data presented in BSC (2002a), BSC (2002b), SNL (2008), and BSC (2008a). A
summary of recommended material properties for design is presented in Table 2-1 and Table 2-2.
6.4.1 Static Soil Properties
6.4.1.1 Alluvium
Results of the in situ density tests and laboratory tests conducted on the alluvial material from
TP-WHB-1 to TP-WHB-4 are shown in Tables 6 and 13 of BSC (2002a), respectively. Results
of the in situ density tests and laboratory tests conducted on the alluvial material from TP-WHB-
5 to TP-WHB-7 are provided in Table 6.2-4 in SNL (2008).
The following sections describe the results of testing on 31 samples obtained at depths ranging
from 4 to 20 feet. There were no alluvium samples obtained for depths greater than 20 feet.
6.4.1.1.1 General Characteristics
The alluvium material is generally medium dense to dense, and varies between a well-graded
gravel (GW), well-graded gravel with silt (GW-GM), poorly graded sand with silt (SP-SM), and
well-graded sand with silt (SW-SM). Intermittent layers of calcite-cemented material (caliche)
are present in the alluvium (BSC 2002b, Section 6.2 and DTNs:GS070583114233.002 and
GS070583114233.003). However, the presence (i.e., strengthening effect) of caliche was
conservatively ignored in this report. Table 6-10 provides a summary of average soil properties
determined from the laboratory testing performed on the 7 test pits.
67 August 2008
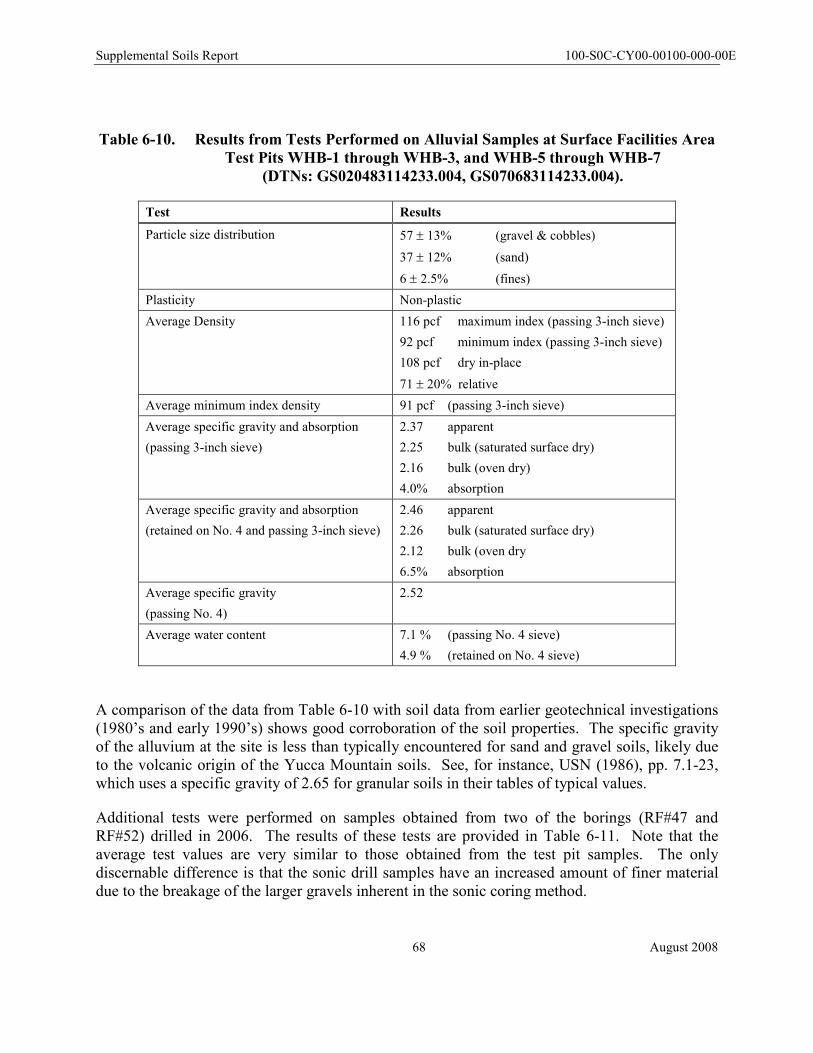
Supplemental Soils Report 100-S0C-CY00-00100-000-00E
Table 610. Results from Tests Performed on Alluvial Samples at Surface Facilities Area Test Pits WHB1 through WHB3, and WHB5 through WHB7
(DTNs: GS020483114233.004, GS070683114233.004).
Test Results
Particle size distribution 57 ± 13% (gravel & cobbles)
37 ± 12% (sand)
6 ± 2.5% (fines)
Plasticity Non-plastic
Average Density 116 pcf maximum index (passing 3-inch sieve)
92 pcf minimum index (passing 3-inch sieve)
108 pcf dry in-place
71 ± 20% relative
Average minimum index density 91 pcf (passing 3-inch sieve)
Average specific gravity and absorption
(passing 3-inch sieve)
2.37 apparent
2.25 bulk (saturated surface dry)
2.16 bulk (oven dry)
4.0% absorption
Average specific gravity and absorption
(retained on No. 4 and passing 3-inch sieve)
2.46 apparent
2.26 bulk (saturated surface dry)
2.12 bulk (oven dry
6.5% absorption
Average specific gravity
(passing No. 4)
2.52
Average water content 7.1 % (passing No. 4 sieve)
4.9 % (retained on No. 4 sieve)
A comparison of the data from Table 6-10 with soil data from earlier geotechnical investigations
(1980’s and early 1990’s) shows good corroboration of the soil properties. The specific gravity
of the alluvium at the site is less than typically encountered for sand and gravel soils, likely due
to the volcanic origin of the Yucca Mountain soils. See, for instance, USN (1986), pp. 7.1-23,
which uses a specific gravity of 2.65 for granular soils in their tables of typical values.
Additional tests were performed on samples obtained from two of the borings (RF#47 and
RF#52) drilled in 2006. The results of these tests are provided in Table 6-11. Note that the
average test values are very similar to those obtained from the test pit samples. The only
discernable difference is that the sonic drill samples have an increased amount of finer material
due to the breakage of the larger gravels inherent in the sonic coring method.
68 August 2008
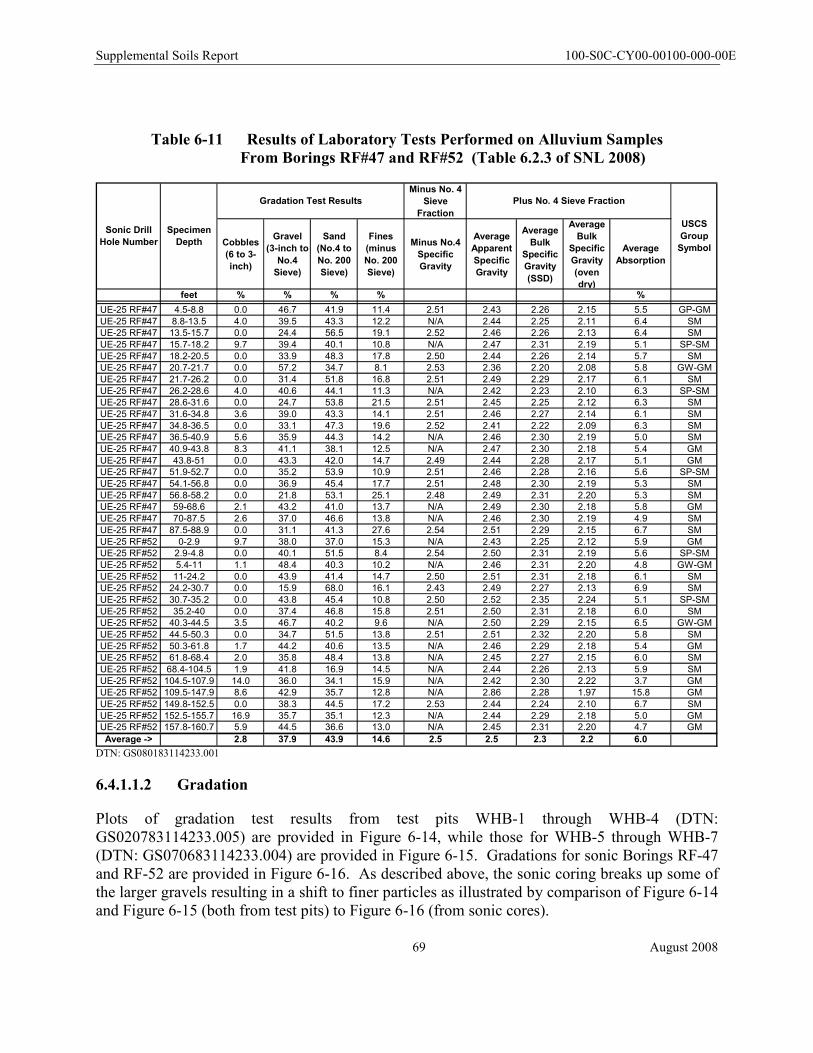
Supplemental Soils Report 100-S0C-CY00-00100-000-00E
Table 611 Results of Laboratory Tests Performed on Alluvium Samples From Borings RF#47 and RF#52 (Table 6.2.3 of SNL 2008)
Minus No. 4 Gradation Test Results Sieve Plus No. 4 Sieve Fraction
Sonic Drill Hole Number
Specimen Depth
Fraction USCS Group Symbol Cobbles
(6 to 3
inch)
Gravel (3inch to
No.4 Sieve)
Sand (No.4 to No. 200 Sieve)
Fines (minus No. 200 Sieve)
Minus No.4 Specific Gravity
Average Apparent Specific Gravity
Average Bulk
Specific Gravity (SSD)
Average Bulk
Specific Gravity (oven dry)
Average Absorption
feet % % % % % UE25 RF#47 4.58.8 0.0 46.7 41.9 11.4 2.51 2.43 2.26 2.15 5.5 GPGM UE25 RF#47 8.813.5 4.0 39.5 43.3 12.2 N/A 2.44 2.25 2.11 6.4 SM UE25 RF#47 13.515.7 0.0 24.4 56.5 19.1 2.52 2.46 2.26 2.13 6.4 SM UE25 RF#47 15.718.2 9.7 39.4 40.1 10.8 N/A 2.47 2.31 2.19 5.1 SPSM UE25 RF#47 18.220.5 0.0 33.9 48.3 17.8 2.50 2.44 2.26 2.14 5.7 SM UE25 RF#47 20.721.7 0.0 57.2 34.7 8.1 2.53 2.36 2.20 2.08 5.8 GWGM UE25 RF#47 21.726.2 0.0 31.4 51.8 16.8 2.51 2.49 2.29 2.17 6.1 SM UE25 RF#47 26.228.6 4.0 40.6 44.1 11.3 N/A 2.42 2.23 2.10 6.3 SPSM UE25 RF#47 28.631.6 0.0 24.7 53.8 21.5 2.51 2.45 2.25 2.12 6.3 SM UE25 RF#47 31.634.8 3.6 39.0 43.3 14.1 2.51 2.46 2.27 2.14 6.1 SM UE25 RF#47 34.836.5 0.0 33.1 47.3 19.6 2.52 2.41 2.22 2.09 6.3 SM UE25 RF#47 36.540.9 5.6 35.9 44.3 14.2 N/A 2.46 2.30 2.19 5.0 SM UE25 RF#47 40.943.8 8.3 41.1 38.1 12.5 N/A 2.47 2.30 2.18 5.4 GM UE25 RF#47 43.851 0.0 43.3 42.0 14.7 2.49 2.44 2.28 2.17 5.1 GM UE25 RF#47 51.952.7 0.0 35.2 53.9 10.9 2.51 2.46 2.28 2.16 5.6 SPSM UE25 RF#47 54.156.8 0.0 36.9 45.4 17.7 2.51 2.48 2.30 2.19 5.3 SM UE25 RF#47 56.858.2 0.0 21.8 53.1 25.1 2.48 2.49 2.31 2.20 5.3 SM UE25 RF#47 5968.6 2.1 43.2 41.0 13.7 N/A 2.49 2.30 2.18 5.8 GM UE25 RF#47 7087.5 2.6 37.0 46.6 13.8 N/A 2.46 2.30 2.19 4.9 SM UE25 RF#47 87.588.9 0.0 31.1 41.3 27.6 2.54 2.51 2.29 2.15 6.7 SM UE25 RF#52 02.9 9.7 38.0 37.0 15.3 N/A 2.43 2.25 2.12 5.9 GM UE25 RF#52 2.94.8 0.0 40.1 51.5 8.4 2.54 2.50 2.31 2.19 5.6 SPSM UE25 RF#52 5.411 1.1 48.4 40.3 10.2 N/A 2.46 2.31 2.20 4.8 GWGM UE25 RF#52 1124.2 0.0 43.9 41.4 14.7 2.50 2.51 2.31 2.18 6.1 SM UE25 RF#52 24.230.7 0.0 15.9 68.0 16.1 2.43 2.49 2.27 2.13 6.9 SM UE25 RF#52 30.735.2 0.0 43.8 45.4 10.8 2.50 2.52 2.35 2.24 5.1 SPSM UE25 RF#52 35.240 0.0 37.4 46.8 15.8 2.51 2.50 2.31 2.18 6.0 SM UE25 RF#52 40.344.5 3.5 46.7 40.2 9.6 N/A 2.50 2.29 2.15 6.5 GWGM UE25 RF#52 44.550.3 0.0 34.7 51.5 13.8 2.51 2.51 2.32 2.20 5.8 SM UE25 RF#52 50.361.8 1.7 44.2 40.6 13.5 N/A 2.46 2.29 2.18 5.4 GM UE25 RF#52 61.868.4 2.0 35.8 48.4 13.8 N/A 2.45 2.27 2.15 6.0 SM UE25 RF#52 68.4104.5 1.9 41.8 16.9 14.5 N/A 2.44 2.26 2.13 5.9 SM UE25 RF#52 104.5107.9 14.0 36.0 34.1 15.9 N/A 2.42 2.30 2.22 3.7 GM UE25 RF#52 109.5147.9 8.6 42.9 35.7 12.8 N/A 2.86 2.28 1.97 15.8 GM UE25 RF#52 149.8152.5 0.0 38.3 44.5 17.2 2.53 2.44 2.24 2.10 6.7 SM UE25 RF#52 152.5155.7 16.9 35.7 35.1 12.3 N/A 2.44 2.29 2.18 5.0 GM UE25 RF#52 157.8160.7 5.9 44.5 36.6 13.0 N/A 2.45 2.31 2.20 4.7 GM Average > 2.8 37.9 43.9 14.6 2.5 2.5 2.3 2.2 6.0
DTN: GS080183114233.001
6.4.1.1.2 Gradation
Plots of gradation test results from test pits WHB-1 through WHB-4 (DTN:
GS020783114233.005) are provided in Figure 6-14, while those for WHB-5 through WHB-7
(DTN: GS070683114233.004) are provided in Figure 6-15. Gradations for sonic Borings RF-47
and RF-52 are provided in Figure 6-16. As described above, the sonic coring breaks up some of
the larger gravels resulting in a shift to finer particles as illustrated by comparison of Figure 6-14
and Figure 6-15 (both from test pits) to Figure 6-16 (from sonic cores).
69 August 2008
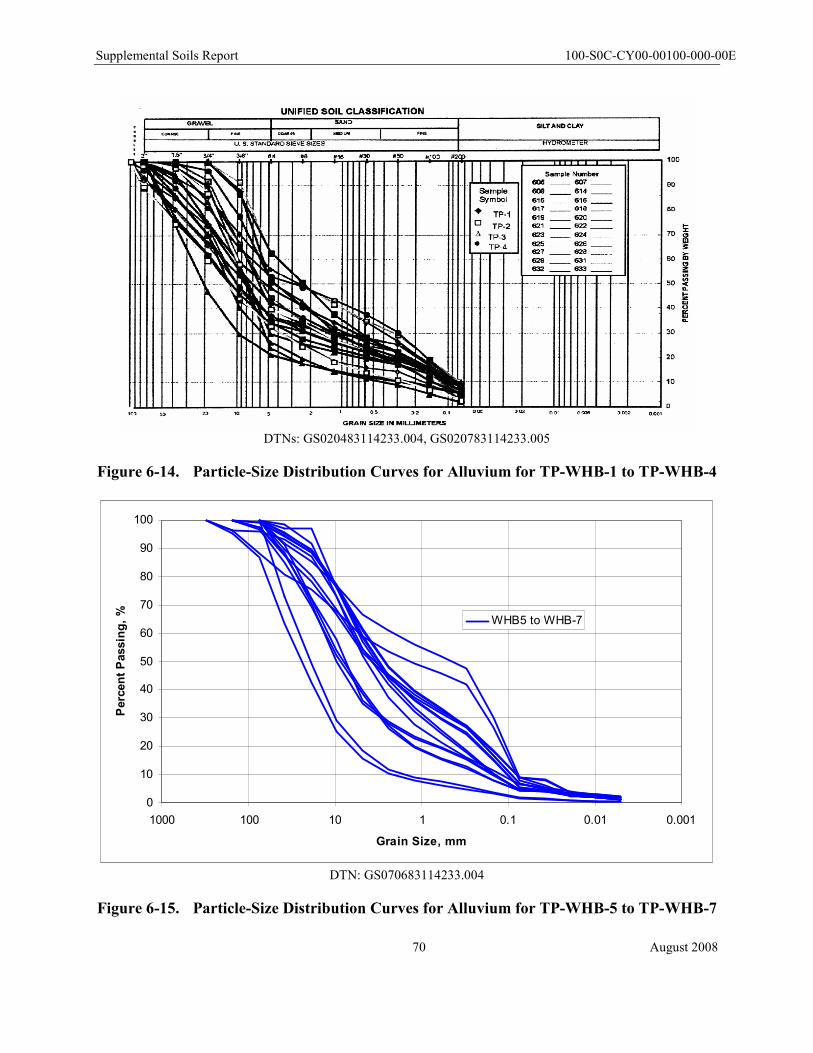
Supplemental Soils Report 100-S0C-CY00-00100-000-00E
DTNs: GS020483114233.004, GS020783114233.005
Figure 614. ParticleSize Distribution Curves for Alluvium for TPWHB1 to TPWHB4
0
10
20
30
40
50
60
70
80
90
100
0.001 0.01 0.1 110 100 1000
Grain Size, mm
Perc
ent P
assin
g, % WHB5 to WHB7
DTN: GS070683114233.004
Figure 615. ParticleSize Distribution Curves for Alluvium for TPWHB5 to TPWHB7
70 August 2008
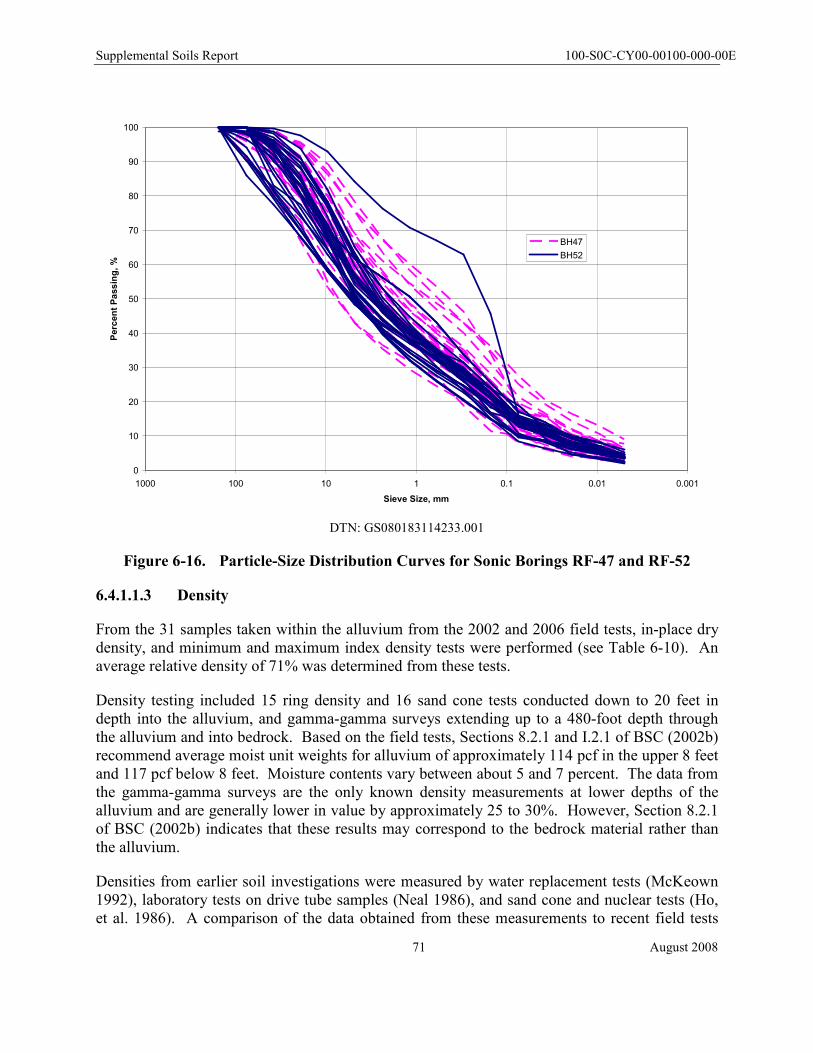
Perc
ent P
assin
g, %
100
90
80
70 BH47 BH52
60
50
40
30
20
10
0 1000 100 10 1 0.1 0.01 0.001
Sieve Size, mm
Supplemental Soils Report 100-S0C-CY00-00100-000-00E
DTN: GS080183114233.001
Figure 616. ParticleSize Distribution Curves for Sonic Borings RF47 and RF52
6.4.1.1.3 Density
From the 31 samples taken within the alluvium from the 2002 and 2006 field tests, in-place dry
density, and minimum and maximum index density tests were performed (see Table 6-10). An
average relative density of 71% was determined from these tests.
Density testing included 15 ring density and 16 sand cone tests conducted down to 20 feet in
depth into the alluvium, and gamma-gamma surveys extending up to a 480-foot depth through
the alluvium and into bedrock. Based on the field tests, Sections 8.2.1 and I.2.1 of BSC (2002b)
recommend average moist unit weights for alluvium of approximately 114 pcf in the upper 8 feet
and 117 pcf below 8 feet. Moisture contents vary between about 5 and 7 percent. The data from
the gamma-gamma surveys are the only known density measurements at lower depths of the
alluvium and are generally lower in value by approximately 25 to 30%. However, Section 8.2.1
of BSC (2002b) indicates that these results may correspond to the bedrock material rather than
the alluvium.
Densities from earlier soil investigations were measured by water replacement tests (McKeown
1992), laboratory tests on drive tube samples (Neal 1986), and sand cone and nuclear tests (Ho,
et al. 1986). A comparison of the data obtained from these measurements to recent field tests
71 August 2008
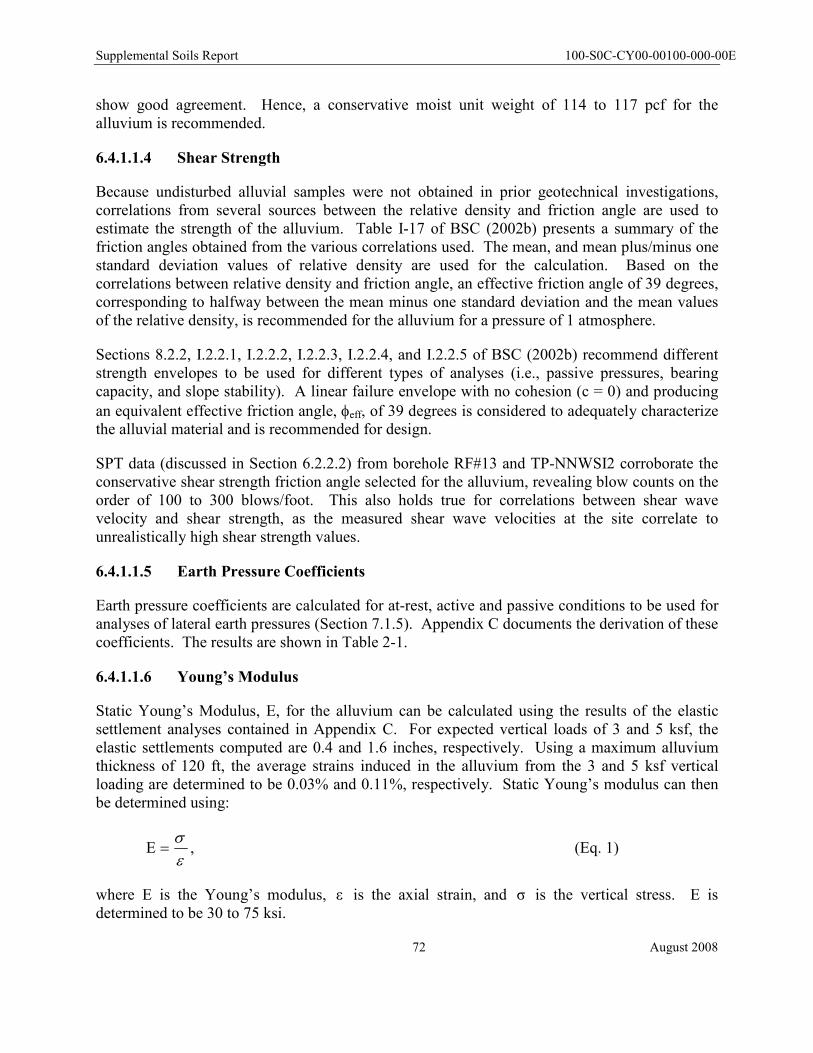
Supplemental Soils Report 100-S0C-CY00-00100-000-00E
show good agreement. Hence, a conservative moist unit weight of 114 to 117 pcf for the
alluvium is recommended.
6.4.1.1.4 Shear Strength
Because undisturbed alluvial samples were not obtained in prior geotechnical investigations,
correlations from several sources between the relative density and friction angle are used to
estimate the strength of the alluvium. Table I-17 of BSC (2002b) presents a summary of the
friction angles obtained from the various correlations used. The mean, and mean plus/minus one
standard deviation values of relative density are used for the calculation. Based on the
correlations between relative density and friction angle, an effective friction angle of 39 degrees,
corresponding to halfway between the mean minus one standard deviation and the mean values
of the relative density, is recommended for the alluvium for a pressure of 1 atmosphere.
Sections 8.2.2, I.2.2.1, I.2.2.2, I.2.2.3, I.2.2.4, and I.2.2.5 of BSC (2002b) recommend different
strength envelopes to be used for different types of analyses (i.e., passive pressures, bearing
capacity, and slope stability). A linear failure envelope with no cohesion (c = 0) and producing
an equivalent effective friction angle, φeff, of 39 degrees is considered to adequately characterize
the alluvial material and is recommended for design.
SPT data (discussed in Section 6.2.2.2) from borehole RF#13 and TP-NNWSI2 corroborate the
conservative shear strength friction angle selected for the alluvium, revealing blow counts on the
order of 100 to 300 blows/foot. This also holds true for correlations between shear wave
velocity and shear strength, as the measured shear wave velocities at the site correlate to
unrealistically high shear strength values.
6.4.1.1.5 Earth Pressure Coefficients
Earth pressure coefficients are calculated for at-rest, active and passive conditions to be used for
analyses of lateral earth pressures (Section 7.1.5). Appendix C documents the derivation of these
coefficients. The results are shown in Table 2-1.
6.4.1.1.6 Young’s Modulus
Static Young’s Modulus, E, for the alluvium can be calculated using the results of the elastic
settlement analyses contained in Appendix C. For expected vertical loads of 3 and 5 ksf, the
elastic settlements computed are 0.4 and 1.6 inches, respectively. Using a maximum alluvium
thickness of 120 ft, the average strains induced in the alluvium from the 3 and 5 ksf vertical
loading are determined to be 0.03% and 0.11%, respectively. Static Young’s modulus can then
be determined using:
σ E = , (Eq. 1)
ε
where E is the Young’s modulus, ε is the axial strain, and σ is the vertical stress. E is
determined to be 30 to 75 ksi.
72 August 2008
Supplemental Soils Report 100-S0C-CY00-00100-000-00E
Sections 8.2.3 and I.2.3 of BSC (2002b) recommend the following equation to be used for a
strain range of 0.1 to 0.5% and for a stress range for 0 to 6 ksf:
−0.6505 0.5E = 777.37(ε) σ , where (Eq. 12 and I-66 of BSC 2002b) (Eq. 2)
ε is the axial strain in percent and σ is the vertical overburden stress. Using an average
overburden stress in the alluvium of 11 ksf (σ = 0.117 kcf × 60 from the alluvium weight plus 4
ksf from vertical loading) and an axial strain of 0.1% yields E to be 80 ksi. For design, use a
static Young’s Modulus of 30 to 75 ksi for static loading conditions (Table 2-1).
6.4.1.1.7 Resistivity
Electrical resistivity of the soil will be required for design of grounding and evaluation of
corrosion potential. Field measurements will be required for the alluvium and any engineered
fill that is placed. It is expected that the main source of engineered fill will be alluvium and,
therefore, the resistivity of these two materials will be similar. Measurements made at eight
locations on the alluvial surface prior to building the construction-support pad at the North Portal
(USBR 1992, and USBR 1993) provide a typical range of values for these materials. The results
indicated resistivities measuring between 60 and 540 ohm-meters.
6.4.1.2 Engineered Fill
It is anticipated that engineered fill will be obtained from alluvial soils, possibly processed to
some extent. The Fran Ridge Borrow Area is an example of such material. The information
presented in this section is provided for corroborative purposes only. Actual design values will
be obtained after a source pit is identified.
Results of the static tests conducted on the fill obtained from the Fran Ridge Borrow Area are
presented in Table 6-12 (Table 27 and Figure 214 of BSC 2002a). Results of additional static
strength tests are presented in Table 28 and Figures 215 through 217 of BSC (2002a). The
following sections summarize the results of the laboratory testing on disturbed samples obtained
at widely spaced locations in the Fran Ridge Borrow Area.
6.4.1.2.1 General Characteristics
The borrow material is classified as a poorly graded sand to gravel (SP/GP), and, after
compaction, a poorly graded sand with silt and gravel (SP-SM). Table 6-12 below presents soil
properties determined for engineered fill from laboratory testing.
73 August 2008
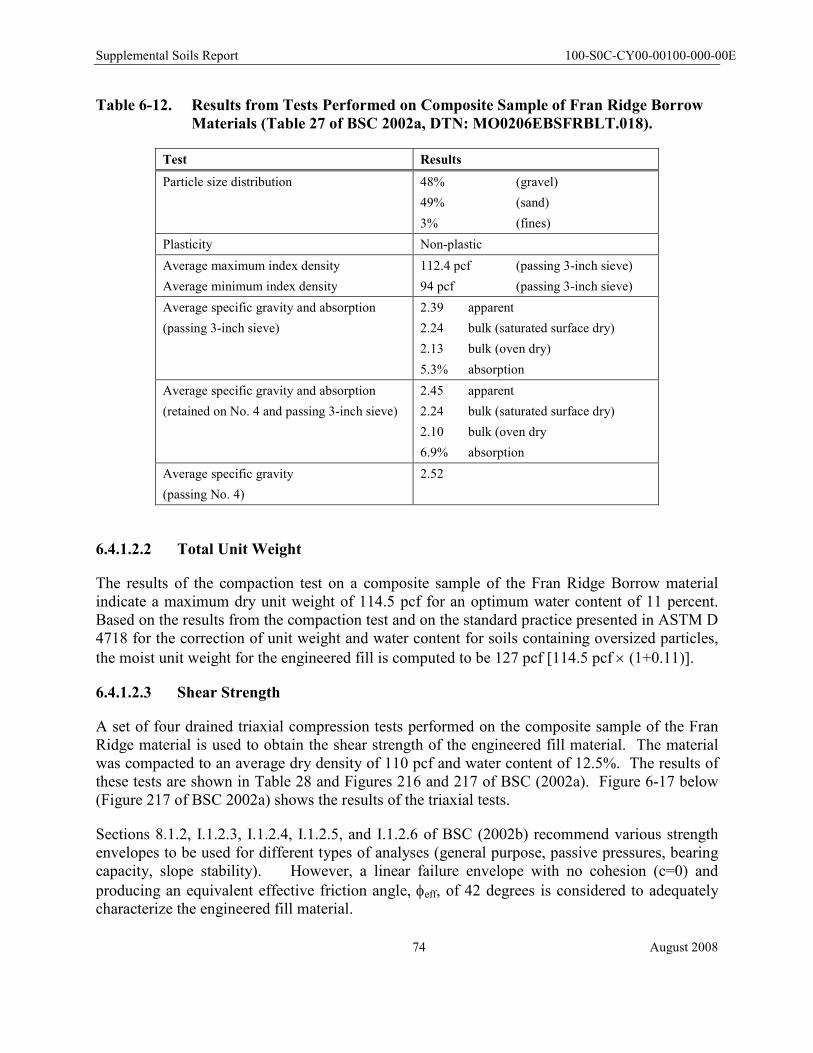
Supplemental Soils Report 100-S0C-CY00-00100-000-00E
Table 612. Results from Tests Performed on Composite Sample of Fran Ridge Borrow Materials (Table 27 of BSC 2002a, DTN: MO0206EBSFRBLT.018).
Test Results
Particle size distribution 48% (gravel)
49% (sand)
3% (fines)
Plasticity Non-plastic
Average maximum index density
Average minimum index density
112.4 pcf (passing 3-inch sieve)
94 pcf (passing 3-inch sieve)
Average specific gravity and absorption
(passing 3-inch sieve)
2.39 apparent
2.24 bulk (saturated surface dry)
2.13 bulk (oven dry)
5.3% absorption
Average specific gravity and absorption
(retained on No. 4 and passing 3-inch sieve)
2.45 apparent
2.24 bulk (saturated surface dry)
2.10 bulk (oven dry
6.9% absorption
Average specific gravity
(passing No. 4)
2.52
6.4.1.2.2 Total Unit Weight
The results of the compaction test on a composite sample of the Fran Ridge Borrow material
indicate a maximum dry unit weight of 114.5 pcf for an optimum water content of 11 percent.
Based on the results from the compaction test and on the standard practice presented in ASTM D
4718 for the correction of unit weight and water content for soils containing oversized particles,
the moist unit weight for the engineered fill is computed to be 127 pcf [114.5 pcf × (1+0.11)].
6.4.1.2.3 Shear Strength
A set of four drained triaxial compression tests performed on the composite sample of the Fran
Ridge material is used to obtain the shear strength of the engineered fill material. The material
was compacted to an average dry density of 110 pcf and water content of 12.5%. The results of
these tests are shown in Table 28 and Figures 216 and 217 of BSC (2002a). Figure 6-17 below
(Figure 217 of BSC 2002a) shows the results of the triaxial tests.
Sections 8.1.2, I.1.2.3, I.1.2.4, I.1.2.5, and I.1.2.6 of BSC (2002b) recommend various strength
envelopes to be used for different types of analyses (general purpose, passive pressures, bearing
capacity, slope stability). However, a linear failure envelope with no cohesion (c=0) and
producing an equivalent effective friction angle, φeff, of 42 degrees is considered to adequately
characterize the engineered fill material.
74 August 2008
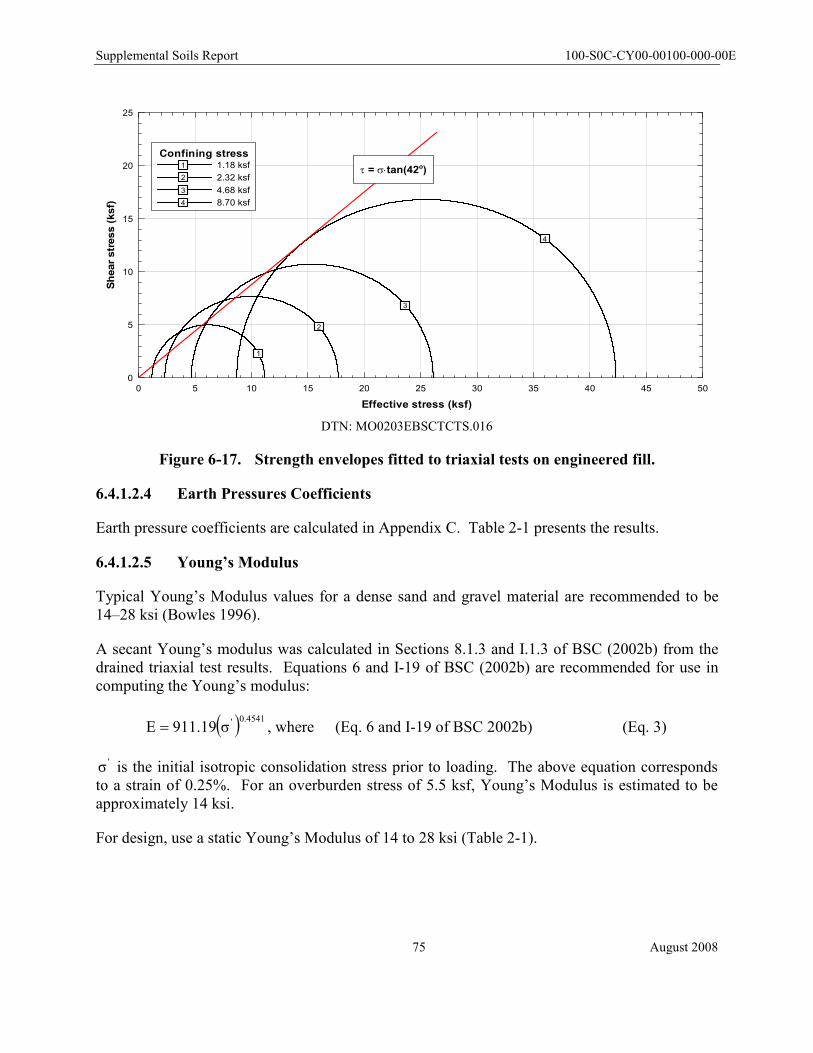
Shear str
ess (ksf)
25
20
15
10
5
0 0 5 10 15 20 25 30 35 40 45 50
Effective stress (ksf)
Confining stress 1.18 ksf 2.32 ksf 4.68 ksf 8.70 ksf
1
2
3
4
1
2
3
4
τ = σ.tan(42o)
Supplemental Soils Report 100-S0C-CY00-00100-000-00E
DTN: MO0203EBSCTCTS.016
Figure 617. Strength envelopes fitted to triaxial tests on engineered fill.
6.4.1.2.4 Earth Pressures Coefficients
Earth pressure coefficients are calculated in Appendix C. Table 2-1 presents the results.
6.4.1.2.5 Young’s Modulus
Typical Young’s Modulus values for a dense sand and gravel material are recommended to be
14–28 ksi (Bowles 1996).
A secant Young’s modulus was calculated in Sections 8.1.3 and I.1.3 of BSC (2002b) from the
drained triaxial test results. Equations 6 and I-19 of BSC (2002b) are recommended for use in
computing the Young’s modulus:
E = 911.19 ( σ )0.4541 ' , where (Eq. 6 and I-19 of BSC 2002b) (Eq. 3)
σ ' is the initial isotropic consolidation stress prior to loading. The above equation corresponds
to a strain of 0.25%. For an overburden stress of 5.5 ksf, Young’s Modulus is estimated to be
approximately 14 ksi.
For design, use a static Young’s Modulus of 14 to 28 ksi (Table 2-1).
75 August 2008
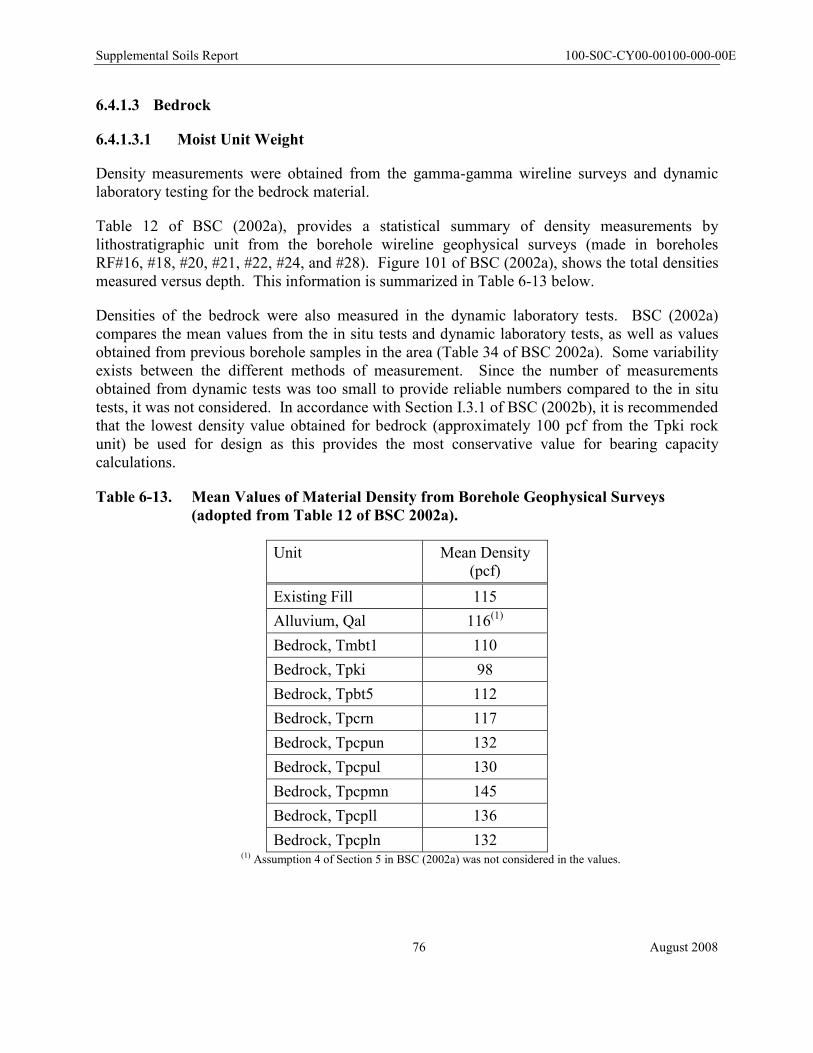
Supplemental Soils Report 100-S0C-CY00-00100-000-00E
6.4.1.3 Bedrock
6.4.1.3.1 Moist Unit Weight
Density measurements were obtained from the gamma-gamma wireline surveys and dynamic
laboratory testing for the bedrock material.
Table 12 of BSC (2002a), provides a statistical summary of density measurements by
lithostratigraphic unit from the borehole wireline geophysical surveys (made in boreholes
RF#16, #18, #20, #21, #22, #24, and #28). Figure 101 of BSC (2002a), shows the total densities
measured versus depth. This information is summarized in Table 6-13 below.
Densities of the bedrock were also measured in the dynamic laboratory tests. BSC (2002a)
compares the mean values from the in situ tests and dynamic laboratory tests, as well as values
obtained from previous borehole samples in the area (Table 34 of BSC 2002a). Some variability
exists between the different methods of measurement. Since the number of measurements
obtained from dynamic tests was too small to provide reliable numbers compared to the in situ
tests, it was not considered. In accordance with Section I.3.1 of BSC (2002b), it is recommended
that the lowest density value obtained for bedrock (approximately 100 pcf from the Tpki rock
unit) be used for design as this provides the most conservative value for bearing capacity
calculations.
Table 613. Mean Values of Material Density from Borehole Geophysical Surveys (adopted from Table 12 of BSC 2002a).
Unit Mean Density
(pcf)
Existing Fill 115
Alluvium, Qal 116(1)
Bedrock, Tmbt1 110
Bedrock, Tpki 98
Bedrock, Tpbt5 112
Bedrock, Tpcrn 117
Bedrock, Tpcpun 132
Bedrock, Tpcpul 130
Bedrock, Tpcpmn 145
Bedrock, Tpcpll 136
Bedrock, Tpcpln 132 (1) Assumption 4 of Section 5 in BSC (2002a) was not considered in the values.
76 August 2008
Supplemental Soils Report 100-S0C-CY00-00100-000-00E
6.4.1.3.2 Shear Strength
Since, the structures will be underlain by a significant amount of alluvium over bedrock, and
noting that the shear strength of bedrock is much greater than that of alluvium, an estimation of
bedrock shear strength within the depth of structural influence was conservatively ignored for the
purposes of this report. This information can be derived from other project sources if needed.
6.4.2 Dynamic Soil Properties
Dynamic soil properties, including seismic wave velocity, Poisson’s ratio, and strain dependent
parameters of shear modulus degradation and material damping ratio were developed for use in
the dynamic analyses of the structures and foundations at the surface facilities site. The available
field and laboratory data was initially compiled and reported in BSC (2002a). Then additional
SASW and dynamic laboratory testing were performed in 2005 through 2007 and summarized in
SNL (2008). Analysis and recommendations for input ground motions for preclosure seismic
design and postclosure performance assessment were initially provided in BSC (2004a). Then
updated with the 2005 through 2007 data and incorporated using a different analysis approach in
BSC (2008a).
6.4.2.1 Alluvium and Bedrock
Subsurface conditions vary across the site and therefore seismic analyses parameters and
assumptions will vary as well, dependent on site location and structure. Therefore, the reader is
directed to the tables, figures and discussions provided in BSC (2008a) for determining the
applicable dynamic parameters to use for the alluvium and bedrock material in analyses
underlying the various structures.
6.4.2.2 Engineered Fill
No geophysical surveys could be performed on the proposed engineered fill. The shear and
compression wave velocity ranges for engineered fill are expected to be equivalent to those of
alluvium at comparable depths. A test fill program, discussed in Section 7.3.10, will be
performed to define pertinent properties of the fill before final design.
A Poisson’s ratio of 0.3 to 0.4 is recommended based on Bowles (1996) for a dense cohesionless
sand.
6.4.3 Roller Compacted Soil Cement
6.4.3.1 Recommended Properties
The following recommendations are based on the review of properties of roller compacted soil
cement (RCSC) and deep soil mixes that are summarized in Section 9 of BSC (2004b). These
parameters are provided as a first estimate for dynamic evaluation of roller-compacted soil-
cement should RCSC be considered for use at the site:
77 August 2008
Supplemental Soils Report 100-S0C-CY00-00100-000-00E
•� Percent cement: 4% to12% by weight
•� Unit weight: 130 pcf to 140 pcf
•� Poisson’s ratio: 0.30
•� Shear-wave velocity, Vs:
o Lower bound: 2000 ft/s
o Average: 2500 ft/s
o Upper bound: 3000 ft/s
•� Shear modulus at low strain:
o Lower bound: 100 ksi
o Average: 180 ksi
o Upper bound: 270 ksi
•� Strength
o c = 400 psi (low end unconfined compressive strength for gravelly
soils, ACI 230.IR-90, Table 4.1)
o φ = 0 deg (ignored)
No information was found in the literature regarding shear modulus reduction curves specific to
RCSC. However, the following presents a limited collection of shear modulus reduction curves
for cement treated soils identified in the literature:
1. Dupas and Pecker (1979)–From cyclic triaxial tests performed on soil-cement samples.
Soil was fine to medium grain sand with 5% cement by weight and compacted to 100%
of the maximum density as determined by ASTM D 558. Curing time 180 days.
2. Wang (1986)–From triaxial and simple shear tests on artificially cemented sand. The
material was a mixture of Monterey #0 and #20 sand with 2% cement and 74% relative
density.
3. Kohata et al. (1997)–From cyclic triaxial tests performed on soil-cement samples cured
for 28 days. Soil was fine-grained. Cement percentage unknown.
4. Sato et al. (1995)–From dynamic triaxial tests performed on sand-cement samples. Sand
was fine to medium grained with100% less than 0.84 mm, D60 = 0.35 mm, D30 = 0.31
mm, and uniformity coefficient = 1.59. Cement percentage unknown.
5. McGinn and O’Rourke (2003)–From pressuremeter tests performed on stiff clays treated
with 12% to 15% cement by weight using the deep soil mixing method.
Figure 6-18 presents the normalized shear modulus data from these sources. The EPRI (1993)
curve for sand for depths of 0-20 ft is included for comparison.
78 August 2008
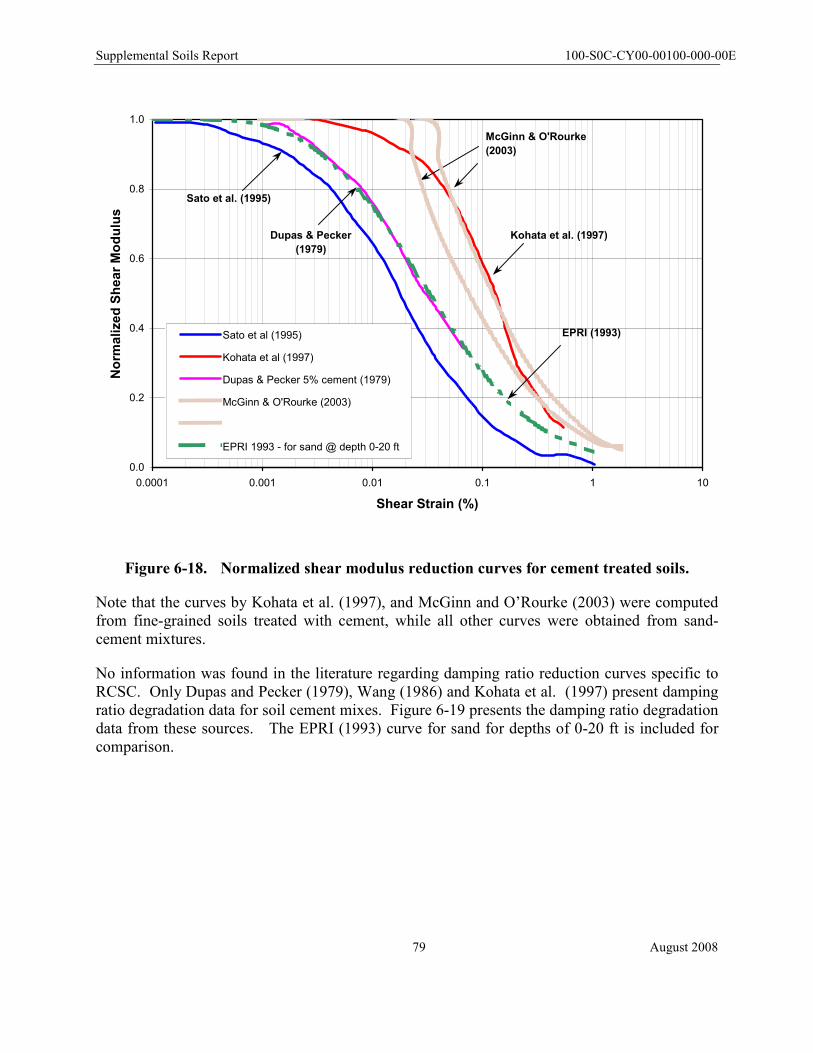
Norm
alized S
hear M
odulu
s1.0
0.8
0.6
0.4
0.2
0.0
McGin
(2003) n & O'Rourke
Sato et al. (1995)
Dupas & Pecker (1979)
K et al. ohata (1997)
Sato et al (1995)
Kohata et al (1997)
Dupas & Pecker 5% cement (1979)
McGinn & O'Rourke (2003)
EPRI 1993 for sand @ depth 020 ft
EPRI (1993)
0.0001 0.001 0.01 0.1 1 10
Shear Strain (%)
Supplemental Soils Report 100-S0C-CY00-00100-000-00E
Figure 618. Normalized shear modulus reduction curves for cement treated soils.
Note that the curves by Kohata et al. (1997), and McGinn and O’Rourke (2003) were computed
from fine-grained soils treated with cement, while all other curves were obtained from sand-
cement mixtures.
No information was found in the literature regarding damping ratio reduction curves specific to
RCSC. Only Dupas and Pecker (1979), Wang (1986) and Kohata et al. (1997) present damping
ratio degradation data for soil cement mixes. Figure 6-19 presents the damping ratio degradation
data from these sources. The EPRI (1993) curve for sand for depths of 0-20 ft is included for
comparison.
79 August 2008
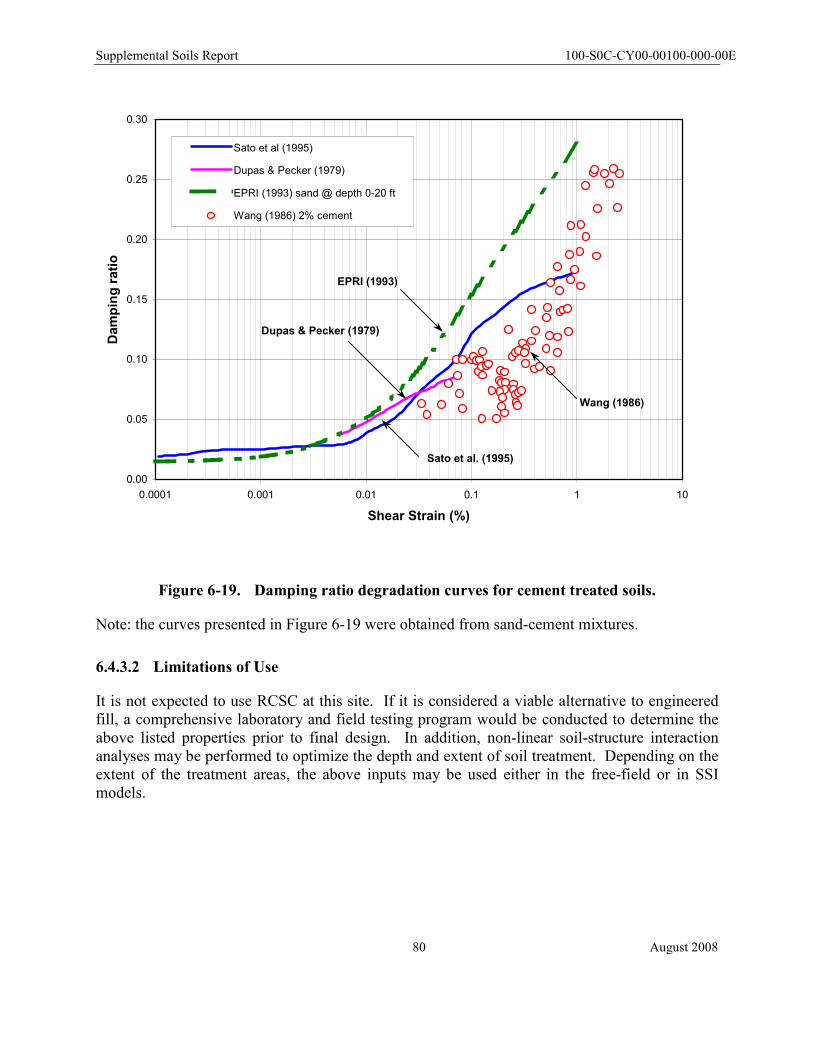
0.00
0.05
0.10
0.15
0.20
0.25
0.30 D
am
pin
g ratio
Sato et al (1995)
Dupas & Pecker (1979)
EPRI (1993) sand @ depth 020 ft
Wang (1986) 2% cement
Wang (1986)
Sato et al. (1995)
EPRI (1993)
Dupas & Pecker (1979)
0.0001 0.001 0.01 0.1 1 10
Shear Strain (%)
Supplemental Soils Report 100-S0C-CY00-00100-000-00E
Figure 619. Damping ratio degradation curves for cement treated soils.
Note: the curves presented in Figure 6-19 were obtained from sand-cement mixtures.
6.4.3.2 Limitations of Use
It is not expected to use RCSC at this site. If it is considered a viable alternative to engineered
fill, a comprehensive laboratory and field testing program would be conducted to determine the
above listed properties prior to final design. In addition, non-linear soil-structure interaction
analyses may be performed to optimize the depth and extent of soil treatment. Depending on the
extent of the treatment areas, the above inputs may be used either in the free-field or in SSI
models.
80 August 2008
Supplemental Soils Report 100-S0C-CY00-00100-000-00E
7 RESULTS AND CONCLUSIONS
7.1 Engineering Design Parameters
Analyses outputs obtained from the calculations prepared for this report are reasonable compared
to the input parameters used. The results are considered suitable for use in the design of the
surface facilities.
Figures and tables containing supporting design parameters are located at the end of this section.
Table 2-2 shows key results of the analyses contained herein.
7.1.1 Material Properties
Table 2-1 summarizes the recommended static and dynamic soil properties discussed in Sections
6.4 and 7 for design.
7.1.2 Foundation Pressures
The recommended foundation pressures of the soil at the surface facilities area were determined
for various conditions using conventional geotechnical bearing capacity theory. Due to the dense
granular nature of the alluvium that will support the planned structures, settlement, rather than
bearing capacity, will control allowable pressures. Design charts are provided for allowable
foundation pressures for different footing geometries resting on alluvium. Design settlements of
1-inch, or less, and ½-inch, or less, were used in the analyses. The strength parameters used for
the alluvium are discussed in Section 6.4. A minimum factor of safety of 3.0 against bearing
capacity failure was used (i.e., qallowable = qultimate / 3.0).
Figure 7-2 and Figure 7-3 show the recommended bearing pressures on square and strip footings
for 2-foot and 6-foot embedment depths with widths ranging from 2 to 30 feet, for 1-inch and ½-
inch design settlement, respectively. Figure 7-4 and Figure 7-5 show the variation of immediate
settlement with bearing pressure for square and strip footings of 5-foot, 10-foot, and 20-foot
widths, for embedment depths of 2 feet and 6 feet, respectively. Figure 7-6 shows the variation
of long-term settlement with foundation width. Note that in Figure 7-6, strip and square footings
provide nearly identical solutions. Details of the foundation analyses are documented in
Appendix B.
For mat foundations, design should be based on allowable settlements. However, the maximum
allowable bearing pressures under the mat should not exceed 50 ksf under extreme (seismic) load
conditions and 10 ksf under normal load conditions (Appendix B, Section B6.7).
81 August 2008
Supplemental Soils Report 100-S0C-CY00-00100-000-00E
7.1.3 Settlement
7.1.3.1 ShortTerm Settlement
Settlement of foundations is a function of the footing size, average footing load, the depth of
footing embedment, and characteristics of the soil material type. Two methods were considered
to estimate the settlements for the surface facilities area: (1) Burland and Burbidge (Terzaghi et
al., 1996), which uses an average N60 blow count value (correlated from a relationship to the
relative density), and (2) Schmertmann (Terzaghi et al., 1996), which uses Young’s modulus
(correlated from measured shear-wave velocities). Immediate settlements induced under
different foundation pressures are presented in Figure 7-4 and Figure 7-5 for a variety of
conditions. A detailed description of the analyses is provided in Appendix B.
7.1.3.2 LongTerm Settlement
Over time, some additional settlement will occur due to long-term, secondary settlement effects.
This settlement is in addition to that estimated in Section 7.1.3.1. The long-term or secondary
settlements for the surface facilities area were computed based on the method developed by
Burland and Burbidge (Terzaghi et al., 1996) for a 50-yr structure design life (Section 2.2.2.7
BSC 2008b). The settlement was determined to be less than ½ inch. Long-term settlements are
presented for different footing widths (square and strip footings) and different depths of
foundation embedment in Figure 7-6. A detailed description of the analysis is provided in
Appendix B.
7.1.3.3 Elastic Settlement
Elastic settlements were computed for a large mat foundation based on a uniform vertical stress
distribution, representative average shear wave velocities (see BSC, 2008a), and Young's
modulus (derived from modulus degradation curves). The dimensions of (300’ × 400’) were
used in the analysis, which encompass the largest building dimensions. Settlements under the
corner and center of the mat were determined for loads of 3, 5, and 7 ksf. A detailed description
of the analysis is provided in Appendix B. Results of the analysis are shown in Table 2-2.
7.1.3.4 Differential Settlement
In accordance with Peck, et al. (1974) Chapter 14, differential settlement between adjacent
footings can be ¾ of the maximum estimated value.
The following are allowable angular distortions, δ/L (allowable differential settlement over a
given distance), for buildings (Fig. 5.59 of Fang 1991):
82 August 2008
Supplemental Soils Report 100-S0C-CY00-00100-000-00E
δ/L Building type
1/500 Buildings where
circular mat or
structures
ri
cracking
ng footin
is
g f
not
or ta
permissible; Rigid
ll and slender rigid
where δ = allowable differential settlement and L = spacing distance
7.1.3.5 SeismicallyInduced Settlement
Seismically-induced settlement is not considered to be a significant issue due to the dry and
dense nature of the soils encountered at the YMP site. In addition, cementation of the alluvium
will also reduce the potential for dynamic settlement.
7.1.4 Coefficient of Subgrade Reaction and Equivalent Soil Springs
All shallow footings and mat foundations will be supported by the alluvium. For the design of
large footings and mats it is typical to represent the soil with equivalent springs. The vertical
coefficient of subgrade reaction for the alluvium is estimated based on Terzaghi (1955). For dry
dense sand, the recommended value for a one-foot by one-foot plate, ks1, is 600 to 2000 kcf
(kips/cubic foot). For the dense gravelly alluvium present at the site, it is recommended that a
best estimate value of 1000 kcf (580 pci) be used. For the anticipated dense engineered fill, it is
recommended that a best estimate value of 600 kcf (350 pci) be used.
These values must be reduced for large loaded sizes in accordance with the following
relationship:
+2
B 1k s = k s1 (Eq. 4)
2 B
where B is the least footing dimension and ks is the coefficient of subgrade reaction for the
k footing or mat. For large footings or mats ks will approach s1 . Therefore, for preliminary
4 design, it is recommended to use 155 to 520 kcf (90–300 pci) for alluvium and 75 to 250 kcf
(45–145 pci) for engineered fill. It is common practice to double the static load for dynamic load
cases.
Figure 9 of USN (1986) was used to estimate the horizontal coefficient of subgrade reaction by
correlations with relative density. For the very dense alluvium material, the values were
estimated to be 104–120 kcf (60–70 pci). For the dense engineered fill, the values were
estimated to be 60–96 kcf (35–55 pci). Results are summarized in Table 2-1.
83 August 2008
Supplemental Soils Report 100-S0C-CY00-00100-000-00E
7.1.5 Lateral Earth Pressures
Currently a 55-foot below-grade wall is planned for construction of a pool for the wet-process
building. Lateral earth pressures were determined to estimate the loads that will act on subgrade
walls. Both static and seismic conditions for yielding and non-yielding walls were considered in
the analyses, including effects from compaction-induced earth pressures and static surcharge
loads. Live loads were not considered in the analyses. No factor of safety was applied to the
calculated earth pressures. The calculations were performed using the measured properties of the
alluvium (see Section 6.4.1). A coefficient of horizontal acceleration of 1g was used in the
seismic analysis. The results from the seismic analysis may be scaled by any selected peak
ground acceleration value.
A schematic summary of the results for yielding and non-yielding walls is shown in Figure 7-7
through Figure 7-15. A detailed description of the analyses is provided in Appendix C.
7.1.5.1 Lateral Earth Pressures for Temporary Shoring
For a braced and shored excavation the lateral pressures can be estimated using a uniform
pressure of 17H psf, where H is the height of the wall. Details of the supporting analysis are
provided in Appendix C.
7.1.5.2 Surcharge and Compaction Loads
Surcharge loading due to nearby point, line, uniform surcharge, strip, and footing loads are
presented in Figure 7-8 and Figure 7-9. These relationships are based on those presented in USN
(1986). In accordance with Section 4.2.11.3.5 of BSC (2007a), a minimum surcharge load of
300 psf shall be used
Compaction stresses imposed on the wall as a result of compaction are addressed in Appendix C.
The calculated compaction stresses due to various compaction devices are presented Figure 7-11
through Figure 7-15. .
7.1.6 Resistance to Lateral Loads
Resistance to lateral loads acting on footings, mats, and subgrade walls can be developed from
passive resistance of the soil and from friction acting between the structural base and the
subgrade soils.
Passive resistance can be determined assuming an equivalent fluid unit weight of 515 pcf acting
on the sides of the foundations. When applying passive resistance for external footings or
building walls, the effective depth of embedment should be reduced by one foot. Supporting
calculations are provided in Appendix C.
The ultimate coefficients of sliding friction for mat and footing foundations underlain by
alluvium and engineered fill are estimated to be 0.81 and 0.90, respectively (see Appendix C).
84 August 2008
Supplemental Soils Report 100-S0C-CY00-00100-000-00E
7.1.7 Slope Considerations
Figure 7-1 is a cross-section through the site and the lower end of Exile Hill (located on the far
right hand side of the figure), which is located west of the planned surface facilities. Note that
the column of geologic labels on the left-hand-side of Figure 7-1 has been shifted upward and do
not label the corresponding geologic strata. The purpose for including Figure 7-1 is to illustrate
the relatively gentle slope of Exile Hill directly adjacent to the surface facilities to be located east
of RF#28 at the toe of the slope. Portions of Figure 7-1 are illegible, but are not pertinent to the
evaluations, conclusions or recommendations of this report. As the cross-section illustrates, the
surface facilities site is on relatively level ground. Exile Hill immediately west of the surface
facilities site slopes at about 2.5H:1V (horizontal: vertical) in its upper portion and flattens to
about 6H:1V near its base adjacent to the surface facilities site. The steeper, upper portions of
Exile Hill, west of the surface facilities, are composed of rock at the surface. The alluvium and
colluvium constitute the flatter lower portion. Due the flatness of the adjacent alluvial/colluvial
portions and the presence of rock in the upper portions, slope stability of Exile Hill is not
anticipated to be a significant concern for the surface facilities site. Additional reconnaissance of
the slope as recommended in Section 7.3.1 will determine if a detailed stability analysis of Exile
Hill is necessary.
85 August 2008
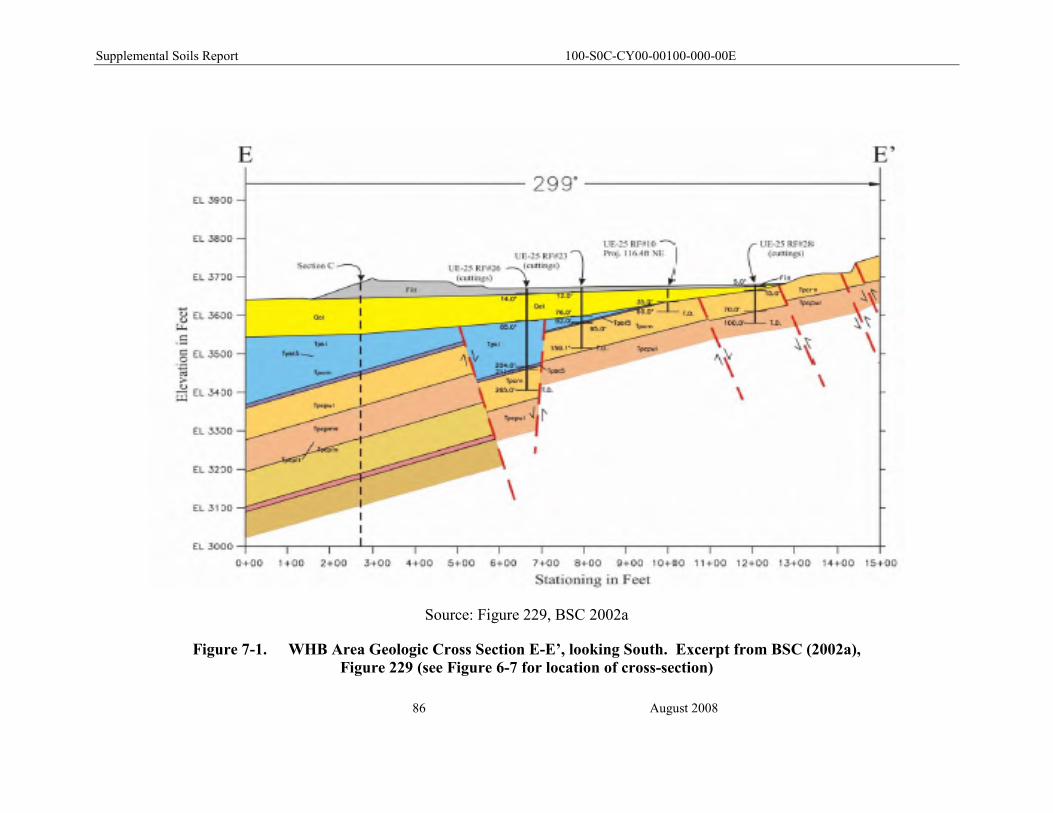
Supplemental Soils Report 100-S0C-CY00-00100-000-00E
Source: Figure 229, BSC 2002a
Figure 71. WHB Area Geologic Cross Section EE’, looking South. Excerpt from BSC (2002a),
Figure 229 (see Figure 67 for location of crosssection)
86 August 2008
Supplemental Soils Report 100-S0C-CY00-00100-000-00E
Temporary cuts in the alluvium should be no steeper than 1.5H:1V. Permanent fill slopes should
be no steeper than 2H:1V. Permanent cut and fill slopes should be provided with erosion
protection by placement of at least 3 inches of coarse aggregate shouldering material.
7.1.8 Pavements
The designs of all pavement sections including the gravel construction phase pavements and any
heavy transport routes should be developed using an approved pavement analysis method.
California Bearing Ratio (CBR) was not directly measured on the site materials. Pavement
section designs may be based on CBR values ranging between 20 and 60 percent for the
alluvium and engineered fill. As discussed in Section 7.3.4, appropriate CBR testing should be
performed to finalize the value chosen for final design. These are conservative values
recommended for the gravelly soils in Table 1, page 7.2-39, of USN (1986).
7.1.9 Percolation Rates
The percolation rate of soils have been measured at a number of different locations in the site
vicinity, including the ESF Muck Storage Area (DTN: SNF29041993001.002, average 1.8 in/hr),
at 14 locations within Midway Valley (DTN: GS960908312212.009, average 2.3 in/hr), and at 2
locations within Fortymile Wash (DTN: GS950308312213.004). Based on BSC (2002c), these
sources are generally consistent with the percolation rate of about 1.8 inches per hour.
An estimate of the permeability of the alluvial soils can also be made based on the fines
percentage (see Section 6.4.1.1.1) and the relationship presented in Figure 8-5 of USN (1986) for
the effect of fines on permeability. Based on this figure, the permeability of the alluvium can be -5 -4
estimated to be between 5x10 fpm (0.036 in/hr) and 5x10 fpm (0.36 in/hr).
Alternatively, Sherard, et al (1984) determined that permeability, k, for sand and gravel filters 2
could be calculated from k = 0.35 x D15 , where D15 (the grain size for which 15% of material is
smaller by weight) = 0.08mm (see Figure 6-14 and Figure 6-15) and k is in cm/sec. This results -3
in a permeability of about 2.24x10 cm/sec = 3.2 in/hr. This estimate, and consideration that
many of the tests performed in the three above-referenced DTN’s of field percolation and double
ring infiltrometer tests obtained higher values than the recommended 1.8 in/hr, would indicate -5 -3
that a reasonable range of permeability to be between about 5x10 fpm (0.036 in/hr) and 2x10
fpm (2.8 in/hr). Also, note that permeability can be highly variable in the alluvial materials
which also include localized layers or zones of relatively impermeable caliche.
Care should be taken to use the proper test for the intended design function and add appropriate
factors of safety. These numbers can also be refined by performing additional field percolation
tests (ASTM D 5126) or laboratory constant-head permeability tests on reconstituted samples
(ASTM D 2434).
87 August 2008
Supplemental Soils Report 100-S0C-CY00-00100-000-00E
7.1.10 2000 International Building Code (IBC) Soil Type
Using the averaged shear wave velocities developed in BSC (2008a) and reported in Table 2-1, a
Soil Profile Type from the 2000 International Building Code (IBC) was selected to characterize
the dynamic soil properties of the surface facilities area (ICC 2000, Table 1615.1.1).
Table 2-1 summarizes the soil profile type determined for the soil units at the site.
7.1.11 Frost Penetration
Figure 7-16 (Figure III-1 of BSC 2002b) below shows the potential frost penetration for the
western United States. Based on this map, the potential for frost penetration at the YMP site is
approximately 10 inches. Use 10 inches for design purposes.
7.1.12 Liquefaction Potential
As discussed in Section 6.1.4.4, groundwater is located 1270 feet below the ground surface.
Therefore, there is no potential for liquefaction to occur beneath the planned structures at the
site.
88 August 2008
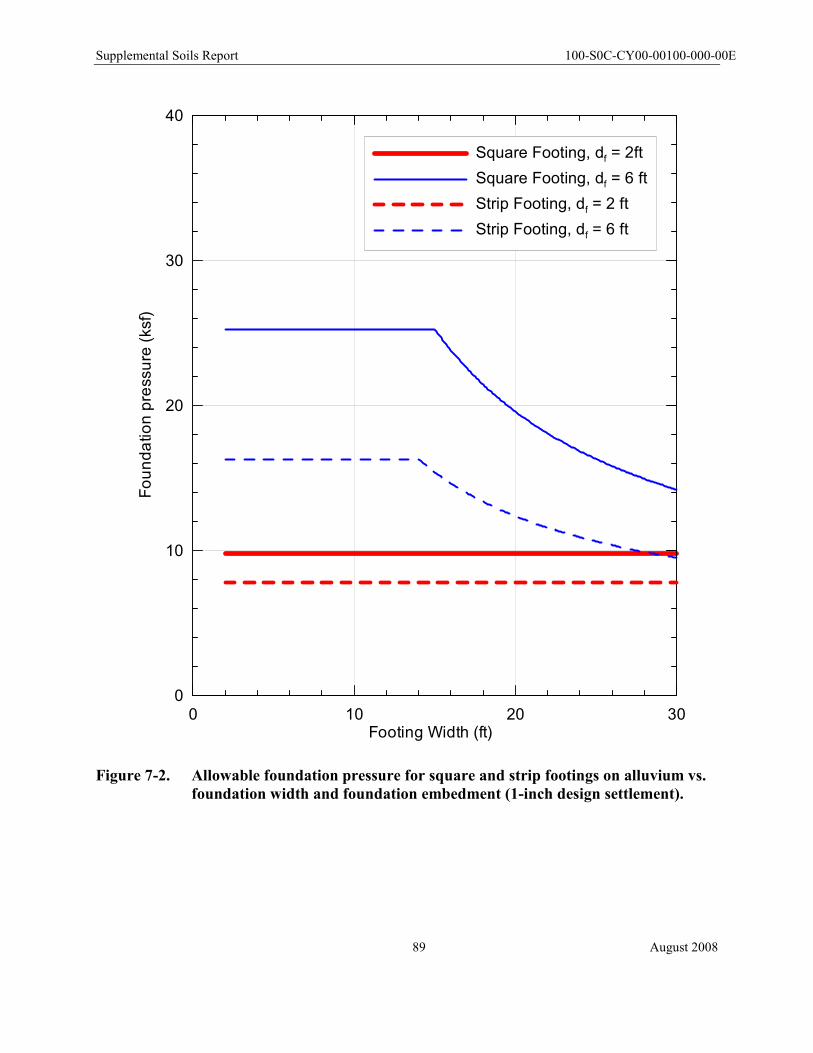
Foundation
pressure
(ksf)
40
30
20
10
0 0 10 20 30
Footing Width (ft)
Square Footing, df = 2ft Square Footing, df = 6 ft Strip Footing, df = 2 ft Strip Footing, df = 6 ft
Supplemental Soils Report 100-S0C-CY00-00100-000-00E
Figure 72. Allowable foundation pressure for square and strip footings on alluvium vs.
foundation width and foundation embedment (1inch design settlement).
89 August 2008
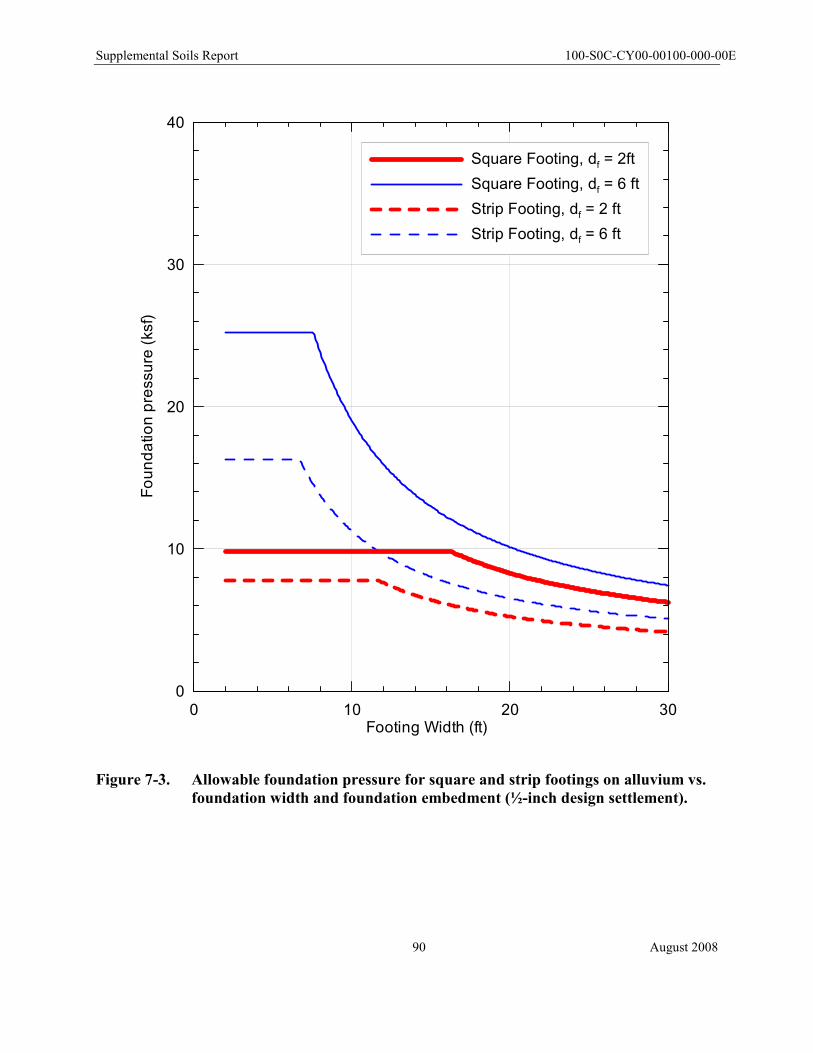
Foundation
pressure
(ksf)
40
30
20
10
0 0 10 20 30
Footing Width (ft)
Square Footing, df = 2ft Square Footing, df = 6 ft Strip Footing, df = 2 ft Strip Footing, df = 6 ft
Supplemental Soils Report 100-S0C-CY00-00100-000-00E
Figure 73. Allowable foundation pressure for square and strip footings on alluvium vs.
foundation width and foundation embedment (½inch design settlement).
90 August 2008
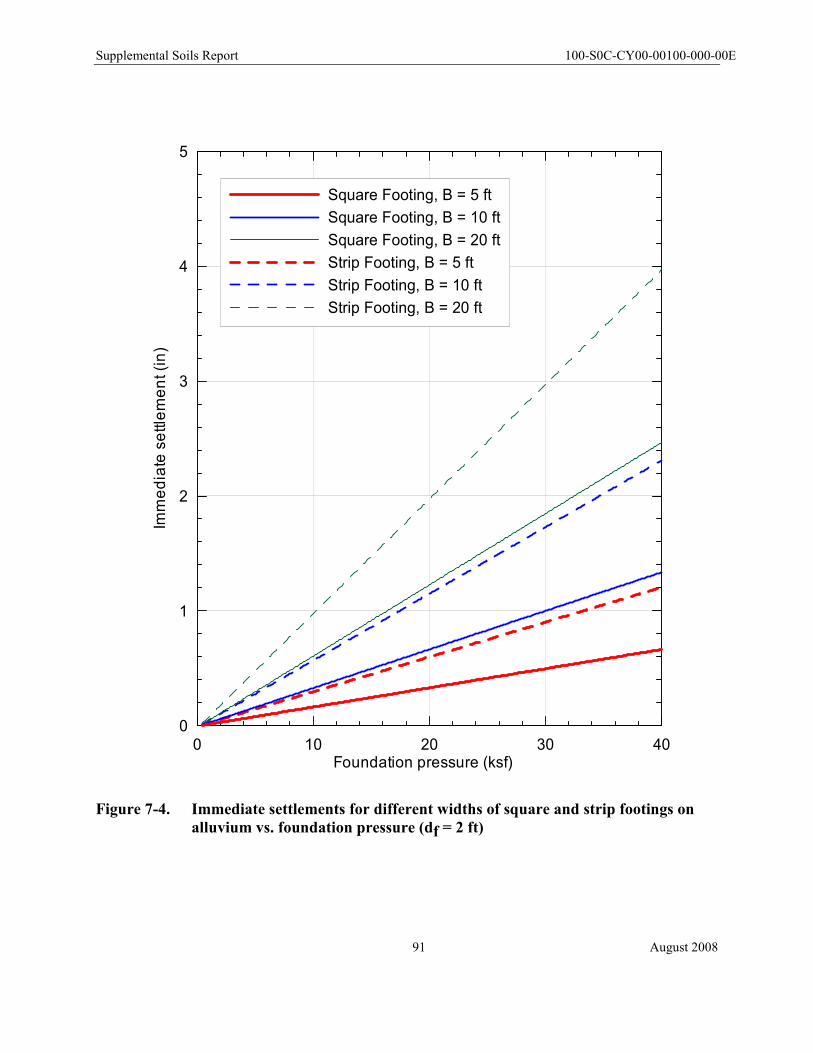
Supplemental Soils Report 100-S0C-CY00-00100-000-00E
0
1
2
3
4
5 Im
mediate
settlement (in)
Square Footing, B = 5 ft Square Footing, B = 10 ft Square Footing, B = 20 ft Strip Footing, B = 5 ft Strip Footing, B = 10 ft Strip Footing, B = 20 ft
0 10 20 30 40 Foundation pressure (ksf)
Figure 74. Immediate settlements for different widths of square and strip footings on alluvium vs. foundation pressure (df = 2 ft)
91 August 2008
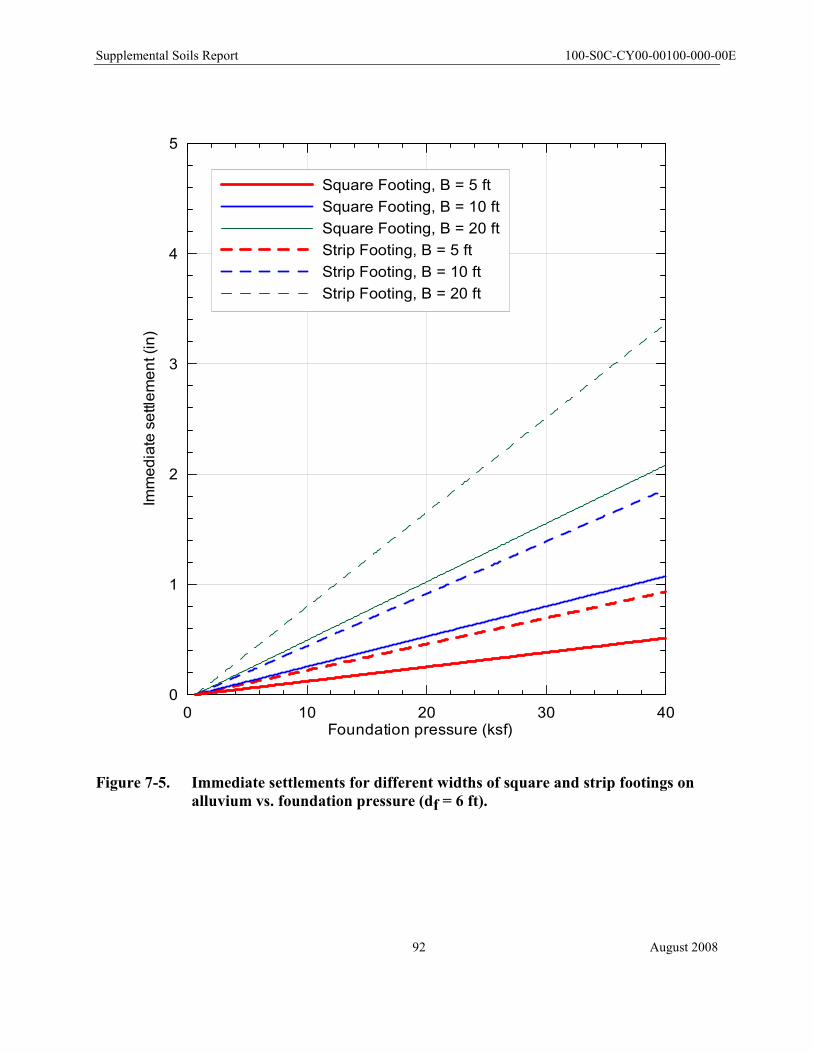
Supplemental Soils Report 100-S0C-CY00-00100-000-00E
0
1
2
3
4
5 Immediate
settlement (in)
Square Footing, B = 5 ft Square Footing, B = 10 ft Square Footing, B = 20 ft Strip Footing, B = 5 ft Strip Footing, B = 10 ft Strip Footing, B = 20 ft
0 10 20 30 40 Foundation pressure (ksf)
Figure 75. Immediate settlements for different widths of square and strip footings on alluvium vs. foundation pressure (df = 6 ft).
92 August 2008
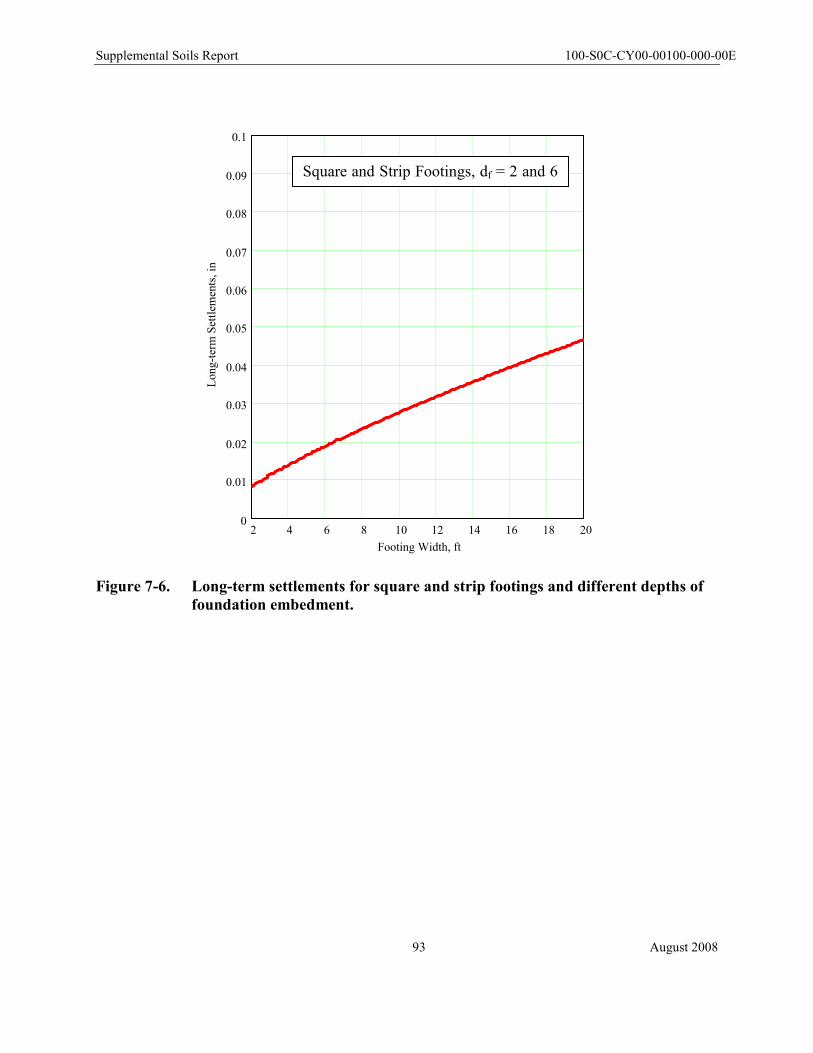
Settlements vesus Foundation Width
0
0.01
0.02
0.03
0.04
0.05
0.06
0.07
0.08
0.09
0.1
Long-t
erm
Set
tlem
ents
, in
Square and Strip Footings, df = 2 and 6
2 4 6 8 10 12 14 16 18 20Footing Width, ft
ft
Supplemental Soils Report 100-S0C-CY00-00100-000-00E
Figure 76. Longterm settlements for square and strip footings and different depths of foundation embedment.
93 August 2008
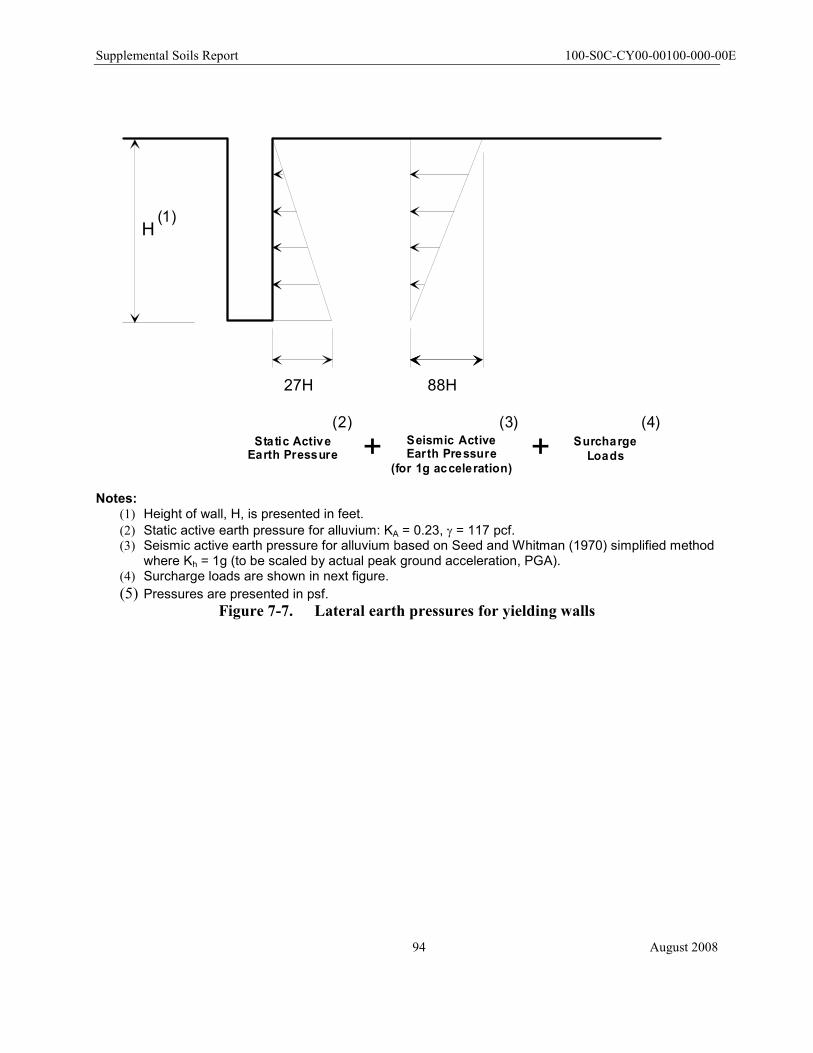
H (1)
27H 88H
(2) (3) (4) Sta tic Activ e
Earth Pressure + Seismic Active Earth Pre ssure + Surcha rge
Loads (for 1g ac celeration)
Supplemental Soils Report 100-S0C-CY00-00100-000-00E
Notes: (1) Height of wall, H, is presented in feet. (2) Static active earth pressure for alluvium: KA = 0.23, γ = 117 pcf. (3) Seismic active earth pressure for alluvium based on Seed and Whitman (1970) simplified method
where Kh = 1g (to be scaled by actual peak ground acceleration, PGA). (4) Surcharge loads are shown in next figure. (5) Pressures are presented in psf.
Figure 77. Lateral earth pressures for yielding walls
94 August 2008
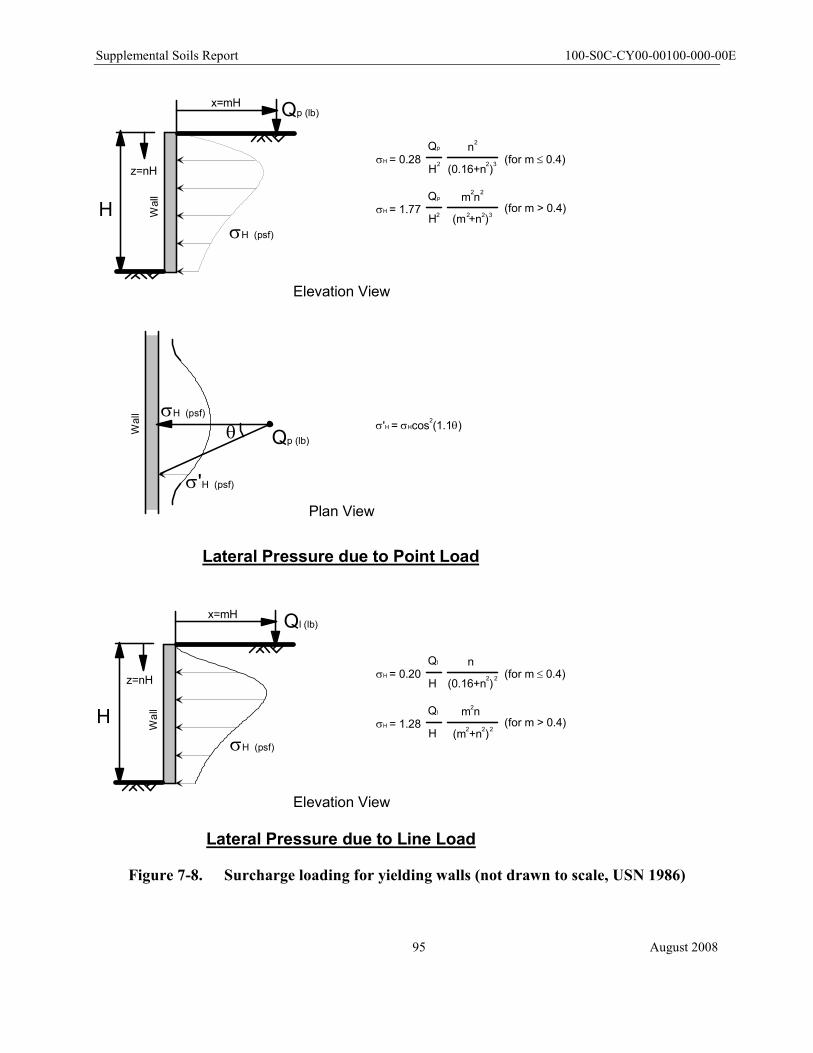
H
Qp (lb)
z=nH
x=mH
σH (psf)
Wall
Qp n2
σH = 0.28 (for m ≤ 0.4)2 2 3 H (0.16+n )
2 2Qp m n
σH = 1.77 (for m > 0.4)2 2 2 3
H (m +n )
Elevation View
Wall
σ'H = σHcos (1.1θ) Qp (lb)
σH (psf)
σ'H
2
θ
(psf)
Plan View
Lateral Pressure due to Point Load
H
Ql (lb)
σH (psf)
z=nH
x=mH
Wall
Ql n σH = 0.20 2 2 (for m ≤ 0.4)
H (0.16+n )
2Ql m n (for m > 0.4)σH = 1.28
2 2 2H (m +n )
Elevation View
Lateral Pressure due to Line Load
Supplemental Soils Report 100-S0C-CY00-00100-000-00E
Figure 78. Surcharge loading for yielding walls (not drawn to scale, USN 1986)
95 August 2008
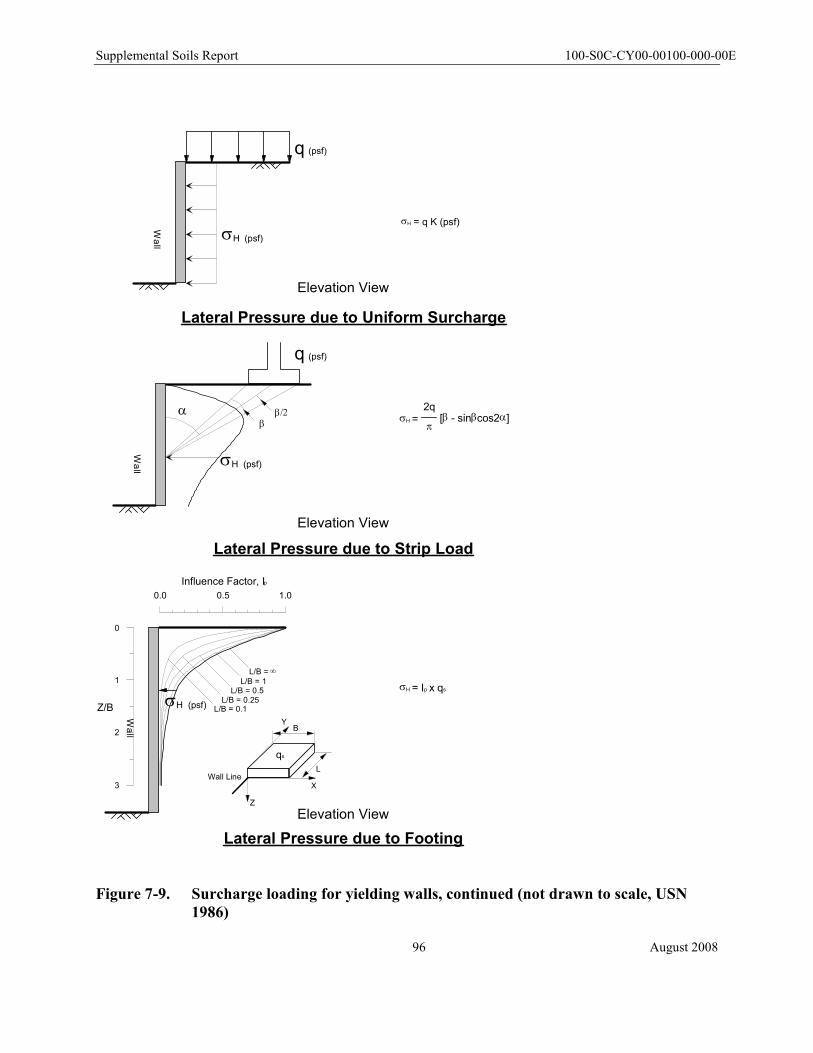
Wall
σH (psf)
q (psf)
σH = q K (psf)
Elevation View
Lateral Pressure due to Uniform Surcharge
q (psf)
σH
α
Wall
2q β
β/2 σH = [β sinβcos2α]π
(psf)
Elevation View
Lateral Pressure due to Strip Load
Influence Factor, Ip
0.0 0.5 1.0
3
2
1
0
L/B = 0.1 L/B = 0.25
L/B = 0.5 L/B = 1 L/B = ∞
Z/B
X
qs
Z
Wall Line
Y
L
B
Elevation View
σH = Ip x qs Wall
σH (psf)
Lateral Pressure due to Footing
Supplemental Soils Report 100-S0C-CY00-00100-000-00E
Figure 79. Surcharge loading for yielding walls, continued (not drawn to scale, USN 1986)
96 August 2008
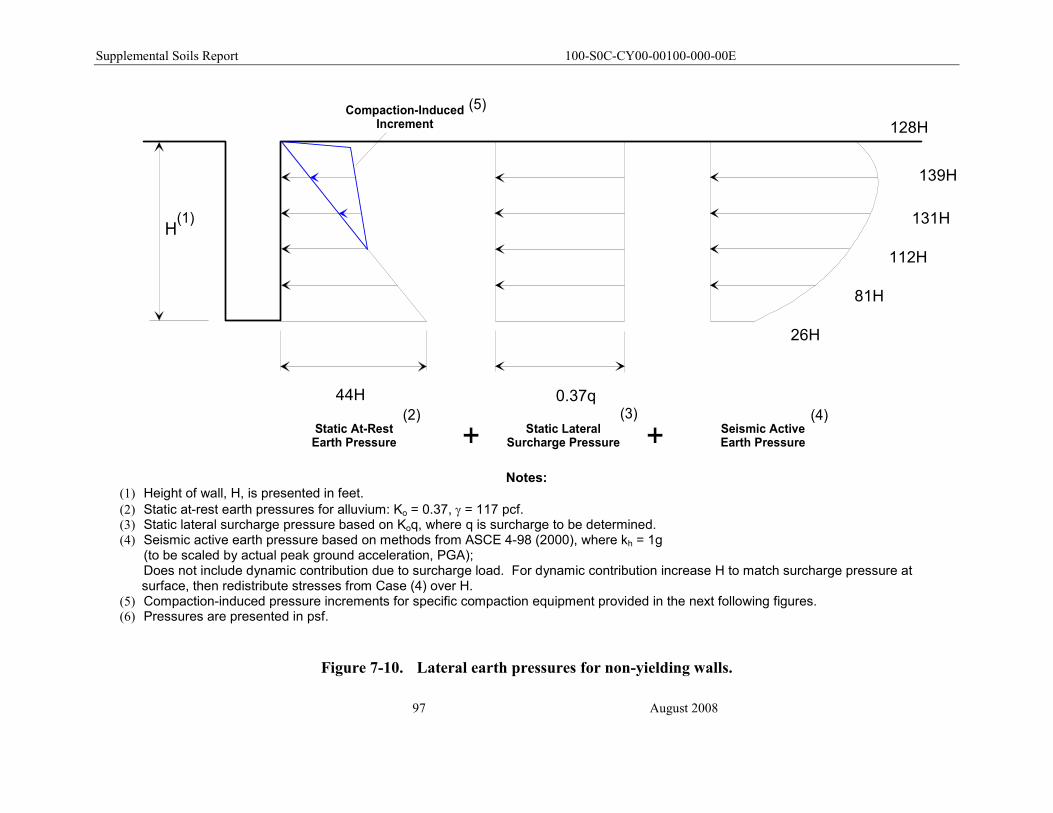
(5) CompactionInduced
Increment 128H
139H
(1) 131H
H
112H
81H
26H
44H 0.37q
(2) (3) (4)
Static AtRest
Earth Pressure + Static Lateral Surcharge Pressure + Seismic Active
Earth Pressure
Supplemental Soils Report 100-S0C-CY00-00100-000-00E
Notes: (1) Height of wall, H, is presented in feet.
(2) Static atrest earth pressures for alluvium: Ko = 0.37, γ = 117 pcf. (3) Static lateral surcharge pressure based on Koq, where q is surcharge to be determined.
(4) Seismic active earth pressure based on methods from ASCE 498 (2000), where kh = 1g
(to be scaled by actual peak ground acceleration, PGA); Does not include dynamic contribution due to surcharge load. For dynamic contribution increase H to match surcharge pressure at
surface, then redistribute stresses from Case (4) over H.
(5) Compactioninduced pressure increments for specific compaction equipment provided in the next following figures.
(6) Pressures are presented in psf.
Figure 710. Lateral earth pressures for nonyielding walls.
97 August 2008
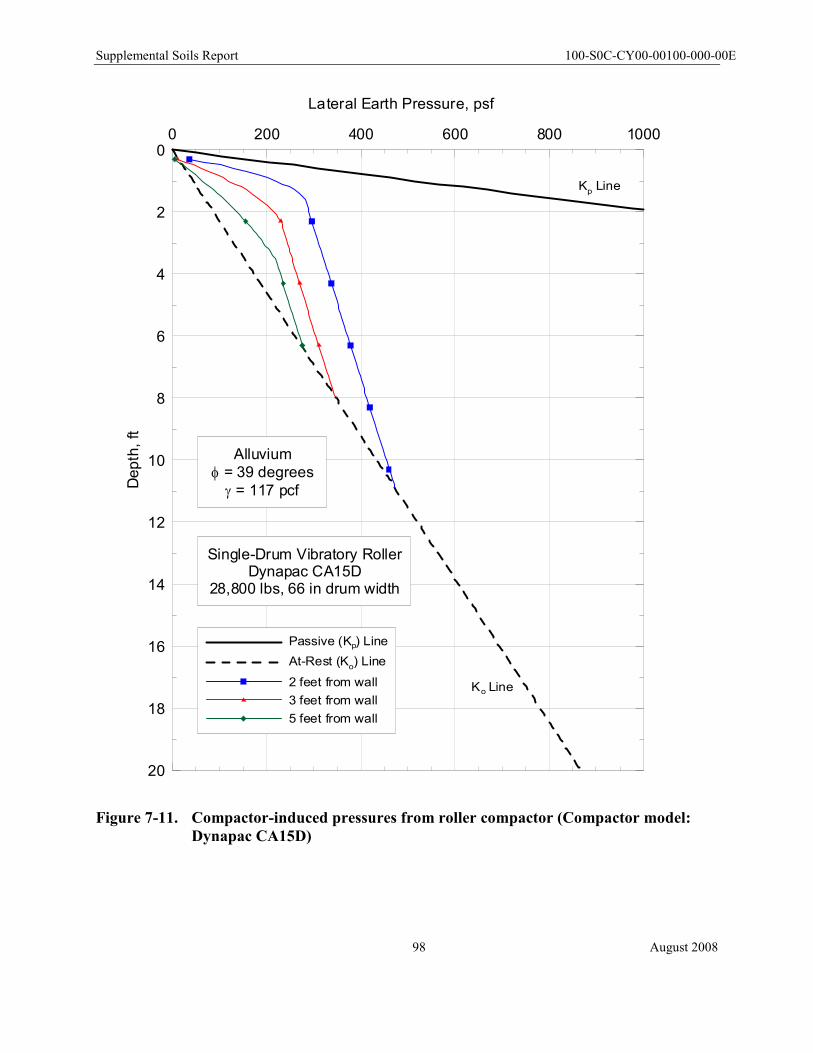
Lateral Earth Pressure, psf
0 200 400 600 800 1000
20
18
16
14
12
10
8
6
4
2
0 Depth, ft
Passive (Kp) Line AtRest (K
o) Line
2 feet from wall 3 feet from wall 5 feet from wall
K p Line
K o Line
SingleDrum Vibratory Roller Dynapac CA15D
28,800 lbs, 66 in drum width
Alluvium φ = 39 degrees
γ = 117 pcf
Supplemental Soils Report 100-S0C-CY00-00100-000-00E
Figure 711. Compactorinduced pressures from roller compactor (Compactor model: Dynapac CA15D)
98 August 2008
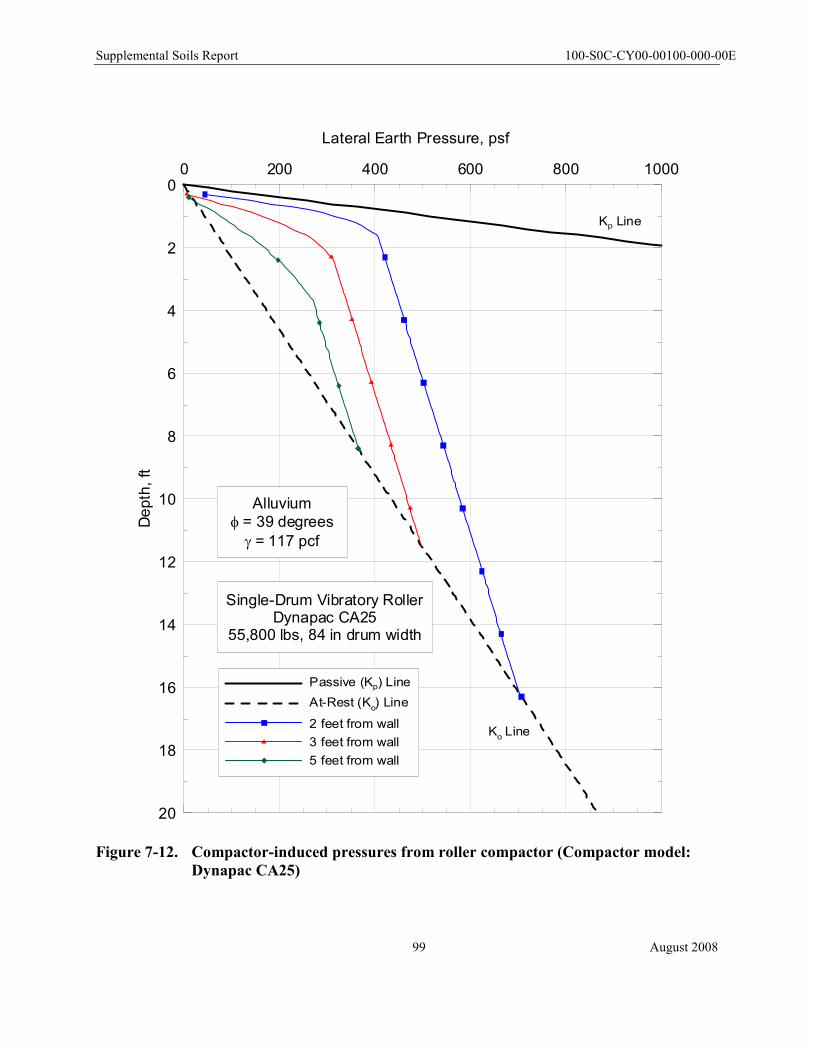
20
18
16
14
12
10
8
6
4
2
0
Depth, ft
Passive (Kp) Line AtRest (K
o) Line
2 feet from wall 3 feet from wall 5 feet from wall
K p Line
K o Line
SingleDrum Vibratory Roller Dynapac CA25
55,800 lbs, 84 in drum width
Alluvium φ = 39 degrees
γ = 117 pcf
Lateral Earth Pressure, psf
0 200 400 600 800 1000
Supplemental Soils Report 100-S0C-CY00-00100-000-00E
Figure 712. Compactorinduced pressures from roller compactor (Compactor model: Dynapac CA25)
99 August 2008
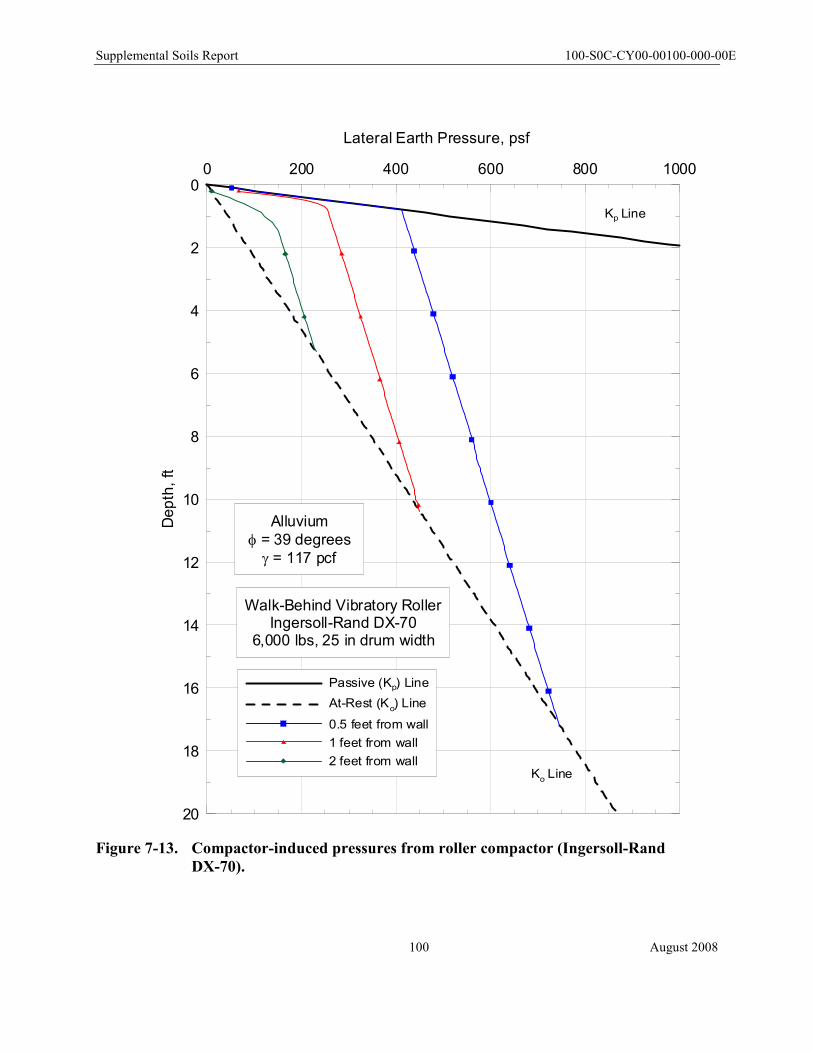
0 200 0
2
4
6
8
10
12
14
16
18
20
Lateral Earth Pressure, psf
400 600 800 1000
Passive (Kp) Line AtRest (K
o) Line
0.5 feet from wall 1 feet from wall 2 feet from wall
Kp Line
K o Line
WalkBehind Vibratory Roller IngersollRand DX70
6,000 lbs, 25 in drum width
Alluvium φ = 39 degrees
γ = 117 pcf
Depth, ft
Supplemental Soils Report 100-S0C-CY00-00100-000-00E
Figure 713. Compactorinduced pressures from roller compactor (IngersollRand DX70).
100 August 2008
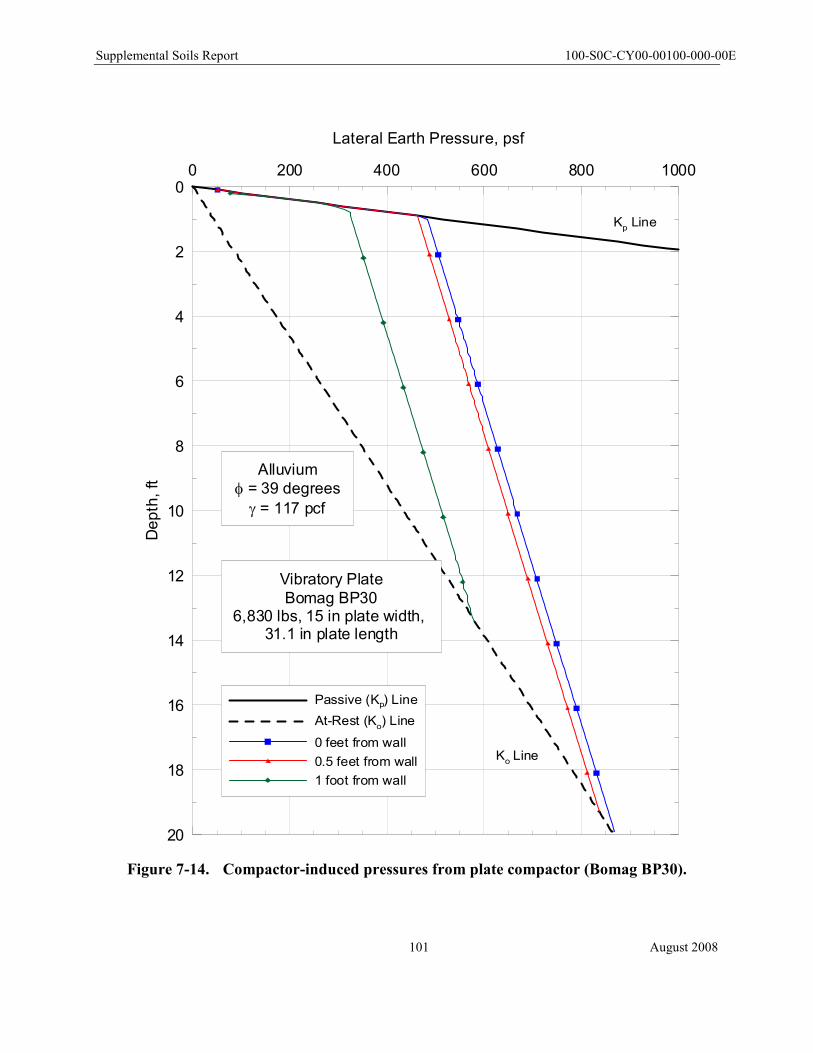
Lateral Earth Pressure, psf
0 200 400 600 800 1000
20
18
16
14
12
10
8
6
4
2
0
Depth, ft
Passive (Kp) Line AtRest (K
o) Line
0 feet from wall 0.5 feet from wall 1 foot from wall
K p Line
K o Line
Vibratory Plate Bomag BP30
6,830 lbs, 15 in plate width, 31.1 in plate length
Alluvium φ = 39 degrees
γ = 117 pcf
Supplemental Soils Report 100-S0C-CY00-00100-000-00E
Figure 714. Compactorinduced pressures from plate compactor (Bomag BP30).
101 August 2008
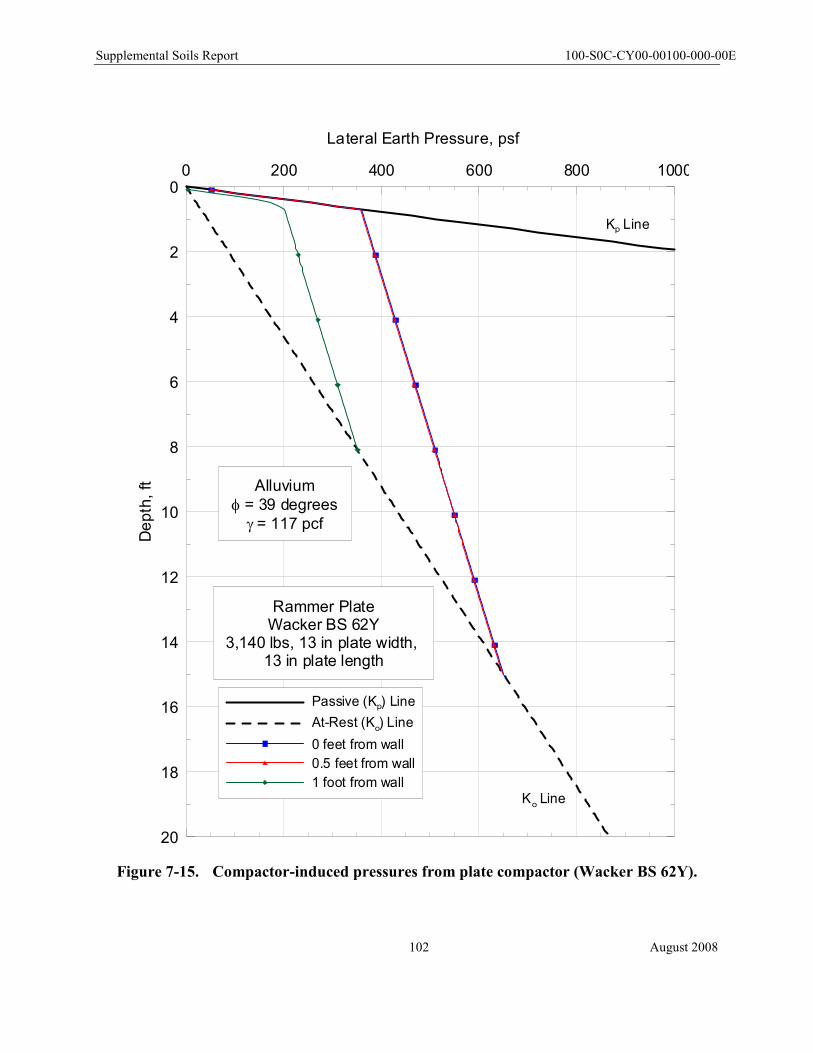
Supplemental Soils Report 100-S0C-CY00-00100-000-00E
Lateral Earth Pressure, psf
0 200 400 600 800 1000
20
18
16
14
12
10
8
6
4
2
0
Depth, ft
Passive (Kp) Line AtRest (K
o) Line
0 feet from wall 0.5 feet from wall 1 foot from wall
Kp Line
K o Line
Rammer Plate Wacker BS 62Y
3,140 lbs, 13 in plate width, 13 in plate length
Alluvium φ = 39 degrees
γ = 117 pcf
Figure 715. Compactorinduced pressures from plate compactor (Wacker BS 62Y).
102 August 2008
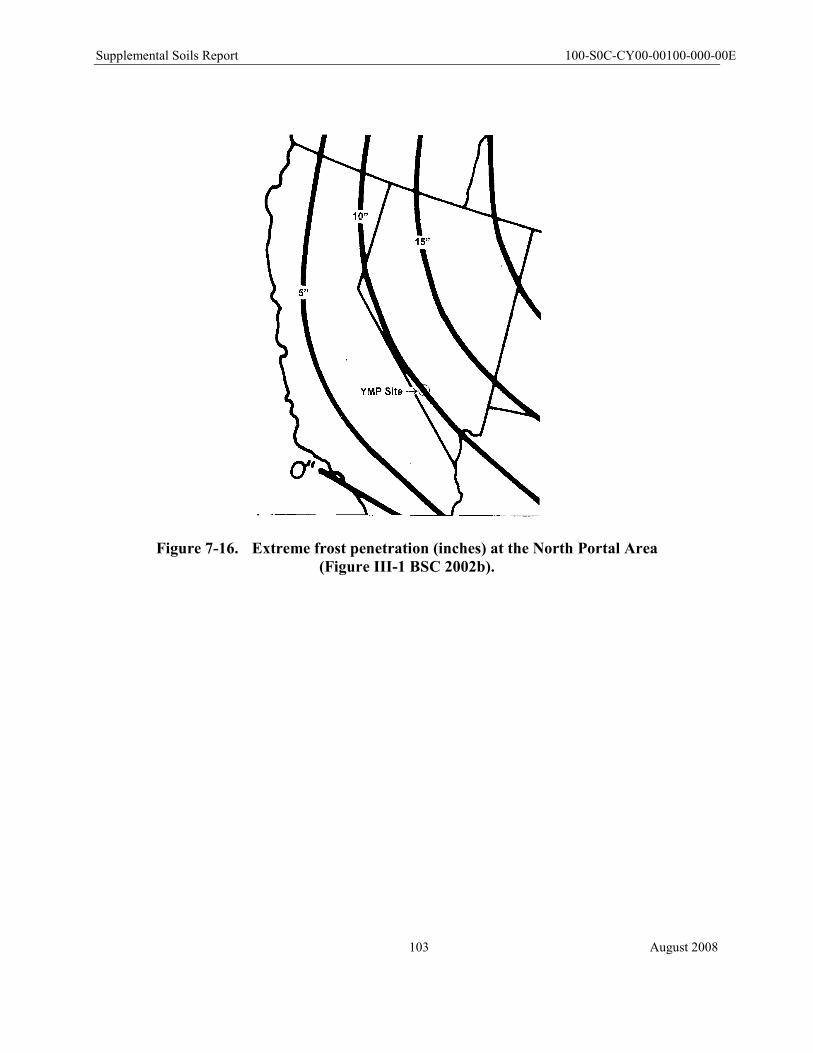
Supplemental Soils Report 100-S0C-CY00-00100-000-00E
Figure 716. Extreme frost penetration (inches) at the North Portal Area (Figure III1 BSC 2002b).
103 August 2008
Supplemental Soils Report 100-S0C-CY00-00100-000-00E
7.2 CONSTRUCTION CONSIDERATIONS
7.2.1 Stripping and Site Preparation
Portions of the site are currently covered with 5 to 50 feet of uncontrolled sand and gravel fill.
All fill in the building areas should be removed down to the top of alluvium. Any preexisting
organic materials and roots, if any, encountered at the top of the alluvium should be stripped at
each of the structure sites. It is expected that no more than 6 inches of stripping of the original
native surface would be needed to remove the organic materials and roots. In areas with
preexisting heavy sagebrush growth, additional stripping may be required to remove the deep
roots.
The excavated areas should extend outside the footing line for a distance equal to at least 1/2 the
depth of the excavation up to a maximum of 5 feet outside the footing line.
The top 12 inches of the exposed subgrade surface should then be compacted to an in-place
density of at least 95 percent of the maximum laboratory dry density as determined by
ASTM D 1557.
The structural fill may consist of the excavated soil, or imported fill. Imported structural fill
should consist of 5/8-inch minus crushed base course or 2-inch minus pit run gravel with less
than 5 percent fines (minus U.S. No. 200 sieve size). All structural fill beneath or around
structures should be compacted to an in-place density of at least 95 percent of the maximum
laboratory dry density as determined by ASTM D 1557.
7.2.2 Foundations
All foundations should be buried a minimum of 2 feet below the ground surface. This depth
exceeds the design depth of freeze of 10 inches (see Section 7.1.11), with some allowance for
loss of ground around footings.
7.2.3 Excavation, Backfill and Temporary Shoring
It is recommended that all excavations be made as open excavations, with side slopes no steeper
than 1.5 Horizontal to 1 Vertical (1.5H: IV). However, recognizing that some elements of
certain structures may be as deep as 50 feet or more below the existing surface elevation, a
combination of open cut and shoring may be necessary for those particular features. Temporary
shoring to support these excavations may be designed based on the soil properties indicated in
Table 2-1.
Consistent with conventional practice, actual temporary excavation slopes should be made the
responsibility of the construction contractor. The construction contractor is able to observe the
nature and conditions of the subsurface encountered and has the responsibility for methods,
sequence, and schedule of construction. If instability is detected, slopes should be flattened or
shored. All temporary excavation slopes should be accomplished in accordance with all local,
104 August 2008
Supplemental Soils Report 100-S0C-CY00-00100-000-00E
state, and federal safety regulations. Excavation slopes and shoring may be designed using the
soil properties shown in Table 2-1. Shoring systems, if used, should be monitored for vertical
and lateral movement during construction to confirm that movements are contained within
allowable limits.
The granular soils observed in the explorations can be excavated using conventional equipment
such as scrapers or rubber-tired or tracked hydraulic backhoes. Excavation in most of the site
soils is not expected to require any unusual equipment or procedures. Any cobbles observed in
the excavations should be removed from any excavated soils that will be used as backfill. No
cemented layers were identified that would require special construction equipment or techniques.
7.2.4 Excavations for Underground Utilities
Backfill above and around underground utilities should be compacted to an in-place density of at
least 95 percent of the maximum laboratory dry density as determined by ASTM D 1557.
Moisture content of backfill materials should be within ± 3 percent of optimum.
As an alternative to conventional trench backfilling, encasement of the conduit in controlled
density fill (CDF) may be used. CDF used for pipe bedding or backfill should have a 28-day
compressive strength between 50 and 200 psi (ACI 230.1R-90).
Consistent with conventional practice, actual temporary excavation slopes for utility trenches
should be made the responsibility of the construction contractor. The construction contractor is
able to observe the nature and conditions of the subsurface materials encountered and has the
responsibility for methods, sequence, and schedule of construction. If instability is detected,
slopes should be flattened or shored. All temporary excavation slopes should be accomplished in
accordance with local, state, and federal safety regulations.
7.2.5 Temporary and Permanent Slopes
Temporary cut slopes should be constructed with slopes no steeper than 1.5H: IV. Fill slopes
should be no steeper than 2H: 1V. This recommendation is in conformance with the Project
Design Documents (BSC 2007a, Section 4.2.1.7).
Permanent cut and fill slopes should be provided with erosion protection by placement of at least
3 inches of coarse concrete aggregate.
7.2.6 Compaction
All foundation stabilization, structural fill, utility bedding, and foundation and trench backfill
materials should be compacted to an in-place density of at least 95 percent of the maximum
laboratory dry density as determined by ASTM D 1557. Moisture content should be controlled
to be within ±3 percent of optimum.
In general, the thickness of backfill layers before compaction should not exceed 12 inches for
heavy compactors and 8 inches for hand-operated mechanical compactors. 105 August 2008
Supplemental Soils Report 100-S0C-CY00-00100-000-00E
7.2.7 Suitability of Onsite Materials
7.2.7.1 Structural Backfill
Based on field descriptions and laboratory testing of the alluvial materials encountered in the test
pits performed at the surface facilities and the Fran Ridge borrow area (Sections 6.2.4 and 6.2.9
of BSC 2002a), these materials are suitable for use as structural backfill provided that material
larger than 3 inches are removed and that a suitable means is used to test the materials for quality
control purposes. Backfill placed around structures should be placed in lifts not to exceed 12
inches loose depth for heavy compactors and 8 inches for hand-operated mechanical compactors,
and compacted to an in-place density of at least 95 percent of the maximum laboratory dry
density as determined by ASTM D 1557.
7.2.8 Concrete Aggregates
Based on gradation tests performed on the alluvial materials encountered in the test pits
performed at the surface facilities and the Fran Ridge borrow area (Section 6.5.2 of BSC 2002a),
materials encountered at the site are not suitable for use as concrete aggregates without
processing. The unprocessed materials contain too many large size particles. Processing these
deposits to produce acceptable concrete aggregate is expected to be cost-prohibitive. However,
if ballast is also processed on site, the additional processing required for concrete aggregate may
become more viable.
7.2.9 Volume Coefficients
Based on density test results compiled in BSC (2002b), Section I.2.1, the mean moist unit weight
of the in situ alluvium is between 114 and 117 pcf. The maximum dry unit weight for tests on
Fran Ridge borrow material (also composed of alluvial soils) as reported in BSC (2002b),
Section 8.1.1, was 114.5 pcf with a moisture content of 11%. Adjustments for the large particle
sizes and for a moisture content one percentage point higher than the optimum resulted in a
maximum estimated moist unit weight of 128 pcf (Section I.1.1 of BSC 2002b).
Therefore, assuming that the Fran Ridge material physical characteristics are similar to the in situ
alluvium, the in-place relative compaction of the alluvium is estimated to be about 114/128 =
89% of its maximum value. Compaction of the excavated alluvium to 95% of its maximum dry
density will result in a denser material that is smaller in volume. The difference involved with
this process is therefore (114-128)/114 = -11%, or 11% percent shrinkage. Due to local
variability in gravel content additional testing during construction will be necessary to determine
the actual shrink or swell factors for the particular blend of materials.
7.2.10 Surface and Storm Water Drainage
Surface drainage should provide positive drainage of surface storm water away from the
structures and pavement areas. It is expected that storm water disposal may utilize conventional
106 August 2008
Supplemental Soils Report 100-S0C-CY00-00100-000-00E
drywells installed within the alluvium. However, cementation in the alluvium may decrease the
effectiveness of drywells and additional studies and analysis would be required for this approach.
Infiltration testing is recommended for the alluvium. A factor of safety of at least 3.0 should be
applied to the measured rate to accommodate plugging over time.
7.2.11 Septic System Drain Field
The septic system drain field should be designed in accordance the state and local requirements.
The septic system should be designed using the average measured infiltration rate at 4 feet below
the existing surface elevation in the alluvial materials. Current design standards allow septic
systems to be designed based on actual infiltration rates without application of a factor of safety.
Because of the expected heavy usage, provisions for reserve capacity should be included in the
septic system drain field design.
7.2.12 Wet Weather Construction
Because of the granular nature of the soils at this site and the general environment of the site, wet
weather construction should not be a major concern. Mitigation measures to reduce the potential
impact of occasional storms would include providing positive drainage to direct storm water
away from excavations and work zones. Effective maintenance of access roads and staging areas
will also reduce the impact of an occasional storm.
7.2.13 Dewatering
Because of the depth of the groundwater, over 1000 feet below the ground surface elevation,
dewatering is not a significant concern at this site.
7.3 ADDITIONAL INVESTIGATIONS/TESTING
The current information is considered sufficient for design of the surface facilities. Additional
field (drilling or test pits) and/or laboratory testing may be needed for non-waste handling
facilities or roadways, or if there are additions/alterations to the current surface facilities
configuration. The following is a list of items that may be required to finalize design for the
YMP facilities at the North Portal area.
7.3.1 Test Pits and Geologic Reconnaissance
Additional shallow test pits may be needed on Exile Hill to better characterize the depth to rock
for embankment cuts and road design. Test pits may also be needed to determine localized
undocumented fill depths in some of the building areas, primarily for bid purposes.
107 August 2008
Supplemental Soils Report 100-S0C-CY00-00100-000-00E
7.3.2 Borings
Any additional borings should be performed using mud rotary, hollow-stem auger, or air-drill
techniques. Sampling would generally involve 3-inch diameter heavy-duty samplers along with
2-inch diameter SPT. Any encountered soft zones would be sampled with 3-inch diameter thin-
walled Shelby tubes. Borings should extend about 15 feet into rock. Therefore, coring
capability will also be needed. The cone penetrometer test (CPT) is not an option due the
amount of gravel present.
7.3.3 Laboratory Testing
Laboratory testing associated with the borings would consist of gradation, Atterberg limits, direct
shear, moisture and density, relative density tests, and possibly large diameter triaxial testing.
7.3.4 CBR Testing
California bearing ratio tests are needed on the alluvium and anticipated fill sources for
pavement design.
7.3.5 Field Plate Load Tests
Plate load tests should be conducted on undisturbed soils in the test pits to define the elastic
parameters of the alluvium and the fill source.
7.3.6 Resistivity Testing
Field electrical resistivity tests should be performed on the alluvium and fill source materials for
electrical grounding design and evaluation of corrosion potential of buried metal pipes.
7.3.7 Aggregate Testing
Qualification of on-site or local aggregate will require testing for use as backfill and under
pavements. Required tests include specific gravity, absorption, degradation, and soundness.
7.3.8 Ballast Testing
Additional aggregate testing suites, as described in Section 7.3.7, would be needed to evaluate
tunnel muck cuttings for use as ballast when suitable samples become available.
7.3.9 Chemical Testing
Laboratory pH, chloride, sulphate tests will be needed to evaluate corrosion potential for metal
pipes from alluvium and fill.
108 August 2008
Supplemental Soils Report 100-S0C-CY00-00100-000-00E
7.3.10 Test Fill Program
A test fill program should be performed to evaluate the in situ engineering properties of
engineered fill, including its shear-wave and damping properties, and to determine the effect of
construction equipment on the material. The test pad would also be used to establish
relationships between the various density testing methods (i.e., nuclear, sand cone, and relative
density).
7.3.11 Pavement and Railroad Subgrade Design
Design of temporary construction roads, operational pavements, railroad subgrade (and any
special purpose roads, such as for heavy transport vehicles) may require additional field and
laboratory tests.
7.3.12 RCSC Testing
If roller compacted soil cement is considered for use at the site, an additional testing program
will be required to develop design parameters as discussed in Section 6.4.3.2.
109 August 2008

Title: Supplemental Soils Report Document Identifier: 100-S0C-CY00-00100-000-00E Page: A-1
APPENDIX A – Not Used
_______________________________________________________________________________________________________
Appendix B Contents Page Number
B1 Objective ............................................................................................................................B2
B2 Inputs..................................................................................................................................B2
B2.1 Foundation Geometry .............................................................................................B2
B2.2 Allowable Settlements .............................................................................................B3
B2.3 Soil Stratigraphy and Parameters .........................................................................B3
B2.4 Factor of Safety........................................................................................................B5
B3 Background........................................................................................................................B5
B4 Methodology ......................................................................................................................B5
B4.1 Allowable Foundation Pressure ............................................................................B6
B4.2 Shortterm Settlements for Shallow Footings.......................................................B6
B4.3 Elastic Settlements for Mat Foundations .............................................................B7
B4.4 Longterm Settlements ...........................................................................................B7
B5 Assumptions.......................................................................................................................B8
B6 Calculations .......................................................................................................................B8
B6.1 Bearing Capacity for Shallow Footings.................................................................B9
B6.2 Shortterm Settlements for Shallow Footings.....................................................B12
B6.3 Foundation Pressure Considering Maximum Allowable Shortterm
Settlements (Sc = δδδδmax)............................................................................................B17
B6.4 Design Foundation Pressure ................................................................................B20
B6.5 Settlements for Different Foundation Pressures ................................................B24
B6.6 Longterm Settlements ..........................................................................................B35
B6.7 Elastic Settlement for Mat Foundation ...............................................................B38
B7 Results and Conclusions.................................................................................................B46
Title: Supplemental Soils Report Document Identifier: 100S0CCY000010000000E Page: B1
APPENDIX B BEARING CAPACITY AND SETTLEMENT
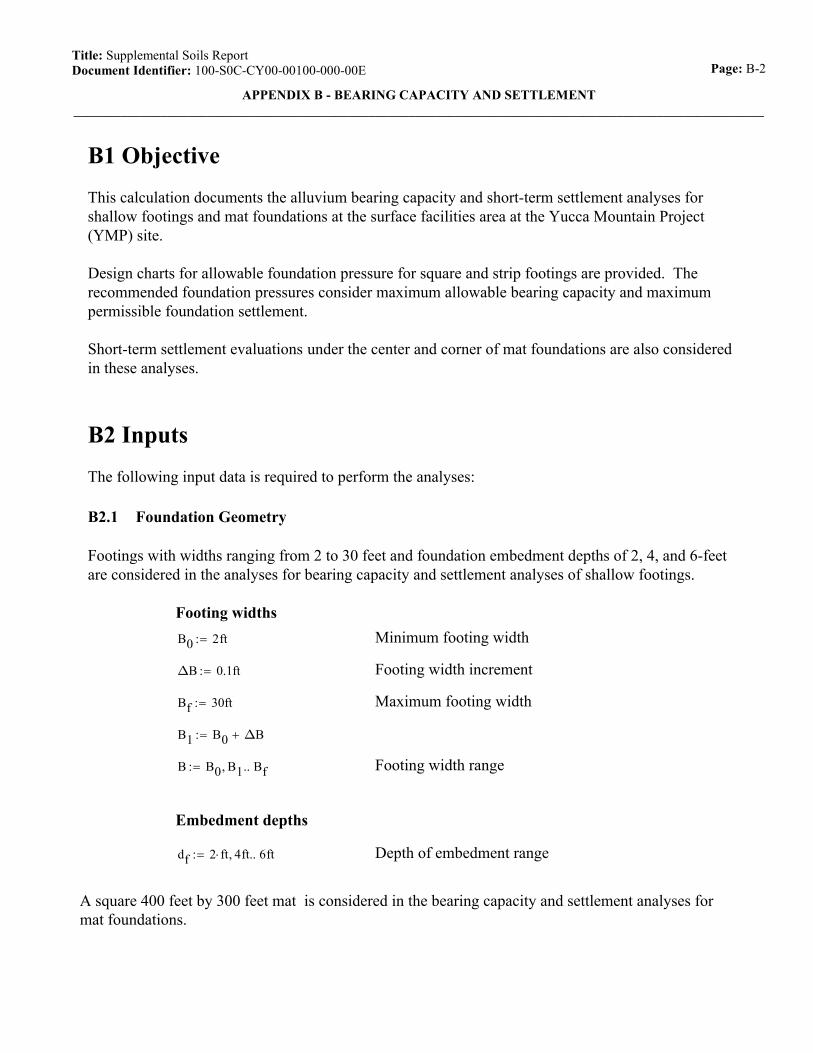
_______________________________________________________________________________________________________
B1 Objective This calculation documents the alluvium bearing capacity and shortterm settlement analyses for shallow footings and mat foundations at the surface facilities area at the Yucca Mountain Project (YMP) site.
Design charts for allowable foundation pressure for square and strip footings are provided. The recommended foundation pressures consider maximum allowable bearing capacity and maximum permissible foundation settlement.
Shortterm settlement evaluations under the center and corner of mat foundations are also considered in these analyses.
B2 Inputs The following input data is required to perform the analyses:
B2.1 Foundation Geometry
Footings with widths ranging from 2 to 30 feet and foundation embedment depths of 2, 4, and 6feet are considered in the analyses for bearing capacity and settlement analyses of shallow footings.
Footing widths B := 0 2ft Minimum footing width
ΔB := 0.1ft Footing width increment
B := Maximum footing width f 30ft
B := 1 B + 0 ΔB
B := B , 0 B .. 1 B Footing width range f
Embedment depths
d := f 2 ⋅ft , 4ft .. 6ft Depth of embedment range
A square 400 feet by 300 feet mat is considered in the bearing capacity and settlement analyses for mat foundations.
Title: Supplemental Soils Report Document Identifier: 100S0CCY000010000000E Page: B2
APPENDIX B BEARING CAPACITY AND SETTLEMENT
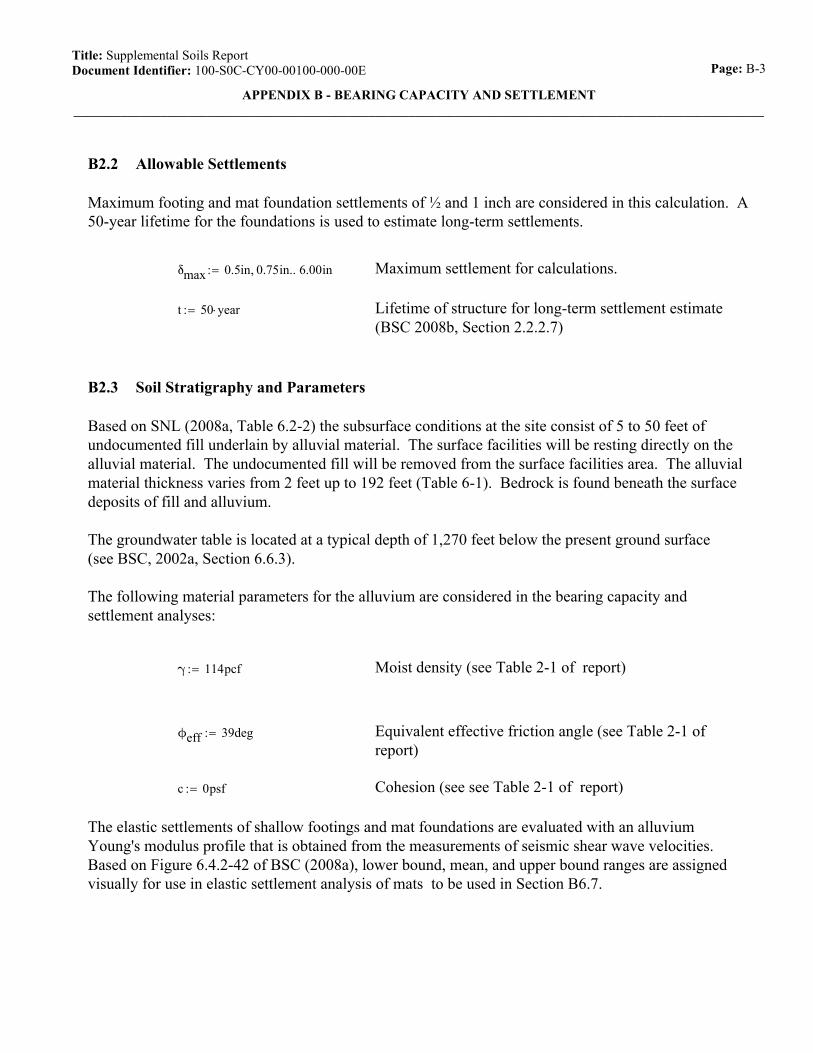
_______________________________________________________________________________________________________
Title: Supplemental Soils Report Document Identifier: 100S0CCY000010000000E Page: B3
APPENDIX B BEARING CAPACITY AND SETTLEMENT
B2.2 Allowable Settlements
Maximum footing and mat foundation settlements of ½ and 1 inch are considered in this calculation. A 50year lifetime for the foundations is used to estimate longterm settlements.
δ := 0.5in , 0.75 in.. 6.00in Maximum settlement for calculations.max
t := 50 ⋅�year Lifetime of structure for longterm settlement estimate (BSC 2008b, Section 2.2.2.7)
B2.3 Soil Stratigraphy and Parameters
Based on SNL (2008a, Table 6.22) the subsurface conditions at the site consist of 5 to 50 feet of undocumented fill underlain by alluvial material. The surface facilities will be resting directly on the alluvial material. The undocumented fill will be removed from the surface facilities area. The alluvial material thickness varies from 2 feet up to 192 feet (Table 61). Bedrock is found beneath the surface deposits of fill and alluvium.
The groundwater table is located at a typical depth of 1,270 feet below the present ground surface (see BSC, 2002a, Section 6.6.3).
The following material parameters for the alluvium are considered in the bearing capacity and settlement analyses:
γ := 114pcf Moist density (see Table 21 of report)
ϕ := 39deg Equivalent effective friction angle (see Table 21 ofeff report)
c := 0psf Cohesion (see see Table 21 of report)
The elastic settlements of shallow footings and mat foundations are evaluated with an alluvium Young's modulus profile that is obtained from the measurements of seismic shear wave velocities. Based on Figure 6.4.242 of BSC (2008a), lower bound, mean, and upper bound ranges are assigned visually for use in elastic settlement analysis of mats to be used in Section B6.7.
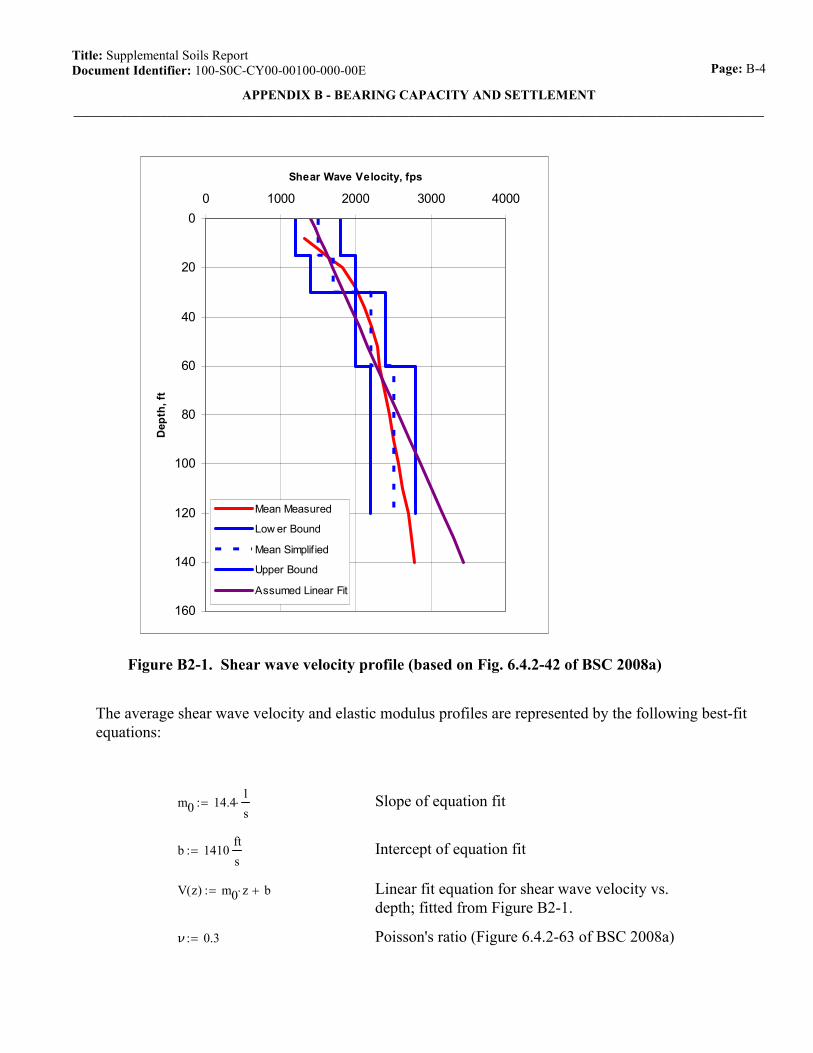
_______________________________________________________________________________________________________
0
20
40
60
80
100
120
140
160
0 1000 2000 3000 4000
Shear Wave Velocity, fps Depth, ft
Mean Measured
Low er Bound
Mean Simplif ied
Upper Bound
Assumed Linear Fit
Title: Supplemental Soils Report Document Identifier: 100S0CCY000010000000E Page: B4
APPENDIX B BEARING CAPACITY AND SETTLEMENT
Figure B21. Shear wave velocity profile (based on Fig. 6.4.242 of BSC 2008a)
The average shear wave velocity and elastic modulus profiles are represented by the following bestfit equations:
1m := 0 14.4 ⋅ Slope of equation fit
s
ft b := 1410 Intercept of equation fit
s
V( z) := m ⋅z + b Linear fit equation for shear wave velocity vs. 0depth; fitted from Figure B21.
ν := 0.3 Poisson's ratio (Figure 6.4.263 of BSC 2008a)
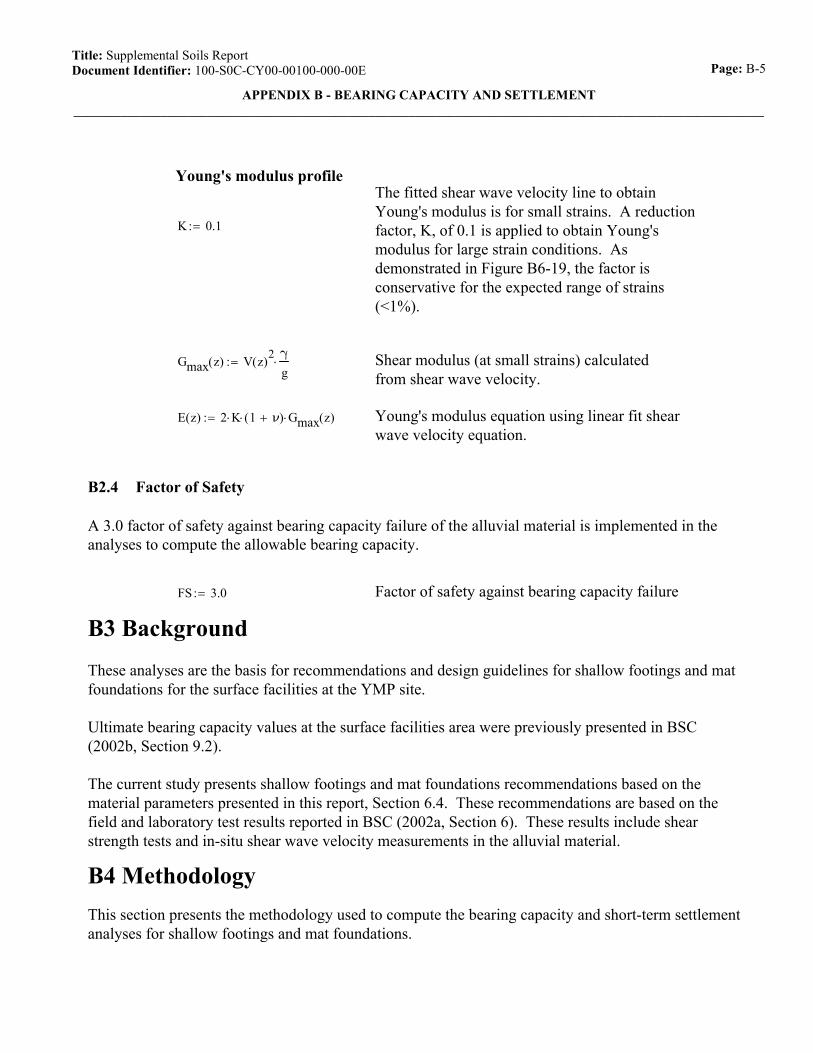
_______________________________________________________________________________________________________
Title: Supplemental Soils Report Document Identifier: 100S0CCY000010000000E Page: B5
APPENDIX B BEARING CAPACITY AND SETTLEMENT
Young's modulus profile The fitted shear wave velocity line to obtain Young's modulus is for small strains. A reduction
K := 0.1 factor, K, of 0.1 is applied to obtain Young's modulus for large strain conditions. As demonstrated in Figure B619, the factor is conservative for the expected range of strains (<1%).
2 γ G z := V z ⋅ Shear modulus (at small strains) calculated( ) ( ) max
g from shear wave velocity.
E z := 2 K⋅(1 ⋅ z Young's modulus equation using linear fit shear( ) ⋅ + ν) G ( ) max wave velocity equation.
B2.4 Factor of Safety
A 3.0 factor of safety against bearing capacity failure of the alluvial material is implemented in the analyses to compute the allowable bearing capacity.
FS := 3.0 Factor of safety against bearing capacity failure
B3 Background
These analyses are the basis for recommendations and design guidelines for shallow footings and mat foundations for the surface facilities at the YMP site.
Ultimate bearing capacity values at the surface facilities area were previously presented in BSC (2002b, Section 9.2).
The current study presents shallow footings and mat foundations recommendations based on the material parameters presented in this report, Section 6.4. These recommendations are based on the field and laboratory test results reported in BSC (2002a, Section 6). These results include shear strength tests and insitu shear wave velocity measurements in the alluvial material.
B4 Methodology This section presents the methodology used to compute the bearing capacity and shortterm settlement analyses for shallow footings and mat foundations.
analyses for shallow footings and mat foundations.
_______________________________________________________________________________________________________
Title: Supplemental Soils Report Document Identifier: 100S0CCY000010000000E Page: B6
APPENDIX B BEARING CAPACITY AND SETTLEMENT
B4.1 Foundation Pressures
The recommended foundation pressures for shallow footings is computed for square and strip footings and for different foundation embedment depths. These recommended pressures are limited by the following criteria:
• The recommended foundation pressure should not exceed the allowable foundation capacity that considers a factor of safety of 3.0 against the soil shear failure. This allowable value is computed using the general ultimate capacity equation reported in Bowles (1996, Table 41 and Table 45a).
• The induced footing settlements cause by the recommended foundation pressure should not exceed the maximum allowable foundation settlement. Elastic settlements are computed using the settlement analyses procedures proposed by Burland and Burbidge, and by Schmertmann et al. as reported in Terzaghi et al. (1996, Sections 50.2.5 and 50.2.6).
B4.2 Shortterm Settlements for Shallow Footings
Shortterm settlements of shallow foundations are computed for square and strip footings using the Burland and Burbidge, and the Schmertmann et al. methods as presented in Terzaghi et al. (1996, Sections 50.2.5 and 50.2.6). Both methods use elastic theory to evaluate immediate settlements.
The Burland and Burbidge method is based on field measurements of foundation settlements. It uses the soil average standard penetration test blow count (N60) values to estimate the soil's vertical compression. The Schmertmann et al. method is based on field measurements of vertical strain beneath shallow footings. It uses the elastic soil modulus to estimate settlements.
The following discussion describes the methodology used to obtain the N60 values and the elastic modulus for the alluvial material to be used as input parameters in the shortterm settlement estimates.
N60
N60 results on the alluvial material are reported in only one of the exploration boreholes drilled in the WHB area. The reported values are unrealistically high and, therefore, are not used in the settlement analyses.
As an alternative to determine the N60 values for the alluvial material, two different procedures that correlate N60 values with experimental soil parameters were reviewed. The soil parameters reviewed in these correlations are as follows:
_______________________________________________________________________________________________________
Title: Supplemental Soils Report Document Identifier: 100S0CCY000010000000E Page: B7
APPENDIX B BEARING CAPACITY AND SETTLEMENT
Using the correlations presented in Seed and Idriss (1970) and Seed et al. (1986), N60 values for the alluvial material were evaluated using the extensive seismic shear wave velocity measurements performed at the site (see BSC 2002a, Section 6). The estimated N60 values with these correlations were unrealistically high for the given velocity measurements and thus are not used in the settlement analyses.
N60 values for the alluvial material were correlated to the internal friction angle of the alluvium. The basis for the internal friction angle was from relative density measurements discussed in Section 6.4.1.1.3. The relationship proposed by Peck et al. (1974, page 310), is used to correlate N60 values with internal friction angle. These values were used in the shortterm settlement analyses (see Section B6.2).
Young's modulus
Estimate of the soil's Young's modulus are obtained from the seismic shear wave velocity measurements performed at the site (see Figure 6.4.242 of BSC 2008a). The average shear wave velocity profile adopted in this calculation is presented in Section B2.3.
B4.3 Elastic Settlements for Mat Foundation
Settlements of a mat foundation on the alluvial sand were determined using elastic theory.
The stress profile under the mat was computed using a Boussinesq equation for a uniform vertical load. The incremental strain profile under the mat was computed using an iterative procedure that accounted for the degradation of Young's modulus with strain. In the iterative procedure, an initial smallstrain Young's modulus was determined from the shear wave velocity profile presented in Section B2.3.
The shear modulus degradation curve for sands (Seed et al, 1986) was used to represent the Young's modulus degradation behavior of the alluvial material. For the purpose of the analysis herein, this assumption is considered conservative.
B4.4 Longterm Settlements
The Burland and Burbidge procedure was implemented to compute the longterm settlements of footings (see Terzaghi et al, 1996, Section 50.2.5). This method estimates settlements based on the soil standard penetration test blow count (N60) values.
_______________________________________________________________________________________________________
Title: Supplemental Soils Report Document Identifier: 100S0CCY000010000000E Page: B8
APPENDIX B BEARING CAPACITY AND SETTLEMENT
B5 Assumptions
It is conservatively assumed that bedrock is very deep and that it has no effect on the bearing capacity and settlement analyses for shallow footings and mat foundations.
Additionally, the Young's modulus, E, is assumed to degrade the same as the shear modulus, G, for sands. This yields conservative results since Poisson's ratio does not remain constant with strain. It is also assumed that there is no rock strain for the mat analysis.
No eccentric or inclined loading is considered in the analyses.
The preconsolidated characteristics of the alluvial material due to the removal of the overlaying undocumented fill is not considered in the shortterm settlement analyses. This is a conservative assumption.
A 50year lifetime for the surface structures is assumed in the longterm settlements calculations (BSC 2008b, Section 2.2.2.7).
All of these assumptions are either sufficiently conservative or represent typical standards used in the industry and do not require further verification.
B6 Calculations Calculations were performed using Mathcad and EXCEL on a standalone PC. The PC is networked for printing and file storage but the programs used are loaded on the PC. These programs started and operated normally during calculation preparation.
The allowable bearing capacity results consider an adequate margin of safety against bearing capacity failure with associated tolerable footing settlement. The following schematic (Figure B61) for a shallow footing presents the definitions of the different symbols used in the bearing capacity and shortterm settlement analyses:
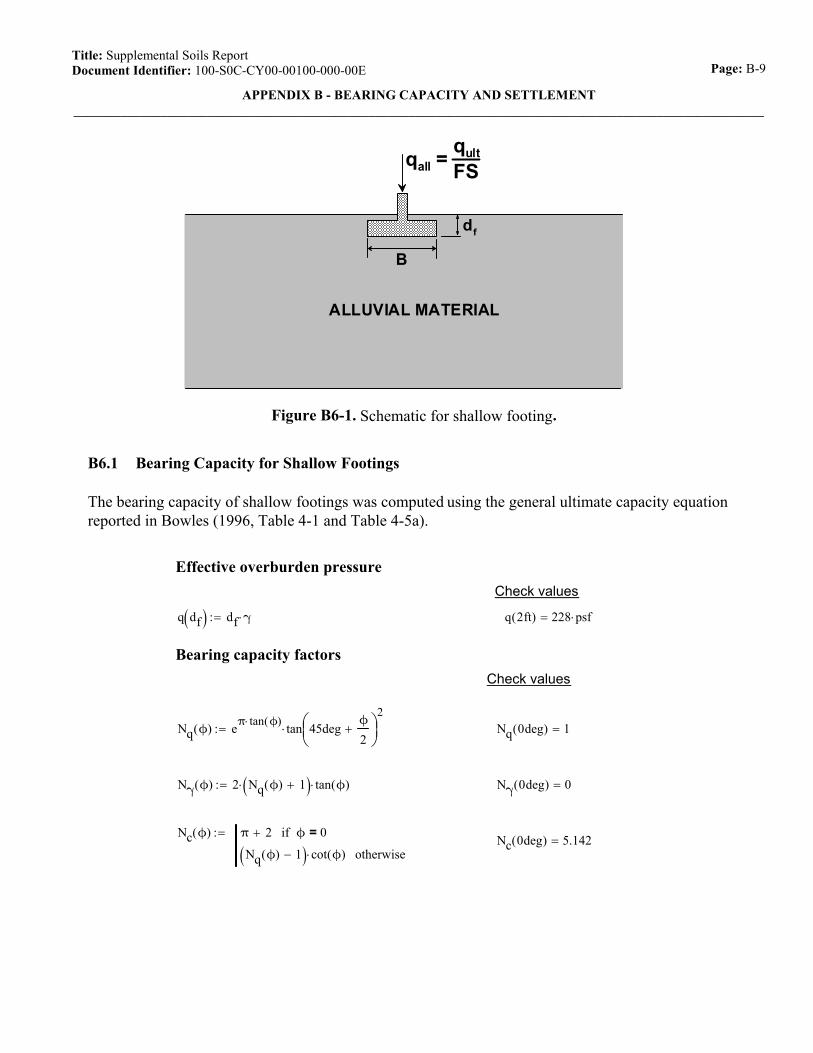
_______________________________________________________________________________________________________
qult qall = FS
ALLUVIAL MATERIAL
df
B
Title: Supplemental Soils Report Document Identifier: 100S0CCY000010000000E Page: B9
APPENDIX B BEARING CAPACITY AND SETTLEMENT
Figure B61. Schematic for shallow footing.
B6.1 Bearing Capacity for Shallow Footings
The bearing capacity of shallow footings was computed using the general ultimate capacity equation reported in Bowles (1996, Table 41 and Table 45a).
Effective overburden pressure Check values
q (d ) := d ⋅ ( ) = 228 psff f γ q 2ft ⋅
Bearing capacity factors Check values
π⋅ tan(ϕ) ϕ 2
N (ϕ) := e ⋅tan 45deg + N (0deg) = 1 q q2
N (ϕ) := 2⋅(N (ϕ) + 1 ⋅γ ) tan(ϕ) N (0deg) = 0 q γ
N (ϕ) := π + 2 if ϕ = 0 c N (0deg) = (
5.142 cN (ϕ) − 1q )⋅cot(ϕ) otherwise
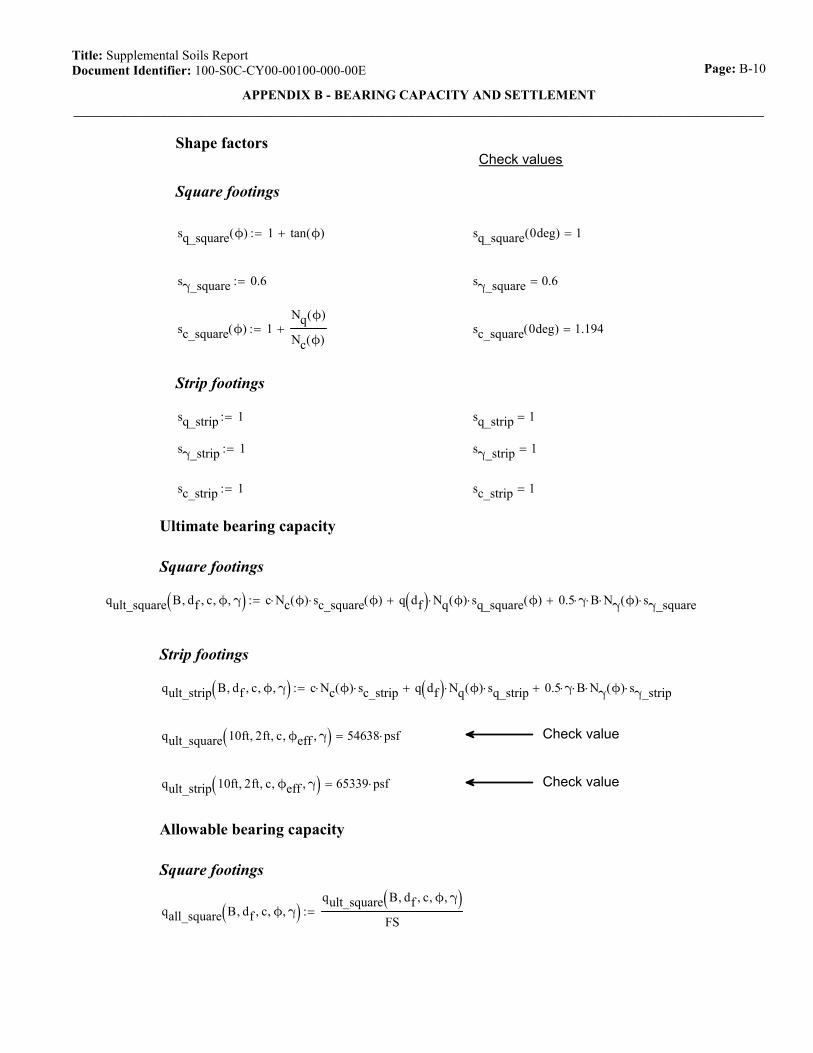
_______________________________________________________________________________________________________
Title: Supplemental Soils Report Document Identifier: 100S0CCY000010000000E Page: B10
APPENDIX B BEARING CAPACITY AND SETTLEMENT
Shape factors Check values
Square footings
s (ϕ) := 1 + tan(ϕ) s (0deg) = 1 q_square q_square
s := 0.6 = 0.6γ_square sγ_square
N (ϕ)qs (ϕ) := 1 + s (0deg) = 1.194 c_square c_square
N (ϕ)c
Strip footings
s := 1 = 1q_strip sq_strip
s := 1 = s 1γ_strip γ_strip
s := 1 = 1c_strip sc_strip
Ultimate bearing capacity
Square footings
q (B , d , c , ϕ, γ) := c⋅ N + (ϕ) ⋅s (ϕ) q( d ) ⋅N (ϕ)⋅s (ϕ) + 0.5⋅γ⋅B⋅ N (ϕ)⋅sult_square f c c_square f q q_square γ γ_square
Strip footings
q (B , d , c , ϕ , γ ) := c ⋅ N (ϕ)⋅s + q (d ) ⋅ N ⋅ + 0.5⋅γ⋅ ⋅ (ϕ) s B N (ϕ)⋅sult_strip f c c_strip f q q_strip γ γ_strip
q (10ft , 2ft , c , ϕ , γ = 54638 ⋅psf Check valueult_square eff )
q (10ft , 2ft , c , ϕ , ⋅ γ = psf Check valueult_strip ) 65339 eff
Allowable bearing capacity
Square footings
) q (
(B , d , , ult_square f c ϕ , γ)
q B , , c , ϕ, :=all_square d γf FS
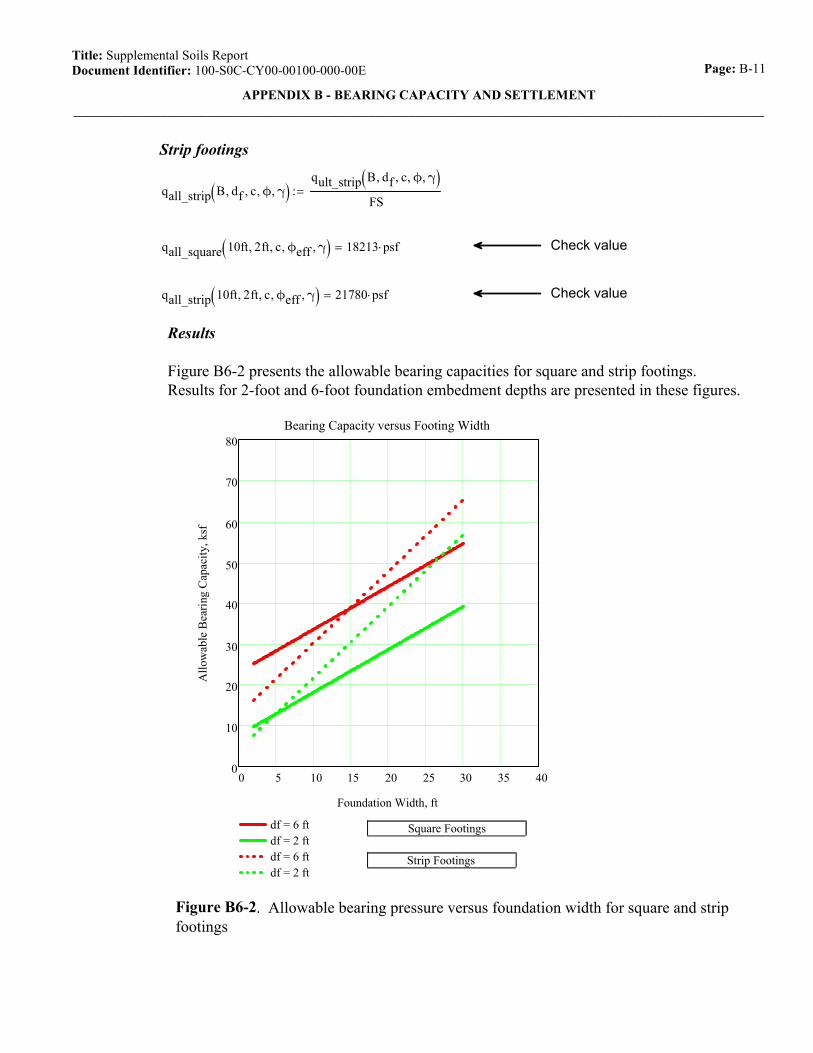
_______________________________________________________________________________________________________
Bearing Capacity versus Footing Width 80
70
60
50
40
30
20
10
0
Foundation Width, ft
df = 6 ft Square Footings df = 2 ft df = 6 ft Strip Footings df = 2 ft
Allow
able
Bea
ring
Cap
acity, k
sf
0 5 10 15 20 25 30 35 40
Title: Supplemental Soils Report Document Identifier: 100S0CCY000010000000E Page: B11
APPENDIX B BEARING CAPACITY AND SETTLEMENT
Strip footings
qall_strip B df, , c , ϕ, γ( ) := qult_strip B df, , c , ϕ, γ( )
FS
qall_square 10ft 2ft, , c ϕeff, , γ( ) = 18213 psf⋅ Check value
qall_strip 10ft 2ft, , c ϕeff, , γ( ) = 21780 psf⋅ Check value
Results
Figure B62 presents the allowable bearing capacities for square and strip footings. Results for 2foot and 6foot foundation embedment depths are presented in these figures.
Figure B62. Allowable bearing pressure versus foundation width for square and strip footings
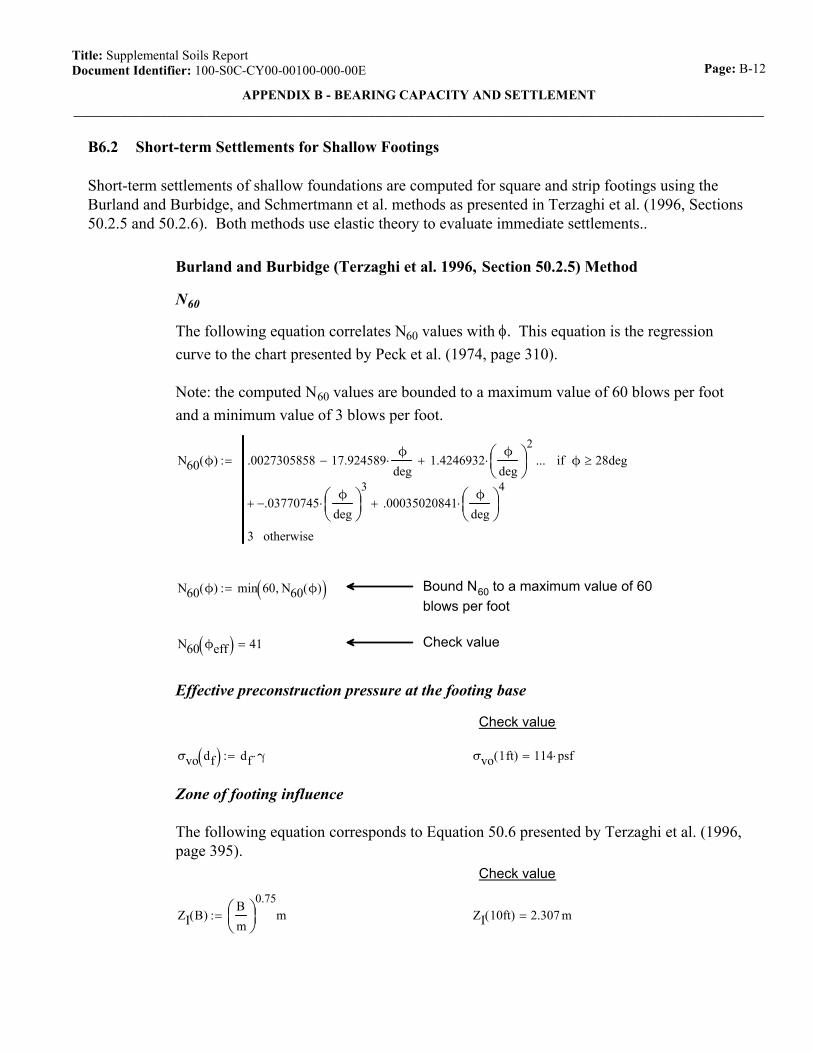
_______________________________________________________________________________________________________
Title: Supplemental Soils Report Document Identifier: 100S0CCY000010000000E Page: B12
APPENDIX B BEARING CAPACITY AND SETTLEMENT
B6.2 Shortterm Settlements for Shallow Footings
Shortterm settlements of shallow foundations are computed for square and strip footings using the Burland and Burbidge, and Schmertmann et al. methods as presented in Terzaghi et al. (1996, Sections 50.2.5 and 50.2.6). Both methods use elastic theory to evaluate immediate settlements..
Burland and Burbidge (Terzaghi et al. 1996, Section 50.2.5) Method
N 60
The following equation correlates N60 values with φ. This equation is the regression curve to the chart presented by Peck et al. (1974, page 310).
Note: the computed N60 values are bounded to a maximum value of 60 blows per foot and a minimum value of 3 blows per foot.
2
ϕ ϕ N (ϕ) := .0027305858 − 17.924589 ⋅ + 1.4246932⋅ ... if ϕ ≥ 28deg 60
deg �deg �3
4
ϕ
�deg � ϕ + −.03770745⋅ + .00035020841 ⋅ �deg �
3 otherwise
N (ϕ) := min( 60 , N (ϕ)) Bound N to a maximum value of 6060 60 60
blows per foot
N60( ϕeff )= 41 Check value
Effective preconstruction pressure at the footing base
Check value
σ ( d ) := d ⋅γ σ (1ft) = ⋅f 114 psfvo f vo
Zone of footing influence
The following equation corresponds to Equation 50.6 presented by Terzaghi et al. (1996, page 395).
Check value
0.75 B
Z (B) :=I Z
m (10ft) = 2.307 m �m � I
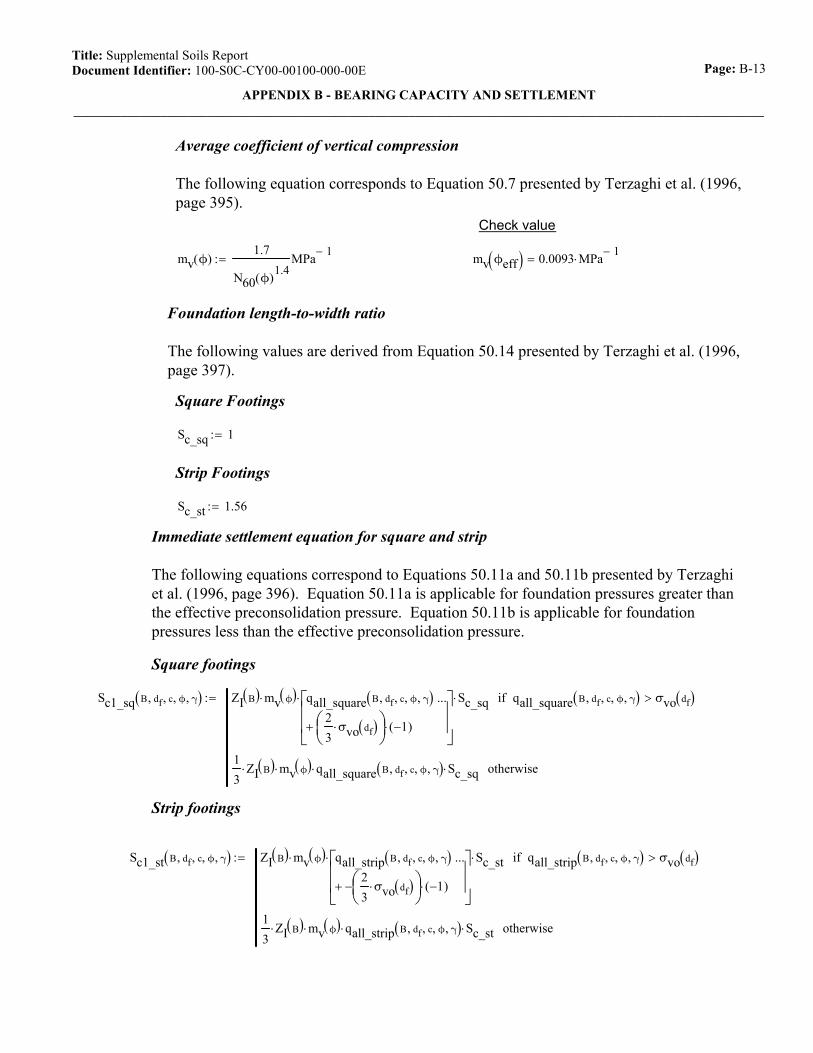
_______________________________________________________________________________________________________
Title: Supplemental Soils Report Document Identifier: 100S0CCY000010000000E Page: B13
APPENDIX B BEARING CAPACITY AND SETTLEMENT
Average coefficient of vertical compression
The following equation corresponds to Equation 50.7 presented by Terzaghi et al. (1996, page 395).
Check value
1.7 − 1 − 1 mv(ϕ) := MPa mv(ϕeff ) = ⋅0.0093 MPa
1.4 )N60(ϕ
Foundation lengthtowidth ratio
The following values are derived from Equation 50.14 presented by Terzaghi et al. (1996, page 397).
Square Footings
S := 1 c_sq
Strip Footings
S := 1.56c_st
Immediate settlement equation for square and strip
The following equations correspond to Equations 50.11a and 50.11b presented by Terzaghi et al. (1996, page 396). Equation 50.11a is applicable for foundation pressures greater than the effective preconsolidation pressure. Equation 50.11b is applicable for foundation pressures less than the effective preconsolidation pressure.
Square footings
S (B , d , c, ϕ , γ) := Z B ⋅ m ϕf ( ) ( ) ⋅q (B , c, ϕ , I d , γ c1_sq v all_square f ) ... ⋅S if , d , c, ϕ , γ) > σ c_sq qall_square(B f vo(df)
2 + ⋅σ (d ) ⋅(f − 1) vo
3 1
⋅Z ( ) ( B ⋅m ϕ) ⋅ q ( , d , c, ϕ , γ ⋅S otherwise I3 v all_square B f ) c_sq
Strip footings
S ( B , d , c, ϕ , γ) := Z ( B) ⋅ m ( ϕ) ⋅ q ( B , d , c, ϕ , γ) ... ⋅ S if qc1_st f I v all_strip f c_st all_strip ( B , d , c, ϕ γf , ) > σ vo ( df) 2
+ − ⋅σ ( ) dvo f ⋅ − ( 1)
3 1
⋅ Z ( I B) ⋅ m ( d v ϕ) ⋅ qall_strip ( B , f , c, ϕ , γ)⋅ S otherwisec_st
3
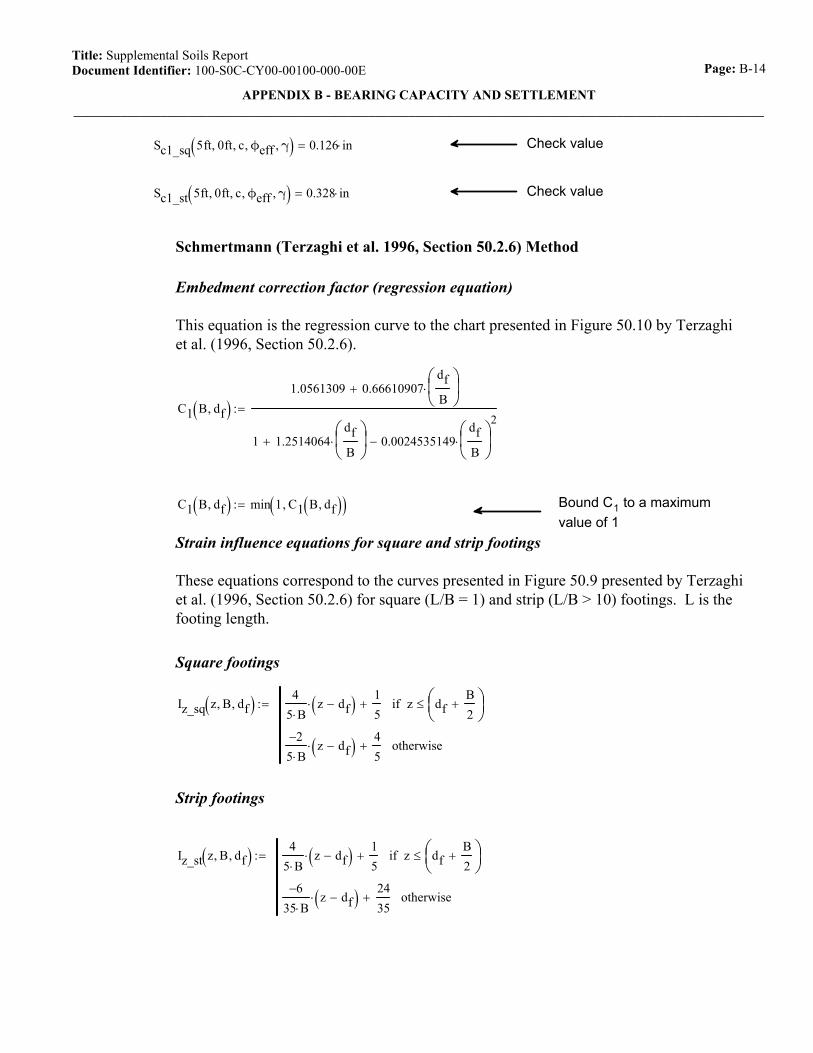
_______________________________________________________________________________________________________
Title: Supplemental Soils Report Document Identifier: 100S0CCY000010000000E Page: B14
APPENDIX B BEARING CAPACITY AND SETTLEMENT
S (5ft , 0ft , c , ϕ , γ) = 0.126⋅ in Check valuec1_sq eff
Sc1_st(5ft , 0ft , c , ϕ , γeff ) = 0.328⋅ in Check value
Schmertmann (Terzaghi et al. 1996, Section 50.2.6) Method
Embedment correction factor (regression equation)
This equation is the regression curve to the chart presented in Figure 50.10 by Terzaghi et al. (1996, Section 50.2.6).
df 1.0561309 + 0.66610907⋅
B C B , d := 1( f )
2 df df �
1 + 1.2514064⋅ − 0.0024535149⋅ B B
C1(B , d := f ) min( 1 , C1(B , d Bound Cf ) ) to a maximum1
value of 1 Strain influence equations for square and strip footings
These equations correspond to the curves presented in Figure 50.9 presented by Terzaghi et al. (1996, Section 50.2.6) for square (L/B = 1) and strip (L/B > 10) footings. L is the footing length.
Square footings
4 1 B I (z , B , d ) := ⋅(z − d ) + if f f z ≤ d +z_sq f
5⋅ B 5 2 −2 4
⋅ z − d + f otherwise 5⋅ B
( )5
Strip footings
4 1 B I ( z , B , d := ⋅ z − d + ≤
5 ⋅ f if z d +z_st f ) f B
( ) 5 2
−6 24⋅
35⋅ B (z − df ) + otherwise 35
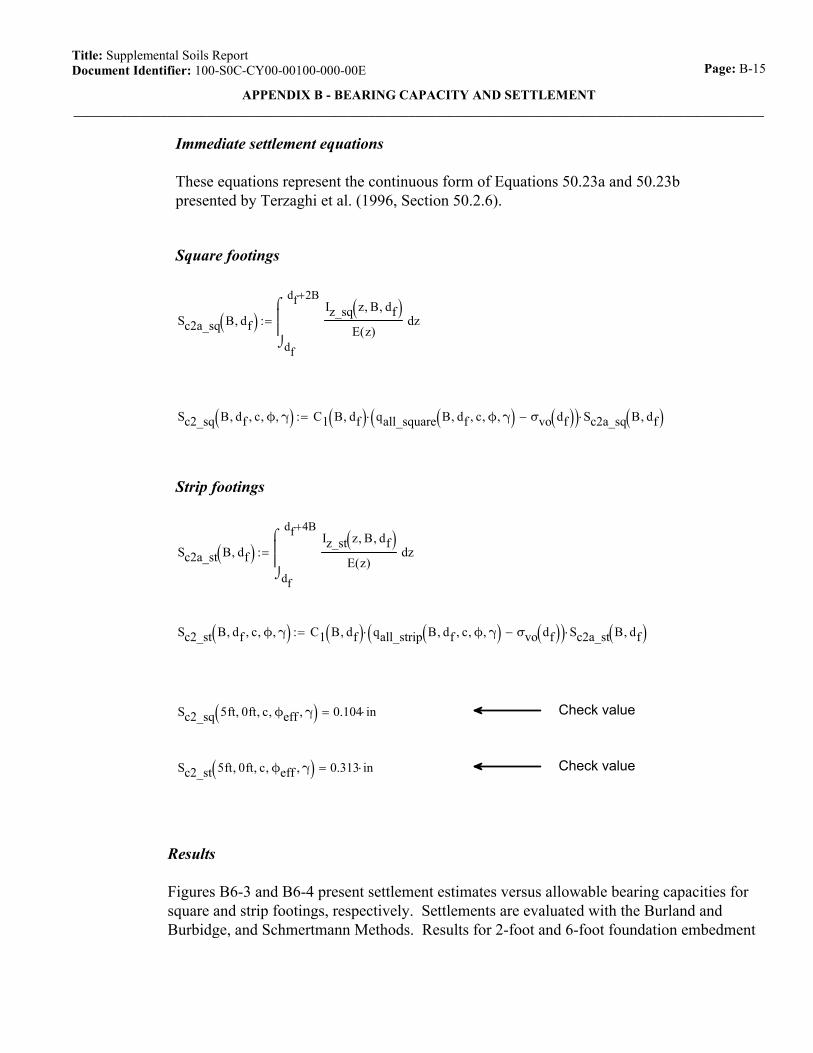
_______________________________________________________________________________________________________
Title: Supplemental Soils Report Document Identifier: 100S0CCY000010000000E Page: B15
APPENDIX B BEARING CAPACITY AND SETTLEMENT
Immediate settlement equations
These equations represent the continuous form of Equations 50.23a and 50.23b presented by Terzaghi et al. (1996, Section 50.2.6).
Square footings
d +2B ⌠ f
Iz_sq(z , B , df )S (B , d := dzc2a_sq f ) E(z)
⌡df
S (B , d , c , , ϕ γ Cc2_sq ) := f 1(B , d )⋅ ( , , c , ϕ , f (qall_square B d f γ) − σ ( ) ⋅ ,vo df ) Sc2a_sq( B df )
Strip footings
d +4B ⌠ f
) I (z , B , dz_st f )
S (B , d := dzc2a_st f E(z) ⌡df
S (B , d , c , ϕ , γ := C (B , d ⋅ qc2_st f ) 1 f ) ( all_strip ( B , d , c , ϕ, γ) − σ )⋅ ( , f vo( df ) Sc2a_st B df )
S (5ft , 0ft , c , ϕ , γ) = 0.104⋅ in Check value c2_sq eff
S , , 0.313 in Check valuec2_st(5ft 0ft , c ϕ , ⋅ γ) = eff
Results
Figures B63 and B64 present settlement estimates versus allowable bearing capacities for square and strip footings, respectively. Settlements are evaluated with the Burland and Burbidge, and Schmertmann Methods. Results for 2foot and 6foot foundation embedment
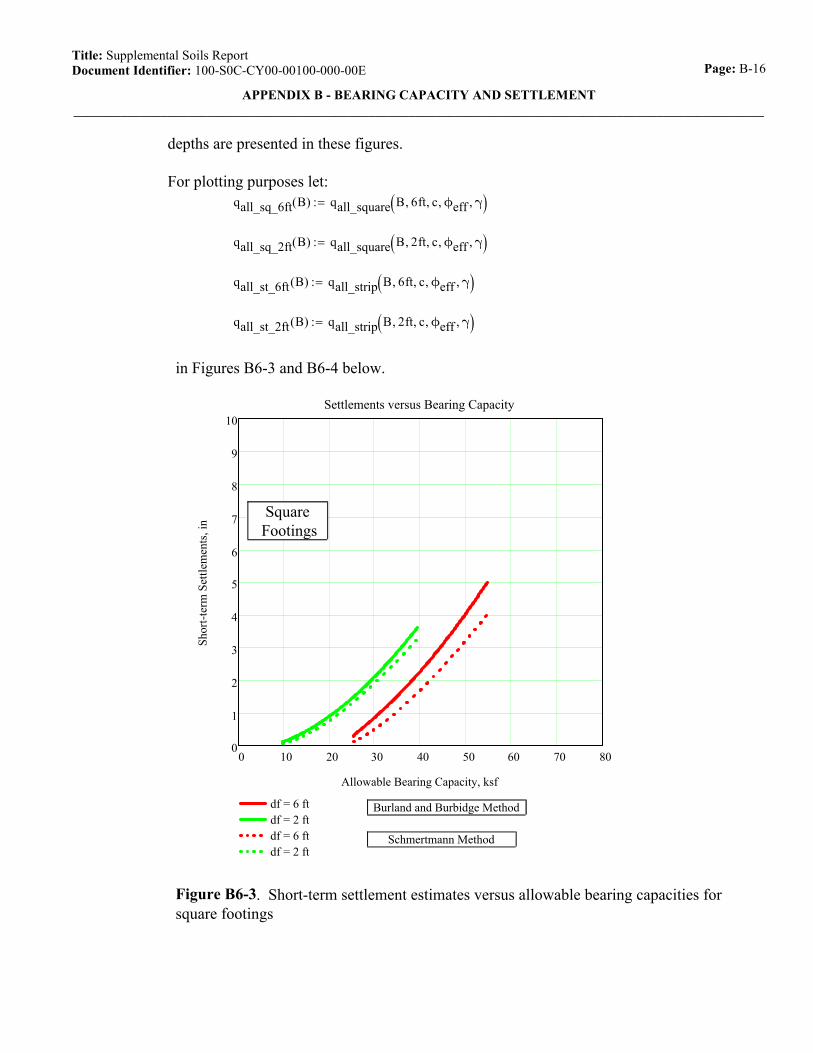
Burbidge, and Schmertmann Methods. Results for 2foot and 6foot foundation embedment
_______________________________________________________________________________________________________
depths are presented in these figures.
For plotting purposes let: ) := , , c , , γqall_sq_6ft(B qall_square(B 6ft ϕeff )�
) := ( , , c , , γ)qall_sq_2ft(B qall_square B 2ft ϕeff
) := , , c , , γqall_st_6ft(B qall_strip(B 6ft ϕeff )�
) := , , c , , γqall_st_2ft(B qall_strip(B 2ft ϕeff )�
in Figures B63 and B64 below.
Settlements versus Bearing Capacity 10
9
8
Square7
Footings 6
5
4
3
2
1
0
Allowable Bearing Capacity, ksf
df = 6 ft Burland and Burbidge Method df = 2 ft df = 6 ft Schmertmann Method df = 2 ft
Shortter
m
Set
tlem
ents
, in
0 10 20 30 40 50 60 70 80
Title: Supplemental Soils Report Document Identifier: 100S0CCY000010000000E Page: B16
APPENDIX B BEARING CAPACITY AND SETTLEMENT
Figure B63. Shortterm settlement estimates versus allowable bearing capacities for square footings
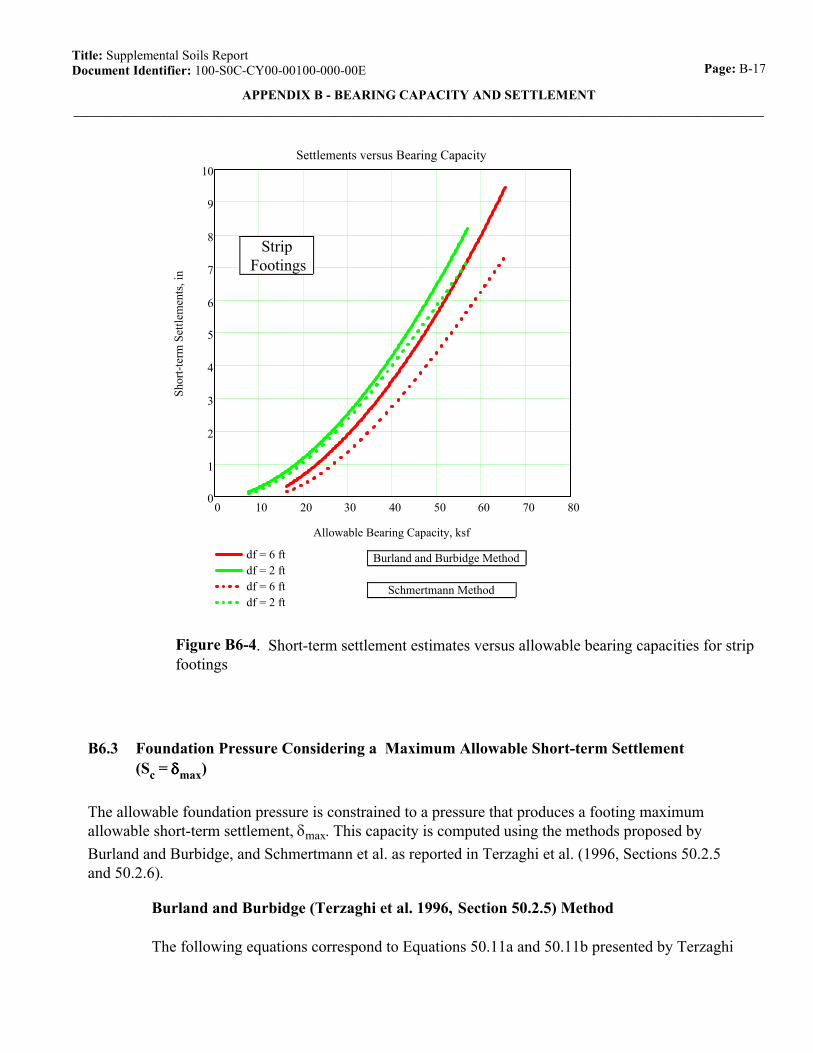
_______________________________________________________________________________________________________
Settlements versus Bearing Capacity 10
9
8 Strip
Footings7
6
5
4
3
2
1
0
Allowable Bearing Capacity, ksf
df = 6 ft Burland and Burbidge Method df = 2 ft df = 6 ft Schmertmann Method df = 2 ft
Shortter
m
Set
tlem
ents
, in
0 10 20 30 40 50 60 70 80
Title: Supplemental Soils Report Document Identifier: 100S0CCY000010000000E Page: B17
APPENDIX B BEARING CAPACITY AND SETTLEMENT
Figure B64. Shortterm settlement estimates versus allowable bearing capacities for strip footings
B6.3 Foundation Pressure Considering a Maximum Allowable Shortterm Settlement (S = δδ δδ )
c max
The allowable foundation pressure is constrained to a pressure that produces a footing maximum allowable shortterm settlement, δmax. This capacity is computed using the methods proposed by
Burland and Burbidge, and Schmertmann et al. as reported in Terzaghi et al. (1996, Sections 50.2.5 and 50.2.6).
Burland and Burbidge (Terzaghi et al. 1996, Section 50.2.5) Method
The following equations correspond to Equations 50.11a and 50.11b presented by Terzaghi
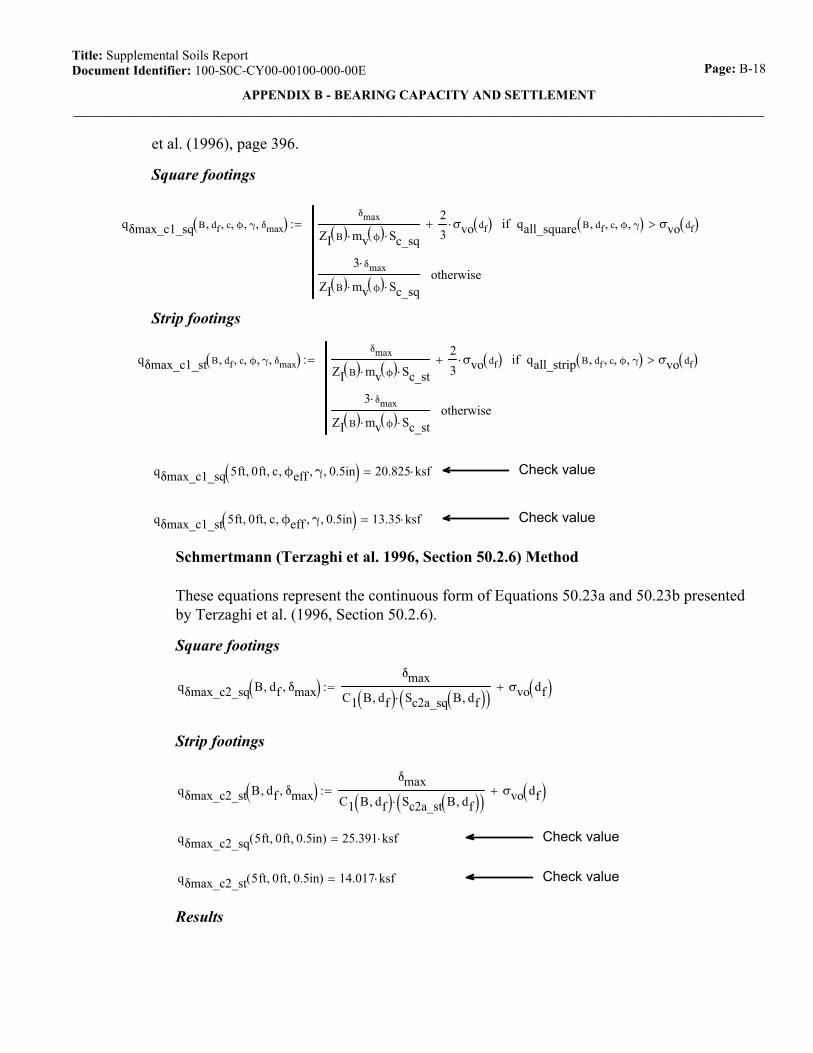
The following equations correspond to Equations 50.11a and 50.11b presented by Terzaghi
_______________________________________________________________________________________________________
Title: Supplemental Soils Report Document Identifier: 100S0CCY000010000000E Page: B18
APPENDIX B BEARING CAPACITY AND SETTLEMENT
et al. (1996), page 396.
Square footings
(δ 2
q B , d , c, ϕ , max
δ γf , δ := + ⋅σ d if (( ) ( ) q B , d σmax_c1_sq max) vo( f) all_square f , c, ϕ , γ) > d
⋅ vo( f) Z B m S 3 I v ϕ ⋅ c_sq
3 ⋅ δ max
( ) ( ) otherwise Z ⋅ ⋅ B m ϕ S I v c_sq
Strip footings
(δ max 2
q , d , c, ϕ , γ , B δ δ f max) := max_c1_st ( ) ( ) ( ) Z ( ) + ⋅σ d if q B , d c ϕ σ dvo f all_strip ( ) γ
⋅ ⋅f , , , > vo f
B m ϕ S 3I v c_st
3⋅δ max
( ) otherwiseZ m ( ) I B ⋅ ϕ ⋅Sv c_st
q (5ft , 0ft , c , ϕ , γ , 0.5in) = 20.825 ⋅ ksf Check valueδmax_c1_sq eff
q (5ft , 0ft , c , ϕ , γ , 0.5in = 13.35⋅ ksf Check valueδmax_c1_st eff )
Schmertmann (Terzaghi et al. 1996, Section 50.2.6) Method
These equations represent the continuous form of Equations 50.23a and 50.23b presented by Terzaghi et al. (1996, Section 50.2.6).
Square footings
qδmax_c2_sq(B , d , δ f max)
δmax := + σ d
, vo( fC
) 1(B df )⋅( S ( , c2a_sq B df ))
Strip footings
δ maxq B , d , δ := + σ dδmax_c2_st( f max)
S vo fC ( B ,d ⋅ ) ( (B ,d
( ) 1 f c2a_st f ))�
q ( 5ft , 0ft , 0.5in) = 25.391 ⋅ ksf Check valueδmax_c2_sq
q ( 5ft , 0ft , 0.5in) = 14.017 ⋅ ksf Check valueδmax_c2_st
Results
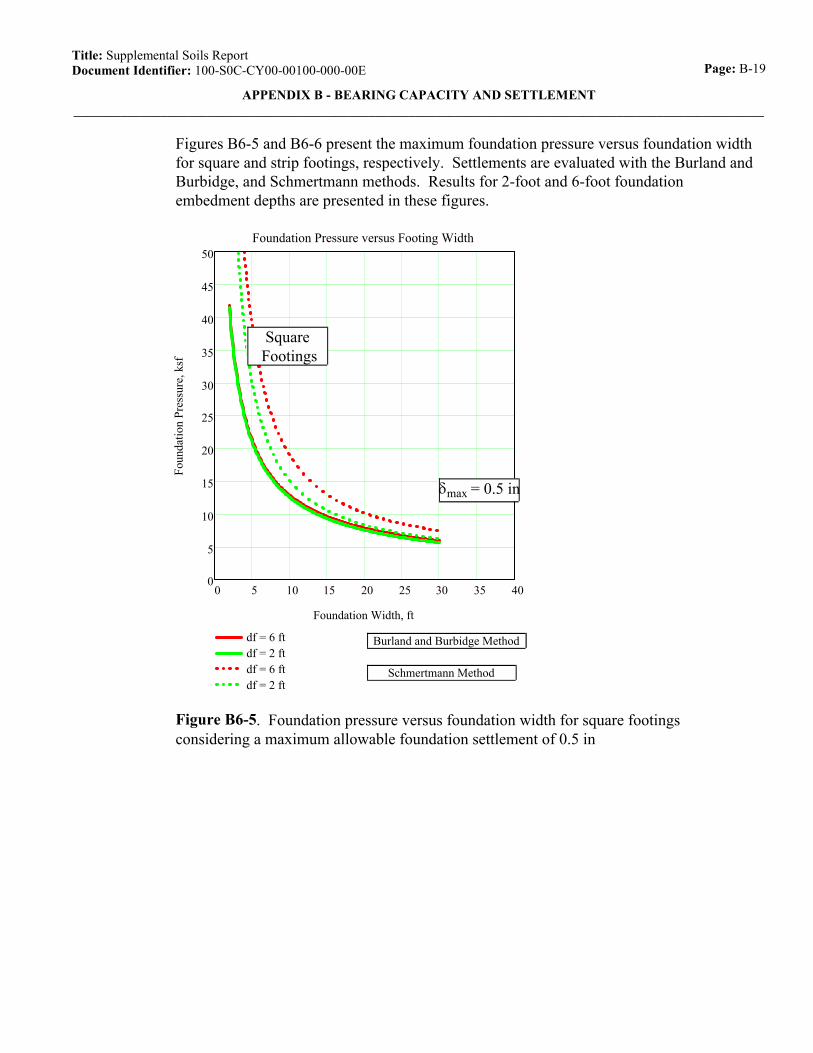
_______________________________________________________________________________________________________
Figures B65 and B66 present the maximum foundation pressure versus foundation width for square and strip footings, respectively. Settlements are evaluated with the Burland and Burbidge, and Schmertmann methods. Results for 2foot and 6foot foundation embedment depths are presented in these figures.
Foundation Pressure versus Footing Width 50
45
40
35
30
25
20
15
10
5
0 0 5 10 15 20 25 30 35 40
Foundation Width, ft
df = 6 ft Burland and Burbidge Method df = 2 ft df = 6 ft Schmertmann Method df = 2 ft
Foundat
ion
Pre
ssure
, ksf
Square Footings
δmax = 0.5 in
Title: Supplemental Soils Report Document Identifier: 100S0CCY000010000000E Page: B19
APPENDIX B BEARING CAPACITY AND SETTLEMENT
Figure B65. Foundation pressure versus foundation width for square footings considering a maximum allowable foundation settlement of 0.5 in
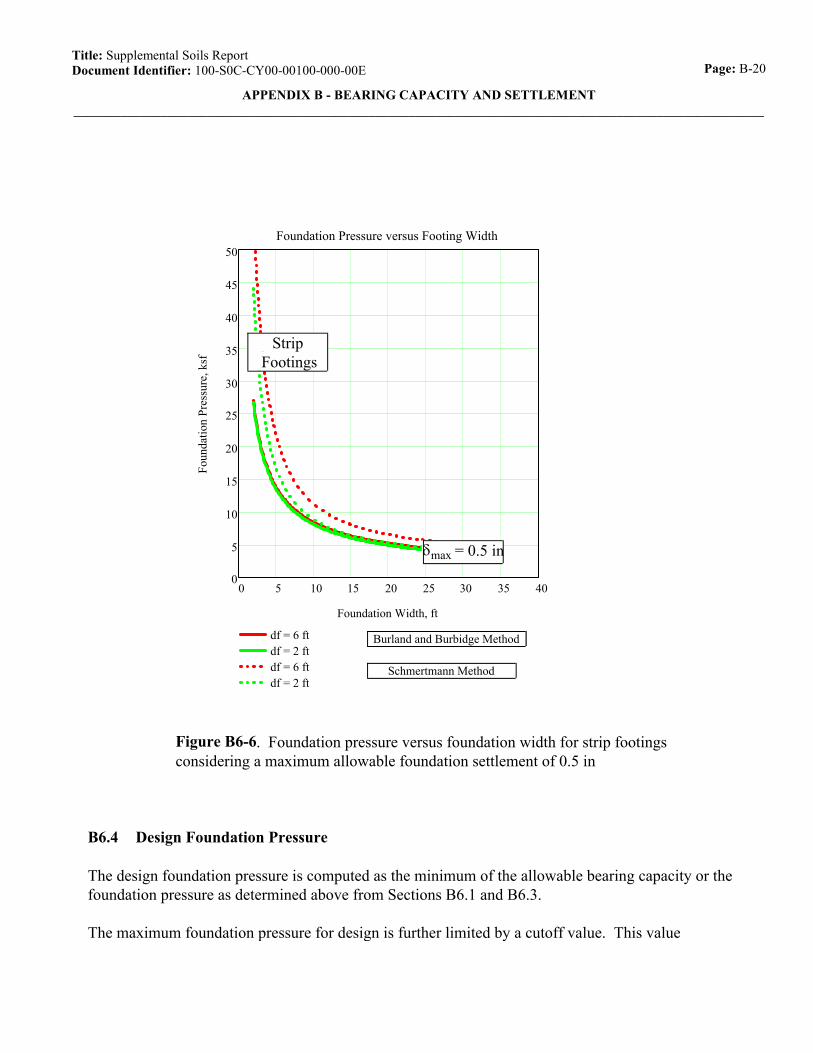
_______________________________________________________________________________________________________
Foundation Pressure versus Footing Width 50
45
40
Strip35
Footings 30
25
20
15
10
5 δ = 0.5 inmax
0
Foundation Width, ft
df = 6 ft Burland and Burbidge Method df = 2 ft df = 6 ft Schmertmann Method df = 2 ft
Foundat
ion
Pre
ssure
, ksf
0 5 10 15 20 25 30 35 40
Title: Supplemental Soils Report Document Identifier: 100S0CCY000010000000E Page: B20
APPENDIX B BEARING CAPACITY AND SETTLEMENT
Figure B66. Foundation pressure versus foundation width for strip footings considering a maximum allowable foundation settlement of 0.5 in
B6.4 Design Foundation Pressure
The design foundation pressure is computed as the minimum of the allowable bearing capacity or the foundation pressure as determined above from Sections B6.1 and B6.3.
The maximum foundation pressure for design is further limited by a cutoff value. This value
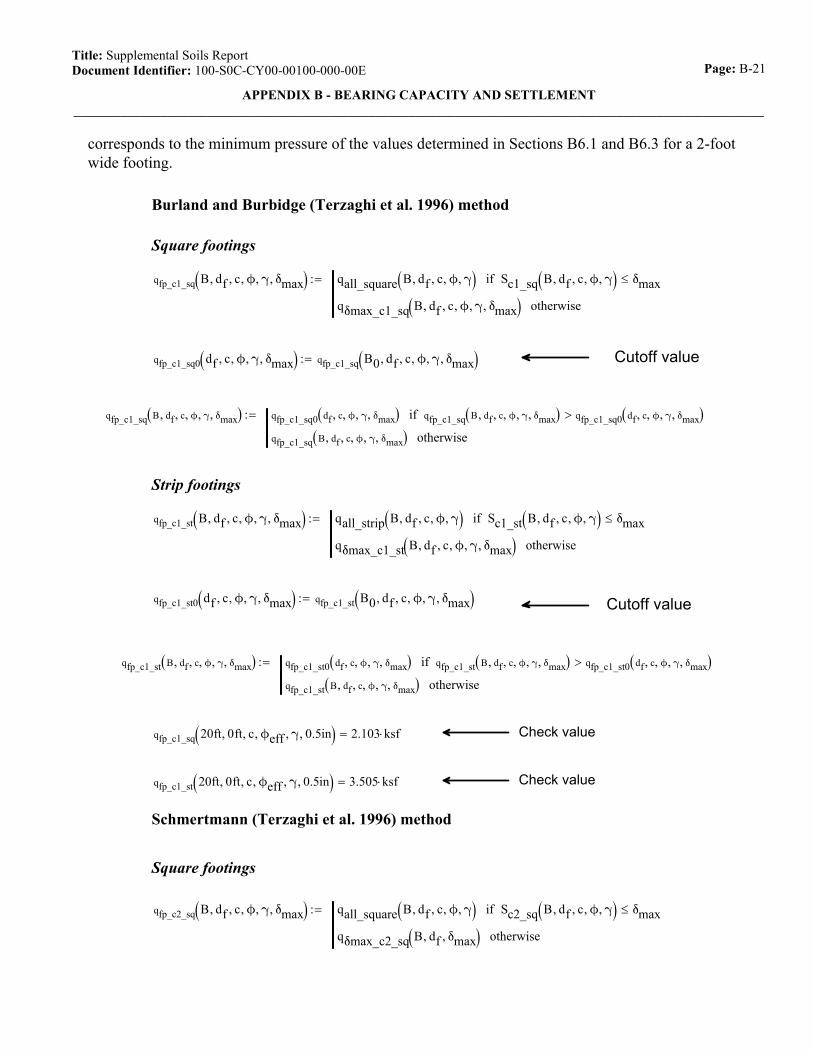
The maximum foundation pressure for design is further limited by a cutoff value. This value
_______________________________________________________________________________________________________
Title: Supplemental Soils Report Document Identifier: 100S0CCY000010000000E Page: B21
APPENDIX B BEARING CAPACITY AND SETTLEMENT
corresponds to the minimum pressure of the values determined in Sections B6.1 and B6.3 for a 2foot wide footing.
Burland and Burbidge (Terzaghi et al. 1996) method
Square footings
qfp_c1_sq(B , d , f c , ϕ, γ , δ max) := , , , , , , , , ≤ q ( ϕ γ if Sall_square B d cf ) c1_sq (B d c ϕ γ) δf max
q (B , d , c , ϕ , γ , δ otherwiseδmax_c1_sq f max)
q (d , c , ϕ , γ ϕfp_c1_sq0 , δ ) := qfp_c1_sq(B , d , c , , γ , δ f max 0 f max) Cutoff value
q (B fp_c1_sq , df , c, ϕ , γ , δ max) := q (d ) if , c, ϕ , γ, δ q Bfp_c1_sq0 f max fp_c1_sq( , df , c, ϕ , γ , δ max) > qfp_c1_sq0(df , c, ϕ , γ , δ max) q ( B , d , c, ϕ γ, δ otherwisefp_c1_sq f , max)
Strip footings
qfp_c1_st(B , d , c , ϕ , γ , δ ) := q (B , d , c , ϕ , γ) if S (B , d , c , ≤ ϕ, f max all_strip γf c1_st ) δf max
q (B , d , c , ϕ , γ , δ otherwiseδmax_c1_st f max)
q (d , c , ϕ, γ , δ B dfp_c1_st0 ) := q ( , , c , ϕ, γfp_c1_st , δf max 0 f max) Cutoff value
q (B , d , c, ϕ , γ, δ ) := q (d , c, ϕ , γ δ γf , if q B d c ϕ δ fp_c1_st max q d cf ) ϕ γ δmax fp_c1_st0 fp_c1_st ( , f , , , , max) > fp_c1_st0 ( f , , , , max) q B , d , , ϕ , γfp_c1_st( cf , δ otherwisemax)
qfp_c1_sq(20ft , 0ft , c , ϕ , γ , 0.5in = 2.103⋅ ksf Check valueeff )
q (20ftfp_c1_st , 0ft , c , ϕ , γ , 0.5in) = ⋅ 3.505 ksf Check valueeff
Schmertmann (Terzaghi et al. 1996) method
Square footings
q (B dfp_c2_sq , , c , , γ , ϕ δ ) := , , , , , , , , ≤ f max q ( c ϕ γ) if ( c ϕ γall_square B d df Sc2_sq B f ) δmax
q , , δ otherwiseδmax_c2_sq(B df max)
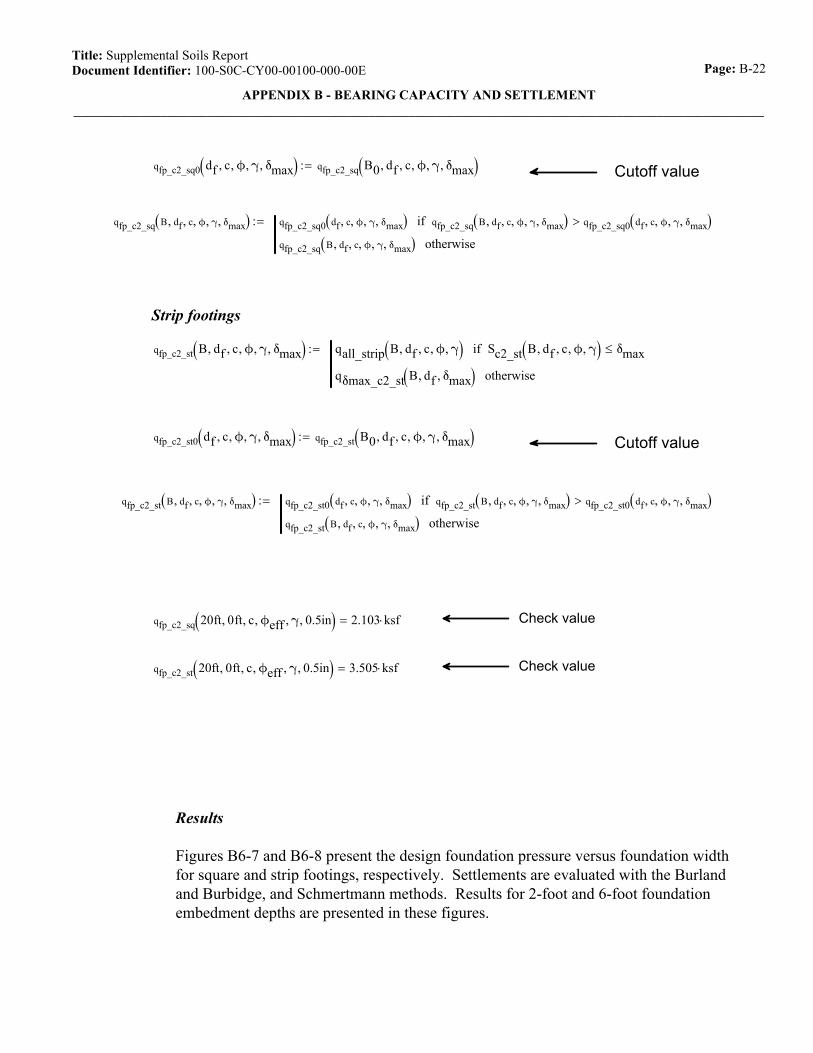
_______________________________________________________________________________________________________
Title: Supplemental Soils Report Document Identifier: 100S0CCY000010000000E Page: B22
APPENDIX B BEARING CAPACITY AND SETTLEMENT
q (d , c , ϕ , γ , δ ) := q , (B d , γfp_c2_sq , c , ϕfp_c2_sq0 , δf max 0 f max) Cutoff value
q B d c ϕ γ δ q d c ϕ γ δ if q B d c ϕ γ δ q d cfp_c2_sq( , f , , , , max) := fp_c2_sq0( f , , , , max) fp_c2_sq( , f , , , , max) > fp_c2_sq0( f , , ϕ , γ , δ max) q B , d c, ϕ , γ, δ otherwisefp_c2_sq( f , max)
Strip footings
q (B , d , c , ϕ , γ , δ ) := q ( , B d , c , ϕ if S ( , , cfp_c2_st , γ) B d , f all_strip f ϕ, γ) ≤ δ max c2_st f max
q , , δ δmax_c2_st(B df max) otherwise
q dfp_c2_st0( , , , , := , , , , , f c ϕ γ δ q c ϕ γ δmax) fp_c2_st(B0 df max) Cutoff value
q (B , d , cfp_c2_st f , ϕ , γ, δ ) := q (d , c, ϕ , γ, δ ) if q (B cmax , ϕf max fp_c2_st , dfp_c2_st0 f , , γ , δ ) > q (d , c, ϕ , γ , δ max fp_c2_st0 f max) q B fp_c2_st( , d , c, ϕ , γ, δ otherwisef max)
q ( 20ft , 0ft , c , ϕ γ , , 0.5infp_c2_sq ) = 2.103⋅ ksf Check value eff
q ( 20ft , 0ft , c , ϕ γ , , 0.5infp_c2_st eff ) = 3.505⋅ ksf Check value
Results
Figures B67 and B68 present the design foundation pressure versus foundation width for square and strip footings, respectively. Settlements are evaluated with the Burland and Burbidge, and Schmertmann methods. Results for 2foot and 6foot foundation embedment depths are presented in these figures.
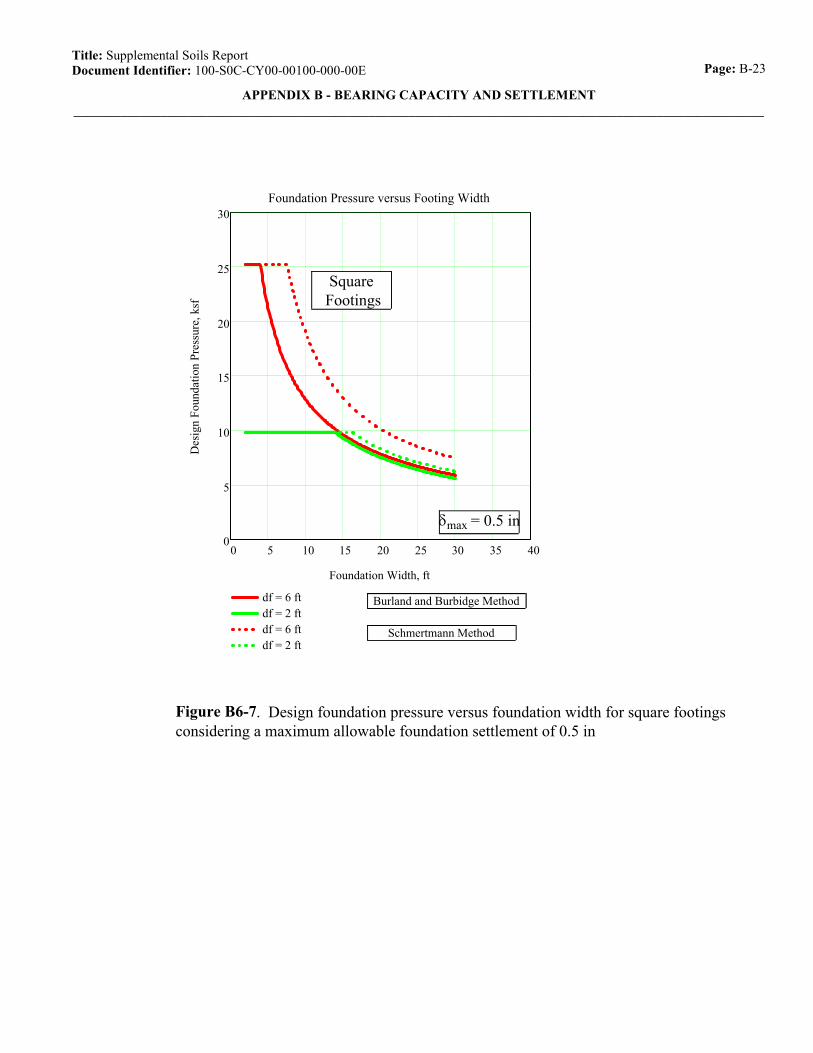
_______________________________________________________________________________________________________
Foundation Pressure versus Footing Width
30
25 Square
ksf
Footings 20
essu
re,
15
Des
ign
Foundat
ion
Pr
10
5
δmax = 0.5 in 0 0 5 10 15 20 25 30 35 40
Foundation Width, ft
df = 6 ft Burland and Burbidge Method df = 2 ft df = 6 ft Schmertmann Method df = 2 ft
Title: Supplemental Soils Report Document Identifier: 100S0CCY000010000000E Page: B23
APPENDIX B BEARING CAPACITY AND SETTLEMENT
Figure B67. Design foundation pressure versus foundation width for square footings considering a maximum allowable foundation settlement of 0.5 in
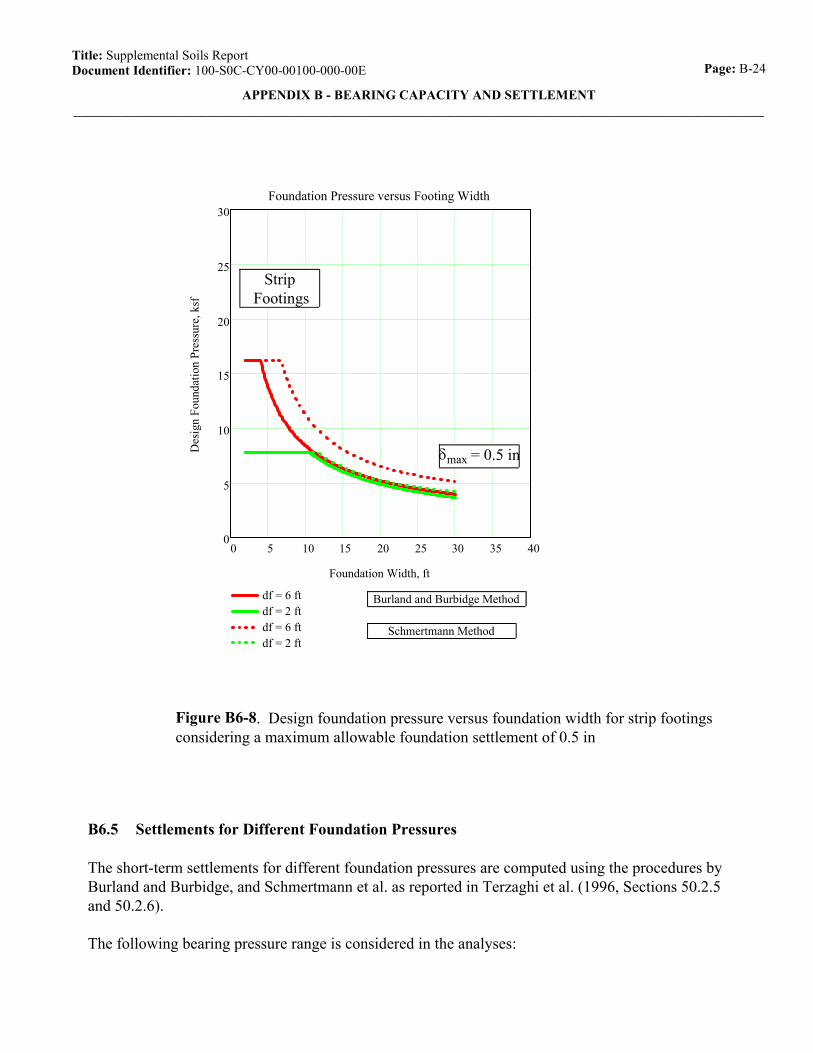
_______________________________________________________________________________________________________
D
esig
n
Foundat
ion
Pre
ssure
, ksf
Foundation Pressure versus Footing Width 30
25 Strip
Footings 20
15
10
δ = 0.5 inmax
5
0
Foundation Width, ft
df = 6 ft Burland and Burbidge Method df = 2 ft df = 6 ft Schmertmann Method df = 2 ft
0 5 10 15 20 25 30 35 40
Title: Supplemental Soils Report Document Identifier: 100S0CCY000010000000E Page: B24
APPENDIX B BEARING CAPACITY AND SETTLEMENT
Figure B68. Design foundation pressure versus foundation width for strip footings considering a maximum allowable foundation settlement of 0.5 in
B6.5 Settlements for Different Foundation Pressures
The shortterm settlements for different foundation pressures are computed using the procedures by Burland and Burbidge, and Schmertmann et al. as reported in Terzaghi et al. (1996, Sections 50.2.5 and 50.2.6).
The following bearing pressure range is considered in the analyses:
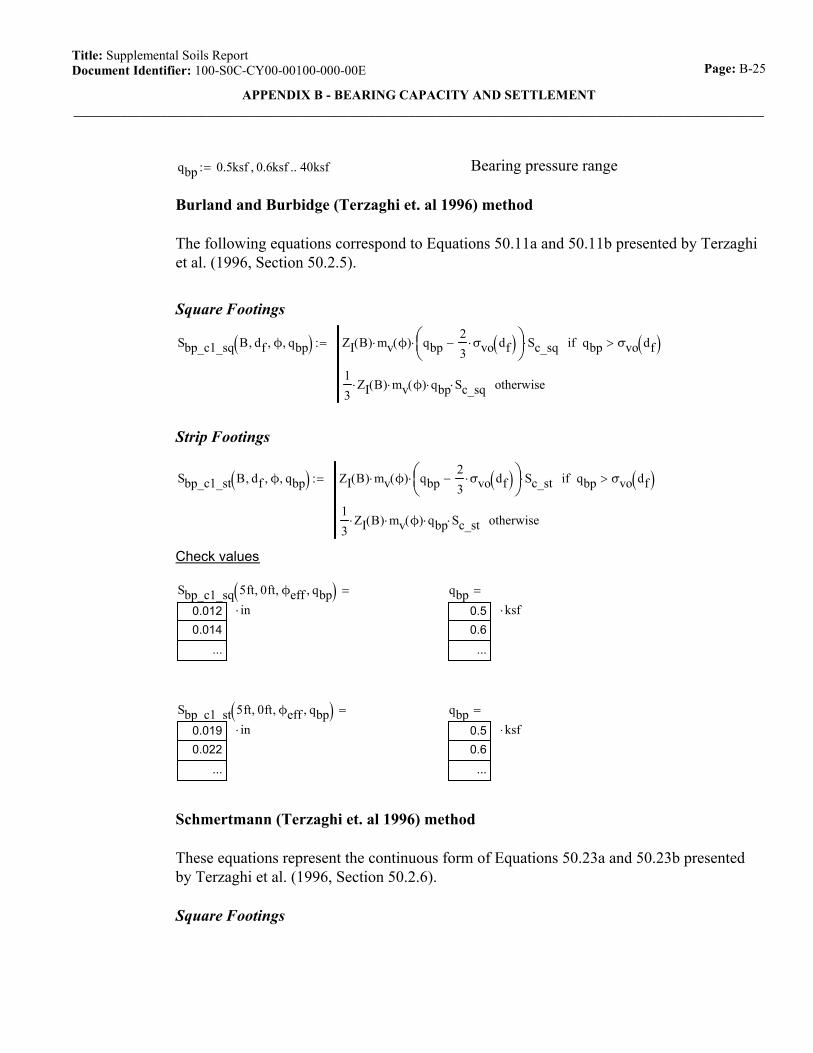
_______________________________________________________________________________________________________
Title: Supplemental Soils Report Document Identifier: 100S0CCY000010000000E Page: B25
APPENDIX B BEARING CAPACITY AND SETTLEMENT
q := 0.5ksf , 0.6ksf .. 40ksf Bearing pressure rangebp
Burland and Burbidge (Terzaghi et. al 1996) method
The following equations correspond to Equations 50.11a and 50.11b presented by Terzaghi et al. (1996, Section 50.2.5).
Square Footings
S ( 2 B , d , ϕ, q ) := Z (B) ⋅ m (ϕ)⋅ q − ⋅ σ ( d ) ⋅S if q > σ bp_c1_sq f bp I v bp vo f c_sq bp vo( df )
3 1
⋅Z (B)⋅m (ϕ)⋅q ⋅SI bp c_sq otherwise v3
Strip Footings
S ( 2
B , d , ϕ, q ) := Z (B) ⋅ − m (ϕ) ⋅q ⋅σ d ⋅S if q > σ dbp_c1_st f bp I v bp vo( f ) c_st bp vo( f3 )
1
⋅Z (B)⋅m (ϕ)⋅q ⋅ I v bp S otherwise3 c_st
Check values
S , 0 , , =bp_c1_sq(5ft ft ϕ = eff qbp) qbp 0.012 ⋅in 0.5 ⋅ksf
0.014 0.6
... ...
S , , , = =bp_c1_st(5ft 0ft ϕ q qeff bp) bp 0.019 ⋅in 0.5 ⋅ksf
0.022 0.6
... ...
Schmertmann (Terzaghi et. al 1996) method
These equations represent the continuous form of Equations 50.23a and 50.23b presented by Terzaghi et al. (1996, Section 50.2.6).
Square Footings
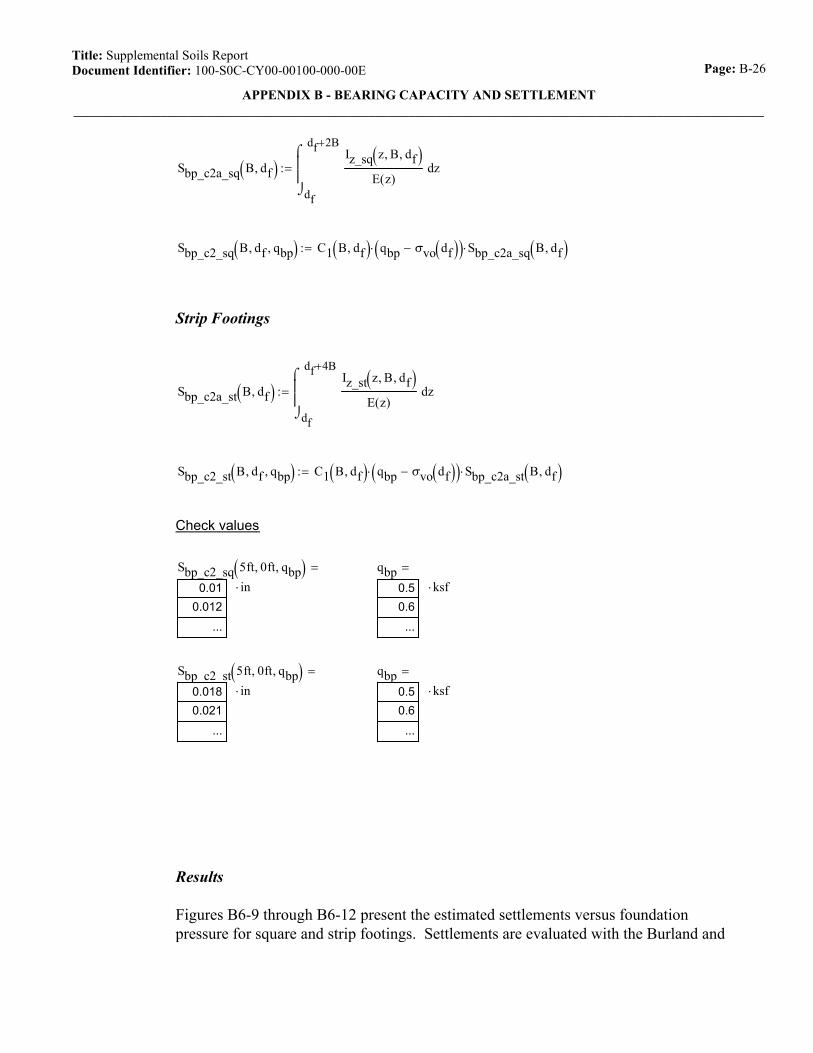
_______________________________________________________________________________________________________
Title: Supplemental Soils Report Document Identifier: 100S0CCY000010000000E Page: B26
APPENDIX B BEARING CAPACITY AND SETTLEMENT
d +2B ⌠ f
) I z , B ,
(d
z_sq( f )S B , d := dzbp_c2a_sq f E(z)
⌡df
S (B , d , := q ) C (B , d ⋅bp_c2_sq f bp 1 f ) (q − ⋅ , σ dbp vo( f ) ) Sbp_c2a_sq(B df )
Strip Footings
d +4B ⌠ f
I (z , B , df )S , bp_c2a_st( ) z_st
:= B d dzf E(z) ⌡df
S (B , d , := C , q ) (B d )⋅bp_c2_st f bp 1 f (q − ⋅ σ vo( d ) ) Sbp f bp_c2a_st(B ,df )
Check values
S 5ft , 0ft , q = q = bp_c2_sq( bp) bp 0.01 ⋅in 0.5 ⋅ksf
0.012 0.6
... ...
S (5ft , 0ft , qbp_c2_st bp) = q =bp 0.018 ⋅in 0.5 ⋅ksf
0.021 0.6
... ...
Results
Figures B69 through B612 present the estimated settlements versus foundation pressure for square and strip footings. Settlements are evaluated with the Burland and
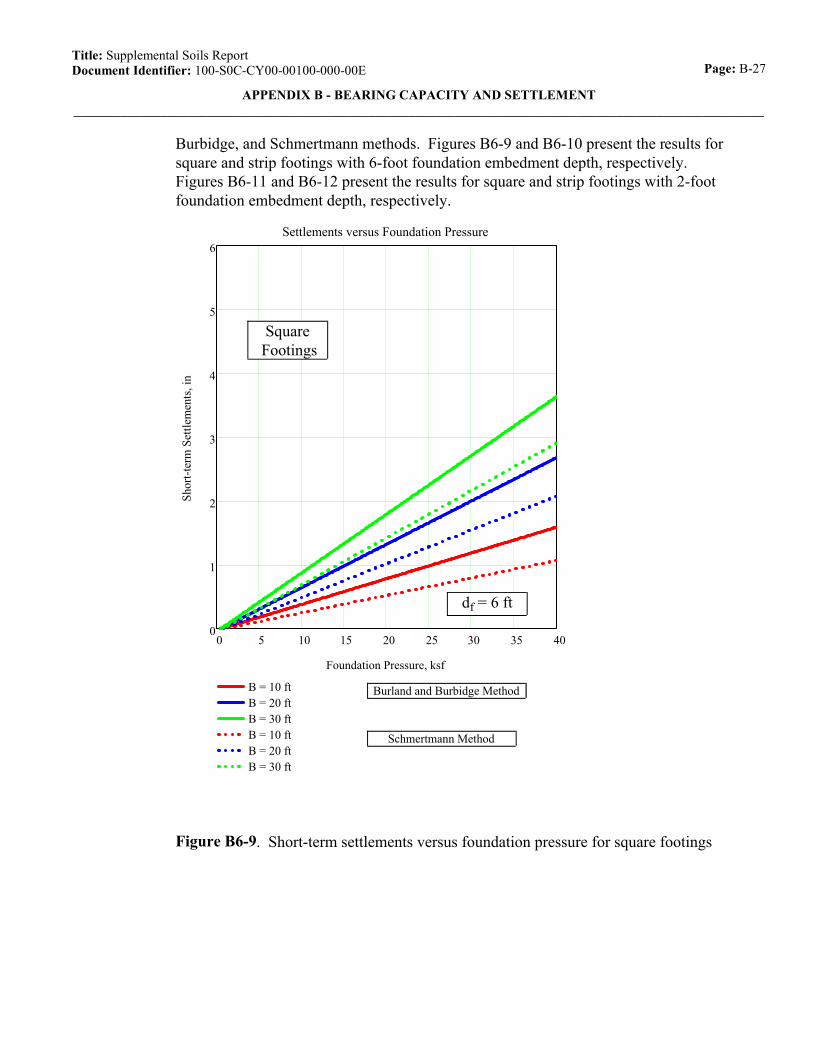
pressure for square and strip footings. Settlements are evaluated with the Burland and
_______________________________________________________________________________________________________
Burbidge, and Schmertmann methods. Figures B69 and B610 present the results for square and strip footings with 6foot foundation embedment depth, respectively. Figures B611 and B612 present the results for square and strip footings with 2foot foundation embedment depth, respectively.
Settlements versus Foundation Pressure 6
5
Square Footings
4
3
2
1
df = 6 ft
0
Foundation Pressure, ksf
B = 10 ft Burland and Burbidge Method B = 20 ft B = 30 ft B = 10 ft Schmertmann Method B = 20 ft B = 30 ft
0 5 10 15 20 25 30 35 40
Shortter
mSet
tlem
ents
,in
Title: Supplemental Soils Report Document Identifier: 100S0CCY000010000000E Page: B27
APPENDIX B BEARING CAPACITY AND SETTLEMENT
Figure B69. Shortterm settlements versus foundation pressure for square footings
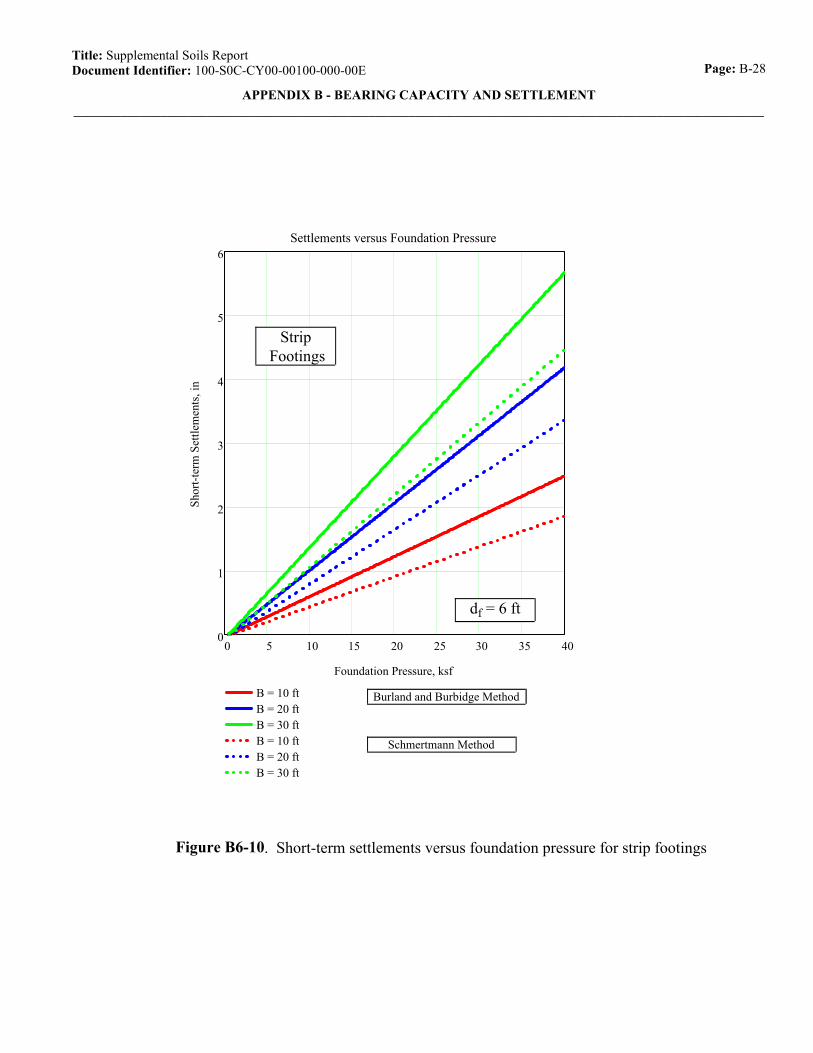
_______________________________________________________________________________________________________
6 Settlements versus Foundation Pressure
4
5
Strip Footings
3
2
0
1
df = 6 ft
Shortter
m
Set
tlem
ents
, in
0 5 10 15 20 25 30 35 40
B = 10 ft B = 20 ft B = 30 ft B = 10 ft B = 20 ft B = 30 ft
Foundation Pressure, ksf
Burland and Burbidge Method
Schmertmann Method
Title: Supplemental Soils Report Document Identifier: 100S0CCY000010000000E Page: B28
APPENDIX B BEARING CAPACITY AND SETTLEMENT
Figure B610. Shortterm settlements versus foundation pressure for strip footings
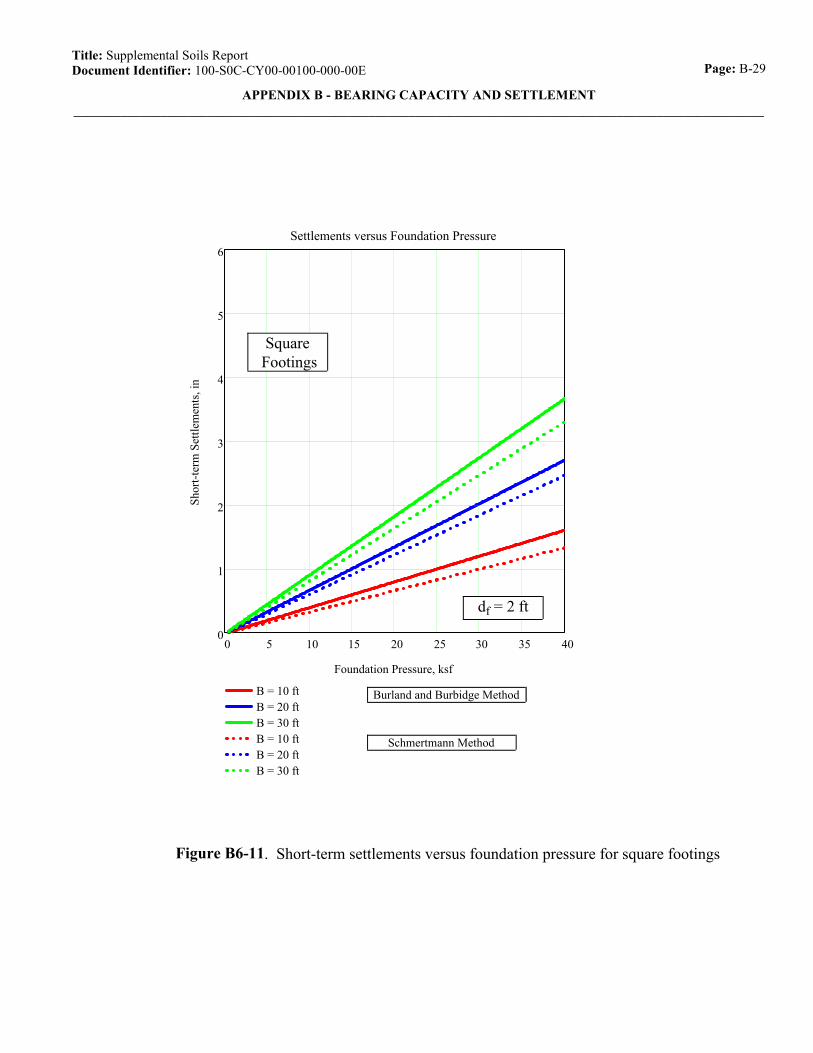
_______________________________________________________________________________________________________
6 Settlements versus Foundation Pressure
4
5
Square Footings
3
2
0
1
df = 2 ft
Shortter
m
Set
tlem
ents
, in
0 5 10 15 20 25 30 35 40
B = 10 ft B = 20 ft B = 30 ft B = 10 ft B = 20 ft B = 30 ft
Foundation Pressure, ksf
Burland and Burbidge Method
Schmertmann Method
Title: Supplemental Soils Report Document Identifier: 100S0CCY000010000000E Page: B29
APPENDIX B BEARING CAPACITY AND SETTLEMENT
Figure B611. Shortterm settlements versus foundation pressure for square footings
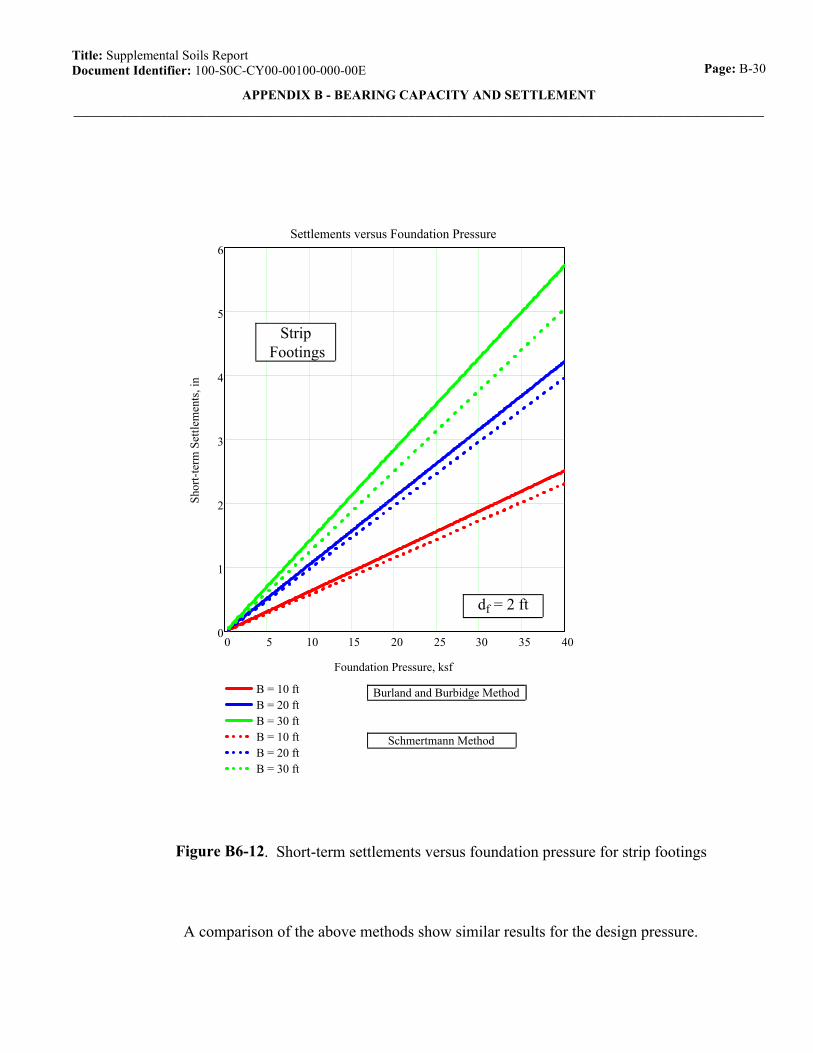
_______________________________________________________________________________________________________
6 Settlements versus Foundation Pressure
4
5
Strip Footings
3
2
0
1
df = 2 ft
Shortter
m
Set
tlem
ents
, in
0 5 10 15 20 25 30 35 40
B = 10 ft B = 20 ft B = 30 ft B = 10 ft B = 20 ft B = 30 ft
Foundation Pressure, ksf
Burland and Burbidge Method
Schmertmann Method
Title: Supplemental Soils Report Document Identifier: 100S0CCY000010000000E Page: B30
APPENDIX B BEARING CAPACITY AND SETTLEMENT
Figure B612. Shortterm settlements versus foundation pressure for strip footings
A comparison of the above methods show similar results for the design pressure.
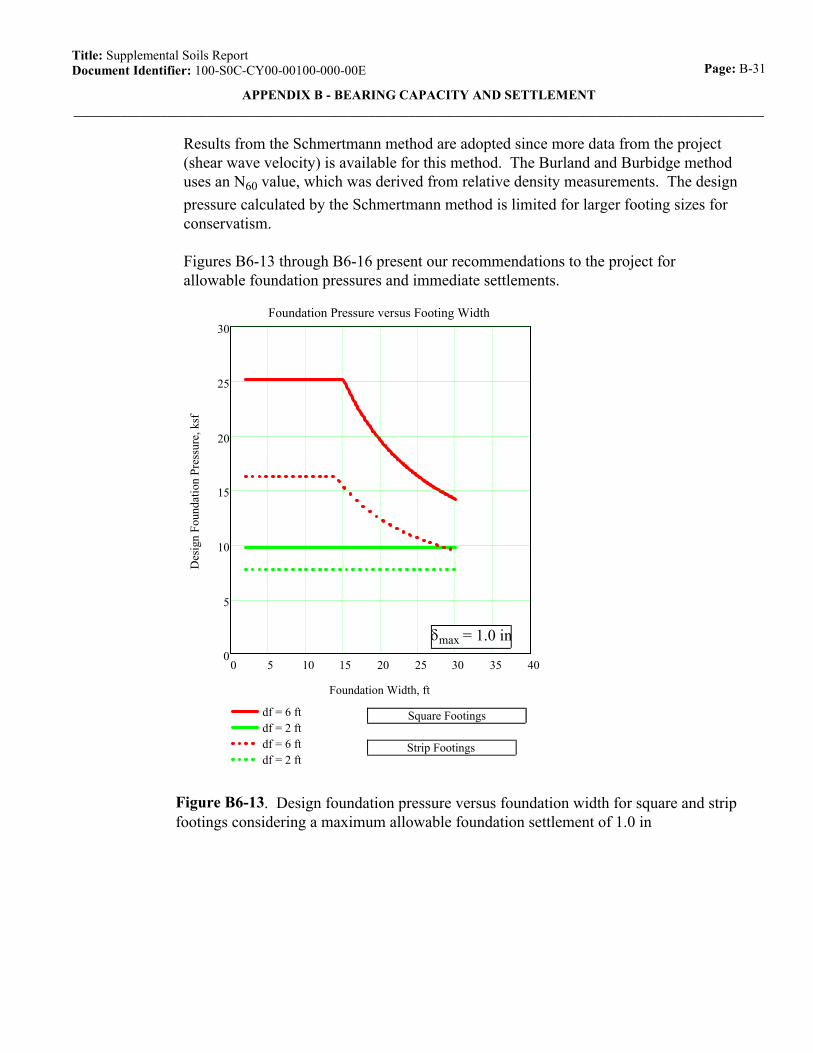
A comparison of the above methods show similar results for the design pressure.
_______________________________________________________________________________________________________
Results from the Schmertmann method are adopted since more data from the project (shear wave velocity) is available for this method. The Burland and Burbidge method uses an N60 value, which was derived from relative density measurements. The design pressure calculated by the Schmertmann method is limited for larger footing sizes for conservatism.
Figures B613 through B616 present our recommendations to the project for allowable foundation pressures and immediate settlements.
30
25
20
essu
re, k
sf
15
Des
ign
Foundat
ion
Pr
10
5
δmax = 1.0 in 0 0 5 10 15 20 25 30 35 40
Foundation Width, ft
df = 6 ft Square Footings df = 2 ft df = 6 ft Strip Footings
Foundation Pressure versus Footing Width
df = 2 ft
Title: Supplemental Soils Report Document Identifier: 100S0CCY000010000000E Page: B31
APPENDIX B BEARING CAPACITY AND SETTLEMENT
Figure B613. Design foundation pressure versus foundation width for square and strip footings considering a maximum allowable foundation settlement of 1.0 in
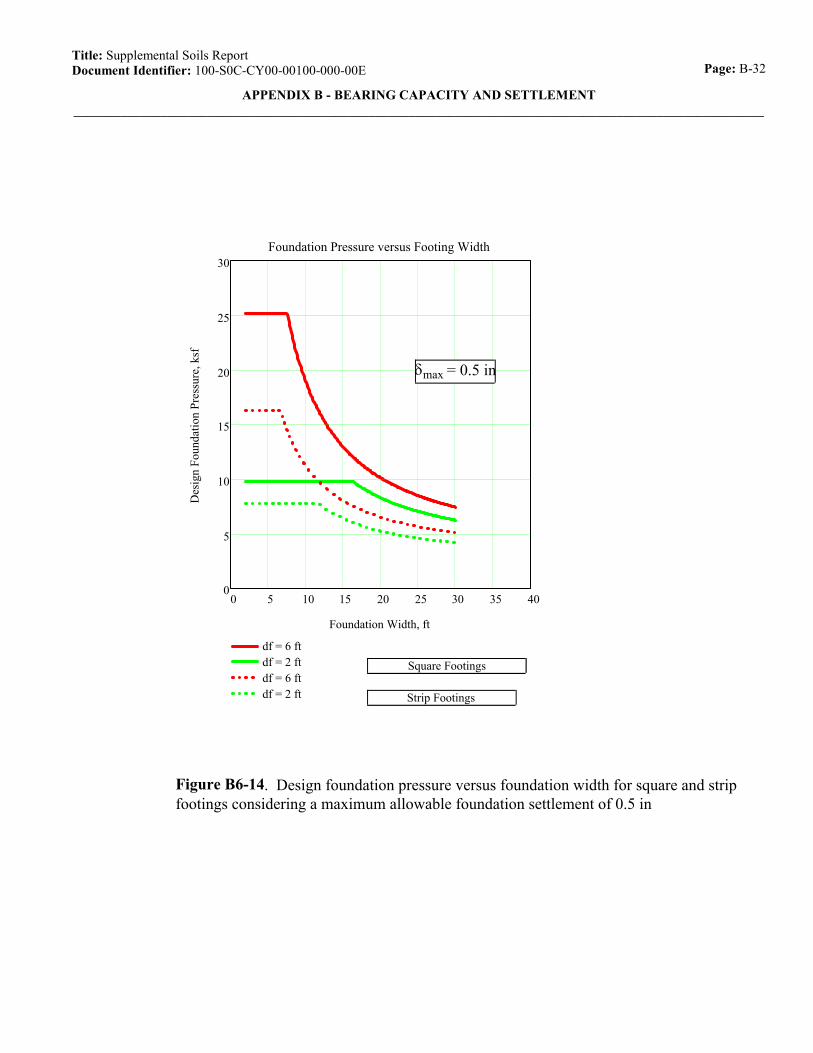
_______________________________________________________________________________________________________
Foundation Pressure versus Footing Width 30
25
20
ress
ure
, ksf
δmax = 0.5 in
15
Des
ign
Foundat
ion
P
10
5
0 0 5 10 15 20 25 30 35 40
Foundation Width, ft
df = 6 ft df = 2 ft Square Footings df = 6 ft df = 2 ft Strip Footings
Title: Supplemental Soils Report Document Identifier: 100S0CCY000010000000E Page: B32
APPENDIX B BEARING CAPACITY AND SETTLEMENT
Figure B614. Design foundation pressure versus foundation width for square and strip footings considering a maximum allowable foundation settlement of 0.5 in
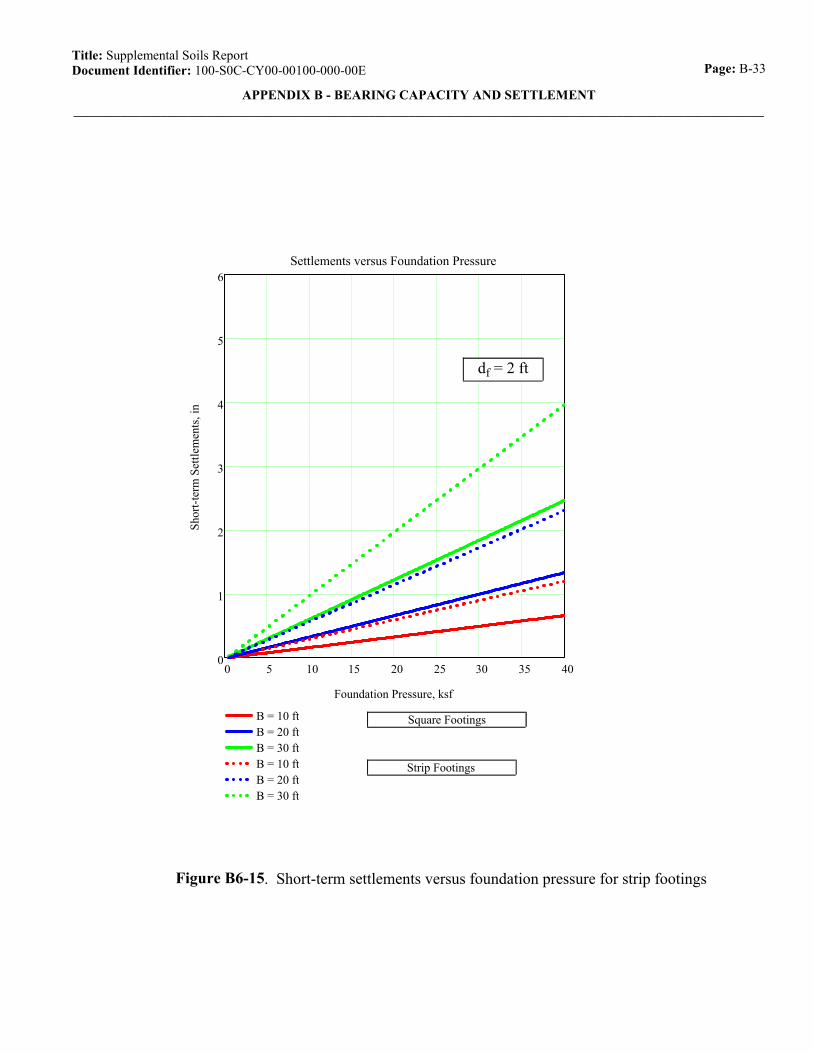
_______________________________________________________________________________________________________
6 Settlements versus Foundation Pressure
4
5
df = 2 ft
3
2
1
0
Shortter
m
Set
tlem
ents
, in
0 5 10 15 20 25 30 35 40
B = 10 ft B = 20 ft B = 30 ft B = 10 ft B = 20 ft B = 30 ft
Foundation Pressure, ksf
Square Footings
Strip Footings
Title: Supplemental Soils Report Document Identifier: 100S0CCY000010000000E Page: B33
APPENDIX B BEARING CAPACITY AND SETTLEMENT
Figure B615. Shortterm settlements versus foundation pressure for strip footings
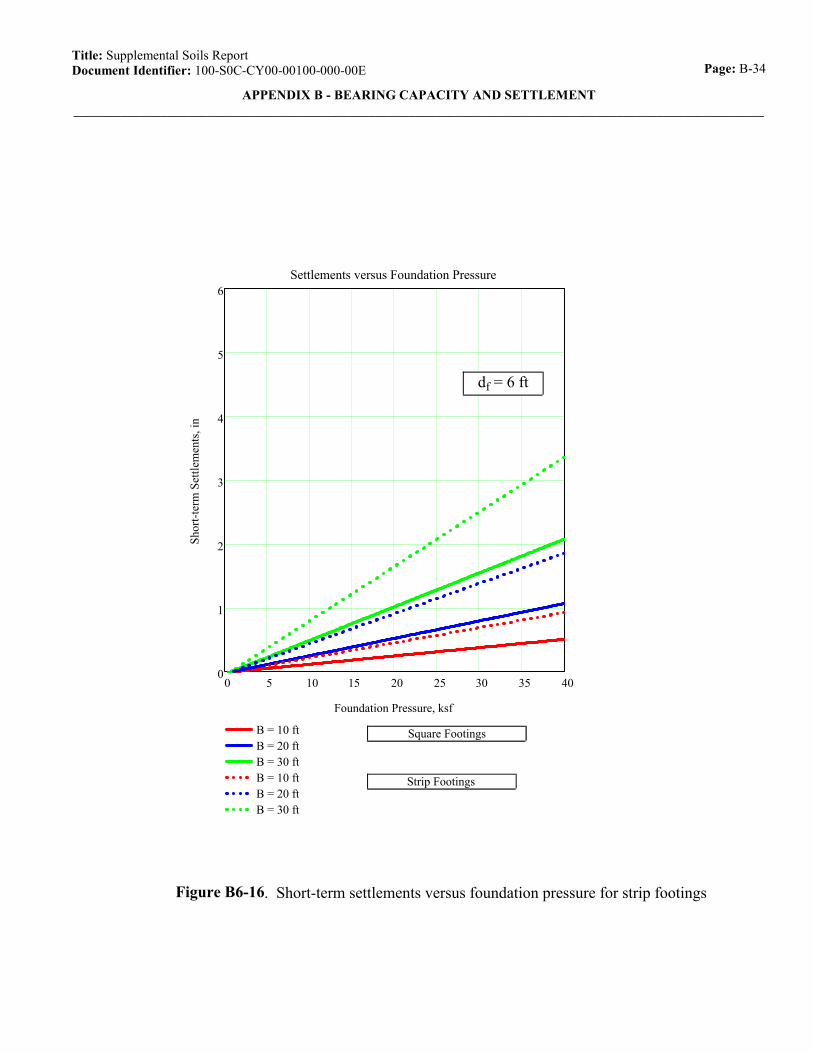
_______________________________________________________________________________________________________
6 Settlements versus Foundation Pressure
4
5
df = 6 ft
3
2
1
0
Shortter
m
Set
tlem
ents
, in
0 5 10 15 20 25 30 35 40
B = 10 ft B = 20 ft B = 30 ft B = 10 ft B = 20 ft B = 30 ft
Foundation Pressure, ksf
Square Footings
Strip Footings
Title: Supplemental Soils Report Document Identifier: 100S0CCY000010000000E Page: B34
APPENDIX B BEARING CAPACITY AND SETTLEMENT
Figure B616. Shortterm settlements versus foundation pressure for strip footings
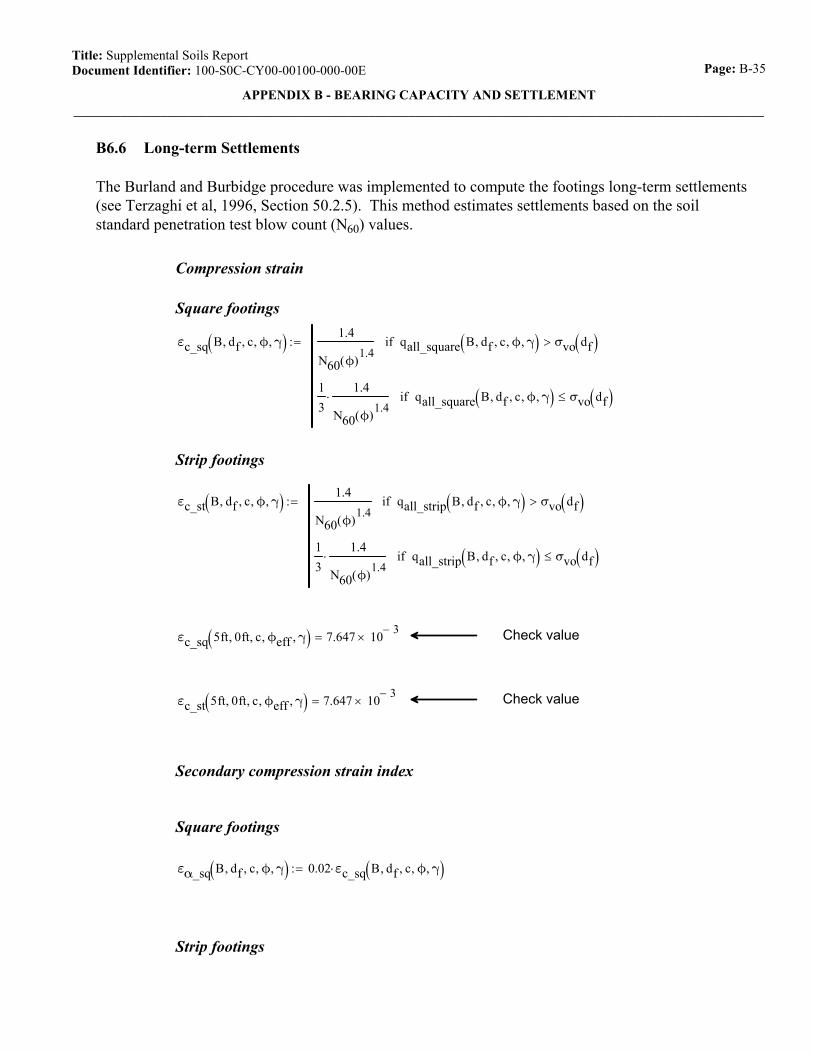
_______________________________________________________________________________________________________
Title: Supplemental Soils Report Document Identifier: 100S0CCY000010000000E Page: B35
APPENDIX B BEARING CAPACITY AND SETTLEMENT
B6.6 Longterm Settlements
The Burland and Burbidge procedure was implemented to compute the footings longterm settlements (see Terzaghi et al, 1996, Section 50.2.5). This method estimates settlements based on the soil standard penetration test blow count (N60) values.
Compression strain
Square footings
ε ( 1.4 B , d , c , ϕ , γ) := if q (B , , c ) dc_sq d , , ϕ γ > σ f all_square f vo
1.4 ( f )
N (ϕ)60
1 1.4⋅ if q B , d , c , ϕ , ≤ σ dall_square f γ vo f3 1.4
( ) ( ) N (ϕ)60
Strip footings
ε (B , d , c , ϕ , γ) 1.4 := if q (B , d , c , ϕ, γ > σ dc_st f all_strip f ) vo( f
1.4 )
N (ϕ)60
1 1.4⋅ if q (B , d , c , , ϕ γ
3 all_strip f1.4
) ≤ σ dvo( f ) N (ϕ)60
− ε ( 5ft , 0ft , c , ϕ , =
3 γ eff ) 7.647 × 10 Check value
c_sq
− ε ( 5ft , 0ft , c , ϕ , γeff ) =
3 7.647 × 10 Check value c_st
Secondary compression strain index
Square footings
ε ( B , d , c , ϕ, γ) := 0.02⋅ε ( B , d , c , ϕ, γα_sq f c_sq f )
Strip footings
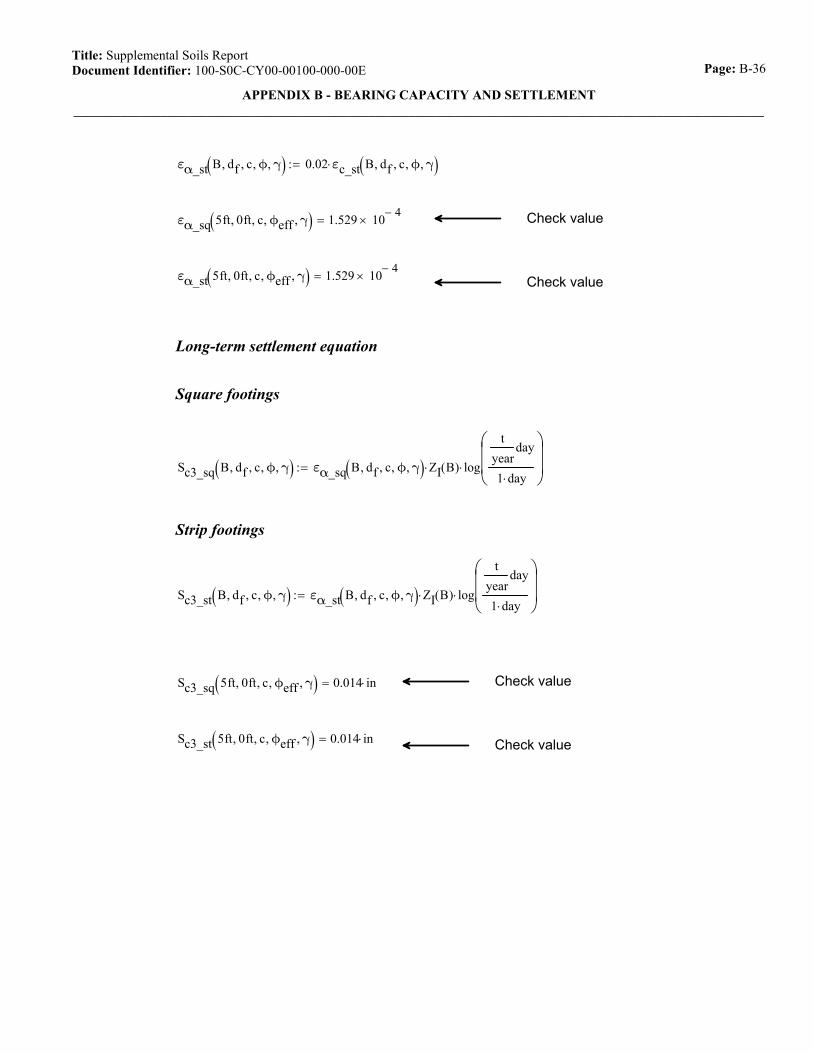
_______________________________________________________________________________________________________
Title: Supplemental Soils Report Document Identifier: 100S0CCY000010000000E Page: B36
APPENDIX B BEARING CAPACITY AND SETTLEMENT
ε (B , d , γ , c , ϕ, ) := 0.02⋅ε (B , d c , ϕ , γα_st f c_st f )
− 4 ε ( 5ft , 0 ft , c , ϕ , γ) = 1.529 × 10 Check valueα_sq eff
( − 4 ε 5ft ,0ft , c , ϕ , γ) = 1.529 × 10α_st eff Check value
Longterm settlement equation
Square footings
t day
S (B , d , c , ϕ, γ c3_sq f ) ( ) year:= , d , c , ϕ, γ ⋅ ε B Z (B) ⋅log α_sq f I 1 ⋅day
Strip footings
t day
year B , , c , ϕ , γ := , , c , S d ε B d ϕ , γ ⋅Z (B)⋅logc3_st( f ) α_st( f ) I 1 ⋅ day
S (5ft , 0ft , c , ϕ , γ) = 0.014⋅ Check valuec3_sq eff in
S , ( 5ft 0ft , c , ϕ , γ = 0.014⋅ inc3_st eff ) Check value
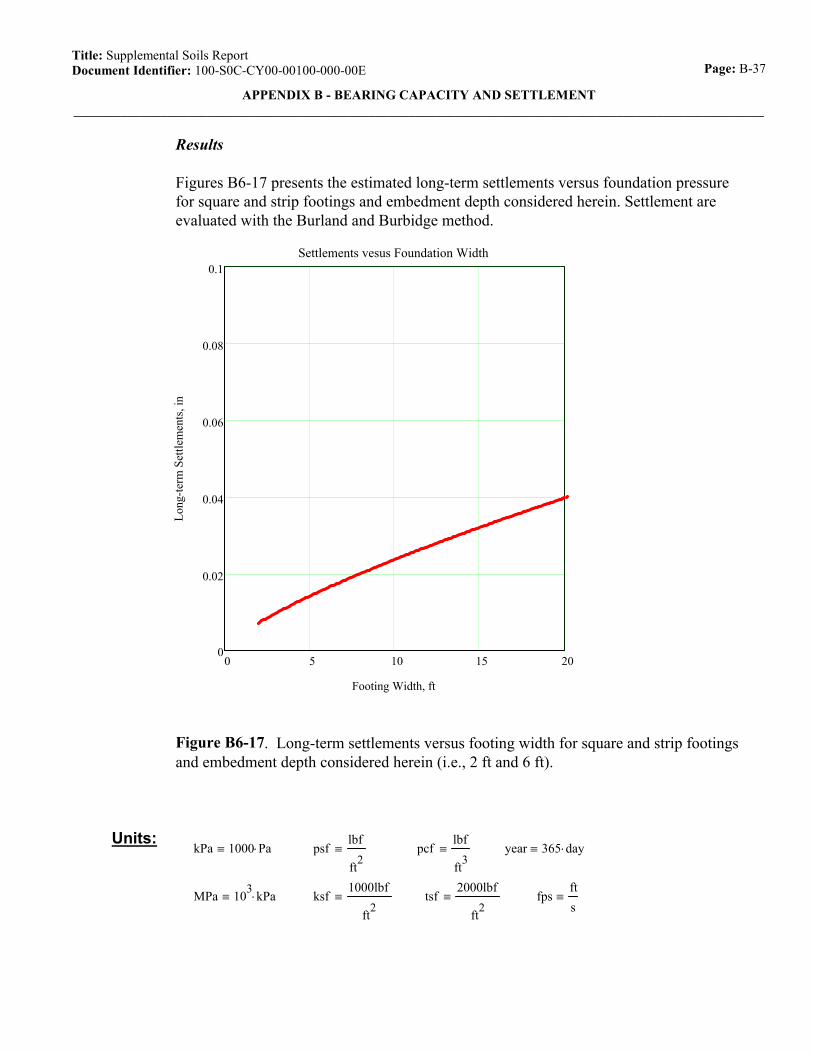
_______________________________________________________________________________________________________
Results
Figures B617 presents the estimated longterm settlements versus foundation pressure for square and strip footings and embedment depth considered herein. Settlement are evaluated with the Burland and Burbidge method.
0.02
0.04
0.06
0.08
0.1
Longter
m
Set
tlem
ents
, in
Settlements vesus Foundation Width
0 0 5 10 15 20
Footing Width, ft
⋅ ⋅
Title: Supplemental Soils Report Document Identifier: 100S0CCY000010000000E Page: B37
APPENDIX B BEARING CAPACITY AND SETTLEMENT
Figure B617. Longterm settlements versus footing width for square and strip footings and embedment depth considered herein (i.e., 2 ft and 6 ft).
Units: lbf lbf kPa ≡ 1000 Pa psf ≡ pcf ≡ year ≡ 365 day
2 3 ft ft
3 1000lbf 2000lbf ft MPa ≡ 10 ⋅kPa ksf ≡ tsf ≡ fps ≡
2 2 s ft ft
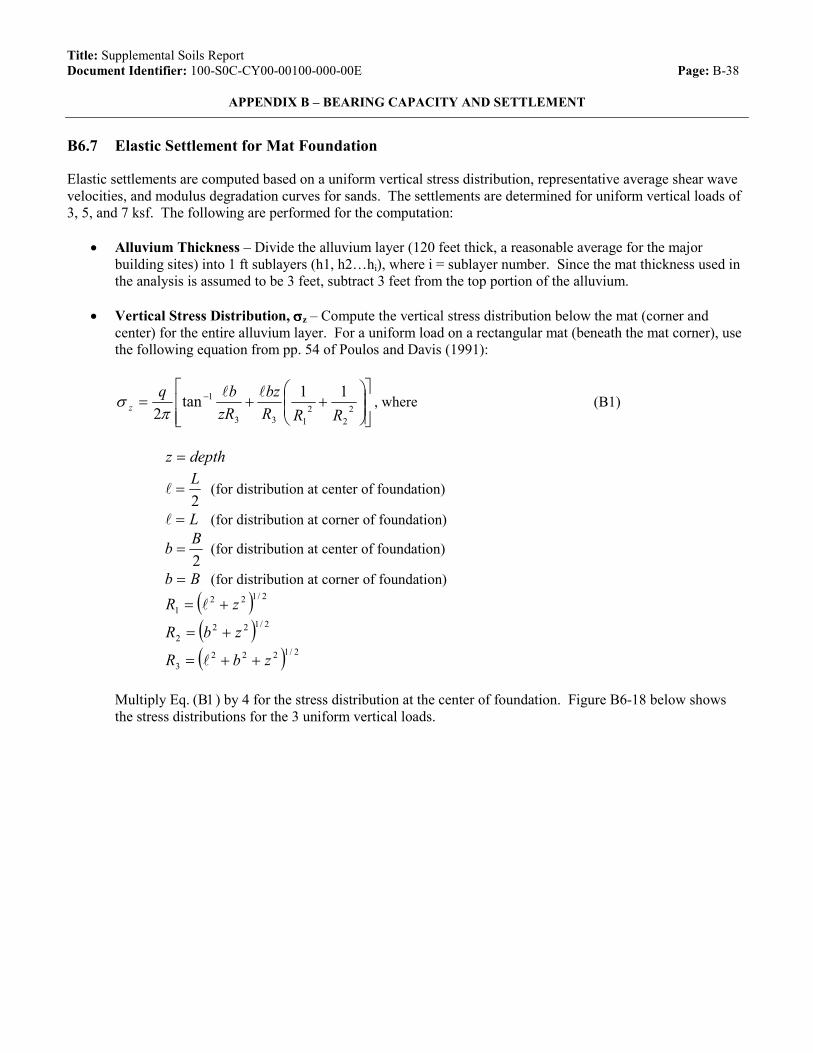
Title: Supplemental Soils Report Document Identifier: 100S0CCY000010000000E Page: B38
APPENDIX B – BEARING CAPACITY AND SETTLEMENT
B6.7 Elastic Settlement for Mat Foundation
Elastic settlements are computed based on a uniform vertical stress distribution, representative average shear wave velocities, and modulus degradation curves for sands. The settlements are determined for uniform vertical loads of 3, 5, and 7 ksf. The following are performed for the computation:
• � Alluvium Thickness – Divide the alluvium layer (120 feet thick, a reasonable average for the major building sites) into 1 ft sublayers (h1, h2…hi), where i = sublayer number. Since the mat thickness used in the analysis is assumed to be 3 feet, subtract 3 feet from the top portion of the alluvium.
• � Vertical Stress Distribution, σσσσz – Compute the vertical stress distribution below the mat (corner and center) for the entire alluvium layer. For a uniform load on a rectangular mat (beneath the mat corner), use the following equation from pp. 54 of Poulos and Davis (1991):
q � l−1 b lbz 1 1 σ = tan + + z , where (B1)
π 2 zR3 R 2 2
3 R1 R2
z = depth L
l = (for distribution at center of foundation) 2
l = L (for distribution at corner of foundation) B
b = (for distribution at center of foundation) 2
b = B (for distribution at corner of foundation) R1 = (l 2 + z )1/ 22
= ( + )1/ 2R 2 2
2 b z
R 2 2 z 23 = (l + b + )1/ 2
Multiply Eq. (Β1) by 4 for the stress distribution at the center of foundation. Figure B618 below shows the stress distributions for the 3 uniform vertical loads.
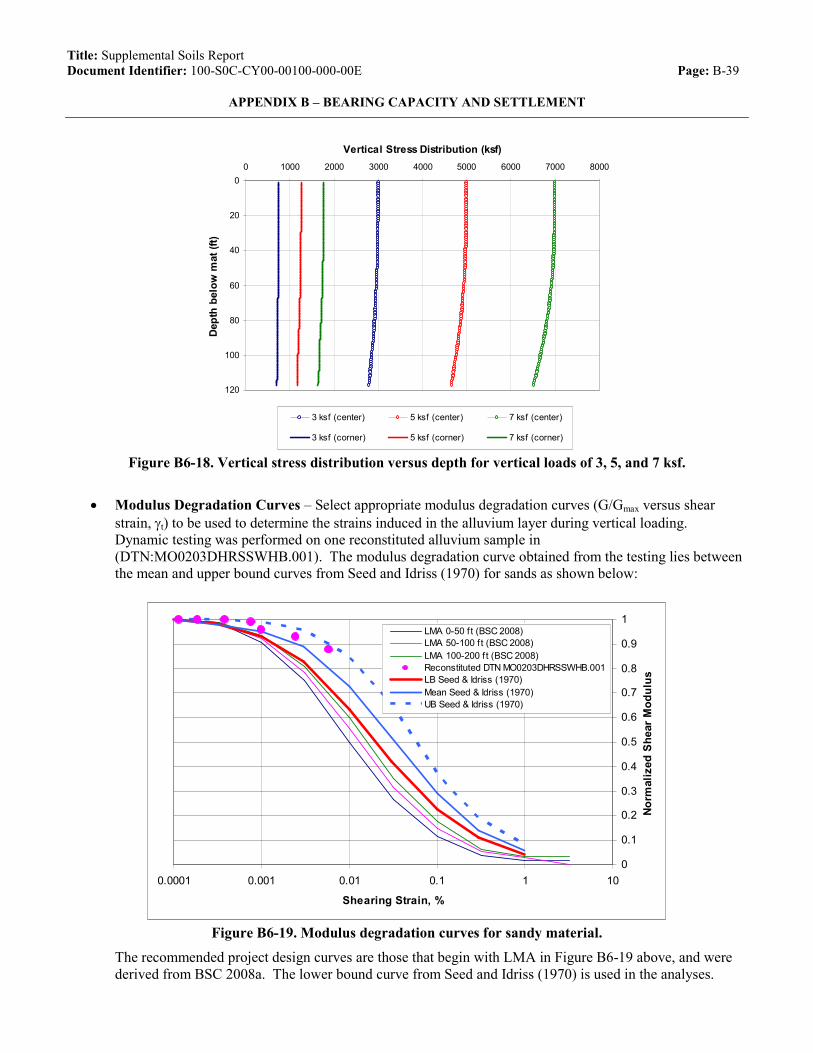
Vertical Stress Distribution (ksf) 0 1000 2000 3000 4000 5000 6000 7000 8000
0
20
40
60
80
100
120
Depth
below
mat (ft)
3 ksf (center) 5 ksf (center) 7 ksf (center)
3 ksf (corner) 5 ksf (corner) 7 ksf (corner)
Title: Supplemental Soils Report Document Identifier: 100S0CCY000010000000E Page: B39
APPENDIX B – BEARING CAPACITY AND SETTLEMENT
Figure B618. Vertical stress distribution versus depth for vertical loads of 3, 5, and 7 ksf.
•� Modulus Degradation Curves – Select appropriate modulus degradation curves (G/Gmax versus shear strain, γt) to be used to determine the strains induced in the alluvium layer during vertical loading. Dynamic testing was performed on one reconstituted alluvium sample in (DTN:MO0203DHRSSWHB.001). The modulus degradation curve obtained from the testing lies between the mean and upper bound curves from Seed and Idriss (1970) for sands as shown below:
0
0.1
0.2
0.3
0.4
0.5
0.6
0.7
0.8
0.9
1
0.0001 0.001 0.01 0.1 1 10
Shearing Strain, %
Norm
alized
Shear
Modulus
LMA 050 f t (BSC 2008) LMA 50100 f t (BSC 2008) LMA 100200 f t (BSC 2008) Reconstituted DTN MO0203DHRSSWHB.001 LB Seed & Idriss (1970) Mean Seed & Idriss (1970) UB Seed & Idriss (1970)
Figure B619. Modulus degradation curves for sandy material.
The recommended project design curves are those that begin with LMA in Figure B619 above, and were derived from BSC 2008a. The lower bound curve from Seed and Idriss (1970) is used in the analyses.
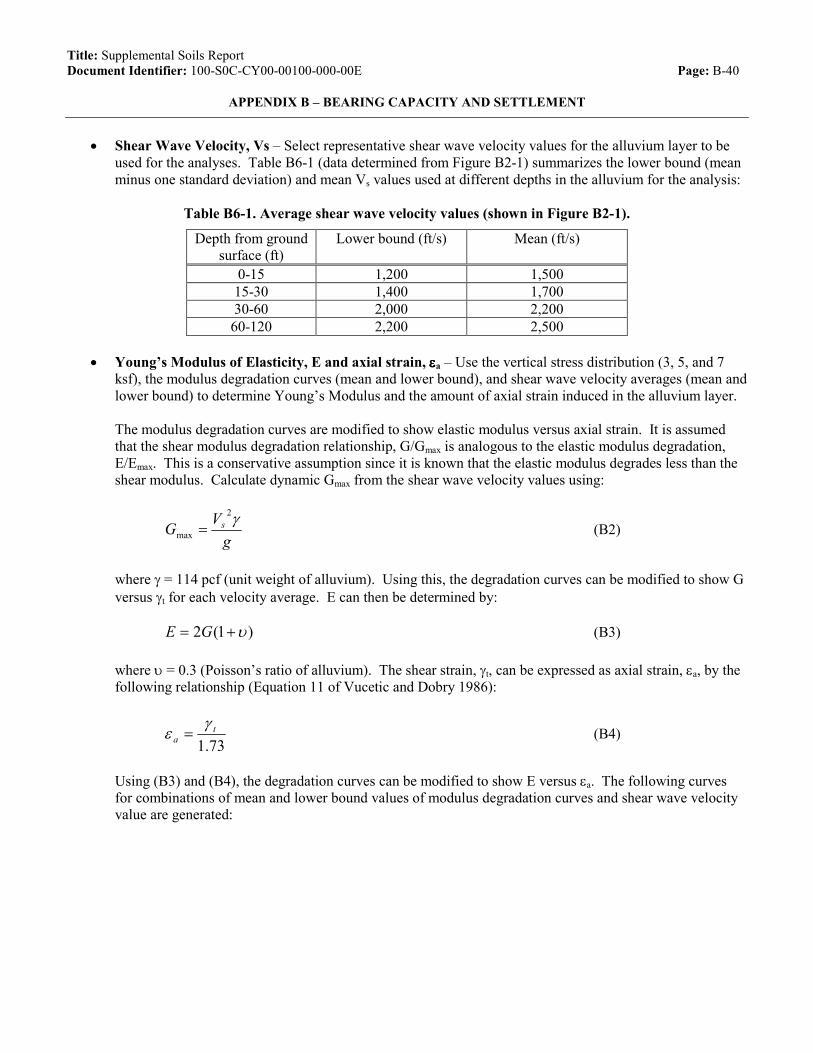
• � Young’s Modulus of Elasticity, E and axial strain, εεεεa – Use the vertical stress distribution (3, 5, and 7 ksf), the modulus degradation curves (mean and lower bound), and shear wave velocity averages (mean and lower bound) to determine Young’s Modulus and the amount of axial strain induced in the alluvium layer.
The modulus degradation curves are modified to show elastic modulus versus axial strain. It is assumed that the shear modulus degradation relationship, G/Gmax is analogous to the elastic modulus degradation,
E/Emax. This is a conservative assumption since it is known that the elastic modulus degrades less than the shear modulus. Calculate dynamic Gmax from the shear wave velocity values using:
V 2s γGmax =� (B2)
g
where γ = 114 pcf (unit weight of alluvium). Using this, the degradation curves can be modified to show G versus γt for each velocity average. E can then be determined by:
E = 2G(1+υ) (B3)
where υ = 0.3 (Poisson’s ratio of alluvium). The shear strain, γt, can be expressed as axial strain, εa, by the following relationship (Equation 11 of Vucetic and Dobry 1986):
γ ε t
a = (B4) 1.73
Using (B3) and (B4), the degradation curves can be modified to show E versus εa. The following curves for combinations of mean and lower bound values of modulus degradation curves and shear wave velocity value are generated:
Title: Supplemental Soils Report Document Identifier: 100S0CCY000010000000E Page: B40
APPENDIX B – BEARING CAPACITY AND SETTLEMENT
•� Shear Wave Velocity, Vs – Select representative shear wave velocity values for the alluvium layer to be used for the analyses. Table B61 (data determined from Figure B21) summarizes the lower bound (mean minus one standard deviation) and mean Vs values used at different depths in the alluvium for the analysis:
Table B61. Average shear wave velocity values (shown in Figure B21).
Depth from ground surface (ft)
Lower bound (ft/s) Mean (ft/s)
015 1,200 1,500 1530 1,400 1,700 3060 2,000 2,200 60120 2,200 2,500
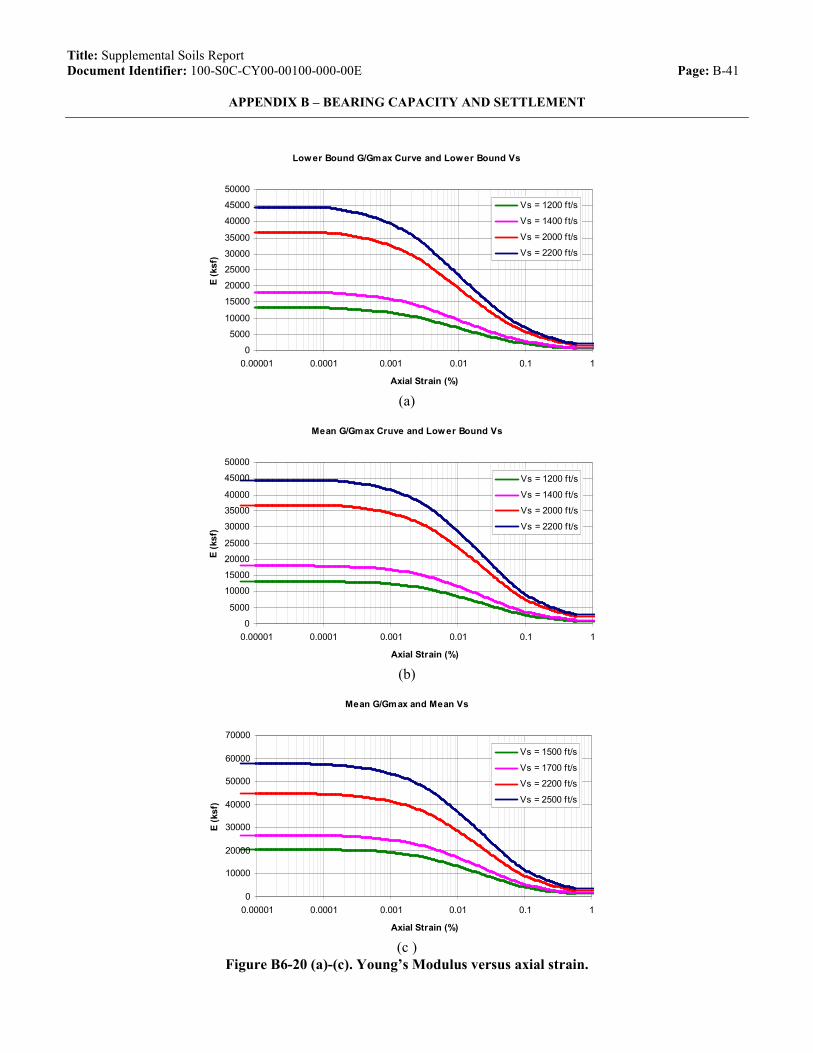
Lower Bound G/Gmax Curve and Lower Bound Vs
50000
45000 Vs = 1200 ft/s
40000 Vs = 1400 ft/s
35000 Vs = 2000 ft/s
30000 Vs = 2200 ft/s
25000
20000
15000
10000
5000
0 0.00001 0.0001 0.001 0.01 0.1 1
Axial Strain (%)
(a)
Mean G/Gmax Cruve and Lower Bound Vs
50000
45000 Vs = 1200 ft/s
40000 Vs = 1400 ft/s
35000 Vs = 2000 ft/s
30000 Vs = 2200 ft/s
25000
20000
15000
10000
5000
0 0.00001 0.0001 0.001 0.01 0.1 1
Axial Strain (%)
(b)
Mean G/Gmax and Mean Vs
70000
Vs = 1500 ft/s 60000
Vs = 1700 ft/s 50000 Vs = 2200 ft/s
Vs = 2500 ft/s40000
30000
20000
10000
0 0.00001 0.0001 0.001 0.01 0.1 1
Axial Strain (%)
(c )
E (ksf)
E (ksf)
E (ksf)
Title: Supplemental Soils Report
Document Identifier: 100S0CCY000010000000E Page: B41
APPENDIX B – BEARING CAPACITY AND SETTLEMENT
Figure B620 (a)(c). Young’s Modulus versus axial strain.
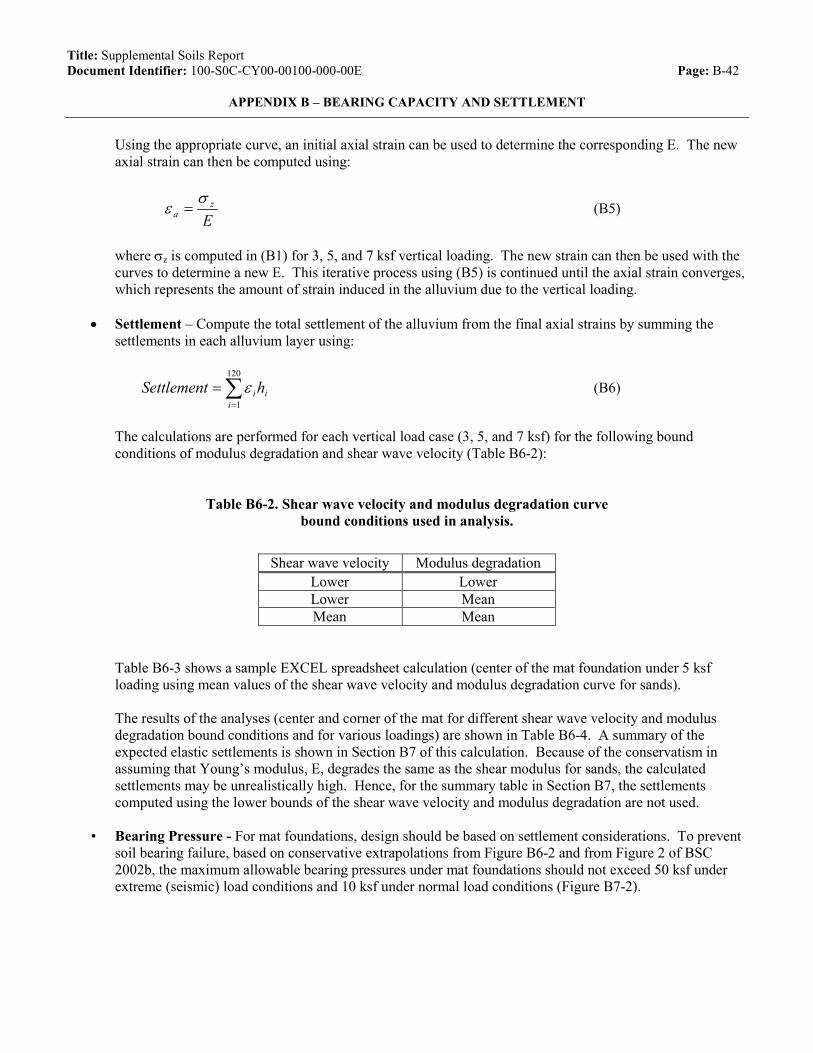
Title: Supplemental Soils Report Document Identifier: 100S0CCY000010000000E Page: B42
APPENDIX B – BEARING CAPACITY AND SETTLEMENT
Using the appropriate curve, an initial axial strain can be used to determine the corresponding E. The new axial strain can then be computed using:
σ εa = z (B5)
E
where σz is computed in (B1) for 3, 5, and 7 ksf vertical loading. The new strain can then be used with the curves to determine a new E. This iterative process using (B5) is continued until the axial strain converges, which represents the amount of strain induced in the alluvium due to the vertical loading.
• � Settlement – Compute the total settlement of the alluvium from the final axial strains by summing the settlements in each alluvium layer using:
120
Settlement = ∑ε ihi (B6) i=1
The calculations are performed for each vertical load case (3, 5, and 7 ksf) for the following bound conditions of modulus degradation and shear wave velocity (Table B62):
Table B62. Shear wave velocity and modulus degradation curve bound conditions used in analysis.
Shear wave velocity Modulus degradation Lower Lower Lower Mean Mean Mean
Table B63 shows a sample EXCEL spreadsheet calculation (center of the mat foundation under 5 ksf loading using mean values of the shear wave velocity and modulus degradation curve for sands).
The results of the analyses (center and corner of the mat for different shear wave velocity and modulus degradation bound conditions and for various loadings) are shown in Table B64. A summary of the expected elastic settlements is shown in Section B7 of this calculation. Because of the conservatism in assuming that Young’s modulus, E, degrades the same as the shear modulus for sands, the calculated settlements may be unrealistically high. Hence, for the summary table in Section B7, the settlements computed using the lower bounds of the shear wave velocity and modulus degradation are not used.
• Bearing Pressure For mat foundations, design should be based on settlement considerations. To prevent soil bearing failure, based on conservative extrapolations from Figure B62 and from Figure 2 of BSC 2002b, the maximum allowable bearing pressures under mat foundations should not exceed 50 ksf under extreme (seismic) load conditions and 10 ksf under normal load conditions (Figure B72).
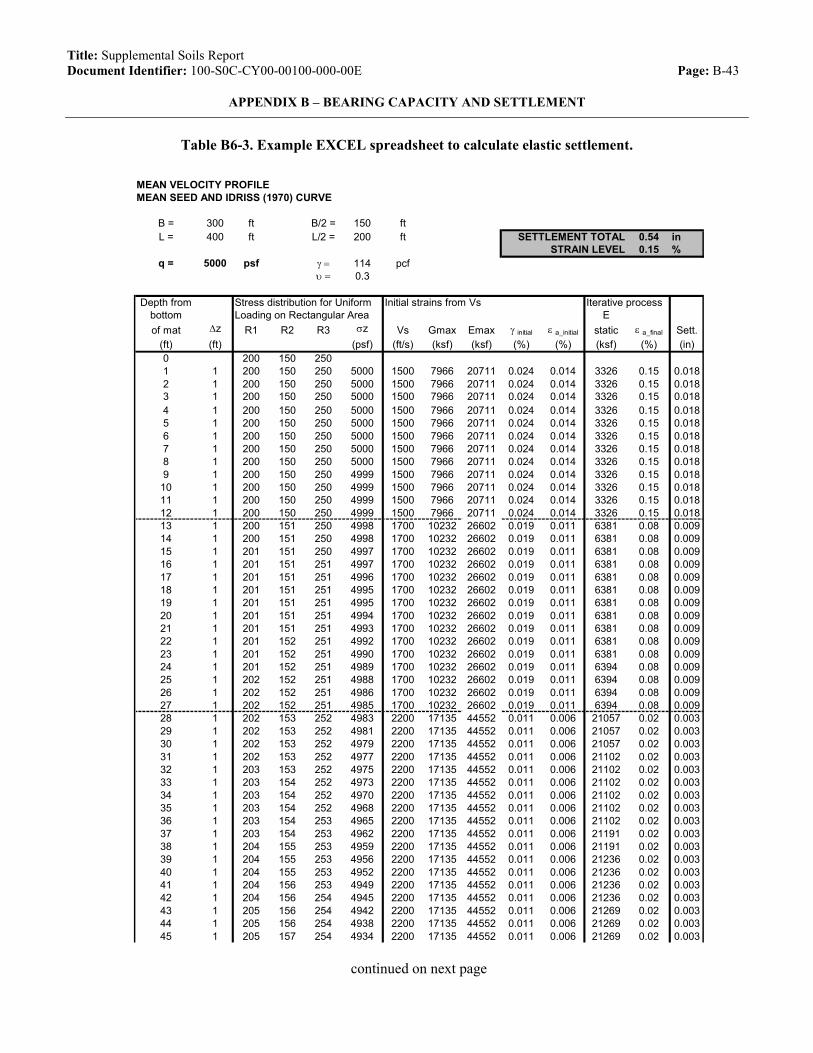
Title: Supplemental Soils Report Document Identifier: 100S0CCY000010000000E Page: B43
APPENDIX B – BEARING CAPACITY AND SETTLEMENT
Table B63. Example EXCEL spreadsheet to calculate elastic settlement.
MEAN VELOCITY PROFILE MEAN SEED AND IDRISS (1970) CURVE
B = 300 ft B/2 = 150 ft L = 400 ft L/2 = 200 ft SETTLEMENT TOTAL 0.54 in
STRAIN LEVEL 0.15 % q = 5000 psf γ = 114 pcf
υ = 0.3
Depth from Stress distribution for Uniform Initial strains from Vs Iterative process bottom Loading on Rectangular Area E of mat ∆z R1 R2 R3 σz Vs Gmax Emax γ initial ε a_initial static ε a_final Sett.
(ft) (ft) (psf) (ft/s) (ksf) (ksf) (%) (%) (ksf) (%) (in) 0 200 150 250 1 1 200 150 250 5000 1500 7966 20711 0.024 0.014 3326 0.15 0.018 2 1 200 150 250 5000 1500 7966 20711 0.024 0.014 3326 0.15 0.018 3 1 200 150 250 5000 1500 7966 20711 0.024 0.014 3326 0.15 0.018 4 1 200 150 250 5000 1500 7966 20711 0.024 0.014 3326 0.15 0.018 5 1 200 150 250 5000 1500 7966 20711 0.024 0.014 3326 0.15 0.018 6 1 200 150 250 5000 1500 7966 20711 0.024 0.014 3326 0.15 0.018 7 1 200 150 250 5000 1500 7966 20711 0.024 0.014 3326 0.15 0.018 8 1 200 150 250 5000 1500 7966 20711 0.024 0.014 3326 0.15 0.018 9 1 200 150 250 4999 1500 7966 20711 0.024 0.014 3326 0.15 0.018
10 1 200 150 250 4999 1500 7966 20711 0.024 0.014 3326 0.15 0.018 11 1 200 150 250 4999 1500 7966 20711 0.024 0.014 3326 0.15 0.018 12 1 200 150 250 4999 1500 7966 20711 0.024 0.014 3326 0.15 0.018 13 1 200 151 250 4998 1700 10232 26602 0.019 0.011 6381 0.08 0.009 14 1 200 151 250 4998 1700 10232 26602 0.019 0.011 6381 0.08 0.009 15 1 201 151 250 4997 1700 10232 26602 0.019 0.011 6381 0.08 0.009 16 1 201 151 251 4997 1700 10232 26602 0.019 0.011 6381 0.08 0.009 17 1 201 151 251 4996 1700 10232 26602 0.019 0.011 6381 0.08 0.009 18 1 201 151 251 4995 1700 10232 26602 0.019 0.011 6381 0.08 0.009 19 1 201 151 251 4995 1700 10232 26602 0.019 0.011 6381 0.08 0.009 20 1 201 151 251 4994 1700 10232 26602 0.019 0.011 6381 0.08 0.009 21 1 201 151 251 4993 1700 10232 26602 0.019 0.011 6381 0.08 0.009 22 1 201 152 251 4992 1700 10232 26602 0.019 0.011 6381 0.08 0.009 23 1 201 152 251 4990 1700 10232 26602 0.019 0.011 6381 0.08 0.009 24 1 201 152 251 4989 1700 10232 26602 0.019 0.011 6394 0.08 0.009 25 1 202 152 251 4988 1700 10232 26602 0.019 0.011 6394 0.08 0.009 26 1 202 152 251 4986 1700 10232 26602 0.019 0.011 6394 0.08 0.009 27 1 202 152 251 4985 1700 10232 26602 0.019 0.011 6394 0.08 0.009 28 1 202 153 252 4983 2200 17135 44552 0.011 0.006 21057 0.02 0.003 29 1 202 153 252 4981 2200 17135 44552 0.011 0.006 21057 0.02 0.003 30 1 202 153 252 4979 2200 17135 44552 0.011 0.006 21057 0.02 0.003 31 1 202 153 252 4977 2200 17135 44552 0.011 0.006 21102 0.02 0.003 32 1 203 153 252 4975 2200 17135 44552 0.011 0.006 21102 0.02 0.003 33 1 203 154 252 4973 2200 17135 44552 0.011 0.006 21102 0.02 0.003 34 1 203 154 252 4970 2200 17135 44552 0.011 0.006 21102 0.02 0.003 35 1 203 154 252 4968 2200 17135 44552 0.011 0.006 21102 0.02 0.003 36 1 203 154 253 4965 2200 17135 44552 0.011 0.006 21102 0.02 0.003 37 1 203 154 253 4962 2200 17135 44552 0.011 0.006 21191 0.02 0.003 38 1 204 155 253 4959 2200 17135 44552 0.011 0.006 21191 0.02 0.003 39 1 204 155 253 4956 2200 17135 44552 0.011 0.006 21236 0.02 0.003 40 1 204 155 253 4952 2200 17135 44552 0.011 0.006 21236 0.02 0.003 41 1 204 156 253 4949 2200 17135 44552 0.011 0.006 21236 0.02 0.003 42 1 204 156 254 4945 2200 17135 44552 0.011 0.006 21236 0.02 0.003 43 1 205 156 254 4942 2200 17135 44552 0.011 0.006 21269 0.02 0.003 44 1 205 156 254 4938 2200 17135 44552 0.011 0.006 21269 0.02 0.003 45 1 205 157 254 4934 2200 17135 44552 0.011 0.006 21269 0.02 0.003
continued on next page
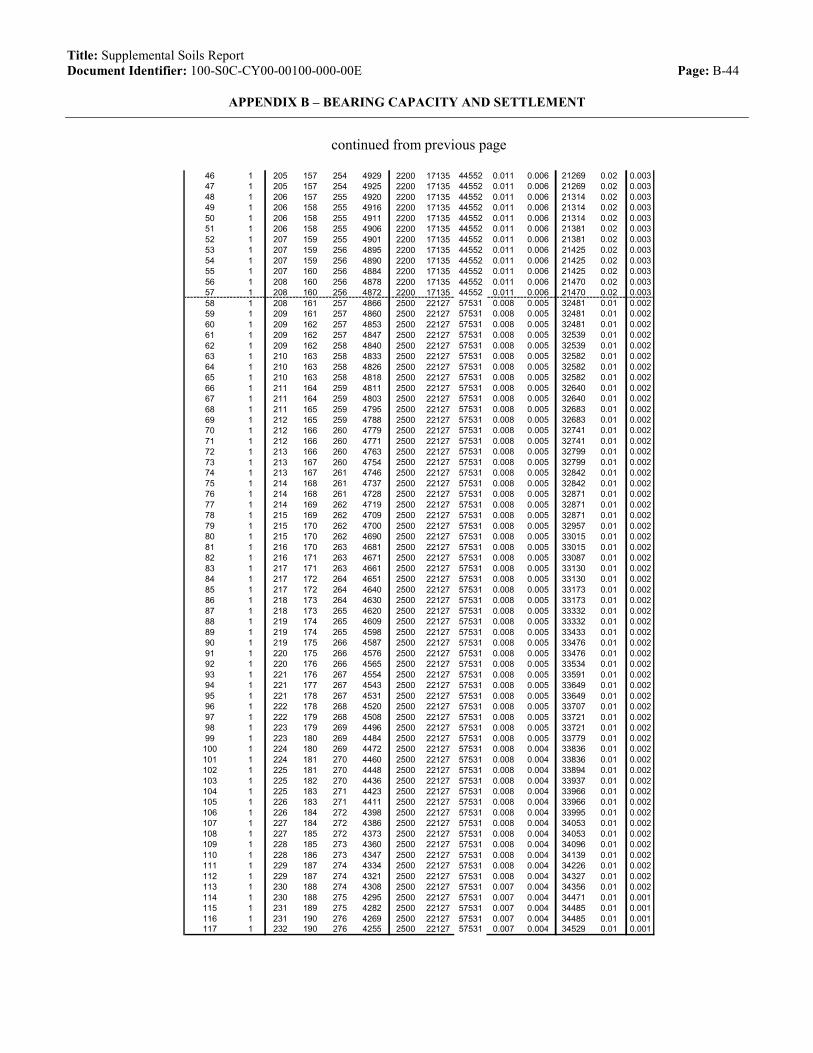
continued from previous page
46 1 205 157 254 4929 2200 17135 44552 0.011 0.006 21269 0.02 0.003 47 1 205 157 254 4925 2200 17135 44552 0.011 0.006 21269 0.02 0.003 48 1 206 157 255 4920 2200 17135 44552 0.011 0.006 21314 0.02 0.003 49 1 206 158 255 4916 2200 17135 44552 0.011 0.006 21314 0.02 0.003 50 1 206 158 255 4911 2200 17135 44552 0.011 0.006 21314 0.02 0.003 51 1 206 158 255 4906 2200 17135 44552 0.011 0.006 21381 0.02 0.003 52 1 207 159 255 4901 2200 17135 44552 0.011 0.006 21381 0.02 0.003 53 1 207 159 256 4895 2200 17135 44552 0.011 0.006 21425 0.02 0.003 54 1 207 159 256 4890 2200 17135 44552 0.011 0.006 21425 0.02 0.003 55 1 207 160 256 4884 2200 17135 44552 0.011 0.006 21425 0.02 0.003 56 1 208 160 256 4878 2200 17135 44552 0.011 0.006 21470 0.02 0.003 57 1 208 160 256 4872 2200 17135 44552 0.011 0.006 21470 0.02 0.003 58 1 208 161 257 4866 2500 22127 57531 0.008 0.005 32481 0.01 0.002 59 1 209 161 257 4860 2500 22127 57531 0.008 0.005 32481 0.01 0.002 60 1 209 162 257 4853 2500 22127 57531 0.008 0.005 32481 0.01 0.002 61 1 209 162 257 4847 2500 22127 57531 0.008 0.005 32539 0.01 0.002 62 1 209 162 258 4840 2500 22127 57531 0.008 0.005 32539 0.01 0.002 63 1 210 163 258 4833 2500 22127 57531 0.008 0.005 32582 0.01 0.002 64 1 210 163 258 4826 2500 22127 57531 0.008 0.005 32582 0.01 0.002 65 1 210 163 258 4818 2500 22127 57531 0.008 0.005 32582 0.01 0.002 66 1 211 164 259 4811 2500 22127 57531 0.008 0.005 32640 0.01 0.002 67 1 211 164 259 4803 2500 22127 57531 0.008 0.005 32640 0.01 0.002 68 1 211 165 259 4795 2500 22127 57531 0.008 0.005 32683 0.01 0.002 69 1 212 165 259 4788 2500 22127 57531 0.008 0.005 32683 0.01 0.002 70 1 212 166 260 4779 2500 22127 57531 0.008 0.005 32741 0.01 0.002 71 1 212 166 260 4771 2500 22127 57531 0.008 0.005 32741 0.01 0.002 72 1 213 166 260 4763 2500 22127 57531 0.008 0.005 32799 0.01 0.002 73 1 213 167 260 4754 2500 22127 57531 0.008 0.005 32799 0.01 0.002 74 1 213 167 261 4746 2500 22127 57531 0.008 0.005 32842 0.01 0.002 75 1 214 168 261 4737 2500 22127 57531 0.008 0.005 32842 0.01 0.002 76 1 214 168 261 4728 2500 22127 57531 0.008 0.005 32871 0.01 0.002 77 1 214 169 262 4719 2500 22127 57531 0.008 0.005 32871 0.01 0.002 78 1 215 169 262 4709 2500 22127 57531 0.008 0.005 32871 0.01 0.002 79 1 215 170 262 4700 2500 22127 57531 0.008 0.005 32957 0.01 0.002 80 1 215 170 262 4690 2500 22127 57531 0.008 0.005 33015 0.01 0.002 81 1 216 170 263 4681 2500 22127 57531 0.008 0.005 33015 0.01 0.002 82 1 216 171 263 4671 2500 22127 57531 0.008 0.005 33087 0.01 0.002 83 1 217 171 263 4661 2500 22127 57531 0.008 0.005 33130 0.01 0.002 84 1 217 172 264 4651 2500 22127 57531 0.008 0.005 33130 0.01 0.002 85 1 217 172 264 4640 2500 22127 57531 0.008 0.005 33173 0.01 0.002 86 1 218 173 264 4630 2500 22127 57531 0.008 0.005 33173 0.01 0.002 87 1 218 173 265 4620 2500 22127 57531 0.008 0.005 33332 0.01 0.002 88 1 219 174 265 4609 2500 22127 57531 0.008 0.005 33332 0.01 0.002 89 1 219 174 265 4598 2500 22127 57531 0.008 0.005 33433 0.01 0.002 90 1 219 175 266 4587 2500 22127 57531 0.008 0.005 33476 0.01 0.002 91 1 220 175 266 4576 2500 22127 57531 0.008 0.005 33476 0.01 0.002 92 1 220 176 266 4565 2500 22127 57531 0.008 0.005 33534 0.01 0.002 93 1 221 176 267 4554 2500 22127 57531 0.008 0.005 33591 0.01 0.002 94 1 221 177 267 4543 2500 22127 57531 0.008 0.005 33649 0.01 0.002 95 1 221 178 267 4531 2500 22127 57531 0.008 0.005 33649 0.01 0.002 96 1 222 178 268 4520 2500 22127 57531 0.008 0.005 33707 0.01 0.002 97 1 222 179 268 4508 2500 22127 57531 0.008 0.005 33721 0.01 0.002 98 1 223 179 269 4496 2500 22127 57531 0.008 0.005 33721 0.01 0.002 99 1 223 180 269 4484 2500 22127 57531 0.008 0.005 33779 0.01 0.002
100 1 224 180 269 4472 2500 22127 57531 0.008 0.004 33836 0.01 0.002 101 1 224 181 270 4460 2500 22127 57531 0.008 0.004 33836 0.01 0.002 102 1 225 181 270 4448 2500 22127 57531 0.008 0.004 33894 0.01 0.002 103 1 225 182 270 4436 2500 22127 57531 0.008 0.004 33937 0.01 0.002 104 1 225 183 271 4423 2500 22127 57531 0.008 0.004 33966 0.01 0.002 105 1 226 183 271 4411 2500 22127 57531 0.008 0.004 33966 0.01 0.002 106 1 226 184 272 4398 2500 22127 57531 0.008 0.004 33995 0.01 0.002 107 1 227 184 272 4386 2500 22127 57531 0.008 0.004 34053 0.01 0.002 108 1 227 185 272 4373 2500 22127 57531 0.008 0.004 34053 0.01 0.002 109 1 228 185 273 4360 2500 22127 57531 0.008 0.004 34096 0.01 0.002 110 1 228 186 273 4347 2500 22127 57531 0.008 0.004 34139 0.01 0.002 111 1 229 187 274 4334 2500 22127 57531 0.008 0.004 34226 0.01 0.002 112 1 229 187 274 4321 2500 22127 57531 0.008 0.004 34327 0.01 0.002 113 1 230 188 274 4308 2500 22127 57531 0.007 0.004 34356 0.01 0.002 114 1 230 188 275 4295 2500 22127 57531 0.007 0.004 34471 0.01 0.001 115 1 231 189 275 4282 2500 22127 57531 0.007 0.004 34485 0.01 0.001 116 1 231 190 276 4269 2500 22127 57531 0.007 0.004 34485 0.01 0.001 117 1 232 190 276 4255 2500 22127 57531 0.007 0.004 34529 0.01 0.001
Title: Supplemental Soils Report Document Identifier: 100S0CCY000010000000E Page: B44
APPENDIX B – BEARING CAPACITY AND SETTLEMENT
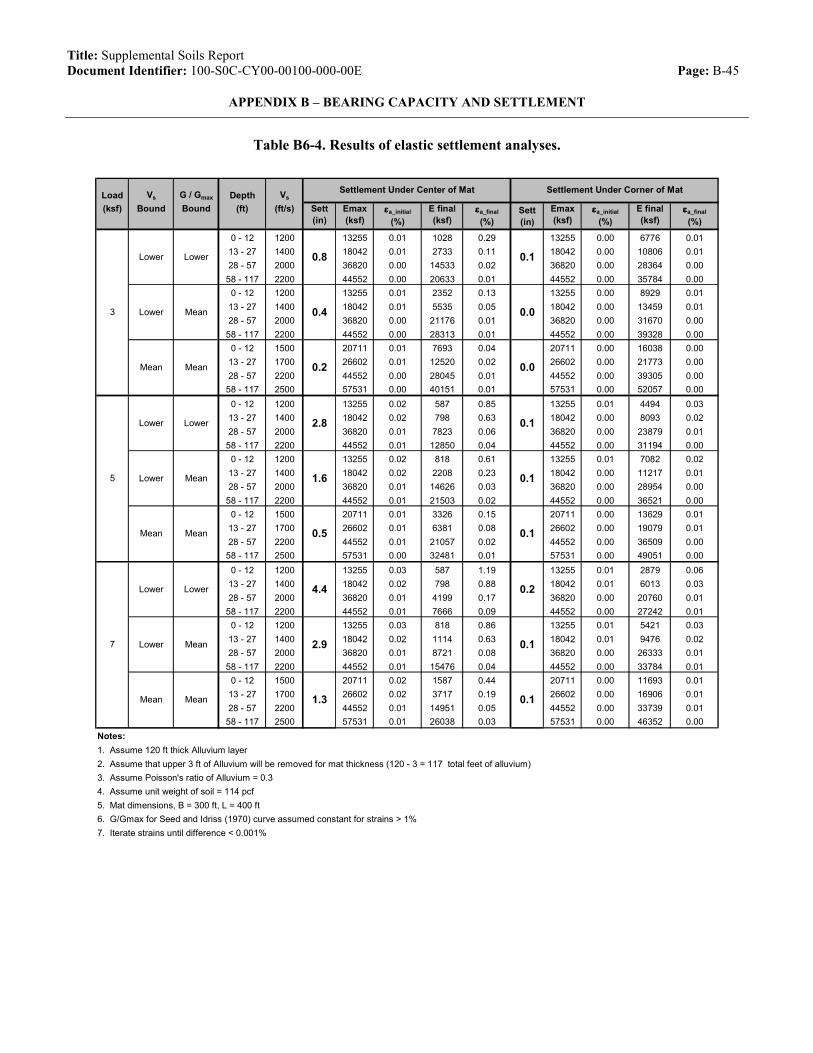
Title: Supplemental Soils Report Document Identifier: 100S0CCY000010000000E Page: B45
APPENDIX B – BEARING CAPACITY AND SETTLEMENT
Table B64. Results of elastic settlement analyses.
Load Vs G / Gmax Depth Vs Settlement Under Center of Mat Settlement Under Corner of Mat
(ksf) Bound Bound (ft) (ft/s) Sett Emax εεεεa_initial E final εεεεa_final Sett Emax εεεεa_initial E final εεεεa_final (in) (ksf) (%) (ksf) (%) (in) (ksf) (%) (ksf) (%)
0 12 1200 13255 0.01 1028 0.29 13255 0.00 6776 0.01
Lower Lower 13 27 28 57
1400 2000
0.8 18042 36820
0.01 0.00
2733 14533
0.11 0.02
0.1 18042 36820
0.00 0.00
10806 28364
0.01 0.00
58 117 2200 44552 0.00 20633 0.01 44552 0.00 35784 0.00 0 12 1200 13255 0.01 2352 0.13 13255 0.00 8929 0.01
3 Lower Mean 13 27 28 57
1400 2000
0.4 18042 36820
0.01 0.00
5535 21176
0.05 0.01
0.0 18042 36820
0.00 0.00
13459 31670
0.01 0.00
58 117 2200 44552 0.00 28313 0.01 44552 0.00 39328 0.00 0 12 1500 20711 0.01 7693 0.04 20711 0.00 16038 0.00
Mean Mean 13 27 28 57
1700 2200
0.2 26602 44552
0.01 0.00
12520 28045
0.02 0.01
0.0 26602 44552
0.00 0.00
21773 39305
0.00 0.00
58 117 2500 57531 0.00 40151 0.01 57531 0.00 52057 0.00 0 12 1200 13255 0.02 587 0.85 13255 0.01 4494 0.03
Lower Lower 13 27 28 57
1400 2000
2.8 18042 36820
0.02 0.01
798 7823
0.63 0.06
0.1 18042 36820
0.00 0.00
8093 23879
0.02 0.01
58 117 2200 44552 0.01 12850 0.04 44552 0.00 31194 0.00 0 12 1200 13255 0.02 818 0.61 13255 0.01 7082 0.02
5 Lower Mean 13 27 28 57
1400 2000
1.6 18042 36820
0.02 0.01
2208 14626
0.23 0.03
0.1 18042 36820
0.00 0.00
11217 28954
0.01 0.00
58 117 2200 44552 0.01 21503 0.02 44552 0.00 36521 0.00 0 12 1500 20711 0.01 3326 0.15 20711 0.00 13629 0.01
Mean Mean 13 27 28 57
1700 2200
0.5 26602 44552
0.01 0.01
6381 21057
0.08 0.02
0.1 26602 44552
0.00 0.00
19079 36509
0.01 0.00
58 117 2500 57531 0.00 32481 0.01 57531 0.00 49051 0.00 0 12 1200 13255 0.03 587 1.19 13255 0.01 2879 0.06
Lower Lower 13 27 28 57
1400 2000
4.4 18042 36820
0.02 0.01
798 4199
0.88 0.17
0.2 18042 36820
0.01 0.00
6013 20760
0.03 0.01
58 117 2200 44552 0.01 7666 0.09 44552 0.00 27242 0.01 0 12 1200 13255 0.03 818 0.86 13255 0.01 5421 0.03
7 Lower Mean 13 27 28 57
1400 2000
2.9 18042 36820
0.02 0.01
1114 8721
0.63 0.08
0.1 18042 36820
0.01 0.00
9476 26333
0.02 0.01
58 117 2200 44552 0.01 15476 0.04 44552 0.00 33784 0.01 0 12 1500 20711 0.02 1587 0.44 20711 0.00 11693 0.01
Mean Mean 13 27 28 57
1700 2200
1.3 26602 44552
0.02 0.01
3717 14951
0.19 0.05
0.1 26602 44552
0.00 0.00
16906 33739
0.01 0.01
58 117 2500 57531 0.01 26038 0.03 57531 0.00 46352 0.00 Notes: 1. Assume 120 ft thick Alluvium layer 2. Assume that upper 3 ft of Alluvium will be removed for mat thickness (120 3 = 117 total feet of alluvium) 3. Assume Poisson's ratio of Alluvium = 0.3 4. Assume unit weight of soil = 114 pcf 5. Mat dimensions, B = 300 ft, L = 400 ft 6. G/Gmax for Seed and Idriss (1970) curve assumed constant for strains > 1% 7. Iterate strains until difference < 0.001%
Title: Supplemental Soils Report Document Identifier: 100S0CCY000010000000E Page: B46
APPENDIX B – BEARING CAPACITY AND SETTLEMENT
B7 Results and Conclusion The following figures and table summarize the results of the bearing capacity and settlement analyses contained herein:
Figure Descpription
B71 Allowable foundation pressure for square and strip footings on alluvium vs. foundation width and foundation embedment (1inch design settlement).
B72 Allowable foundation pressure for square and strip footings on alluvium vs. foundation width and foundation embedment (½inch design settlement).
B73 Immediate settlements for different widths of square and strip footings on alluvium vs. foundation pressure (df = 2 ft).
B74 Immediate settlements for different widths of square and strip footings on alluvium vs. foundation pressure (df = 6 ft).
B75 Longterm settlements for square and strip footings with different depths of foundation embedment.
B76 Elastic settlement of mat foundation (3 ksf vertical load).
B77 Elastic settlement of mat foundation (5 ksf vertical load).
B78 Elastic settlement of mat foundation (7 ksf vertical load).
Table Description
B71 Results of elastic settlement of 400’ × 300’ mat foundation analyses
Title: Supplemental Soils Report Document Identifier: 100S0CCY000010000000E Page: B47
APPENDIX B – BEARING CAPACITY AND SETTLEMENT
Figures B71 through B74 pertain to bearing capacity and immediate settlement calculations for shallow square and strip footings. For these figures, the results from the Schmertmann method are used since more data (shear wave velocity) is available for this method. The Burland and Burbidge (Terzaghi et al. 1996) method, which is based on blow counts, was not considered reliable. Few blow counts were recorded at the site and due to the high gravel content of the alluvium, are not representative of the more compressible matrix material.
Figure B75 presents the longterm settlements evaluation for square and strip footings using the Burland and Burbidge (Terzaghi et al. 1996) method.
Figures B76 to B78 show the variation with depth of percent of total settlement and percent strain for elastic settlements in the center and corner of a mat foundation. A summary of the predicted total and maximum differential elastic settlements (center and corner of mat foundation) is shown in Table B61. The predicted settlements are considered to be very conservative due to the assumption that Young’s modulus degrades the same as the shear modulus for sands (alluvium). In actuality, the predicted settlements should be less. Additionally, for the elastic settlement analyses, the stiffness of the mat foundation is not considered to redistribute the loads.
The results of the analyses contained herein appear reasonable for the design of foundations for the expected loading at the Yucca Mountain Project.
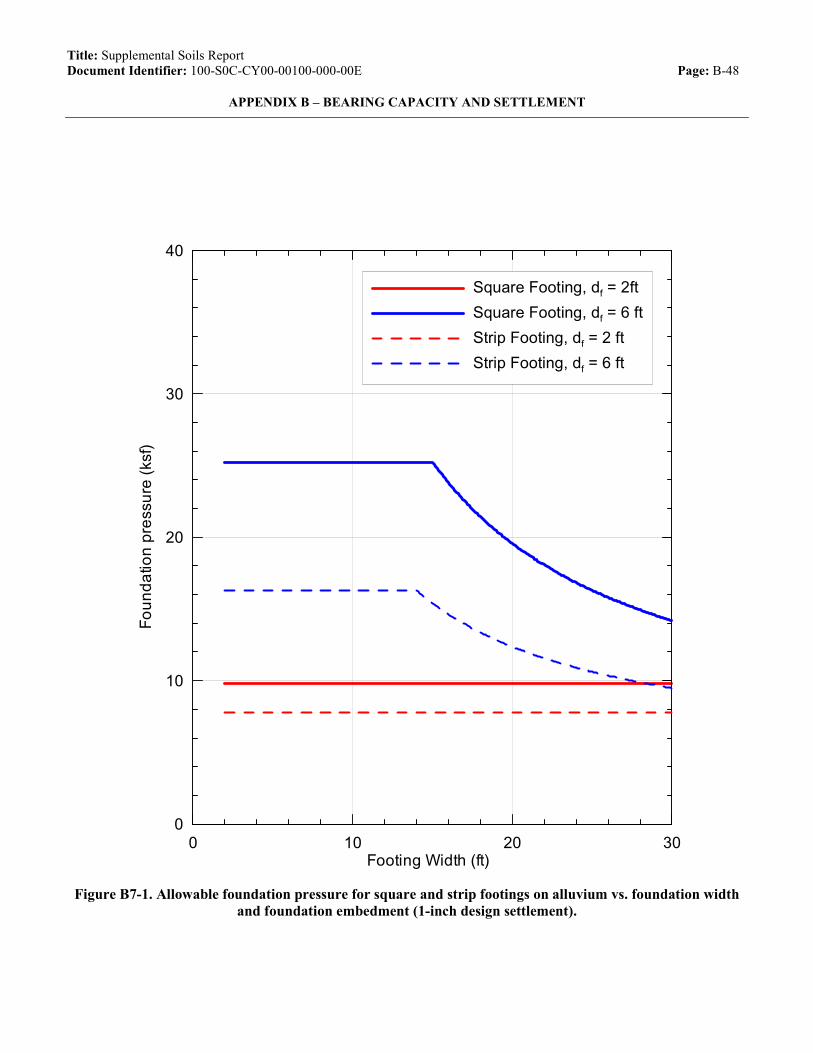
40
30
20
10
0 0 10 20 30
Footing Width (ft)
Square Footing, df = 2ft Square Footing, df = 6 ft Strip Footing, df = 2 ft Strip Footing, df = 6 ft
Fo
un
da
tio
n
pre
ss
ure
(ks
f)
Title: Supplemental Soils Report Document Identifier: 100S0CCY000010000000E Page: B48
APPENDIX B – BEARING CAPACITY AND SETTLEMENT
Figure B71. Allowable foundation pressure for square and strip footings on alluvium vs. foundation width and foundation embedment (1inch design settlement).
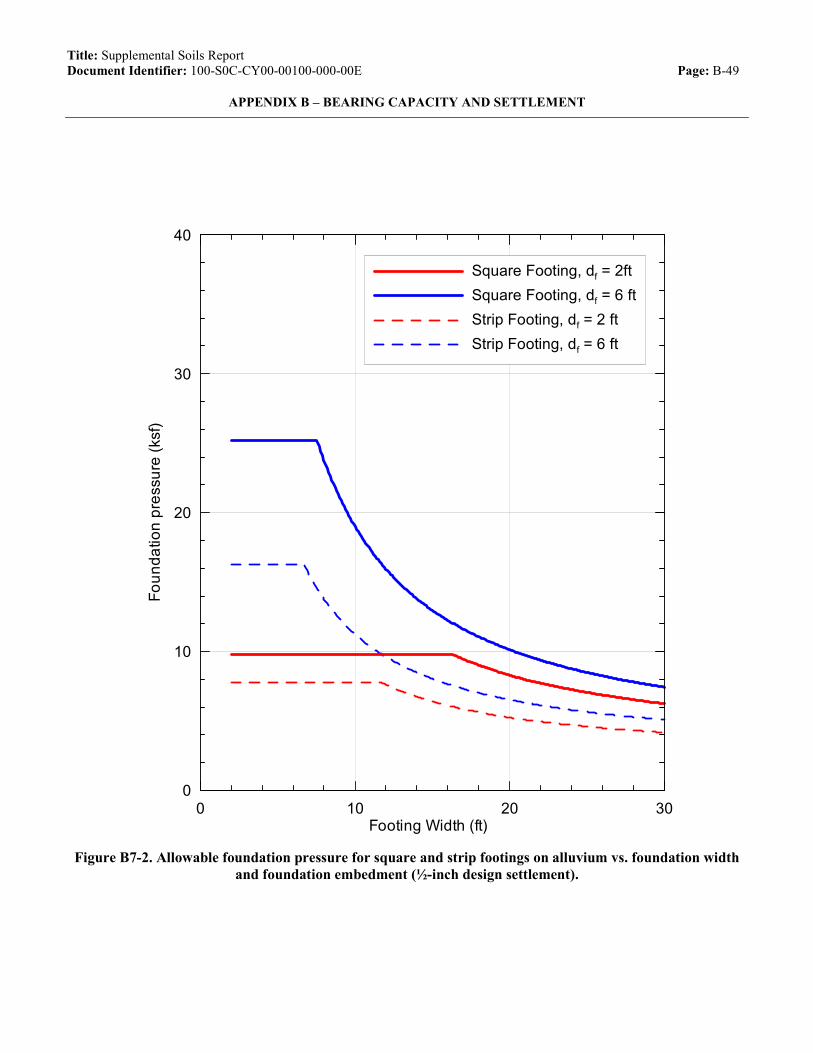
40
30
20
10
0 0 10 20 30
Footing Width (ft)
Square Footing, df = 2ft Square Footing, df = 6 ft Strip Footing, df = 2 ft Strip Footing, df = 6 ft
Fo
un
da
tio
n
pre
ss
ure
(ks
f)
Title: Supplemental Soils Report Document Identifier: 100S0CCY000010000000E Page: B49
APPENDIX B – BEARING CAPACITY AND SETTLEMENT
Figure B72. Allowable foundation pressure for square and strip footings on alluvium vs. foundation width and foundation embedment (½inch design settlement).
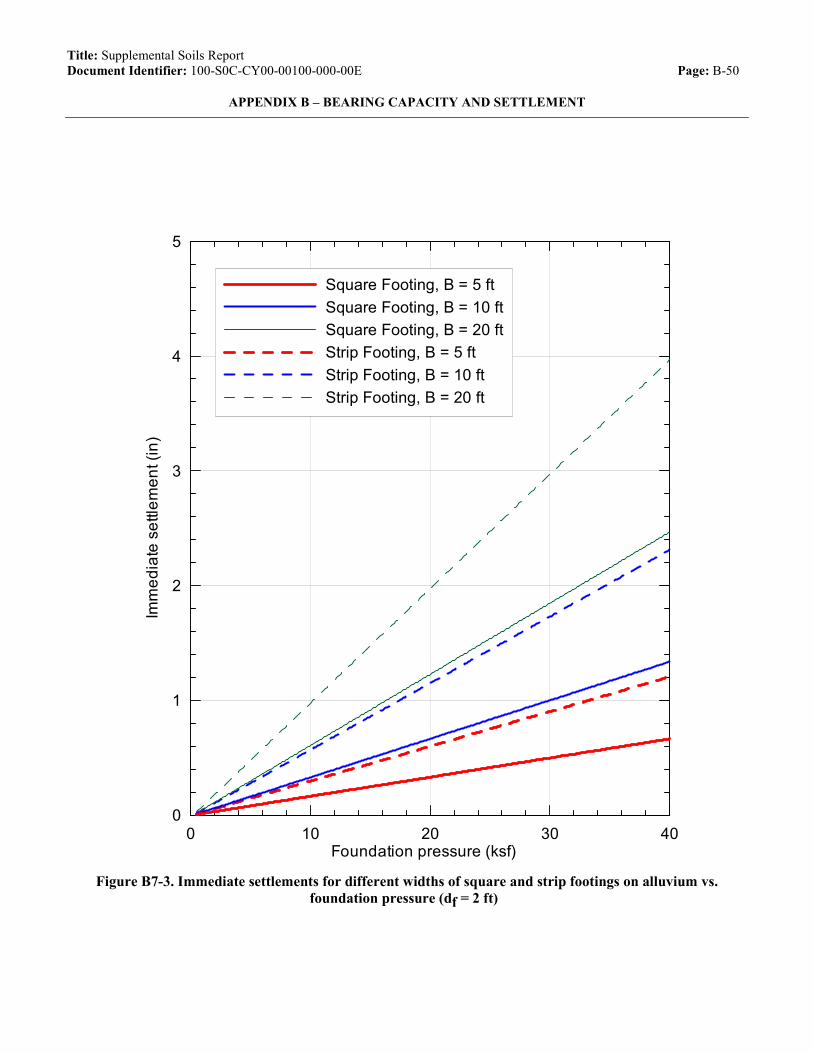
5
Square Footing, B = 5 ft Square Footing, B = 10 ft Square Footing, B = 20 ft
4 Strip Footing, B = 5 ft Strip Footing, B = 10 ft Strip Footing, B = 20 ft
3
Imm
ed
iate
se
ttle
me
nt (
in)
2
1
0 0 10 20 30 40
Foundation pressure (ksf)
Title: Supplemental Soils Report Document Identifier: 100S0CCY000010000000E Page: B50
APPENDIX B – BEARING CAPACITY AND SETTLEMENT
Figure B73. Immediate settlements for different widths of square and strip footings on alluvium vs. foundation pressure (df = 2 ft)
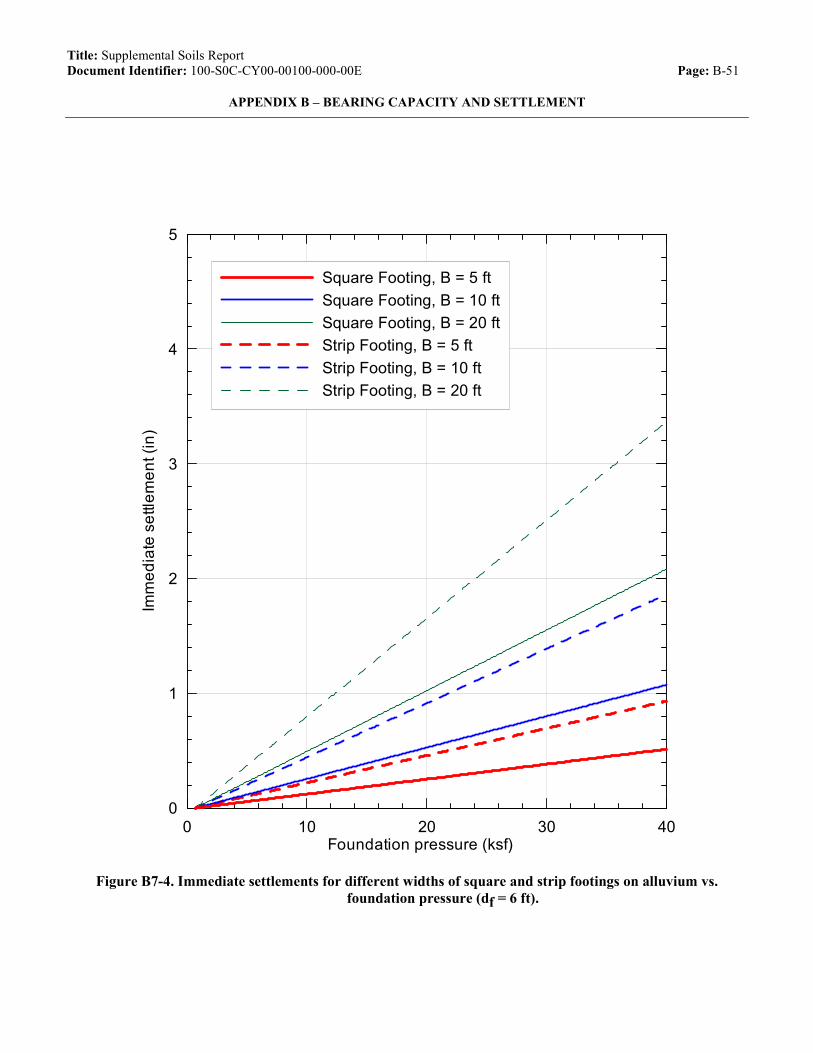
5
Square Footing, B = 5 ft Square Footing, B = 10 ft Square Footing, B = 20 ft
4 Strip Footing, B = 5 ft Strip Footing, B = 10 ft Strip Footing, B = 20 ft
3
Imm
ed
iate
se
ttle
me
nt (
in)
2
1
0 0 10 20 30 40
Foundation pressure (ksf)
Title: Supplemental Soils Report Document Identifier: 100S0CCY000010000000E Page: B51
APPENDIX B – BEARING CAPACITY AND SETTLEMENT
Figure B74. Immediate settlements for different widths of square and strip footings on alluvium vs. foundation pressure (df = 6 ft).
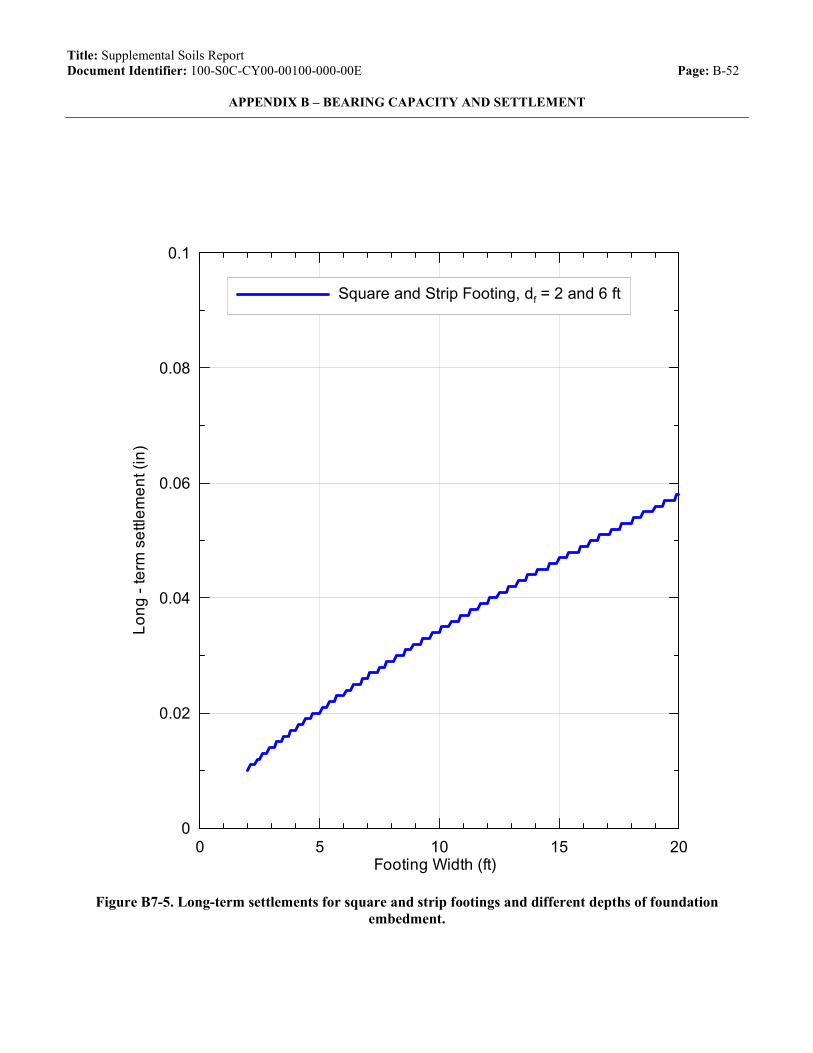
0.1
Square and Strip Footing, df = 2 and 6 ft
0.08
0.06
0.04
0.02
0
Lo
ng
te
rm
se
ttle
me
nt (
in)
0 5 10 15 20 Footing Width (ft)
Title: Supplemental Soils Report Document Identifier: 100S0CCY000010000000E Page: B52
APPENDIX B – BEARING CAPACITY AND SETTLEMENT
Figure B75. Longterm settlements for square and strip footings and different depths of foundation embedment.
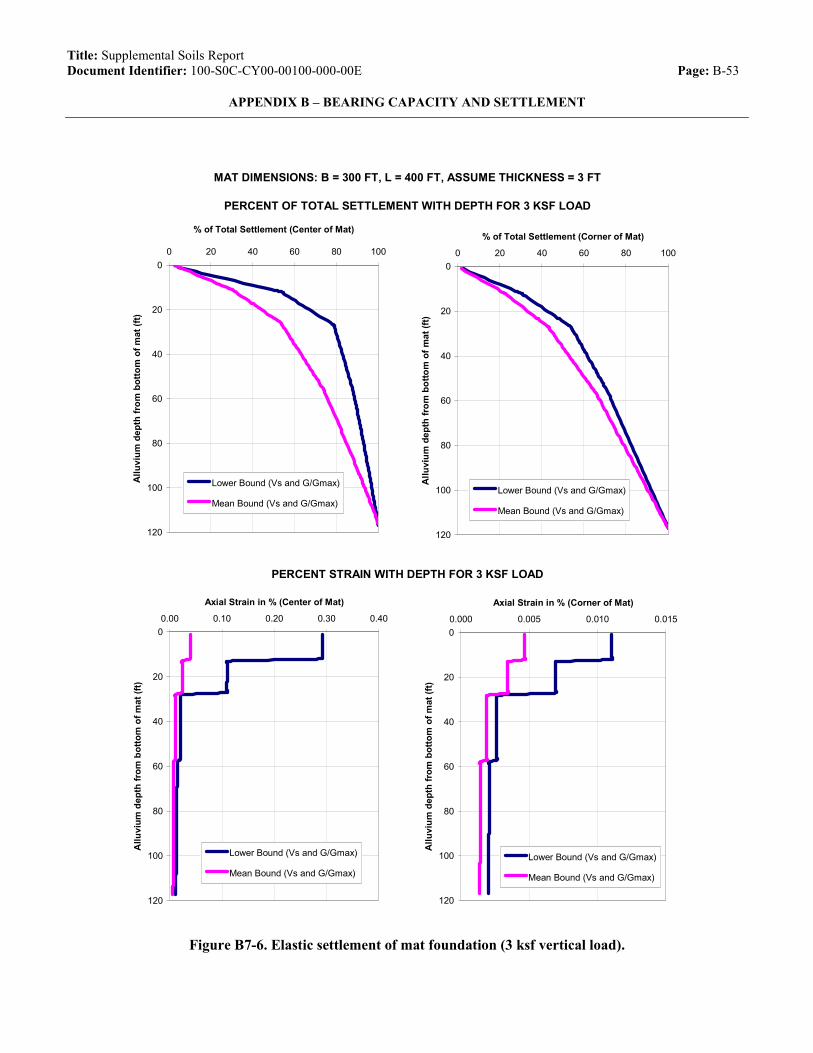
MAT DIMENSIONS: B = 300 FT, L = 400 FT, ASSUME THICKNESS = 3 FT
PERCENT OF TOTAL SETTLEMENT WITH DEPTH FOR 3 KSF LOAD
% of Total Settlement (Center of Mat) % of Total Settlement (Corner of Mat)
0 20 40 60 80 100 0 20 40 60 80 100 0 0
20 20
Lower Bound (Vs and G/Gmax)
Mean Bound (Vs and G/Gmax)
Lower Bound (Vs and G/Gmax)
Mean Bound (Vs and G/Gmax)
Alluvium
depth
from
bottom
of m
at (ft)
Alluvium
depth
from
bottom
of m
at (ft)
Alluvium
depth
from
bottom
of m
at (ft)
40 40
60 60
80 80
100 100
120 120
PERCENT STRAIN WITH DEPTH FOR 3 KSF LOAD
Axial Strain in % (Center of Mat) Axial Strain in % (Corner of Mat)
0.00 0.10 0.20 0.30 0.40 0.000 0.005 0.010 0.015 0 0
20 20
Lower Bound (Vs and G/Gmax)
Mean Bound (Vs and G/Gmax)
Lower Bound (Vs and G/Gmax)
Mean Bound (Vs and G/Gmax)
Alluvium
depth
from
bottom
of m
at (ft)
40 40
60 60
80 80
100 100
120 120
Title: Supplemental Soils Report Document Identifier: 100S0CCY000010000000E Page: B53
APPENDIX B – BEARING CAPACITY AND SETTLEMENT
Figure B76. Elastic settlement of mat foundation (3 ksf vertical load).
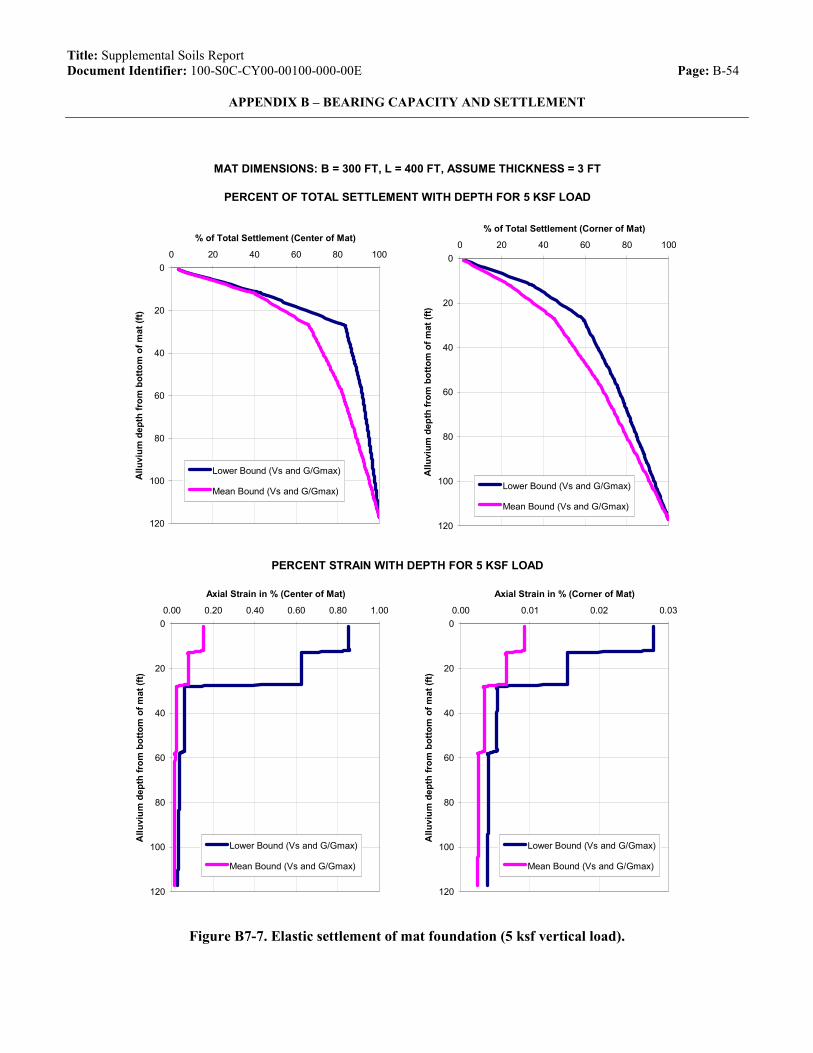
MAT DIMENSIONS: B = 300 FT, L = 400 FT, ASSUME THICKNESS = 3 FT
PERCENT OF TOTAL SETTLEMENT WITH DEPTH FOR 5 KSF LOAD
% of Total Settlement (Corner of Mat) % of Total Settlement (Center of Mat)
0 20 40 60 80 100 0 20 40 60 80 100 0
0
20
Lower Bound (Vs and G/Gmax)
Mean Bound (Vs and G/Gmax)
Lower Bound (Vs and G/Gmax)
Mean Bound (Vs and G/Gmax)
Alluvium
depth
from
bottom
of m
at (ft) 20
Alluvium
depth
from
bottom
of m
at (ft)
Alluvium
depth
from
bottom
of m
at (ft)
40 40
60 60
80 80
100 100
120 120
PERCENT STRAIN WITH DEPTH FOR 5 KSF LOAD
Axial Strain in % (Center of Mat) Axial Strain in % (Corner of Mat)
0.00 0.20 0.40 0.60 0.80 1.00 0.00 0.01 0.02 0.03 0
Lower Bound (Vs and G/Gmax)
Mean Bound (Vs and G/Gmax)
0
20 20
Lower Bound (Vs and G/Gmax)
Mean Bound (Vs and G/Gmax)
Alluvium
depth
from
bottom
of m
at (ft)
40 40
60 60
80 80
100 100
120 120
Title: Supplemental Soils Report Document Identifier: 100S0CCY000010000000E Page: B54
APPENDIX B – BEARING CAPACITY AND SETTLEMENT
Figure B77. Elastic settlement of mat foundation (5 ksf vertical load).
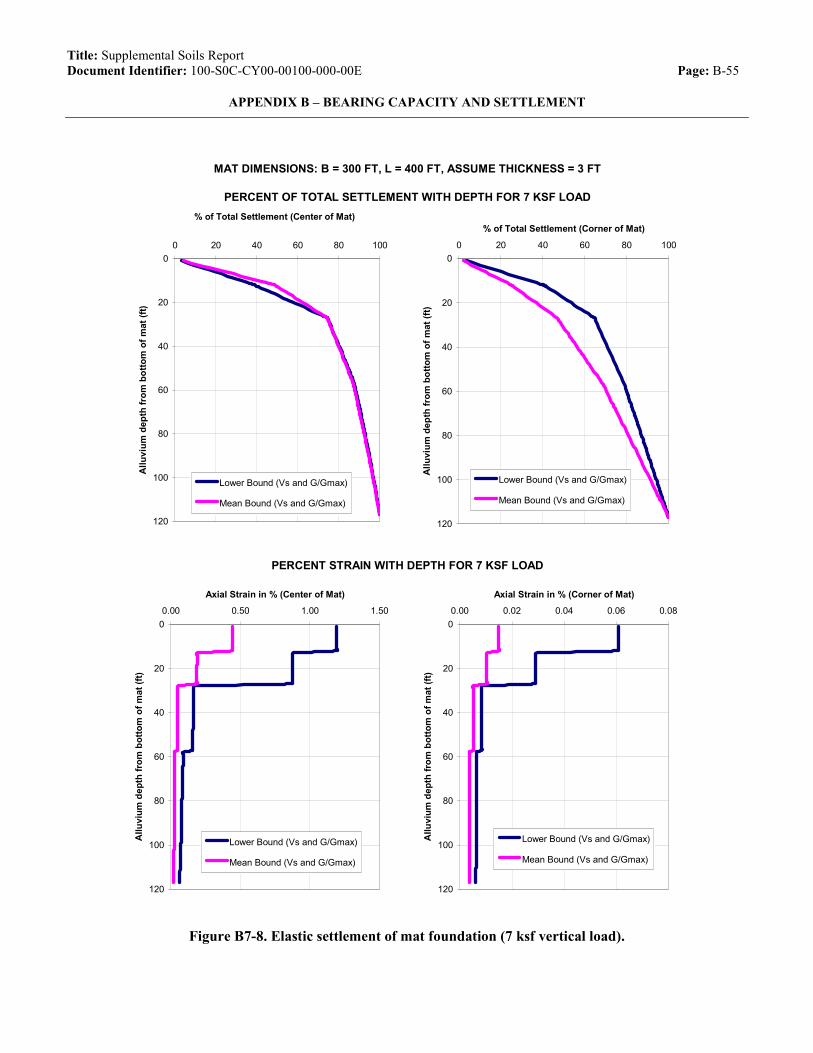
MAT DIMENSIONS: B = 300 FT, L = 400 FT, ASSUME THICKNESS = 3 FT
PERCENT OF TOTAL SETTLEMENT WITH DEPTH FOR 7 KSF LOAD
% of Total Settlement (Center of Mat) % of Total Settlement (Corner of Mat)
0 20 40 60 80 100 0 20 40 60 80 100
Lower Bound (Vs and G/Gmax)
Mean Bound (Vs and G/Gmax)
00
20 20
Lower Bound (Vs and G/Gmax)
Mean Bound (Vs and G/Gmax)
Alluvium
depth
from
bottom
of m
at (ft)
Alluvium
depth
from
bottom
of m
at (ft)
Alluvium
depth
from
bottom
of m
at (ft)
40 40
60 60
80 80
100 100
120 120
PERCENT STRAIN WITH DEPTH FOR 7 KSF LOAD
Axial Strain in % (Center of Mat) Axial Strain in % (Corner of Mat)
0.00 0.50 1.00 1.50 0.00 0.02 0.04 0.06 0.08 0 0
20 20
Lower Bound (Vs and G/Gmax)
Mean Bound (Vs and G/Gmax)
Lower Bound (Vs and G/Gmax)
Mean Bound (Vs and G/Gmax)
Alluvium
depth
from
bottom
of m
at (ft)
40
60
80
40
60
80
100 100
120 120
Title: Supplemental Soils Report Document Identifier: 100S0CCY000010000000E Page: B55
APPENDIX B – BEARING CAPACITY AND SETTLEMENT
Figure B78. Elastic settlement of mat foundation (7 ksf vertical load).
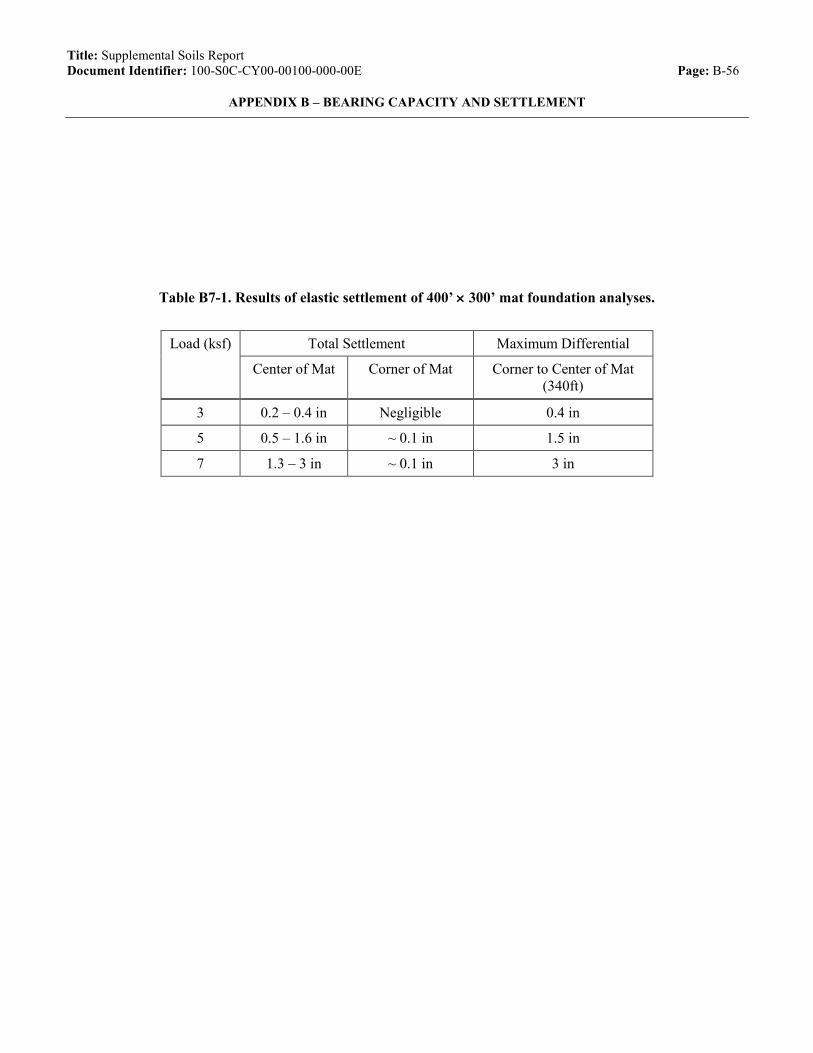
Title: Supplemental Soils Report Document Identifier: 100S0CCY000010000000E Page: B56
APPENDIX B – BEARING CAPACITY AND SETTLEMENT
Table B71. Results of elastic settlement of 400’ ×××× 300’ mat foundation analyses.
Load (ksf) Total Settlement Maximum Differential
Center of Mat Corner of Mat Corner to Center of Mat (340ft)
3 0.2 – 0.4 in Negligible 0.4 in
5 0.5 – 1.6 in ~ 0.1 in 1.5 in
7 1.3 – 3 in ~ 0.1 in 3 in
Title: Supplemental Soils Report Document Identifier: 100S0CCY000010000000E Page: C1
APPENDIX C – LATERAL EARTH PRESSURES AND RESISTANCE TO LATERAL LOADS
Appendix C Contents Page Number
C1 Objective...........................................................................................................................................C2
C2 Inputs ................................................................................................................................................C2
C3 Background ......................................................................................................................................C3
C4 Methodology.....................................................................................................................................C3 C4.1 Static lateral earth pressures ............................................................................................................................. C3
C4.2 Dynamic lateral earth pressures (yielding walls) ............................................................................................. C3
C4.3 Dynamic lateral earth pressures (nonyielding walls) ..................................................................................... C3
C4.4 Surcharge pressures ........................................................................................................................................... C3
C4.5 Compactioninduced pressures.......................................................................................................................... C3
C4.6 Temporary shoring pressure ............................................................................................................................. C4
C4.7 Resistance to lateral loads .................................................................................................................................. C4
C5 Assumptions .....................................................................................................................................C4
C6 Calculations ......................................................................................................................................C4 C6.1 Static lateral earth pressures ............................................................................................................................. C4
C6.2 Dynamic Lateral Pressures ................................................................................................................................ C5
C6.3 Surcharge pressures ........................................................................................................................................... C7
C6.4 CompactionInduced Pressures......................................................................................................................... C7
C6.5 Temporary Shoring Pressure ............................................................................................................................ C8
C6.6 Resistance to Lateral Loads ............................................................................................................................... C8 C6.6.1 Passive Pressures .................................................................................................................................... C8 C6.6.2 Interface Friction Coefficient ................................................................................................................. C8
C7 Results / Conclusions .......................................................................................................................C9 C7.1 Lateral Earth Pressures on Yielding Walls:..................................................................................................... C9
C7.2 Lateral Earth Pressures on NonYielding Walls............................................................................................ C12
C7.3 Temporary Shoring Pressure .......................................................................................................................... C18
C7.4 Resistance to Lateral Loads ............................................................................................................................. C18
C8 MathCad Worksheets....................................................................................................................C18
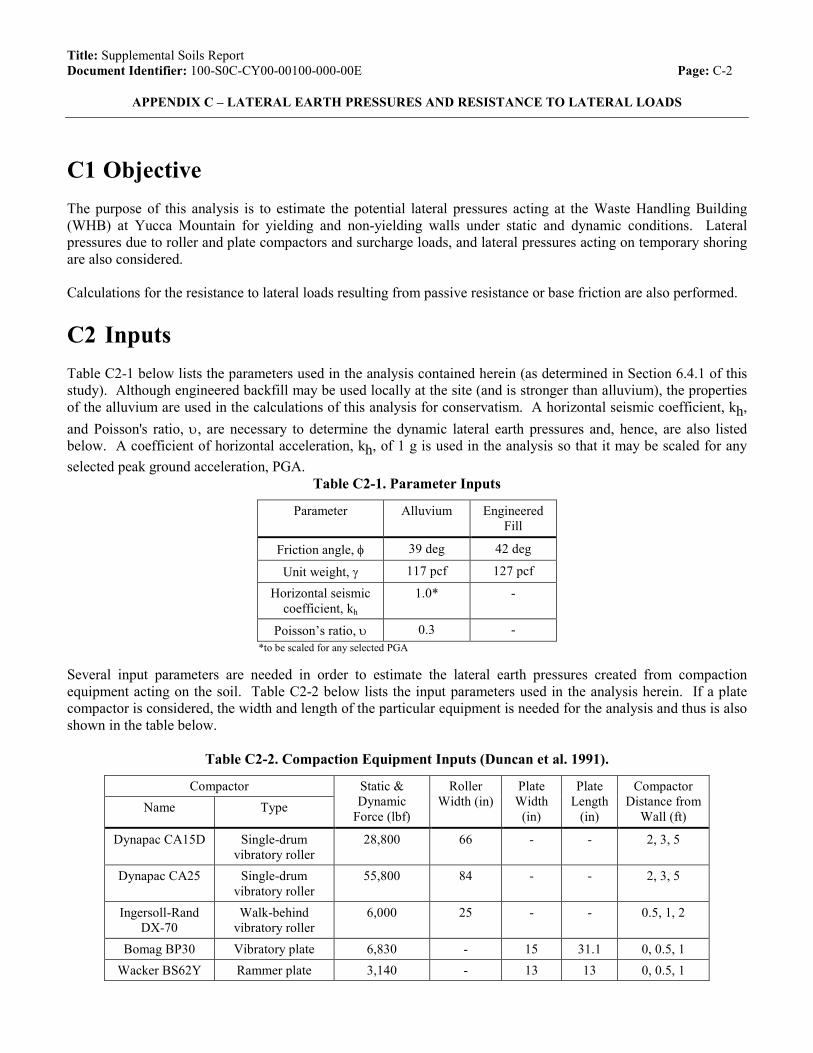
Title: Supplemental Soils Report Document Identifier: 100S0CCY000010000000E Page: C2
APPENDIX C – LATERAL EARTH PRESSURES AND RESISTANCE TO LATERAL LOADS
C1 Objective The purpose of this analysis is to estimate the potential lateral pressures acting at the Waste Handling Building (WHB) at Yucca Mountain for yielding and nonyielding walls under static and dynamic conditions. Lateral pressures due to roller and plate compactors and surcharge loads, and lateral pressures acting on temporary shoring are also considered.
Calculations for the resistance to lateral loads resulting from passive resistance or base friction are also performed.
C2 Inputs Table C21 below lists the parameters used in the analysis contained herein (as determined in Section 6.4.1 of this study). Although engineered backfill may be used locally at the site (and is stronger than alluvium), the properties of the alluvium are used in the calculations of this analysis for conservatism. A horizontal seismic coefficient, kh, and Poisson's ratio, υ, are necessary to determine the dynamic lateral earth pressures and, hence, are also listed below. A coefficient of horizontal acceleration, kh, of 1 g is used in the analysis so that it may be scaled for any selected peak ground acceleration, PGA.
Table C21. Parameter Inputs
Parameter Alluvium Engineered Fill
Friction angle, φ 39 deg 42 deg
Unit weight, γ 117 pcf 127 pcf
Horizontal seismic coefficient, kh
1.0*
Poisson’s ratio, υ 0.3
*to be scaled for any selected PGA
Several input parameters are needed in order to estimate the lateral earth pressures created from compaction equipment acting on the soil. Table C22 below lists the input parameters used in the analysis herein. If a plate compactor is considered, the width and length of the particular equipment is needed for the analysis and thus is also shown in the table below.
Table C22. Compaction Equipment Inputs (Duncan et al. 1991).
Compactor Static & Dynamic Force (lbf)
Roller Width (in)
Plate Width (in)
Plate Length (in)
Compactor Distance from Wall (ft)
Name Type
Dynapac CA15D Singledrum vibratory roller
28,800 66 2, 3, 5
Dynapac CA25 Singledrum vibratory roller
55,800 84 2, 3, 5
IngersollRand DX70
Walkbehind vibratory roller
6,000 25 0.5, 1, 2
Bomag BP30 Vibratory plate 6,830 15 31.1 0, 0.5, 1 Wacker BS62Y Rammer plate 3,140 13 13 0, 0.5, 1
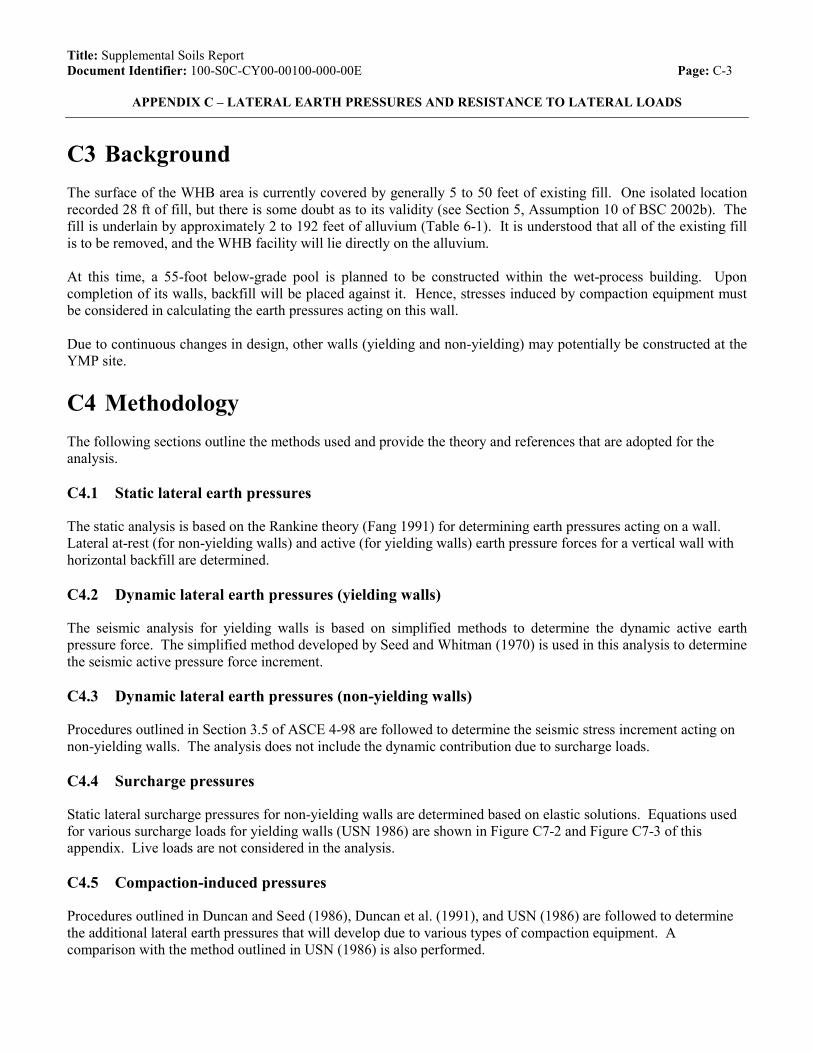
Title: Supplemental Soils Report Document Identifier: 100S0CCY000010000000E Page: C3
APPENDIX C – LATERAL EARTH PRESSURES AND RESISTANCE TO LATERAL LOADS
C3 Background The surface of the WHB area is currently covered by generally 5 to 50 feet of existing fill. One isolated location recorded 28 ft of fill, but there is some doubt as to its validity (see Section 5, Assumption 10 of BSC 2002b). The fill is underlain by approximately 2 to 192 feet of alluvium (Table 61). It is understood that all of the existing fill is to be removed, and the WHB facility will lie directly on the alluvium.
At this time, a 55foot belowgrade pool is planned to be constructed within the wetprocess building. Upon completion of its walls, backfill will be placed against it. Hence, stresses induced by compaction equipment must be considered in calculating the earth pressures acting on this wall.
Due to continuous changes in design, other walls (yielding and nonyielding) may potentially be constructed at the YMP site.
C4 Methodology The following sections outline the methods used and provide the theory and references that are adopted for the analysis.
C4.1 Static lateral earth pressures
The static analysis is based on the Rankine theory (Fang 1991) for determining earth pressures acting on a wall. Lateral atrest (for nonyielding walls) and active (for yielding walls) earth pressure forces for a vertical wall with horizontal backfill are determined.
C4.2 Dynamic lateral earth pressures (yielding walls)
The seismic analysis for yielding walls is based on simplified methods to determine the dynamic active earth pressure force. The simplified method developed by Seed and Whitman (1970) is used in this analysis to determine the seismic active pressure force increment.
C4.3 Dynamic lateral earth pressures (nonyielding walls)
Procedures outlined in Section 3.5 of ASCE 498 are followed to determine the seismic stress increment acting on nonyielding walls. The analysis does not include the dynamic contribution due to surcharge loads.
C4.4 Surcharge pressures
Static lateral surcharge pressures for nonyielding walls are determined based on elastic solutions. Equations used for various surcharge loads for yielding walls (USN 1986) are shown in Figure C72 and Figure C73 of this appendix. Live loads are not considered in the analysis.
C4.5 Compactioninduced pressures
Procedures outlined in Duncan and Seed (1986), Duncan et al. (1991), and USN (1986) are followed to determine the additional lateral earth pressures that will develop due to various types of compaction equipment. A comparison with the method outlined in USN (1986) is also performed.
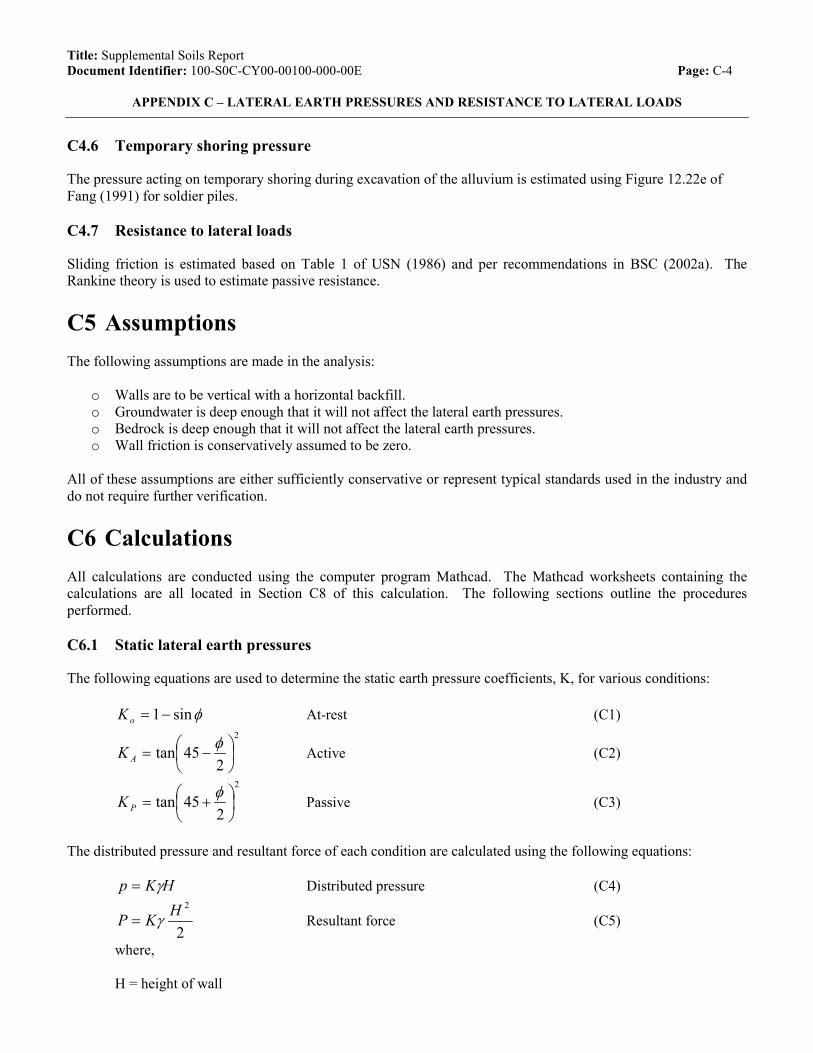
Title: Supplemental Soils Report Document Identifier: 100S0CCY000010000000E Page: C4
APPENDIX C – LATERAL EARTH PRESSURES AND RESISTANCE TO LATERAL LOADS
C4.6 Temporary shoring pressure
The pressure acting on temporary shoring during excavation of the alluvium is estimated using Figure 12.22e of Fang (1991) for soldier piles.
C4.7 Resistance to lateral loads
Sliding friction is estimated based on Table 1 of USN (1986) and per recommendations in BSC (2002a). The Rankine theory is used to estimate passive resistance.
C5 Assumptions The following assumptions are made in the analysis:
o Walls are to be vertical with a horizontal backfill. o Groundwater is deep enough that it will not affect the lateral earth pressures. o Bedrock is deep enough that it will not affect the lateral earth pressures. o Wall friction is conservatively assumed to be zero.
All of these assumptions are either sufficiently conservative or represent typical standards used in the industry and do not require further verification.
C6 Calculations All calculations are conducted using the computer program Mathcad. The Mathcad worksheets containing the calculations are all located in Section C8 of this calculation. The following sections outline the procedures performed.
C6.1 Static lateral earth pressures
The following equations are used to determine the static earth pressure coefficients, K, for various conditions:
Ko = 1− sinφ Atrest (C1)
φ 2
KA = tan 45 − Active (C2) 2 � φ
2
K = tan 45 + Passive (C3) P 2
The distributed pressure and resultant force of each condition are calculated using the following equations:
p = KγH Distributed pressure (C4)
P = Kγ H 2
Resultant force (C5) 2
where,
H = height of wall
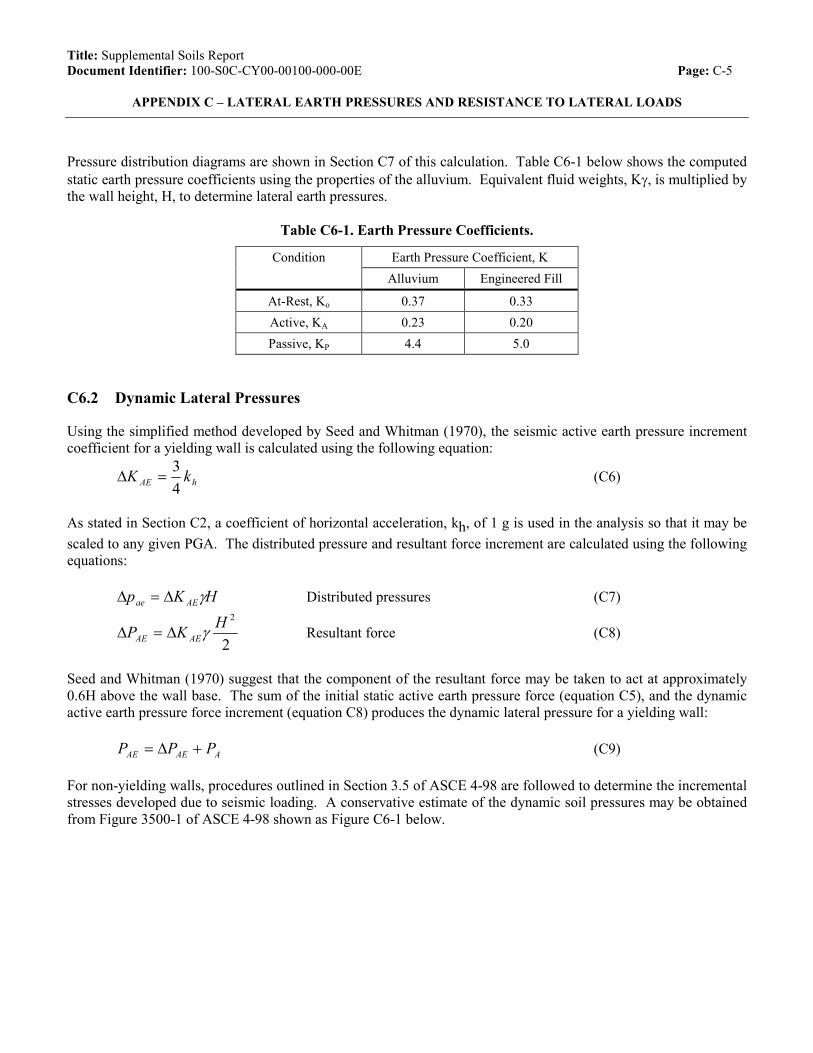
Title: Supplemental Soils Report Document Identifier: 100S0CCY000010000000E Page: C5
APPENDIX C – LATERAL EARTH PRESSURES AND RESISTANCE TO LATERAL LOADS
Pressure distribution diagrams are shown in Section C7 of this calculation. Table C61 below shows the computed static earth pressure coefficients using the properties of the alluvium. Equivalent fluid weights, Kγ, is multiplied by the wall height, H, to determine lateral earth pressures.
Table C61. Earth Pressure Coefficients.
Condition Earth Pressure Coefficient, K Alluvium Engineered Fill
AtRest, Ko 0.37 0.33 Active, KA 0.23 0.20 Passive, KP 4.4 5.0
C6.2 Dynamic Lateral Pressures
Using the simplified method developed by Seed and Whitman (1970), the seismic active earth pressure increment coefficient for a yielding wall is calculated using the following equation:
∆K AE = 3 kh (C6)
4
As stated in Section C2, a coefficient of horizontal acceleration, kh, of 1 g is used in the analysis so that it may be scaled to any given PGA. The distributed pressure and resultant force increment are calculated using the following equations:
∆p = ∆K γH Distributed pressures (C7) ae AE
∆P = ∆K γ H 2
Resultant force (C8) AE AE 2
Seed and Whitman (1970) suggest that the component of the resultant force may be taken to act at approximately 0.6H above the wall base. The sum of the initial static active earth pressure force (equation C5), and the dynamic active earth pressure force increment (equation C8) produces the dynamic lateral pressure for a yielding wall:
P = ∆P + P (C9) AE AE A
For nonyielding walls, procedures outlined in Section 3.5 of ASCE 498 are followed to determine the incremental stresses developed due to seismic loading. A conservative estimate of the dynamic soil pressures may be obtained from Figure 35001 of ASCE 498 shown as Figure C61 below.
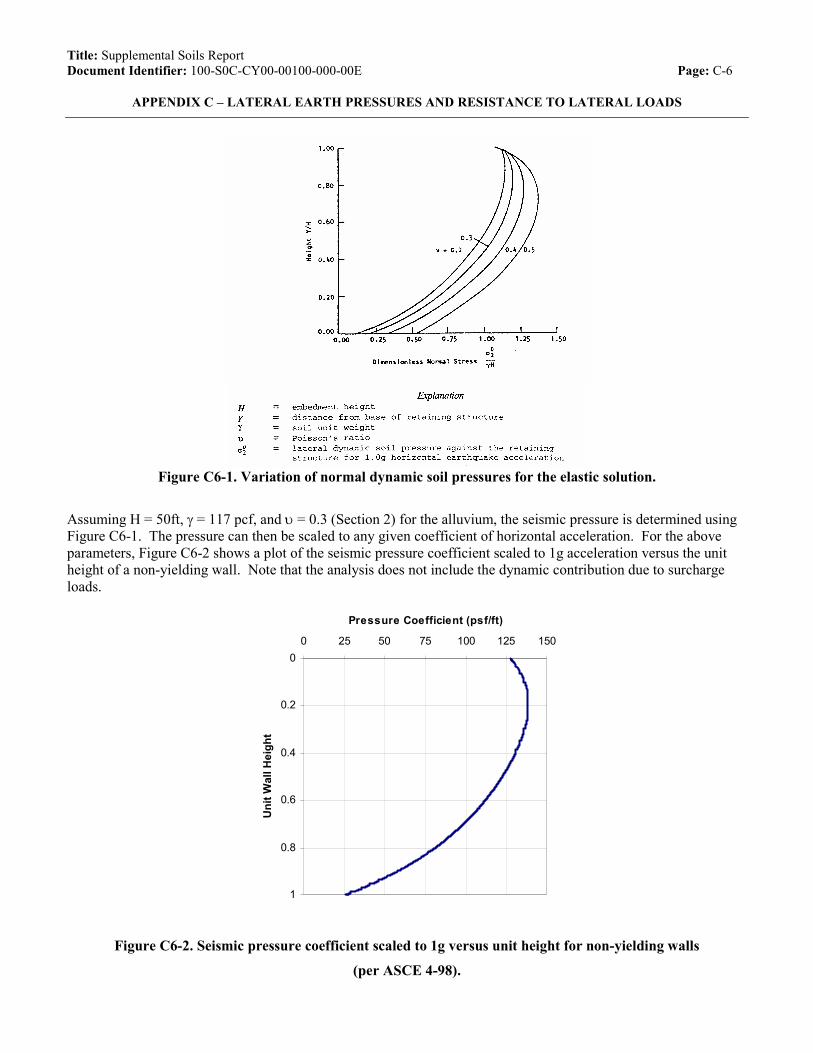
Pressure Coefficient (psf/ft)
0 25 50 75 100 125 150 0
0.2
0.4
0.6
0.8
1
Unit
Wall
Height
Title: Supplemental Soils Report Document Identifier: 100S0CCY000010000000E Page: C6
APPENDIX C – LATERAL EARTH PRESSURES AND RESISTANCE TO LATERAL LOADS
Figure C61. Variation of normal dynamic soil pressures for the elastic solution.
Assuming H = 50ft, γ = 117 pcf, and υ = 0.3 (Section 2) for the alluvium, the seismic pressure is determined using Figure C61. The pressure can then be scaled to any given coefficient of horizontal acceleration. For the above parameters, Figure C62 shows a plot of the seismic pressure coefficient scaled to 1g acceleration versus the unit height of a nonyielding wall. Note that the analysis does not include the dynamic contribution due to surcharge loads.
Figure C62. Seismic pressure coefficient scaled to 1g versus unit height for nonyielding walls
(per ASCE 498).
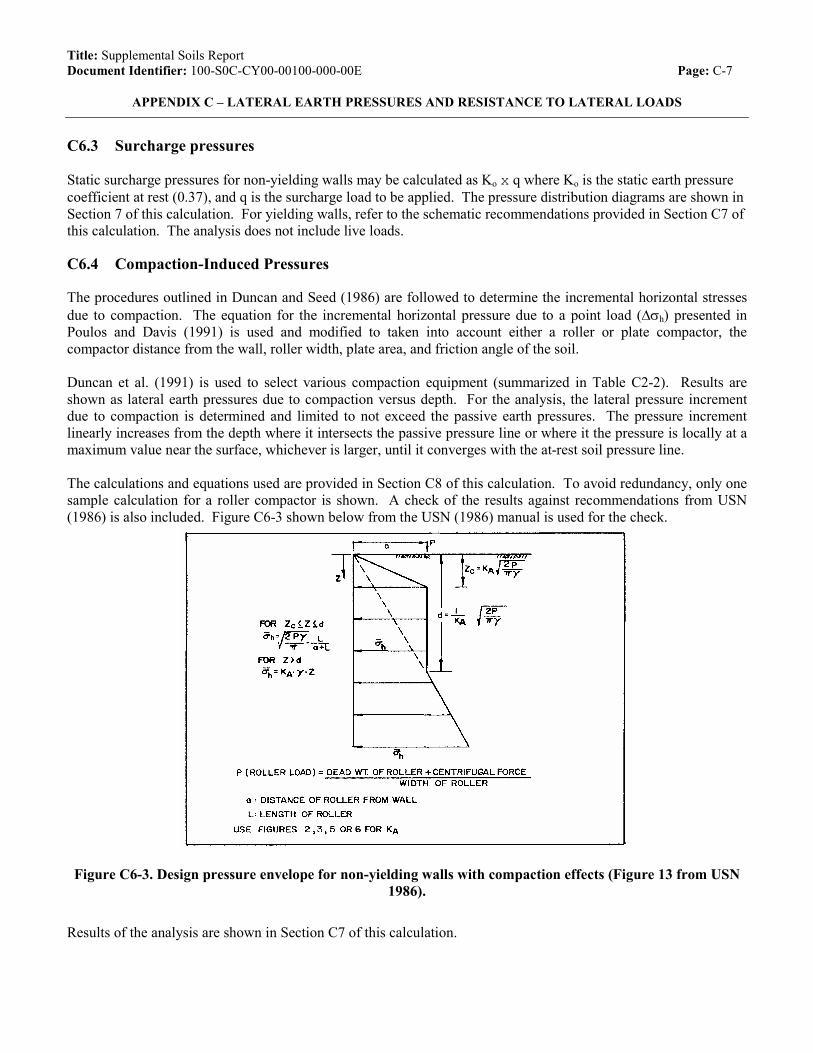
Title: Supplemental Soils Report Document Identifier: 100S0CCY000010000000E Page: C7
APPENDIX C – LATERAL EARTH PRESSURES AND RESISTANCE TO LATERAL LOADS
C6.3 Surcharge pressures
Static surcharge pressures for nonyielding walls may be calculated as Ko x q where Ko is the static earth pressure coefficient at rest (0.37), and q is the surcharge load to be applied. The pressure distribution diagrams are shown in Section 7 of this calculation. For yielding walls, refer to the schematic recommendations provided in Section C7 of this calculation. The analysis does not include live loads.
C6.4 CompactionInduced Pressures
The procedures outlined in Duncan and Seed (1986) are followed to determine the incremental horizontal stresses due to compaction. The equation for the incremental horizontal pressure due to a point load (∆σh) presented in Poulos and Davis (1991) is used and modified to taken into account either a roller or plate compactor, the compactor distance from the wall, roller width, plate area, and friction angle of the soil.
Duncan et al. (1991) is used to select various compaction equipment (summarized in Table C22). Results are shown as lateral earth pressures due to compaction versus depth. For the analysis, the lateral pressure increment due to compaction is determined and limited to not exceed the passive earth pressures. The pressure increment linearly increases from the depth where it intersects the passive pressure line or where it the pressure is locally at a maximum value near the surface, whichever is larger, until it converges with the atrest soil pressure line.
The calculations and equations used are provided in Section C8 of this calculation. To avoid redundancy, only one sample calculation for a roller compactor is shown. A check of the results against recommendations from USN (1986) is also included. Figure C63 shown below from the USN (1986) manual is used for the check.
Figure C63. Design pressure envelope for nonyielding walls with compaction effects (Figure 13 from USN 1986).
Results of the analysis are shown in Section C7 of this calculation.
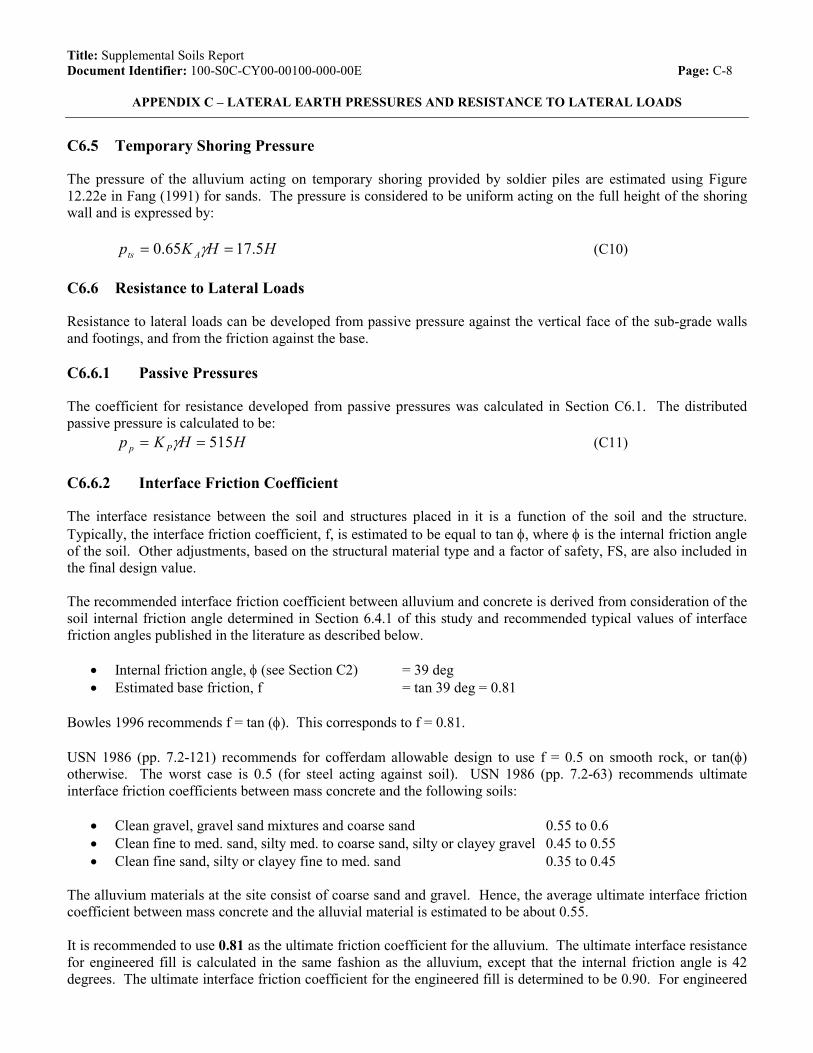
Title: Supplemental Soils Report Document Identifier: 100S0CCY000010000000E Page: C8
APPENDIX C – LATERAL EARTH PRESSURES AND RESISTANCE TO LATERAL LOADS
C6.5 Temporary Shoring Pressure
The pressure of the alluvium acting on temporary shoring provided by soldier piles are estimated using Figure 12.22e in Fang (1991) for sands. The pressure is considered to be uniform acting on the full height of the shoring wall and is expressed by:
pts = 0.65K AγH = 17.5H (C10)
C6.6 Resistance to Lateral Loads
Resistance to lateral loads can be developed from passive pressure against the vertical face of the subgrade walls and footings, and from the friction against the base.
C6.6.1 Passive Pressures
The coefficient for resistance developed from passive pressures was calculated in Section C6.1. The distributed passive pressure is calculated to be: pp = KPγH = 515H (C11)
C6.6.2 Interface Friction Coefficient
The interface resistance between the soil and structures placed in it is a function of the soil and the structure. Typically, the interface friction coefficient, f, is estimated to be equal to tan φ, where φ is the internal friction angle of the soil. Other adjustments, based on the structural material type and a factor of safety, FS, are also included in the final design value.
The recommended interface friction coefficient between alluvium and concrete is derived from consideration of the soil internal friction angle determined in Section 6.4.1 of this study and recommended typical values of interface friction angles published in the literature as described below.
• Internal friction angle, φ (see Section C2) = 39 deg • Estimated base friction, f = tan 39 deg = 0.81
Bowles 1996 recommends f = tan (φ). This corresponds to f = 0.81.
USN 1986 (pp. 7.2121) recommends for cofferdam allowable design to use f = 0.5 on smooth rock, or tan(φ) otherwise. The worst case is 0.5 (for steel acting against soil). USN 1986 (pp. 7.263) recommends ultimate interface friction coefficients between mass concrete and the following soils:
• Clean gravel, gravel sand mixtures and coarse sand 0.55 to 0.6
• Clean fine to med. sand, silty med. to coarse sand, silty or clayey gravel 0.45 to 0.55 • Clean fine sand, silty or clayey fine to med. sand 0.35 to 0.45
The alluvium materials at the site consist of coarse sand and gravel. Hence, the average ultimate interface friction coefficient between mass concrete and the alluvial material is estimated to be about 0.55.
It is recommended to use 0.81 as the ultimate friction coefficient for the alluvium. The ultimate interface resistance for engineered fill is calculated in the same fashion as the alluvium, except that the internal friction angle is 42 degrees. The ultimate interface friction coefficient for the engineered fill is determined to be 0.90. For engineered
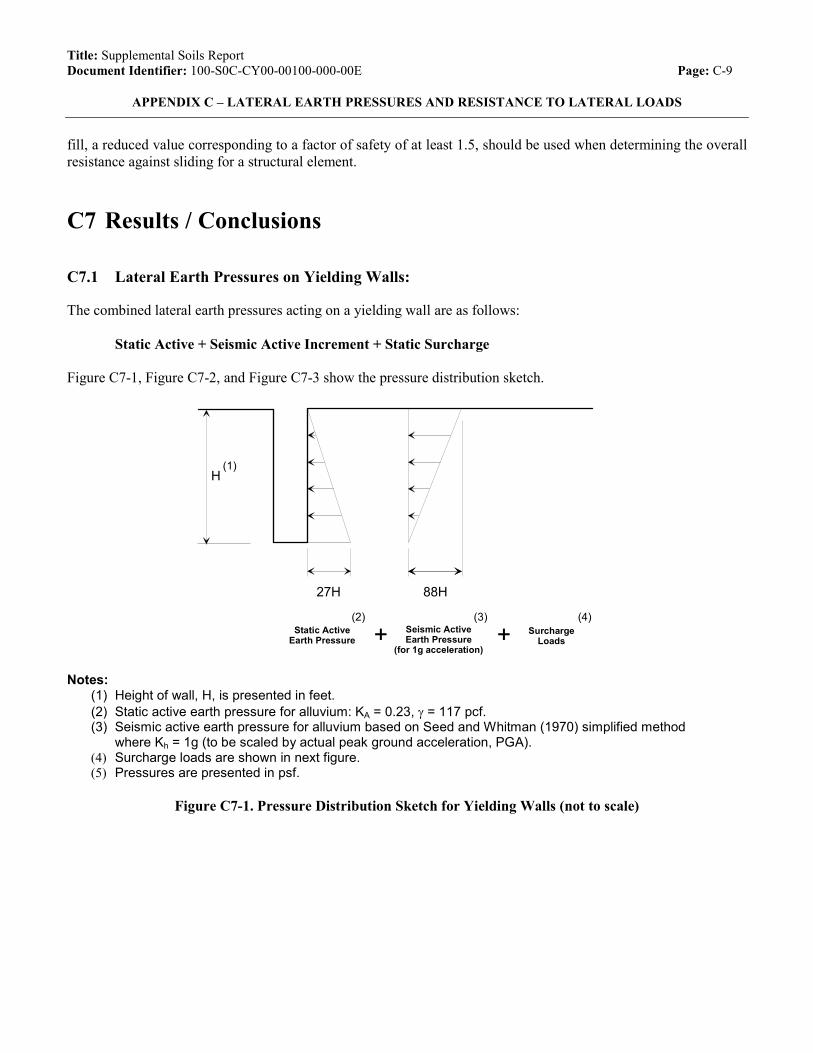
(1) H
27H 88H
(2) (3) (4) Static Active Earth Pressure + Seismic Active
Earth Pressure + Surcharge Loads
(for 1g acceleration)
Title: Supplemental Soils Report Document Identifier: 100S0CCY000010000000E Page: C9
APPENDIX C – LATERAL EARTH PRESSURES AND RESISTANCE TO LATERAL LOADS
fill, a reduced value corresponding to a factor of safety of at least 1.5, should be used when determining the overall resistance against sliding for a structural element.
C7 Results / Conclusions
C7.1 Lateral Earth Pressures on Yielding Walls:
The combined lateral earth pressures acting on a yielding wall are as follows:
Static Active + Seismic Active Increment + Static Surcharge
Figure C71, Figure C72, and Figure C73 show the pressure distribution sketch.
Notes: (1) Height of wall, H, is presented in feet. (2) Static active earth pressure for alluvium: KA = 0.23, γ = 117 pcf. (3) Seismic active earth pressure for alluvium based on Seed and Whitman (1970) simplified method
where Kh = 1g (to be scaled by actual peak ground acceleration, PGA). (4) Surcharge loads are shown in next figure. (5) Pressures are presented in psf.
Figure C71. Pressure Distribution Sketch for Yielding Walls (not to scale)
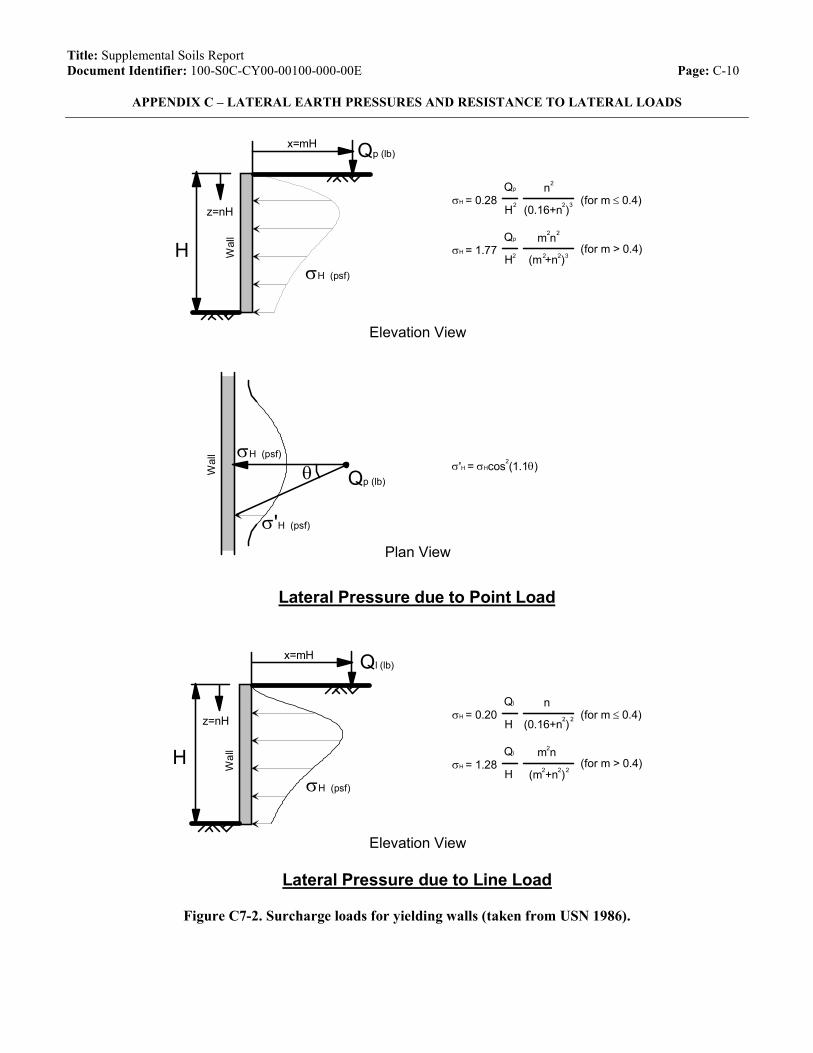
H
Qp (lb)
z=nH
x=mH
σH (psf)
Wall
Qp n2
σH = 0.28 (for m ≤ 0.4) 2 2 3
H (0.16+n )
2 2Qp m n
σH = 1.77 (for m > 0.4)2 2 2 3
H (m +n )
Elevation View
Wall
σ'H = σHcos (1.1θ) Qp (lb)
σH (psf)
σ'H
2
θ
(psf)
Plan View
Lateral Pressure due to Point Load
H
Ql (lb)
σH (psf)
z=nH
x=mH
Wall
Ql n σH = 0.20 2 2 (for m ≤ 0.4)
H (0.16+n )
2Ql m n (for m > 0.4)σH = 1.28
2 2 2H (m +n )
Elevation View
Lateral Pressure due to Line Load
Title: Supplemental Soils Report Document Identifier: 100S0CCY000010000000E Page: C10
APPENDIX C – LATERAL EARTH PRESSURES AND RESISTANCE TO LATERAL LOADS
Figure C72. Surcharge loads for yielding walls (taken from USN 1986).
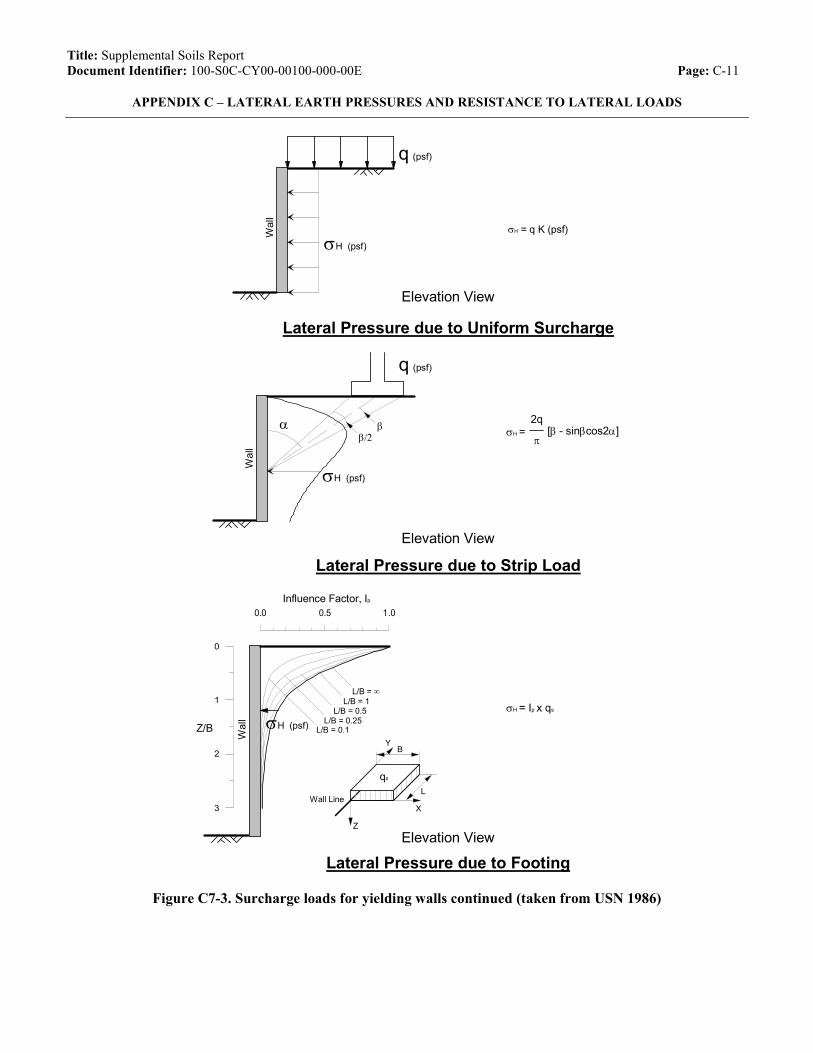
Wall
σH (psf)
q (psf)
σH = q K (psf)
Elevation View
Lateral Pressure due to Uniform Surcharge
q (psf)
σH
α
Wall
2q β σH = [β sinβcos2α]
β/2 π
(psf)
Elevation View
Lateral Pressure due to Strip Load
Influence Factor, Ip
0.0 0.5 1.0
3
2
1
0
L/B = 0.1 L/B = 0.25 L/B = 0.5 L/B = 1 L/B = ∞
Z/B
X
qs
Z
Wall Line
Y
L
B
Elevation View
σH = Ip x qs
Wall σH (psf)
Lateral Pressure due to Footing
Title: Supplemental Soils Report Document Identifier: 100S0CCY000010000000E Page: C11
APPENDIX C – LATERAL EARTH PRESSURES AND RESISTANCE TO LATERAL LOADS
Figure C73. Surcharge loads for yielding walls continued (taken from USN 1986)
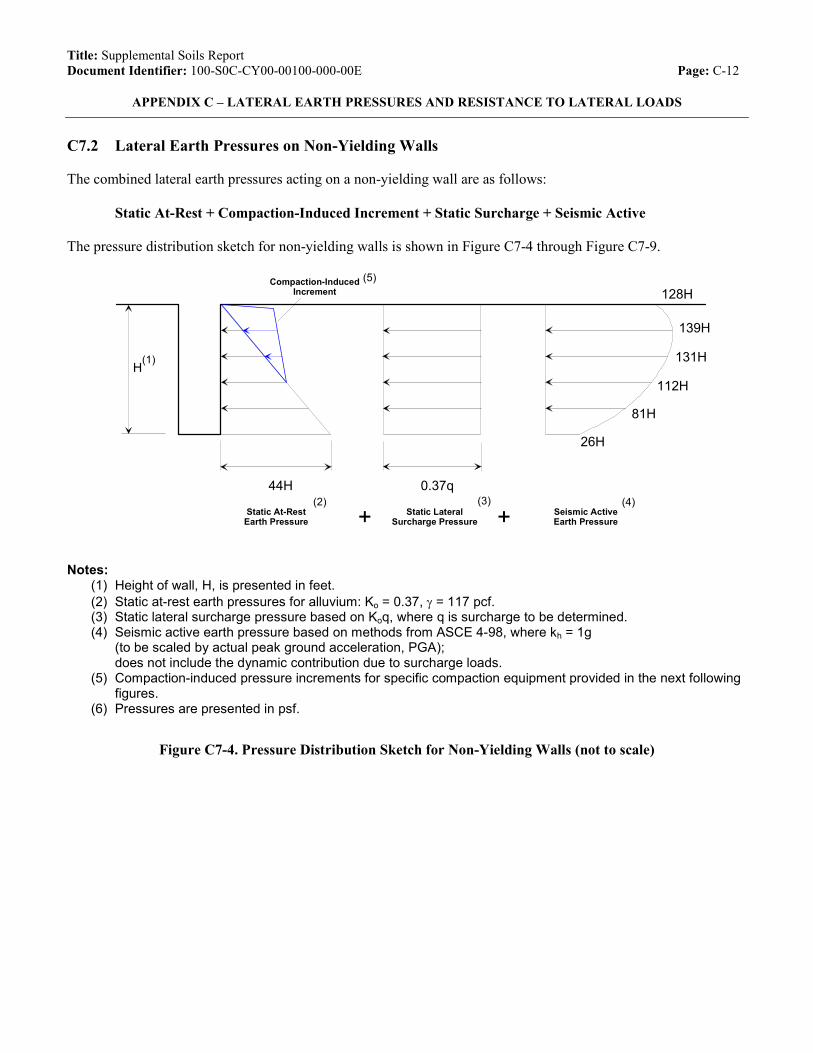
(5) CompactionInduced Increment 128H
139H
131H (1) H
112H
81H
26H
44H 0.37q (2) (3) (4)
Static AtRest Static Lateral Seismic Active Earth Pressure + Surcharge Pressure + Earth Pressure
Title: Supplemental Soils Report Document Identifier: 100S0CCY000010000000E Page: C12
APPENDIX C – LATERAL EARTH PRESSURES AND RESISTANCE TO LATERAL LOADS
C7.2 Lateral Earth Pressures on NonYielding Walls
The combined lateral earth pressures acting on a nonyielding wall are as follows:
Static AtRest + CompactionInduced Increment + Static Surcharge + Seismic Active
The pressure distribution sketch for nonyielding walls is shown in Figure C74 through Figure C79.
Notes: (1) Height of wall, H, is presented in feet. (2) Static atrest earth pressures for alluvium: Ko = 0.37, γ = 117 pcf. (3) Static lateral surcharge pressure based on Koq, where q is surcharge to be determined. (4) Seismic active earth pressure based on methods from ASCE 498, where kh = 1g
(to be scaled by actual peak ground acceleration, PGA); does not include the dynamic contribution due to surcharge loads.
(5) Compactioninduced pressure increments for specific compaction equipment provided in the next following figures.
(6) Pressures are presented in psf.
Figure C74. Pressure Distribution Sketch for NonYielding Walls (not to scale)
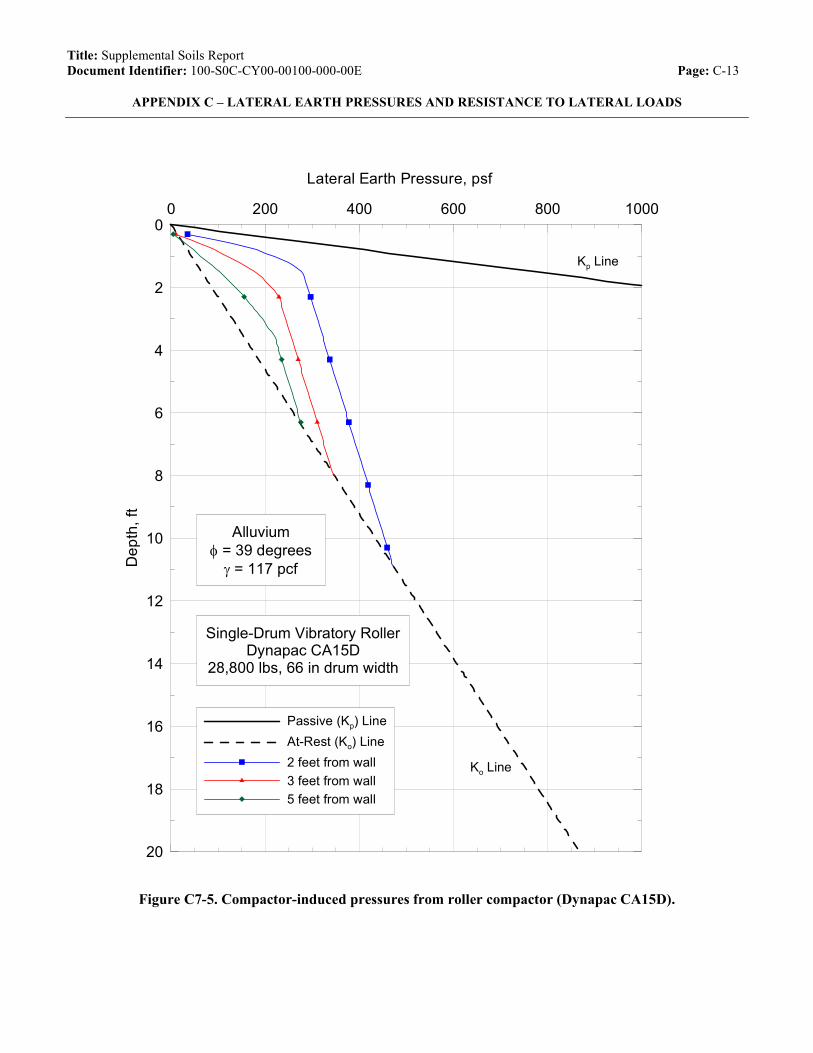
0 200 0
2
4
6
8
10
12
14
16
18
20
Lateral Earth Pressure, psf
400 600 800 1000
Passive (Kp) Line AtRest (Ko) Line 2 feet from wall 3 feet from wall 5 feet from wall
K p Line
K o Line
SingleDrum Vibratory Roller Dynapac CA15D
28,800 lbs, 66 in drum width
Alluvium φ = 39 degrees
γ = 117 pcf Depth, ft
Title: Supplemental Soils Report Document Identifier: 100S0CCY000010000000E Page: C13
APPENDIX C – LATERAL EARTH PRESSURES AND RESISTANCE TO LATERAL LOADS
Figure C75. Compactorinduced pressures from roller compactor (Dynapac CA15D).
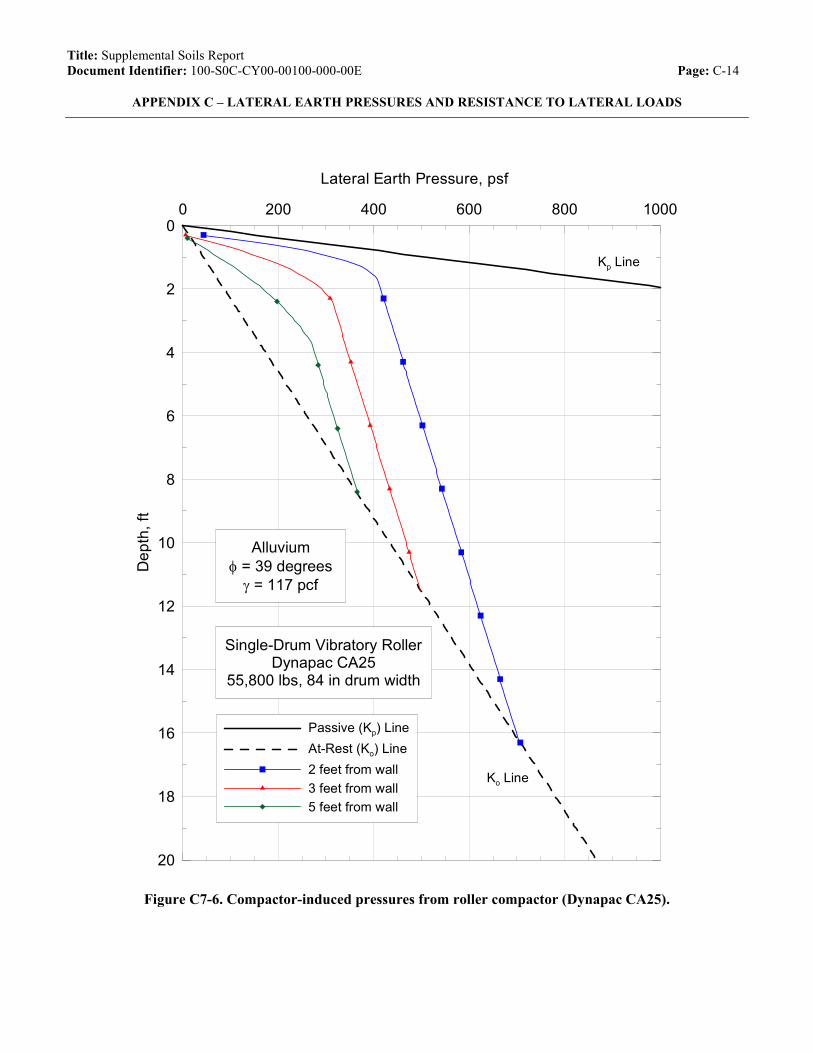
0 200 0
2
4
6
8
10
12
14
16
18
20
Lateral Earth Pressure, psf
400 600 800 1000
Passive (Kp) Line AtRest (Ko) Line 2 feet from wall 3 feet from wall 5 feet from wall
K p Line
K o Line
SingleDrum Vibratory Roller Dynapac CA25
55,800 lbs, 84 in drum width
Alluvium φ = 39 degrees
γ = 117 pcf
Depth, ft
Title: Supplemental Soils Report Document Identifier: 100S0CCY000010000000E Page: C14
APPENDIX C – LATERAL EARTH PRESSURES AND RESISTANCE TO LATERAL LOADS
Figure C76. Compactorinduced pressures from roller compactor (Dynapac CA25).
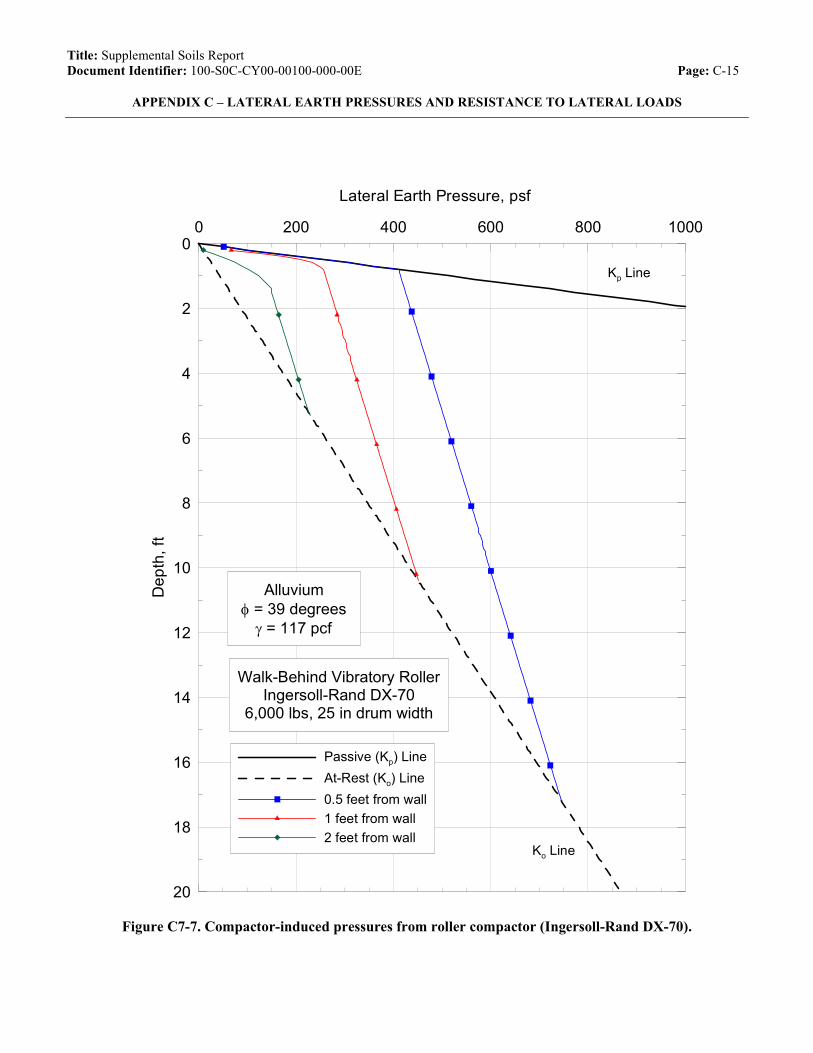
0 200 0
2
4
6
8
10
12
14
16
18
20
Lateral Earth Pressure, psf
400 600 800 1000
Passive (Kp) Line AtRest (Ko) Line 0.5 feet from wall 1 feet from wall 2 feet from wall
K p Line
K o Line
WalkBehind Vibratory Roller IngersollRand DX70
6,000 lbs, 25 in drum width
Alluvium φ = 39 degrees
γ = 117 pcf
Depth, ft
Title: Supplemental Soils Report Document Identifier: 100S0CCY000010000000E Page: C15
APPENDIX C – LATERAL EARTH PRESSURES AND RESISTANCE TO LATERAL LOADS
Figure C77. Compactorinduced pressures from roller compactor (IngersollRand DX70).
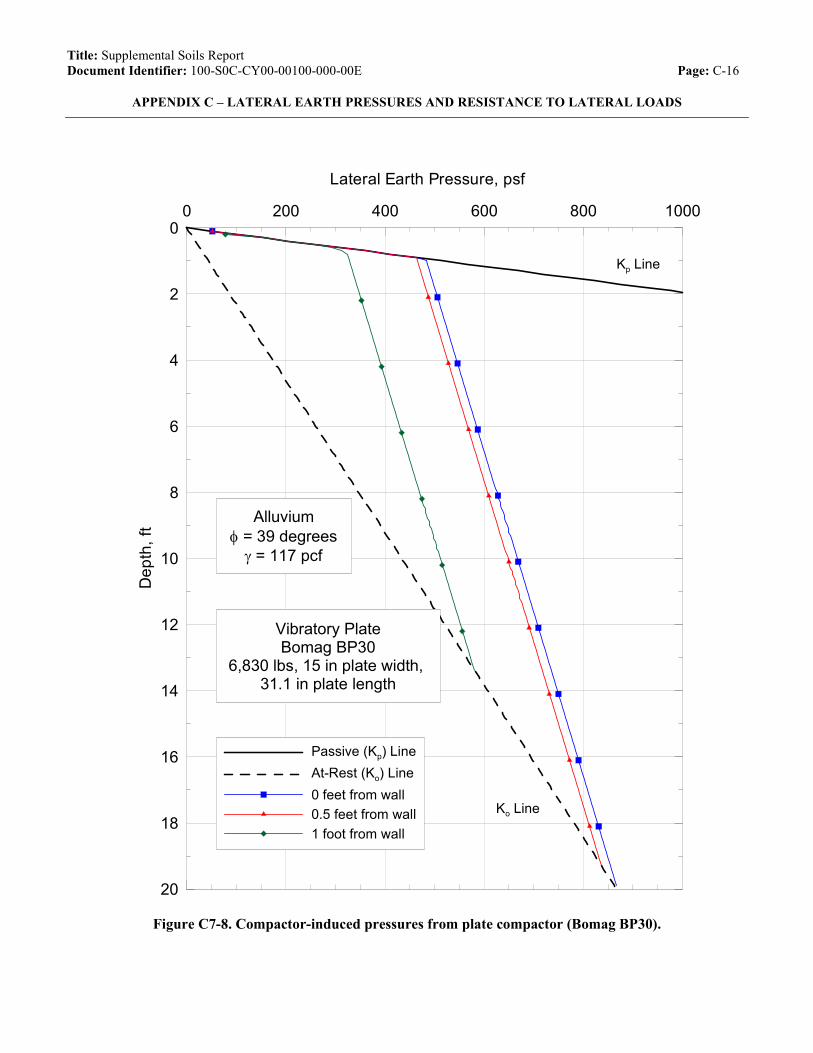
0 200 0
2
4
6
8
10
12
14
16
18
20
Lateral Earth Pressure, psf
400 600 800 1000
Passive (Kp) Line AtRest (Ko) Line 0 feet from wall 0.5 feet from wall 1 foot from wall
K p Line
K o Line
Vibratory Plate Bomag BP30
6,830 lbs, 15 in plate width, 31.1 in plate length
Alluvium φ = 39 degrees
γ = 117 pcf
Depth, ft
Title: Supplemental Soils Report Document Identifier: 100S0CCY000010000000E Page: C16
APPENDIX C – LATERAL EARTH PRESSURES AND RESISTANCE TO LATERAL LOADS
Figure C78. Compactorinduced pressures from plate compactor (Bomag BP30).
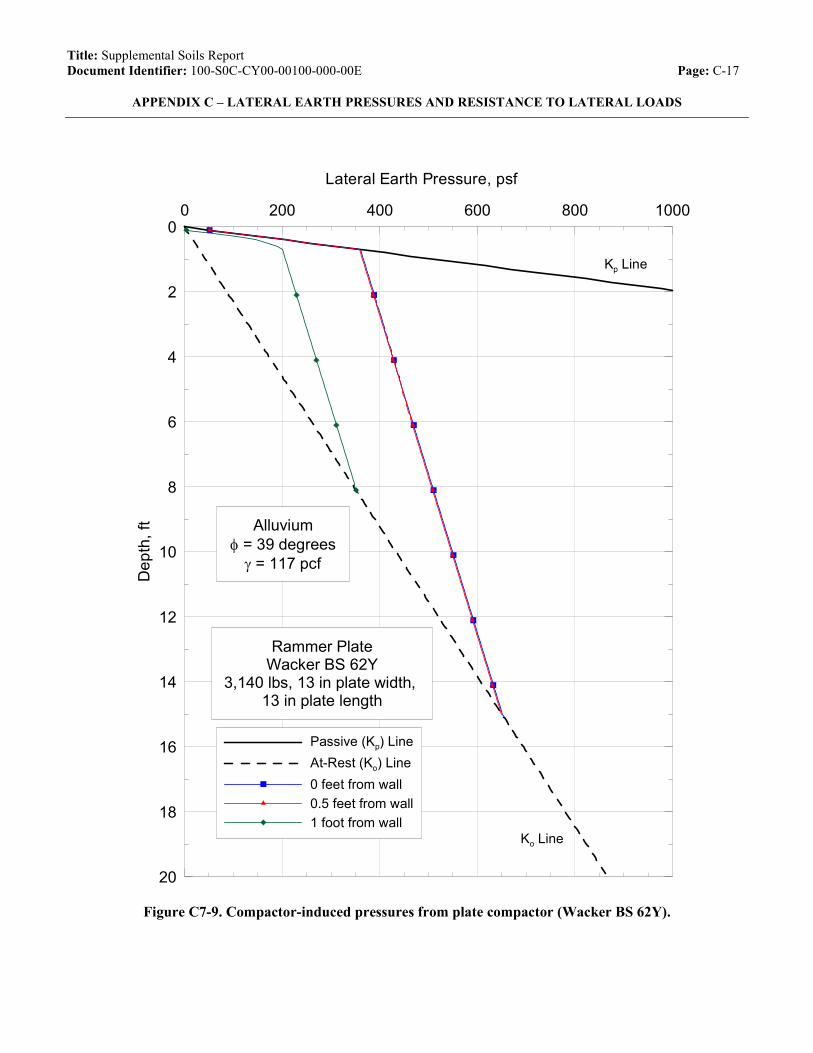
0 200 0
2
4
6
8
10
12
14
16
18
20
Lateral Earth Pressure, psf
400 600 800 1000
Passive (Kp) Line AtRest (Ko) Line 0 feet from wall 0.5 feet from wall 1 foot from wall
K p Line
K o Line
Rammer Plate Wacker BS 62Y
3,140 lbs, 13 in plate width, 13 in plate length
Alluvium φ = 39 degrees
γ = 117 pcf
Depth, ft
Title: Supplemental Soils Report Document Identifier: 100S0CCY000010000000E Page: C17
APPENDIX C – LATERAL EARTH PRESSURES AND RESISTANCE TO LATERAL LOADS
Figure C79. Compactorinduced pressures from plate compactor (Wacker BS 62Y).
Title: Supplemental Soils Report Document Identifier: 100S0CCY000010000000E Page: C18
APPENDIX C – LATERAL EARTH PRESSURES AND RESISTANCE TO LATERAL LOADS
C7.3 Temporary Shoring Pressure
The pressure of the alluvium acting on temporary shoring provided by soldier piles is estimated to be 17.5H.
C7.4 Resistance to Lateral Loads
The coefficient for resistance developed from passive pressures was calculated in Section C6.1. The passive pressure against the vertical face of the subgrade walls and footings is calculated to be 515H.
The average interface friction coefficient between mass concrete and the alluvium or potential engineered fill is estimated to be 0.90, where tan φ = 0.90. An appropriate factor of safety should be applied to this value.
C8 MathCad Worksheets
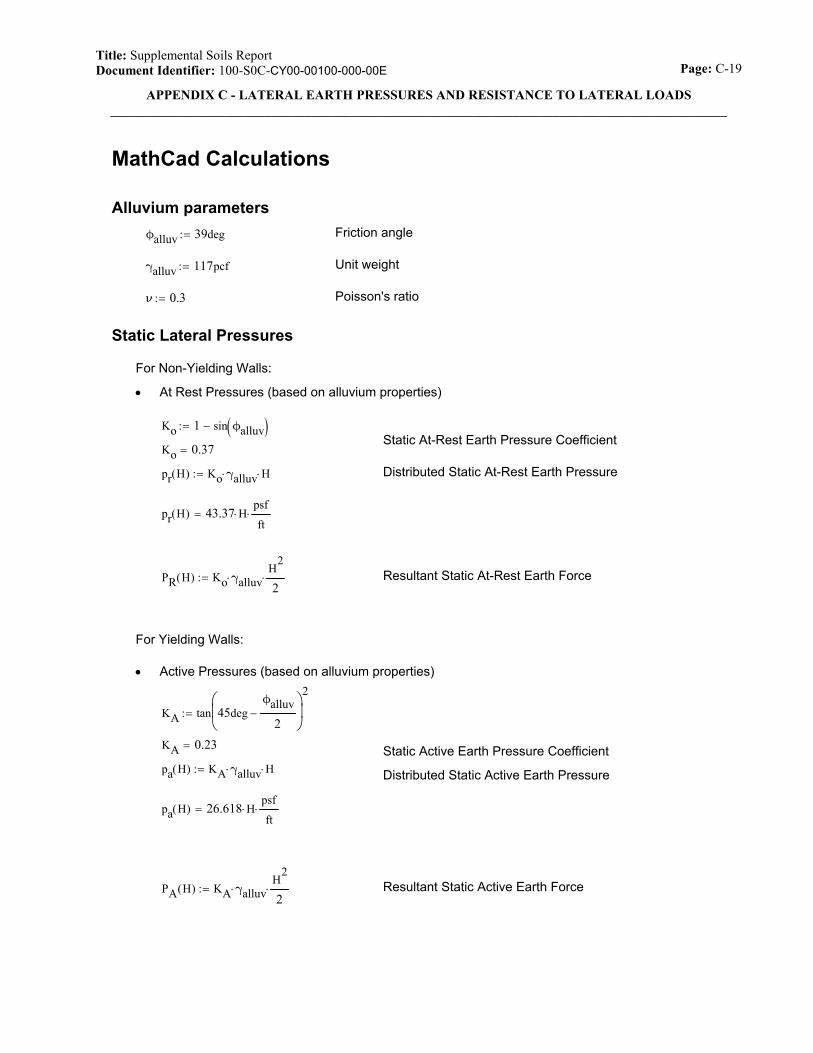
____________________________________________________________________________________________
Title: Supplemental Soils Report Document Identifier: 100S0CCY000010000000E Page: C19
APPENDIX C LATERAL EARTH PRESSURES AND RESISTANCE TO LATERAL LOADS
MathCad Calculations
Alluvium parameters ϕ := 39deg Friction angle
alluv
γ := 117pcf Unit weightalluv
ν := 0.3 Poisson's ratio
Static Lateral Pressures
For NonYielding Walls:
• At Rest Pressures (based on alluvium properties)
K := 1 − sin ϕo (� alluv) Static AtRest Earth Pressure Coefficient
K = 0.37 o p (H) := K ⋅γ ⋅H Distributed Static AtRest Earth Pressure r o alluv
psf p (H) = 43.37⋅H⋅ r
ft
2 H
P (H) := K ⋅γ ⋅� Resultant Static AtRest Earth ForceR o alluv
2
For Yielding Walls:
•� Active Pressures (based on alluvium properties)
ϕ 2
alluv K := tan45deg − A 2 �K = 0.23A Static Active Earth Pressure Coefficient p (H) := K ⋅γ ⋅H a A alluv Distributed Static Active Earth Pressure
psf p (H) = 26.618⋅H⋅ a
ft
2 H
P (H) := K ⋅γ ⋅ Resultant Static Active Earth ForceA A alluv
2
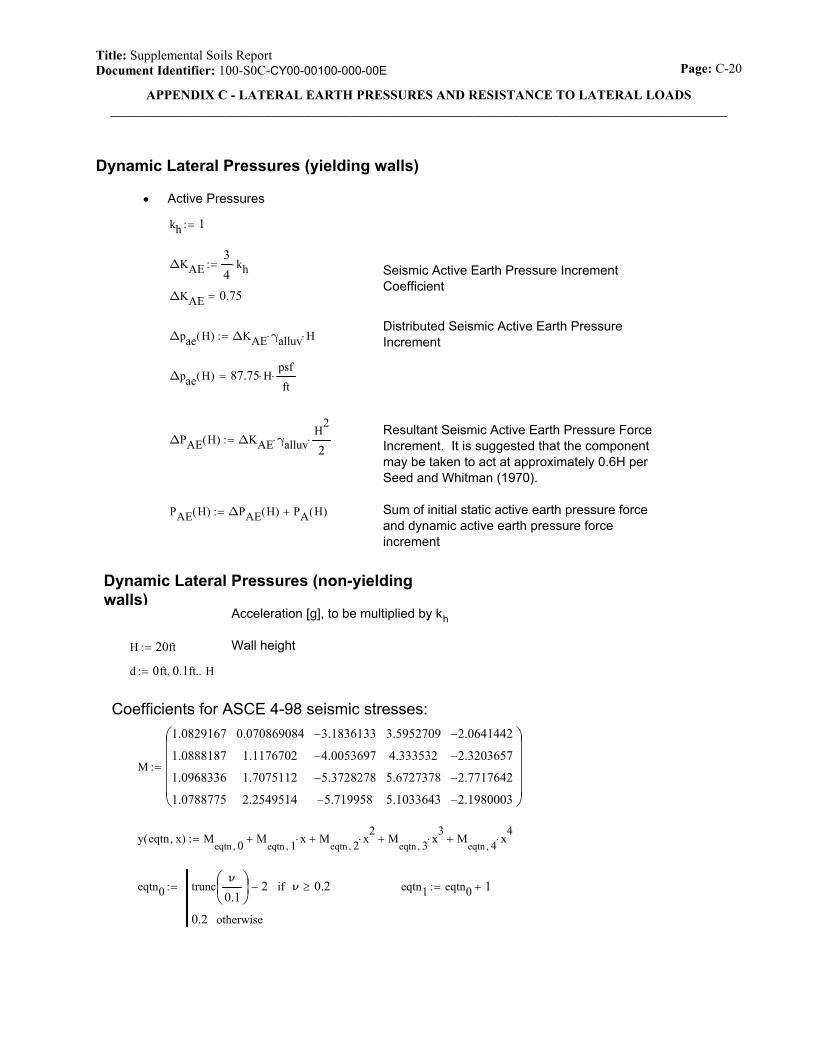
____________________________________________________________________________________________
Title: Supplemental Soils Report Document Identifier: 100S0CCY000010000000E Page: C20
APPENDIX C LATERAL EARTH PRESSURES AND RESISTANCE TO LATERAL LOADS
Dynamic Lateral Pressures (yielding walls)
•� Active Pressures
k := 1h
3 ΔK := ⋅AE kh Seismic Active Earth Pressure Increment4
Coefficient ΔK = 0.75AE
Distributed Seismic Active Earth Pressure Δp (H) := ΔK ⋅γ ⋅H ae AE alluv Increment
psfΔp (H) = 87.75⋅H⋅ ae
ft
2 H Resultant Seismic Active Earth Pressure Force
ΔP (H) := ΔK ⋅γ ⋅AE AE alluv Increment. It is suggested that the component2 may be taken to act at approximately 0.6H per Seed and Whitman (1970).
P (H) := ΔP (H) + P (H) Sum of initial static active earth pressure forceAE AE A
and dynamic active earth pressure force increment
Dynamic Lateral Pressures (nonyielding walls)
a := 1 Acceleration [g], to be multiplied by kh
H := 20ft Wall height
d := 0ft, 0.1ft.. H
Coefficients for ASCE 498 seismic stresses: 1.0829167 0.070869084 −3.1836133 3.5952709 −2.0641442 1.0888187 1.1176702 −4.0053697 4.333532 −2.3203657
M := 1.0968336 1.7075112 −5.3728278 5.6727378 −2.7717642 � �1.0788775 2.2549514 −5.719958 5.1033643 −2.1980003
2 3 4 y( eqtn , x) := M + M ⋅x + M ⋅x + M ⋅x + M ⋅x
eqtn , 0 eqtn , 1 eqtn , 2 eqtn , 3 eqtn , 4
ν eqtn := trunc − 2 if ν ≥ 0.2 0 eqtn := 1 eqtn + 1
0 0.1
0.2 otherwise
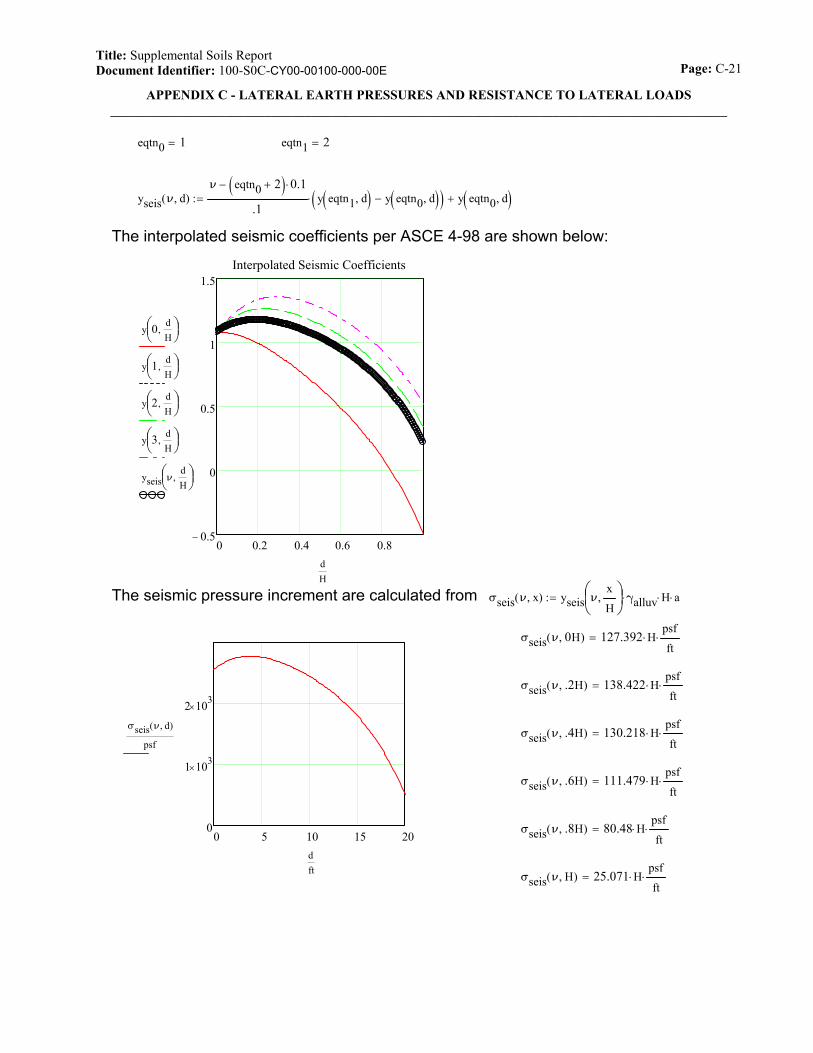
____________________________________________________________________________________________
eqtn = 1 eqtn = 20 1
ν − (eqtn0 + 2) ⋅0.1 y (ν , d) := ⋅ y eqtn , d − y eqtn , d + y eqtn , dseis
.1 ( ( 1 ) ( 0 )) ( 0 )
The interpolated seismic coefficients per ASCE 498 are shown below:
Interpolated Seismic Coefficients 1.5
d y0 , H
1 d �
y1 , H�
d �y2 , H 0.5
d �y3 , H�
d 0 y ν , seis H
− 0.5 0 0.2 0.4 0.6 0.8
d H
x The seismic pressure increment are calculated from σ (ν , x) := y ν , ⋅γ ⋅H⋅aseis seis alluv H psf
σseis(ν , 0H) = 127.392⋅H⋅ ft
psfσseis(ν , .2H) = 138.422⋅H⋅
3 ft 2 10 �
σ (ν , d) psfseis σseis(ν , .4H) = 130.218⋅H⋅
psf ft 3
1 10 × psfσseis(ν , .6H) = 111.479⋅H⋅
ft
psf0 σseis(ν , .8H) = 80.48⋅H⋅ 0 5 10 15 20 ft
d ft psf
σseis(ν , H) = 25.071⋅H⋅ ft
Title: Supplemental Soils Report Document Identifier: 100S0CCY000010000000E Page: C21
APPENDIX C LATERAL EARTH PRESSURES AND RESISTANCE TO LATERAL LOADS
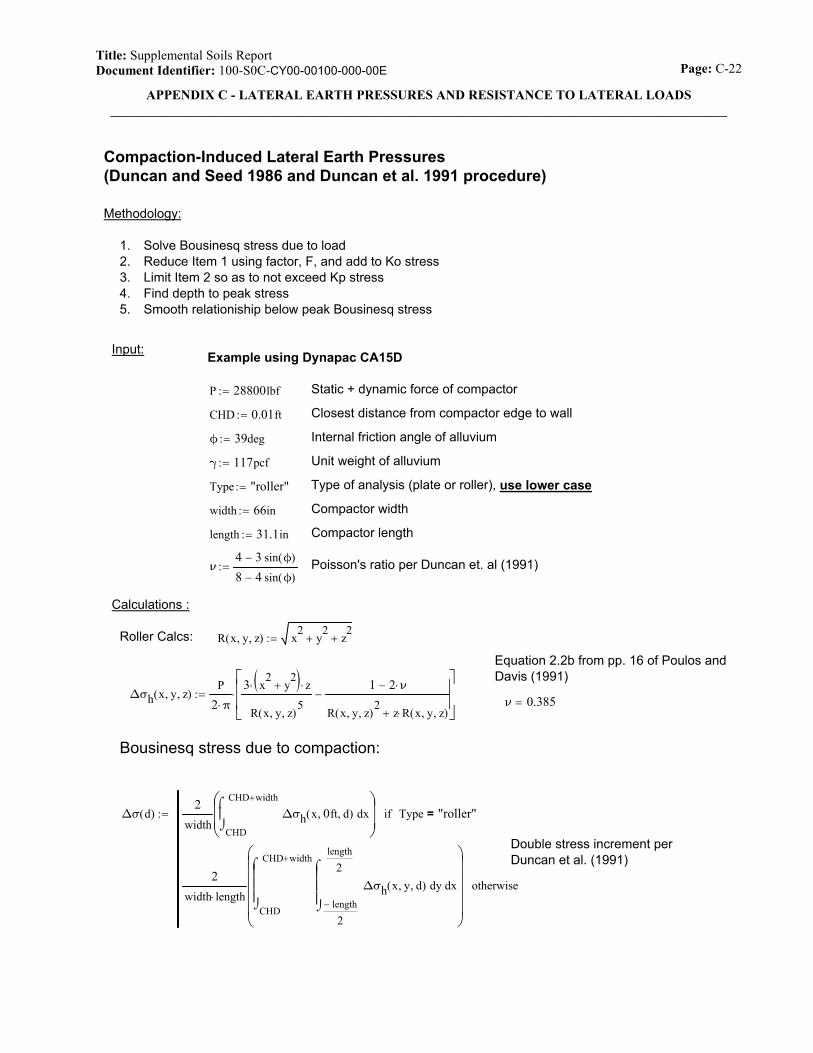
____________________________________________________________________________________________
Title: Supplemental Soils Report Document Identifier: 100S0CCY000010000000E Page: C22
APPENDIX C LATERAL EARTH PRESSURES AND RESISTANCE TO LATERAL LOADS
CompactionInduced Lateral Earth Pressures (Duncan and Seed 1986 and Duncan et al. 1991 procedure)
Methodology:
1. Solve Bousinesq stress due to load 2. Reduce Item 1 using factor, F, and add to Ko stress 3. Limit Item 2 so as to not exceed Kp stress 4. Find depth to peak stress 5. Smooth relationiship below peak Bousinesq stress
Input: Example using Dynapac CA15D
P := 28800lbf Static + dynamic force of compactor
CHD := 0.01ft Closest distance from compactor edge to wall
ϕ := 39deg Internal friction angle of alluvium
γ := 117pcf Unit weight of alluvium
Type := "roller" Type of analysis (plate or roller), use lower case
width := 66in Compactor width
length := 31.1in Compactor length
4 − 3 sin(ϕ) ν := Poisson's ratio per Duncan et. al (1991)
8 − 4 sin(ϕ)
Calculations :
2 2 2Roller Calcs: R(x , y , z) := x + y + z
Equation 2.2b from pp. 16 of Poulos and
P ⋅ 3 ( 2 2 x + y ) Davis (1991)
⋅z 1 − 2⋅ν Δσ ( x , y , z) := ⋅ −h 2⋅ 5 2 νπ = 0.385�R ( x , y , z) R( x , y , z) + z⋅ R ( x , y , z) �
Bousinesq stress due to compaction:
CHD+⌠ width2 Δσ (d) := Δσ (x , 0ft , d) d x if Type = "roller"
h
width ⌡ �CHD Double stress increment per
lengthCHD+width Duncan et al. (1991) ⌠ ⌠ 2 2
Δσ ( x , y , d) d y dx width⋅ length h
otherwise
⌡ ⌡ − length
CHD � 2
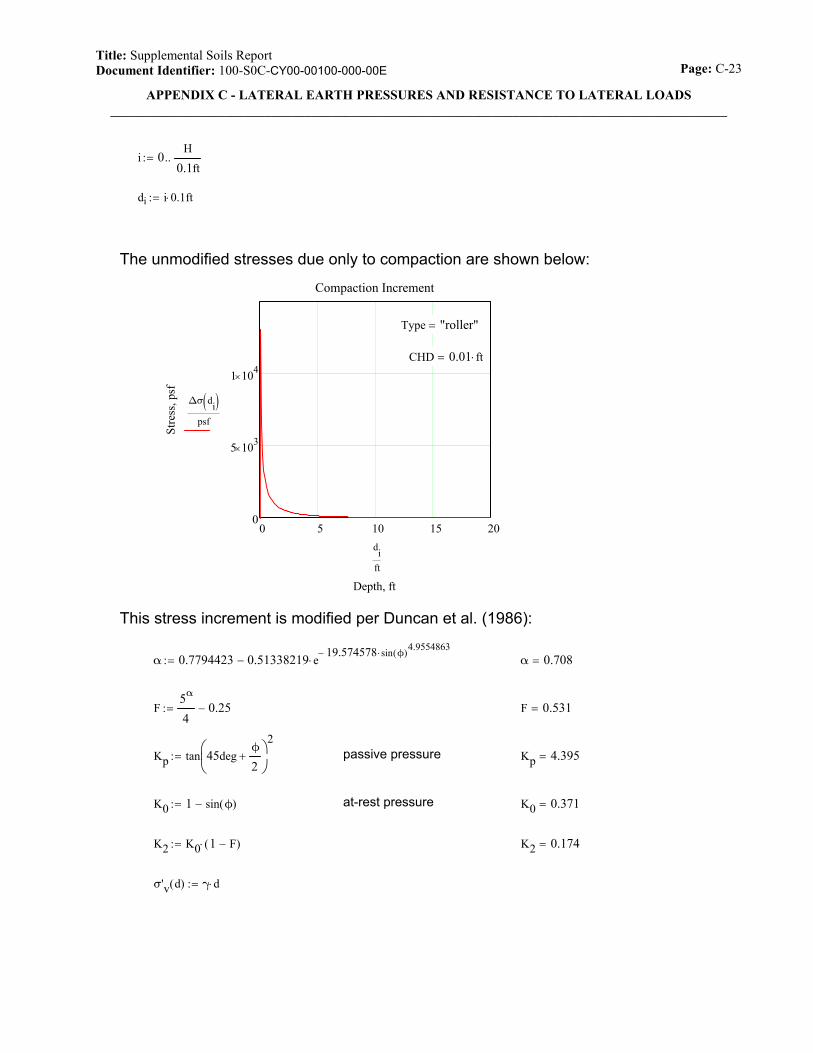
____________________________________________________________________________________________
H i := 0 ..
0.1ft
di := i⋅ 0.1ft
The unmodified stresses due only to compaction are shown below:
Compaction Increment
Type = "roller"
CHD 0.01⋅ft= 4
1 10 ×
Δσ(d )i psf
3 5 10 ×
0 0 5 10 15 20
d i
ft
Depth, ft
Stres
s,
psf
Title: Supplemental Soils Report Document Identifier: 100S0CCY000010000000E Page: C23
APPENDIX C LATERAL EARTH PRESSURES AND RESISTANCE TO LATERAL LOADS
This stress increment is modified per Duncan et al. (1986):
4.9554863− 19.574578 ⋅sin(ϕ)
α := 0.7794423 − 0.51338219⋅e α = 0.708
α5
F := − 0.25 F = 0.531 4
ϕ2
passive pressure K = 4.395K := tan45deg + p 2 � p
K0 := 1 − sin(ϕ) atrest pressure K0 = 0.371
K := K ⋅(1 − F) K = 0.1742 0 2
σ' d := γ⋅d( ) v
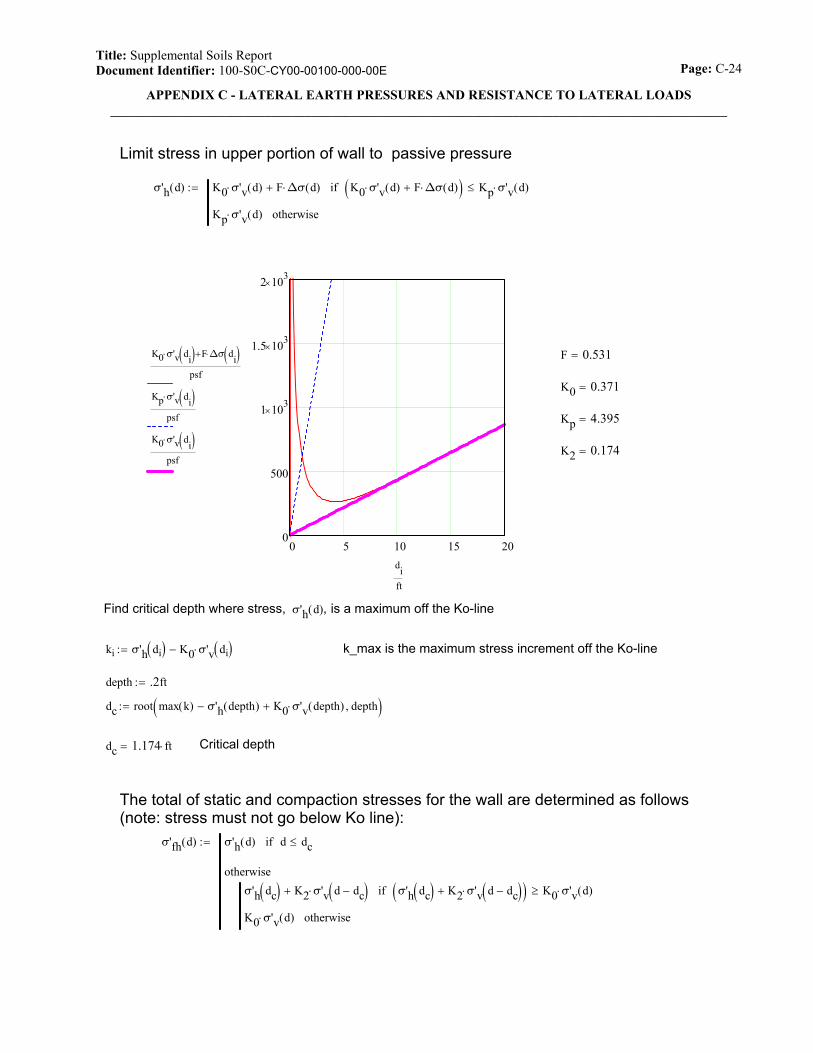
____________________________________________________________________________________________
Limit stress in upper portion of wall to passive pressure
σ' d :=( ) K0⋅σ'v( ) + ⋅ ( ) if (K0⋅σ'v d + ⋅ ( ) ) ≤ Kp ⋅σ'v( ) d F Δσ d ( ) F Δσ d dh
K ⋅σ' ( ) d otherwise p v
3 2 10 ×
3 1.5 10×
K ⋅σ' d +F⋅Δσ d F = 0.531 psf
K = 0.371
0 v( i) ( i)
0Kp ⋅σ'v(d )i 3 1 10 ×
psf K = 4.395 p K ⋅σ' d0 v( i)
K = 0.1742psf 500
0 0 5 10 15 20
d i
ft
Title: Supplemental Soils Report Document Identifier: 100S0CCY000010000000E Page: C24
APPENDIX C LATERAL EARTH PRESSURES AND RESISTANCE TO LATERAL LOADS
Find critical depth where stress, σ' d( ), is a maximum off the Koline h
ki := σ' ( ) − K ⋅σ' ( )� k_max is the maximum stress increment off the Kolinedi dih 0 v
depth := .2ft
dc := root(max k − σ'h(depth) + K0⋅σ'v(depth )( ) ) , depth
d = 1.174⋅ft Critical depthc
The total of static and compaction stresses for the wall are determined as follows (note: stress must not go below Ko line):
σ' fh d( ) := σ' h d( ) if d d c ≤
σ' h d c( ) K2 σ' v d d c −( )⋅+
otherwise if σ' h d c( ) K2 σ' v d d c −( )⋅+( ) K0 σ' v d( ) ⋅≥
K0 σ' v d( ) ⋅ otherwise
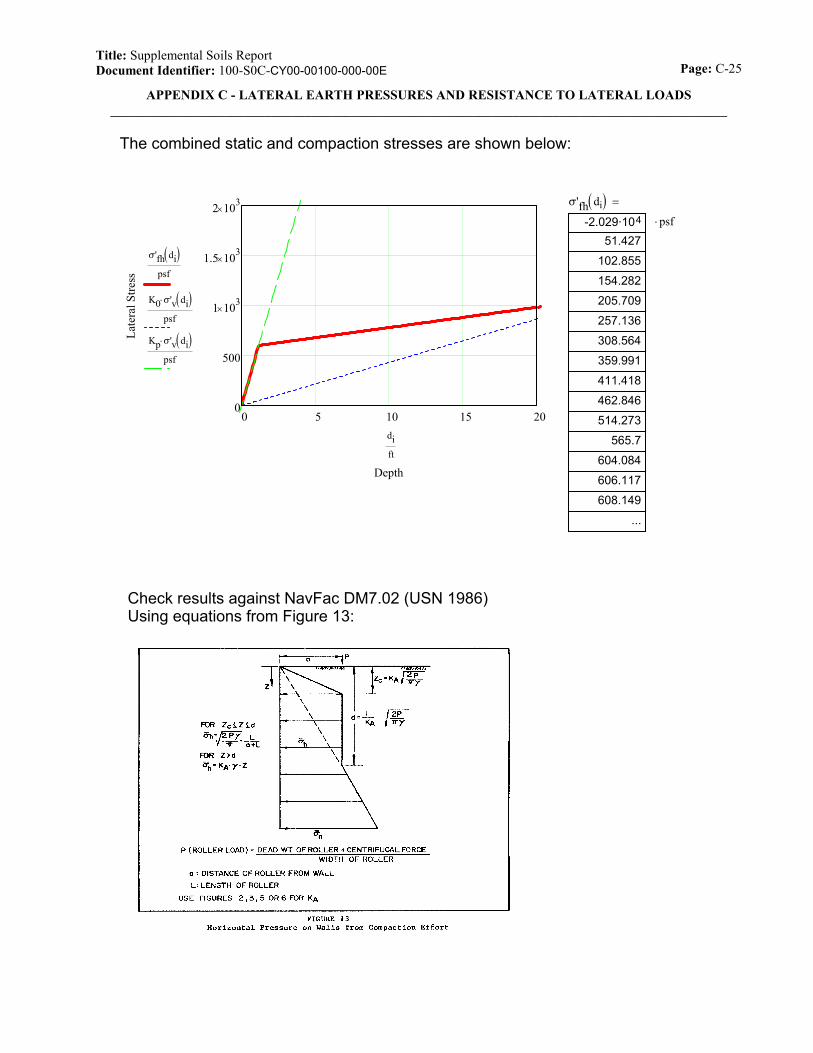
____________________________________________________________________________________________
Lat
eral
Stres
s
3 σ'fh di =2 10 ×
2.029·104
51.427
102.855
154.282
205.709
257.136
308.564
359.991
411.418
462.846
514.273
565.7
604.084
606.117
608.149
...
⋅psf
3σ'fh(di) 1.5 10 ×
psf
K ⋅σ' (d ) 30 v i 1 10 × psf
K ⋅σ' (d )p v i psf 500
0 0 5 10 15 20
di ft
Depth
Title: Supplemental Soils Report Document Identifier: 100S0CCY000010000000E Page: C25
APPENDIX C LATERAL EARTH PRESSURES AND RESISTANCE TO LATERAL LOADS
The combined static and compaction stresses are shown below:
( )
Check results against NavFac DM7.02 (USN 1986) Using equations from Figure 13:
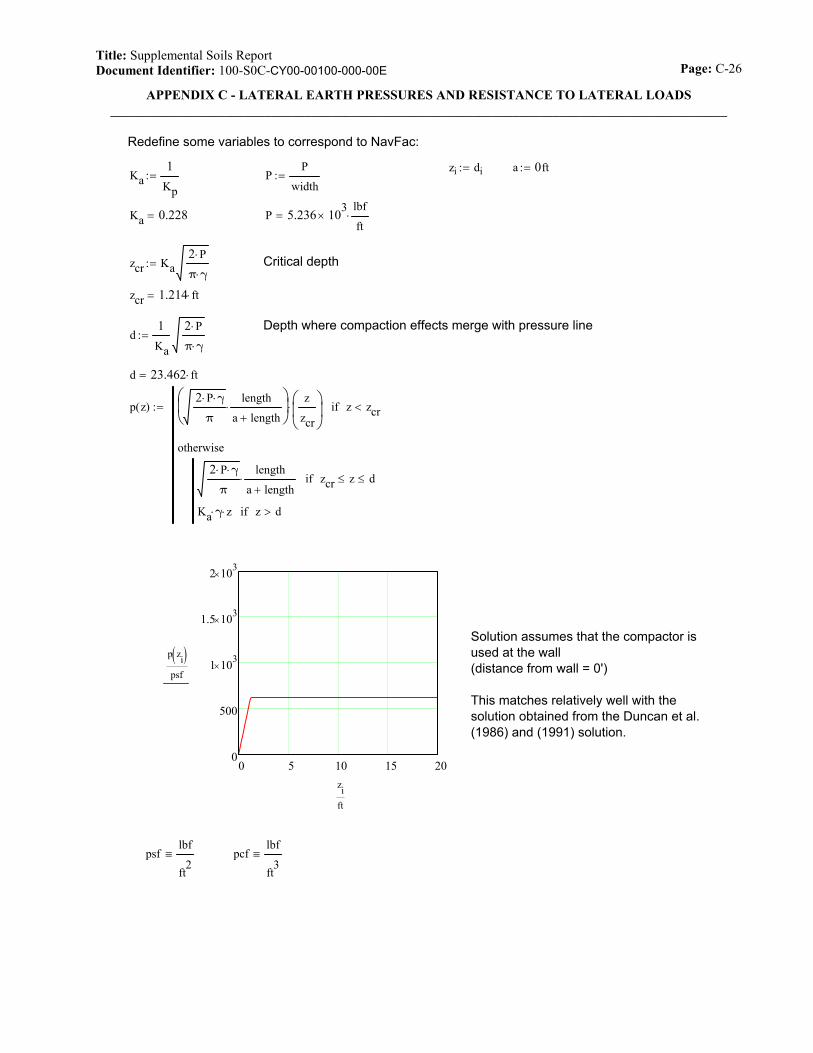
____________________________________________________________________________________________
3 2 10 ×
3 1.5 10×
Solution assumes that the compactor is used at the wallp z( )
× 3i
1 10 (distance from wall = 0')psf
This matches relatively well with the 500 solution obtained from the Duncan et al.
(1986) and (1991) solution.
0 0 5 10 15 20
z i
ft
Title: Supplemental Soils Report Document Identifier: 100S0CCY000010000000E Page: C26
APPENDIX C LATERAL EARTH PRESSURES AND RESISTANCE TO LATERAL LOADS
Redefine some variables to correspond to NavFac:
1 P zi := di a := 0ft K := P := a
K width p 3 lbf
K = 0.228 P = 5.236 × 10 ⋅ a ft
2⋅P z := K Critical depthcr a
π⋅ γ
z = ⋅ 1.214 ft cr
1 2⋅P Depth where compaction effects merge with pressure line d :=
K π⋅ γa
d = 23.462⋅ft
2⋅P⋅γ length z p(z) := ⋅ ⋅ if z < z
crπ a + length zcr�
otherwise
2⋅P⋅γ length⋅ if z ≤ z ≤ d
π + cr a length
K ⋅γ⋅z if z > d a
lbf lbf psf ≡ pcf ≡
2 3 ft ft