Embed Size (px)
Citation preview
Energy vs. Climate defining the problem
Steve Goldthorpe Energy Analyst, Waipu
Presentation to ESR Auckland Branch 15th August 2013
Steve Goldthorpe BSc. Chem. Eng. Personal backgound
• 1979-1995 British Coal R&D in UK – PADB • Process modelling • Coal liquefaction • Carbon capture and storage
• 1995-2002 URS Engineering Consultancy in Auckland • Air quality assessments • Novel energy technology investigations • Greenhouse gas inventory auditing
• 2002-present SGEA – Independent Energy Analyst • Current clients
– IEA Greenhouse Gas R & D Programme – Asian Development Bank
2
Energy vs. Climate defining the problem
• Fossil Energy vs. Climate
• Greenhouse Gas inventories
• IEA GHG R&D programme
• The importance of methane
• GHG emissions from shale gas
• Sea Level Rise
• CCS in China
• NZ Sustainable Energy Forum
3
Fossil Energy vs. climate • The fossil carbon resource was created from
atmospheric CO2 over many millions of years, but is being returned to the atmosphere by human activity over a few hundred years.
• Since pre-industrial times:- – CO2 in the atmosphere has increased from
280 ppm to 400 ppm; – CH4 in the atmosphere has increased from
700 ppb to 1800 ppb. • The thermal balance of the planet is sensitive to trace
elements in the atmosphere and the global climate is sensitive to the planetary thermal balance.
4
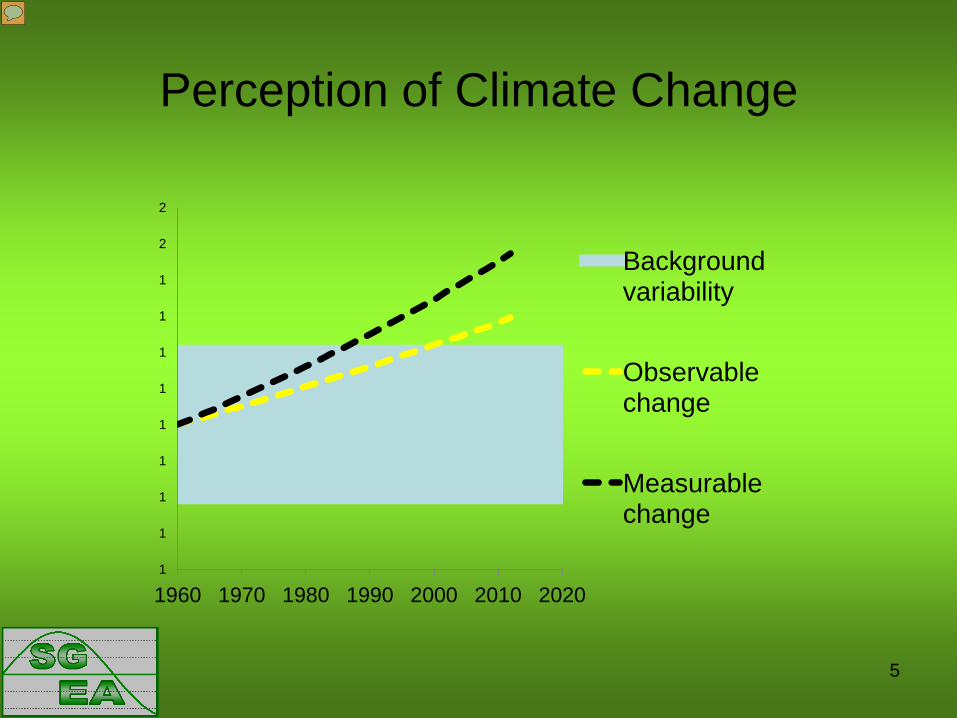
Perception of Climate Change
1
1
1
1
1
1
1
1
1
2
2
1960 1970 1980 1990 2000 2010 2020
Background variability
Observable change
Measurable change
5
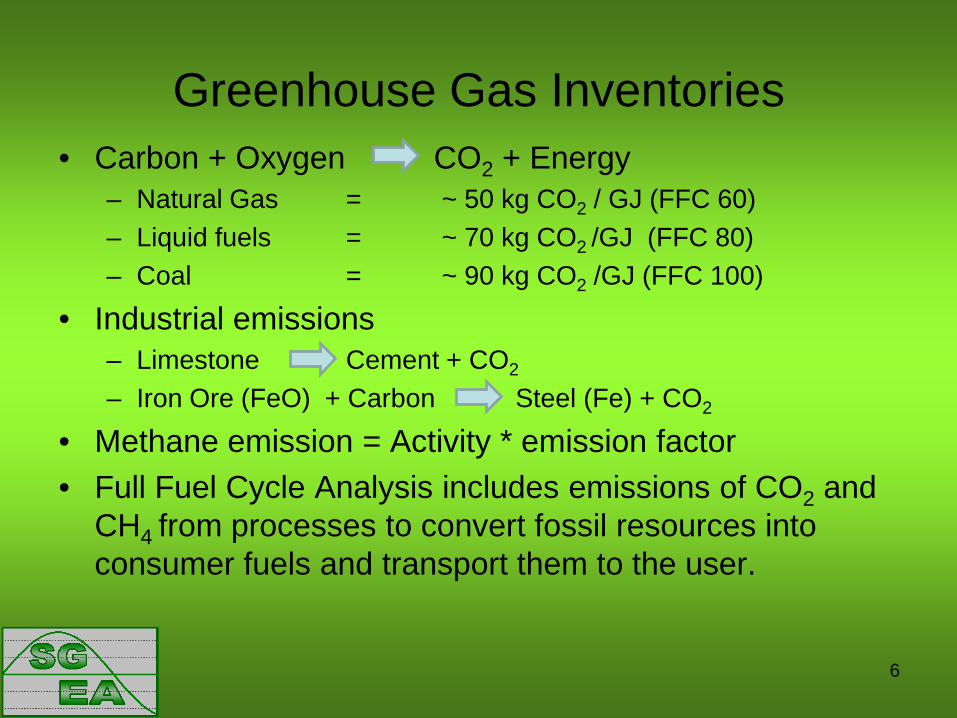
Greenhouse Gas Inventories • Carbon + Oxygen CO2 + Energy
– Natural Gas = ~ 50 kg CO2 / GJ (FFC 60) – Liquid fuels = ~ 70 kg CO2 /GJ (FFC 80) – Coal = ~ 90 kg CO2 /GJ (FFC 100)
• Industrial emissions – Limestone Cement + CO2
– Iron Ore (FeO) + Carbon Steel (Fe) + CO2
• Methane emission = Activity * emission factor • Full Fuel Cycle Analysis includes emissions of CO2 and
CH4 from processes to convert fossil resources into consumer fuels and transport them to the user.
6
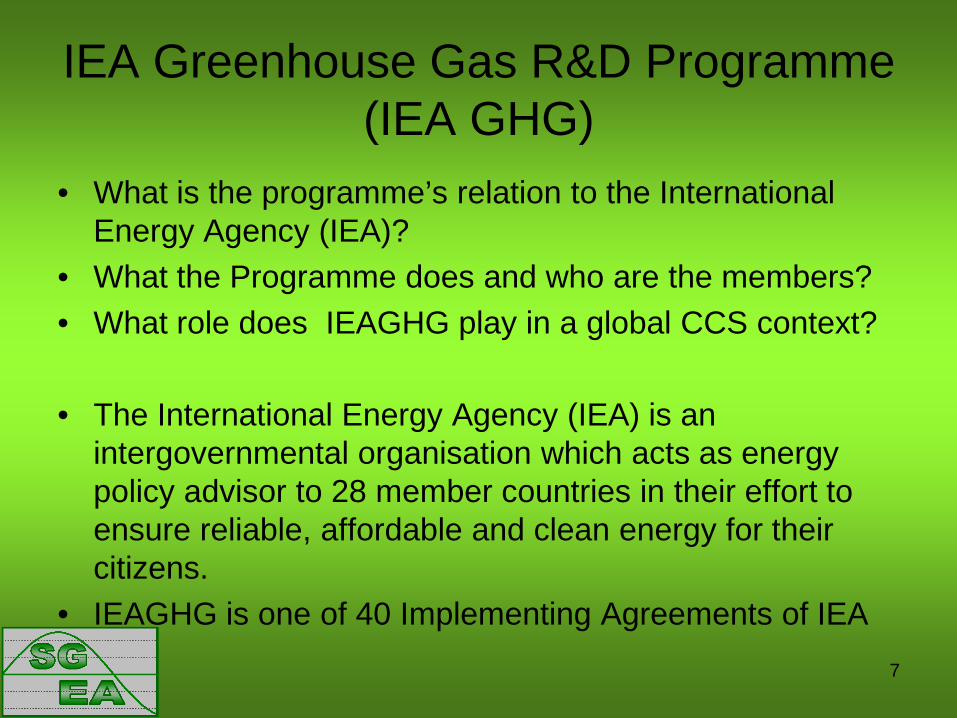
IEA Greenhouse Gas R&D Programme (IEA GHG)
• What is the programme’s relation to the International Energy Agency (IEA)?
• What the Programme does and who are the members? • What role does IEAGHG play in a global CCS context?
• The International Energy Agency (IEA) is an
intergovernmental organisation which acts as energy policy advisor to 28 member countries in their effort to ensure reliable, affordable and clean energy for their citizens.
• IEAGHG is one of 40 Implementing Agreements of IEA
7
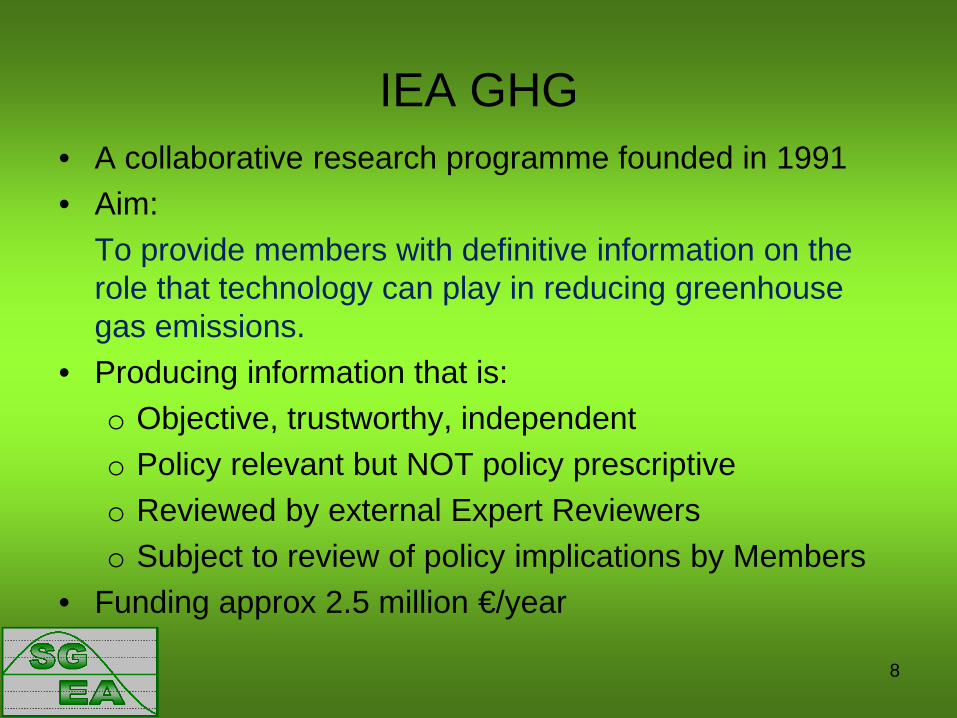
IEA GHG • A collaborative research programme founded in 1991 • Aim: To provide members with definitive information on the
role that technology can play in reducing greenhouse gas emissions.
• Producing information that is: o Objective, trustworthy, independent o Policy relevant but NOT policy prescriptive o Reviewed by external Expert Reviewers o Subject to review of policy implications by Members
• Funding approx 2.5 million €/year
8
What IEAGHG does
• Technical evaluations of mitigation options
– Comparative analyses with standardised baseline
• Assist international co-operation
– Facillitating international research networks
• Assist technology implementation
– Near market research
– GCCSI
• Disseminate information
9
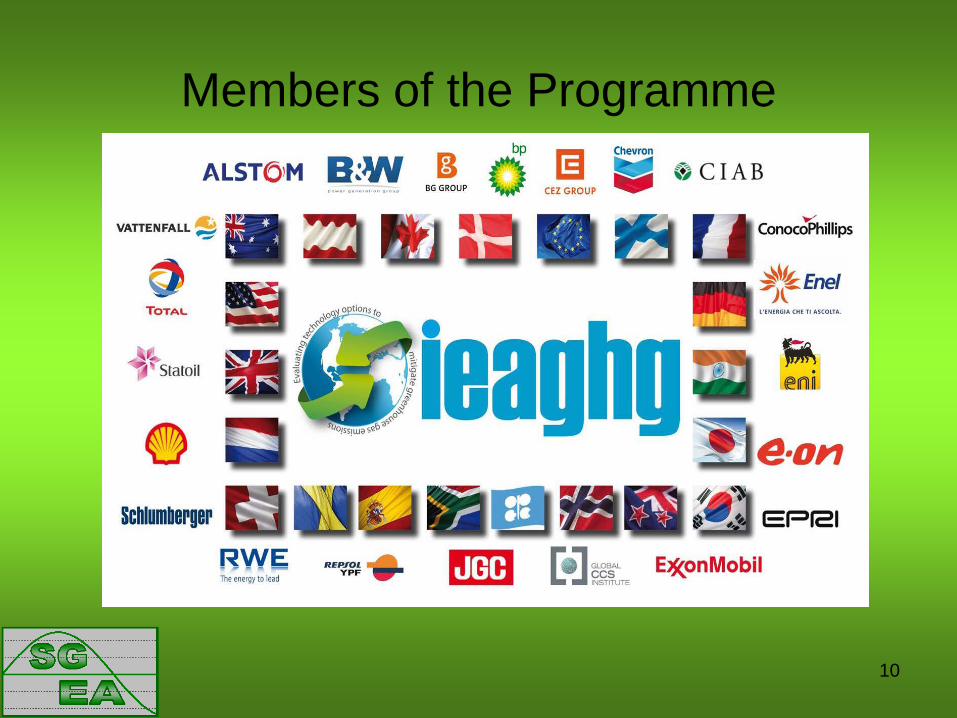
Members of the Programme
10
My work with IEAGHG in UK
• Shale Gas – Investigating the claim that shale gas production and
use, as practiced in the USA, could be more greenhouse intensive than coal production and use
• Steel Study – Assisting with the assessment of the integration of
Carbon Capture and Storage into a conventional steel production process
• Other novel technology reviews • On-going work in 2013
11
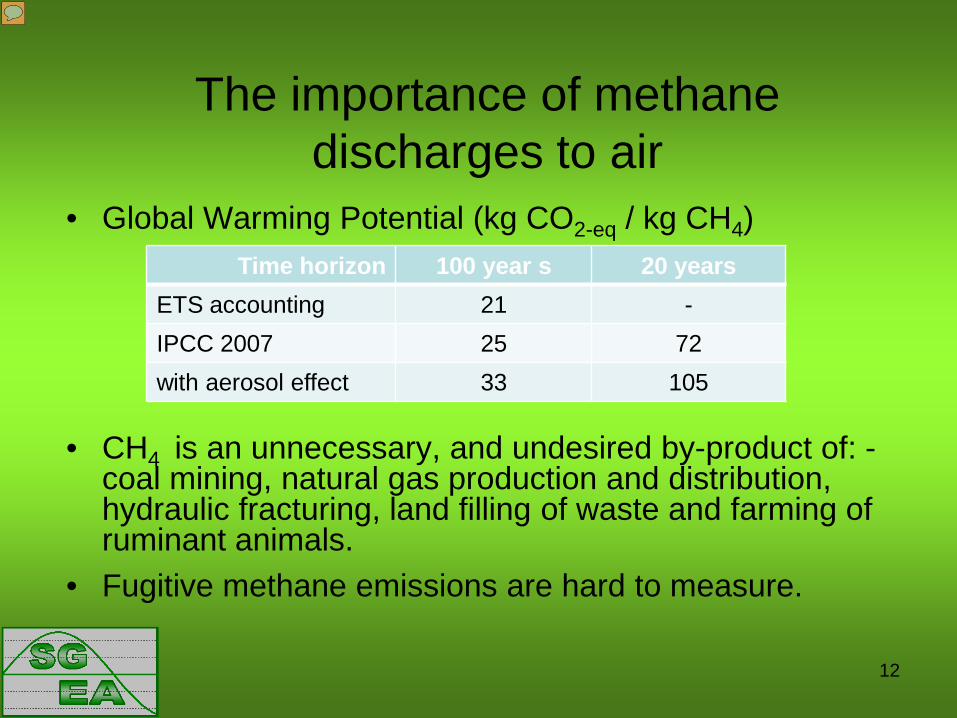
The importance of methane discharges to air
• Global Warming Potential (kg CO2-eq / kg CH4)
• CH4 is an unnecessary, and undesired by-product of: - coal mining, natural gas production and distribution, hydraulic fracturing, land filling of waste and farming of ruminant animals.
• Fugitive methane emissions are hard to measure.
Time horizon 100 year s 20 years ETS accounting 21 - IPCC 2007 25 72 with aerosol effect 33 105
12
0
20
40
60
80
100
120
140
160
0 20 40 60 80 100
Rel
ativ
e im
pact
on
clim
ate
Years after discharge
Carbon dioxide Methane
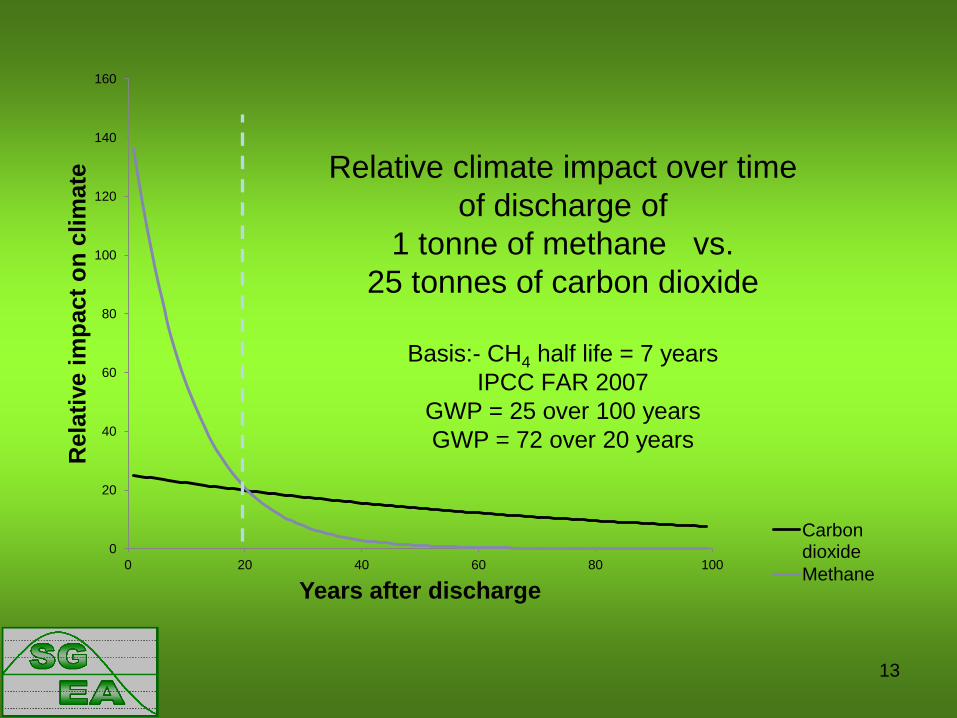
Relative climate impact over time of discharge of
1 tonne of methane vs. 25 tonnes of carbon dioxide
Basis:- CH4 half life = 7 years
IPCC FAR 2007 GWP = 25 over 100 years GWP = 72 over 20 years
13
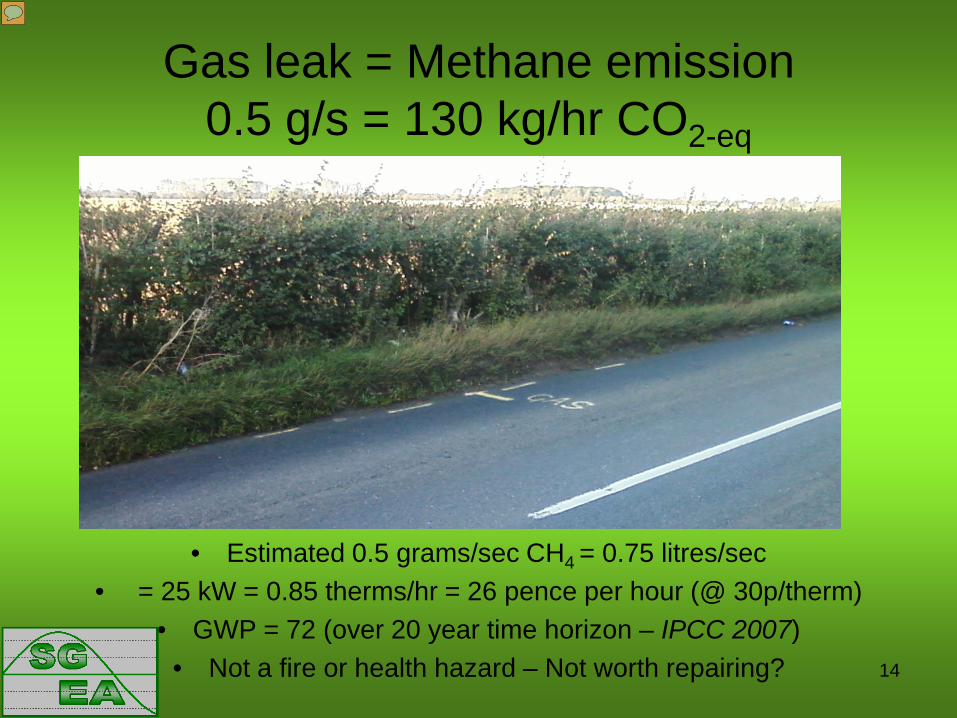
Gas leak = Methane emission 0.5 g/s = 130 kg/hr CO2-eq
• Estimated 0.5 grams/sec CH4 = 0.75 litres/sec • = 25 kW = 0.85 therms/hr = 26 pence per hour (@ 30p/therm)
• GWP = 72 (over 20 year time horizon – IPCC 2007) • Not a fire or health hazard – Not worth repairing?
14
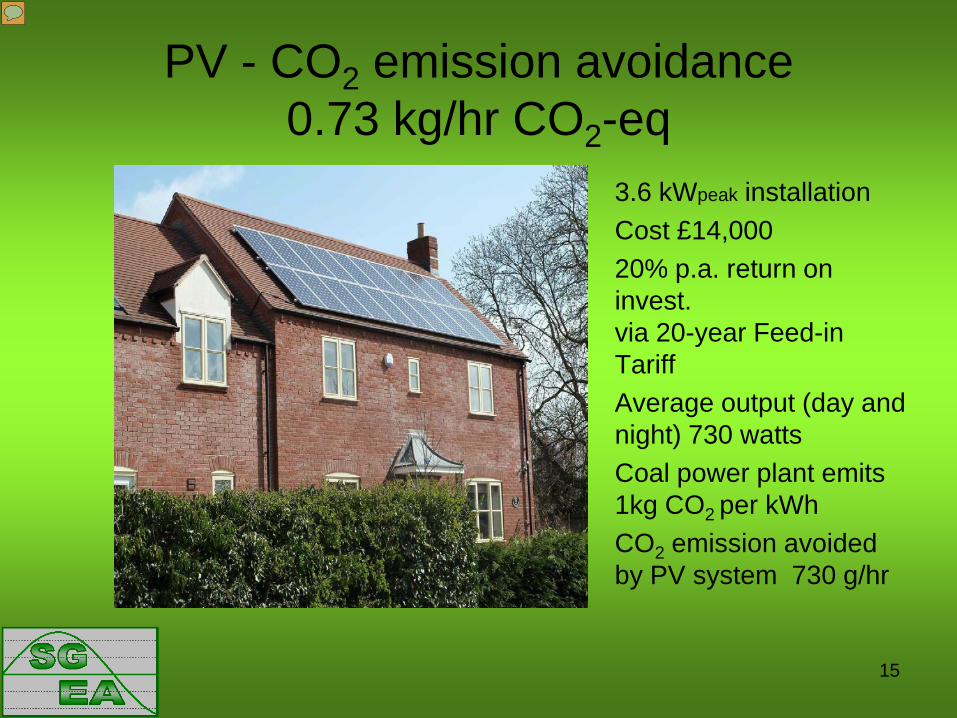
PV - CO2 emission avoidance 0.73 kg/hr CO2-eq
• 3.6 kWpeak installation • Cost £14,000 • 20% p.a. return on
invest. via 20-year Feed-in Tariff
• Average output (day and night) 730 watts
• Coal power plant emits 1kg CO2 per kWh
• CO2 emission avoided by PV system 730 g/hr
15
Observations
• The greenhouse impact* of a very small gas leak that is not worth fixing is cancelling out the greenhouse benefits of 178 domestic PV installations, which cost £2.5 million to install.
• Reliance on gas industry safety imperatives and commercial pressures to eliminate all gas distribution leaks is inadequate from a greenhouse gas emission perspective.
* When considered over a 20-year time horizon, which is the likely lifetime of the PV installations.
16
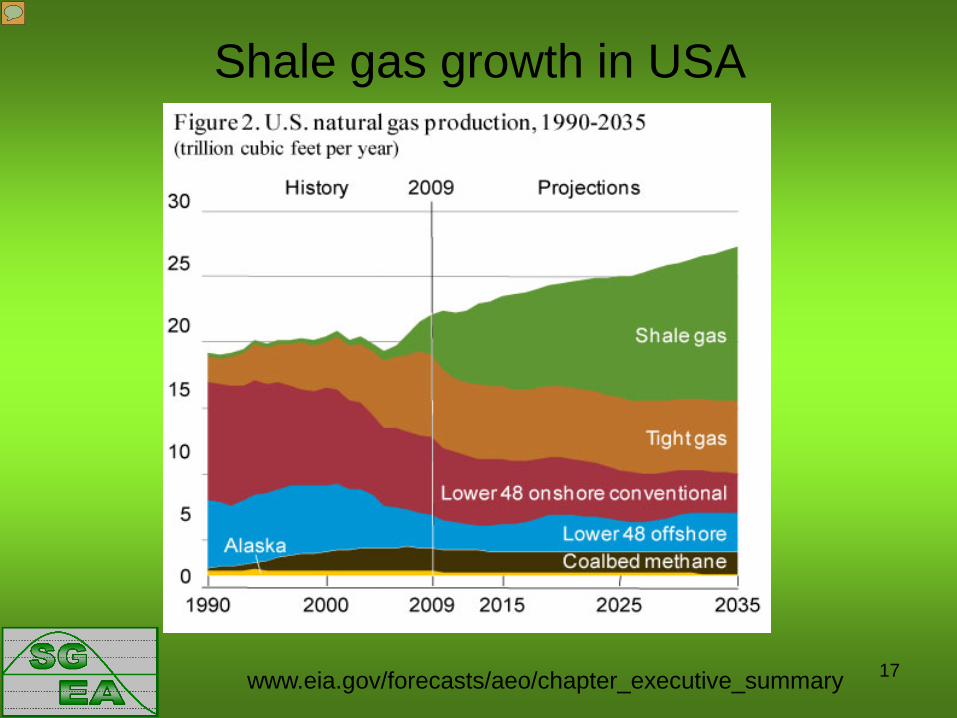
Shale gas growth in USA
www.eia.gov/forecasts/aeo/chapter_executive_summary 17
18
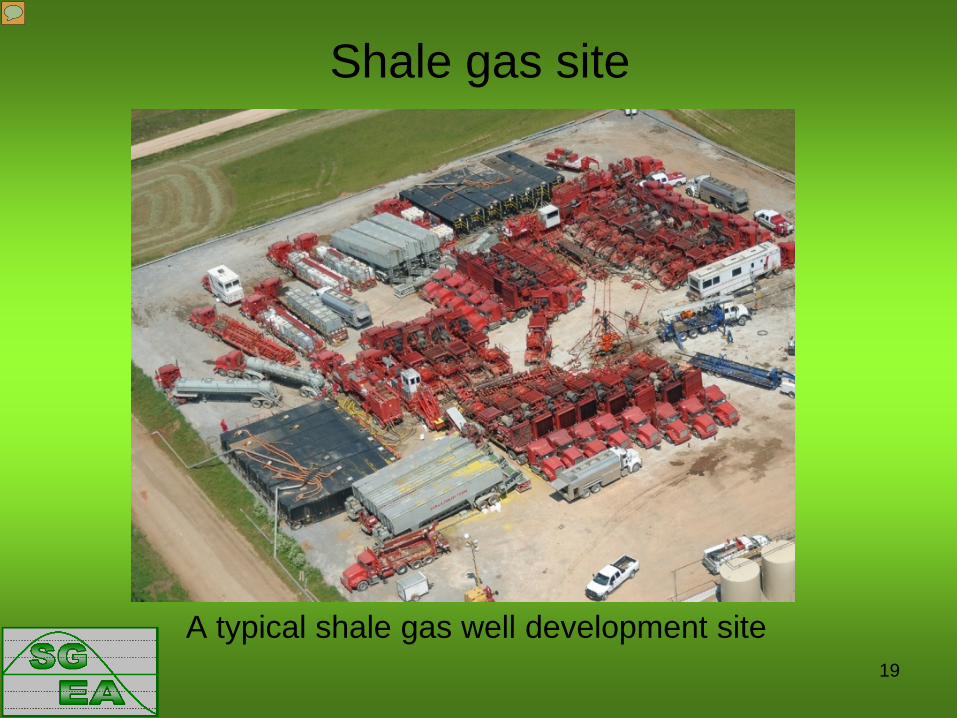
Shale gas site
A typical shale gas well development site
19
Shale Gas production
• Fracking requires (2 to 7) million US gallons of water to make up the fracking fluid to create a shale gas well
• After fracking 20-30% of the working fluid flows back up to the surface as highly contaminated waste water
• The flow back fluid comes up the well with a large quantity of shale gas (methane) that is cold vented or flared
• Liquid unloading produces more methane emissions • The high initial gas flow rate rapidly declines so that after
6-10years the well has to be reworked with another complete fracking process
20
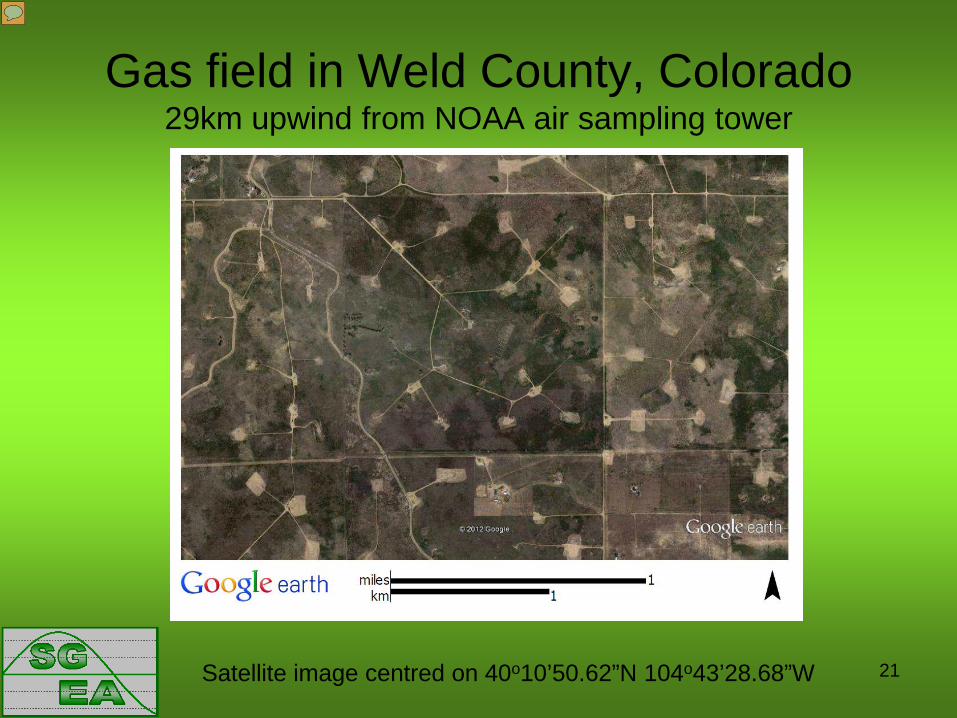
Gas field in Weld County, Colorado 29km upwind from NOAA air sampling tower
21 Satellite image centred on 40o10’50.62”N 104o43’28.68”W
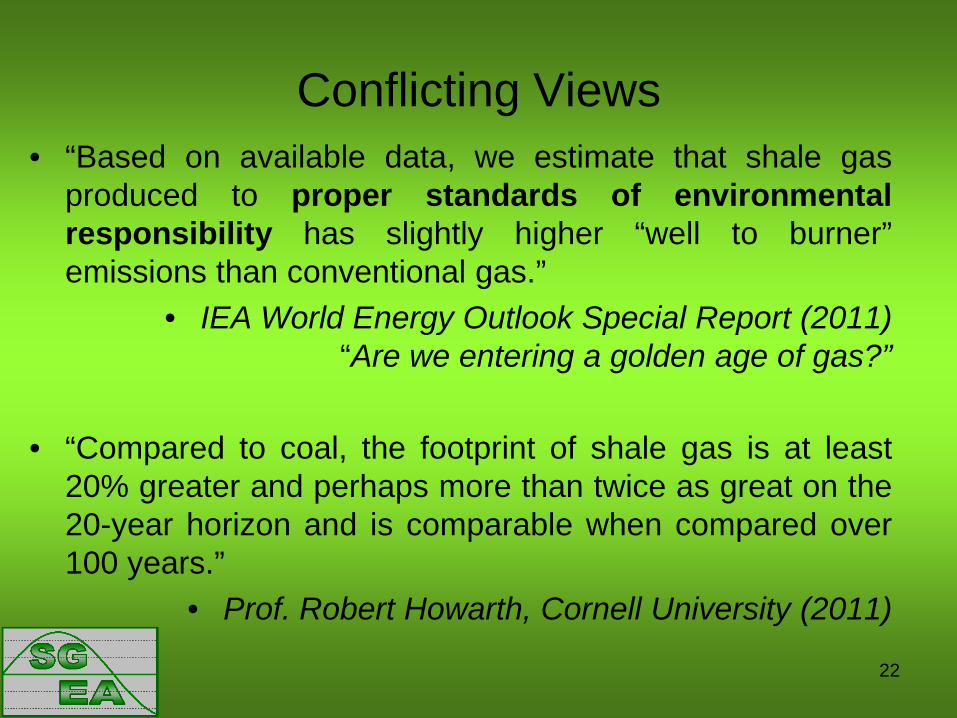
Conflicting Views • “Based on available data, we estimate that shale gas
produced to proper standards of environmental responsibility has slightly higher “well to burner” emissions than conventional gas.”
• IEA World Energy Outlook Special Report (2011) “Are we entering a golden age of gas?”
• “Compared to coal, the footprint of shale gas is at least
20% greater and perhaps more than twice as great on the 20-year horizon and is comparable when compared over 100 years.”
• Prof. Robert Howarth, Cornell University (2011)
22
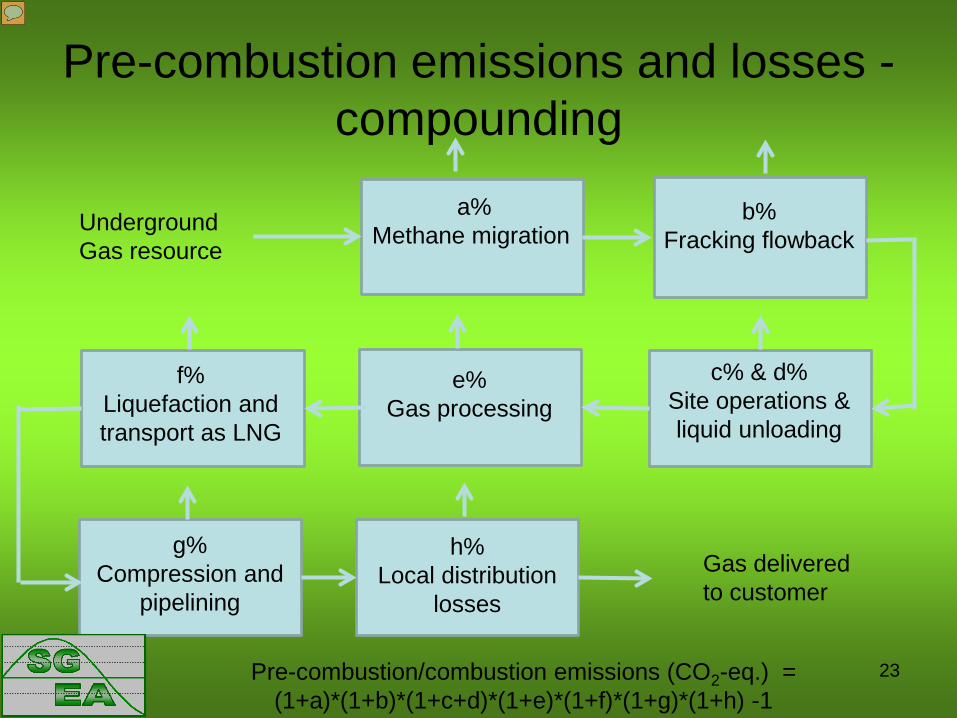
Pre-combustion emissions and losses - compounding
a% Methane migration Underground
Gas resource b%
Fracking flowback
Pre-combustion/combustion emissions (CO2-eq.) = (1+a)*(1+b)*(1+c+d)*(1+e)*(1+f)*(1+g)*(1+h) -1
Gas delivered to customer
c% & d% Site operations & liquid unloading
e% Gas processing
f% Liquefaction and transport as LNG
g% Compression and
pipelining
h% Local distribution
losses
23
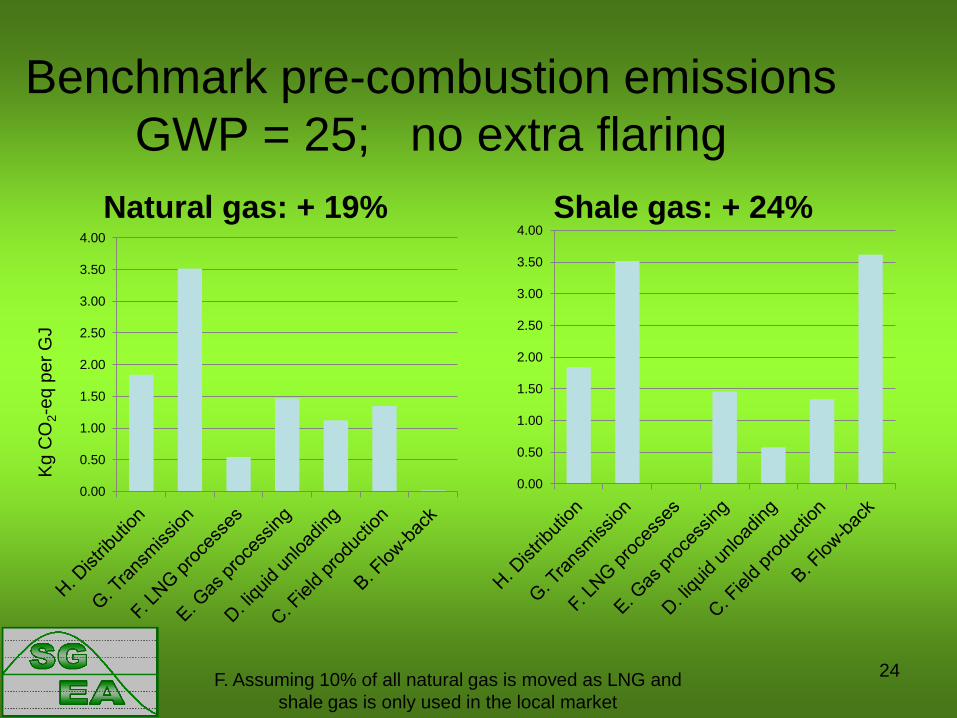
Benchmark pre-combustion emissions GWP = 25; no extra flaring
Natural gas: + 19% Shale gas: + 24%
0.00
0.50
1.00
1.50
2.00
2.50
3.00
3.50
4.00
0.00
0.50
1.00
1.50
2.00
2.50
3.00
3.50
4.00
Kg
CO
2-eq
per
GJ
F. Assuming 10% of all natural gas is moved as LNG and shale gas is only used in the local market
24
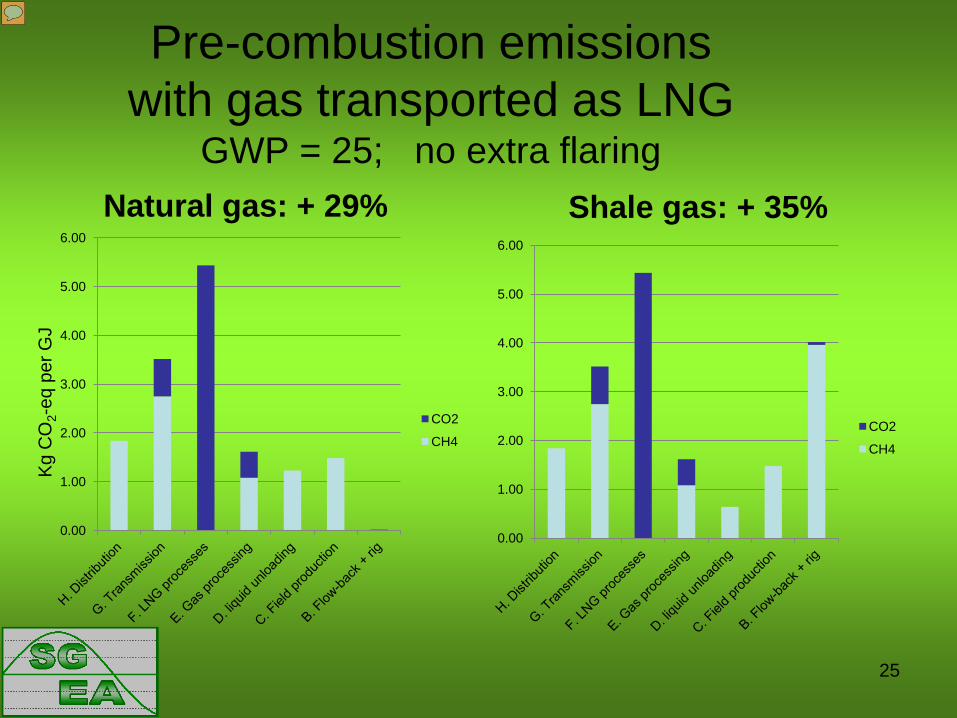
Pre-combustion emissions with gas transported as LNG
GWP = 25; no extra flaring Natural gas: + 29% Shale gas: + 35%
Kg
CO
2-eq
per
GJ
0.00
1.00
2.00
3.00
4.00
5.00
6.00
CO2
CH4
0.00
1.00
2.00
3.00
4.00
5.00
6.00
CO2
CH4
25
Flaring or cold venting at the shale gas well site ?
• Current industry best practice is to flare unsellable gas where possible (“proper standards of environmental responsibility”?)
• Legislation is moving towards reducing cold venting but • Capture of fugitive methane is difficult • Flaring of variable intermittent gas streams is difficult • Methane in air from 5% to 15% is flammable • Safe gas practices favour ventilation and dispersion • Gas delivery/supply pipeline is not connected to the site
before completion of the well and proving of flow
26
Howarth’s assumptions • No additional flaring at well site • No consideration of migration of methane to atmosphere
external to the well casing • No addition of CO2 from own use of fuel gas • No consideration of gas transport as LNG • Flow back methane = 1.9% of lifetime production • Well site leaks during production 0.3% to 1.9% • No liquid unloading from fracked wells • Methane from gas processing 0% to 0.19% • Leaks from transmission and distribution 1.4% to 3.6% • Includes aerosol effect in GWP factor • Considers 100 years and 20 years time horizon for GWP • No consideration of power generation benefit of gas
27
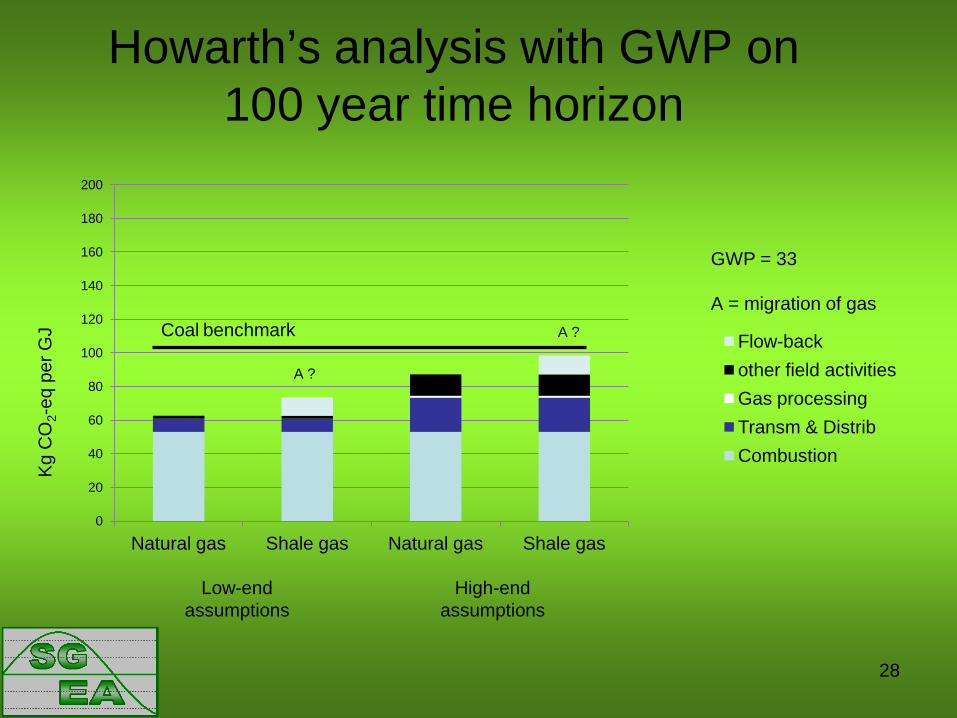
Howarth’s analysis with GWP on 100 year time horizon
0
20
40
60
80
100
120
140
160
180
200
Natural gas Shale gas Natural gas Shale gas
Flow-back other field activities Gas processing Transm & Distrib Combustion
Coal benchmark
Low-end assumptions
High-end assumptions
A ?
A ?
GWP = 33 A = migration of gas
Kg
CO
2-eq
per
GJ
28
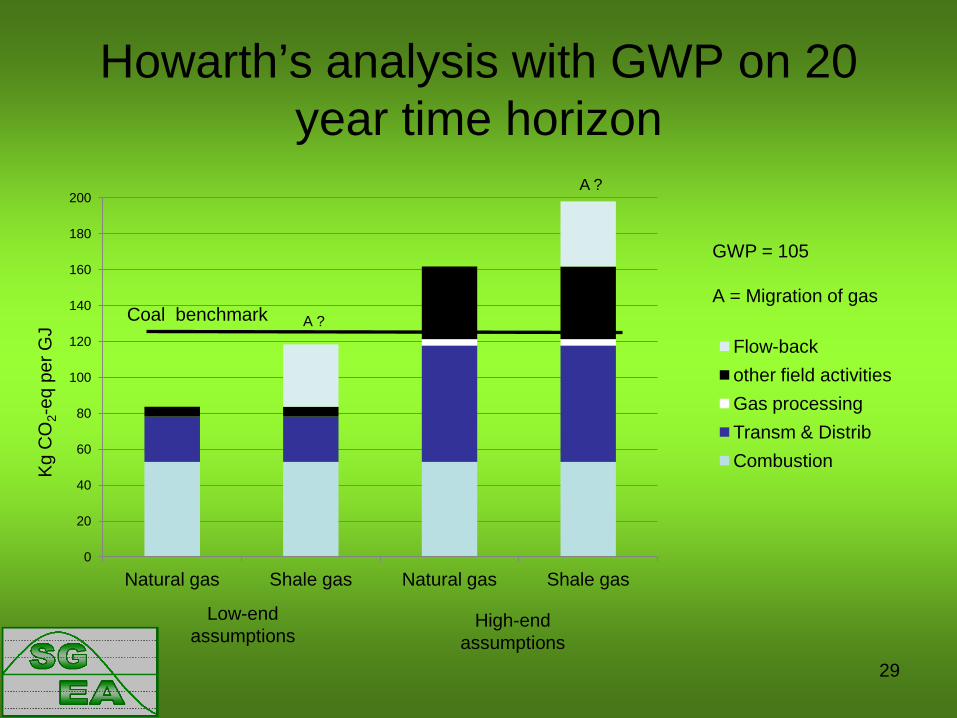
Howarth’s analysis with GWP on 20 year time horizon
0
20
40
60
80
100
120
140
160
180
200
Natural gas Shale gas Natural gas Shale gas
Flow-back other field activities Gas processing Transm & Distrib Combustion
Low-end assumptions
Coal benchmark
GWP = 105 A = Migration of gas
A ?
High-end assumptions
A ?
Kg
CO
2-eq
per
GJ
29
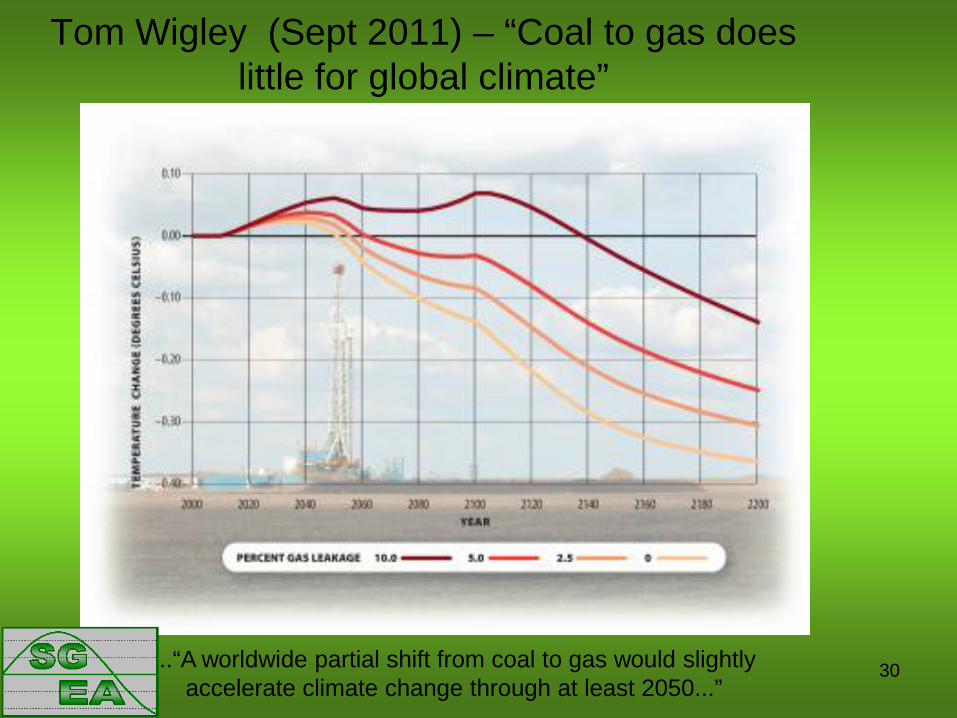
Tom Wigley (Sept 2011) – “Coal to gas does little for global climate”
...“A worldwide partial shift from coal to gas would slightly accelerate climate change through at least 2050...”
30
Shale gas methane conclusions • Major concerns over methane releases from shale gas
production were raised in a paper released this year
• An in-house scoping review of the issues was carried out and a discussion paper was prepared
• It was found that fugitive methane emission issues are broader than just fracking technology
• Recent atmospheric modelling suggests that “Switching from coal to natural gas does little for global climate”
• Under worst case assumptions shale gas is as greenhouse intensive as coal
31
Full Fuel Cycle Analysis • The person who creates the demand for a fuel product
creates the GHG emissions from making that product • FFCA includes a pro-rata share of emissions from
exploration, production, processing and transport of fuels • Default emission factors are required • As exploitation of fossil fuels becomes harder and LNG
is used, pre-combustion energy consumption increases • FFCA includes emissions from other sources of energy
used, such as diesel, electricity and natural gas • FFCA excludes embodied GHG emissions in equipment
used by the energy industries
32
Conclusions – Shale gas • Additional methane emissions occur with shale gas • Capture and flaring of that gas would require legislation • Methane emissions at shale gas sites is highly uncertain • Measurement and reporting of fugitive methane is needed • Fugitive methane issues are broader than shale gas • In the short term the climate impact of methane is more
significant than is recognised by current carbon accounting methods.
• Full Fuel Cycle Analysis is needed to address increasing pre-combustion emissions of unconventional fossil fuel technologies
33
Sea Level Rise The Copenhagen Diagnosis
• The net loss of ice from the Greenland ice sheet has accelerated since the mid-1990s and is now contributing as much as 0.7 millimeters per year to sea level rise due to both increased melting and accelerated ice flow.
• Antarctica is also losing ice mass at an increasing rate, mostly from the West Antarctic ice sheet due to increased ice flow. Antarctica is currently contributing to sea level rise at a rate nearly equal to Greenland.
• The largest unknown in the projections of sea level rise over the next century is the potential for rapid dynamic collapse of ice sheets.
34
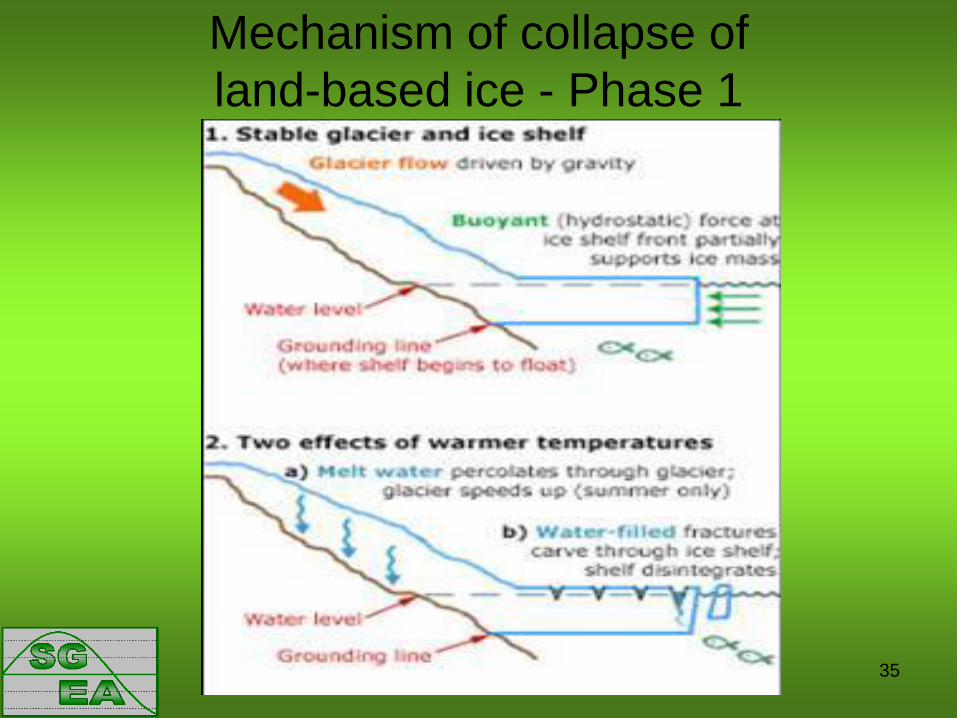
Mechanism of collapse of land-based ice - Phase 1
35
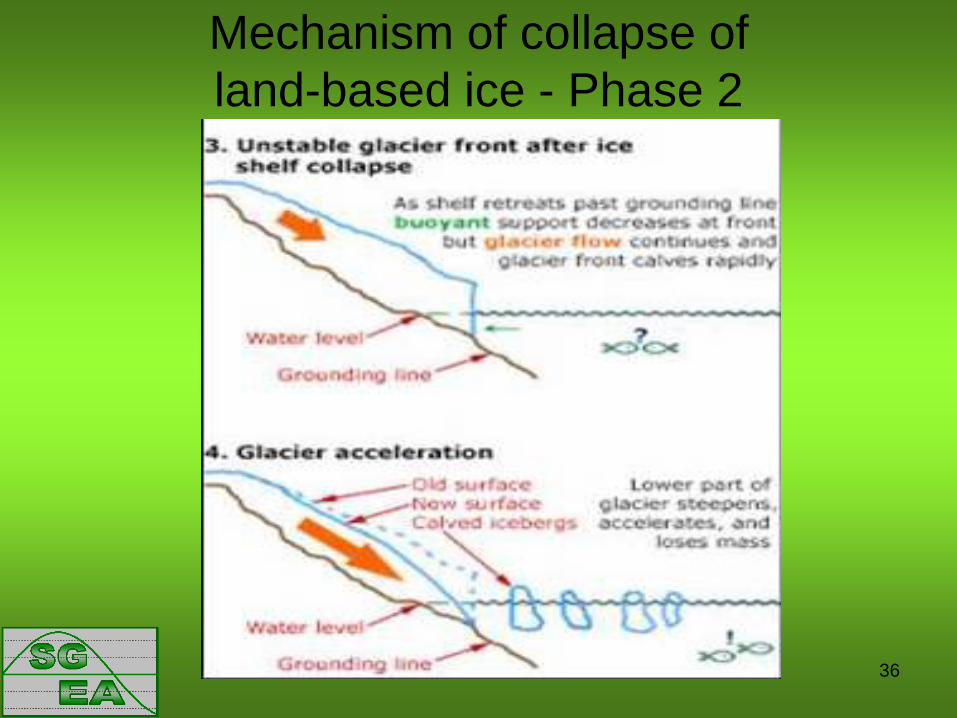
Mechanism of collapse of land-based ice - Phase 2
36
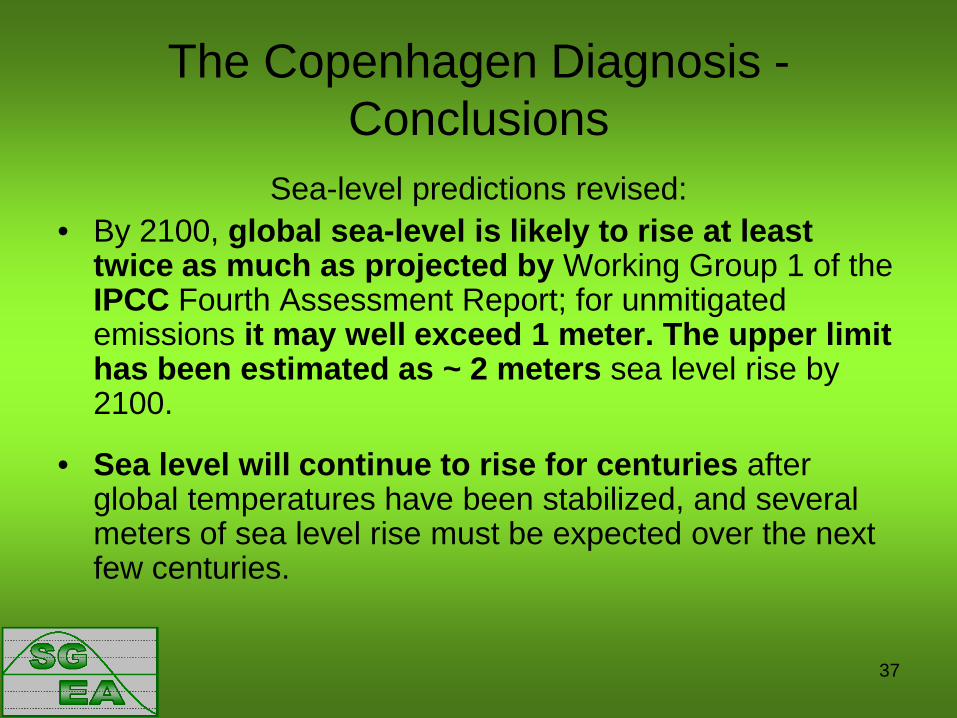
The Copenhagen Diagnosis - Conclusions
Sea-level predictions revised: • By 2100, global sea-level is likely to rise at least
twice as much as projected by Working Group 1 of the IPCC Fourth Assessment Report; for unmitigated emissions it may well exceed 1 meter. The upper limit has been estimated as ~ 2 meters sea level rise by 2100.
• Sea level will continue to rise for centuries after global temperatures have been stabilized, and several meters of sea level rise must be expected over the next few centuries.
37

What would this landscape look like with 2 metres higher Mean Sea Level ? 38
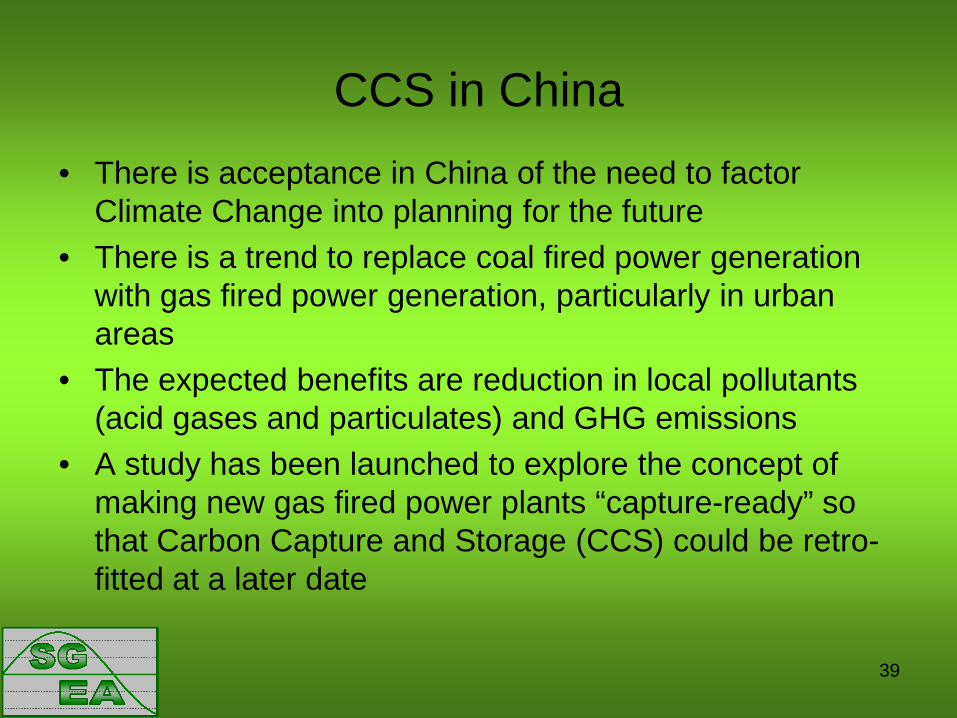
CCS in China • There is acceptance in China of the need to factor
Climate Change into planning for the future • There is a trend to replace coal fired power generation
with gas fired power generation, particularly in urban areas
• The expected benefits are reduction in local pollutants (acid gases and particulates) and GHG emissions
• A study has been launched to explore the concept of making new gas fired power plants “capture-ready” so that Carbon Capture and Storage (CCS) could be retro-fitted at a later date
39
The Sustainable Energy Forum Inc. Facilitating the use of energy for economic,
environmental and social sustainability
• Founded in the early 1990s
• Annual meeting/seminar/conference
• Occasional submissions
• SEFnews – an unmoderated email list for information and discussion ~ 100 members
• EnergyWatch – a quarterly publication
• WWW.SEF.org.nz
• WWW.EnergyWatch.org.nz


![[cover] AWFUL DISCLOSURES MARIA MONK, AS EXHIBITED …](https://img.pdfslide.us/doc/110x75/61973d4076e9a6227e218209/cover-awful-disclosures-maria-monk-as-exhibited-.jpg)