Embed Size (px)
Citation preview
Energy UseData Handbook
1990 to 2010

Aussi disponible en français sous le titre : Guide de données sur la consommation d’énergie, 1990 à 2010
Information contained in this publication or product may be reproduced in part or in whole, and by any means, for personal or public non-commercial purposes, without charge or further permission, unless otherwise specified.
You are asked to:
• exerciseduediligenceinensuringtheaccuracyofthematerialsreproduced;• indicatethecompletetitleofthematerialsreproduced,andthenameoftheauthororganization;and
• indicatethatthereproductionisacopyofanofficialworkthatispublishedby the Government of Canada and that the reproduction has not been produced in affiliation with, or with the endorsement of, the Government of Canada.
Commercialreproductionanddistributionisprohibitedexceptwithwrittenpermission from the Government of Canada’s copyright administrator, Public Works and Government Services Canada (PWGSC).
For more information, contact PWGSC at 613-996-6886 or at [email protected].
© Her Majesty the Queen in Right of Canada, 2013
Her Majesty is not responsible for the accuracy or completeness of the information contained in the reproduced material. Her Majesty shall at all times be indemnified and held harmless against any and all claims whatsoever arising out of negligence or other fault in the use of the information contained in this publication or product.
Cat. No. M141-11/2010E (Print)ISSN 1715-3174
Cat. No. M141-11/2010E-PDF (On-line)ISSN 1910-4413
Recycled paper

Preface
www.nrcan.gc.ca/eneene/index-eng.php i
This is the eleventh edition of the Energy Use Data Handbook, 1990 to 2010, which fulfils part of the mandate of Natural Resources Canada’s (NRCan’s) Office of Energy Efficiency (OEE) to strengthen and expand Canada’s commitment to energy efficiency and to reduce greenhouse gas (GHG) emissions that contribute to climate change.
The main objective of the handbook is to provide a statistical overview of Canada’s sectoral energy markets. The GHG emissions figures presented here are for analytical purposes. Readers should consult Environment Canada’s publication National Inventory Report for the official GHG inventory.
The eleventh edition of the handbook represents a re-setting of the 1990-2010 historical energy-use data, and differs from the previous edition in several ways:
• DataintegratestheresultsfromtheSurveyofSecondaryDistributorsofRefinedPetroleumProducts(SSDRPP),movingconsumptionofrefined petroleum products from those who are secondary distributors to appropriate end-uses.
• DataintegratesthefullIndustrialConsumptionofEnergy(ICE)Surveyand corresponding backcasts, which allows for a more accurate portrayal of energy consumed in the industrial sector.
• Intheresidentialsector,standbylossesindomesticwaterheatingwererevised to be input energy rather than output energy.
• Astatisticaldiscrepancyhasbeenaddedintheenergybalance.
The handbook covers five sectors at an aggregate level: residential, commercial/institutional, industrial, transportation and electricity generation. The year 1990 is the reference year for the Kyoto Protocol, whereas 2010 is the most recent year for which data are available.

Preface
www.nrcan.gc.ca/eneene/index-eng.php iii
This handbook provides data on energy use and GHG emissions as well as information on major activities and relevant indicators influencing energy use.SuchdataformthefoundationforOEEanalysisinpublicationssuchas Energy Efficiency Trends in Canada, 1990 to 2010, which assesses factors influencing changes in energy use and related changes in GHGs.
Acomprehensivedatabase,includingmostdatathattheOEEusesforitsanalysis of historical energy use and GHG emissions, is available on the following Web site: oee.nrcan.gc.ca/tables10.
For more information on this product or other services, contact the OEE by e-mail at [email protected].
This handbook was prepared by Naima Behidj, Yantao Liu, Monique Brugger, MichaelWarbanski,StéphaneLeblanc,FumikoYamadaandRositaKwan,allstaffmembersoftheDemandPolicyandAnalysisDivisionoftheOEE,whichispartofNRCan.TheprojectleaderwasJohnAppleby,withLauraOlesonproviding overall direction.
For more information, contact
Office of Energy Efficiency Natural Resources Canada 580BoothStreet,18thFloor OttawaON K1A0E4
E-mail: [email protected]

Table of Contents
www.nrcan.gc.ca/eneene/index-eng.php v
Preface . . . . . . . . . . . . . . . . . . . . . . . . . . . . . . . . . . . . . . . . . . . . . . . . . . . . . . . . . . . . . . . . . . . . . . . . . . . . . . . . . . . . . . . . i
Chapter 1 – Total End-Use Sector ....................................1The Data Situation . . . . . . . . . . . . . . . . . . . . . . . . . . . . . . . . . . . . . . . . . . . . . . . . . . . . . . . . . . . . . . . . . . . . . . . . . . 1
Canada’s Secondary Energy Use and GHG Emissions by Energy Source . . . . . . . . . . . . . . 2
Canada’s Secondary Energy Use by Sector, End-Use and Subsector . . . . . . . . . . . . . . . . . . 4
Canada’s GHG Emissions by Sector, End-Use and Subsector – Including Electricity-Related Emissions . . . . . . . . . . . . . . . . . . . . . . . . . . . . . . . . . . . . . . . . . . . . . . 8
Canada’s GHG Emissions by Sector, End-Use and Subsector – Excluding Electricity-Related Emissions . . . . . . . . . . . . . . . . . . . . . . . . . . . . . . . . . . . . . . . . . . . 12
Commodity Prices and Background Indicators . . . . . . . . . . . . . . . . . . . . . . . . . . . . . . . . . . . . . . . . . 16
Chapter 2 – Residential Sector ...................................... 19The Data Situation . . . . . . . . . . . . . . . . . . . . . . . . . . . . . . . . . . . . . . . . . . . . . . . . . . . . . . . . . . . . . . . . . . . . . . . . 19
Residential Secondary Energy Use by Energy Source and End-Use . . . . . . . . . . . . . . . . . . 22
Residential GHG Emissions by Energy Source and End-Use – Including and Excluding Electricity-Related Emissions . . . . . . . . . . . . . . . . . . . . . . . . . . . 24
Residential Housing Stock and Floor Space . . . . . . . . . . . . . . . . . . . . . . . . . . . . . . . . . . . . . . . . . . . . 26
Residential Space Heating Energy Use by Energy Source and Building Type . . . . . . . . 30
Residential Space Heating System Stock Share . . . . . . . . . . . . . . . . . . . . . . . . . . . . . . . . . . . . . . . . 32
Residential Lighting and Space Cooling Details . . . . . . . . . . . . . . . . . . . . . . . . . . . . . . . . . . . . . . . . 34
Residential Appliance Details . . . . . . . . . . . . . . . . . . . . . . . . . . . . . . . . . . . . . . . . . . . . . . . . . . . . . . . . . . . . 36
Residential Appliance Unit Energy Consumption (UEC) . . . . . . . . . . . . . . . . . . . . . . . . . . . . . . . . 38
Residential Water Heating Energy Use and Water Heater Stock Share . . . . . . . . . . . . . . . 40
Residential Energy Prices and Background Indicators . . . . . . . . . . . . . . . . . . . . . . . . . . . . . . . . . 42

Table of Contents Table of Contents
www.nrcan.gc.ca/eneene/index-eng.phpEnergy Use Data Handbook, 1990 to 2010 — February 2013vi vii
Passenger Transportation Segment . . . . . . . . . . . . . . . . . . . . . . . . . . . . . . . . . . . . . . . . . . . . . . . . . . . . 122
Passenger Transportation Secondary Energy Use by Energy Source and Transportation Mode .. . . . . . . . . . . . . . . . . . . . . . . . . . . . . . . . . . . . . . . . . . . . . . . . . . . . . . . . . . . . . . . . . 122
Passenger Transportation GHG Emissions by Energy Source and Transportation Mode .. . . . . . . . . . . . . . . . . . . . . . . . . . . . . . . . . . . . . . . . . . . . . . . . . . . . . . . . . . . . . . . . . 126
Passenger Road Transportation Secondary Energy Use and GHG Emissions by Energy Source . . . . . . . . . . . . . . . . . . . . . . . . . . . . . . . . . . . . . . . . . . . . . . . . . . . . . . . . . . . . . . . . . . . . . . 128
Passenger Transportation Explanatory Variables . . . . . . . . . . . . . . . . . . . . . . . . . . . . . . . . . . . . . . 130
Freight Transportation Segment . . . . . . . . . . . . . . . . . . . . . . . . . . . . . . . . . . . . . . . . . . . . . . . . . . . . . . . . 134
Freight Transportation Secondary Energy Use by Energy Source and Transportation Mode .. . . . . . . . . . . . . . . . . . . . . . . . . . . . . . . . . . . . . . . . . . . . . . . . . . . . . . . . . . . . . . . . . 134
Freight Transportation GHG Emissions by Energy Source and Transportation Mode .. . . . . . . . . . . . . . . . . . . . . . . . . . . . . . . . . . . . . . . . . . . . . . . . . . . . . . . . . . . . . . . . . 136
Freight Road Transportation Secondary Energy Use and GHG Emissions by Energy Source . . . . . . . . . . . . . . . . . . . . . . . . . . . . . . . . . . . . . . . . . . . . . . . . . . . . . . . . . . . . . . . . . . . . . . 138
Freight Transportation Explanatory Variables . . . . . . . . . . . . . . . . . . . . . . . . . . . . . . . . . . . . . . . . . . 140
Chapter 6 – Electricity Generation Sector ..................... 143
The Data Situation . . . . . . . . . . . . . . . . . . . . . . . . . . . . . . . . . . . . . . . . . . . . . . . . . . . . . . . . . . . . . . . . . . . . . . . 143
Electricity Generation Energy Use and Generation by Energy Source . . . . . . . . . . . . . . . 144
Electricity Generation GHG Emissions by Energy Source . . . . . . . . . . . . . . . . . . . . . . . . . . . . . 146
Appendix A1 – Reallocation of RESD Data ................ 149Appendix A2 – Reconciliation of Data ...................... 153Appendix B – Reconciliation of Definitions ............... 157Appendix C – Glossary of Terms ............................ 161Appendix D – List of Abbreviations ......................... 169
Chapter 3 – Commercial/Institutional Sector .................. 45
The Data Situation . . . . . . . . . . . . . . . . . . . . . . . . . . . . . . . . . . . . . . . . . . . . . . . . . . . . . . . . . . . . . . . . . . . . . . . . 45
Commercial/Institutional Secondary Energy Use by Energy Source, End-Use and Activity Type . . . . . . . . . . . . . . . . . . . . . . . . . . . . . . . . . . . . . . . . . . . . . . . . . . . . . . . . . . . . . 48
Commercial/Institutional GHG Emissions by Energy Source, End-Use and Activity Type – Including Electricity-Related Emissions . . . . . . . . . . . . . . . . . . . . . . . . 52
Commercial/Institutional GHG Emissions by End-Use and Activity Type – Excluding Electricity-Related Emissions . . . . . . . . . . . . . . . . . . . . . . . . . . . . . . . . . . . . . . . . . . . 54
Commercial/Institutional Secondary Energy Use by Activity Type and Energy Source . . . . . . . . . . . . . . . . . . . . . . . . . . . . . . . . . . . . . . . . . . . . . . . . . . . . . . . . . . . . . . . . . . . . . . . . . . . 56
Commercial/Institutional Energy Prices and Background Indicators . . . . . . . . . . . . . . . . . 66
Chapter 4 – Industrial Sector ......................................... 69
The Data Situation . . . . . . . . . . . . . . . . . . . . . . . . . . . . . . . . . . . . . . . . . . . . . . . . . . . . . . . . . . . . . . . . . . . . . . . . 69
Industrial Secondary Energy Use and GHG Emissions by Energy Source . . . . . . . . . . . . 72
Industrial Secondary Energy Use by Industry . . . . . . . . . . . . . . . . . . . . . . . . . . . . . . . . . . . . . . . . . . . 76
Industrial GHG Emissions by Industry – Including Electricity-Related Emissions . . . . 82
Industrial GHG Emissions by Industry – Excluding Electricity-Related Emissions . . . 88
Industrial Gross Domestic Product by Industry . . . . . . . . . . . . . . . . . . . . . . . . . . . . . . . . . . . . . . . . . 94
Industrial Energy Intensity by Industry . . . . . . . . . . . . . . . . . . . . . . . . . . . . . . . . . . . . . . . . . . . . . . . . . . 98
Industrial Energy Prices and Background Indicators . . . . . . . . . . . . . . . . . . . . . . . . . . . . . . . . . . 104
Chapter 5 – Transportation Sector ................................ 107
The Data Situation . . . . . . . . . . . . . . . . . . . . . . . . . . . . . . . . . . . . . . . . . . . . . . . . . . . . . . . . . . . . . . . . . . . . . . . 107
Transportation Secondary Energy Use by Energy Source and Transportation Mode .. . . . . . . . . . . . . . . . . . . . . . . . . . . . . . . . . . . . . . . . . . . . . . . . . . . . . . . . . . . . . . . . . 112
Transportation GHG Emissions by Energy Source and Transportation Mode .. . . . . . . 116
Transportation Energy Prices and Background Indicators . . . . . . . . . . . . . . . . . . . . . . . . . . . . 120

www.nrcan.gc.ca/eneene/index-eng.php 1
1Total End-Use Sector
The Data SituationThe aggregate energy use data presented in this handbook are based on StatisticsCanada’sReport on Energy Supply and Demand in Canada (Cat. No. 57-003-X), Canada’s official report on the energy supply and demand balance in Canada. Greenhouse gas emissions data are estimated using emissions factors developed by Environment Canada.
The Office of Energy Efficiency has developed energy models and/or databases for each sector of the economy presented in this report (i.e. residential, commercial/institutional, industrial, transportation and electricity generation) to assess trends in energy use in the Canadian economy. The data situation for each specific sector is outlined at the beginning of the corresponding chapter of this handbook.
Crude oil and natural gas commodity prices (wholesale prices) are providedbytheOilandGasPolicyandRegulatoryAffairsDivisionofNatural Resources Canada. The crude oil wellhead price is provided by the Energy Information Administration of the U.S. Department ofEnergy.
Due to rounding, the numbers in the tables may not add up or calculate to their reported
totals or growth rates.

www.nrcan.gc.ca/eneene/index-eng.phpEnergy Use Data Handbook, 1990 to 2010 — February 20132 3
1 Total End-Use Sector 1Total End-Use Sector
Canada’s Secondary Energy Use and GHG Emissions by Energy Source
1990 1995 2001 2002 2003 2004 2005 2006 2007 2008 2009 2010 Total Growth 1990–2010
Total Energy Use (PJ)a,b,c 6,931.3 7,475.1 7,815.4 8,100.3 8,326.0 8,582.0 8,575.6 8,401.3 8,816.1 8,703.9 8,339.5 8,479.1 22.3%
Energy Use by Energy Source (PJ)
Electricity 1,550.1 1,664.6 1,782.4 1,835.5 1,853.6 1,866.8 1,907.2 1,873.6 1,924.6 1,928.5 1,756.8 1,779.8 14.8%
Natural Gas 1,777.6 1,992.9 1,949.3 2,098.6 2,146.8 2,122.6 2,077.9 2,005.6 2,229.7 2,248.5 2,201.9 2,219.4 24.9%
Motor Gasoline1 1,176.5 1,218.8 1,346.1 1,385.9 1,407.0 1,433.7 1,428.5 1,430.9 1,474.4 1,459.3 1,478.0 1,511.0 28.4%
Oil2 1,202.2 1,188.4 1,313.3 1,275.8 1,383.5 1,444.8 1,445.9 1,395.0 1,476.6 1,457.5 1,350.0 1,438.8 19.7%
Aviation Gasoline 5.5 4.2 3.5 3.4 3.1 2.9 3.3 3.0 3.1 3.0 2.9 2.6 -53.0%
Aviation Turbo Fuel 181.9 183.9 215.3 216.7 214.8 240.0 253.6 251.7 254.2 239.6 219.1 228.2 25.4%
Still Gas and Petroleum Coke 309.9 375.6 378.3 433.6 425.7 479.9 465.7 467.5 486.9 445.7 485.6 474.4 53.1%
Wood Waste and Pulping Liquor 341.0 432.8 409.0 441.0 476.0 573.2 570.5 545.2 519.9 462.5 432.7 416.9 22.2%
Other3 308.4 330.5 330.0 317.1 318.4 319.0 324.8 338.2 345.0 355.8 307.3 314.2 1.9%
Residential Wood 78.2 83.3 88.3 92.7 97.0 99.2 98.2 90.6 101.7 103.5 105.2 93.8 19.9%
Total GHG Emissions Including Electricity (Mt of CO2e)a,b,c,d
398.7 416.0 461.8 472.5 491.5 495.7 489.4 479.8 510.0 497.4 467.7 484.4 21.5%
GHG Emissions by Energy Source (Mt of CO2e)
Electricity 86.4 83.9 112.1 113.0 119.7 113.2 109.8 106.3 112.0 105.2 87.6 92.8 7.4%
Natural Gas 90.7 101.1 99.7 107.7 111.1 109.6 107.3 104.0 117.7 117.9 116.1 117.6 29.7%
Motor Gasoline1 81.3 85.5 93.9 96.6 98.1 99.4 98.5 98.2 100.7 99.2 100.0 101.9 25.4%
Oil2 87.4 86.2 95.6 92.7 100.5 105.0 105.1 101.5 107.5 106.1 97.9 104.4 19.4%
Aviation Gasoline 0.4 0.3 0.3 0.3 0.2 0.2 0.2 0.2 0.2 0.2 0.2 0.2 -53.0%
Aviation Turbo Fuel 12.8 12.9 14.7 14.8 14.7 16.4 17.3 17.2 17.4 16.4 15.0 15.6 22.0%
Still Gas and Petroleum Coke 17.2 21.9 21.7 24.4 24.1 28.7 27.4 27.7 29.0 26.1 28.6 27.9 62.1%
Wood Waste and Pulping Liquor 0.2 0.3 0.3 0.3 0.4 0.4 0.4 0.4 0.4 0.4 0.3 0.3 56.6%
Other3 20.7 22.1 21.9 20.9 20.9 20.8 21.1 22.4 23.1 23.9 19.9 21.8 5.2%
Residential Wood 1.6 1.7 1.8 1.9 2.0 2.0 2.0 1.8 2.1 2.1 2.1 1.9 19.9%
Total GHG Emissions Excluding Electricity (Mt of CO2e)a,b,c,d
312.3 332.0 349.7 359.5 371.9 382.6 379.6 373.5 398.0 392.3 380.0 391.6 25.4%
1) “Motor Gasoline” includes ethanol. See transportation tables for details.2) “Oil” includes diesel fuel oil, light fuel oil, kerosene and heavy fuel oil.3) “Other” includes coal, coke, coke oven gas, LPG/NGL, steam and waste fuels from the cement industry.
Sources:a) Statistics Canada, Report on Energy Supply and Demand in Canada, 1990–2010, Ottawa, 2012.b) Natural Resources Canada, Residential End-Use Model, Ottawa, 2012.c) Canadian Industrial Energy End-Use Data and Analysis Centre, Development of Energy Intensity Indicators
for Canadian Industry 1990 to 2010, Simon Fraser University, 2012.d) Environment Canada, National Inventory Report 1990–2010: Greenhouse Gas Sources and Sinks in Canada,
Ottawa, 2012.

www.nrcan.gc.ca/eneene/index-eng.phpEnergy Use Data Handbook, 1990 to 2010 — February 20134 5
1 Total End-Use Sector 1Total End-Use Sector
Canada’s Secondary Energy Use by Sector, End-Use and Subsector
1990 1995 2001 2002 2003 2004 2005 2006 2007 2008 2009 2010 Total Growth 1990–2010
Total Energy Use (PJ)a,b,e 6,931.3 7,475.1 7,815.4 8,100.3 8,326.0 8,582.0 8,575.6 8,401.3 8,816.1 8,703.9 8,339.5 8,479.1 22.3%
Residential (PJ)a,b 1,282.3 1,339.6 1,334.2 1,393.7 1,435.2 1,440.8 1,428.0 1,372.2 1,502.1 1,504.9 1,429.3 1,360.7 6.1%
Space Heating 816.6 862.6 815.5 869.7 908.9 915.3 894.2 845.4 960.2 967.9 933.1 851.5 4.3%
Water Heating 219.8 231.7 242.7 245.0 249.1 246.4 246.0 246.2 254.6 250.2 239.5 237.9 8.2%
Appliances 183.9 179.3 191.9 190.3 192.8 198.2 192.7 193.3 198.8 203.6 187.3 190.0 3.3%
Major Appliances 154.5 143.6 141.0 137.1 136.6 137.8 132.2 129.9 131.3 131.1 118.7 117.1 -24.2%
Other Appliances1 29.5 35.7 50.9 53.2 56.2 60.4 60.5 63.4 67.6 72.5 68.7 72.9 147.6%
Lighting 51.6 52.0 60.9 60.6 62.5 63.8 60.9 60.5 61.4 61.6 54.9 54.8 6.2%
Space Cooling 10.4 13.9 23.1 28.1 21.9 17.1 34.1 26.8 27.1 21.6 14.4 26.5 155.9%
Commercial/Institutional (PJ)a,c 867.0 960.8 1,047.2 1,109.1 1,126.0 1,112.5 1,084.2 1,035.6 1,104.5 1,143.2 1,079.0 1,057.3 22.0%
Space Heating 471.8 524.4 540.2 586.1 599.6 587.7 544.3 497.8 537.0 558.2 531.3 478.2 1.4%
Water Heating 67.5 72.7 90.3 87.1 90.5 93.2 92.9 95.0 93.7 97.2 92.7 92.2 36.7%
Auxiliary Equipment 83.2 97.7 132.6 138.3 145.9 153.7 158.0 163.6 184.9 203.8 195.1 202.4 143.2%
Auxiliary Motors 91.1 97.1 93.7 93.4 94.1 94.5 88.0 89.0 91.6 95.5 94.7 97.6 7.1%
Lighting 114.2 121.8 120.7 118.8 117.7 118.6 108.9 110.7 116.1 120.5 120.0 123.7 8.3%
Space Cooling 30.2 39.3 62.0 77.5 70.4 56.9 83.8 71.5 72.3 59.6 38.1 55.7 84.2%
Street Lightingf 8.9 7.8 7.7 7.8 7.8 7.8 8.3 8.1 9.0 8.6 7.1 7.5 -16.3%
Industrial (PJ)a,e 2,710.0 2,963.1 2,962.1 3,107.5 3,189.3 3,366.0 3,357.7 3,314.4 3,427.6 3,282.8 3,121.1 3,227.6 19.1%
Mining 347.8 445.0 518.3 535.1 634.0 620.0 666.8 710.6 843.2 842.4 904.1 993.5 185.7%
Pulp and Paper 728.2 814.8 779.5 805.5 816.3 901.5 859.8 778.4 750.3 653.6 602.2 565.9 -22.3%
Iron and Steel 219.4 247.0 229.3 246.7 241.3 249.7 239.7 251.9 256.5 249.8 188.9 205.4 -6.4%
Smelting and Refining 183.3 219.3 246.1 251.0 256.1 248.3 260.3 262.1 255.2 260.5 227.1 231.5 26.3%
Cement 59.3 61.9 65.5 69.3 66.3 68.9 72.0 75.0 67.2 65.4 60.7 59.3 0.0%
Chemicals 223.2 250.8 230.5 230.7 214.5 244.9 236.0 247.7 242.8 241.4 232.8 254.7 14.1%
Petroleum Refining 323.1 325.2 312.9 376.2 350.6 395.3 351.4 328.6 339.3 317.0 310.5 308.3 -4.6%
Other Manufacturing 551.1 542.8 509.4 514.7 524.5 541.6 572.1 557.0 568.7 547.2 503.4 506.5 -8.1%
Forestry 7.7 7.9 20.1 20.0 23.0 28.2 28.8 31.3 30.0 30.9 25.6 29.5 281.0%
Construction 66.9 48.4 50.6 58.3 62.8 67.7 70.9 71.9 74.5 74.6 65.9 73.0 9.1%
1) “Other Appliances” includes small appliances such as televisions, video cassette recorders, digital video disc players, radios, computers and toasters.
Sources:a) Statistics Canada, Report on Energy Supply and Demand in Canada, 1990–2010, Ottawa, 2012.b) Natural Resources Canada, Residential End-Use Model, Ottawa, 2012.c) Natural Resources Canada, Commercial/Institutional End-Use Model, Ottawa, 2012.
d) Natural Resources Canada, Transportation End-Use Model, Ottawa, 2012.e) Canadian Industrial Energy End-Use Data and Analysis Centre, Development of Energy Intensity Indicators
for Canadian Industry 1990 to 2010, Simon Fraser University, 2012.f) Statistics Canada, Electric Power Generation, Transmission and Distribution, 2006–2010, Ottawa, 2012
(Cat. No. 57-202-X).
table continued on next page

www.nrcan.gc.ca/eneene/index-eng.phpEnergy Use Data Handbook, 1990 to 2010 — February 20136 7
1 Total End-Use Sector 1Total End-Use Sector
1) “Other Appliances” includes small appliances such as televisions, video cassette recorders, digital video disc players, radios, computers and toasters.
Sources:a) Statistics Canada, Report on Energy Supply and Demand in Canada, 1990–2010, Ottawa, 2012.b) Natural Resources Canada, Residential End-Use Model, Ottawa, 2012.c) Natural Resources Canada, Commercial/Institutional End-Use Model, Ottawa, 2012.d) Natural Resources Canada, Transportation End-Use Model, Ottawa, 2012.e) Canadian Industrial Energy End-Use Data and Analysis Centre, Development of Energy Intensity Indicators
for Canadian Industry 1990 to 2010, Simon Fraser University, 2012.f) Statistics Canada, Electric Power Generation, Transmission and Distribution, 2006–2010, Ottawa, 2012
(Cat. No. 57-202-X).
continued from previous tableCanada’s Secondary Energy Use by Sector, End-Use and Subsector (continued)
1990 1995 2001 2002 2003 2004 2005 2006 2007 2008 2009 2010 Total Growth 1990–2010
Total Transportation (PJ)a 1,877.9 2,009.8 2,255.1 2,282.2 2,358.6 2,446.2 2,486.3 2,456.9 2,554.5 2,541.9 2,506.6 2,595.0 38.2%
Passenger Transportation (PJ)a,d 1,179.0 1,190.4 1,274.0 1,308.8 1,314.8 1,352.4 1,363.9 1,351.6 1,399.9 1,375.6 1,376.6 1,390.3 17.9%
Cars 721.2 682.0 640.4 652.2 648.5 647.8 636.1 628.8 645.9 631.1 637.1 625.2 -13.3%
Trucks 216.9 271.6 371.8 389.8 400.4 415.5 423.8 422.8 447.0 447.9 465.2 479.5 121.1%
Motorcycles 2.5 2.2 2.7 3.1 3.3 3.6 3.6 3.8 4.1 4.2 5.7 5.8 130.8%
Buses 53.7 51.4 44.3 48.2 48.9 47.3 48.7 46.0 48.8 51.6 48.8 51.2 -4.6%
Air 180.9 180.8 211.9 212.8 211.1 235.6 249.1 247.5 251.4 237.7 217.6 225.5 24.7%
Rail 3.8 2.3 3.0 2.8 2.6 2.5 2.7 2.7 2.8 3.2 2.3 2.9 -21.7%
Freight Transportation (PJ)a,d 645.6 757.2 890.8 880.6 949.2 996.9 1,023.3 1,005.0 1,052.8 1,064.0 1,038.0 1,100.7 70.5%
Light Trucks 99.7 120.0 153.0 157.6 160.8 166.3 167.5 169.5 180.1 180.9 187.0 192.6 93.1%
Medium Trucks 134.8 162.0 155.8 145.7 161.4 177.0 154.7 165.3 157.6 153.6 150.8 156.9 16.4%
Heavy Trucks 212.3 287.7 377.7 384.6 424.4 436.0 473.0 464.4 491.9 505.3 515.9 547.3 157.8%
Air 6.5 7.3 6.9 7.3 6.8 7.2 7.8 7.2 5.8 4.9 4.4 5.3 -19.1%
Rail 85.7 78.6 80.7 73.5 74.4 76.6 81.7 85.6 91.8 97.0 62.5 80.7 -5.8%
Marine 106.5 101.7 116.7 112.0 121.5 133.7 138.6 113.0 125.7 122.2 117.4 117.9 10.6%
Off-Road (PJ)d 53.3 62.1 90.3 92.8 94.5 96.8 99.1 100.4 101.8 102.3 91.9 104.1 95.1%
Agriculture (PJ)a 194.2 201.8 216.8 207.9 216.9 216.5 219.5 222.3 227.4 231.1 203.5 238.5 22.8%

www.nrcan.gc.ca/eneene/index-eng.phpEnergy Use Data Handbook, 1990 to 2010 — February 20138 9
1 Total End-Use Sector 1Total End-Use Sector
Canada’s GHG Emissions by Sector, End-Use and Subsector – Including Electricity-Related Emissions
1990 1995 2001 2002 2003 2004 2005 2006 2007 2008 2009 2010 Total Growth 1990–2010
Total GHG Emissions Including Electricity (Mt of CO2e)a,b,d,e,f
398.7 416.0 461.8 472.5 491.5 495.7 489.4 479.8 510.0 497.4 467.7 484.4 21.5%
Residential (Mt of CO2e)a,b,e 68.7 67.6 73.3 75.7 79.1 77.6 75.1 71.9 79.5 77.0 70.5 68.4 -0.5%
Space Heating 43.2 43.3 42.8 45.4 47.8 47.6 45.7 43.1 49.4 48.5 45.6 42.1 -2.6%
Water Heating 11.8 11.9 13.1 13.2 13.5 13.2 12.9 12.9 13.4 12.9 12.1 12.2 2.9%
Appliances 10.2 9.0 12.0 11.7 12.4 12.0 11.1 10.9 11.5 11.1 9.3 9.9 -3.4%
Major Appliances 8.6 7.2 8.8 8.4 8.7 8.3 7.6 7.3 7.6 7.1 5.9 6.1 -29.2%
Other Appliances1 1.6 1.8 3.2 3.3 3.6 3.7 3.5 3.6 3.9 4.0 3.4 3.8 131.7%
Lighting 2.9 2.6 3.8 3.7 4.0 3.9 3.5 3.4 3.6 3.4 2.7 2.9 -0.6%
Space Cooling 0.6 0.7 1.5 1.7 1.4 1.0 2.0 1.5 1.6 1.2 0.7 1.4 139.5%
Commercial/Institutional (Mt of CO2e)a,c,e 47.4 50.1 60.1 63.0 65.4 62.7 59.3 56.4 61.0 60.8 54.6 54.6 15.1%
Space Heating 25.5 27.8 29.1 31.5 32.5 31.6 28.7 26.2 28.4 29.0 26.9 24.4 -4.6%
Water Heating 3.6 3.9 4.9 4.7 4.9 5.1 5.0 5.1 5.0 5.1 4.9 4.8 32.3%
Auxiliary Equipment 4.6 5.0 8.2 8.5 9.3 9.3 9.1 9.3 10.7 11.1 9.8 10.6 128.7%
Auxiliary Motors 5.1 4.9 5.9 5.8 6.1 5.7 5.1 5.0 5.3 5.2 4.7 5.1 0.2%
Lighting 6.4 6.1 7.6 7.3 7.6 7.2 6.3 6.3 6.8 6.6 6.0 6.5 1.3%
Space Cooling 1.7 2.0 3.9 4.7 4.5 3.4 4.8 4.0 4.2 3.2 1.9 2.9 72.4%
Street Lightingg 0.5 0.4 0.5 0.5 0.5 0.5 0.5 0.5 0.5 0.5 0.4 0.4 -21.7%
Industrial (Mt of CO2e)a,e,f 138.1 142.9 154.5 158.8 165.7 168.6 165.6 164.7 175.7 167.1 155.6 165.9 20.2%
Mining 22.0 27.2 33.3 34.2 41.0 39.9 41.9 44.6 53.9 53.8 57.4 63.0 186.1%
Pulp and Paper 24.3 22.4 24.0 23.5 23.8 23.0 20.3 17.9 17.9 14.7 12.7 12.4 -48.8%
Iron and Steel 14.6 16.1 15.4 16.2 16.0 16.4 15.6 16.6 17.0 16.4 12.2 13.5 -7.8%
Smelting and Refining 10.8 11.8 15.5 15.4 16.5 15.2 15.3 15.2 15.3 14.9 11.9 12.7 17.4%
Cement 4.4 4.6 5.1 5.4 5.5 5.6 5.9 6.1 5.4 5.3 4.9 4.8 9.9%
Chemicals 10.8 11.9 12.2 11.9 11.4 12.7 12.0 12.5 12.4 12.0 11.0 12.4 15.4%
Petroleum Refining 17.9 18.8 17.8 20.8 19.6 23.4 20.6 19.3 20.0 18.0 17.8 17.8 -0.1%
Other Manufacturing 28.5 26.4 26.4 26.0 26.2 25.9 27.2 25.3 26.6 24.8 21.4 22.3 -21.7%
Forestry 0.6 0.6 1.5 1.5 1.7 2.0 2.1 2.3 2.2 2.3 1.9 2.2 286.0%
Construction 4.3 3.2 3.4 3.8 4.1 4.4 4.7 4.8 4.9 5.0 4.4 4.8 12.2%
1) “Other Appliances” includes small appliances such as televisions, video cassette recorders, digital video disc players, radios, computers and toasters.
Sources:a) Statistics Canada, Report on Energy Supply and Demand in Canada, 1990–2010, Ottawa, 2012.b) Natural Resources Canada, Residential End-Use Model, Ottawa, 2012.c) Natural Resources Canada, Commercial/Institutional End-Use Model, Ottawa, 2012.
d) Natural Resources Canada, Transportation End-Use Model, Ottawa, 2012.e) Environment Canada, National Inventory Report 1990–2010: Greenhouse Gas Sources and Sinks in Canada,
Ottawa, 2012.f) Canadian Industrial Energy End-Use Data and Analysis Centre, Development of Energy Intensity Indicators
for Canadian Industry 1990 to 2010, Simon Fraser University, 2012.g) Statistics Canada, Electric Power Generation, Transmission and Distribution, 2006–2010, Ottawa, 2012
(Cat. No. 57-202-X).
table continued on next page

www.nrcan.gc.ca/eneene/index-eng.phpEnergy Use Data Handbook, 1990 to 2010 — February 201310 11
1 Total End-Use Sector 1Total End-Use Sector
1) “Other Appliances” includes small appliances such as televisions, video cassette recorders, digital video disc players, radios, computers and toasters.
Sources:a) Statistics Canada, Report on Energy Supply and Demand in Canada, 1990–2010, Ottawa, 2012.b) Natural Resources Canada, Residential End-Use Model, Ottawa, 2012.c) Natural Resources Canada, Commercial/Institutional End-Use Model, Ottawa, 2012.d) Natural Resources Canada, Transportation End-Use Model, Ottawa, 2012.e) Environment Canada, National Inventory Report 1990–2010: Greenhouse Gas Sources and Sinks in Canada,
Ottawa, 2012.f) Canadian Industrial Energy End-Use Data and Analysis Centre, Development of Energy Intensity Indicators
for Canadian Industry 1990 to 2010, Simon Fraser University, 2012.g) Statistics Canada, Electric Power Generation, Transmission and Distribution, 2006–2010, Ottawa, 2012
(Cat. No. 57-202-X).
continued from previous table
Canada’s GHG Emissions by Sector, End-Use and Subsector – Including Electricity-Related Emissions (continued)
1990 1995 2001 2002 2003 2004 2005 2006 2007 2008 2009 2010 Total Growth 1990–2010
Total Transportation (Mt of CO2e)a,d,e 131.4 141.7 158.8 160.7 166.0 171.7 174.1 171.4 177.8 176.5 173.3 179.2 36.4%
Passenger Transportation (Mt of CO2e)a,d,e 81.7 83.7 88.9 91.4 91.7 93.9 94.2 92.9 95.8 93.8 93.4 94.1 15.1%
Cars 49.8 48.0 44.8 45.6 45.3 45.0 43.9 43.2 44.1 42.9 43.1 42.1 -15.4%
Light Trucks 15.1 19.2 26.2 27.5 28.2 29.1 29.5 29.2 30.7 30.5 31.5 32.3 114.5%
Motorcycles 0.2 0.1 0.2 0.2 0.2 0.2 0.2 0.3 0.3 0.3 0.4 0.4 125.2%
Buses 3.6 3.5 3.1 3.3 3.4 3.3 3.4 3.2 3.4 3.6 3.4 3.6 -2.1%
Air 12.7 12.7 14.5 14.6 14.4 16.1 17.0 16.9 17.2 16.3 14.9 15.4 21.2%
Rail 0.3 0.2 0.2 0.2 0.2 0.2 0.2 0.2 0.2 0.2 0.2 0.2 -20.9%
Freight Transportation (Mt of CO2e)a,d,e 46.0 53.8 63.8 63.0 67.9 71.3 73.2 71.7 75.1 75.9 73.6 78.1 69.8%
Light Trucks 6.8 8.3 10.7 11.0 11.3 11.6 11.6 11.6 12.3 12.3 12.6 13.0 90.8%
Medium Trucks 9.2 11.0 10.7 10.1 11.1 12.2 10.7 11.4 10.9 10.6 10.4 10.9 18.0%
Heavy Trucks 14.8 20.0 26.7 27.2 30.0 30.8 33.5 32.8 34.8 35.8 36.5 38.7 162.3%
Air 0.5 0.5 0.5 0.5 0.5 0.5 0.5 0.5 0.4 0.3 0.3 0.4 -21.4%
Rail 6.7 6.1 6.3 5.8 5.8 6.0 6.4 6.7 7.2 7.6 4.9 6.3 -4.9%
Marine 8.2 7.8 8.9 8.5 9.2 10.1 10.5 8.6 9.5 9.2 8.8 8.9 9.1%
Off-Road (Mt of CO2e)d,e 3.6 4.2 6.1 6.3 6.4 6.5 6.7 6.8 6.9 6.9 6.2 7.0 93.2%
Agriculture (Mt of CO2e)a,e 13.2 13.6 15.2 14.4 15.2 15.1 15.2 15.4 15.9 16.0 13.7 16.3 24.1%

www.nrcan.gc.ca/eneene/index-eng.phpEnergy Use Data Handbook, 1990 to 2010 — February 201312 13
1 Total End-Use Sector 1Total End-Use Sector
Canada’s GHG Emissions by Sector, End-Use and Subsector – Excluding Electricity-Related Emissions
1990 1995 2001 2002 2003 2004 2005 2006 2007 2008 2009 2010 Total Growth 1990–2010
Total GHG Emissions Excluding Electricity (Mt of CO2e)a,b,d,e,f
312.3 332.0 349.7 359.5 371.9 382.6 379.6 373.5 398.0 392.3 380.0 391.6 25.4%
Residential (Mt of CO2e)a,b,e 42.6 43.7 41.5 43.8 44.7 44.7 43.8 41.8 46.5 45.6 43.9 40.7 -4.5%
Space Heating 33.9 34.3 31.5 33.7 34.5 34.5 33.7 31.6 35.8 35.2 33.8 30.8 -9.3%
Water Heating 8.5 9.2 9.8 9.9 10.0 9.9 9.9 9.9 10.4 10.1 9.7 9.6 12.7%
Appliances 0.2 0.2 0.2 0.3 0.3 0.3 0.3 0.3 0.3 0.4 0.4 0.4 84.5%
Major Appliances 0.2 0.2 0.2 0.3 0.3 0.3 0.3 0.3 0.3 0.4 0.4 0.4 84.5%
Other Appliances1 0.0 0.0 0.0 0.0 0.0 0.0 0.0 0.0 0.0 0.0 0.0 0.0 –
Lighting 0.0 0.0 0.0 0.0 0.0 0.0 0.0 0.0 0.0 0.0 0.0 0.0 –
Space Cooling 0.0 0.0 0.0 0.0 0.0 0.0 0.0 0.0 0.0 0.0 0.0 0.0 –
Commercial/Institutional (Mt of CO2e)a,c,e 25.7 28.8 31.9 33.5 34.6 33.7 31.6 29.6 30.5 30.3 29.2 27.7 7.7%
Space Heating 22.1 24.8 26.5 28.3 29.2 28.2 26.0 23.9 24.7 24.3 23.5 22.0 -0.4%
Water Heating 3.2 3.5 4.5 4.4 4.6 4.6 4.7 4.8 4.8 4.9 4.6 4.6 43.7%
Auxiliary Equipment 0.3 0.4 0.7 0.6 0.6 0.7 0.7 0.7 0.8 0.9 0.9 0.9 158.4%
Auxiliary Motors 0.0 0.0 0.0 0.0 0.0 0.0 0.0 0.0 0.0 0.0 0.0 0.0 –
Lighting 0.0 0.0 0.0 0.0 0.0 0.0 0.0 0.0 0.0 0.0 0.0 0.0 –
Space Cooling 0.1 0.1 0.2 0.2 0.2 0.2 0.2 0.2 0.2 0.2 0.1 0.2 201.2%
Street Lightingg 0.0 0.0 0.0 0.0 0.0 0.0 0.0 0.0 0.0 0.0 0.0 0.0 –
Industrial (Mt of CO2e)a,e,f 101.4 106.0 104.6 109.5 113.8 119.9 117.1 117.5 129.3 125.8 121.8 129.6 27.8%
Mining 16.3 21.6 26.5 27.7 34.4 33.4 35.3 38.3 48.3 49.6 54.1 59.0 262.8%
Pulp and Paper 14.5 12.1 10.5 10.2 9.7 9.7 8.1 6.9 7.0 5.5 5.4 5.0 -65.8%
Iron and Steel 13.0 14.6 12.9 13.7 13.6 14.1 13.5 14.3 14.9 14.5 10.9 11.9 -7.8%
Smelting and Refining 3.4 3.4 3.8 3.5 3.5 3.6 3.6 3.4 3.8 3.7 2.6 2.7 -19.3%
Cement 4.0 4.3 4.6 5.0 5.0 5.2 5.4 5.7 5.0 4.9 4.6 4.5 12.0%
Chemicals 7.1 8.3 7.6 7.4 6.7 7.9 7.5 7.9 7.8 7.9 7.7 9.0 25.7%
Petroleum Refining 16.7 17.9 16.6 19.5 18.3 22.3 19.5 18.2 18.8 16.9 16.7 16.7 0.1%
Other Manufacturing 21.6 20.0 17.2 17.2 16.9 17.3 17.5 15.8 16.6 15.6 13.5 13.8 -35.9%
Forestry 0.6 0.6 1.5 1.5 1.7 2.0 2.1 2.3 2.2 2.3 1.9 2.2 286.0%
Construction 4.3 3.2 3.4 3.8 4.1 4.4 4.7 4.8 4.9 5.0 4.4 4.8 12.2%
1) “Other Appliances” includes small appliances such as televisions, video cassette recorders, digital video disc players, radios, computers and toasters.
Sources:a) Statistics Canada, Report on Energy Supply and Demand in Canada, 1990–2010, Ottawa, 2012.b) Natural Resources Canada, Residential End-Use Model, Ottawa, 2012.c) Natural Resources Canada, Commercial/Institutional End-Use Model, Ottawa, 2012.
d) Natural Resources Canada, Transportation End-Use Model, Ottawa, 2012.e) Environment Canada, National Inventory Report 1990–2010: Greenhouse Gas Sources and Sinks in Canada,
Ottawa, 2012.f) Canadian Industrial Energy End-Use Data and Analysis Centre, Development of Energy Intensity Indicators for Canadian
Industry 1990 to 2010, Simon Fraser University, 2012.g) Statistics Canada, Electric Power Generation, Transmission and Distribution, 2006–2010, Ottawa, 2012
(Cat. No. 57-202-X).
table continued on next page

www.nrcan.gc.ca/eneene/index-eng.phpEnergy Use Data Handbook, 1990 to 2010 — February 201314 15
1 Total End-Use Sector 1Total End-Use Sector
1) “Other Appliances” includes small appliances such as televisions, video cassette recorders, digital video disc players, radios, computers and toasters.
Sources:a) Statistics Canada, Report on Energy Supply and Demand in Canada, 1990–2010, Ottawa, 2012.b) Natural Resources Canada, Residential End-Use Model, Ottawa, 2012.c) Natural Resources Canada, Commercial/Institutional End-Use Model, Ottawa, 2012.d) Natural Resources Canada, Transportation End-Use Model, Ottawa, 2012.e) Environment Canada, National Inventory Report 1990–2010: Greenhouse Gas Sources and Sinks in Canada,
Ottawa, 2012.f) Canadian Industrial Energy End-Use Data and Analysis Centre, Development of Energy Intensity Indicators for Canadian
Industry 1990 to 2010, Simon Fraser University, 2012.g) Statistics Canada, Electric Power Generation, Transmission and Distribution, 2006–2010, Ottawa, 2012
(Cat. No. 57-202-X).
continued from previous table
Canada’s GHG Emissions by Sector, End-Use and Subsector – Excluding Electricity-Related Emissions (continued)
1990 1995 2001 2002 2003 2004 2005 2006 2007 2008 2009 2010 Total Growth 1990–2010
Total Transportation (Mt of CO2e)a,d,e 131.2 141.6 158.6 160.5 165.8 171.5 173.9 171.2 177.7 176.4 173.2 179.1 36.5%
Passenger Transportation (Mt of CO2e)a,d,e 81.5 83.6 88.8 91.1 91.5 93.7 94.0 92.7 95.7 93.6 93.3 93.9 15.2%
Cars 49.8 48.0 44.8 45.6 45.3 45.0 43.9 43.2 44.1 42.9 43.1 42.1 -15.4%
Light Trucks 15.1 19.2 26.2 27.5 28.2 29.1 29.5 29.2 30.7 30.5 31.5 32.3 114.5%
Motorcycles 0.2 0.1 0.2 0.2 0.2 0.2 0.2 0.3 0.3 0.3 0.4 0.4 125.2%
Buses 3.5 3.3 2.9 3.1 3.2 3.1 3.1 3.0 3.3 3.5 3.3 3.4 -1.0%
Air 12.7 12.7 14.5 14.6 14.4 16.1 17.0 16.9 17.2 16.3 14.9 15.4 21.2%
Rail 0.3 0.2 0.2 0.2 0.2 0.2 0.2 0.2 0.2 0.2 0.2 0.2 -20.9%
Freight Transportation (Mt of CO2e)a,d,e 46.0 53.8 63.8 63.0 67.9 71.3 73.2 71.7 75.1 75.9 73.6 78.1 69.8%
Light Trucks 6.8 8.3 10.7 11.0 11.3 11.6 11.6 11.6 12.3 12.3 12.6 13.0 90.8%
Medium Trucks 9.2 11.0 10.7 10.1 11.1 12.2 10.7 11.4 10.9 10.6 10.4 10.9 18.0%
Heavy Trucks 14.8 20.0 26.7 27.2 30.0 30.8 33.5 32.8 34.8 35.8 36.5 38.7 162.3%
Air 0.5 0.5 0.5 0.5 0.5 0.5 0.5 0.5 0.4 0.3 0.3 0.4 -21.4%
Rail 6.7 6.1 6.3 5.8 5.8 6.0 6.4 6.7 7.2 7.6 4.9 6.3 -4.9%
Marine 8.2 7.8 8.9 8.5 9.2 10.1 10.5 8.6 9.5 9.2 8.8 8.9 9.1%
Off-Road (Mt of CO2e)d,e 3.6 4.2 6.1 6.3 6.4 6.5 6.7 6.8 6.9 6.9 6.2 7.0 93.2%
Agriculture (Mt of CO2e)a,e 11.4 11.9 13.0 12.3 12.9 12.9 13.1 13.4 14.0 14.2 12.0 14.6 27.4%

www.nrcan.gc.ca/eneene/index-eng.phpEnergy Use Data Handbook, 1990 to 2010 — February 201316 17
1 Total End-Use Sector 1Total End-Use Sector
Commodity Prices and Background Indicators
1990 1995 2001 2002 2003 2004 2005 2006 2007 2008 2009 2010 Total Growth 1990–2010
Commodity Prices
Crude Oil Prices
Wellhead U.S. Average ($US/bbl.)a 20.03 14.62 21.84 22.51 27.56 36.77 50.28 59.69 66.52 94.04 56.35 74.71 273.0%
Edmonton Par1 ($/m3)b 173.95 151.36 246.69 251.33 371.37 330.27 432.01 457.54 479.23 642.77 414.33 487.69 180.4%
Brent Montreal2 ($/m3)b 187.35 160.31 267.49 263.13 275.71 336.01 433.55 484.56 504.51 665.16 454.65 532.13 184.0%
Natural Gas Price at AECO-C Hub (intra-Alberta)3 ($/GJ)b
1.34 1.09 5.91 3.83 6.31 6.52 8.14 6.79 6.27 7.73 3.95 3.95 194.8%
Background Indicators
Total GDP (million $2002)c 767,185 837,839 1,041,449 1,068,785 1,091,675 1,130,685 1,167,031 1,199,108 1,226,371 1,233,651 1,198,817 1,242,240 61.9%
Industrial 221,187 238,267 295,031 301,125 305,084 315,536 322,461 323,645 320,753 307,940 274,651 294,073 33.0%
Commercial/Institutional 477,088 528,086 659,667 681,987 698,531 722,717 746,157 776,156 802,702 820,983 825,774 846,681 77.5%
Agricultured 17,344 17,896 17,176 15,320 17,949 19,868 20,720 20,848 21,165 24,419 23,183 22,910 32.1%
Electricity Generation 21,356 23,498 22,238 23,620 23,975 24,067 25,593 25,145 26,171 27,364 26,616 26,946 26.2%
Multifactor Measure of Productivity (2002 = 100)c
93.9 95.0 99.8 100.0 99.6 99.2 99.4 98.6 97.4 95.3 93.6 95.1 –
1) Edmonton crude oil price is based on the price of West Texas Intermediate (WTI) crude, sold on the Chicago Mercantile Exchange. Edmonton par is priced to be competitive with WTI, taking into account transportation costs.
2) Brent Montreal crude oil is the cost of Brent crude oil (in the Montreal market) including the transportation costs through the Portland-Montreal oil pipeline.
3) AECO-C hub is the main pricing point for Alberta natural gas and represents the major pricing point for Canadian gas.
Sources:a) Energy Information Administration (EIA), Domestic Crude Oil First Purchase Prices by Area,
http://www.eia.gov/pub/oil_gas/petroleum/data_publications/petroleum_marketing_monthly/current/pdf/pmmall.pdf.
b) Natural Resources Canada, Oil and Gas Policy and Regulatory Affairs Division, Ottawa, 2011.c) Informetrica Limited, The Informetrica Model and Database, Ottawa, 2012. d) The agriculture sector GDP includes Crop Production (NAICS code 111), Animal Production (112) and their related
Support Activities (1151, 1152).

www.nrcan.gc.ca/eneene/index-eng.php 19
2Residential Sector
The Data SituationAggregatedataonresidentialenergyusearereportedinStatisticsCanada’s Report on Energy Supply and Demand in Canada(RESD)(Cat.No.57-003-X).To provide more detail on how this energy is used, the Office of Energy Efficiency (OEE) has developed the Residential End-Use Model (REUM). This stockaccounting model assesses trends in energy use in the Canadian residential sector byallocatingtheenergyusereportedintheRESDtoend-usesusingannualstockcharacteristics and sales data, coupled with usage profiles and unit energy consumptionforequipmentstock.Itisdisaggregatedattheprovinciallevelandincludes four building types, five end-uses, eight vintage categories (house age categories) and six fuel types. Some end-uses are further disaggregated byequipment type.
Household characteristics are derived from the Household Facilities and Equipment Survey for the years prior to 1997 and from StatisticsCanada’s Survey of Household Spending ffrom 1997 and onward. The two surveys collect similar information but use different methodologies, therefore requiring significant data processing to merge the information. Because Statistics Canada stopped releasing data about vacant housing stock in2001, the calculation of housing stock for 2001 and onward uses the number of households, new construction completions, and demolished dwellings. Floor space information is acquired by combining housing stock estimates withdatafromtwootherStatisticsCanadasurveys:theBuilding Permits Survey and the OEE-sponsored Survey of Household Energy Use.
Energy consumption information was drawn from the data collected by various industry associations and external studies (some of which are commissioned by the OEE). Specifically, the Canadian ApplianceManufacturersAssociation,theHeating,RefrigerationandAirConditioningInstituteofCanada,theEnergyTechnologyDatabasedevelopedbyMarbekResource Consultants Ltd. and the internal expertise of OEE staff were utilized in this regard.

www.nrcan.gc.ca/eneene/index-eng.php 21
2Residential Sector
Inthe2010edition,theSurveyofSecondaryDistributorsofRefinedPetroleumProducts(SSDRPP)wasintegratedinthelatestRESDfrom2000onwardforpetroleumproducts.Asaresult,someoilusethatwaspreviouslyattributedtothe commercial sector is now reported in the residential sector, which saw a noticeable increase in oil use. In addition, standby losses in domesticwaterheating were used as input energy instead of output energy to generate water heating energy use in this publication.
TheREUM also takes into account the influence ofweather on residentialenergydemand.Itusesthenumberofheatingdegree-daysinMonthly Values of Degree-Days Below 18.0°C and the number of cooling degree-days in Monthly Values of Degree-Days Above 18.0°C, two reports from Environment Canada.
The residential prices of heating oil and natural gas are weighted averagesof regionalprices fromStatisticsCanada’sEnergy Statistics Handbook (Cat. No. 57-601-X). The residential price of electricity is a weighted average of the data found inHydro-Québec’sComparison of Electricity Prices in Major North American Cities.
Due to rounding, the numbers in the tables may not add up or calculate to their reported totals or growth rates.

www.nrcan.gc.ca/eneene/index-eng.phpEnergy Use Data Handbook, 1990 to 2010 — February 201322 23
2 Residential Sector 2Residential Sector
Residential Secondary Energy Use by Energy Source and End-Use
1990 1995 2001 2002 2003 2004 2005 2006 2007 2008 2009 2010 Total Growth 1990–2010
Total Energy Use (PJ)a,b 1,282.3 1,339.6 1,334.2 1,393.7 1,435.2 1,440.8 1,428.0 1,372.2 1,502.1 1,504.9 1,429.3 1,360.7 6.1%
Energy Use by Energy Source (PJ)a,b
Electricity 467.4 473.8 504.8 517.4 532.8 543.5 543.6 530.4 568.2 576.2 533.9 529.6 13.3%
Natural Gas 528.4 630.5 600.5 640.2 670.2 651.1 646.6 618.7 686.1 691.7 660.4 615.0 16.4%Heating Oil 186.4 137.5 128.8 131.0 122.8 135.0 125.8 118.1 129.9 116.4 114.6 106.6 -42.8%
Other1 21.9 14.5 11.8 12.3 12.4 11.9 13.7 14.5 16.1 17.0 15.2 15.7 -28.4%
Wood 78.2 83.3 88.3 92.7 97.0 99.2 98.2 90.6 101.7 103.5 105.2 93.8 19.9%
Energy Use by End-Use (PJ)b
Space Heating 816.6 862.6 815.5 869.7 908.9 915.3 894.2 845.4 960.2 967.9 933.1 851.5 4.3%
Water Heating 219.8 231.7 242.7 245.0 249.1 246.4 246.0 246.2 254.6 250.2 239.5 237.9 8.2%
Appliances 183.9 179.3 191.9 190.3 192.8 198.2 192.7 193.3 198.8 203.6 187.3 190.0 3.3%
Major Appliances 154.5 143.6 141.0 137.1 136.6 137.8 132.2 129.9 131.3 131.1 118.7 117.1 -24.2%
Other Appliances2 29.5 35.7 50.9 53.2 56.2 60.4 60.5 63.4 67.6 72.5 68.7 72.9 147.6%
Lighting 51.6 52.0 60.9 60.6 62.5 63.8 60.9 60.5 61.4 61.6 54.9 54.8 6.2%
Space Cooling 10.4 13.9 23.1 28.1 21.9 17.1 34.1 26.8 27.1 21.6 14.4 26.5 155.9%
Activity
Total Floor Space (million m2)b 1,207 1,360 1,474 1,497 1,522 1,573 1,625 1,676 1,729 1,760 1,789 1,816 50.4%
Total Households (thousands)b,c 9,895 10,900 11,837 12,014 12,189 12,375 12,587 12,756 12,985 13,164 13,417 13,378 35.2%
Energy Intensity (GJ/m2)a,b 1.06 0.98 0.91 0.93 0.94 0.92 0.88 0.82 0.87 0.86 0.80 0.75 -29.4%
Energy Intensity (GJ/household)a,b,c 129.6 122.9 112.7 116.0 117.7 116.4 113.4 107.6 115.7 114.3 106.5 101.7 -21.5%
Heating Degree-Day Indexb,d 0.92 0.98 0.88 0.93 0.96 0.95 0.92 0.85 0.93 0.95 0.96 0.86 –
Cooling Degree-Day Indexb,e 1.05 1.18 1.43 1.73 1.32 0.95 1.79 1.38 1.45 1.08 0.93 1.59 –
1) “Other” includes coal and propane.2) “Other Appliances” includes small appliances such as televisions, video cassette recorders, digital video disc players,
radios, computers and toasters.
Sources:a) Statistics Canada, Report on Energy Supply and Demand in Canada, 1990–2010, Ottawa, 2012.b) Natural Resources Canada, Residential End-Use Model, Ottawa, 2012.c) Statistics Canada, Survey of Household Spending, 1997–2010, Ottawa, 2011.d) Environment Canada, Climate Summaries, Monthly Values of Degree-Days Below 18.0°C, 1990–2010, Ottawa.e) Environment Canada, Climate Summaries, Monthly Values of Degree-Days Above 18.0°C, 1990–2010, Ottawa.

www.nrcan.gc.ca/eneene/index-eng.phpEnergy Use Data Handbook, 1990 to 2010 — February 201324 25
2 Residential Sector 2Residential Sector
Residential GHG Emissions by Energy Source and End-Use – Including and Excluding Electricity-Related Emissions
1990 1995 2001 2002 2003 2004 2005 2006 2007 2008 2009 2010 Total Growth 1990–2010
Total GHG Emissions Including Electricity (Mt of CO2e)a,b,c
68.7 67.6 73.3 75.7 79.1 77.6 75.1 71.9 79.5 77.0 70.5 68.4 -0.5%
GHG Emissions by Energy Source (Mt of CO2e)a,b,c
Electricity 26.1 23.9 31.8 31.9 34.4 32.9 31.3 30.1 33.1 31.4 26.6 27.6 6.0%
Natural Gas 26.6 31.5 30.0 32.0 33.4 32.4 32.1 30.8 34.3 34.3 32.7 30.4 14.2%
Heating Oil 13.1 9.7 9.0 9.2 8.6 9.5 8.8 8.3 9.1 8.2 8.1 7.5 -42.8%
Other1 1.4 0.9 0.7 0.8 0.8 0.8 0.9 0.9 1.0 1.1 1.0 1.0 -28.7%
Wood 1.6 1.7 1.8 1.9 2.0 2.0 2.0 1.8 2.1 2.1 2.1 1.9 19.9%
GHG Emissions by End-Use (Mt of CO2e)b,c
Space Heating 43.2 43.3 42.8 45.4 47.8 47.6 45.7 43.1 49.4 48.5 45.6 42.1 -2.6%
Water Heating 11.8 11.9 13.1 13.2 13.5 13.2 12.9 12.9 13.4 12.9 12.1 12.2 2.9%
Appliances 10.2 9.0 12.0 11.7 12.4 12.0 11.1 10.9 11.5 11.1 9.3 9.9 -3.4%
Major Appliances 8.6 7.2 8.8 8.4 8.7 8.3 7.6 7.3 7.6 7.1 5.9 6.1 -29.2%
Other Appliances2 1.6 1.8 3.2 3.3 3.6 3.7 3.5 3.6 3.9 4.0 3.4 3.8 131.7%
Lighting 2.9 2.6 3.8 3.7 4.0 3.9 3.5 3.4 3.6 3.4 2.7 2.9 -0.6%
Space Cooling 0.6 0.7 1.5 1.7 1.4 1.0 2.0 1.5 1.6 1.2 0.7 1.4 139.5%
GHG Intensity (tonnes/TJ)a,b,c 53.6 50.5 54.9 54.3 55.1 53.9 52.6 52.4 53.0 51.2 49.3 50.2 -6.2%
Total GHG Emissions Excluding Electricity (Mt of CO2e)a,b,c
42.6 43.7 41.5 43.8 44.7 44.7 43.8 41.8 46.5 45.6 43.9 40.7 -4.5%
GHG Emissions by End-Use (Mt of CO2e)b,c
Space Heating 33.9 34.3 31.5 33.7 34.5 34.5 33.7 31.6 35.8 35.2 33.8 30.8 -9.3%
Water Heating 8.5 9.2 9.8 9.9 10.0 9.9 9.9 9.9 10.4 10.1 9.7 9.6 12.7%
Appliances 0.2 0.2 0.2 0.3 0.3 0.3 0.3 0.3 0.3 0.4 0.4 0.4 84.5%
Major Appliances 0.2 0.2 0.2 0.3 0.3 0.3 0.3 0.3 0.3 0.4 0.4 0.4 84.5%Other Appliances2 0.0 0.0 0.0 0.0 0.0 0.0 0.0 0.0 0.0 0.0 0.0 0.0 –
Lighting 0.0 0.0 0.0 0.0 0.0 0.0 0.0 0.0 0.0 0.0 0.0 0.0 –
Space Cooling 0.0 0.0 0.0 0.0 0.0 0.0 0.0 0.0 0.0 0.0 0.0 0.0 –
GHG Intensity (tonnes/TJ)a,b,c 33.3 32.6 31.1 31.4 31.2 31.0 30.7 30.5 30.9 30.3 30.7 29.9 -10.0%
1) “Other” includes coal and propane.2) “Other Appliances” includes small appliances such as televisions, video cassette recorders, digital video disc players,
radios, computers and toasters.
Sources:a) Statistics Canada, Report on Energy Supply and Demand in Canada, 1990–2010, Ottawa, 2012.b) Natural Resources Canada, Residential End-Use Model, Ottawa, 2012.c) Environment Canada, National Inventory Report 1990–2010: Greenhouse Gas Sources and Sinks in Canada,
Ottawa, 2012.

www.nrcan.gc.ca/eneene/index-eng.phpEnergy Use Data Handbook, 1990 to 2010 — February 201326 27
2 Residential Sector 2Residential Sector
Residential Housing Stock and Floor Space
1990 1995 2001 2002 2003 2004 2005 2006 2007 2008 2009 2010 Total Growth 1990–2010
Total Housing Stock (thousands)a 10,427 11,507 12,348 12,522 12,712 12,923 13,134 13,343 13,549 13,755 13,947 14,123 35.4%
Housing Stock by Building Type (thousands)
Single Detached 5,856 6,482 7,000 7,104 7,215 7,329 7,435 7,539 7,645 7,737 7,824 7,902 34.9%
Single Attached 970 1,131 1,284 1,311 1,339 1,375 1,413 1,451 1,487 1,523 1,555 1,586 63.5%
Apartments 3,380 3,659 3,817 3,858 3,904 3,961 4,024 4,089 4,148 4,222 4,291 4,355 28.8%
Mobile Homes 221 235 247 250 253 257 261 265 269 273 277 279 26.4%
Housing Stock by Vintage (thousands)
Before 1946 2,155 2,043 1,907 1,886 1,886 1,844 1,824 1,804 1,784 1,764 1,746 1,726 -19.9%
1946–1960 1,479 1,419 1,345 1,333 1,333 1,310 1,298 1,287 1,276 1,265 1,254 1,243 -16.0%
1961–1977 3,098 3,003 2,888 2,869 2,869 2,833 2,815 2,797 2,780 2,762 2,745 2,728 -11.9%
1978–1983 1,751 1,706 1,651 1,642 1,642 1,624 1,615 1,606 1,598 1,589 1,581 1,573 -10.2%
1984–1995 1,944 3,336 3,268 3,257 3,257 3,235 3,224 3,213 3,202 3,191 3,181 3,170 63.0%
1996–20001 0 0 1,074 1,073 1,074 1,070 1,068 1,066 1,065 1,063 1,062 1,060 351.9%
2001–20052 0 0 215 463 463 1,007 1,289 1,289 1,288 1,288 1,287 1,287 499.3%
2006–20103 0 0 0 0 0 0 0 281 556 833 1,091 1,336 376.2%
Total Floor Space (million m2)a 1,207 1,360 1,474 1,497 1,497 1,573 1,625 1,676 1,729 1,760 1,789 1,816 50.4%
Floor Space by Building Type (million m2)
Single Detached 793 899 983 1,000 1,000 1,056 1,095 1,133 1,172 1,190 1,208 1,223 54.3%
Single Attached 110 128 149 153 152 163 170 176 183 188 193 198 79.7%
Apartments 285 311 319 321 322 330 336 342 348 355 362 368 29.1%
Mobile Homes 20 21 23 23 23 24 25 25 26 26 27 27 37.7%
Floor Space by Vintage (million m2)
Before 1946 238 226 212 210 210 209 209 210 210 208 206 204 -14.5%
1946–1960 148 142 134 133 133 132 133 134 135 134 133 131 -10.9%
1961–1977 344 334 312 308 308 305 306 307 308 306 304 302 -12.0%
1978–1983 219 213 204 202 202 202 203 204 205 204 203 202 -7.9%
1984–1995 259 446 431 428 428 430 436 441 446 444 443 441 70.4%
1996–20001 0 0 150 149 149 149 149 149 150 150 149 149 365.7%
2001–20052 0 0 31 67 67 147 189 191 193 193 193 193 520.7%
2006–20103 0 0 0 0 0 0 0 41 82 121 158 193 377.2%
1) Growth rate shown in the final column entitled “Total Growth 1990–2010” is for 1996 to 2010.2) Growth rate shown in the final column entitled “Total Growth 1990–2010” is for 2001 to 2010.3) Growth rate shown in the final column entitled “Total Growth 1990–2010” is for 2006 to 2010.
Source:a) Natural Resources Canada, Residential End-Use Model, Ottawa, 2012.
table continued on next page

www.nrcan.gc.ca/eneene/index-eng.phpEnergy Use Data Handbook, 1990 to 2010 — February 201328 29
2 Residential Sector 2Residential Sector
1990 1995 2001 2002 2003 2004 2005 2006 2007 2008 2009 2010 Total Growth 1990–2010
Average Size of Housing Unit (m2/house)a 116 118 119 120 120 122 124 126 128 128 128 129 11.0%
Average Size by Building Type (m2/house)
Single Detached 135 139 140 141 141 144 147 150 153 154 154 155 14.3%
Single Attached 113 113 116 117 117 119 120 122 123 124 124 125 9.9%
Apartments 84 85 84 83 83 83 83 84 84 84 84 85 0.2%
Mobile Homes 89 90 92 92 93 93 94 94 95 96 96 96 8.9%
Average Size by Vintage (m2/house)
Before 1946 110 111 111 111 112 113 115 116 118 118 118 118 6.8%
1946–1960 100 100 100 100 99 101 103 104 106 106 106 106 6.0%
1961–1977 111 111 108 107 107 108 109 110 111 111 111 111 -0.1%
1978–1983 125 125 124 123 123 124 125 127 128 128 128 128 2.5%
1984–1995 133 134 132 131 131 133 135 137 139 139 139 139 4.5%
1996–20001 0 0 139 139 139 139 140 140 141 141 141 141 3.1%
2001–20052 0 0 145 145 145 146 146 148 150 150 150 150 3.6%
2006–20103 0 0 0 0 0 0 0 144 147 145 145 145 0.2%
continued from previous tableResidential Housing Stock and Floor Space (continued)
1) Growth rate shown in the final column entitled “Total Growth 1990–2010” is for 1996 to 2010.2) Growth rate shown in the final column entitled “Total Growth 1990–2010” is for 2001 to 2010.3) Growth rate shown in the final column entitled “Total Growth 1990–2010” is for 2006 to 2010.
Source:a) Natural Resources Canada, Residential End-Use Model, Ottawa, 2012.

www.nrcan.gc.ca/eneene/index-eng.phpEnergy Use Data Handbook, 1990 to 2010 — February 201330 31
2 Residential Sector 2Residential Sector
Residential Space Heating Energy Use by Energy Source and Building Type
1990 1995 2001 2002 2003 2004 2005 2006 2007 2008 2009 2010 Total Growth 1990–2010
Total Space Heating Energy Use (PJ)a 816.6 862.6 815.5 869.7 908.9 915.3 894.2 845.4 960.2 967.9 933.1 851.5 4.3%
Energy Use by Energy Source (PJ)a
Electricity 166.3 178.8 179.9 190.3 206.6 215.4 209.0 202.9 234.7 244.3 234.9 216.7 30.3%
Natural Gas 388.6 467.4 428.9 465.2 490.1 474.4 467.0 439.8 499.1 505.7 482.4 438.6 12.9%
Heating Oil 166.2 121.6 109.7 112.3 105.9 117.7 109.7 101.5 112.6 101.4 99.4 90.9 -45.3%
Other1 18.0 12.7 11.1 11.5 11.5 11.1 12.7 13.3 14.8 15.7 14.0 14.3 -20.9%
Wood 77.5 82.1 86.0 90.4 94.7 96.8 95.8 88.0 99.0 100.9 102.4 91.1 17.6%
Energy Use by Building Type (PJ)a
Single Detached 596.8 631.5 600.8 641.7 667.9 674.3 661.2 627.9 715.6 720.4 693.0 632.8 6.0%
Single Attached 64.1 70.7 70.2 75.2 80.8 80.5 79.8 74.8 84.9 87.0 83.0 76.4 19.1%
Apartments 134.0 138.6 123.9 130.8 137.9 138.3 132.1 122.5 136.7 137.7 134.3 121.5 -9.3%
Mobile Homes 21.7 21.8 20.6 22.1 22.2 22.2 21.0 20.3 22.9 22.9 22.8 20.8 -4.0%
Activity
Total Floor Space (million m2)a 1,207 1,360 1,474 1,497 1,522 1,573 1,625 1,676 1,729 1,760 1,789 1,816 50.4%
Energy Intensity (GJ/m2)a 0.68 0.63 0.55 0.58 0.60 0.58 0.55 0.50 0.56 0.55 0.52 0.47 -30.7%
Heat Gains (PJ)a 94.9 100.5 98.6 104.6 109.3 110.0 103.5 96.6 108.2 113.0 106.2 96.1 1.2%
Heating Degree-Day Indexa,b 0.92 0.98 0.88 0.93 0.96 0.95 0.92 0.85 0.93 0.95 0.96 0.86 –
1) “Other” includes coal and propane.
Sources:a) Natural Resources Canada, Residential End-Use Model, Ottawa, 2012.b) Environment Canada, Climate Summaries, Monthly Values of Degree-Days Below 18.0°C, 1990–2010, Ottawa.

www.nrcan.gc.ca/eneene/index-eng.phpEnergy Use Data Handbook, 1990 to 2010 — February 201332 33
2 Residential Sector 2Residential Sector
Residential Space Heating System Stock Share
1990 1995 2001 2002 2003 2004 2005 2006 2007 2008 2009 2010Heating System Stock Share by System Type (%)a
Heating Oil – Normal Efficiency 14.0 8.6 3.1 2.3 1.8 1.4 1.0 0.8 0.6 0.5 0.4 0.3
Heating Oil – Medium Efficiency 0.3 3.0 6.7 7.0 7.1 7.3 7.3 7.3 7.3 7.2 7.3 7.3
Heating Oil – High Efficiency 0.0 0.0 0.0 0.0 0.0 0.0 0.0 0.0 0.0 0.0 0.0 0.0
Natural Gas – Normal Efficiency 39.0 30.6 20.9 19.1 17.2 15.1 13.1 11.1 9.3 7.6 6.0 4.6
Natural Gas – Medium Efficiency 2.1 9.6 16.3 17.3 18.2 19.2 19.9 20.5 20.9 21.1 21.2 20.8
Natural Gas – High Efficiency 2.9 5.4 9.8 10.9 12.1 13.4 14.8 16.0 17.3 18.7 20.1 21.7
Electric 28.1 28.9 27.6 27.6 27.8 27.7 27.9 28.3 28.6 28.7 28.8 28.9
Heat Pump 2.3 2.7 3.5 3.7 3.8 3.9 4.0 4.1 4.2 4.3 4.5 4.6
Other1 0.8 1.0 1.1 1.1 1.0 1.0 1.0 1.0 1.0 1.0 1.0 1.0
Wood 1.7 1.9 2.1 2.1 2.1 2.1 2.1 2.0 2.0 1.9 2.0 1.9
Dual Systems
Wood/Electric 5.1 4.6 4.9 4.9 4.9 4.9 4.9 4.8 4.8 4.8 4.8 4.8
Wood/Heating Oil 2.4 2.1 2.3 2.3 2.3 2.3 2.3 2.3 2.3 2.3 2.3 2.3
Natural Gas/Electric 0.3 0.4 0.4 0.5 0.5 0.5 0.5 0.5 0.5 0.5 0.5 0.5
Heating Oil/Electric 0.8 0.9 1.1 1.2 1.2 1.2 1.2 1.2 1.2 1.2 1.2 1.3
1) “Other” includes coal and propane.
Source:a) Natural Resources Canada, Residential End-Use Model, Ottawa, 2012.

www.nrcan.gc.ca/eneene/index-eng.phpEnergy Use Data Handbook, 1990 to 2010 — February 201334 35
2 Residential Sector 2Residential Sector
Residential Lighting and Space Cooling Details
1990 1995 2001 2002 2003 2004 2005 2006 2007 2008 2009 2010 Total Growth 1990–2010
Total Lighting Energy Use1 (PJ)a 51.6 52.0 60.9 60.6 62.5 63.8 60.9 60.5 61.4 61.6 54.9 54.8 6.2%
Activity
Total Households (thousands)a 9,895 10,900 11,837 12,014 12,189 12,375 12,587 12,756 12,985 13,164 13,417 13,378 35.2%
Energy Intensity (GJ/Household)a 5.2 4.8 5.1 5.0 5.1 5.2 4.8 4.7 4.7 4.7 4.1 4.1 -21.4%
Heat Loss (PJ)a 21.7 23.3 24.5 25.9 27.4 27.5 25.5 23.6 26.1 26.9 24.5 21.9 0.9%
Total Space Cooling Energy Use1 (PJ)a 10.4 13.9 23.1 28.1 21.9 17.1 34.1 26.8 27.1 21.6 14.4 26.5 155.9%
Energy Use by Cooling System Type (PJ)a
Room 2.7 2.8 4.0 5.0 4.0 2.8 5.5 4.6 4.8 3.7 2.9 4.7 76.2%
Central 7.7 11.1 19.1 23.1 17.8 14.2 28.6 22.2 22.3 17.9 11.5 21.8 183.9%
Activity
Cooled Floor Space (million m2)a 267 348 512 543 582 617 656 711 708 749 757 788 195.7%
Energy Intensity (MJ/m2)a 38.9 39.9 45.1 51.7 37.6 27.7 52.1 37.7 38.3 28.8 19.0 33.6 -13.4%
Cooling Degree-Day Indexa,b 1.05 1.18 1.43 1.73 1.32 0.95 1.79 1.38 1.45 1.08 0.93 1.59 –
Total Cooling System Stock (thousands)a 2,438 3,045 4,272 4,513 4,808 5,151 5,572 6,144 6,282 6,554 6,600 6,804 179.1%
System Stock by Type (thousands)a
Room 1,067 1,142 1,533 1,670 1,805 1,795 1,992 2,289 2,446 2,398 2,376 2,431 127.8%
Central 1,371 1,903 2,740 2,843 3,003 3,357 3,580 3,855 3,836 4,156 4,223 4,374 219.0%
New Unit Efficiencya
Room (EER) 7.1 9.2 9.4 9.4 9.4 9.4 9.4 10.9 10.9 10.9 10.9 10.9 53.3%
Central (SEER) 9.1 10.2 10.3 10.3 10.3 10.3 10.3 13.0 13.0 13.0 13.0 13.0 42.2%
Stock Efficiencya
Room (EER) 6.8 7.4 8.4 8.6 8.8 8.9 9.1 9.5 9.8 10.0 10.1 10.3 50.0%
Central (SEER) 8.6 9.2 9.7 9.7 9.8 9.9 10.0 10.3 10.5 10.7 10.9 11.1 28.1%
1) Lighting and space cooling consume only electricity.
Sources:a) Natural Resources Canada, Residential End-Use Model, Ottawa, 2012.b) Environment Canada, Climate Summaries, Monthly Values of Degree-Days Above 18.0°C, 1990–2010, Ottawa.

www.nrcan.gc.ca/eneene/index-eng.phpEnergy Use Data Handbook, 1990 to 2010 — February 201336 37
2 Residential Sector 2Residential Sector
Residential Appliance Details
1990 1995 2001 2002 2003 2004 2005 2006 2007 2008 2009 2010 Total Growth 1990–2010
Total Appliance Energy Use (PJ)a 183.9 179.3 191.9 190.3 192.8 198.2 192.7 193.3 198.8 203.6 187.3 190.0 3.3%
Energy Use by Energy Source (PJ)a
Electricity 180.1 175.1 187.1 185.3 187.5 192.7 186.8 187.2 192.1 196.4 180.2 182.9 1.5%
Natural Gas 3.8 4.2 4.9 5.0 5.3 5.5 5.8 6.1 6.8 7.2 7.1 7.2 88.5%
Energy Use by Appliance Type (PJ)a
Refrigerator 60.6 52.7 46.1 43.8 41.6 40.9 38.3 36.1 35.5 34.6 30.5 29.7 -51.1%
Freezer 24.5 21.1 16.0 14.8 14.2 13.8 12.8 12.3 12.2 11.9 10.6 10.2 -58.5%
Dishwasher1 4.9 4.8 4.8 4.7 4.7 4.8 4.5 4.4 4.2 4.1 3.6 3.4 -29.7%
Clothes Washer1 3.7 4.1 4.8 4.8 4.9 4.9 4.7 4.6 4.5 4.2 3.5 3.4 -8.2%
Clothes Dryer 32.4 32.0 35.5 35.2 36.2 37.3 36.7 37.2 38.4 39.3 36.2 36.3 11.9%
Range 28.4 29.0 33.8 33.9 35.0 36.1 35.2 35.4 36.5 37.0 34.2 34.1 20.4%
Other Appliances2 29.5 35.7 50.9 53.2 56.2 60.4 60.5 63.4 67.6 72.5 68.7 72.9 147.6%
Activity
Total Households (thousands)a,b 9,895 10,900 11,837 12,014 12,189 12,375 12,587 12,756 12,985 13,164 13,417 13,378 35.2%
Energy Intensity (GJ/household)a,b 18.6 16.4 16.2 15.8 15.8 16.0 15.3 15.2 15.3 15.5 14.0 14.2 -23.6%
Heat Loss by Appliance Type (PJ)a
Refrigerator 25.6 23.8 18.6 18.9 18.4 17.8 16.2 14.2 15.2 15.2 13.7 11.9 -53.7%
Freezer 10.4 9.6 6.6 6.5 6.4 6.1 5.5 4.9 5.3 5.3 4.9 4.1 -60.3%
Dishwasher1 0.7 0.7 0.7 0.7 0.7 0.7 0.6 0.6 0.6 0.6 0.5 0.5 -33.3%
Clothes Washer1 0.9 1.0 1.1 1.2 1.2 1.2 1.1 1.0 1.1 1.0 0.9 0.8 -13.0%
Clothes Dryer 3.8 4.0 4.0 4.3 4.5 4.6 4.3 4.1 4.6 4.8 4.5 4.1 6.2%
Range 10.0 10.9 11.4 12.1 12.9 13.1 12.4 11.5 13.0 13.5 12.7 11.3 13.4%
Other Appliances2 12.5 16.1 20.6 22.9 24.9 26.3 25.6 24.9 28.9 31.8 30.8 29.1 133.3%
Appliances per Household by Appliance Typea,b
Refrigerator 1.18 1.20 1.23 1.24 1.24 1.25 1.26 1.27 1.27 1.27 1.27 1.26 7.3%
Freezer 0.57 0.58 0.57 0.57 0.57 0.56 0.55 0.55 0.55 0.54 0.54 0.54 -4.9%
Dishwasher 0.42 0.47 0.52 0.54 0.55 0.56 0.57 0.58 0.59 0.59 0.60 0.60 42.8%
Clothes Washer 0.74 0.78 0.81 0.81 0.81 0.81 0.82 0.82 0.82 0.81 0.82 0.81 10.4%
Clothes Dryer 0.72 0.76 0.81 0.82 0.82 0.82 0.83 0.84 0.84 0.84 0.84 0.83 15.8%
Range 0.98 0.99 0.99 0.99 0.99 0.99 0.99 0.99 0.99 1.00 1.00 1.00 1.5%
Other Appliances2 10.12 11.11 13.37 13.85 14.17 14.66 15.22 15.46 15.65 15.73 15.87 15.94 57.4%
1) Excludes hot water requirements.2) “Other Appliances” includes small appliances such as televisions, video cassette recorders, digital video disc players,
radios, computers and toasters.
Sources:a) Natural Resources Canada, Residential End-Use Model, Ottawa, 2012.b) Statistics Canada, Survey of Household Spending, 1997–2010, Ottawa, 2012.

www.nrcan.gc.ca/eneene/index-eng.phpEnergy Use Data Handbook, 1990 to 2010 — February 201338 39
2 Residential Sector 2Residential Sector
Residential Appliance Unit Energy Consumption (UEC)
1990 1995 2001 2002 2003 2004 2005 2006 2007 2008 2009 2010 Total Growth 1990–2010
UEC1 for New Electric Appliances (kWh/year)a
Refrigerator 956 642 559 506 487 478 469 481 483 467 430 425 -55.6%
Freezer 714 382 384 368 369 373 386 380 384 375 356 365 -48.8%
Dishwasher2 277 181 170 160 141 123 107 101 96 93 88 84 -69.8%
Clothes Washer2 134 118 111 109 101 83 65 58 44 41 37 35 -74.1%
Clothes Dryer 1,103 909 916 916 914 912 904 905 912 916 921 928 -15.8%
Range 772 771 763 756 718 653 573 537 524 522 518 522 -32.4%
UEC1 for New Natural Gas Appliances (kWh/year)b
Clothes Dryer 925 889 880 880 880 880 880 880 880 880 880 880 -4.9%
Range 1,357 1,236 1,226 1,226 1,226 1,226 1,226 1,226 1,226 1,226 1,226 1,226 -9.7%
UEC1 for Stock of Electric Appliances (kWh/year)b
Refrigerator 1,504 1,262 905 857 781 730 689 632 597 558 534 507 -66.3%
Freezer 1,272 1,052 680 632 588 553 522 495 471 449 427 400 -68.6%
Dishwasher2 338 291 224 214 202 190 178 168 151 141 133 122 -64.0%
Clothes Washer2 145 150 144 142 139 134 128 123 117 105 95 89 -39.0%
Clothes Dryer 1,294 1,186 1,054 1,037 1,022 1,007 992 978 964 951 940 925 -28.6%
Range 803 793 779 776 771 762 747 732 717 697 683 665 -17.3%
UEC1 for Stock of Natural Gas Appliances (kWh/year)b
Clothes Dryer 1,480 1,122 885 883 882 881 880 880 880 880 880 880 -40.5%
Range 1,519 1,388 1,296 1,278 1,264 1,257 1,251 1,246 1,241 1,237 1,234 1,230 -19.0%
1) Unit energy consumption (UEC) is based on rated efficiency.2) Excludes hot water requirements.
Sources:a) Special tabulations from the Canadian Appliance Manufacturers Association, Mississauga, 2012.b) Natural Resources Canada, Residential End-Use Model, Ottawa, 2012.

www.nrcan.gc.ca/eneene/index-eng.phpEnergy Use Data Handbook, 1990 to 2010 — February 201340 41
2 Residential Sector 2Residential Sector
Residential Water Heating Energy Use and Water Heater Stock Share
1990 1995 2001 2002 2003 2004 2005 2006 2007 2008 2009 2010 Total Growth 1990–2010
Total Water Heating Energy Use (PJ)a 219.8 231.7 242.7 245.0 249.1 246.4 246.0 246.2 254.6 250.2 239.5 237.9 8.2%
Energy Use by Energy Source (PJ)a
Electricity 59.0 53.9 53.8 53.2 54.3 54.6 52.7 53.0 53.0 52.3 49.4 48.8 -17.3%
Natural Gas 136.0 158.9 166.7 169.9 174.7 171.2 173.7 172.8 180.2 178.9 170.9 169.2 24.4%
Heating Oil 20.2 15.9 19.1 18.7 16.9 17.4 16.1 16.6 17.3 15.1 15.2 15.8 -22.0%
Other1 3.8 1.8 0.8 0.8 0.9 0.9 1.0 1.2 1.3 1.3 1.3 1.4 -63.5%
Wood 0.7 1.2 2.3 2.3 2.4 2.4 2.4 2.6 2.7 2.7 2.8 2.7 286.5%
Activity
Total Households (thousands)a,b 9,895 10,900 11,837 12,014 12,189 12,375 12,587 12,756 12,985 13,164 13,417 13,378 35.2%
Energy Intensity (GJ/household)a,b 22.2 21.3 20.5 20.4 20.4 19.9 19.5 19.3 19.6 19.0 17.9 17.8 -19.9%
Water Heater Stock Market Share (%)a
Electricity 52.5 49.7 46.9 46.5 46.3 45.9 45.6 45.5 45.4 45.4 45.4 45.3 –
Natural Gas 41.5 44.6 47.1 47.6 48.0 48.4 48.8 49.0 49.0 49.1 49.0 49.1 –
Heating Oil 5.1 4.7 5.0 4.9 4.7 4.6 4.5 4.4 4.4 4.4 4.4 4.4 –
Other1 0.6 0.6 0.3 0.3 0.3 0.4 0.4 0.4 0.4 0.4 0.4 0.4 –
Wood 0.2 0.4 0.6 0.6 0.6 0.6 0.7 0.7 0.7 0.7 0.7 0.7 –
Heat Loss (PJ)a 9.3 11.0 11.1 12.2 12.9 12.7 12.4 11.8 13.5 13.8 13.7 12.5 34.1%
1) “Other” includes coal and propane.
Sources:a) Natural Resources Canada, Residential End-Use Model, Ottawa, 2012.b) Statistics Canada, Survey of Household Spending, 1997–2010, Ottawa, 2012.

www.nrcan.gc.ca/eneene/index-eng.phpEnergy Use Data Handbook, 1990 to 2010 — February 201342 43
2 Residential Sector 2Residential Sector
Residential Energy Prices and Background Indicators
1990 1995 2001 2002 2003 2004 2005 2006 2007 2008 2009 2010 Total Growth 1990–2010
Energy Prices by Energy Source (incl. taxes)
Natural Gas (cents/m3)a,d 19.1 22.4 44.6 36.6 46.9 46.6 51.3 53.0 50.5 52.2 44.0 44.2 131.3%
Heating Oil (cents/litre)a,d,e 35.6 35.6 53.5 49.7 57.2 60.4 78.2 82.1 85.0 111.1 77.6 90.1 152.9%
Electricity (cents/kWh)b,d 6.2 7.8 8.1 8.5 8.6 8.8 9.2 9.4 9.5 9.6 9.5 9.6 55.1%
Background Indicators
Consumer Price Index (2002 = 100)c
Natural Gas 52.1 62.6 122.1 100.0 130.1 127.4 136.3 140.5 131.3 146.8 117.3 115.2 –
Fuel Oil and Other Fuels 72.8 75.1 108.8 100.0 114.9 126.5 158.7 165.9 172.5 225.4 158.0 183.4 –
Electricity 68.7 87.3 92.9 100.0 98.0 102.0 104.9 110.8 112.9 113.2 115.2 120.7 –
Real Personal Disposable Income per Household ($2002)c
56,325 52,997 56,822 57,165 57,723 59,164 59,460 62,076 63,580 65,344 64,865 66,128 17.4%
Total Population (thousands)f 27,691 29,302 31,019 31,354 31,640 31,941 32,245 32,576 32,930 33,316 33,720 34,109 23.2%
Sources:a) Statistics Canada, Energy Statistics Handbook, Ottawa, 2011 (Cat. No. 57-601-X).b) Hydro-Québec, Comparison of Electricity Prices in Major North American Cities, 2010.c) Informetrica Limited, The Informetrica Model and Database, Ottawa, 2012. d) Statistics Canada, Report on Energy Supply and Demand in Canada, 1990–2010, Ottawa, 2012.e) Statistics Canada, Total Population, Census Divisions and Census Metropolitan Areas, Tables 051-0014,
051-0034 and 051-0046, Ottawa, 2011 (CANSIM).f) Statistics Canada, Estimates of Population, by Age Group and Sex, Provinces and Territories, Table 051-0001,
Ottawa, 2011 (CANSIM).

3Commercial/Institutional Sector
www.nrcan.gc.ca/eneene/index-eng.php 45
The Data SituationOf all the sectors reviewed in this handbook, the commercial/institutional sector has the most significant limitations with regard to available data.
Aggregate data on commercial/institutional energy use are reported inStatistics Canada’s Report on Energy Supply and Demand in Canada (RESD) (Cat. No. 57-003-X) under the “public administration” and“commercialandother institutional”categories.StatisticsCanadadefinesthese categories as final consumers not reported in the other end-use sectors. Therefore, energy use data for the commercial/institutional sector essentially represent the residual energy use not accounted for in the residential, industrial, transportation and agriculture sectors.
InrecentEnergyUseDataHandbookpublications,theOfficeofEnergyEfficiency (OEE) reported some anomalies in petroleum products data for the commercial/institutional sector. In particular, there has been asharpincreaseinconsumptionoftheseproductssince1999.Someheavyfuel oil, light fuel oil and kerosene may be erroneously attributed to the commercial sector. There is some evidence that fuel marketers (included in the commercial/institutional sector) are buying petroleum products from refineries and then re-selling them to other sectors (e.g. industrial, transportation). To improve annual energy end-use statistics for the commercial and institutional sector, Statistics Canada conducted theSurvey of Secondary Distributors of Refined Petroleum Products(SSDRPP).TheresultsofthissurveywereusedtoadjusttheRESDforpetroleum products with a backcast to 2000. As result, a significantdecrease in petroleum products, especially heavy fuel oil, has been noticed. Inaddition,StatisticsCanadahasalsoadjustedtheRESDbyintegratingthenewIndustrialConsumptionofEnergy(ICE)surveywitha backcast to 1995. However, this has not had a significant impact on the commercial and institutional sector.
The OEE developed the Commercial/Institutional End-Use Model(CEUM)toassessCanadianenergyusetrendsinthissector.TheCEUMuses floor space estimates, by region and building type, and energy

3Commercial/Institutional Sector
www.nrcan.gc.ca/eneene/index-eng.php 47
intensity by region, building type and end-use to allocate energy reported byStatisticsCanadaintheRESDtotenactivitytypesandsixend-uses.Floor space estimates are developed by Informetrica Limited for theOEE from average costs per unit of floor space and investment flows for new construction. These estimates are categorized using the North AmericanIndustryClassificationSystem(NAICS).TheCEUMusedtheSurvey of Commercial and Institutional Energy Use (Establishement)(SCIEU)assourcedata forenergy intensities.The2011SCIEUwasundertakenbyStatisticsCanadaonbehalfoftheOEEtocollectdataforthereferenceyear2009.TheestablishmentsideoftheSCIEUdiffersfromearlierversionsoftheCommercialandInstitutionalConsumptionofEnergySurvey(CICES)astheformer includes three industries that were not previously covered by the CICES.Allof the changesmentionedabovewill affect energybreakdownwhen compared to the previous edition.
TheSCIEUincludesnewinformationrelatedtothepenetrationrateforairconditioners. This information was used to update the penetration rate for air conditioners in the model and to refine the space cooling energy intensity calculation.
The model also takes into account the influence of weather on commercial/institutional energydemand. Ituses thenumberofheatingdegree-days inMonthly Values of Degree-Days Below 18.0°C and the number of cooling degree-days in Monthly Values of Degree-Days Above 18.0°C (both reports from Environment Canada).
The commercial/institutional price of heating oil and natural gas are weighted averages of regional prices taken from the Oil and Gas Policy and Regulatory AffairsDivisionofNaturalResourcesCanadaandStatisticsCanada’sEnergy Statistics Handbook (Cat. No. 57-601-X), respectively. The commercial/institutional price of electricity is a weighted average of the data found in Hydro-Québec’s Comparison of Electricity Prices in Major North American Cities.
Due to rounding, the numbers in the tables may not add upor calculate to their reported totals or growth rates.

www.nrcan.gc.ca/eneene/index-eng.phpEnergy Use Data Handbook, 1990 to 2010 — February 201348 49
3 Commercial/Institutional Sector 3Commercial/Institutional Sector
Commercial/Institutional Secondary Energy Use by Energy Source, End-Use and Activity Type
1990 1995 2001 2002 2003 2004 2005 2006 2007 2008 2009 2010 Total Growth 1990–2010
Total Energy Use (PJ)a 867.0 960.8 1,047.2 1,109.1 1,126.0 1,112.5 1,084.2 1,035.6 1,104.5 1,143.2 1,079.0 1,057.3 22.0%
Energy Use by Energy Source (PJ)a
Electricity 390.1 421.2 447.1 479.2 477.2 479.7 481.4 471.8 524.7 558.6 509.5 516.8 32.5%
Natural Gas 387.1 427.6 488.0 517.2 525.1 514.1 504.9 468.5 482.3 495.2 508.7 477.8 23.4%
Light Fuel Oil and Kerosene 62.0 61.2 53.8 56.8 56.2 58.1 44.1 37.0 33.8 26.7 21.9 24.7 -60.2%
Heavy Fuel Oil 11.4 8.6 21.9 20.5 35.0 26.5 25.4 28.4 28.6 25.8 8.9 5.0 -55.9%
Steam 0.2 0.4 0.3 0.3 0.3 0.5 2.6 2.6 3.8 3.8 0.0 0.0 –
Other1 16.3 41.8 36.0 35.1 32.1 33.6 25.8 27.3 31.4 33.1 30.0 33.1 103.7%
Energy Use by End-Use (PJ)b
Space Heating 471.8 524.4 540.2 586.1 599.6 587.7 544.3 497.8 537.0 558.2 531.3 478.2 1.4%
Water Heating 67.5 72.7 90.3 87.1 90.5 93.2 92.9 95.0 93.7 97.2 92.7 92.2 36.7%
Auxiliary Equipment 83.2 97.7 132.6 138.3 145.9 153.7 158.0 163.6 184.9 203.8 195.1 202.4 143.2%
Auxiliary Motors 91.1 97.1 93.7 93.4 94.1 94.5 88.0 89.0 91.6 95.5 94.7 97.6 7.1%
Lighting 114.2 121.8 120.7 118.8 117.7 118.6 108.9 110.7 116.1 120.5 120.0 123.7 8.3%
Space Cooling 30.2 39.3 62.0 77.5 70.4 56.9 83.8 71.5 72.3 59.6 38.1 55.7 84.2%
Street Lightingf 8.9 7.8 7.7 7.8 7.8 7.8 8.3 8.1 9.0 8.6 7.1 7.5 -16.3%
1) “Other” includes coal and propane.2) Excludes street lighting.3) “Offices” includes activities related to finance and insurance; real estate and rental and leasing;
professional, scientific and technical services; public administration; and others.
Sources:a) Statistics Canada, Report on Energy Supply and Demand in Canada, 1990–2010, Ottawa, 2012.b) Natural Resources Canada, Commercial/Institutional End-Use Model, Ottawa, 2012.c) Informetrica Limited, The Informetrica Model and Database, Ottawa, 2012. d) Environment Canada, Climate Summaries, Monthly Values of Degree-Days Below 18.0°C, 1990–2010, Ottawa.e) Environment Canada, Climate Summaries, Monthly Values of Degree-Days Above 18.0°C, 1990–2010, Ottawa.f) Statistics Canada, Electric Power Generation, Transmission and Distribution, 2006–2010, Ottawa, 2012
(Cat. No. 57-202-X).
table continued on next page

www.nrcan.gc.ca/eneene/index-eng.phpEnergy Use Data Handbook, 1990 to 2010 — February 201350 51
3 Commercial/Institutional Sector 3Commercial/Institutional Sector
continued from previous table
Commercial/Institutional Secondary Energy Use by Energy Source, End-Use and Activity Type (continued)
1990 1995 2001 2002 2003 2004 2005 2006 2007 2008 2009 2010 Total Growth 1990–2010
Energy Use by Activity Type2 (PJ)b
Wholesale Trade 61.8 65.0 67.8 70.8 71.4 70.1 66.8 63.6 67.8 69.7 65.4 63.5 2.7%
Retail Trade 142.5 154.1 170.5 179.7 183.2 183.7 179.3 172.9 185.9 192.6 182.0 178.9 25.6%
Transportation and Warehousing 51.4 52.6 49.7 51.2 51.0 49.1 45.3 42.3 44.5 45.4 42.2 40.9 -20.4%
Information and Cultural Industries 16.7 19.7 23.0 24.4 25.0 24.5 23.5 22.4 23.7 24.4 23.5 23.1 38.6%
Offices3 272.5 313.4 350.9 375.8 382.2 377.6 377.5 358.9 384.3 403.1 378.9 370.2 35.9%
Educational Services 112.8 124.9 136.7 144.5 147.4 145.0 139.0 132.0 139.4 142.7 135.1 132.5 17.4%
Health Care and Social Assistance 97.2 107.4 116.7 123.5 124.2 122.1 117.5 113.2 120.3 122.8 116.7 114.7 18.0%
Arts, Entertainment and Recreation 19.6 24.2 26.7 28.0 28.5 27.9 27.1 26.0 27.9 28.6 27.7 27.5 40.2%
Accommodation and Food Services 64.0 70.9 76.0 80.9 82.8 82.7 79.1 76.6 81.4 84.5 81.3 80.0 25.1%
Other Services 19.6 20.8 21.6 22.5 22.6 22.0 20.7 19.5 20.3 20.6 19.2 18.6 -5.5%
Activity
Total Floor Space (million m2)c 509.9 558.7 610.2 620.8 631.2 642.6 654.2 667.3 679.7 693.2 703.8 717.1 40.6%
Energy Intensity2 (GJ/m2)a,c 1.68 1.71 1.70 1.77 1.77 1.72 1.64 1.54 1.61 1.64 1.52 1.46 -13.0%
Heating Degree-Day Indexb,d 0.92 0.98 0.88 0.93 0.96 0.95 0.92 0.85 0.93 0.95 0.96 0.86 –
Cooling Degree-Day Indexb,e 1.05 1.18 1.43 1.73 1.32 0.95 1.79 1.38 1.45 1.08 0.93 1.59 –
1) “Other” includes coal and propane.2) Excludes street lighting.3) “Offices” includes activities related to finance and insurance; real estate and rental and leasing;
professional, scientific and technical services; public administration; and others.
Sources:a) Statistics Canada, Report on Energy Supply and Demand in Canada, 1990–2010, Ottawa, 2012.b) Natural Resources Canada, Commercial/Institutional End-Use Model, Ottawa, 2012.c) Informetrica Limited, The Informetrica Model and Database, Ottawa, 2012. d) Environment Canada, Climate Summaries, Monthly Values of Degree-Days Below 18.0°C, 1990–2010, Ottawa.e) Environment Canada, Climate Summaries, Monthly Values of Degree-Days Above 18.0°C, 1990–2010, Ottawa.f) Statistics Canada, Electric Power Generation, Transmission and Distribution, 2006–2010, Ottawa, 2012
(Cat. No. 57-202-X).

www.nrcan.gc.ca/eneene/index-eng.phpEnergy Use Data Handbook, 1990 to 2010 — February 201352 53
3 Commercial/Institutional Sector 3Commercial/Institutional Sector
Commercial/Institutional GHG Emissions by Energy Source, End-Use and Activity Type – Including Electricity-Related Emissions
1990 1995 2001 2002 2003 2004 2005 2006 2007 2008 2009 2010 Total Growth 1990–2010
Total GHG Emissions Including Electricity (Mt of CO2e)a,d
47.4 50.1 60.1 63.0 65.4 62.7 59.3 56.4 61.0 60.8 54.6 54.6 15.1%
GHG Emissions by Energy Source (Mt of CO2e)a,d
Electricity 21.7 21.2 28.1 29.5 30.8 29.1 27.7 26.8 30.5 30.5 25.4 27.0 23.9%
Natural Gas 19.5 21.4 24.4 25.8 26.1 25.6 25.1 23.3 24.1 24.5 25.2 23.6 20.9%
Light Fuel Oil and Kerosene 4.4 4.3 3.8 4.0 3.9 4.1 3.1 2.6 2.4 1.9 1.5 1.7 -60.8%
Heavy Fuel Oil 0.9 0.6 1.6 1.5 2.6 2.0 1.9 2.1 2.1 1.9 0.7 0.4 -56.7%
Steam 0.0 0.0 0.0 0.0 0.0 0.0 0.0 0.0 0.0 0.0 0.0 0.0 –
Other1 1.0 2.5 2.2 2.1 2.0 2.1 1.6 1.7 1.9 2.0 1.8 2.0 104.4%
GHG Emissions by End-Use (Mt of CO2e)b,d
Space Heating 25.5 27.8 29.1 31.5 32.5 31.6 28.7 26.2 28.4 29.0 26.9 24.4 -4.6%
Water Heating 3.6 3.9 4.9 4.7 4.9 5.1 5.0 5.1 5.0 5.1 4.9 4.8 32.3%
Auxiliary Equipment 4.6 5.0 8.2 8.5 9.3 9.3 9.1 9.3 10.7 11.1 9.8 10.6 128.7%
Auxiliary Motors 5.1 4.9 5.9 5.8 6.1 5.7 5.1 5.0 5.3 5.2 4.7 5.1 0.2%
Lighting 6.4 6.1 7.6 7.3 7.6 7.2 6.3 6.3 6.8 6.6 6.0 6.5 1.3%
Space Cooling 1.7 2.0 3.9 4.7 4.5 3.4 4.8 4.0 4.2 3.2 1.9 2.9 72.4%
Street Lightingc 0.5 0.4 0.5 0.5 0.5 0.5 0.5 0.5 0.5 0.5 0.4 0.4 -21.7%
GHG Emissions by Activity Type2 (Mt of CO2e)b,d
Wholesale Trade 3.4 3.4 3.9 4.0 4.1 3.9 3.6 3.5 3.7 3.7 3.3 3.3 -2.5%
Retail Trade 7.7 8.0 9.7 10.2 10.6 10.3 9.8 9.4 10.2 10.2 9.2 9.2 19.3%
Transportation and Warehousing 2.8 2.7 2.8 2.9 2.9 2.7 2.5 2.3 2.4 2.4 2.1 2.1 -24.9%
Information and Cultural Industries 0.9 1.0 1.3 1.4 1.5 1.4 1.3 1.2 1.3 1.3 1.2 1.2 30.1%
Offices3 14.9 16.3 20.1 21.3 22.1 21.2 20.6 19.5 21.1 21.4 19.1 19.1 28.1%
Educational Services 6.2 6.5 7.9 8.2 8.6 8.2 7.6 7.2 7.7 7.6 6.8 6.9 10.5%
Health Care and Social Assistance 5.4 5.6 6.7 7.0 7.3 6.9 6.5 6.2 6.7 6.6 5.9 5.9 10.9%
Arts, Entertainment and Recreation 1.1 1.3 1.5 1.6 1.7 1.6 1.5 1.4 1.6 1.5 1.4 1.4 31.7%
Accommodation and Food Services 3.5 3.7 4.4 4.6 4.8 4.7 4.4 4.2 4.5 4.5 4.1 4.2 18.6%
Other Services 1.1 1.1 1.2 1.3 1.3 1.2 1.1 1.1 1.1 1.1 1.0 1.0 -11.7%
GHG Intensity (tonnes/TJ)a,d 54.7 52.1 57.4 56.8 58.1 56.4 54.7 54.5 55.2 53.1 50.6 51.7 -5.6%
1) “Other” includes coal and propane.2) Excludes street lighting.3) “Offices” includes activities related to finance and insurance; real estate and rental and leasing;
professional, scientific and technical services; public administration; and others.
Sources:a) Statistics Canada, Report on Energy Supply and Demand in Canada, 1990–2010, Ottawa, 2012.b) Natural Resources Canada, Commercial/Institutional End-Use Model, Ottawa, 2012.c) Statistics Canada, Electric Power Generation, Transmission and Distribution, 2006–2010, Ottawa, 2012
(Cat. No. 57-202-X).d) Environment Canada, National Inventory Report 1990–2010: Greenhouse Gas Sources and Sinks in Canada,
Ottawa, 2012.

www.nrcan.gc.ca/eneene/index-eng.phpEnergy Use Data Handbook, 1990 to 2010 — February 201354 55
3 Commercial/Institutional Sector 3Commercial/Institutional Sector
Commercial/Institutional GHG Emissions by End-Use and Activity Type – Excluding Electricity-Related Emissions
1990 1995 2001 2002 2003 2004 2005 2006 2007 2008 2009 2010 Total Growth 1990–2010
Total GHG Emissions Excluding Electricity (Mt of CO2e)a,d
25.7 28.8 31.9 33.5 34.6 33.7 31.6 29.6 30.5 30.3 29.2 27.7 7.7%
GHG Emissions by End-Use (Mt of CO2e)b,d
Space Heating 22.1 24.8 26.5 28.3 29.2 28.2 26.0 23.9 24.7 24.3 23.5 22.0 -0.4%
Water Heating 3.2 3.5 4.5 4.4 4.6 4.6 4.7 4.8 4.8 4.9 4.6 4.6 43.7%
Auxiliary Equipment 0.3 0.4 0.7 0.6 0.6 0.7 0.7 0.7 0.8 0.9 0.9 0.9 158.4%
Auxiliary Motors 0.0 0.0 0.0 0.0 0.0 0.0 0.0 0.0 0.0 0.0 0.0 0.0 –
Lighting 0.0 0.0 0.0 0.0 0.0 0.0 0.0 0.0 0.0 0.0 0.0 0.0 –
Space Cooling 0.1 0.1 0.2 0.2 0.2 0.2 0.2 0.2 0.2 0.2 0.1 0.2 201.2%
Street Lightingc 0.0 0.0 0.0 0.0 0.0 0.0 0.0 0.0 0.0 0.0 0.0 0.0 –
GHG Emissions by Activity Type1 (Mt of CO2e)b,d
Wholesale Trade 1.8 1.9 2.1 2.1 2.2 2.1 1.9 1.8 1.9 1.8 1.8 1.6 -9.8%
Retail Trade 4.2 4.6 5.2 5.4 5.6 5.6 5.2 4.9 5.1 5.1 4.9 4.7 10.5%
Transportation and Warehousing 1.6 1.7 1.7 1.7 1.7 1.6 1.5 1.3 1.4 1.3 1.3 1.2 -27.7%
Information and Cultural Industries 0.5 0.6 0.7 0.7 0.8 0.7 0.7 0.6 0.6 0.6 0.6 0.6 20.4%
Offices2 8.1 9.4 10.6 11.3 11.7 11.3 11.1 10.3 10.6 10.7 10.3 9.7 19.7%
Educational Services 3.4 3.8 4.2 4.4 4.6 4.4 4.0 3.8 3.8 3.7 3.6 3.4 2.8%
Health Care and Social Assistance 2.9 3.3 3.6 3.8 3.9 3.8 3.5 3.3 3.4 3.3 3.2 3.0 3.3%
Arts, Entertainment and Recreation 0.6 0.7 0.8 0.8 0.9 0.8 0.8 0.7 0.8 0.7 0.7 0.7 22.7%
Accommodation and Food Services 1.9 2.2 2.4 2.5 2.7 2.6 2.4 2.3 2.3 2.3 2.3 2.2 12.3%
Other Services 0.6 0.6 0.7 0.7 0.7 0.7 0.6 0.6 0.6 0.5 0.5 0.5 -17.4%
GHG Intensity (tonnes/TJ)a,d 29.6 30.0 30.5 30.2 30.8 30.3 29.2 28.6 27.6 26.5 27.0 26.2 -11.7%
1) Excludes street lighting. 2) “Offices” includes activities related to finance and insurance; real estate and rental and leasing;
professional, scientific and technical services; public administration; and others.
Sources:a) Statistics Canada, Report on Energy Supply and Demand in Canada, 1990–2010, Ottawa, 2012.b) Natural Resources Canada, Commercial/Institutional End-Use Model, Ottawa, 2012.c) Statistics Canada, Electric Power Generation, Transmission and Distribution, 2006–2010, Ottawa, 2012
(Cat. No. 57-202-X).d) Environment Canada, National Inventory Report 1990–2010: Greenhouse Gas Sources and Sinks in Canada,
Ottawa, 2012.
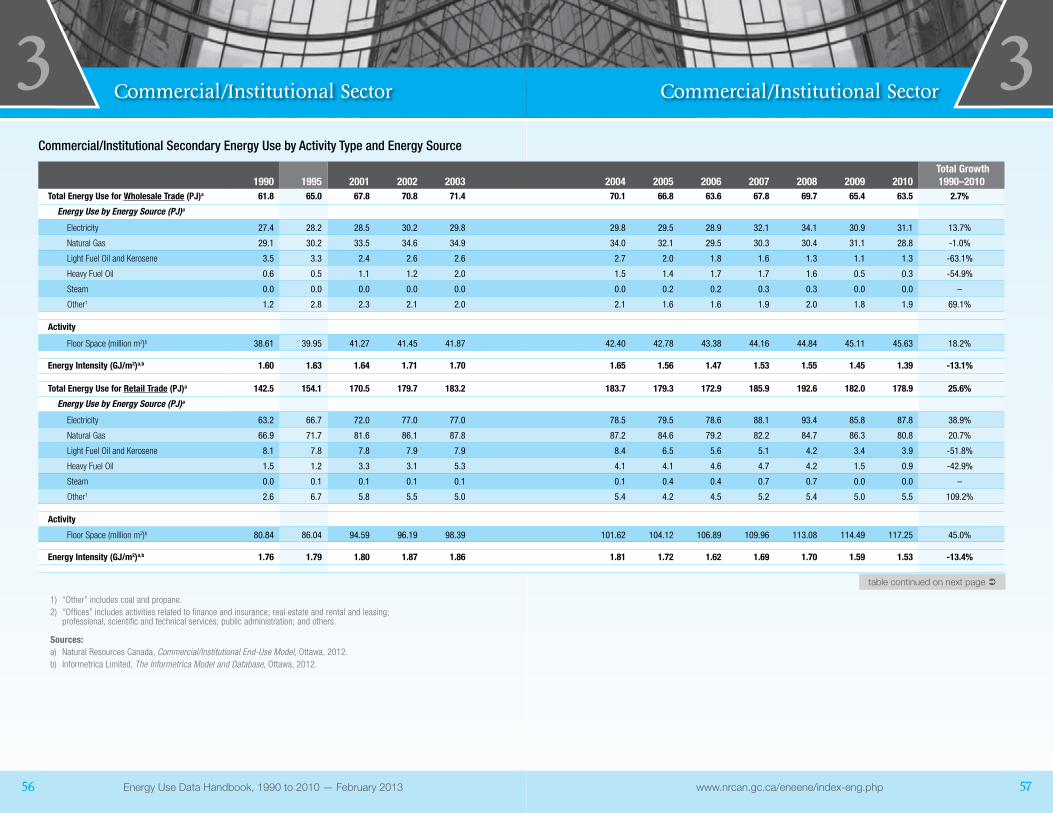
www.nrcan.gc.ca/eneene/index-eng.phpEnergy Use Data Handbook, 1990 to 2010 — February 201356 57
3 Commercial/Institutional Sector 3Commercial/Institutional Sector
Commercial/Institutional Secondary Energy Use by Activity Type and Energy Source
1990 1995 2001 2002 2003 2004 2005 2006 2007 2008 2009 2010 Total Growth 1990–2010
Total Energy Use for Wholesale Trade (PJ)a 61.8 65.0 67.8 70.8 71.4 70.1 66.8 63.6 67.8 69.7 65.4 63.5 2.7%
Energy Use by Energy Source (PJ)a
Electricity 27.4 28.2 28.5 30.2 29.8 29.8 29.5 28.9 32.1 34.1 30.9 31.1 13.7%
Natural Gas 29.1 30.2 33.5 34.6 34.9 34.0 32.1 29.5 30.3 30.4 31.1 28.8 -1.0%
Light Fuel Oil and Kerosene 3.5 3.3 2.4 2.6 2.6 2.7 2.0 1.8 1.6 1.3 1.1 1.3 -63.1%
Heavy Fuel Oil 0.6 0.5 1.1 1.2 2.0 1.5 1.4 1.7 1.7 1.6 0.5 0.3 -54.9%
Steam 0.0 0.0 0.0 0.0 0.0 0.0 0.2 0.2 0.3 0.3 0.0 0.0 –
Other1 1.2 2.8 2.3 2.1 2.0 2.1 1.6 1.6 1.9 2.0 1.8 1.9 69.1%
Activity
Floor Space (million m2)b 38.61 39.95 41.27 41.45 41.87 42.40 42.78 43.38 44.16 44.84 45.11 45.63 18.2%
Energy Intensity (GJ/m2)a,b 1.60 1.63 1.64 1.71 1.70 1.65 1.56 1.47 1.53 1.55 1.45 1.39 -13.1%
Total Energy Use for Retail Trade (PJ)a 142.5 154.1 170.5 179.7 183.2 183.7 179.3 172.9 185.9 192.6 182.0 178.9 25.6%
Energy Use by Energy Source (PJ)a
Electricity 63.2 66.7 72.0 77.0 77.0 78.5 79.5 78.6 88.1 93.4 85.8 87.8 38.9%
Natural Gas 66.9 71.7 81.6 86.1 87.8 87.2 84.6 79.2 82.2 84.7 86.3 80.8 20.7%
Light Fuel Oil and Kerosene 8.1 7.8 7.8 7.9 7.9 8.4 6.5 5.6 5.1 4.2 3.4 3.9 -51.8%
Heavy Fuel Oil 1.5 1.2 3.3 3.1 5.3 4.1 4.1 4.6 4.7 4.2 1.5 0.9 -42.9%
Steam 0.0 0.1 0.1 0.1 0.1 0.1 0.4 0.4 0.7 0.7 0.0 0.0 –
Other1 2.6 6.7 5.8 5.5 5.0 5.4 4.2 4.5 5.2 5.4 5.0 5.5 109.2%
Activity
Floor Space (million m2)b 80.84 86.04 94.59 96.19 98.39 101.62 104.12 106.89 109.96 113.08 114.49 117.25 45.0%
Energy Intensity (GJ/m2)a,b 1.76 1.79 1.80 1.87 1.86 1.81 1.72 1.62 1.69 1.70 1.59 1.53 -13.4%
1) “Other” includes coal and propane.2) “Offices” includes activities related to finance and insurance; real estate and rental and leasing;
professional, scientific and technical services; public administration; and others.
Sources:a) Natural Resources Canada, Commercial/Institutional End-Use Model, Ottawa, 2012.b) Informetrica Limited, The Informetrica Model and Database, Ottawa, 2012.
table continued on next page

www.nrcan.gc.ca/eneene/index-eng.phpEnergy Use Data Handbook, 1990 to 2010 — February 201358 59
3 Commercial/Institutional Sector 3Commercial/Institutional Sector
continued from previous table
Commercial/Institutional Secondary Energy Use by Activity Type and Energy Source (continued)
1990 1995 2001 2002 2003 2004 2005 2006 2007 2008 2009 2010 Total Growth 1990–2010
Total Energy Use for Transportation and Warehousing (PJ)a
51.4 52.6 49.7 51.2 51.0 49.1 45.3 42.3 44.5 45.4 42.2 40.9 -20.4%
Energy Use by Energy Source (PJ)a
Electricity 21.0 20.7 18.7 19.3 18.8 18.4 17.4 16.8 18.5 19.5 17.6 17.7 -15.5%
Natural Gas 25.0 25.6 24.9 26.1 26.2 24.9 23.5 21.2 21.6 21.8 22.4 20.9 -16.4%
Light Fuel Oil and Kerosene 3.9 3.6 3.1 3.0 2.9 3.0 2.1 1.6 1.5 1.1 0.8 1.0 -75.5%
Heavy Fuel Oil 0.7 0.5 1.3 1.2 1.9 1.4 1.2 1.6 1.5 1.5 0.4 0.2 -74.0%
Steam 0.0 0.0 0.0 0.0 0.0 0.0 0.2 0.2 0.3 0.3 0.0 0.0 –
Other1 0.8 2.2 1.6 1.5 1.3 1.3 0.9 1.0 1.1 1.2 1.0 1.2 41.3%
Activity
Floor Space (million m2)b 33.92 34.22 33.58 33.39 33.41 33.35 33.26 33.37 33.70 33.85 33.83 33.85 -0.2%
Energy Intensity (GJ/m2)a,b 1.52 1.54 1.48 1.53 1.53 1.47 1.36 1.27 1.32 1.34 1.25 1.21 -20.2%
Total Energy Use for Information and Cultural Industries (PJ)a
16.7 19.7 23.0 24.4 25.0 24.5 23.5 22.4 23.7 24.4 23.5 23.1 38.6%
Energy Use by Energy Source (PJ)a
Electricity 7.6 8.8 10.0 10.9 10.8 10.8 10.8 10.6 11.7 12.4 11.4 11.5 51.0%
Natural Gas 7.0 8.3 10.4 10.7 11.1 10.7 10.3 9.6 9.8 10.0 10.7 10.1 44.0%
Light Fuel Oil and Kerosene 1.5 1.6 1.3 1.6 1.6 1.6 1.2 1.0 0.9 0.7 0.6 0.6 -56.2%
Heavy Fuel Oil 0.3 0.2 0.5 0.5 0.8 0.6 0.6 0.6 0.6 0.6 0.2 0.1 -58.9%
Steam 0.0 0.0 0.0 0.0 0.0 0.0 0.0 0.0 0.1 0.1 0.0 0.0 –
Other1 0.3 0.8 0.7 0.8 0.7 0.8 0.6 0.6 0.7 0.7 0.6 0.7 148.2%
Activity
Floor Space (million m2)b 8.97 10.49 12.07 12.34 12.55 12.71 12.93 13.19 13.39 13.66 13.96 14.21 58.4%
Energy Intensity (GJ/m2)a,b 1.86 1.88 1.90 1.98 1.99 1.93 1.82 1.70 1.77 1.79 1.68 1.63 -12.5%
1) “Other” includes coal and propane.2) “Offices” includes activities related to finance and insurance; real estate and rental and leasing;
professional, scientific and technical services; public administration; and others.
Sources:a) Natural Resources Canada, Commercial/Institutional End-Use Model, Ottawa, 2012.b) Informetrica Limited, The Informetrica Model and Database, Ottawa, 2012.
continued from previous table

www.nrcan.gc.ca/eneene/index-eng.phpEnergy Use Data Handbook, 1990 to 2010 — February 201360 61
3 Commercial/Institutional Sector 3Commercial/Institutional Sector
Commercial/Institutional Secondary Energy Use by Activity Type and Energy Source (continued)
1990 1995 2001 2002 2003 2004 2005 2006 2007 2008 2009 2010 Total Growth 1990–2010
Total Energy Use for Offices2 (PJ)a 272.5 313.4 350.9 375.8 382.2 377.6 377.5 358.9 384.3 403.1 378.9 370.2 35.9%
Energy Use by Energy Source (PJ)a
Electricity 121.4 136.9 150.3 162.4 162.0 163.2 165.6 162.0 180.5 195.3 177.7 179.4 47.7%
Natural Gas 122.9 139.9 165.1 178.6 181.5 178.5 181.1 167.3 173.3 179.5 181.4 170.2 38.4%
Light Fuel Oil and Kerosene 19.4 20.0 16.7 17.0 16.9 16.8 13.3 11.1 10.2 8.4 6.8 7.8 -60.0%
Heavy Fuel Oil 3.6 2.8 6.8 6.3 11.1 7.9 8.0 8.4 8.4 7.4 2.7 1.6 -54.6%
Steam 0.1 0.1 0.1 0.1 0.1 0.2 0.8 0.8 1.2 1.2 0.0 0.0 –
Other1 5.1 13.7 11.9 11.5 10.6 11.1 8.7 9.3 10.7 11.4 10.2 11.2 121.5%
Activity
Floor Space (million m2)b 193.95 219.73 247.63 253.03 257.92 262.69 267.84 273.72 278.83 284.96 290.43 296.22 52.7%
Energy Intensity (GJ/m2)a,b 1.40 1.43 1.42 1.49 1.48 1.44 1.41 1.31 1.38 1.41 1.30 1.25 -11.0%
Total Energy Use for Educational Services (PJ)a 112.8 124.9 136.7 144.5 147.4 145.0 139.0 132.0 139.4 142.7 135.1 132.5 17.4%
Energy Use by Energy Source (PJ)a
Electricity 51.1 55.1 58.8 62.6 62.7 62.7 62.5 60.8 66.9 70.8 64.4 65.3 27.9%
Natural Gas 48.8 54.2 61.5 65.7 66.8 65.1 62.7 58.0 59.1 59.8 62.6 58.9 20.6%
Light Fuel Oil and Kerosene 9.1 8.9 8.2 8.3 8.2 8.6 6.3 5.2 4.7 3.6 3.0 3.4 -62.6%
Heavy Fuel Oil 1.7 1.3 3.4 3.1 5.3 4.0 3.7 4.1 4.1 3.8 1.3 0.7 -59.4%
Steam 0.0 0.1 0.0 0.0 0.0 0.1 0.3 0.3 0.5 0.5 0.0 0.0 –
Other1 2.1 5.4 4.8 4.7 4.3 4.5 3.4 3.6 4.1 4.2 3.8 4.2 98.6%
Activity
Floor Space (million m2)b 68.14 74.28 80.56 82.00 83.42 84.59 86.06 87.09 87.98 89.11 90.11 91.76 34.7%
Energy Intensity (GJ/m2)a,b 1.66 1.68 1.70 1.76 1.77 1.71 1.62 1.52 1.58 1.60 1.50 1.44 -12.8%
1) “Other” includes coal and propane.2) “Offices” includes activities related to finance and insurance; real estate and rental and leasing;
professional, scientific and technical services; public administration; and others.
Sources:a) Natural Resources Canada, Commercial/Institutional End-Use Model, Ottawa, 2012.b) Informetrica Limited, The Informetrica Model and Database, Ottawa, 2012.
table continued on next page
continued from previous table

www.nrcan.gc.ca/eneene/index-eng.phpEnergy Use Data Handbook, 1990 to 2010 — February 201362 63
3 Commercial/Institutional Sector 3Commercial/Institutional Sector
continued from previous table
Commercial/Institutional Secondary Energy Use by Activity Type and Energy Source (continued)
1990 1995 2001 2002 2003 2004 2005 2006 2007 2008 2009 2010 Total Growth 1990–2010
Total Energy Use for Health Care and Social Assistance (PJ)a
97.2 107.4 116.7 123.5 124.2 122.1 117.5 113.2 120.3 122.8 116.7 114.7 18.0%
Energy Use by Energy Source (PJ)a
Electricity 43.6 46.9 49.1 53.1 52.4 52.2 52.0 51.2 56.9 59.7 55.0 55.9 28.3%
Natural Gas 41.7 46.5 52.6 55.8 55.9 54.2 53.0 50.0 51.1 52.2 54.4 51.4 23.3%
Light Fuel Oil and Kerosene 8.5 8.3 7.9 8.1 7.9 8.4 6.1 5.1 4.7 3.7 2.9 3.2 -62.1%
Heavy Fuel Oil 1.6 1.2 2.9 2.7 4.5 3.6 3.3 3.7 3.7 3.3 1.2 0.7 -57.0%
Steam 0.0 0.0 0.0 0.0 0.0 0.1 0.3 0.3 0.5 0.4 0.0 0.0 –
Other1 1.9 4.5 4.1 3.8 3.5 3.7 2.8 3.0 3.4 3.5 3.2 3.5 88.8%
Activity
Floor Space (million m2)b 38.16 41.58 44.77 45.63 45.90 46.48 47.42 48.53 49.47 50.08 50.99 52.05 36.4%
Energy Intensity (GJ/m2)a,b 2.55 2.58 2.61 2.71 2.70 2.63 2.48 2.33 2.43 2.45 2.29 2.20 -13.5%
Total Energy Use for Arts, Entertainment and Recreation (PJ)a
19.6 24.2 26.7 28.0 28.5 27.9 27.1 26.0 27.9 28.6 27.7 27.5 40.2%
Energy Use by Energy Source (PJ)a
Electricity 9.0 10.9 11.7 12.4 12.3 12.3 12.4 12.2 13.7 14.4 13.4 13.7 51.8%
Natural Gas 8.3 10.2 12.2 12.2 12.4 12.0 11.8 11.0 11.3 11.7 12.6 12.0 44.9%
Light Fuel Oil and Kerosene 1.7 1.9 1.4 2.0 2.0 2.0 1.6 1.3 1.2 0.8 0.7 0.8 -53.5%
Heavy Fuel Oil 0.3 0.2 0.5 0.5 0.9 0.7 0.6 0.8 0.8 0.8 0.2 0.1 -60.8%
Steam 0.0 0.0 0.0 0.0 0.0 0.0 0.1 0.1 0.1 0.1 0.0 0.0 –
Other1 0.3 1.0 0.8 0.9 0.9 0.9 0.7 0.7 0.8 0.9 0.8 0.9 164.1%
Activity
Floor Space (million m2)b 10.40 12.59 13.94 14.08 14.30 14.47 14.92 15.25 15.70 15.98 16.40 16.87 62.2%
Energy Intensity (GJ/m2)a,b 1.89 1.92 1.92 1.99 1.99 1.93 1.82 1.71 1.78 1.79 1.69 1.63 -13.6%
1) “Other” includes coal and propane.2) “Offices” includes activities related to finance and insurance; real estate and rental and leasing;
professional, scientific and technical services; public administration; and others.
Sources:a) Natural Resources Canada, Commercial/Institutional End-Use Model, Ottawa, 20112.b) Informetrica Limited, The Informetrica Model and Database, Ottawa, 2012.
table continued on next page

www.nrcan.gc.ca/eneene/index-eng.phpEnergy Use Data Handbook, 1990 to 2010 — February 201364 65
3 Commercial/Institutional Sector 3Commercial/Institutional Sector
Commercial/Institutional Secondary Energy Use by Activity Type and Energy Source (continued)
1990 1995 2001 2002 2003 2004 2005 2006 2007 2008 2009 2010 Total Growth 1990–2010
Total Energy Use for Accommodation and Food Services (PJ)a
64.0 70.9 76.0 80.9 82.8 82.7 79.1 76.6 81.4 84.5 81.3 80.0 25.1%
Energy Use by Energy Source (PJ)a
Electricity 27.8 30.0 31.2 33.8 33.9 34.4 34.1 33.8 37.6 40.2 37.1 37.7 35.4%
Natural Gas 29.2 32.2 35.7 36.6 37.4 36.8 35.8 33.9 34.6 36.2 38.3 36.3 24.1%
Light Fuel Oil and Kerosene 4.5 4.3 4.2 5.6 5.6 5.9 4.4 3.7 3.5 2.5 2.1 2.3 -49.4%
Heavy Fuel Oil 0.8 0.6 1.8 1.6 2.7 2.2 2.1 2.4 2.5 2.2 0.7 0.4 -52.3%
Steam 0.0 0.0 0.0 0.0 0.0 0.0 0.1 0.1 0.2 0.2 0.0 0.0 –
Other1 1.6 3.7 3.0 3.4 3.2 3.3 2.6 2.7 3.1 3.3 3.1 3.4 112.2%
Activity
Floor Space (million m2)b 24.40 26.76 28.51 29.28 29.93 30.80 31.41 32.42 33.02 34.16 35.03 35.76 46.5%
Energy Intensity (GJ/m2)a,b 2.62 2.65 2.66 2.76 2.77 2.68 2.52 2.36 2.47 2.48 2.32 2.24 -14.6%
Total Energy Use for Other Services (PJ)a 19.6 20.8 21.6 22.5 22.6 22.0 20.7 19.5 20.3 20.6 19.2 18.6 -5.5%
Energy Use by Energy Source (PJ)a
Electricity 9.0 9.3 9.2 9.8 9.6 9.5 9.3 8.9 9.7 10.2 9.1 9.1 1.4%
Natural Gas 8.2 8.8 10.4 10.8 11.2 10.6 9.9 8.9 9.0 8.9 9.0 8.4 3.1%
Light Fuel Oil and Kerosene 1.8 1.6 0.7 0.7 0.7 0.8 0.6 0.5 0.4 0.4 0.3 0.4 -78.0%
Heavy Fuel Oil 0.3 0.2 0.4 0.3 0.5 0.5 0.4 0.6 0.6 0.5 0.2 0.1 -71.1%
Steam 0.0 0.0 0.0 0.0 0.0 0.0 0.0 0.0 0.1 0.1 0.0 0.0 –
Other1 0.4 0.8 0.9 0.9 0.6 0.6 0.5 0.5 0.5 0.6 0.5 0.5 43.6%
Activity
Floor Space (million m2)b 12.54 13.07 13.33 13.45 13.45 13.47 13.47 13.49 13.46 13.46 13.45 13.50 7.6%
Energy Intensity (GJ/m2)a,b 1.56 1.59 1.62 1.67 1.68 1.64 1.54 1.44 1.51 1.53 1.43 1.37 -12.2%
1) “Other” includes coal and propane.2) “Offices” includes activities related to finance and insurance; real estate and rental and leasing;
professional, scientific and technical services; public administration; and others.
Sources:a) Natural Resources Canada, Commercial/Institutional End-Use Model, Ottawa, 2012.b) Informetrica Limited, The Informetrica Model and Database, Ottawa, 2012.
continued from previous table

www.nrcan.gc.ca/eneene/index-eng.phpEnergy Use Data Handbook, 1990 to 2010 — February 201366 67
3 Commercial/Institutional Sector 3Commercial/Institutional Sector
Commercial/Institutional Energy Prices and Background Indicators
1990 1995 2001 2002 2003 2004 2005 2006 2007 2008 2009 2010 Total Growth 1990–2010
Energy Prices by Energy Source (incl. taxes)
Natural Gas (cents/m3)a,d 15.3 17.7 37.0 31.2 40.0 40.3 43.4 46.0 42.0 46.4 37.8 36.9 140.6%
Light Fuel Oil (cents/litre)e 25.8 22.1 35.6 34.7 38.7 46.5 61.9 64.2 68.6 94.3 60.9 70.5 173.6%
Heavy Fuel Oil (cents/litre)e 14.1 16.2 26.9 29.6 31.1 30.7 38.2 39.2 44.3 57.6 46.1 54.7 289.2%
Electricity (40 kW/10,000 kWh)1 (cents/kWh)b,d 7.7 9.5 8.8 9.2 9.4 9.7 10.1 10.4 10.7 10.8 10.7 10.8 41.4%
Electricity (500 kW/100,000 kWh)1 (cents/kWh)b,d 8.4 10.3 10.0 10.3 11.2 10.9 11.7 11.5 11.5 12.2 11.5 12.3 46.1%
Background Indicators
Commercial/Institutional Floor Space (million m2)c 509.9 558.7 610.2 620.8 631.2 642.6 654.2 667.3 679.7 693.2 703.8 717.1 40.6%
Commercial/Institutional Employees (thousands)c 9,338 9,828 11,160 11,443 11,751 11,943 12,133 12,454 12,845 13,084 13,112 13,326 42.7%
Employees (per thousand m2)c 18.3 17.6 18.3 18.4 18.6 18.6 18.5 18.7 18.9 18.9 18.6 18.6 1.5%
Commercial/Institutional GDP (million $2002)c 477,088 528,086 659,667 681,987 698,531 722,717 746,157 776,156 802,702 820,983 825,774 846,681 77.5%
1) kW refers to power hook-up, whereas kWh refers to monthly electricity consumption.
Sources:a) Statistics Canada, Energy Statistics Handbook, Ottawa, 2011 (Cat. No. 57-601).b) Hydro-Québec, Comparison of Electricity Prices in Major North American Cities, 2010.c) Informetrica Limited, The Informetrica Model and Database, Ottawa, 2012. d) Statistics Canada, Report on Energy Supply and Demand in Canada, 1990–2010, Ottawa, 2012.e) Natural Resources Canada, Oil and Gas Policy and Regulatory Affairs Division, Ottawa, 2011.

4Industrial Sector
www.nrcan.gc.ca/eneene/index-eng.php 69
The Data SituationThe aggregate energy use data presented for the industrial sector are taken fromStatisticsCanada’sReport on Energy Supply and Demand in Canada (RESD)(Cat.No.57-003-X).TheRESDcontainsdataderivedprimarilyfromStatisticsCanadasurveysofenergydistributorsandend-usersaswellasadministrativerecordsreceivedbyStatisticsCanada.Suchdataare then supplemented with data from the National Energy Board and various energy-producing provinces. The major energy survey used for the industrial sector is the Industrial Consumption of Energy(ICE)1 survey (Cat. No. 57-505-X).
Thisyear,data from the ICE surveywas integrated into theRESD from1995onward.Asaresult,someenergyusethatwaspreviouslyattributedto“other manufacturing” is now allocated to the other industries in themanufacturingsector.Also,datafromtheSurveyofSecondaryDistributorsofRefined Petroleum Products (SSDRPP)was integrated into theRESDfrom 2000 onward. This change did not have as much of an impact on the industrial sector.
To provide more detail about the industrial end-use energy trends over time, theOffice of Energy Efficiency (OEE) developed the Industrial End-UseModel (IEUM).Thedetailed energyusedatapresented in the IEUMaretakenfromtheICEsurveyfor1990andfrom1995andbeyond.Datafor1991to1994arefromtheCanadianIndustrialEnd-UseEnergyDataandAnalysis Centre’s (CIEEDAC’s) report Energy Intensity Indicators for Canadian Industry 1990–2010. OEE also updates its energy end-use databasebyincludingenergyconsumptiondatafromtheAnnualCensusofMines and other industry associations.
1 From 1991 to 1994, not all of the 49 industries are available because of the conversion to the North American Industrial Classification System (NAICS) in 2001.

4Industrial Sector
www.nrcan.gc.ca/eneene/index-eng.php 71
InformetricaLimitedhasprovidedphysicalunits,grossdomesticproduct(GDP) and gross output (GO) data, and prediction in physical units(where applicable). Energy intensities for pulp mills and iron and steel are now reported on a GO basis.
Industrialoilandnaturalgaspricesareaweightedaverageofregionalpricestaken from the Petroleum Resources Branch of Natural Resources Canada andStatisticsCanada’sEnergy Statistics Handbook (Cat. No. 57-601-X), respectively. Electricity prices are a weighted average of the data found in Hydro-Québec’sComparison of Electricity Prices in Major North American Cities.
Due to rounding, the numbers in the tables may not add upor calculate to their reported totals or growth rates.

www.nrcan.gc.ca/eneene/index-eng.phpEnergy Use Data Handbook, 1990 to 2010 — February 201372 73
4 Industrial Sector 4Industrial Sector
Industrial Secondary Energy Use and GHG Emissions by Energy Source
1990 1995 2001 2002 2003 2004 2005 2006 2007 2008 2009 2010 Total Growth 1990–2010
Total Energy Use (PJ)a,d 2,710.0 2,963.1 2,962.1 3,107.5 3,189.3 3,366.0 3,357.7 3,314.4 3,427.6 3,282.8 3,121.1 3,227.6 19.1%
Energy Use by Energy Source (PJ)a,d
Electricity 658.4 732.8 792.6 800.8 804.2 803.5 841.8 832.5 796.7 757.4 676.9 697.1 5.9%
Natural Gas 837.2 909.6 835.5 917.0 927.1 934.4 904.7 895.9 1,037.1 1,036.9 1,007.0 1,097.2 31.1%
Diesel Fuel Oil, Light Fuel Oil and Kerosene 127.7 124.3 138.4 133.4 144.9 158.8 168.2 172.2 185.9 190.2 176.3 208.5 63.3%
Heavy Fuel Oil 201.1 147.2 143.8 124.8 149.7 156.0 134.5 118.7 119.6 101.3 92.0 79.3 -60.6%
Still Gas and Petroleum Coke 309.9 375.6 378.3 433.6 425.7 479.9 465.7 467.5 486.9 445.7 485.6 474.4 53.1%
LPG and NGL 26.0 26.9 36.2 36.2 32.5 34.1 53.6 52.7 58.0 62.1 57.0 67.0 157.3%
Coal 49.4 46.9 61.0 54.0 58.4 56.6 54.3 57.9 59.5 65.2 53.3 60.6 22.6%
Coke and Coke Oven Gas 131.3 134.4 129.3 126.5 127.5 125.5 125.5 134.6 129.1 128.3 99.4 105.7 -19.5%
Wood Waste and Pulping Liquor 341.0 432.8 409.0 441.0 476.0 573.2 570.5 545.2 519.9 462.5 432.7 416.9 22.2%
Other1 27.9 32.8 38.3 40.2 43.3 44.1 39.0 37.3 35.0 33.4 41.1 21.0 -24.7%
Activity
GDP (million $2002)b 221,187 238,267 295,031 301,125 305,084 315,536 322,461 323,645 320,753 307,940 274,651 294,073 33.0%
GO (million $2002)b 572,565 622,946 793,554 817,837 817,114 839,156 868,690 883,357 874,312 825,585 768,691 804,756 40.6%
Energy Intensity (MJ/$2002 – GDP)a,b,d 12.3 12.4 10.0 10.3 10.5 10.7 10.4 10.2 10.7 10.7 11.4 11.0 -10.4%
Energy Intensity (MJ/$2002 – GO)a,b,d 4.7 4.8 3.7 3.8 3.9 4.0 3.9 3.8 3.9 4.0 4.1 4.0 -15.2%
1) “Other” includes steam and waste fuels from the cement industry.
Sources:a) Statistics Canada, Report on Energy Supply and Demand in Canada, 1990–2010, Ottawa, 2012.b) Informetrica Limited, The Informetrica Model and Database, Ottawa, 2012. c) Environment Canada, National Inventory Report 1990–2010: Greenhouse Gas Sources and Sinks in Canada,
Ottawa, 2012.d) Canadian Industrial Energy End-Use Data and Analysis Centre, Development of Energy Intensity Indicators for
Canadian Industry 1990 to 210, Simon Fraser University, 2012.
table continued on next page

www.nrcan.gc.ca/eneene/index-eng.phpEnergy Use Data Handbook, 1990 to 2010 — February 201374 75
4 Industrial Sector 4Industrial Sector
Industrial Secondary Energy Use and GHG Emissions by Energy Source (continued)
1990 1995 2001 2002 2003 2004 2005 2006 2007 2008 2009 2010 Total Growth 1990–2010
Total GHG Emissions Including Electricity (Mt of CO2e)a,c,d
138.1 142.9 154.5 158.8 165.7 168.6 165.6 164.7 175.7 167.1 155.6 165.9 20.2%
GHG Emissions by Energy Source (Mt of CO2e)a,c,d
Electricity 36.7 37.0 49.9 49.3 51.9 48.7 48.5 47.2 46.4 41.3 33.8 36.4 -1.0%
Natural Gas 43.4 47.0 44.1 48.7 50.4 50.5 49.1 48.9 58.2 57.9 57.0 62.2 43.5%
Diesel Fuel Oil, Light Fuel Oil and Kerosene 9.2 8.9 10.0 9.7 10.5 11.5 12.2 12.5 13.5 13.8 12.8 15.1 64.7%
Heavy Fuel Oil 15.2 11.1 10.7 9.3 11.1 11.6 10.0 8.8 8.9 7.5 6.8 5.9 -61.3%
Still Gas and Petroleum Coke 17.2 21.9 21.7 24.4 24.1 28.7 27.4 27.7 29.0 26.1 28.6 27.9 62.1%
LPG and NGL 1.6 1.6 2.2 2.2 2.0 2.1 3.3 3.2 3.5 3.8 3.5 4.1 160.5%
Coal 4.4 4.2 5.4 4.8 5.2 5.1 4.9 5.2 5.3 5.8 4.8 5.4 23.4%
Coke and Coke Oven Gas 10.1 10.6 10.0 9.8 9.9 9.7 9.7 10.4 10.2 10.0 7.8 8.2 -18.5%
Wood Waste and Pulping Liquor 0.2 0.3 0.3 0.3 0.4 0.4 0.4 0.4 0.4 0.4 0.3 0.3 60.0%
Other1 0.1 0.3 0.2 0.4 0.4 0.4 0.3 0.3 0.4 0.4 0.3 0.3 183.3%
GHG Intensity (tonnes/TJ)a,c,d 51.0 48.2 52.2 51.1 52.0 50.1 49.3 49.7 51.3 50.9 49.9 51.4 0.9%
Total GHG Emissions Excluding Electricity (Mt of CO2e)a,c,d
101.4 106.0 104.6 109.5 113.8 119.9 117.1 117.5 129.3 125.8 121.9 129.6 27.8%
GHG Intensity (tonnes/TJ)a,c,d 37.4 35.8 35.3 35.2 35.7 35.6 34.9 35.4 37.7 38.3 39.0 40.1 7.3%
continued from previous table
1) “Other” includes steam and waste fuels from the cement industry.
Sources:a) Statistics Canada, Report on Energy Supply and Demand in Canada, 1990–2010, Ottawa, 2012.b) Informetrica Limited, The Informetrica Model and Database, Ottawa, 2012. c) Environment Canada, National Inventory Report 1990–2010: Greenhouse Gas Sources and Sinks in Canada,
Ottawa, 2012.d) Canadian Industrial Energy End-Use Data and Analysis Centre, Development of Energy Intensity Indicators for
Canadian Industry 1990 to 210, Simon Fraser University, 2012.
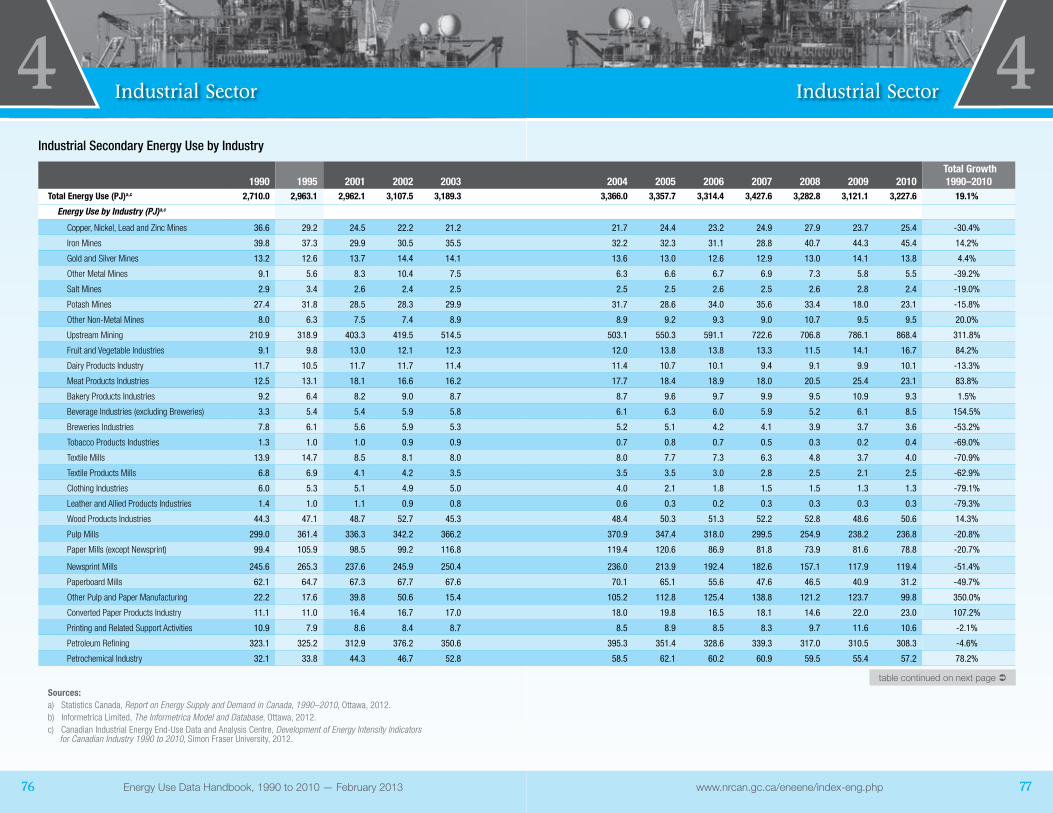
www.nrcan.gc.ca/eneene/index-eng.phpEnergy Use Data Handbook, 1990 to 2010 — February 201376 77
4 Industrial Sector 4Industrial Sector
Industrial Secondary Energy Use by Industry
1990 1995 2001 2002 2003 2004 2005 2006 2007 2008 2009 2010 Total Growth 1990–2010
Total Energy Use (PJ)a,c 2,710.0 2,963.1 2,962.1 3,107.5 3,189.3 3,366.0 3,357.7 3,314.4 3,427.6 3,282.8 3,121.1 3,227.6 19.1%
Energy Use by Industry (PJ)a,c
Copper, Nickel, Lead and Zinc Mines 36.6 29.2 24.5 22.2 21.2 21.7 24.4 23.2 24.9 27.9 23.7 25.4 -30.4%
Iron Mines 39.8 37.3 29.9 30.5 35.5 32.2 32.3 31.1 28.8 40.7 44.3 45.4 14.2%
Gold and Silver Mines 13.2 12.6 13.7 14.4 14.1 13.6 13.0 12.6 12.9 13.0 14.1 13.8 4.4%
Other Metal Mines 9.1 5.6 8.3 10.4 7.5 6.3 6.6 6.7 6.9 7.3 5.8 5.5 -39.2%
Salt Mines 2.9 3.4 2.6 2.4 2.5 2.5 2.5 2.6 2.5 2.6 2.8 2.4 -19.0%
Potash Mines 27.4 31.8 28.5 28.3 29.9 31.7 28.6 34.0 35.6 33.4 18.0 23.1 -15.8%
Other Non-Metal Mines 8.0 6.3 7.5 7.4 8.9 8.9 9.2 9.3 9.0 10.7 9.5 9.5 20.0%
Upstream Mining 210.9 318.9 403.3 419.5 514.5 503.1 550.3 591.1 722.6 706.8 786.1 868.4 311.8%
Fruit and Vegetable Industries 9.1 9.8 13.0 12.1 12.3 12.0 13.8 13.8 13.3 11.5 14.1 16.7 84.2%
Dairy Products Industry 11.7 10.5 11.7 11.7 11.4 11.4 10.7 10.1 9.4 9.1 9.9 10.1 -13.3%
Meat Products Industries 12.5 13.1 18.1 16.6 16.2 17.7 18.4 18.9 18.0 20.5 25.4 23.1 83.8%
Bakery Products Industries 9.2 6.4 8.2 9.0 8.7 8.7 9.6 9.7 9.9 9.5 10.9 9.3 1.5%
Beverage Industries (excluding Breweries) 3.3 5.4 5.4 5.9 5.8 6.1 6.3 6.0 5.9 5.2 6.1 8.5 154.5%
Breweries Industries 7.8 6.1 5.6 5.9 5.3 5.2 5.1 4.2 4.1 3.9 3.7 3.6 -53.2%
Tobacco Products Industries 1.3 1.0 1.0 0.9 0.9 0.7 0.8 0.7 0.5 0.3 0.2 0.4 -69.0%
Textile Mills 13.9 14.7 8.5 8.1 8.0 8.0 7.7 7.3 6.3 4.8 3.7 4.0 -70.9%
Textile Products Mills 6.8 6.9 4.1 4.2 3.5 3.5 3.5 3.0 2.8 2.5 2.1 2.5 -62.9%
Clothing Industries 6.0 5.3 5.1 4.9 5.0 4.0 2.1 1.8 1.5 1.5 1.3 1.3 -79.1%
Leather and Allied Products Industries 1.4 1.0 1.1 0.9 0.8 0.6 0.3 0.2 0.3 0.3 0.3 0.3 -79.3%
Wood Products Industries 44.3 47.1 48.7 52.7 45.3 48.4 50.3 51.3 52.2 52.8 48.6 50.6 14.3%
Pulp Mills 299.0 361.4 336.3 342.2 366.2 370.9 347.4 318.0 299.5 254.9 238.2 236.8 -20.8%
Paper Mills (except Newsprint) 99.4 105.9 98.5 99.2 116.8 119.4 120.6 86.9 81.8 73.9 81.6 78.8 -20.7%
Newsprint Mills 245.6 265.3 237.6 245.9 250.4 236.0 213.9 192.4 182.6 157.1 117.9 119.4 -51.4%
Paperboard Mills 62.1 64.7 67.3 67.7 67.6 70.1 65.1 55.6 47.6 46.5 40.9 31.2 -49.7%
Other Pulp and Paper Manufacturing 22.2 17.6 39.8 50.6 15.4 105.2 112.8 125.4 138.8 121.2 123.7 99.8 350.0%
Converted Paper Products Industry 11.1 11.0 16.4 16.7 17.0 18.0 19.8 16.5 18.1 14.6 22.0 23.0 107.2%
Printing and Related Support Activities 10.9 7.9 8.6 8.4 8.7 8.5 8.9 8.5 8.3 9.7 11.6 10.6 -2.1%
Petroleum Refining 323.1 325.2 312.9 376.2 350.6 395.3 351.4 328.6 339.3 317.0 310.5 308.3 -4.6%
Petrochemical Industry 32.1 33.8 44.3 46.7 52.8 58.5 62.1 60.2 60.9 59.5 55.4 57.2 78.2%
Sources:a) Statistics Canada, Report on Energy Supply and Demand in Canada, 1990–2010, Ottawa, 2012.b) Informetrica Limited, The Informetrica Model and Database, Ottawa, 2012. c) Canadian Industrial Energy End-Use Data and Analysis Centre, Development of Energy Intensity Indicators
for Canadian Industry 1990 to 2010, Simon Fraser University, 2012.
table continued on next page

www.nrcan.gc.ca/eneene/index-eng.phpEnergy Use Data Handbook, 1990 to 2010 — February 201378 79
4 Industrial Sector 4Industrial Sector
Sources:a) Statistics Canada, Report on Energy Supply and Demand in Canada, 1990–2010, Ottawa, 2012.b) Informetrica Limited, The Informetrica Model and Database, Ottawa, 2012. c) Canadian Industrial Energy End-Use Data and Analysis Centre, Development of Energy Intensity Indicators
for Canadian Industry 1990 to 2010, Simon Fraser University, 2012.
Industrial Secondary Energy Use by Industry (continued)
1990 1995 2001 2002 2003 2004 2005 2006 2007 2008 2009 2010 Total Growth 1990–2010
Energy Use by Industry (PJ)a,c (continued)
Industrial Gas Industry 5.9 5.8 8.9 9.1 9.2 10.5 8.3 13.7 12.8 10.8 13.9 13.7 130.5%
Alkali and Chlorine Manufacturing 30.4 29.9 24.5 17.6 16.8 17.6 16.0 14.2 8.7 8.1 7.4 3.0 -90.2%
All Other Basic Inorganic Chemical Manufacturing 28.6 30.7 34.0 29.9 33.6 36.0 37.4 33.9 28.8 27.9 24.7 26.1 -8.8%
Chemical Fertilizer (except Potash) Manufacturing 31.9 55.9 62.1 54.1 58.0 58.2 53.4 55.0 52.9 49.2 45.1 52.5 64.4%
Other Chemical Manufacturing 94.2 94.7 56.6 73.3 44.1 64.1 58.9 70.7 78.8 86.0 86.5 102.2 8.4%
Resin and Synthetic Rubber Industries 48.1 30.6 36.7 33.5 28.8 28.2 24.6 33.2 32.4 34.8 38.0 35.3 -26.8%
Motor Vehicle Plastic Parts Manufacturing 2.8 2.7 5.2 4.2 4.2 5.8 4.7 4.5 3.9 3.7 2.6 3.2 15.5%
Rubber Products Industries 9.5 9.9 10.9 11.1 11.2 10.0 10.1 9.5 9.2 8.3 8.3 8.2 -13.9%
Cement Industry 59.3 61.9 65.5 69.3 66.4 68.9 72.0 75.0 67.2 65.4 60.7 59.3 0.0%
Iron and Steel 219.4 247.0 229.3 246.7 241.3 249.7 239.7 251.9 256.5 249.8 188.9 205.4 -6.4%
Primary Production of Alumina and Aluminum 109.8 138.2 159.9 169.2 178.7 169.8 187.2 188.5 192.2 195.3 172.9 180.6 64.5%
Other Non-Ferrous Smelting and Refining 73.5 81.0 86.2 81.8 77.4 78.4 73.1 73.7 63.0 65.2 54.1 50.9 -30.7%
Fabricated Metal Products Industries 37.3 36.4 37.3 40.3 39.0 41.2 40.7 38.3 39.3 41.9 35.8 33.3 -10.5%
Machinery Industries 12.2 13.7 13.3 13.6 15.1 16.0 18.0 16.7 17.6 16.6 15.9 16.5 35.0%
Computer and Electronic Products Industries 4.6 5.9 3.7 3.9 4.6 5.1 5.6 5.4 5.8 5.3 5.1 5.7 22.9%
Electrical Equipment and Components Industries 8.5 7.7 6.3 5.9 6.7 7.1 7.3 6.8 6.4 6.0 5.3 5.7 -33.5%
Motor Vehicle Industry 18.5 24.6 23.6 23.5 24.4 22.7 22.6 21.0 20.2 18.4 14.9 15.0 -18.9%
Motor Vehicle Gasoline Engine and Engine Parts Manufacturing
3.1 2.9 2.8 3.0 3.0 3.1 3.5 3.1 3.2 2.5 2.1 1.8 -44.1%
Motor Vehicle Electrical and Electronic Equipment Manufacturing
0.3 0.3 0.5 0.7 0.6 0.6 0.6 0.3 0.5 0.3 0.3 0.4 68.0%
Motor Vehicle Steering and Suspension Components (except Spring) Manufacturing
2.1 2.1 1.6 1.8 1.2 1.3 1.4 1.3 1.3 1.0 1.2 0.7 -68.2%
Motor Vehicle Brake System Manufacturing 1.8 2.1 2.9 2.8 2.1 2.2 1.1 0.9 0.7 0.8 0.4 0.4 -79.3%
Motor Vehicle Transmission and Power Train Parts Manufacturing
3.0 2.0 2.7 2.8 3.1 3.4 3.7 3.5 3.2 2.7 2.0 2.2 -27.9%
Motor Vehicle Seating and Interior Trim Manufacturing
1.2 1.2 1.7 2.0 1.9 2.0 1.9 1.8 1.6 1.4 1.4 1.6 32.2%
Motor Vehicle Metal Stamping 3.3 3.5 3.8 4.5 3.5 3.8 3.8 3.7 3.6 3.4 2.6 3.0 -8.0%
Other Motor Vehicle Parts Manufacturing 3.2 3.2 4.2 5.9 5.1 5.3 5.0 4.4 4.5 4.8 4.4 3.4 4.6%
Furniture and Related Products Industries 6.7 6.7 10.5 10.9 11.2 10.8 11.6 10.0 10.5 11.0 10.6 9.7 45.2%
continued from previous table
table continued on next page
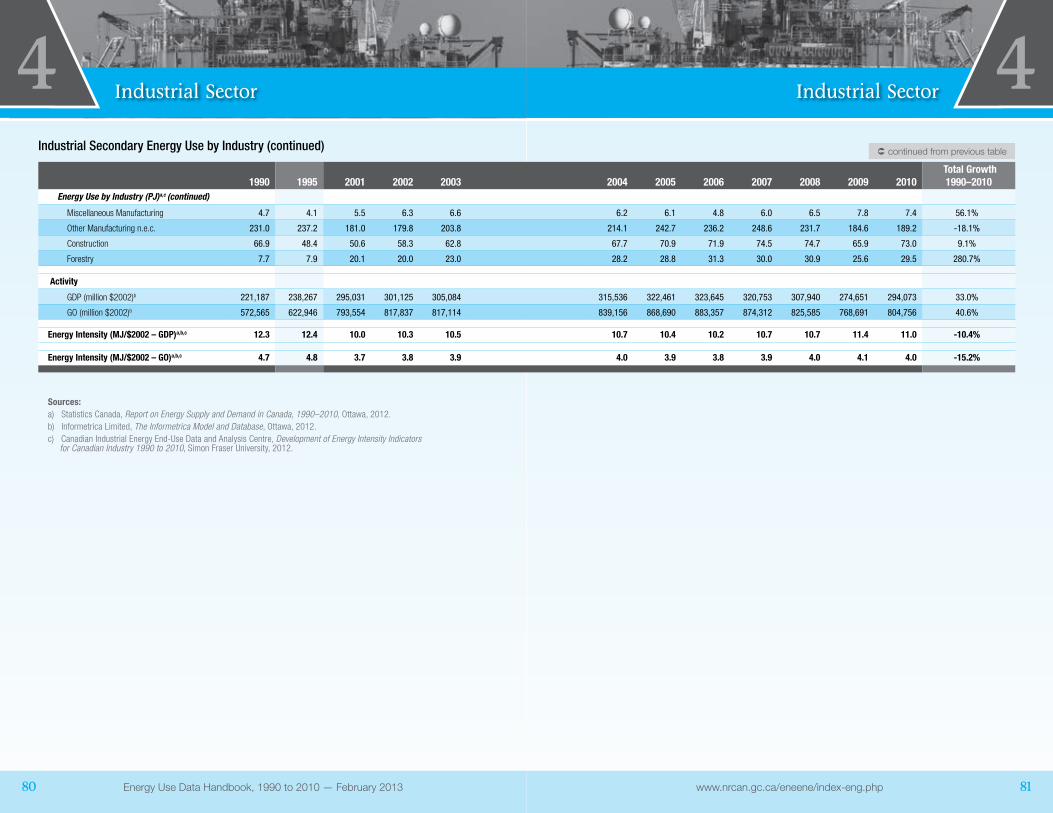
www.nrcan.gc.ca/eneene/index-eng.phpEnergy Use Data Handbook, 1990 to 2010 — February 201380 81
4 Industrial Sector 4Industrial Sector
Industrial Secondary Energy Use by Industry (continued)
1990 1995 2001 2002 2003 2004 2005 2006 2007 2008 2009 2010 Total Growth 1990–2010
Energy Use by Industry (PJ)a,c (continued)
Miscellaneous Manufacturing 4.7 4.1 5.5 6.3 6.6 6.2 6.1 4.8 6.0 6.5 7.8 7.4 56.1%
Other Manufacturing n.e.c. 231.0 237.2 181.0 179.8 203.8 214.1 242.7 236.2 248.6 231.7 184.6 189.2 -18.1%
Construction 66.9 48.4 50.6 58.3 62.8 67.7 70.9 71.9 74.5 74.7 65.9 73.0 9.1%
Forestry 7.7 7.9 20.1 20.0 23.0 28.2 28.8 31.3 30.0 30.9 25.6 29.5 280.7%
Activity
GDP (million $2002)b 221,187 238,267 295,031 301,125 305,084 315,536 322,461 323,645 320,753 307,940 274,651 294,073 33.0%
GO (million $2002)b 572,565 622,946 793,554 817,837 817,114 839,156 868,690 883,357 874,312 825,585 768,691 804,756 40.6%
Energy Intensity (MJ/$2002 – GDP)a,b,c 12.3 12.4 10.0 10.3 10.5 10.7 10.4 10.2 10.7 10.7 11.4 11.0 -10.4%
Energy Intensity (MJ/$2002 – GO)a,b,c 4.7 4.8 3.7 3.8 3.9 4.0 3.9 3.8 3.9 4.0 4.1 4.0 -15.2%
continued from previous table
Sources:a) Statistics Canada, Report on Energy Supply and Demand in Canada, 1990–2010, Ottawa, 2012.b) Informetrica Limited, The Informetrica Model and Database, Ottawa, 2012. c) Canadian Industrial Energy End-Use Data and Analysis Centre, Development of Energy Intensity Indicators
for Canadian Industry 1990 to 2010, Simon Fraser University, 2012.

www.nrcan.gc.ca/eneene/index-eng.phpEnergy Use Data Handbook, 1990 to 2010 — February 201382 83
4 Industrial Sector 4Industrial Sector
Industrial GHG Emissions by Industry – Including Electricity-Related Emissions1
1990 1995 2001 2002 2003 2004 2005 2006 2007 2008 2009 2010 Total Growth 1990–2010
Total GHG Emissions Including Electricity (Mt of CO2e)a,b,c
138.1 142.9 154.5 158.8 165.7 168.6 165.6 164.7 175.7 167.1 155.6 165.9 20.2%
GHG Emissions by Industry (Mt of CO2e)a,b,c
Copper, Nickel, Lead and Zinc Mines 2.3 1.7 1.6 1.5 1.4 1.4 1.6 1.5 1.6 1.7 1.4 1.6 -31.0%
Iron Mines 2.9 2.5 2.1 2.2 2.6 2.3 2.2 2.2 2.0 2.8 3.1 3.1 9.8%
Gold and Silver Mines 0.8 0.7 0.9 0.9 0.9 0.9 0.8 0.8 0.8 0.8 0.8 0.8 -2.5%
Other Metal Mines 0.6 0.3 0.5 0.7 0.5 0.4 0.4 0.4 0.4 0.5 0.4 0.3 -42.1%
Salt Mines 0.2 0.2 0.2 0.2 0.2 0.2 0.2 0.2 0.2 0.2 0.2 0.2 -25.0%
Potash Mines 1.8 2.0 1.9 1.9 2.0 2.1 1.8 2.2 2.3 2.1 1.1 1.4 -20.2%
Other Non-Metal Mines 0.5 0.4 0.5 0.5 0.6 0.6 0.6 0.7 0.6 0.8 0.7 0.7 24.5%
Upstream Mining 13.0 19.3 25.5 26.5 32.8 32.1 34.3 36.7 45.9 45.0 49.8 54.9 321.6%
Fruit and Vegetable Industries 0.5 0.5 0.8 0.7 0.7 0.7 0.8 0.8 0.8 0.6 0.8 0.7 32.0%
Dairy Products Industry 0.6 0.5 0.6 0.6 0.6 0.6 0.6 0.5 0.5 0.5 0.5 0.5 -18.8%
Meat Products Industries 0.7 0.7 1.0 0.9 0.9 1.0 1.0 1.0 1.0 1.1 1.3 1.2 74.6%
Bakery Products Industries 0.5 0.3 0.4 0.5 0.5 0.5 0.5 0.5 0.5 0.5 0.6 0.5 0.0%
Beverage Industries (excluding Breweries) 0.2 0.3 0.3 0.3 0.3 0.3 0.3 0.3 0.3 0.3 0.3 0.4 138.9%
Breweries Industries 0.4 0.3 0.3 0.3 0.3 0.3 0.3 0.2 0.2 0.2 0.2 0.2 -53.7%
Tobacco Products Industries 0.1 0.1 0.1 0.1 0.1 0.0 0.0 0.0 0.0 0.0 0.0 0.0 -71.4%
Textile Mills 0.7 0.8 0.5 0.5 0.4 0.4 0.4 0.4 0.3 0.3 0.2 0.2 -71.2%
Textile Products Mills 0.4 0.4 0.2 0.2 0.2 0.2 0.2 0.2 0.2 0.1 0.1 0.1 -63.9%
Clothing Industries 0.3 0.3 0.3 0.3 0.3 0.2 0.1 0.1 0.1 0.1 0.1 0.1 -81.3%
Leather and Allied Products Industries 0.1 0.1 0.1 0.1 0.0 0.0 0.0 0.0 0.0 0.0 0.0 0.0 -85.7%
Wood Products Industries 1.5 1.6 1.7 2.0 1.7 1.8 1.8 1.7 1.9 1.6 1.3 1.4 -11.2%
Pulp Mills 6.5 5.9 6.7 6.4 6.6 6.3 5.8 5.3 5.3 4.2 3.6 3.7 -43.6%
Paper Mills (except Newsprint) 3.4 3.1 3.5 3.2 4.0 3.8 3.5 2.8 2.8 2.4 2.3 2.1 -36.1%
Newsprint Mills 11.1 10.5 10.9 10.7 10.6 9.9 8.4 7.0 7.1 5.5 3.7 3.8 -65.7%
Paperboard Mills 2.2 2.0 2.2 2.1 2.2 2.2 1.9 1.6 1.5 1.4 1.1 1.0 -53.2%
Other Pulp and Paper Manufacturing 1.2 1.0 0.7 1.0 0.5 0.9 0.8 1.4 1.4 1.2 2.1 1.8 53.4%
Converted Paper Products Industry 0.6 0.6 0.9 0.9 0.9 0.9 1.0 0.8 0.9 0.7 1.0 1.1 89.8%
Printing and Related Support Activities 0.6 0.4 0.5 0.5 0.5 0.5 0.5 0.5 0.5 0.5 0.6 0.5 -5.3%
1) Includes only end-use energy-related GHG emissions.
Sources:a) Statistics Canada, Report on Energy Supply and Demand in Canada, 1990–2010, Ottawa, 2012.b) Environment Canada, National Inventory Report 1990–2010: Greenhouse Gas Sources and Sinks in Canada,
Ottawa, 2012.c) Canadian Industrial Energy End-Use Data and Analysis Centre, Development of Energy Intensity Indicators for Canadian
Industry 1990 to 2010, Simon Fraser University, 2012.
table continued on next page
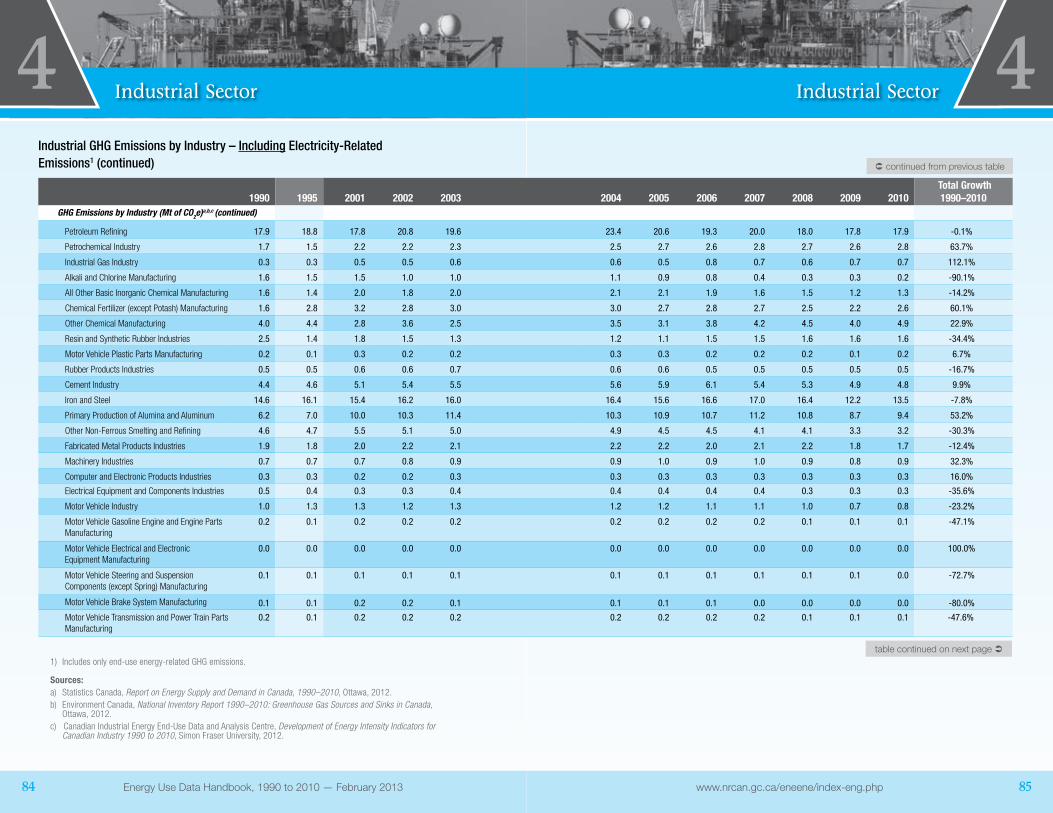
www.nrcan.gc.ca/eneene/index-eng.phpEnergy Use Data Handbook, 1990 to 2010 — February 201384 85
4 Industrial Sector 4Industrial Sector
1) Includes only end-use energy-related GHG emissions.
Sources:a) Statistics Canada, Report on Energy Supply and Demand in Canada, 1990–2010, Ottawa, 2012.b) Environment Canada, National Inventory Report 1990–2010: Greenhouse Gas Sources and Sinks in Canada,
Ottawa, 2012.c) Canadian Industrial Energy End-Use Data and Analysis Centre, Development of Energy Intensity Indicators for
Canadian Industry 1990 to 2010, Simon Fraser University, 2012.
Industrial GHG Emissions by Industry – Including Electricity-Related Emissions1 (continued)
1990 1995 2001 2002 2003 2004 2005 2006 2007 2008 2009 2010 Total Growth 1990–2010
GHG Emissions by Industry (Mt of CO2e)a,b,c (continued)
Petroleum Refining 17.9 18.8 17.8 20.8 19.6 23.4 20.6 19.3 20.0 18.0 17.8 17.9 -0.1%
Petrochemical Industry 1.7 1.5 2.2 2.2 2.3 2.5 2.7 2.6 2.8 2.7 2.6 2.8 63.7%
Industrial Gas Industry 0.3 0.3 0.5 0.5 0.6 0.6 0.5 0.8 0.7 0.6 0.7 0.7 112.1%
Alkali and Chlorine Manufacturing 1.6 1.5 1.5 1.0 1.0 1.1 0.9 0.8 0.4 0.3 0.3 0.2 -90.1%
All Other Basic Inorganic Chemical Manufacturing 1.6 1.4 2.0 1.8 2.0 2.1 2.1 1.9 1.6 1.5 1.2 1.3 -14.2%
Chemical Fertilizer (except Potash) Manufacturing 1.6 2.8 3.2 2.8 3.0 3.0 2.7 2.8 2.7 2.5 2.2 2.6 60.1%
Other Chemical Manufacturing 4.0 4.4 2.8 3.6 2.5 3.5 3.1 3.8 4.2 4.5 4.0 4.9 22.9%
Resin and Synthetic Rubber Industries 2.5 1.4 1.8 1.5 1.3 1.2 1.1 1.5 1.5 1.6 1.6 1.6 -34.4%
Motor Vehicle Plastic Parts Manufacturing 0.2 0.1 0.3 0.2 0.2 0.3 0.3 0.2 0.2 0.2 0.1 0.2 6.7%
Rubber Products Industries 0.5 0.5 0.6 0.6 0.7 0.6 0.6 0.5 0.5 0.5 0.5 0.5 -16.7%
Cement Industry 4.4 4.6 5.1 5.4 5.5 5.6 5.9 6.1 5.4 5.3 4.9 4.8 9.9%
Iron and Steel 14.6 16.1 15.4 16.2 16.0 16.4 15.6 16.6 17.0 16.4 12.2 13.5 -7.8%
Primary Production of Alumina and Aluminum 6.2 7.0 10.0 10.3 11.4 10.3 10.9 10.7 11.2 10.8 8.7 9.4 53.2%
Other Non-Ferrous Smelting and Refining 4.6 4.7 5.5 5.1 5.0 4.9 4.5 4.5 4.1 4.1 3.3 3.2 -30.3%
Fabricated Metal Products Industries 1.9 1.8 2.0 2.2 2.1 2.2 2.2 2.0 2.1 2.2 1.8 1.7 -12.4%
Machinery Industries 0.7 0.7 0.7 0.8 0.9 0.9 1.0 0.9 1.0 0.9 0.8 0.9 32.3%
Computer and Electronic Products Industries 0.3 0.3 0.2 0.2 0.3 0.3 0.3 0.3 0.3 0.3 0.3 0.3 16.0%
Electrical Equipment and Components Industries 0.5 0.4 0.3 0.3 0.4 0.4 0.4 0.4 0.4 0.3 0.3 0.3 -35.6%
Motor Vehicle Industry 1.0 1.3 1.3 1.2 1.3 1.2 1.2 1.1 1.1 1.0 0.7 0.8 -23.2%
Motor Vehicle Gasoline Engine and Engine Parts Manufacturing
0.2 0.1 0.2 0.2 0.2 0.2 0.2 0.2 0.2 0.1 0.1 0.1 -47.1%
Motor Vehicle Electrical and Electronic Equipment Manufacturing
0.0 0.0 0.0 0.0 0.0 0.0 0.0 0.0 0.0 0.0 0.0 0.0 100.0%
Motor Vehicle Steering and Suspension Components (except Spring) Manufacturing
0.1 0.1 0.1 0.1 0.1 0.1 0.1 0.1 0.1 0.1 0.1 0.0 -72.7%
Motor Vehicle Brake System Manufacturing 0.1 0.1 0.2 0.2 0.1 0.1 0.1 0.1 0.0 0.0 0.0 0.0 -80.0%
Motor Vehicle Transmission and Power Train Parts Manufacturing
0.2 0.1 0.2 0.2 0.2 0.2 0.2 0.2 0.2 0.1 0.1 0.1 -47.6%
continued from previous table
table continued on next page
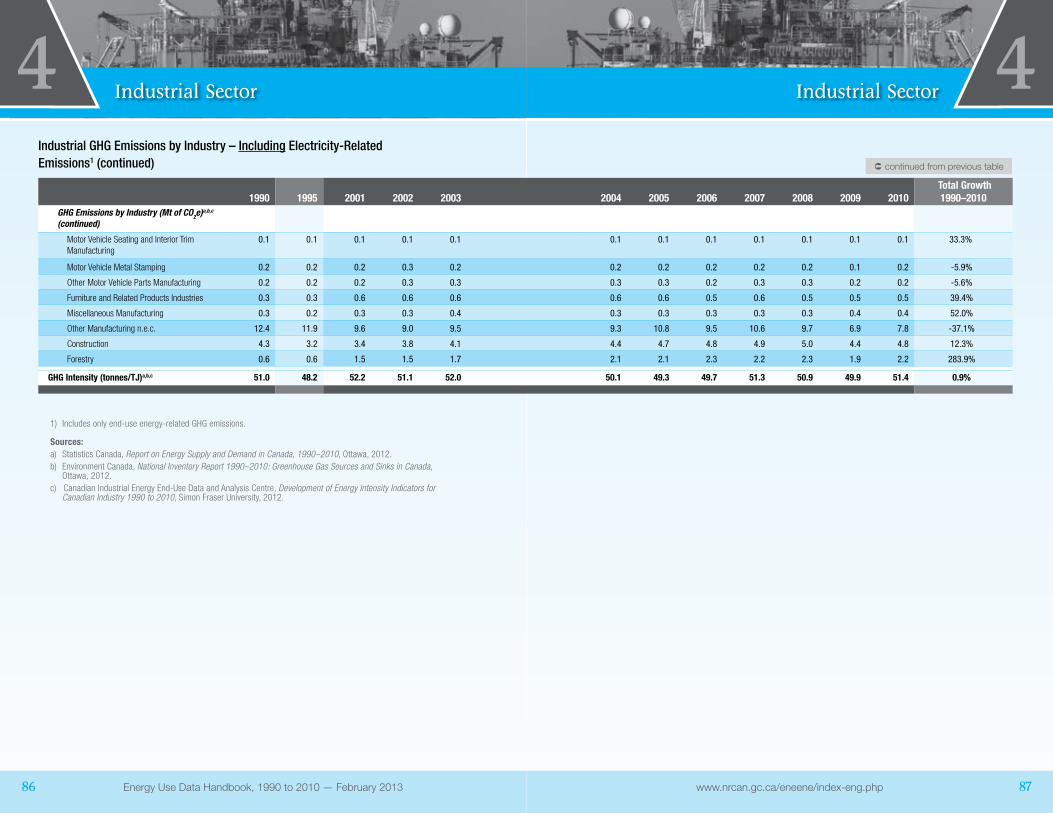
www.nrcan.gc.ca/eneene/index-eng.phpEnergy Use Data Handbook, 1990 to 2010 — February 201386 87
4 Industrial Sector 4Industrial Sector
1) Includes only end-use energy-related GHG emissions.
Sources:a) Statistics Canada, Report on Energy Supply and Demand in Canada, 1990–2010, Ottawa, 2012.b) Environment Canada, National Inventory Report 1990–2010: Greenhouse Gas Sources and Sinks in Canada,
Ottawa, 2012.c) Canadian Industrial Energy End-Use Data and Analysis Centre, Development of Energy Intensity Indicators for
Canadian Industry 1990 to 2010, Simon Fraser University, 2012.
Industrial GHG Emissions by Industry – Including Electricity-Related Emissions1 (continued)
1990 1995 2001 2002 2003 2004 2005 2006 2007 2008 2009 2010 Total Growth 1990–2010
GHG Emissions by Industry (Mt of CO2e)a,b,c
(continued)
Motor Vehicle Seating and Interior Trim Manufacturing
0.1 0.1 0.1 0.1 0.1 0.1 0.1 0.1 0.1 0.1 0.1 0.1 33.3%
Motor Vehicle Metal Stamping 0.2 0.2 0.2 0.3 0.2 0.2 0.2 0.2 0.2 0.2 0.1 0.2 -5.9%
Other Motor Vehicle Parts Manufacturing 0.2 0.2 0.2 0.3 0.3 0.3 0.3 0.2 0.3 0.3 0.2 0.2 -5.6%
Furniture and Related Products Industries 0.3 0.3 0.6 0.6 0.6 0.6 0.6 0.5 0.6 0.5 0.5 0.5 39.4%
Miscellaneous Manufacturing 0.3 0.2 0.3 0.3 0.4 0.3 0.3 0.3 0.3 0.3 0.4 0.4 52.0%
Other Manufacturing n.e.c. 12.4 11.9 9.6 9.0 9.5 9.3 10.8 9.5 10.6 9.7 6.9 7.8 -37.1%
Construction 4.3 3.2 3.4 3.8 4.1 4.4 4.7 4.8 4.9 5.0 4.4 4.8 12.3%
Forestry 0.6 0.6 1.5 1.5 1.7 2.1 2.1 2.3 2.2 2.3 1.9 2.2 283.9%
GHG Intensity (tonnes/TJ)a,b,c 51.0 48.2 52.2 51.1 52.0 50.1 49.3 49.7 51.3 50.9 49.9 51.4 0.9%
continued from previous table

www.nrcan.gc.ca/eneene/index-eng.phpEnergy Use Data Handbook, 1990 to 2010 — February 201388 89
4 Industrial Sector 4Industrial Sector
Industrial GHG Emissions by Industry – Excluding Electricity-Related Emissions1
1990 1995 2001 2002 2003 2004 2005 2006 2007 2008 2009 2010 Total Growth 1990–2010
Total GHG Emissions Excluding Electricity (Mt of CO2e)a,b,c
101.4 106.0 104.6 109.5 113.8 119.9 117.1 117.5 129.3 125.8 121.9 129.6 27.8%
GHG Emissions by Industry (Mt of CO2e)a,b,c
Copper, Nickel, Lead and Zinc Mines 1.0 0.8 0.8 0.7 0.6 0.7 0.8 0.7 0.8 1.0 0.9 0.9 -12.6%
Iron Mines 2.1 1.8 1.5 1.5 1.8 1.5 1.5 1.8 1.6 2.1 2.5 2.5 16.1%
Gold and Silver Mines 0.4 0.4 0.4 0.4 0.4 0.4 0.3 0.3 0.3 0.3 0.3 0.3 -18.9%
Other Metal Mines 0.3 0.2 0.3 0.3 0.3 0.2 0.2 0.3 0.3 0.3 0.2 0.2 -35.3%
Salt Mines 0.2 0.2 0.1 0.1 0.1 0.1 0.1 0.1 0.1 0.1 0.2 0.1 -29.4%
Potash Mines 1.4 1.7 1.5 1.5 1.6 1.7 1.5 1.8 1.9 1.7 0.9 1.1 -25.7%
Other Non-Metal Mines 0.4 0.3 0.5 0.5 0.6 0.6 0.6 0.6 0.6 0.7 0.6 0.6 41.9%
Upstream Mining 10.4 16.1 21.4 22.7 29.1 28.3 30.3 32.6 42.7 43.4 48.7 53.3 414.4%
Fruit and Vegetable Industries 0.4 0.5 0.6 0.6 0.6 0.5 0.6 0.6 0.5 0.5 0.6 0.5 11.9%
Dairy Products Industry 0.5 0.4 0.5 0.5 0.4 0.4 0.4 0.4 0.3 0.3 0.3 0.4 -21.7%
Meat Products Industries 0.5 0.5 0.7 0.6 0.6 0.7 0.7 0.7 0.6 0.6 0.8 0.8 78.3%
Bakery Products Industries 0.4 0.3 0.3 0.3 0.3 0.3 0.3 0.3 0.3 0.3 0.3 0.3 -30.0%
Beverage Industries (excluding Breweries) 0.1 0.2 0.2 0.3 0.2 0.3 0.3 0.3 0.2 0.2 0.2 0.3 175.0%
Breweries Industries 0.3 0.3 0.2 0.3 0.2 0.2 0.2 0.2 0.2 0.2 0.1 0.1 -58.8%
Tobacco Products Industries 0.0 0.0 0.0 0.0 0.0 0.0 0.0 0.0 0.0 0.0 0.0 0.0 -75.0%
Textile Mills 0.5 0.5 0.3 0.3 0.3 0.2 0.2 0.2 0.2 0.1 0.1 0.1 -79.6%
Textile Products Mills 0.3 0.3 0.2 0.2 0.1 0.1 0.1 0.1 0.1 0.1 0.1 0.1 -68.0%
Clothing Industries 0.2 0.2 0.2 0.1 0.1 0.1 0.1 0.0 0.0 0.0 0.0 0.0 -84.2%
Leather and Allied Products Industries 0.0 0.0 0.0 0.0 0.0 0.0 0.0 0.0 0.0 0.0 0.0 0.0 -75.0%
Wood Products Industries 1.1 0.9 0.8 0.9 0.7 0.8 0.8 0.9 1.0 0.8 0.6 0.6 -39.0%
Pulp Mills 4.1 3.8 3.4 3.3 3.3 3.2 2.5 2.2 2.3 1.9 1.8 1.6 -60.3%
Paper Mills (except Newsprint) 2.2 2.1 1.9 1.7 1.9 1.9 1.6 1.1 1.1 0.9 0.9 0.7 -67.3%
Newsprint Mills 5.4 4.5 3.2 2.9 2.8 2.6 2.0 1.5 1.5 1.0 0.7 0.6 -89.8%
Paperboard Mills 1.7 1.4 1.5 1.4 1.5 1.5 1.2 1.0 1.0 0.9 0.7 0.6 -62.7%
Other Pulp and Paper Manufacturing 1.2 0.3 0.7 1.0 0.3 0.5 0.6 1.0 1.0 0.9 1.4 1.5 25.9%
Converted Paper Products Industry 0.4 0.4 0.5 0.5 0.5 0.5 0.6 0.5 0.5 0.5 0.8 0.8 95.2%
Printing and Related Support Activities 0.3 0.2 0.3 0.3 0.3 0.2 0.2 0.2 0.2 0.2 0.3 0.2 -29.0%
1) Includes only end-use energy-related GHG emissions.
Sources:a) Statistics Canada, Report on Energy Supply and Demand in Canada, 1990–2010, Ottawa, 2012.b) Environment Canada, National Inventory Report 1990–2010: Greenhouse Gas Sources and Sinks in Canada,
Ottawa, 2012.c) Canadian Industrial Energy End-Use Data and Analysis Centre, Development of Energy Intensity Indicators
for Canadian Industry 1990 to 2010, Simon Fraser University, 2012.
table continued on next page

www.nrcan.gc.ca/eneene/index-eng.phpEnergy Use Data Handbook, 1990 to 2010 — February 201390 91
4 Industrial Sector 4Industrial Sector
1) Includes only end-use energy-related GHG emissions.
Sources:a) Statistics Canada, Report on Energy Supply and Demand in Canada, 1990–2010, Ottawa, 2012.b) Environment Canada, National Inventory Report 1990–2010: Greenhouse Gas Sources and Sinks in Canada,
Ottawa, 2012.c) Canadian Industrial Energy End-Use Data and Analysis Centre, Development of Energy Intensity Indicators
for Canadian Industry 1990 to 2010, Simon Fraser University, 2012.
Industrial GHG Emissions by Industry – Excluding Electricity-Related Emissions1 (continued)
1990 1995 2001 2002 2003 2004 2005 2006 2007 2008 2009 2010 Total Growth 1990–2010
GHG Emissions by Industry (Mt of CO2e)a,b,c (continued)
Petroleum Refining 16.7 17.9 16.6 19.5 18.3 22.3 19.5 18.2 18.8 16.9 16.8 16.8 0.1%
Petrochemical Industry 1.5 1.4 1.9 1.9 2.0 2.3 2.5 2.4 2.5 2.5 2.4 2.6 67.5%
Industrial Gas Industry 0.0 0.0 0.1 0.1 0.0 0.0 0.0 0.0 0.0 0.0 0.3 0.2 450.0%
Alkali and Chlorine Manufacturing 0.8 0.7 0.5 0.3 0.3 0.4 0.2 0.2 0.1 0.1 0.0 0.0 -96.3%
All Other Basic Inorganic Chemical Manufacturing 0.4 0.3 0.4 0.3 0.4 0.4 0.4 0.3 0.3 0.3 0.2 0.3 -40.5%
Chemical Fertilizer (except Potash) Manufacturing 1.4 2.6 2.8 2.4 2.6 2.6 2.4 2.4 2.4 2.2 2.0 2.3 65.7%
Other Chemical Manufacturing 2.9 3.3 2.0 2.4 1.3 2.2 2.0 2.5 2.5 2.9 2.8 3.6 21.6%
Resin and Synthetic Rubber Industries 2.0 0.9 1.1 1.0 0.6 0.6 0.5 0.9 0.9 1.0 1.2 1.1 -44.1%
Motor Vehicle Plastic Parts Manufacturing 0.1 0.1 0.2 0.1 0.1 0.2 0.1 0.1 0.1 0.1 0.1 0.1 -12.5%
Rubber Products Industries 0.3 0.4 0.4 0.4 0.4 0.3 0.3 0.3 0.3 0.3 0.3 0.2 -33.3%
Cement Industry 4.0 4.3 4.6 5.0 5.0 5.2 5.4 5.7 5.0 4.9 4.6 4.5 12.1%
Iron and Steel 13.0 14.6 12.9 13.7 13.6 14.1 13.5 14.3 14.9 14.5 10.9 11.9 -7.8%
Primary Production of Alumina and Aluminum 0.5 0.7 1.0 0.9 1.1 1.1 1.2 0.9 1.1 1.1 0.6 0.7 34.0%
Other Non-Ferrous Smelting and Refining 2.8 2.7 2.8 2.6 2.5 2.5 2.4 2.5 2.8 2.6 2.1 2.0 -29.0%
Fabricated Metal Products Industries 1.4 1.4 1.3 1.5 1.4 1.5 1.4 1.3 1.3 1.3 1.2 1.1 -23.2%
Machinery Industries 0.4 0.4 0.5 0.4 0.5 0.5 0.5 0.5 0.5 0.5 0.5 0.5 44.4%
Computer and Electronic Products Industries 0.1 0.1 0.1 0.1 0.1 0.1 0.1 0.1 0.1 0.1 0.1 0.1 0.0%
Electrical Equipment and Components Industries 0.3 0.3 0.2 0.2 0.2 0.2 0.2 0.2 0.2 0.2 0.1 0.2 -48.5%
Motor Vehicle Industry 0.7 1.0 0.9 0.9 0.9 0.9 0.8 0.8 0.7 0.7 0.5 0.5 -29.2%
Motor Vehicle Gasoline Engine and Engine Parts Manufacturing
0.1 0.1 0.1 0.1 0.1 0.1 0.1 0.1 0.1 0.0 0.0 0.0 -66.7%
Motor Vehicle Electrical and Electronic Equipment Manufacturing
0.0 0.0 0.0 0.0 0.0 0.0 0.0 0.0 0.0 0.0 0.0 0.0 –
Motor Vehicle Steering and Suspension Components (except Spring) Manufacturing
0.1 0.1 0.1 0.1 0.0 0.0 0.0 0.0 0.0 0.0 0.0 0.0 -85.7%
Motor Vehicle Brake System Manufacturing 0.1 0.1 0.1 0.1 0.1 0.1 0.0 0.0 0.0 0.0 0.0 0.0 -83.3%
Motor Vehicle Transmission and Power Train Parts Manufacturing
0.2 0.1 0.1 0.1 0.1 0.1 0.1 0.1 0.1 0.1 0.0 0.1 -72.2%
continued from previous table
table continued on next page
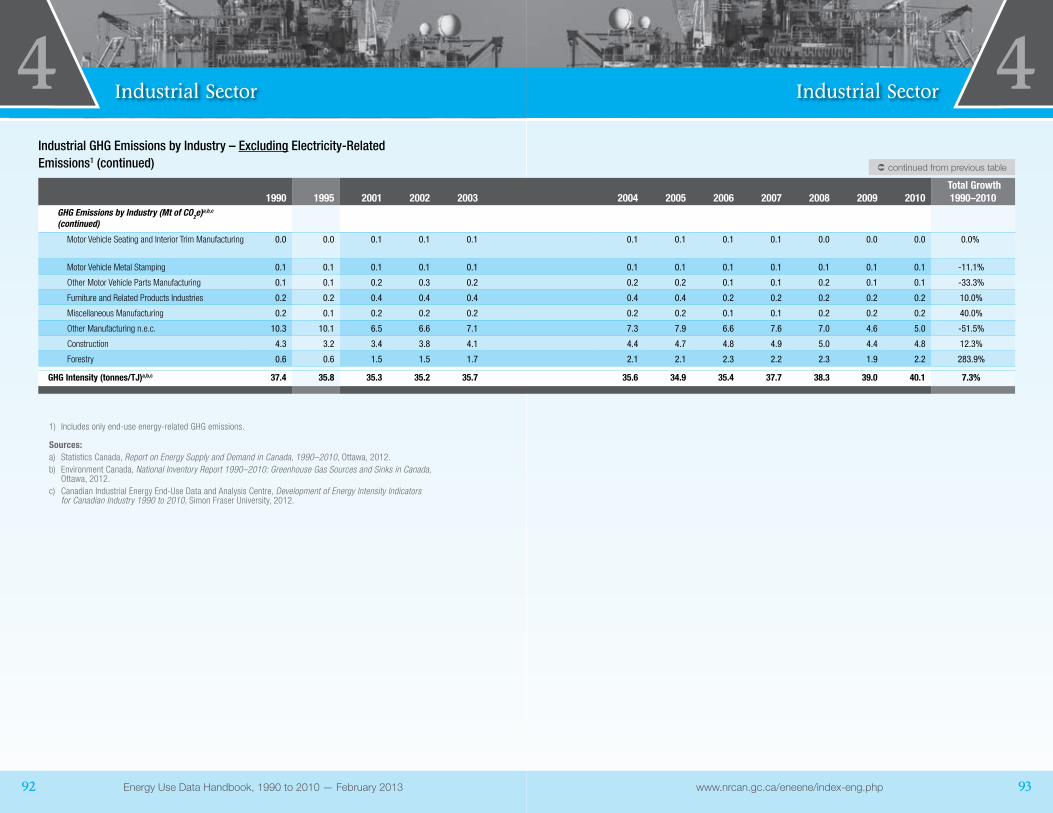
www.nrcan.gc.ca/eneene/index-eng.phpEnergy Use Data Handbook, 1990 to 2010 — February 201392 93
4 Industrial Sector 4Industrial Sector
Industrial GHG Emissions by Industry – Excluding Electricity-Related Emissions1 (continued)
1990 1995 2001 2002 2003 2004 2005 2006 2007 2008 2009 2010 Total Growth 1990–2010
GHG Emissions by Industry (Mt of CO2e)a,b,c (continued)
Motor Vehicle Seating and Interior Trim Manufacturing 0.0 0.0 0.1 0.1 0.1 0.1 0.1 0.1 0.1 0.0 0.0 0.0 0.0%
Motor Vehicle Metal Stamping 0.1 0.1 0.1 0.1 0.1 0.1 0.1 0.1 0.1 0.1 0.1 0.1 -11.1%
Other Motor Vehicle Parts Manufacturing 0.1 0.1 0.2 0.3 0.2 0.2 0.2 0.1 0.1 0.2 0.1 0.1 -33.3%
Furniture and Related Products Industries 0.2 0.2 0.4 0.4 0.4 0.4 0.4 0.2 0.2 0.2 0.2 0.2 10.0%
Miscellaneous Manufacturing 0.2 0.1 0.2 0.2 0.2 0.2 0.2 0.1 0.1 0.2 0.2 0.2 40.0%
Other Manufacturing n.e.c. 10.3 10.1 6.5 6.6 7.1 7.3 7.9 6.6 7.6 7.0 4.6 5.0 -51.5%
Construction 4.3 3.2 3.4 3.8 4.1 4.4 4.7 4.8 4.9 5.0 4.4 4.8 12.3%
Forestry 0.6 0.6 1.5 1.5 1.7 2.1 2.1 2.3 2.2 2.3 1.9 2.2 283.9%
GHG Intensity (tonnes/TJ)a,b,c 37.4 35.8 35.3 35.2 35.7 35.6 34.9 35.4 37.7 38.3 39.0 40.1 7.3%
continued from previous table
1) Includes only end-use energy-related GHG emissions.
Sources:a) Statistics Canada, Report on Energy Supply and Demand in Canada, 1990–2010, Ottawa, 2012.b) Environment Canada, National Inventory Report 1990–2010: Greenhouse Gas Sources and Sinks in Canada,
Ottawa, 2012.c) Canadian Industrial Energy End-Use Data and Analysis Centre, Development of Energy Intensity Indicators
for Canadian Industry 1990 to 2010, Simon Fraser University, 2012.

www.nrcan.gc.ca/eneene/index-eng.phpEnergy Use Data Handbook, 1990 to 2010 — February 201394 95
4 Industrial Sector 4Industrial Sector
Industrial Gross Domestic Product by Industry
1990 1995 2001 2002 2003 2004 2005 2006 2007 2008 2009 2010 Total Growth 1990–2010
Total Gross Domestic Product (million $2002)a 221,187 238,267 295,031 301,125 305,084 315,536 322,461 323,645 320,753 307,940 274,651 294,073 33.0%
Gross Domestic Product by Industry (million $2002)a
Copper, Nickel, Lead and Zinc Mines 2,373 2,061 2,167 1,981 1,848 2,004 2,043 2,152 2,176 2,302 1,639 1,734 -26.9%
Iron Mines 778 668 498 497 630 530 561 596 548 538 460 559 -28.1%
Gold and Silver Mines 1,344 1,137 1,249 1,139 1,103 935 887 703 633 626 653 660 -50.9%
Other Metal Mines 276 208 343 496 462 397 352 321 268 256 283 273 -1.1%
Salt Mines 186 218 252 230 261 250 245 266 227 295 295 227 22.0%
Potash Mines 862 1,054 1,110 1,160 1,330 1,480 1,464 1,157 1,515 1,318 548 1,192 38.3%
Other Non-Metal Mines 201 229 649 839 1,321 1,392 1,290 1,306 1,714 1,507 1,201 1,261 527.4%
Upstream Mining 32,840 43,365 44,967 44,787 46,000 47,589 48,751 51,127 52,194 50,845 47,871 50,633 54.2%
Fruit and Vegetable Industries 1,204 1,544 2,334 2,380 2,270 2,122 2,044 2,041 2,110 2,103 2,166 2,058 70.9%
Dairy Products Industry 2,594 2,340 2,427 2,182 2,188 2,227 2,334 2,410 2,472 2,635 2,631 2,618 0.9%
Meat Products Industries 2,854 2,653 3,768 3,575 3,537 3,712 4,261 4,362 4,318 4,408 4,541 4,774 67.3%
Bakery Products Industries 1,725 2,108 2,417 2,400 2,207 2,383 2,414 2,553 2,541 2,777 2,925 2,822 63.6%
Beverage Industries (excluding Breweries) 1,110 1,098 1,691 1,877 1,911 2,049 2,029 2,171 2,253 2,189 2,064 2,123 91.3%
Breweries Industries 2,176 2,436 2,272 2,144 2,113 2,338 2,488 2,529 2,347 2,224 2,201 2,001 -8.0%
Tobacco Products Industries 2,383 2,454 1,893 1,857 1,619 1,320 1,197 1,013 634 467 510 586 -75.4%
Textile Mills 1,527 1,546 1,604 1,692 1,406 1,398 1,201 1,025 855 750 673 717 -53.0%
Textile Products Mills 845 813 1,151 1,108 1,100 1,117 1,044 947 871 721 546 591 -30.1%
Clothing Industries 3,283 3,216 3,840 3,563 3,454 2,919 2,560 2,370 1,952 1,568 1,304 1,412 -57.0%
Leather and Allied Products Industries 644 497 414 400 318 246 201 180 193 166 153 165 -74.4%
Wood Products Industries 4,867 5,105 6,017 6,673 6,555 6,757 7,497 7,292 6,362 5,643 4,742 5,470 12.4%
Pulp Mills 1,202 1,393 1,750 1,798 1,705 1,852 1,810 1,676 1,744 1,544 1,305 1,426 18.6%
Paper Mills (except Newsprint) 1,846 1,869 1,878 2,014 2,577 2,752 2,777 2,285 2,467 2,292 1,997 1,834 -0.7%
Newsprint Mills 2,925 3,077 3,098 3,376 2,893 2,804 3,038 2,748 2,703 2,282 1,762 1,871 -36.0%
Paperboard Mills 995 1,000 1,004 926 862 840 819 784 760 787 643 675 -32.2%
Other Pulp and Paper Manufacturing 2,512 3,180 3,518 3,350 3,568 3,543 3,578 3,322 3,208 3,010 2,880 2,874 14.4%
Converted Paper Products Industry 2,520 3,130 3,551 3,751 3,853 3,765 3,665 3,341 3,174 3,018 2,975 2,962 17.5%
Printing and Related Support Activities 6,866 5,073 6,670 6,232 6,064 6,188 6,344 6,170 6,017 5,895 5,196 4,953 -27.9%
Petroleum Refining 2,611 2,724 2,713 2,770 2,876 2,818 2,729 2,599 2,677 2,563 2,467 2,538 -2.8%
Petrochemical Industry 1,103 1,151 1,185 1,070 917 889 822 964 985 908 631 805 -27.0%
Industrial Gas Industry 229 244 291 295 311 296 339 387 343 322 299 323 41.0%
Alkali and Chlorine Manufacturing 477 422 458 415 425 378 390 430 303 259 218 91 -80.9%
Source:a) Informetrica Limited, The Informetrica Model and Database, Ottawa, 2012.
table continued on next page

www.nrcan.gc.ca/eneene/index-eng.phpEnergy Use Data Handbook, 1990 to 2010 — February 201396 97
4 Industrial Sector 4Industrial Sector
1990 1995 2001 2002 2003 2004 2005 2006 2007 2008 2009 2010 Total Growth 1990–2010
Gross Domestic Product by Industry (million $2002)a (continued)
All Other Basic Inorganic Chemical Manufacturing 450 436 629 690 789 697 858 976 964 856 737 788 75.1%
Chemical fertilizer (except Potash) Manufacturing 608 702 813 673 964 1,067 1,116 1,131 1,013 854 724 717 17.9%
Other Chemical Manufacturing 1,325 1,229 1,013 1,184 1,120 1,250 1,379 1,189 1,344 1,478 1,346 1,467 10.7%
Resin and Synthetic Rubber Industries 1,116 1,803 2,345 2,716 2,605 3,258 3,297 3,086 3,359 3,023 2,178 2,350 110.6%
Motor Vehicle Plastic Parts Manufacturing 514 790 1,465 1,507 1,623 1,512 1,834 1,755 1,601 1,345 1,058 1,414 175.1%
Rubber Products Industries 1,147 1,823 2,058 2,149 2,115 2,163 2,055 1,810 1,671 1,565 1,244 1,502 31.0%
Cement Industry 767 612 809 794 808 906 1,048 1,062 1,030 911 739 792 3.3%
Iron and Steel 3,479 4,024 3,909 4,162 4,145 4,182 4,062 4,030 3,708 3,861 2,279 3,208 -7.8%
Primary Production of Alumina and Aluminum 1,146 1,522 2,700 2,808 2,733 3,111 3,363 3,525 3,540 3,532 3,217 3,271 185.4%
Other Non-Ferrous Smelting and Refining 1,085 1,179 2,006 1,832 1,720 1,863 1,904 1,748 1,593 1,584 1,320 1,457 34.3%
Fabricated Metal Products Industries 7,840 8,189 13,729 14,062 13,708 13,458 13,778 14,055 14,078 12,841 10,653 11,455 46.1%
Machinery Industries 7,058 9,790 12,404 12,158 11,790 12,707 12,960 13,195 13,213 12,962 10,904 12,046 70.7%
Computer and Electronic Products Industries 3,083 4,824 6,510 5,820 6,242 6,636 6,880 6,987 6,879 6,891 6,224 6,531 111.8%
Electrical Equipment and Components Industries 3,482 2,946 4,539 3,859 3,051 3,306 3,348 3,153 3,133 3,235 2,834 2,964 -14.9%
Motor Vehicle Industry 8,093 11,566 13,570 14,021 13,754 13,872 14,470 13,742 13,577 10,277 7,085 9,886 22.2%
Motor Vehicle Gasoline Engine and Engine Parts Manufacturing
1,020 1,526 1,962 2,104 2,208 2,256 2,147 2,053 2,125 1,583 1,327 1,460 43.1%
Motor Vehicle Electrical and Electronic Equipment Manufacturing
235 352 445 334 427 429 432 440 398 298 203 256 8.9%
Motor Vehicle Steering and Suspension Components (except Spring) Manufacturing
288 431 511 606 539 515 535 523 527 428 329 487 69.1%
Motor Vehicle Brake System Manufacturing 385 577 597 549 594 655 570 500 431 350 249 275 -28.6%
Motor Vehicle Transmission and Power Train Parts Manufacturing
645 964 926 987 973 988 1,042 1,037 1,021 726 425 503 -22.0%
Motor Vehicle Seating and Interior Trim Manufacturing
489 732 756 1,169 1,137 1,257 1,432 1,376 1,182 955 743 948 93.9%
Motor Vehicle Metal Stamping 686 1,027 1,348 1,288 1,458 1,645 1,759 1,516 1,411 1,111 809 951 38.6%
Other Motor Vehicle Parts Manufacturing 831 1,243 2,375 2,287 2,317 2,281 2,217 2,224 1,989 1,639 1,198 1,308 57.4%
Furniture and Related Products Industries 3,073 3,282 6,189 6,097 5,577 5,748 5,322 4,953 4,664 4,306 3,599 3,739 21.7%
Miscellaneous Manufacturing 2,095 2,232 3,484 3,856 3,910 3,967 3,818 3,945 3,786 3,655 3,364 3,389 61.8%
Other Manufacturing n.e.c. 25,610 27,878 39,638 44,342 46,059 46,758 46,145 46,075 43,299 40,798 38,439 38,944 52.1%
Construction 50,645 41,300 55,367 57,776 59,709 63,134 66,158 68,687 71,539 73,958 67,309 72,576 43.3%
Forestry 5,058 5,121 5,619 5,893 5,764 6,168 6,226 5,936 5,383 4,908 4,018 4,781 -5.5%
Industrial Gross Domestic Product by Industry (continued) continued from previous table
Source:a) Informetrica Limited, The Informetrica Model and Database, Ottawa, 2012.

www.nrcan.gc.ca/eneene/index-eng.phpEnergy Use Data Handbook, 1990 to 2010 — February 201398 99
4 Industrial Sector 4Industrial Sector
Industrial Energy Intensity by Industry
Units 1990 1995 2001 2002 2003 2004 2005 2006 2007 2008 2009 2010Total Growth 1990–2010
Aggregate Energy Intensitya,b,c MJ/$2002 – GDP 12.3 12.4 10.0 10.3 10.5 10.7 10.4 10.2 10.7 10.7 11.4 11.0 -10.4%
Energy Intensity by Industrya,b,c
Copper, Nickel, Lead and Zinc Mines MJ/tonne 251.1 225.2 259.6 253.4 254.5 248.3 240.5 245.5 275.2 293.2 277.0 287.3 14.4%
Iron Mines MJ/tonne 436.7 400.3 398.1 407.7 411.4 410.2 372.9 338.5 341.7 434.2 527.0 448.9 2.8%
Gold and Silver Mines MJ/tonne 557.1 502.0 332.0 346.0 328.2 325.4 320.5 307.4 325.0 341.2 337.4 305.3 -45.2%
Other Metal Mines MJ/tonne 409.5 380.4 596.5 619.7 375.5 328.1 339.3 342.9 341.9 420.8 454.7 420.6 2.7%
Salt Mines MJ/tonne 376.1 436.9 229.2 234.5 217.7 215.9 228.4 221.6 245.6 205.2 212.0 257.2 -31.6%
Potash Mines MJ/tonne 3,923.7 3,507.6 3,480.6 3,319.6 3,290.8 3,138.5 2,699.3 4,063.4 3,264.9 3,164.9 4,060.8 2,425.6 -38.2%
Other Non-Metal Mines MJ/$2002 – GDP 8.3 5.6 5.9 5.5 6.5 5.9 5.9 6.6 4.6 6.0 6.6 7.4 -10.0%
Upstream Mining MJ/$2002 – GDP 6.4 7.4 9.0 9.4 11.2 10.6 11.3 11.6 13.8 13.9 16.4 17.2 167.1%
Fruit and Vegetable Industries MJ/$2002 – GO 1.8 1.7 1.9 1.8 1.8 1.7 2.0 2.0 1.9 1.6 2.0 2.3 27.2%
Dairy Products Industry MJ/kilolitre 1,592.0 1,453.8 1,567.9 1,589.4 1,509.9 1,488.3 1,405.3 1,357.0 1,232.0 1,200.0 1,292.6 1,321.7 -17.0%
Meat Products Industries MJ/tonne 4,628.9 4,318.3 4,457.2 3,924.0 3,895.1 3,916.7 4,074.5 4,336.9 4,133.9 4,624.8 5,826.0 5,275.6 14.0%
Bakery Products Industries MJ/$2002 – GO 1.9 1.2 1.4 1.6 1.5 1.4 1.5 1.5 1.5 1.4 1.6 1.3 -27.6%
Beverage Industries (excluding Breweries) MJ/$2002 – GO 0.8 1.2 1.1 1.1 1.1 1.2 1.2 1.2 1.2 1.0 1.2 1.6 89.0%
Breweries Industries MJ/$2002 – GDP 1.7 1.4 1.3 1.4 1.3 1.2 1.1 0.9 0.9 0.8 0.7 0.7 -58.1%
Tobacco Products Industries MJ/$2002 – GO 0.3 0.3 0.3 0.3 0.3 0.2 0.3 0.2 0.2 0.1 0.1 0.1 -56.3%
Textile Mills MJ/$2002 – GO 5.4 5.5 2.0 1.9 1.9 2.1 2.1 2.0 1.9 1.6 1.1 1.3 -76.3%
Textile Products Mills MJ/$2002 – GO 3.4 3.5 1.4 1.4 1.2 1.1 1.1 1.0 0.9 0.8 0.7 0.9 -74.1%
Clothing Industries MJ/$2002 – GO 0.8 0.8 0.6 0.6 0.6 0.6 0.3 0.2 0.2 0.3 0.2 0.2 -78.6%
Leather and Allied Products Industries MJ/$2002 – GO 1.6 1.3 1.1 0.9 0.8 0.8 0.6 0.4 0.5 0.6 0.5 0.6 -65.2%
Wood Products Industries MJ/$2002 – GO 3.0 2.7 2.7 2.9 2.4 2.4 2.5 2.6 3.0 3.6 3.9 3.6 19.5%
Pulp Mills MJ/tonne 41,799.0 35,741.8 35,097.5 34,272.5 35,226.7 35,194.8 32,141.2 30,934.4 28,945.1 26,738.9 30,259.9 25,739.2 -38.4%
Paper Mills (except Newsprint) MJ/$2002 – GO 21.1 20.5 17.3 16.7 19.9 20.3 20.9 14.8 14.4 13.5 15.8 15.3 -27.3%
Newsprint Mills MJ/tonne 27,088.3 28,756.8 28,378.5 29,082.4 29,537.2 28,847.6 27,523.6 27,017.0 27,496.3 26,213.6 26,918.4 25,728.9 -5.0%
Paperboard Mills MJ/tonne 21,942.1 18,786.9 17,115.0 16,761.7 17,638.3 17,716.7 17,494.3 15,218.3 13,682.0 14,365.4 14,780.8 11,183.8 -49.0%
Other Pulp and Paper Manufacturing MJ/$2002 – GDP 8.8 5.5 11.3 15.1 4.3 29.7 31.5 37.8 43.3 40.3 43.0 34.7 293.5%
Converted Paper Products Industry MJ/$2002 – GO 1.5 1.3 1.6 1.6 1.6 1.7 1.9 1.6 1.8 1.5 2.3 2.5 71.0%
Printing and Related Support Activities MJ/$2002 – GO 1.3 0.9 0.7 0.7 0.7 0.7 0.7 0.6 0.6 0.7 0.8 0.7 -41.7%
Sources:a) Statistics Canada, Report on Energy Supply and Demand in Canada, 1990–2010, Ottawa, 2012.b) Informetrica Limited, The Informetrica Model and Database, Ottawa, 2012. c) Canadian Industrial Energy End-Use Data and Analysis Centre, Development of Energy Intensity Indicators
for Canadian Industry 1990 to 2010, Simon Fraser University, 2012.
table continued on next page

www.nrcan.gc.ca/eneene/index-eng.phpEnergy Use Data Handbook, 1990 to 2010 — February 2013100 101
4 Industrial Sector 4Industrial Sector
Sources:a) Statistics Canada, Report on Energy Supply and Demand in Canada, 1990–2010, Ottawa, 2012.b) Informetrica Limited, The Informetrica Model and Database, Ottawa, 2012. c) Canadian Industrial Energy End-Use Data and Analysis Centre, Development of Energy Intensity Indicators
for Canadian Industry 1990 to 2010, Simon Fraser University, 2012.
Industrial Energy Intensity by Industry (continued)
Units 1990 1995 2001 2002 2003 2004 2005 2006 2007 2008 2009 2010Total Growth 1990–2010
Energy Intensity by Industrya,b,c (continued)
Petroleum Refining MJ/$2002 – GO 13.4 12.2 9.7 10.8 10.3 11.8 10.8 9.9 9.9 9.8 9.0 8.8 -34.7%
Petrochemical Industry MJ/tonne 4,597.7 4,042.4 4,725.3 4,623.4 5,265.9 5,434.9 6,931.0 40,958.5 6,014.9 12,552.0 10,767.6 10,894.9 137.0%
Industrial Gas Industry MJ/$2002 – GO 11.2 10.2 12.1 12.2 12.7 14.7 11.1 18.6 18.0 14.7 20.6 19.8 77.5%
Alkali and Chlorine Manufacturing MJ/$2002 – GO 20.0 22.4 15.5 12.2 12.5 13.9 13.9 11.4 10.8 10.5 11.1 11.4 -43.3%
All Other Basic Inorganic Chemical Manufacturing MJ/$2002 – GO 20.0 22.3 15.7 12.5 13.5 15.4 14.7 11.9 11.3 11.0 11.0 11.5 -42.5%
Chemical Fertilizer (except Potash) Manufacturing MJ/$2002 – GO 1.4 2.3 2.4 1.8 2.0 2.0 1.7 1.9 1.4 1.4 1.2 0.7 -51.1%
Other Chemical Manufacturing MJ/$2002 – GDP 71.1 77.1 55.9 61.9 39.3 51.2 42.7 59.4 58.6 58.2 64.3 69.7 -2.1%
Resin and Synthetic Rubber Industries MJ/tonne 27,008.4 13,205.3 11,014.1 9,207.1 8,463.2 7,250.2 6,744.8 8,576.1 8,332.3 10,446.5 9,719.1 8,985.8 -66.7%
Motor Vehicle Plastic Parts Manufacturing MJ/$2002 – GO 1.4 1.1 1.5 1.1 1.1 1.5 1.2 1.2 1.2 1.5 1.3 1.3 -6.5%
Rubber Products Industries MJ/tonne 2.5 2.2 1.8 1.7 1.9 1.6 1.6 1.5 1.6 1.6 1.8 1.6 -34.3%
Cement Industry MJ/tonne 5,645.5 5,261.0 5,173.4 5,317.6 5,034.6 5,268.8 5,395.4 5,544.6 4,688.5 5,035.2 5,752.1 5,001.0 -11.4%
Iron and Steel MJ/$2002 – GO 26.1 26.5 18.8 19.6 19.7 21.7 19.1 21.1 20.9 23.0 19.7 21.8 -16.6%
Primary Production of Alumina and Aluminum
MJ/tonne 70,041.4 63,638.5 61,919.5 61,336.9 63,995.0 65,521.5 64,672.5 61,764.2 62,344.3 62,582.4 57,072.4 60,946.7 -13.0%
Other Non-Ferrous Smelting and Refining
MJ/tonne 47,911.3 44,352.2 49,657.9 44,972.4 44,717.8 44,187.2 44,219.1 41,512.9 38,037.1 39,944.1 38,730.0 36,654.0 -23.5%
Fabricated Metal Products Industries MJ/$2002 – GO 1.6 1.5 1.2 1.2 1.2 1.2 1.2 1.1 1.2 1.4 1.3 1.2 -28.0%
Machinery Industries MJ/$2002 – GO 0.6 0.7 0.5 0.5 0.5 0.6 0.6 0.6 0.6 0.6 0.7 0.8 19.0%
Computer and Electronic Products Industries
MJ/$2002 – GO 0.4 0.5 0.2 0.2 0.2 0.2 0.2 0.2 0.2 0.2 0.2 0.3 -31.7%
Electrical Equipment and Components Industries
MJ/$2002 – GO 1.2 1.1 0.6 0.6 0.7 0.7 0.7 0.7 0.8 0.8 0.6 0.8 -32.5%
Motor Vehicle Industry MJ/$2002 – GDP 2.3 2.1 1.7 1.7 1.8 1.6 1.6 1.5 1.5 1.8 2.1 1.5 -33.3%
Motor Vehicle Gasoline Engine and Engine Parts Manufacturing
MJ/$2002 – GDP 3.1 1.9 1.4 1.4 1.4 1.4 1.6 1.5 1.5 1.6 1.6 1.2 -60.9%
Motor Vehicle Electrical and Electronic Equipment Manufacturing
MJ/$2002 – GDP 1.1 0.7 1.1 2.0 1.4 1.3 1.4 0.6 1.1 1.2 1.5 1.7 52.8%
continued from previous table
table continued on next page
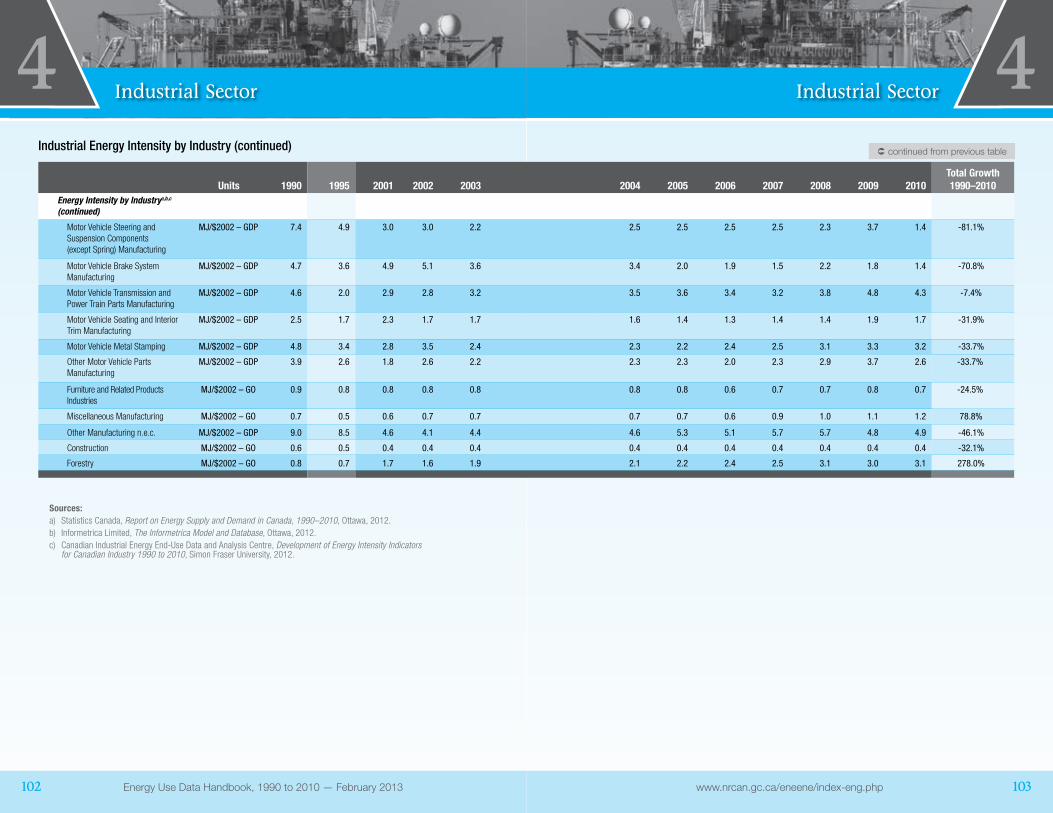
www.nrcan.gc.ca/eneene/index-eng.phpEnergy Use Data Handbook, 1990 to 2010 — February 2013102 103
4 Industrial Sector 4Industrial Sector
Industrial Energy Intensity by Industry (continued)
Units 1990 1995 2001 2002 2003 2004 2005 2006 2007 2008 2009 2010Total Growth 1990–2010
Energy Intensity by Industrya,b,c (continued)
Motor Vehicle Steering and Suspension Components (except Spring) Manufacturing
MJ/$2002 – GDP 7.4 4.9 3.0 3.0 2.2 2.5 2.5 2.5 2.5 2.3 3.7 1.4 -81.1%
Motor Vehicle Brake System Manufacturing
MJ/$2002 – GDP 4.7 3.6 4.9 5.1 3.6 3.4 2.0 1.9 1.5 2.2 1.8 1.4 -70.8%
Motor Vehicle Transmission and Power Train Parts Manufacturing
MJ/$2002 – GDP 4.6 2.0 2.9 2.8 3.2 3.5 3.6 3.4 3.2 3.8 4.8 4.3 -7.4%
Motor Vehicle Seating and Interior Trim Manufacturing
MJ/$2002 – GDP 2.5 1.7 2.3 1.7 1.7 1.6 1.4 1.3 1.4 1.4 1.9 1.7 -31.9%
Motor Vehicle Metal Stamping MJ/$2002 – GDP 4.8 3.4 2.8 3.5 2.4 2.3 2.2 2.4 2.5 3.1 3.3 3.2 -33.7%
Other Motor Vehicle Parts Manufacturing
MJ/$2002 – GDP 3.9 2.6 1.8 2.6 2.2 2.3 2.3 2.0 2.3 2.9 3.7 2.6 -33.7%
Furniture and Related Products Industries
MJ/$2002 – GO 0.9 0.8 0.8 0.8 0.8 0.8 0.8 0.6 0.7 0.7 0.8 0.7 -24.5%
Miscellaneous Manufacturing MJ/$2002 – GO 0.7 0.5 0.6 0.7 0.7 0.7 0.7 0.6 0.9 1.0 1.1 1.2 78.8%
Other Manufacturing n.e.c. MJ/$2002 – GDP 9.0 8.5 4.6 4.1 4.4 4.6 5.3 5.1 5.7 5.7 4.8 4.9 -46.1%
Construction MJ/$2002 – GO 0.6 0.5 0.4 0.4 0.4 0.4 0.4 0.4 0.4 0.4 0.4 0.4 -32.1%
Forestry MJ/$2002 – GO 0.8 0.7 1.7 1.6 1.9 2.1 2.2 2.4 2.5 3.1 3.0 3.1 278.0%
continued from previous table
Sources:a) Statistics Canada, Report on Energy Supply and Demand in Canada, 1990–2010, Ottawa, 2012.b) Informetrica Limited, The Informetrica Model and Database, Ottawa, 2012. c) Canadian Industrial Energy End-Use Data and Analysis Centre, Development of Energy Intensity Indicators
for Canadian Industry 1990 to 2010, Simon Fraser University, 2012.

www.nrcan.gc.ca/eneene/index-eng.phpEnergy Use Data Handbook, 1990 to 2010 — February 2013104 105
4 Industrial Sector 4Industrial Sector
Industrial Energy Prices and Background Indicators
1990 1995 2001 2002 2003 2004 2005 2006 2007 2008 2009 2010 Total Growth 1990–2010
Energy Prices by Energy Source (incl. taxes)
Natural Gas (cents/m3)a,e 10.5 10.6 23.9 26.2 32.6 33.7 36.9 36.5 26.3 33.9 26.0 22.3 112.4%
Light Fuel Oil (cents/litre)f 25.8 22.1 35.6 34.7 38.7 46.5 61.9 64.2 68.6 94.3 60.9 70.5 173.6%
Heavy Fuel Oil (cents/litre)f 14.1 16.2 26.9 29.6 31.1 30.7 38.2 39.2 44.3 57.6 46.1 54.7 289.2%
Electricity (1,000 kW/400,000 kWh)1 (cents/kWh)b,e
5.6 7.0 7.6 7.4 7.9 7.7 8.1 8.2 8.4 8.9 8.4 9.0 59.8%
Electricity (5,000 kW/3,060,000 kWh)1 (cents/kWh)b,e
4.0 4.9 6.0 5.7 6.1 5.9 6.2 6.3 6.5 6.9 6.5 7.0 75.7%
Background Indicators
Industrial GDP (million $2002)d 221,187 238,267 295,031 301,125 305,084 315,536 322,461 323,645 320,753 307,940 274,651 294,073 33.0%
Industrial GO (million $2002)d 572,565 622,946 793,554 817,837 817,114 839,156 868,690 883,357 874,312 825,585 768,691 804,756 40.6%
Capacity Utilization Rate (%)c
Mining 87.5 85.5 87.7 88.5 88.9 87.6 84.7 82.9 80.8 77.0 70.6 76.8 –
Manufacturing 78.2 83.9 81.7 82.9 81.5 83.5 83.7 82.7 82.8 75.6 70.9 76.2 –
Pulp and Paper 83.7 92.0 88.6 90.6 91.1 91.1 89.4 88.3 87.4 87.9 82.4 86.4 –
Primary Metals2 85.1 88.3 86.2 87.8 88.4 91.8 91.5 91.9 92.1 89.0 76.4 81.6 –
Petroleum Refining 87.5 89.5 94.9 96.5 95.4 93.9 88.3 83.2 82.5 75.0 78.1 78.7 –
Chemicals 86.6 85.2 80.4 80.8 80.9 81.5 80.2 79.8 82.0 75.0 69.9 74.5 –
Forestry 82.2 81.3 81.6 83.9 85.5 89.8 84.3 83.7 83.4 85.9 75.3 89.6 –
Construction 91.1 75.8 90.5 89.8 88.0 86.1 83.5 81.7 80.3 79.0 70.0 74.0 –
Industrial Employees (thousands)d
Mining 192 173 179 170 178 188 211 241 255 265 248 254 32.3%
Manufacturing 2,050 1,904 2,229 2,286 2,275 2,292 2,209 2,107 2,031 1,962 1,782 1,744 -14.9%
Pulp and Paper 140 121 109 106 108 104 102 94 87 91 74 74 -47.5%
Primary Metals2 135 110 99 101 97 92 91 90 79 78 67 66 -51.0%
Petroleum Refining 25 18 17 17 16 17 18 17 19 19 19 18 -28.1%
Chemicals 106 99 119 125 121 118 116 103 108 109 104 107 1.2%
Forestry 73 93 74 74 77 72 70 63 61 55 47 51 -29.8%
Construction 816 726 824 865 906 953 1,015 1,066 1,131 1,231 1,161 1,217 49.2%
1) kW refers to power hook-up, whereas kWh refers to monthly electricity consumption.2) “Primary Metals” includes iron and steel, smelting and refining, and other primary metal activity.
Sources:a) Statistics Canada, Energy Statistics Handbook, Ottawa, 2011 (Cat. No. 57-601-X).b) Hydro-Québec, Comparison of Electricity Prices in Major North American Cities, 2010.c) Informetrica Limited, The Informetrica Model and Database, Ottawa, 2012. d) Statistics Canada, Report on Energy Supply and Demand in Canada, 1990–2010, Ottawa, 2012.e) Natural Resources Canada, Oil and Gas Policy and Regulatory Affairs Division, Ottawa, 2011.

5Transportation Sector
www.nrcan.gc.ca/eneene/index-eng.php 107
The Data SituationThe aggregate data on transportation energy use by energy source are from StatisticsCanada’sReport on Energy Supply and Demand in Canada(RESD)(Cat. No. 57-003-X). Other sources that have more specific data enable the Office of Energy Efficiency to allocate energy use by transportation mode as outlined below.
Usingstock,fuelefficienciesandaveragedistancestravelled,theTransportationEnd-UseModel(TEUM)calculatespreliminaryestimatesforroadenergyuseby vehicle type. These preliminary estimates are then calibrated to match the RESDroadinformationtoobtainfinalroadenergyuseestimates.
Aggregatenon-roadenergyusedata(rail,airandmarine)areobtaineddirectlyfrom the RESD. Rail and air are further disaggregated into passenger andfreight transportationbasedondata from the following StatisticsCanada’sreports: Rail in Canada (Cat. No. 52-216-X), Canadian Civil Aviation (Cat. No. 51-206-X) and Service Bulletin: Aviation(Cat.No.51-004-X),aswellasCANSIMupdates.TheClimate Change Air Sub-Group Report by Sypher:MuellerInternationalInc.,July1999,isalsousedintheallocationof air energy use to passenger and freight modes.
DataforvehiclestockintheTEUMwereobtainedmainlyfromR.L.Polk&Co.andDesRosiersAutomotiveConsultantsInc.Specifically,thedatawere extracted from two databases: Canadian Vehicles in Operation Census (CVIOC)andTrucking Industry Profile(TIP).StatisticsCanada’sRoad Motor Vehicles, Registrations (Cat. No. 53-219-X), its Canadian Vehicle Survey(CVS)(Cat.No.53-223-X)andtheU.S.DepartmentofEnergy’sTransportation Energy Data Book, Edition 25 are used to develop historical car and truck stockdataforyearsinwhichdatafromtheCVIOCand/ortheTIPwerenotavailable. The bus stock information is further disaggregated by bus industry basedonthefollowingStatisticsCanadareports:Passenger Bus and Urban Transit Statistics(PBS)(Cat.No.53-215-X),Service Bulletin: Surface and Marine Transport(Cat.No.50-002-X)andCANSIMupdates.

5Transportation Sector
www.nrcan.gc.ca/eneene/index-eng.php 109
Car and truck sales are derived from new vehicle registrations from R. L. Polk andfromStatisticsCanada’sNew Motor Vehicle Sales (Cat. No. 63-007-X).
Laboratory-tested fuel efficiencies for new cars and light trucks are obtained fromTransportCanada’sVehicleFuelEconomyInformationSystem(VFEIS).InformationfromtheVFEISisthenusedinconjunctionwithprovincialsalesdataobtainedfromDesRosiersAutomotiveConsultantsInc.toattainaverageprovincial values for each model year. Medium and heavy truck fuel consumption for the years before 1998 are based on the Heavy-Duty Truck Fuel Economy and Annual Mileage in Canada report (Energy and Environmental Analysis, Inc., March 2001) produced for NaturalResourcesCanada (NRCan).Data formore recent years are obtainedfromtheCVSwhilehistoricaldataaredevelopedtomatchthepreviousdata source. On-road fuel efficiency for buses is based on data from the PBS.
The National Private Vehicle Use Survey – October 1994 to September 1996 andtheCVS,conductedbyStatisticsCanadaonbehalfofNRCanandTransportCanada, provide average distances travelled for cars and trucks. The medium and heavytruckaveragedistancetravelledfrom2000onwardfollowstheCVSdata,while previous years are based on trends from Trucking in Canada (Cat. No.53-222-X)forheavytrucksandtheTEUM(2004)formediumtrucks.MotorcycleestimatesarebasedoninformationfromtheU.S.DepartmentofTransportationandtheTEUMassumptions.
Occupancy rates are essential for calculating the passenger-kilometres travelled for cars and light trucks. Since 1999, occupancy rates havebeenobtainedfromtheCVSdata.ObservedtrendsinTransportCanada’sseatbelt survey (1992–2002), total population and vehicle stock were used to develop historical data from 1976 to 1998. Motorcycle occupancyratesarebasedonU.S.DepartmentofTransportationdata.Finally,busoccupancyratesaretakenfromtheCVSandthePBS.Inthenon-road portion, passenger-kilometres are taken directly from Rail in Canada for rail and from the Canadian Civil Aviation report for air.

5Transportation Sector
www.nrcan.gc.ca/eneene/index-eng.php 111
Light-truckandmedium-trucktonne-kilometresarecalculatedusingaTEUMassumption on load factor, while heavy-truck tonne-kilometres are from the Trucking in Canada: Trucking Commodity Origin and Destination Survey. Non-road tonne-kilometres are taken from the Canadian Civil Aviation, Rail in CanadaandTransportCanada’sSurfaceandMarineStatisticsDivisionforair, rail and marine, respectively.
Transportation energy prices are weighted averages of regional prices from StatisticsCanada’sEnergy Statistics Handbook (Cat. No. 57-601-X). Other transportationindicatorsarefromInformetricaLimited’sThe Informetrica Model and Database.
Inthe2010editionofthishandbook,theSurveyofSecondaryDistributorsofRefinedPetroleumProducts(SSDRPP)wasintegratedinthelatestRESDfrom 2000 onward for major oil uses, which caused noticeable changes compared to the previous publication, including increased heavy fuel oil consumption for marine transportation, decreased diesel use for heavy truck transportation and fluctuations in diesel use for railway transportation.
Due to rounding, the numbers in the tables may not add upor calculate to their reported totals or growth rates.

www.nrcan.gc.ca/eneene/index-eng.phpEnergy Use Data Handbook, 1990 to 2010 — February 2013112 113
5 Transportation Sector 5Transportation Sector
Transportation Secondary Energy Use by Energy Source and Transportation Mode
1990 1995 2001 2002 2003 2004 2005 2006 2007 2008 2009 2010 Total Growth 1990–2010
Total Energy Use (PJ)a 1,877.9 2,009.8 2,255.1 2,282.2 2,358.6 2,446.2 2,486.3 2,456.9 2,554.5 2,541.9 2,506.6 2,595.0 38.2%
Passenger Transportationb 1,179.0 1,190.4 1,274.0 1,308.8 1,314.8 1,352.4 1,363.9 1,351.6 1,399.9 1,375.6 1,376.6 1,390.3 17.9%
Freight Transportationb 645.6 757.2 890.8 880.6 949.2 996.9 1,023.3 1,005.0 1,052.8 1,064.0 1,038.0 1,100.7 70.5%
Off-Road1,b 53.3 62.1 90.3 92.8 94.5 96.8 99.1 100.4 101.8 102.3 91.9 104.1 95.1%
Energy Use by Energy Source (PJ)a
Electricity 3.1 3.0 3.1 3.4 3.4 3.5 3.5 3.5 2.5 2.3 2.4 2.5 -18.7%
Natural Gas 1.7 2.4 2.0 1.7 1.7 1.8 1.9 1.9 1.9 1.9 1.9 1.9 14.0%
Motor Gasoline 1,120.4 1,178.5 1,296.3 1,332.4 1,352.4 1,381.9 1,368.6 1,369.7 1,393.2 1,375.1 1,394.6 1,406.9 25.6%
Diesel Fuel Oil 469.8 548.5 647.5 646.5 686.9 716.1 745.2 740.4 772.3 789.3 751.4 812.4 72.9%
Ethanol 0.0 0.0 0.0 0.0 0.0 0.0 6.5 6.6 30.8 33.0 36.8 45.2 –
Biodiesel Fuel n.a. n.a. n.a. n.a. n.a. n.a. n.a. n.a. n.a. n.a. n.a. n.a. –
Light Fuel Oil and Kerosene 0.0 0.0 0.0 0.0 0.0 0.0 0.0 0.0 0.0 0.0 0.0 0.0 –
Heavy Fuel Oil 60.1 56.6 70.3 65.7 84.4 87.5 93.5 68.7 84.4 84.9 86.4 84.0 39.7%
Aviation Gasoline 5.5 4.2 3.5 3.4 3.1 2.9 3.3 3.0 3.1 3.0 2.9 2.6 -53.0%
Aviation Turbo Fuel 181.9 183.9 215.3 216.7 214.8 240.0 253.6 251.7 254.2 239.6 219.1 228.2 25.4%
Propane 35.4 32.8 17.2 12.4 11.9 12.6 10.3 11.3 12.1 12.8 11.2 11.2 -68.4%
Energy Use by Transportation Mode (PJ)b
Cars 721.2 682.0 640.4 652.2 648.5 647.8 636.1 628.8 645.9 631.1 637.1 625.2 -13.3%
Passenger Light Trucks 216.9 271.6 371.8 389.8 400.4 415.5 423.8 422.8 447.0 447.9 465.2 479.5 121.1%
Freight Light Trucks 99.7 120.0 153.0 157.6 160.8 166.3 167.5 169.5 180.1 180.9 187.0 192.6 93.1%
Medium Trucks 134.8 162.0 155.8 145.7 161.4 177.0 154.7 165.3 157.6 153.6 150.8 156.9 16.4%
Heavy Trucks 212.3 287.7 377.7 384.6 424.4 436.0 473.0 464.4 491.9 505.3 515.9 547.3 157.8%
Motorcycles 2.5 2.2 2.7 3.1 3.3 3.6 3.6 3.8 4.1 4.2 5.7 5.8 130.8%
School Buses 15.1 16.8 11.7 11.9 13.2 11.3 11.4 12.3 12.4 13.7 13.0 13.4 -11.4%
Urban Transit 29.0 26.2 26.1 29.2 29.3 30.3 31.2 27.7 30.1 31.4 31.1 33.1 14.4%
Inter-City Buses 9.6 8.5 6.5 7.1 6.3 5.7 6.1 5.9 6.3 6.5 4.7 4.7 -51.0%
Passenger Air 180.9 180.8 211.9 212.8 211.1 235.6 249.1 247.5 251.4 237.7 217.6 225.5 24.7%
Freight Air 6.5 7.3 6.9 7.3 6.8 7.2 7.8 7.2 5.8 4.9 4.4 5.3 -19.1%
Passenger Rail 3.8 2.3 3.0 2.8 2.6 2.5 2.7 2.7 2.8 3.2 2.3 2.9 -21.7%
1) “Off-Road” includes vehicles not registered for on-road travel, such as ATVs, snowmobiles, golf carts and some military vehicles.
2) Excludes non-commercial aviation.
Sources:a) Statistics Canada, Report on Energy Supply and Demand in Canada, 1990–2010, Ottawa, 2012.b) Natural Resources Canada, Transportation End-Use Model, Ottawa, 2012.
table continued on next page

www.nrcan.gc.ca/eneene/index-eng.phpEnergy Use Data Handbook, 1990 to 2010 — February 2013114 115
5 Transportation Sector 5Transportation Sector
Transportation Secondary Energy Use by Energy Source and Transportation Mode (continued)
1990 1995 2001 2002 2003 2004 2005 2006 2007 2008 2009 2010 Total Growth 1990–2010
Energy Use by Transportation Mode (PJ)b (continued)
Freight Rail 85.7 78.6 80.7 73.5 74.4 76.6 81.7 85.6 91.8 97.0 62.5 80.7 -5.8%
Marine 106.5 101.7 116.7 112.0 121.5 133.7 138.6 113.0 125.7 122.2 117.4 117.9 10.6%
Off-Road1 53.3 62.1 90.3 92.8 94.5 96.8 99.1 100.4 101.8 102.3 91.9 104.1 95.1%
Activity
Total Passenger-kilometres2 (millions)b 496,803 548,531 614,963 629,229 632,646 651,530 663,198 676,065 700,103 702,859 713,541 733,766 47.7%
Total Tonne-kilometres (millions)b 543,300 614,639 735,682 766,497 789,023 850,684 889,015 885,746 884,691 855,245 767,453 835,011 53.7%
Passenger Transportation Energy Intensity2 (MJ/Pkm)b
2.29 2.11 2.03 2.04 2.04 2.03 2.01 1.95 1.94 1.90 1.89 1.86 -19.1%
Freight Transportation Energy Intensity (MJ/Tkm)b
1.19 1.23 1.21 1.15 1.20 1.17 1.15 1.13 1.19 1.24 1.35 1.32 10.9%
continued from previous table
1) “Off-Road” includes vehicles not registered for on-road travel, such as ATVs, snowmobiles, golf carts and some military vehicles.
2) Excludes non-commercial aviation.
Sources:a) Statistics Canada, Report on Energy Supply and Demand in Canada, 1990–2010, Ottawa, 2012.b) Natural Resources Canada, Transportation End-Use Model, Ottawa, 2012.

www.nrcan.gc.ca/eneene/index-eng.phpEnergy Use Data Handbook, 1990 to 2010 — February 2013116 117
5 Transportation Sector 5Transportation Sector
Transportation GHG Emissions by Energy Source and Transportation Mode
1990 1995 2001 2002 2003 2004 2005 2006 2007 2008 2009 2010 Total Growth 1990–2010
Total GHG Emissions (Mt of CO2e)a,b,c 131.4 141.7 158.8 160.7 166.0 171.7 174.1 171.4 177.8 176.5 173.3 179.2 36.4%
Passenger Transportationb,c 81.7 83.7 88.9 91.4 91.7 93.9 94.2 92.9 95.8 93.8 93.4 94.1 15.1%
Freight Transportationb,c 46.0 53.8 63.8 63.0 67.9 71.3 73.2 71.7 75.1 75.9 73.6 78.1 69.8%
Off-Roadb,c 3.6 4.2 6.1 6.3 6.4 6.5 6.7 6.8 6.9 6.9 6.2 7.0 92.9%
GHG Emissions by Energy Source (Mt of CO2e)a,b,c
Electricity 0.2 0.2 0.2 0.2 0.2 0.2 0.2 0.2 0.1 0.1 0.1 0.1 -24.0%
Natural Gas 0.1 0.1 0.1 0.1 0.1 0.1 0.1 0.1 0.1 0.1 0.1 0.1 11.8%
Motor Gasoline 77.4 82.8 90.5 93.0 94.4 95.9 94.5 94.1 95.2 93.5 94.5 94.9 22.6%
Diesel Fuel Oil 33.8 39.2 46.8 46.6 49.4 51.6 53.7 53.4 55.7 56.9 53.9 58.4 72.8%
Ethanol 0.0 0.0 0.0 0.0 0.0 0.0 0.4 0.4 2.0 2.2 2.4 2.9 –
Biodiesel Fuel n.a. n.a. n.a. n.a. n.a. n.a. n.a. n.a. n.a. n.a. n.a. n.a. –
Light Fuel Oil and Kerosene 0.0 0.0 0.0 0.0 0.0 0.0 0.0 0.0 0.0 0.0 0.0 0.0 –
Heavy Fuel Oil 4.5 4.3 5.2 4.9 6.3 6.5 6.9 5.1 6.3 6.3 6.4 6.2 37.2%
Aviation Gasoline 0.4 0.3 0.3 0.3 0.2 0.2 0.2 0.2 0.2 0.2 0.2 0.2 -53.0%
Aviation Turbo Fuel 12.8 12.9 14.7 14.8 14.7 16.4 17.3 17.2 17.4 16.4 15.0 15.6 22.0%
Propane 2.1 2.0 1.0 0.7 0.7 0.8 0.6 0.7 0.7 0.8 0.7 0.7 -68.1%
GHG Emissions by Transportation Mode (Mt of CO2e)a,b,c
Cars 49.8 48.0 44.8 45.6 45.3 45.0 43.9 43.2 44.1 42.9 43.1 42.1 -15.4%
Passenger Light Trucks 15.1 19.2 26.2 27.5 28.2 29.1 29.5 29.2 30.7 30.5 31.5 32.3 114.5%
Freight Light Trucks 6.8 8.3 10.7 11.0 11.3 11.6 11.6 11.6 12.3 12.3 12.6 13.0 90.8%
Medium Trucks 9.2 11.0 10.7 10.1 11.1 12.2 10.7 11.4 10.9 10.6 10.4 10.9 18.0%
Heavy Trucks 14.8 20.0 26.7 27.2 30.0 30.8 33.5 32.8 34.8 35.8 36.5 38.7 162.3%
Motorcycles 0.2 0.1 0.2 0.2 0.2 0.2 0.2 0.3 0.3 0.3 0.4 0.4 125.2%
School Buses 1.0 1.1 0.8 0.8 0.9 0.8 0.8 0.9 0.9 1.0 0.9 0.9 -6.6%
1) “Off-Road” includes vehicles not registered for on-road travel, such as ATVs, snowmobiles, golf carts and some military vehicles.
Sources:a) Statistics Canada, Report on Energy Supply and Demand in Canada, 1990–2010, Ottawa, 2012.b) Natural Resources Canada, Transportation End-Use Model, Ottawa, 2012.c) Environment Canada, National Inventory Report 1990–2010: Greenhouse Gas Sources and Sinks in Canada,
Ottawa, 2012.
table continued on next page

www.nrcan.gc.ca/eneene/index-eng.phpEnergy Use Data Handbook, 1990 to 2010 — February 2013118 119
5 Transportation Sector 5Transportation Sector
Transportation GHG Emissions by Energy Source and Transportation Mode (continued)
1990 1995 2001 2002 2003 2004 2005 2006 2007 2008 2009 2010 Total Growth 1990–2010
GHG Emissions by Transportation Mode (Mt of CO2e)a,b,c (continued)
Urban Transit 2.0 1.8 1.8 2.0 2.0 2.1 2.1 1.9 2.1 2.2 2.1 2.3 16.6%
Inter-City Buses 0.7 0.6 0.5 0.5 0.4 0.4 0.4 0.4 0.4 0.5 0.3 0.3 -50.2%
Passenger Air 12.7 12.7 14.5 14.6 14.4 16.1 17.0 16.9 17.2 16.3 14.9 15.4 21.2%
Freight Air 0.5 0.5 0.5 0.5 0.5 0.5 0.5 0.5 0.4 0.3 0.3 0.4 -21.4%
Passenger Rail 0.3 0.2 0.2 0.2 0.2 0.2 0.2 0.2 0.2 0.2 0.2 0.2 -20.9%
Freight Rail 6.7 6.1 6.3 5.8 5.8 6.0 6.4 6.7 7.2 7.6 4.9 6.3 -4.9%
Marine 8.2 7.8 8.9 8.5 9.2 10.1 10.5 8.6 9.5 9.2 8.8 8.9 9.1%
Off-Road1 3.6 4.2 6.1 6.3 6.4 6.5 6.7 6.8 6.9 6.9 6.2 7.0 92.9%
GHG Intensity (tonnes/TJ)a,b,c 69.9 70.5 70.4 70.4 70.4 70.2 70.0 69.8 69.6 69.4 69.1 69.1 -1.3%
GHG Emissions Related to Electricity (Mt of CO2e)a,c
0.2 0.2 0.2 0.2 0.2 0.2 0.2 0.2 0.1 0.1 0.1 0.1 -24.0%
continued from previous table
1) “Off-Road” includes vehicles not registered for on-road travel, such as ATVs, snowmobiles, golf carts and some military vehicles.
Sources:a) Statistics Canada, Report on Energy Supply and Demand in Canada, 1990–2010, Ottawa, 2012.b) Natural Resources Canada, Transportation End-Use Model, Ottawa, 2012.c) Environment Canada, National Inventory Report 1990–2010: Greenhouse Gas Sources and Sinks in Canada,
Ottawa, 2012.

www.nrcan.gc.ca/eneene/index-eng.phpEnergy Use Data Handbook, 1990 to 2010 — February 2013120 121
5 Transportation Sector 5Transportation Sector
Transportation Energy Prices and Background Indicators
1990 1995 2001 2002 2003 2004 2005 2006 2007 2008 2009 2010 Total Growth 1990–2010
Energy Prices by Energy Source (incl. taxes)
Regular Unleaded Gasoline1 (cents/litre)a,d,e 58.7 55.6 70.7 70.5 75.0 82.9 93.5 98.6 103.1 116.4 95.8 104.8 78.5%
Diesel Fuel Oil1 (cents/litre)a,d,e 51.4 51.1 68.3 63.1 68.8 75.6 92.8 96.6 99.0 125.2 89.8 100.9 96.5%
Propane (cents/litre)a,d 26.6 29.3 45.1 37.4 50.2 51.3 57.5 62.0 62.2 72.4 61.4 67.2 152.4%
Excise Tax (cents/litre)b
Unleaded Gasoline 8.5 10.0 10.0 10.0 10.0 10.0 10.0 10.0 10.0 10.0 10.0 10.0 17.6%
Leaded Gasoline 9.5 11.0 11.0 11.0 11.0 11.0 11.0 11.0 11.0 11.0 11.0 11.0 15.8%
Diesel Fuel Oil 4.0 4.0 4.0 4.0 4.0 4.0 4.0 4.0 4.0 4.0 4.0 4.0 –
Background Indicators
Consumer Price Index (2002 = 100)c
Gasoline and Other Fuels2 82.7 80.0 100.8 100.0 106.4 117.6 132.6 139.8 146.1 164.7 135.8 148.2 –
Public Transportation 52.3 68.8 94.7 100.0 102.9 105.3 108.6 113.6 114.6 121.4 122.3 121.1 –
Inter-City Transportation 47.4 63.0 93.1 100.0 102.3 104.1 107.0 111.7 111.9 119.5 118.6 113.2 –
Local and Commuter 60.8 78.8 97.4 100.0 103.9 107.5 111.4 116.7 119.4 124.5 128.8 135.4 –
GDP at Factor Cost (million $2002)c
Business Sector 615,284 678,056 872,752 896,598 914,112 945,546 978,197 1,004,002 1,025,638 1,027,685 983,942 1,022,287 66.1%
Transportation 35,200 39,102 48,606 48,528 49,057 50,894 54,065 55,306 56,248 56,266 54,095 56,938 61.8%
Real Personal Disposable Income per Household ($2002)c
56,325 52,997 56,822 57,165 57,723 59,164 59,460 62,076 63,580 65,344 64,865 66,128 17.4%
1) Price at full-service stations.2) “Other Fuels” includes diesel fuel oil, propane, natural gas and any other fuel that would be used
for automobile propulsion.
Sources:a) Statistics Canada, Energy Statistics Handbook, Ottawa, 2011 (Cat. No. 57-601-X).b) Canada Revenue Agency, Current Rates of Excise Taxes — Revised, Ottawa, 2008;
www.cra-arc.gc.ca/E/pub/et/currate/currate-e.html.c) Informetrica Limited, The Informetrica Model and Database, Ottawa, 2012. d) Statistics Canada, Report on Energy Supply and Demand in Canada, 1990–2010, Ottawa, 2012.e) Statistics Canada, Total Population, Census Divisions and Census Metropolitan Areas,
Tables 051-0014, 051-0034 and 051-0046, Ottawa, 2011 (CANSIM).

www.nrcan.gc.ca/eneene/index-eng.phpEnergy Use Data Handbook, 1990 to 2010 — February 2013122 123
5 Transportation Sector — Passenger 5Transportation Sector — Passenger
Passenger Transportation Secondary Energy Use by Energy Source and Transportation Mode
1990 1995 2001 2002 2003 2004 2005 2006 2007 2008 2009 2010 Total Growth 1990–2010
Passenger Transportation Energy Use (PJ)a 1,179.0 1,190.4 1,274.0 1,308.8 1,314.8 1,352.4 1,363.9 1,351.6 1,399.9 1,375.6 1,376.6 1,390.3 17.9%
Energy Use by Energy Source (PJ)a
Electricity 3.1 3.0 3.1 3.4 3.4 3.5 3.5 3.5 2.5 2.3 2.4 2.5 -18.7%
Natural Gas 1.6 2.3 1.9 1.7 1.7 1.7 1.8 1.8 1.8 1.7 1.8 1.8 9.9%
Motor Gasoline 917.9 934.7 995.7 1,029.2 1,037.5 1,052.2 1,044.6 1,037.7 1,060.5 1,044.0 1,066.7 1,062.2 15.7%
Diesel Fuel Oil 56.2 53.0 52.7 55.3 54.8 52.5 53.3 50.7 54.3 58.2 54.3 58.3 3.6%
Ethanol 0.0 0.0 0.0 0.0 0.0 0.0 4.9 4.9 23.5 25.4 28.3 34.3 –
Biodiesel Fuel n.a. n.a. n.a. n.a. n.a. n.a. n.a. n.a. n.a. n.a. n.a. n.a. –
Aviation Gasoline 5.4 4.1 3.5 3.4 3.1 2.8 3.3 2.9 3.1 3.0 2.8 2.6 -52.9%
Aviation Turbo Fuel 175.5 176.7 208.5 209.4 208.0 232.8 245.8 244.6 248.4 234.7 214.7 223.0 27.1%
Propane 19.2 16.6 8.6 6.5 6.3 6.9 6.7 5.5 5.9 6.3 5.6 5.7 -70.5%
Energy Use by Transportation Mode (PJ)a
Cars 721.2 682.0 640.4 652.2 648.5 647.8 636.1 628.8 645.9 631.1 637.1 625.2 -13.3%
Light Trucks 216.9 271.6 371.8 389.8 400.4 415.5 423.8 422.8 447.0 447.9 465.2 479.5 121.1%
Motorcycles 2.5 2.2 2.7 3.1 3.3 3.6 3.6 3.8 4.1 4.2 5.7 5.8 130.8%
School Buses 15.1 16.8 11.7 11.9 13.2 11.3 11.4 12.3 12.4 13.7 13.0 13.4 -11.4%
Urban Transit 29.0 26.2 26.1 29.2 29.3 30.3 31.2 27.7 30.1 31.4 31.1 33.1 14.4%
Inter-City Buses 9.6 8.5 6.5 7.1 6.3 5.7 6.1 5.9 6.3 6.5 4.7 4.7 -51.0%
Air 180.9 180.8 211.9 212.8 211.1 235.6 249.1 247.5 251.4 237.7 217.6 225.5 24.7%
Rail 3.8 2.3 3.0 2.8 2.6 2.5 2.7 2.7 2.8 3.2 2.3 2.9 -21.7%
Activity
Total Passenger-kilometres1 (millions)a,b,c 496,803 548,531 614,963 629,229 632,646 651,530 663,198 676,065 700,103 702,859 713,541 733,766 47.7%
1) Excludes non-commercial aviation.
Sources:a) Natural Resources Canada, Transportation End-Use Model, Ottawa, 2012.b) Statistics Canada, Canadian Civil Aviation, 1990–2000, Ottawa, 2003 (Cat. No. 51-206-X); and
Statistics Canada, Aviation: Service Bulletin (Cat. No. 51-004-X), Ottawa: Vol. 43, No. 4, 2011.c) Statistics Canada, Rail in Canada, 1990–2009, Ottawa, 2011 (Cat. No. 52-216-X).
table continued on next page

www.nrcan.gc.ca/eneene/index-eng.phpEnergy Use Data Handbook, 1990 to 2010 — February 2013124 125
5 Transportation Sector — Passenger 5Transportation Sector — Passenger
Passenger Transportation Secondary Energy Use by Energy Source and Transportation Mode (continued)
1990 1995 2001 2002 2003 2004 2005 2006 2007 2008 2009 2010 Total Growth 1990–2010
Passenger-kilometres by Transportation Mode (millions)
Carsa 309,987 321,760 317,806 327,365 328,482 330,461 326,461 324,409 335,867 330,866 336,390 332,463 7.3%
Light Trucksa 75,035 105,281 148,436 156,200 161,336 168,301 172,569 173,151 184,132 185,921 195,291 203,372 171.0%
Motorcyclesa 1,688 1,480 2,004 2,377 2,549 2,792 3,011 3,213 3,499 3,598 3,243 3,285 94.6%
School Busesa 16,861 22,511 19,742 21,052 23,834 21,685 23,075 28,847 24,021 25,706 29,106 31,087 84.4%
Urban Transita 15,162 12,938 14,851 16,394 16,505 17,356 18,405 19,281 16,573 17,666 18,590 19,871 31.1%
Inter-City Busesa 9,513 9,652 8,036 9,149 8,179 7,550 8,224 6,985 8,223 7,928 6,824 6,153 -35.3%
Air1,b 66,776 73,492 102,535 95,094 90,326 101,965 109,975 118,729 126,334 129,600 122,683 136,043 103.7%
Railc 1,782 1,415 1,553 1,597 1,434 1,421 1,478 1,450 1,453 1,574 1,413 1,492 -16.3%
Energy Intensity1 (MJ/Pkm)a,b,c 2.29 2.11 2.03 2.04 2.04 2.03 2.01 1.95 1.94 1.90 1.89 1.86 -19.1%
continued from previous table
1) Excludes non-commercial aviation.
Sources:a) Natural Resources Canada, Transportation End-Use Model, Ottawa, 2012.b) Statistics Canada, Canadian Civil Aviation, 1990–2000, Ottawa, 2003 (Cat. No. 51-206-X); and
Statistics Canada, Aviation: Service Bulletin (Cat. No. 51-004-X), Ottawa: Vol. 43, No. 4, 2011.c) Statistics Canada, Rail in Canada, 1990–2009, Ottawa, 2011 (Cat. No. 52-216-X).

www.nrcan.gc.ca/eneene/index-eng.phpEnergy Use Data Handbook, 1990 to 2010 — February 2013126 127
5 Transportation Sector — Passenger 5Transportation Sector — Passenger
Passenger Transportation GHG Emissions by Energy Source and Transportation Mode
1990 1995 2001 2002 2003 2004 2005 2006 2007 2008 2009 2010 Total Growth 1990–2010
Passenger Transportation GHG Emissions (Mt of CO2e)b,c
81.7 83.7 88.9 91.4 91.7 93.9 94.2 92.9 95.8 93.8 93.4 94.1 15.1%
GHG Emissions by Energy Source (Mt of CO2e)b,c
Electricity 0.2 0.2 0.2 0.2 0.2 0.2 0.2 0.2 0.1 0.1 0.1 0.1 -24.0%
Natural Gas 0.1 0.1 0.1 0.1 0.1 0.1 0.1 0.1 0.1 0.1 0.1 0.1 7.7%
Motor Gasoline 63.6 66.0 69.9 72.2 72.7 73.3 72.4 71.4 72.6 71.1 72.3 71.7 12.7%
Diesel Fuel Oil 4.0 3.7 3.8 3.9 3.9 3.7 3.8 3.6 3.9 4.1 3.9 4.1 4.9%
Ethanol 0.0 0.0 0.0 0.0 0.0 0.0 0.3 0.3 1.6 1.7 1.9 2.2 –
Biodiesel Fuel n.a. n.a. n.a. n.a. n.a. n.a. n.a. n.a. n.a. n.a. n.a. n.a. –
Aviation Gasoline 0.4 0.3 0.3 0.2 0.2 0.2 0.2 0.2 0.2 0.2 0.2 0.2 -52.9%
Aviation Turbo Fuel 12.3 12.4 14.2 14.3 14.2 15.9 16.8 16.7 17.0 16.0 14.7 15.2 23.6%
Propane 1.1 1.0 0.5 0.4 0.4 0.4 0.4 0.3 0.4 0.4 0.3 0.3 -70.2%
GHG Emissions by Transportation Mode (Mt of CO2e)b,c
Cars 49.8 48.0 44.8 45.6 45.3 45.0 43.9 43.2 44.1 42.9 43.1 42.1 -15.4%
Light Trucks 15.1 19.2 26.2 27.5 28.2 29.1 29.5 29.2 30.7 30.5 31.5 32.3 114.5%
Motorcycles 0.2 0.1 0.2 0.2 0.2 0.2 0.2 0.3 0.3 0.3 0.4 0.4 125.2%
School Buses 1.0 1.1 0.8 0.8 0.9 0.8 0.8 0.9 0.9 1.0 0.9 0.9 -6.6%
Urban Transit 2.0 1.8 1.8 2.0 2.0 2.1 2.1 1.9 2.1 2.2 2.1 2.3 16.6%
Inter-City Buses 0.7 0.6 0.5 0.5 0.4 0.4 0.4 0.4 0.4 0.5 0.3 0.3 -50.2%
Air 12.7 12.7 14.5 14.6 14.4 16.1 17.0 16.9 17.2 16.3 14.9 15.4 21.2%
Rail 0.3 0.2 0.2 0.2 0.2 0.2 0.2 0.2 0.2 0.2 0.2 0.2 -20.9%
GHG Intensity (tonnes/TJ)b,c 69.3 70.3 69.8 69.8 69.8 69.4 69.1 68.8 68.5 68.2 67.9 67.7 -2.4%
GHG Emissions Related to Electricity (Mt of CO2e)a,c
0.2 0.2 0.2 0.2 0.2 0.2 0.2 0.2 0.1 0.1 0.1 0.1 -24.0%
Sources:a) Statistics Canada, Report on Energy Supply and Demand in Canada, 1990–2010, Ottawa, 2012.b) Natural Resources Canada, Transportation End-Use Model, Ottawa, 2012.c) Environment Canada, National Inventory Report 1990–2010: Greenhouse Gas Sources and Sinks in Canada,
Ottawa, 2012.

www.nrcan.gc.ca/eneene/index-eng.phpEnergy Use Data Handbook, 1990 to 2010 — February 2013128 129
5 Transportation Sector — Passenger 5Transportation Sector — Passenger
Passenger Road Transportation Secondary Energy Use and GHG Emissions by Energy Source
1990 1995 2001 2002 2003 2004 2005 2006 2007 2008 2009 2010 Total Growth 1990–2010
Passenger Road Transportation Energy Use (PJ)a 994.3 1,007.2 1,059.1 1,093.3 1,101.1 1,114.3 1,112.1 1,101.3 1,145.7 1,134.7 1,156.8 1,161.8 16.8%
Energy Use by Energy Source (PJ)a
Electricity 3.1 3.0 3.1 3.4 3.4 3.5 3.5 3.5 2.5 2.3 2.4 2.5 -18.7%
Natural Gas 1.6 2.3 1.9 1.7 1.7 1.7 1.8 1.8 1.8 1.7 1.8 1.8 9.9%
Motor Gasoline 917.9 934.7 995.7 1,029.2 1,037.5 1,052.2 1,044.6 1,037.7 1,060.5 1,044.0 1,066.7 1,062.2 15.7%
Diesel Fuel Oil 52.5 50.7 49.8 52.5 52.2 50.0 50.6 48.0 51.5 55.0 52.0 55.3 5.4%
Ethanol 0.0 0.0 0.0 0.0 0.0 0.0 4.9 4.9 23.5 25.4 28.3 34.3 –
Biodiesel Fuel n.a. n.a. n.a. n.a. n.a. n.a. n.a. n.a. n.a. n.a. n.a. n.a. –
Propane 19.2 16.6 8.6 6.5 6.3 6.9 6.7 5.5 5.9 6.3 5.6 5.7 -70.5%
Activity
Passenger-kilometres (millions)a 428,246 473,623 510,875 532,537 540,886 548,144 551,745 555,886 572,316 571,684 589,445 596,231 39.2%
Energy Intensity (MJ/Pkm)a 2.32 2.13 2.07 2.05 2.04 2.03 2.02 1.98 2.00 1.98 1.96 1.95 -16.1%
Passenger Road Transportation GHG Emissions (Mt of CO2e)a,b
68.7 70.8 74.2 76.6 77.1 77.6 77.0 75.8 78.4 77.3 78.4 78.4 14.2%
GHG Emissions by Energy Source (Mt of CO2e)a,b
Electricity 0.2 0.2 0.2 0.2 0.2 0.2 0.2 0.2 0.1 0.1 0.1 0.1 -24.0%
Natural Gas 0.1 0.1 0.1 0.1 0.1 0.1 0.1 0.1 0.1 0.1 0.1 0.1 7.7%
Motor Gasoline 63.6 66.0 69.9 72.2 72.7 73.3 72.4 71.4 72.6 71.1 72.3 71.7 12.7%
Diesel Fuel Oil 3.7 3.5 3.5 3.7 3.7 3.5 3.6 3.4 3.7 3.9 3.7 3.9 7.0%
Ethanol 0.0 0.0 0.0 0.0 0.0 0.0 0.3 0.3 1.6 1.7 1.9 2.2 –
Biodiesel Fuel n.a. n.a. n.a. n.a. n.a. n.a. n.a. n.a. n.a. n.a. n.a. n.a. –
Propane 1.1 1.0 0.5 0.4 0.4 0.4 0.4 0.3 0.4 0.4 0.3 0.3 -70.2%
GHG Intensity (Tonne/TJ)a,b 69.1 70.3 70.1 70.0 70.0 69.6 69.2 68.8 68.4 68.1 67.8 67.5 -2.3%
Sources:a) Natural Resources Canada, Transportation End-Use Model, Ottawa, 2012.b) Environment Canada, National Inventory Report 1990–2010: Greenhouse Gas Sources and Sinks in Canada,
Ottawa, 2012.

www.nrcan.gc.ca/eneene/index-eng.phpEnergy Use Data Handbook, 1990 to 2010 — February 2013130 131
5 Transportation Sector — Passenger 5Transportation Sector — Passenger
Passenger Transportation Explanatory Variables
1990 1995 2001 2002 2003 2004 2005 2006 2007 2008 2009 2010 Total Growth 1990–2010
Light-Duty Vehicles
Sales (thousands)
Carsa,d 872 641 865 919 866 826 846 866 881 914 760 723 -17.1%
Light Trucksa,d 303 349 499 546 526 513 525 549 597 576 530 627 107.4%
Motorcycles n.a. n.a. n.a. n.a. n.a. n.a. n.a. n.a. n.a. n.a. n.a. n.a. –
Stock (thousands)
Carsa,f 11,100 10,936 10,966 11,010 11,046 11,190 11,124 11,263 11,607 12,000 12,098 12,061 8.7%
Light Trucksa,f 2,751 3,360 4,718 4,856 5,036 5,274 5,440 5,507 5,853 6,223 6,480 6,746 145.2%
Motorcyclesa,c 306 275 318 350 373 409 444 485 522 567 595 608 98.8%
Average Distance Travelled per Year (km)
Carsa 17,990 18,694 18,317 18,790 18,790 18,659 18,539 18,194 18,275 17,410 17,556 17,402 -3.3%
Light Trucksa 17,588 18,747 18,453 18,862 18,780 18,703 18,587 18,418 18,425 17,494 17,642 17,644 0.3%
Motorcyclesa 5,020 4,899 5,160 5,347 5,377 5,378 5,343 5,218 5,274 4,998 5,062 5,024 0.1%
On-Road Average Fuel Consumption (L/100 km)
Carsa,g
Motor Gasoline1 10.4 9.6 9.1 9.0 8.9 8.9 8.8 8.8 8.8 8.7 8.7 8.6 -17.1%
Diesel Fuel Oil2 8.1 7.6 6.8 6.7 6.6 6.5 6.4 6.3 6.3 6.3 6.4 6.4 -20.1%
Light Trucksa,g
Motor Gasoline1 13.0 12.4 12.2 12.1 12.1 12.0 12.0 11.9 11.9 11.9 11.8 11.7 -10.1%
Diesel Fuel Oil2 9.8 11.0 12.0 12.1 12.3 12.4 12.3 12.0 11.8 11.4 10.8 10.1 3.2%
Motorcyclesa,e
Motor Gasoline1 4.7 4.7 4.7 4.7 4.7 4.7 4.3 4.3 4.2 4.2 5.4 5.4 14.9%
1) Includes Ethanol.2) Includes Biodiesel.3) These series are representative of vehicles produced in the model year, not for vehicles sold in that calendar year.
Sources:a) Natural Resources Canada, Transportation End-Use Model, Ottawa, 2012.b) Statistics Canada, Passenger Bus and Urban Transit Statistics, 1990–2000, Ottawa, 2002 (Cat. No. 53-215-X); and The
Canadian Passenger Bus and Urban Transit Industries Survey, 2001–2010, Ottawa, 2012 (Cat. No. 50-002-X); and Tables 408-0008 and 408-0010, 2012 (CANSIM).
c) Statistics Canada, Road Motor Vehicle Registrations, Ottawa, 1999 (Cat. No. 53-219-X); and Statistics Canada, Motor Vehicle Registrations, 2000–2009, Table 405-0004, Ottawa, 2011 (CANSIM).
d) R.L. Polk & Co., New Vehicle Registrations, 1990–2010, Southfield(Detroit), Michigan, 2011.e) United States Department of Transportation, National Transportation Statistics, Table VM-1, 2010.f) DesRosiers Automotive Consultants, Canadian Vehicles in Operation Census, 1990–2010, Richmond Hill (Toronto), 2011.g) Transport Canada, Vehicle Fuel Economy Information System, 1979–2009, Ottawa, 2010.
table continued on next page

www.nrcan.gc.ca/eneene/index-eng.phpEnergy Use Data Handbook, 1990 to 2010 — February 2013132 133
5 Transportation Sector — Passenger 5Transportation Sector — Passenger
Passenger Transportation Explanatory Variables (continued)
1990 1995 2001 2002 2003 2004 2005 2006 2007 2008 2009 2010 Total Growth 1990–2010
Lab-Tested New Vehicle Fuel Consumption3 (L/100 km)g
CAFC Standard Cars 8.6 8.6 8.6 8.6 8.6 8.6 8.6 8.6 8.6 8.6 8.6 8.6 –
CAFC Average Car Fleet 8.2 7.9 7.8 7.7 7.6 7.5 7.4 7.5 7.2 7.1 6.8 6.8 -17.1%
CAFC Standard Light Trucks 11.8 11.4 11.4 11.4 11.4 11.4 11.2 10.9 10.6 10.5 10.2 10 -15.3%
CAFC Average Light Truck Fleet 11.4 11.5 11.0 11.0 10.8 10.9 10.6 10.4 10.1 9.5 9.1 8.5 -25.4%
Buses
Stock (thousands)a,c
School Buses 44.7 48.8 43.0 46.3 47.5 46.9 46.9 49.2 48.0 48.4 49.5 50.7 13.4%
Urban Transit 25.7 21.7 23.2 24.8 24.1 23.5 24.0 23.0 25.9 27.1 28.1 28.4 10.6%
Inter-City Buses 6.6 6.8 7.8 8.3 8.3 7.4 8.0 8.2 8.7 8.6 8.0 8.4 27.1%
Average Distance Travelled per Year (km)a,b
School Buses 21,926 25,126 23,235 22,768 24,802 22,627 23,790 28,045 23,699 24,840 27,251 28,127 28.3%
Urban Transit 56,190 55,589 56,654 58,053 59,644 63,765 65,610 71,197 53,911 54,481 54,816 57,412 2.2%
Inter-City Buses 85,632 83,503 60,723 65,382 58,466 60,075 60,789 50,226 55,795 54,347 50,367 43,568 -49.1%
continued from previous table
1) Includes Ethanol.2) Includes Biodiesel.3) These series are representative of vehicles produced in the model year, not for vehicles sold in that calendar year.
Sources:a) Natural Resources Canada, Transportation End-Use Model, Ottawa, 2012.b) Statistics Canada, Passenger Bus and Urban Transit Statistics, 1990–2000, Ottawa, 2002 (Cat. No. 53-215-X); and
The Canadian Passenger Bus and Urban Transit Industries Survey, 2001–2010, Ottawa, 2012 (Cat. No. 50-002-X); and Tables 408-0008 and 408-0010, 2012 (CANSIM).
c) Statistics Canada, Road Motor Vehicle Registrations, Ottawa, 1999 (Cat. No. 53-219-X); and Statistics Canada, Motor Vehicle Registrations, 2000–2009, Table 405-0004, Ottawa, 2011 (CANSIM).
d) R.L. Polk & Co., New Vehicle Registrations, 1990–2010, Southfield(Detroit), Michigan, 2011.e) United States Department of Transportation, National Transportation Statistics, Table VM-1, 2010.f) DesRosiers Automotive Consultants, Canadian Vehicles in Operation Census, 1990–2010, Richmond Hill (Toronto), 2011.g) Transport Canada, Vehicle Fuel Economy Information System, 1979–2009, Ottawa, 2010.

www.nrcan.gc.ca/eneene/index-eng.phpEnergy Use Data Handbook, 1990 to 2010 — February 2013134 135
5 Transportation Sector — Freight 5Transportation Sector — Freight
Sources:a) Natural Resources Canada, Transportation End-Use Model, Ottawa, 2012. b Statistics Canada, Trucking in Canada, 1990–2005, Ottawa, 2007 (Cat. No. 53-222-X); and Table 403-0004, 2012
(CANSIM).
c) Statistics Canada, Canadian Civil Aviation, 1990–2000, Ottawa, 2003 (Cat. No. 51-206-X); and Statistics Canada, Aviation: Service Bulletin (Cat. No. 51-004-X), Ottawa: Vol. 43, No. 4, 2011.
d) Statistics Canada, Rail in Canada, 1990–2009, Ottawa, 2011 (Cat. No. 52-216-X). e) Transport Canada, Surface and Marine Statistics and Forecasts Division, Ottawa, 2012.
Freight Transportation Secondary Energy Use by Energy Source and Transportation Mode
1990 1995 2001 2002 2003 2004 2005 2006 2007 2008 2009 2010 Total Growth 1990–2010
Freight Transportation Energy Use (PJ)a 645.6 757.2 890.8 880.6 949.2 996.9 1,023.3 1,005.0 1,052.8 1,064.0 1,038.0 1,100.7 70.5%
Energy Use by Energy Source (PJ)a
Natural Gas 0.1 0.1 0.1 0.1 0.1 0.1 0.1 0.1 0.1 0.1 0.1 0.1 137.7%
Motor Gasoline 149.1 181.6 210.3 210.3 220.3 232.8 225.4 232.2 233.0 231.1 238.3 243.7 63.4%
Diesel Fuel Oil 413.6 495.4 594.8 591.2 632.0 663.6 691.9 689.7 717.9 731.1 697.0 754.2 82.4%
Ethanol 0.0 0.0 0.0 0.0 0.0 0.0 1.1 1.2 5.2 5.3 6.2 7.8 –
Biodiesel Fuel n.a. n.a. n.a. n.a. n.a. n.a. n.a. n.a. n.a. n.a. n.a. n.a. –
Light Fuel Oil and Kerosene 0.0 0.0 0.0 0.0 0.0 0.0 0.0 0.0 0.0 0.0 0.0 0.0 –
Heavy Fuel Oil 60.1 56.6 70.3 65.7 84.4 87.5 93.5 68.7 84.4 84.9 86.4 84.0 39.7%
Aviation Gasoline 0.1 0.1 0.0 0.0 0.0 0.0 0.0 0.0 0.0 0.0 0.0 0.0 -62.9%
Aviation Turbo Fuel 6.4 7.2 6.8 7.3 6.8 7.2 7.8 7.1 5.8 4.9 4.4 5.2 -18.6%
Propane 16.2 16.2 8.6 5.9 5.6 5.7 3.6 5.9 6.2 6.5 5.7 5.5 -65.9%
Energy Use by Transportation Mode (PJ)a
Light Trucks 99.7 120.0 153.0 157.6 160.8 166.3 167.5 169.5 180.1 180.9 187.0 192.6 93.1%
Medium Trucks 134.8 162.0 155.8 145.7 161.4 177.0 154.7 165.3 157.6 153.6 150.8 156.9 16.4%
Heavy Trucks 212.3 287.7 377.7 384.6 424.4 436.0 473.0 464.4 491.9 505.3 515.9 547.3 157.8%
Air 6.5 7.3 6.9 7.3 6.8 7.2 7.8 7.2 5.8 4.9 4.4 5.3 -19.1%
Rail 85.7 78.6 80.7 73.5 74.4 76.6 81.7 85.6 91.8 97.0 62.5 80.7 -5.8%
Marine 106.5 101.7 116.7 112.0 121.5 133.7 138.6 113.0 125.7 122.2 117.4 117.9 10.6%
Activity
Total Tonne-kilometres (millions)a,b,c,d,e 543,300 614,639 735,682 766,497 789,023 850,684 889,015 885,746 884,691 855,245 767,453 835,011 53.7%
Tonne-kilometres by Transportation Mode (millions)
Light Trucksa 10,667 13,955 18,801 19,457 19,972 21,156 21,449 21,792 23,713 23,991 25,072 26,081 144.5%
Medium Trucksa 14,862 19,272 19,712 18,593 20,877 23,145 20,470 24,471 23,635 22,671 20,922 23,302 56.8%
Heavy Trucksb 77,800 110,000 170,569 177,012 184,744 224,910 233,583 225,105 224,839 223,802 208,531 225,403 189.7%
Airc 1,754 2,045 2,172 2,151 1,855 2,013 2,236 2,227 1,997 1,809 1,628 2,090 19.2%
Raild 248,348 280,477 323,211 317,807 318,263 338,898 352,140 352,477 358,832 340,092 299,646 337,028 35.7%
Marinee 189,869 188,890 201,216 231,477 243,312 240,562 259,138 259,674 251,675 242,880 211,653 221,106 16.5%
Energy Intensity (MJ/Tkm)a 1.19 1.23 1.21 1.15 1.20 1.17 1.15 1.13 1.19 1.24 1.35 1.32 10.9%
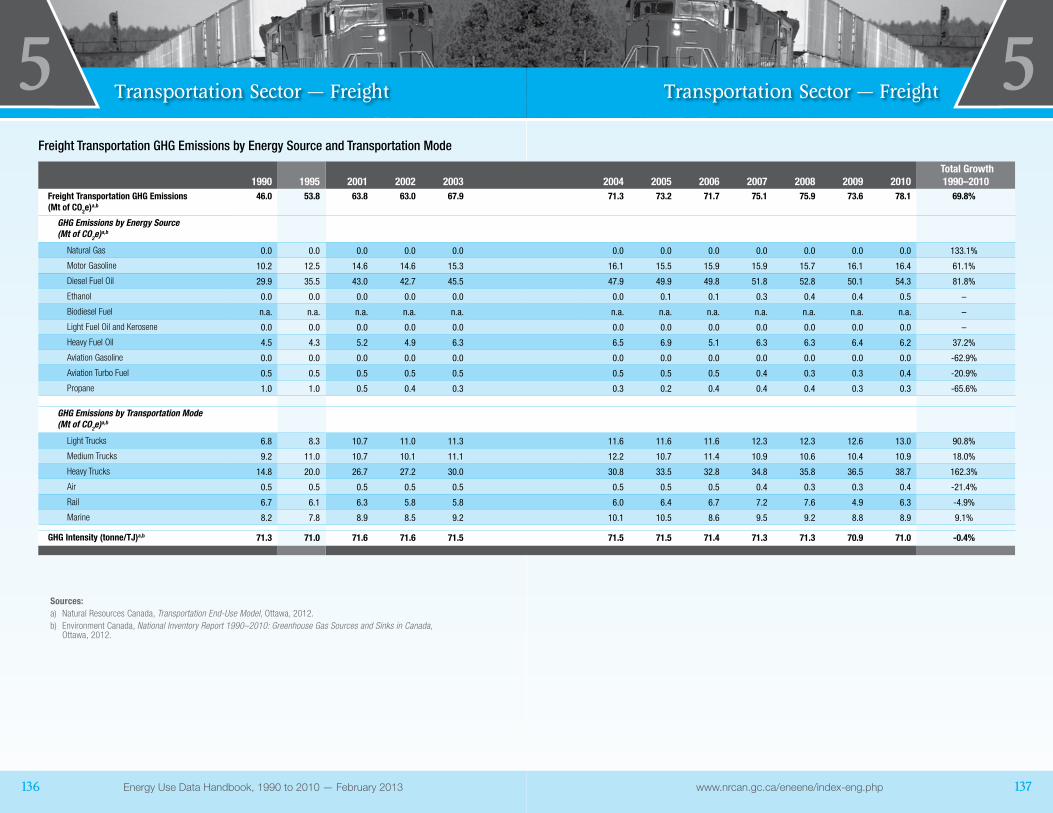
www.nrcan.gc.ca/eneene/index-eng.phpEnergy Use Data Handbook, 1990 to 2010 — February 2013136 137
5 Transportation Sector — Freight 5Transportation Sector — Freight
Freight Transportation GHG Emissions by Energy Source and Transportation Mode
1990 1995 2001 2002 2003 2004 2005 2006 2007 2008 2009 2010 Total Growth 1990–2010
Freight Transportation GHG Emissions (Mt of CO2e)a,b
46.0 53.8 63.8 63.0 67.9 71.3 73.2 71.7 75.1 75.9 73.6 78.1 69.8%
GHG Emissions by Energy Source (Mt of CO2e)a,b
Natural Gas 0.0 0.0 0.0 0.0 0.0 0.0 0.0 0.0 0.0 0.0 0.0 0.0 133.1%
Motor Gasoline 10.2 12.5 14.6 14.6 15.3 16.1 15.5 15.9 15.9 15.7 16.1 16.4 61.1%
Diesel Fuel Oil 29.9 35.5 43.0 42.7 45.5 47.9 49.9 49.8 51.8 52.8 50.1 54.3 81.8%
Ethanol 0.0 0.0 0.0 0.0 0.0 0.0 0.1 0.1 0.3 0.4 0.4 0.5 –
Biodiesel Fuel n.a. n.a. n.a. n.a. n.a. n.a. n.a. n.a. n.a. n.a. n.a. n.a. –
Light Fuel Oil and Kerosene 0.0 0.0 0.0 0.0 0.0 0.0 0.0 0.0 0.0 0.0 0.0 0.0 –
Heavy Fuel Oil 4.5 4.3 5.2 4.9 6.3 6.5 6.9 5.1 6.3 6.3 6.4 6.2 37.2%
Aviation Gasoline 0.0 0.0 0.0 0.0 0.0 0.0 0.0 0.0 0.0 0.0 0.0 0.0 -62.9%
Aviation Turbo Fuel 0.5 0.5 0.5 0.5 0.5 0.5 0.5 0.5 0.4 0.3 0.3 0.4 -20.9%
Propane 1.0 1.0 0.5 0.4 0.3 0.3 0.2 0.4 0.4 0.4 0.3 0.3 -65.6%
GHG Emissions by Transportation Mode (Mt of CO2e)a,b
Light Trucks 6.8 8.3 10.7 11.0 11.3 11.6 11.6 11.6 12.3 12.3 12.6 13.0 90.8%
Medium Trucks 9.2 11.0 10.7 10.1 11.1 12.2 10.7 11.4 10.9 10.6 10.4 10.9 18.0%
Heavy Trucks 14.8 20.0 26.7 27.2 30.0 30.8 33.5 32.8 34.8 35.8 36.5 38.7 162.3%
Air 0.5 0.5 0.5 0.5 0.5 0.5 0.5 0.5 0.4 0.3 0.3 0.4 -21.4%
Rail 6.7 6.1 6.3 5.8 5.8 6.0 6.4 6.7 7.2 7.6 4.9 6.3 -4.9%
Marine 8.2 7.8 8.9 8.5 9.2 10.1 10.5 8.6 9.5 9.2 8.8 8.9 9.1%
GHG Intensity (tonne/TJ)a,b 71.3 71.0 71.6 71.6 71.5 71.5 71.5 71.4 71.3 71.3 70.9 71.0 -0.4%
Sources:a) Natural Resources Canada, Transportation End-Use Model, Ottawa, 2012.b) Environment Canada, National Inventory Report 1990–2010: Greenhouse Gas Sources and Sinks in Canada,
Ottawa, 2012.

www.nrcan.gc.ca/eneene/index-eng.phpEnergy Use Data Handbook, 1990 to 2010 — February 2013138 139
5 Transportation Sector — Freight 5Transportation Sector — Freight
Freight Road Transportation Secondary Energy Use and GHG Emissions by Energy Source
1990 1995 2001 2002 2003 2004 2005 2006 2007 2008 2009 2010 Total Growth 1990–2010
Freight Road Transportation Energy Use (PJ)a 446.8 569.6 686.6 687.8 746.5 779.4 795.3 799.2 829.5 839.9 853.7 896.8 100.7%
Energy Use by Energy Source (PJ)a
Natural Gas 0.1 0.1 0.1 0.1 0.1 0.1 0.1 0.1 0.1 0.1 0.1 0.1 137.7%
Motor Gasoline 149.1 181.6 210.3 210.3 220.3 232.8 225.4 232.2 233.0 231.1 238.3 243.7 63.4%
Diesel Fuel Oil 281.5 371.7 467.7 471.5 520.6 540.8 565.2 559.8 584.9 596.8 603.5 639.6 127.3%
Ethanol 0.0 0.0 0.0 0.0 0.0 0.0 1.1 1.2 5.2 5.3 6.2 7.8 –
Biodiesel Fuel n.a. n.a. n.a. n.a. n.a. n.a. n.a. n.a. n.a. n.a. n.a. n.a. –
Propane 16.2 16.2 8.6 5.9 5.6 5.7 3.6 5.9 6.2 6.5 5.7 5.5 -65.9%
Activity
Tonne-kilometres (millions)a,c 103,329 143,227 209,082 215,062 225,593 269,211 275,502 271,368 272,187 270,464 254,526 274,787 165.9%
Energy Intensity (MJ/Tkm)a 4.32 3.98 3.28 3.20 3.31 2.90 2.89 2.95 3.05 3.11 3.35 3.26 -24.5%
Freight Road Transportation GHG Emissions (Mt of CO2e)a,b
30.8 39.4 48.1 48.3 52.4 54.6 55.8 55.9 58.0 58.7 59.6 62.5 103.4%
GHG Emissions by Energy Source (Mt of CO2e)a,b
Natural Gas 0.0 0.0 0.0 0.0 0.0 0.0 0.0 0.0 0.0 0.0 0.0 0.0 133.1%
Motor Gasoline 10.2 12.5 14.6 14.6 15.3 16.1 15.5 15.9 15.9 15.7 16.1 16.4 61.1%
Diesel Fuel Oil 19.6 25.9 33.0 33.3 36.8 38.2 40.0 39.6 41.4 42.2 42.7 45.3 131.2%
Ethanol 0.0 0.0 0.0 0.0 0.0 0.0 0.1 0.1 0.3 0.4 0.4 0.5 –
Biodiesel Fuel n.a. n.a. n.a. n.a. n.a. n.a. n.a. n.a. n.a. n.a. n.a. n.a. –
Propane 1.0 1.0 0.5 0.4 0.3 0.3 0.2 0.4 0.4 0.4 0.3 0.3 -65.6%
GHG Intensity (tonne/TJ)a,b 68.8 69.1 70.1 70.2 70.2 70.1 70.1 70.0 69.9 69.8 69.8 69.7 1.3%
Sources:a) Natural Resources Canada, Transportation End-Use Model, Ottawa, 2012.b) Environment Canada, National Inventory Report 1990–2010: Greenhouse Gas Sources and Sinks in Canada,
Ottawa, 2012.c) Statistics Canada, Trucking in Canada, 1990–2005, Ottawa, 2007 (Cat. No. 53-222-X); and
Table 403-0004, 2012 (CANSIM).

www.nrcan.gc.ca/eneene/index-eng.phpEnergy Use Data Handbook, 1990 to 2010 — February 2013140 141
5 Transportation Sector — Freight 5Transportation Sector — Freight
Freight Transportation Explanatory Variables
1990 1995 2001 2002 2003 2004 20045 2006 2007 2008 2009 2010 Total Growth 1990–2010
Trucks
Sales (thousands)
Light Trucksa,b 110 122 170 185 177 173 176 183 200 195 180 212 92.2%
Medium Trucksa,b 29 34 44 44 44 47 50 59 62 52 34 42 45.1%
Heavy Trucksa,b 16 26 22 25 24 30 34 38 29 27 15 19 19.3%
Stock (thousands)
Light Trucksa,c 1,005 1,176 1,606 1,648 1,697 1,773 1,826 1,841 1,963 2,104 2,196 2,283 127.3%
Medium Trucksa,d 578 615 640 667 685 693 703 712 721 729 736 744 28.7%
Heavy Trucksa,d 297 293 319 325 332 336 340 344 347 351 353 357 20.0%
Average Distance Travelled per Year (km)
Light Trucksa 21,236 22,817 21,681 21,863 21,791 21,696 21,362 21,523 21,568 20,359 20,391 20,398 -3.9%
Medium Trucksa,e 23,366 27,246 25,473 22,838 24,786 26,929 23,297 27,270 26,021 24,676 22,563 24,846 6.3%
Heavy Trucksa,e 72,005 82,161 90,878 84,755 81,368 90,879 89,422 84,743 92,660 84,573 82,863 83,330 15.7%
On-Road Average Fuel Consumption (L/100 km)
Light Trucksa
Motor Gasoline1 13.5 12.7 12.5 12.4 12.3 12.3 12.3 12.2 12.2 12.2 12.0 12.0 -11.1%
Diesel Fuel Oil2 10.0 11.1 12.1 12.3 12.4 12.5 12.5 12.2 12.1 11.7 11.3 10.6 5.9%
Medium Trucksa,e
Motor Gasoline1 27.1 26.2 25.8 25.7 25.5 25.4 25.3 23.0 22.1 23.2 25.4 23.2 -14.4%
Diesel Fuel Oil2 27.6 26.7 26.2 26.2 26.1 26.1 26.0 23.3 23.6 23.3 24.4 23.2 -16.0%
Heavy Trucksa,e
Diesel Fuel Oil 2 42.5 40.0 37.2 36.5 35.9 35.3 34.7 34.7 34.9 35.4 33.4 33.4 -21.5%
Lab-Tested Light Truck Fuel Consumption 3 (L/100 km)f
CAFC Standard Light Trucks 11.8 11.4 11.4 11.4 11.4 11.4 11.2 10.9 10.6 10.5 10.2 10 -15.3%
CAFC Average Light Truck Fleet 11.4 11.5 11.0 11.0 10.8 10.9 10.6 10.4 10.1 9.5 9.1 8.5 -25.4%
1) Includes Ethanol. 2) Includes Biodiesel. 3) These series are representative of vehicles produced in the model year, not for vehicles sold in that calendar year.
Sources:a) Natural Resources Canada, Transportation End-Use Model, Ottawa, 2012.b) R.L. Polk & Co., New Vehicle Registrations, 1990–2010, Southfield (Detroit), Michigan, 2011. c) DesRosiers Automotive Consultants, Canadian Vehicles in Operation Census, 1990–2010, Richmond Hill (Toronto), 2011.
d) R.L. Polk & Co., Truck Industry Profile, 1994–2002, Southfield (Detroit), Michigan, 2004. Data for 2003 to 2010 estimated by Natural Resources Canada.
e) Statistics Canada, Canadian Vehicle Survey, 2004–2009, Ottawa, 2010 (Cat. No. 53-223-X). f) Transport Canada, Vehicle Fuel Economy Information System, 1979–2009, Ottawa, 2010.

Electricity Generation Sector 6
www.nrcan.gc.ca/eneene/index-eng.php 143
The Data SituationEnergy use and production data for the electricity generation sector are reportedinStatisticsCanada’sReport on Energy Supply and Demand in Canada(RESD)(Cat.No.57-003-X).TheRESDdoesnotprovideenergyuse data for the electricity generated from wood and other non-specified fuel, hydro and nuclear categories. Electricity production data for these three energy sources are converted to energy use data using energy content valuesof10.5,3.6and11.564megajoulesperkilowatt-hour,respectively.
GrossdomesticproductdataareprovidedbyInformetricaLimited.
Due to rounding, the numbers in the tables may not add upor calculate to their reported totals or growth rates.

www.nrcan.gc.ca/eneene/index-eng.phpEnergy Use Data Handbook, 1990 to 2010 — February 2013144 145
6 Electricity Generation Sector 6Electricity Generation Sector
Electricity Generation Energy Use and Generation by Energy Source
1990 1995 2001 2002 2003 2004 2005 2006 2007 2008 2009 2010 Total Growth 1990–2010
Total Energy Use (PJ)a,b 3,002.5 3,485.5 3,700.6 3,727.0 3,744.0 3,863.8 3,943.9 3,940.7 4,042.9 4,001.9 3,742.7 3,763.6 25.3%
Energy Use by Energy Source (PJ)a,b
Natural Gas 80.0 182.1 350.7 323.0 355.1 362.8 378.3 418.1 448.4 441.5 428.8 518.6 548.3%
Diesel Fuel Oil, Light Fuel Oil and Kerosene 11.5 8.0 8.9 7.7 8.4 8.7 9.6 7.9 10.4 7.3 8.2 8.3 -27.5%
Heavy Fuel Oil 141.4 84.4 141.2 115.8 141.3 134.9 85.6 58.2 65.4 57.5 53.9 32.3 -77.1%
Coal 874.5 907.5 1,109.5 1,138.4 1,118.6 1,046.5 1,062.7 1,014.5 1,075.7 1,015.8 849.1 853.6 -2.4%
Hydro 1,058.3 1,197.7 1,187.6 1,248.9 1,204.4 1,215.4 1,296.1 1,267.0 1,313.6 1,345.8 1,314.4 1,253.2 18.4%
Nuclear 795.2 1,067.4 836.3 824.0 817.0 985.7 1,004.1 1,068.7 1,019.8 1,047.5 982.8 989.0 24.4%
Wood and Other 37.2 28.2 45.2 46.6 45.4 44.4 43.7 42.5 46.1 43.5 49.8 56.5 51.7%
Petroleum Coke, Still Gas, Coke and Coke Oven Gas1
4.3 10.2 21.2 22.7 53.8 65.4 63.9 63.8 63.5 42.9 55.7 52.0 –
Total Electricity Generated (GWh)a 467,596 542,739 569,402 581,068 569,917 580,444 604,370 592,636 614,583 614,926 588,906 579,388 23.9%
Electricity Generated by Energy Source (GWh)a
Natural Gas 9,018 18,577 38,899 35,688 35,641 37,154 37,436 40,508 42,233 39,070 41,082 47,806 430.1%
Diesel Fuel Oil, Light Fuel Oil and Kerosene 994 2,411 780 723 862 894 932 758 1,031 979 1,071 1,092 9.9%
Heavy Fuel Oil 13,394 3,451 14,012 13,535 16,937 16,797 14,608 8,960 10,289 8,332 8,243 5,363 -60.0%
Coal 76,794 85,192 102,742 101,754 100,826 91,792 93,992 87,317 96,808 90,987 76,367 77,849 1.4%
Hydro 293,985 332,705 329,881 346,917 334,560 337,606 360,026 351,936 364,877 373,822 365,108 348,110 18.4%
Nuclear 68,761 92,306 72,320 71,252 70,652 85,240 86,830 92,419 88,191 90,585 84,992 85,527 24.4%
Wood and Other 3,546 2,687 4,306 4,434 4,324 4,232 4,164 4,047 4,392 4,147 4,747 5,379 51.7%
Petroleum Coke, Still Gas, Coke and Coke Oven Gas1
1,105 5,409 6,462 6,765 6,114 6,730 6,383 6,691 6,762 7,004 7,295 8,262 647.5%
Activity
GDP (million $2002)c 21,356 23,498 22,238 23,620 23,975 24,067 25,593 25,145 26,171 27,364 26,616 26,946 26.2%
Production (GWh)a 467,596 542,739 569,402 581,068 569,917 580,444 604,370 592,636 614,583 614,926 588,906 579,388 23.9%
Energy Intensity (GJ/$2002)a,b,c 0.141 0.148 0.166 0.158 0.156 0.161 0.154 0.157 0.154 0.146 0.141 0.140 -0.7%
Energy Intensity (GJ/GWh)a,b 6,421 6,422 6,499 6,414 6,569 6,657 6,526 6,649 6,578 6,508 6,355 6,496 1.2%
1) Includes manufactured gases, other petroleum products, other fuels and station service.
Sources:a) Statistics Canada, Report on Energy Supply and Demand in Canada, 1990–2010, Ottawa, 2012.b) Natural Resources Canada, Electricity Energy Use Model, Ottawa, 2012.c) Informetrica Limited, The Informetrica Model and Database, Ottawa, 2012.

www.nrcan.gc.ca/eneene/index-eng.phpEnergy Use Data Handbook, 1990 to 2010 — February 2013146 147
6 Electricity Generation Sector 6Electricity Generation Sector
Electricity Generation GHG Emissions by Energy Source
1990 1995 2001 2002 2003 2004 2005 2006 2007 2008 2009 2010 Total Growth 1990–2010
Total GHG Emissions (Mt of CO2e)a,b,c 94.0 98.8 129.3 129.2 133.4 127.8 126.4 122.1 129.9 121.5 106.7 109.7 16.8%
GHG Emissions by Energy Source (Mt of CO2e)a,b,c
Natural Gas 4.1 9.2 17.7 16.3 17.8 18.2 19.0 21.0 22.5 22.0 21.4 25.8 529.9%
Diesel Fuel Oil, Light Fuel Oil and Kerosene 0.8 0.6 0.7 0.6 0.6 0.6 0.7 0.6 0.8 0.5 0.6 0.6 -26.6%
Heavy Fuel Oil 10.7 6.4 10.4 8.6 10.5 10.0 6.3 4.3 4.8 4.3 4.0 2.4 -77.6%
Coal 78.0 81.7 98.8 101.9 100.0 93.6 95.1 90.9 96.4 91.1 76.1 76.6 -1.8%
Hydro 0.0 0.0 0.0 0.0 0.0 0.0 0.0 0.0 0.0 0.0 0.0 0.0 –
Nuclear 0.0 0.0 0.0 0.0 0.0 0.0 0.0 0.0 0.0 0.0 0.0 0.0 –
Wood and Other 0.0 0.0 0.1 0.1 0.1 0.1 0.0 0.0 0.1 0.0 0.1 0.1 –
Petroleum Coke, Still Gas, Coke and Coke Oven Gas1
0.4 0.9 1.7 1.9 4.5 5.4 5.3 5.3 5.2 3.5 4.6 4.3 –
GHG Intensity2 (tonnes/TJ [electricity generated])a,b,c
55.8 50.5 63.1 61.8 65.0 61.2 58.1 57.2 58.7 54.9 50.3 52.6 -5.8%
GHG Intensity3 (tonnes/TJ [energy used])a,b,c 31.3 28.3 34.9 34.7 35.6 33.1 32.1 31.0 32.1 30.4 28.5 29.2 -6.8%
1) Includes manufactured gases, other petroleum products, other fuels and station service.2) Emissions per unit of electricity generated. This GHG emissions factor is applied to the end-use electricity
consumption for the sectoral analysis including electricity-related emissions.3) Emissions per unit of energy used to produce electricity. The difference between the two emissions factors represents
electricity conversion losses (energy used to produce electricity versus the amount of electricity generated).
Sources:a) Statistics Canada, Report on Energy Supply and Demand in Canada, 1990–2010, Ottawa, 2012.b) Natural Resources Canada, Electricity Energy Use Model, Ottawa, 2012.c) Environment Canada, National Inventory Report 1990–2010: Greenhouse Gas Sources and Sinks in Canada,
Ottawa, 2012.

Appendix A1 – Reallocation of Data A
www.nrcan.gc.ca/eneene/index-eng.php 149
Adjustment of Energy Use for Specific Fuel Types in This Handbook with Data in Statistics Canada’s Report on Energy Supply and Demand in Canada (RESD) – 2010 (petajoules)
Notes on sources of energy use data for five end-use sectors:
Residential: BasedatatakenfromRESD(Table2-1)Residentialplus residential wood use (estimated from Natural Resources Canada’s ResidentialEnd-UseModel).
Commercial/Institutional: BasedatatakenfromRESD(Table2-1)Publicadministration and Commercial and other institutional less(Table4-1)Public administration and Commercial and other institutional motor gasoline, diesel, aviation gasoline and aviation turbo fuel columns.
Industrial: BasedatatakenfromRESD(Table2-1)Totalindustrialplus (Table10)Solidwoodwasteandspentpulpingliquorless (Table 8) Wood waste and spent pulping liquor used for electricity generation multiplied by a conversion factor, plus (Table4-1)Producerconsumption for refiningandmining industries of still gas, diesel, heavy fuel oil, light fuel oil, kerosene, petroleum coke and refinery LPG columns, plus(CanadianIndustrialEnergyEnd-UseDataandAnalysisCentre)wastefuelsfromthecementindustry.
Transportation: BasedatatakenfromRESD(Table2-1)Totaltransportationless Pipelines plus(Table4-1)PublicadministrationandCommercialandother institutional motor gasoline, diesel, aviation gasoline and aviation turbo fuel columns.
Agriculture: BasedatatakenfromRESD(Table2-1)representiongthesumofAgricultureenergysourcefuels.

A1 – Reallocation of Data A1 – Reallocation of Data AA
www.nrcan.gc.ca/eneene/index-eng.phpEnergy Use Data Handbook, 1990 to 2010 — February 2013150 151
AppendixAppendix
Adjustment of Energy Use for Specific Fuel Types in This Handbook with Data in Statistics Canada’s Report on Energy Supply and Demand in Canada (RESD) – 2010 (petajoules)
RESD data, Total
Primary and Secondary
Energy Use, Before Reallocation
Motor Gasoline - Industrial Sector
Aviation Fuels - Industrial Sector
Aviation Fuels - Agriculture
LFO - Canadian Airlines, Railways and Road Transport and UrbanTransit
LFO - Retail Pump Sales
HFO - Retail Pump Sales
HFO - Railways and Road Transport and Urban Transit
Other Adjustments
After Reallocation
Sector
Residential 1,264 3 1,267
Commercial/Institutional 1,138 2 0 (0) 0 0 1,141
Industrial 2,337 (18) (6) 0 1 2,314
Transportation 2,622 18 6 0 (2) (4) 0 (2) (3) 2,636
Agriculture 246 (0) 0 (8) 239
Final Demand 7,607 0 0 0 0 0 0 (1) (10) 7,596
Non-Energy 933 933
Producer Consumption 1,178 1,178
Net Supply 9,718 0 0 0 0 0 0 (1) (10) 9,707
Fuel Conversion
Electricity, Steam and Coal/Coke Input Fuels1
3,944 1 3,945
Electricity, Steam and Coal/Coke Production2
(2,209) (2,209)
Total Primary 11,453 0 0 0 0 0 0 0 (10) 11,443
1) “Electricity, Steam and Coal/Coke Input Fuels” represents the amount of input energy from source fuels (coal, uranium, etc.) that is transformed to electricity, steam, coke and coke gas.
2) “Electricity, Steam and Coal/Coke Production” represents the amount of electricity, steam, coke and coke gas produced. The difference between these items is referred to as conversion losses.

Appendix A2 – Reconciliation of Data A
www.nrcan.gc.ca/eneene/index-eng.php 153
Reconciliation of Data on Energy Use Found in This Handbook with Data in Statistics Canada’s Report on Energy Supply and Demand in Canada (RESD) – 2010 (petajoules)
Notes on sources of energy use data for five end-use sectors:
Residential: BasedatatakenfromRESD(Table2-1)Residentialplus residential wood use (estimated from Natural Resources Canada’s ResidentialEnd-UseModel).
Commercial/Institutional: BasedatatakenfromRESD(Table2-1)Publicadministration and Commercial and other institutional less(Table4-1)Public administration and Commercial and other institutional motor gasoline, diesel, aviation gasoline and aviation turbo fuel columns.
Industrial: BasedatatakenfromRESD(Table2-1)Totalindustrialplus (Table 10) solid wood waste and spent pulping liquor less (Table 8) wood waste and spent pulping liquor used for electricity generation multiplied by a conversion factor, plus (Table4-1)Producerconsumption for refiningandmining industries of still gas, diesel, heavy fuel oil, light fuel oil, kerosene, petroleum coke and refinery LPG columns, plus(CanadianIndustrialEnergyEnd-UseDataandAnalysisCentre)wastefuelsfromthecementindustry.
Transportation: BasedatatakenfromRESD(Table2-1)Totaltransportationless Pipelines plus(Table4-1)PublicadministrationandCommercialandother institutional motor gasoline, diesel, aviation gasoline and aviation turbo fuel columns.
Agriculture: BasedatatakenfromRESD(Table2-1)representiongthesumofAgricultureenergysourcefuels.
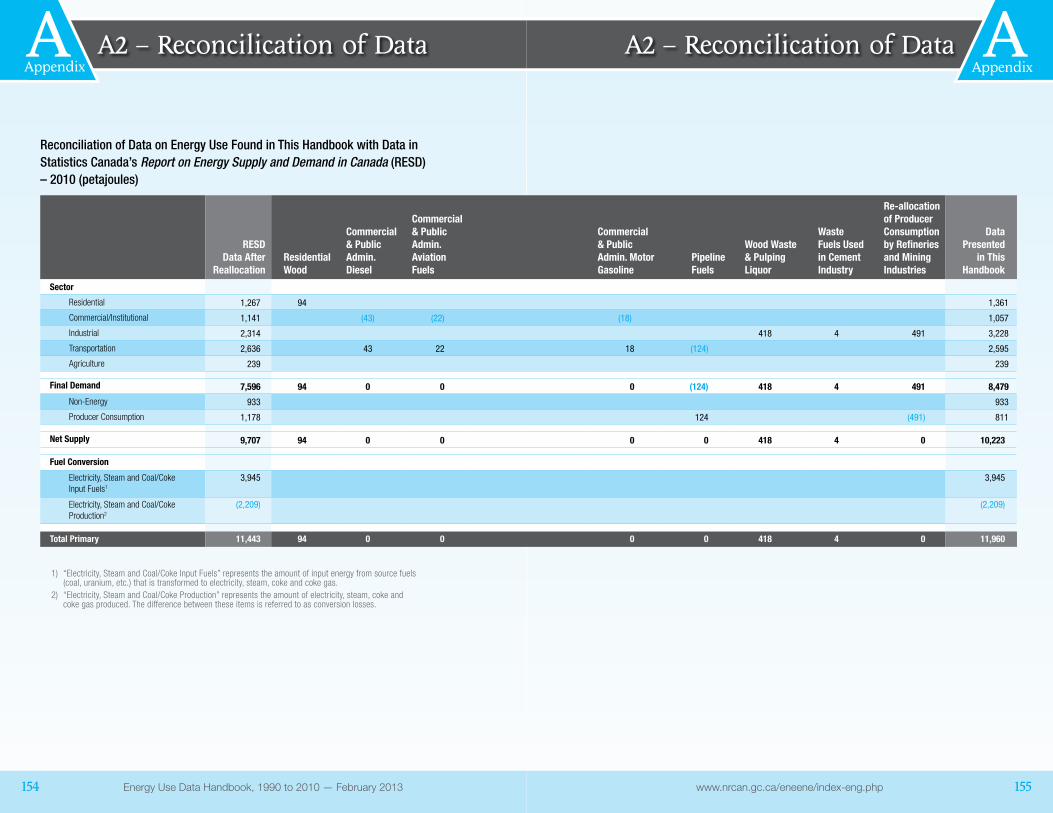
A2 – Reconcilication of Data A2 – Reconcilication of Data AA
www.nrcan.gc.ca/eneene/index-eng.phpEnergy Use Data Handbook, 1990 to 2010 — February 2013154 155
Appendix Appendix
1) “Electricity, Steam and Coal/Coke Input Fuels” represents the amount of input energy from source fuels (coal, uranium, etc.) that is transformed to electricity, steam, coke and coke gas.
2) “Electricity, Steam and Coal/Coke Production” represents the amount of electricity, steam, coke and coke gas produced. The difference between these items is referred to as conversion losses.
Reconciliation of Data on Energy Use Found in This Handbook with Data in Statistics Canada’s Report on Energy Supply and Demand in Canada (RESD) – 2010 (petajoules)
RESD Data After
ReallocationResidential Wood
Commercial & Public Admin. Diesel
Commercial & Public Admin. Aviation Fuels
Commercial & Public Admin. Motor Gasoline
Pipeline Fuels
Wood Waste & Pulping Liquor
Waste Fuels Used in Cement Industry
Re-allocation of Producer Consumption by Refineries and Mining Industries
Data Presented
in This Handbook
Sector
Residential 1,267 94 1,361
Commercial/Institutional 1,141 (43) (22) (18) 1,057
Industrial 2,314 418 4 491 3,228
Transportation 2,636 43 22 18 (124) 2,595
Agriculture 239 239
Final Demand 7,596 94 0 0 0 (124) 418 4 491 8,479
Non-Energy 933 933
Producer Consumption 1,178 124 (491) 811
Net Supply 9,707 94 0 0 0 0 418 4 0 10,223
Fuel Conversion
Electricity, Steam and Coal/Coke Input Fuels1
3,945 3,945
Electricity, Steam and Coal/Coke Production2
(2,209) (2,209)
Total Primary 11,443 94 0 0 0 0 418 4 0 11,960

Appendix B – Reconciliation of Definitions B
www.nrcan.gc.ca/eneene/index-eng.php 157
Reconciliation of Definitions for Estimated Greenhouse Gas Emissions Found in This Handbook with Environment Canada’s National Inventory Report 1990–2010 2
IntroductionInthishandbook,Energy Use Data Handbook 1990 to 2010(EUDH),thedataon greenhouse gas (GHG) emissions are estimated using emissions factors developed by Environment Canada (EC). The emissions estimates provided here mirror the sectoral definitions used to calculate the estimates presented in EC’s National Inventory Report 1990–2010(NIR-2010).BothNaturalResourcesCanada (NRCan) and EC use the energy demand data from StatisticsCanada’s Report on Energy Supply and Demand in Canada as a base.
However, the two organizations use different sectoral mappings. EC prepares itsemissionsinventoryaccordingtothespecificationsoftheIntergovernmentalPanel on Climate Change, while NRCan has developed mapping that is more suited to energy end-use analysis.
The objective of this appendix is to help readers understand the similarities anddifferencesbetweenEUDHandNIR2010emissionsestimatesforthefive sectors covered in this handbook.
Residential Sector TheEUDHandNIR-2010differintheirdefinitionsofresidentialemissions:
•EUDHresidentialemissions includeend-useelectricity-relatedemissions,whicharereportedunderpowergenerationinNIR-2010.
•Woodenergyusediffers(EC’sestimateislargerthanNRCan’s).Hence,theGHG emissions related to wood energy use presented here are lower than thoseinNIR-2010.
2 Canada’s official GHG inventory is available on the Environment Canada Web site at http://ec.gc.ca/ges-ghg/default.asp?lang=En&n=8BAF9C6D-1

Reconciliation of Definitions Reconciliation of Definitions BAppendix
BAppendix
www.nrcan.gc.ca/eneene/index-eng.phpEnergy Use Data Handbook, 1990 to 2010 — February 2013158 159
Transportation SectorThe EUDH and NIR-2010 differ in their definitions of transportationemissions:
•NIR-2010 re-allocates industrial and agriculture diesel and agriculturemotor gasoline to the transportation sector.
•NIR-2010includespipeline-relatedemissionsinthetransportationsector.
•NIR-2010excludesemissionsresultingfromtheuseofenergyintheforeignaviation and marine sub-sectors.
•EUDH transportation emissions include end-use electricity-relatedemissions,whicharereportedunderpowergenerationinNIR-2010.
Electricity Generation SectorThere is only one difference between the EUDH and NIR-2010 for theelectricity generation sector.
•NIR-2010reportsemissionsfromelectricityandsteamgenerationattheaggregatelevel,whiletheEUDHreportsemissionsforelectricitygenerationonly.Note that in itsAnnex 9“Electricity IntensityTables,”NIR-2010reports detailed emissions from electricity generation that are similar to those found in this handbook.
Commercial/Institutional SectorThereisonlyonedifferencebetweenEUDHandNIR-2010definitionsofcommercial/institutional emissions:
•EUDH commercial/institutional emissions include end-use electricity-relatedemissions,whichNIR-2010includesunderpowergeneration.
Industrial SectorTherearemanydifferencesbetweenEUDHandNIR-2010definitionsofthe industrial sector:
•NIR-2010 re-allocates industrial diesel fuel use from the industrialsector to the transportation sector.
•This handbook re-allocates producers’ consumption of petroleumproducts from the producers’ consumption category to the petroleum refining and upstream mining industries. NIR-2010 reports this asconsumption of fossil fuels.
•NIR-2010 re-allocates industrial coke use from energy use in theindustrial sector to non-energy use in industrial processes.
•EUDHindustrialemissionsincludeend-useelectricity-relatedemissions.NIR-2010reportsthemunderpowergeneration.
•NIR-2010 includes producers’ consumption of non-fossil fuels in thefossilfuelcategories.TheEUDHdoesnotreportthisconsumption.
•NIR-2010 also re-allocates estimates of emissions from upstream oiland gas flaring to fugitive emissions from the fossil fuel sector.

Appendix C – Glossary of Terms C
www.nrcan.gc.ca/eneene/index-eng.php 161
Activity: Term used to characterize major drivers of energy use in a sector (e.g. floor space area in the commercial/institutional sector).
AECO-C Hub: Ahubisamarketcentrewhereseveralpipelinesinterconnectand where many buyers and sellers trade gas, thereby creating a liquid pricing point.TheAECO-ChubisthemainpricingpointforAlbertanaturalgasandrepresents the major pricing point for Canadian gas. Prices are determined via the spot market, which includes all transactions for sales of 30 days or less, but it typically refers to a 30-day sale.
Agriculture: The agriculture sector includes all types of farms, including livestock, field crops, grain and oilseed farms, as well as activities related to hunting and trapping. Energy used in this sector is for farm production and includes energy use by establishments engaged in agricultural activities and inprovidingservices toagriculture.Agricultureenergyuse is included intotal secondary energy use for Canada.
Apartment: This type of dwelling includes dwelling units in apartment blocks or apartment hotels; flats in duplexes or triplexes (i.e. where the division between dwelling units is horizontal); suites in structurally converted houses; living quarters located above or in the rear of stores, restaurants, garages or other business premises; caretakers’ quarters in schools, churches, warehouses, etc.; and private quarters for employees in hospitals or other types of institutions.
Appliance: Energy-consuming equipment used in the home for purposes otherthanairconditioning,centralizedwaterheatingandlighting.Includescooking appliances (gas stoves and ovens, electric stoves and ovens, microwave ovens, and propane or gas grills); cooling appliances (evaporative coolers, attic fans, window or ceiling fans, and portable or table fans); and refrigerators, freezers, clothes washers and dishwashers. Other appliances include small ones such as televisions, video cassette recorders, digital video disc players, radios, computers and toasters.

Glossary of Terms Glossary of Terms CAppendix
CAppendix
www.nrcan.gc.ca/eneene/index-eng.phpEnergy Use Data Handbook, 1990 to 2010 — February 2013162 163
Cooling Degree-Day (CDD): Ameasureofhowhotalocationwasoveraperiod,relativetoabasetemperature.Inthishandbook,thebasetemperatureis18.0°Candtheperiodisoneyear.Ifthedailyaveragetemperatureexceedsthebasetemperature,thenumberofcoolingdegree-days(CDDs)forthatdayis the difference between the two temperatures. However, if the daily average isequaltoorlessthanthebasetemperature,thenumberofCDDsforthatdayiszero.ThenumberofCDDsforalongerperiodisthesumofthedailyCDDsforthedaysinthatperiod.
Cooling Degree-Day Index: Ameasureofhowrelativelyhot(orcold)ayearwaswhencomparedwiththecoolingdegree-day(CDD)average.WhentheCDD index is above (below)1, theobserved temperature iswarmer(colder)thannormal.TheCDDnormalrepresentsaweightedaverageofthe1951–1980CDDsobservedinanumberofweatherstationsacrossCanada.Itsvaluevariesfromyeartoyearbecauseofpopulationflow.
Dwelling: Adwellingisdefinedasastructurallyseparatesetoflivingpremiseswith a private entrance from outside the building or from a common hallway orstairwayinside.Aprivatedwellingisoneinwhichoneperson,afamilyorother small group of individuals may reside, such as a single house or apartment.
Electricity Conversion Loss: The energy lost during the conversion from primary energy (petroleum, natural gas, coal, hydro, uranium and biomass) into electrical energy. Losses occur during generation, transmission and distribution of electricity and include plant and unaccounted-for uses.
End-Use: Anyspecificactivitythatrequiresenergy(e.g.refrigeration,spaceheating, water heating, manufacturing processes and feedstock).
Energy Intensity: The amount of energy use per unit of activity. Examples of activity measures in this report are households, floor space, passenger-kilometres, tonne-kilometres, physical units of production and constant dollar value of gross domestic product.
Energy Source: Anysubstancethatsuppliesheatorpower(e.g.petroleum,natural gas, coal, renewable energy and electricity), including the use of a fuel as a non-energy feedstock.
Auxiliary Equipment: Withtheexceptionofauxiliarymotors(seeAuxiliaryMotors),“auxiliaryequipment” includesstand-aloneequipmentpowereddirectly from an electrical outlet, such as computers, photocopiers, refrigerators anddesktoplamps.Italsoincludesequipmentthatcanbepoweredbynaturalgas, propane or other fuels, such as clothes dryers and cooking appliances.
Auxiliary Motors: Refers to devices used to transform electric power into mechanical energy in order to provide a service, such as pumps, ventilators, compressors and conveyors.
Biomass: Includeswoodwasteandpulpingliquor.Woodwasteisafuelconsisting of bark, shavings, sawdust and low-grade lumber and lumber rejects from the operation of pulp mills, sawmills and plywood mills. Pulping liquor is a substance primarily made up of lignin and other wood constituents andchemicalsthatareby-productsofthemanufactureofchemicalpulp.Itcan produce steam for industrial processes when burned in a boiler and/or produce electricity through thermal generation.
Capacity Utilization: The rates of capacity use are measures of the intensity withwhichindustriesusetheirproductioncapacity.Itistheratioofanindustry’s actual output to its estimated potential output.
Carbon Dioxide (CO2): Acompoundofcarbonandoxygenformedwhenevercarbon is burned. Carbon dioxide (CO2) is a colourless gas that absorbs infraredradiation,mostlyatwavelengthsbetween12and18microns. Itbehaves as a one-way filter, allowing incoming, visible light to pass through in one direction while preventing outgoing infrared radiation from passing in the opposite direction. The one-way filtering effect of CO2 causes an excess of the infrared radiation to be trapped in the atmosphere; thus it acts as a “greenhouse”andhasthepotentialtoincreasethesurfacetemperatureofthe planet (see Greenhouse Gas).
Company Average Fuel Consumption (CAFC): The Government of Canada encourages improvements in the fuel efficiency of the Canadian new vehicle fleet by setting voluntary annual company average fuel consumption goals for vehicle manufacturers and importers.

Glossary of Terms Glossary of Terms CAppendix
CAppendix
www.nrcan.gc.ca/eneene/index-eng.phpEnergy Use Data Handbook, 1990 to 2010 — February 2013164 165
Floor Space (area): Theareaenclosedbyexteriorwallsofabuilding.Intheresidential sector, it excludes parking areas, basements or other floors below ground level; these areas are included in the commercial/institutional sector. Itismeasuredinsquaremetres.
Gigajoule (GJ): One gigajoule equals 1 × 10⁹ joules (see Petajoule).
Greenhouse Gas (GHG): Agreenhousegas(GHG)absorbsandradiatesheat in the lower atmosphere that otherwise would be lost in space. The greenhouse effect is essential for life on this planet, since it keeps average global temperatures high enough to support plant and animal growth. The main GHGs are carbon dioxide (CO2), methane (CH4), chlorofluorocarbons (CFCs) and nitrous oxide (N2O). By far the most abundant GHG is CO2, accountingforabout70percentoftotalGHGemissions(seeCarbonDioxide).
Greenhouse Gas Intensity of Energy: The amount of greenhouse gases emitted per unit of energy used.
Gross Domestic Product (GDP): The total value of goods and services producedwithinCanadaduringagivenyear.Alsoreferredtoasannualeconomic output or, more simply, output. To avoid counting the same output morethanonce,grossdomesticproduct(GDP)includesonlyfinalgoodsandservices–notthosethatareusedtomakeanotherproduct.GDPfiguresarereported in constant 2002 dollars.
Gross Output (GO): The total value of goods and services produced by an industry.Itisthesumoftheindustry’sshipmentsplusthechangeinvaluedue to labour and capital investment. Gross output figures are reported in constant 2002 dollars.
Heat Gain: Heat gained by a building from the operation of appliances. These heat gains reduce the space heating load in the winter and increase the space cooling load in the summer.
Heat Loss: Represents the amount of energy released as heat by an appliance or piece of equipment while it is in operation.
Heating Degree-Day (HDD): Ameasureofhowcoldalocationwasoveraperiod,relativetoabasetemperature.Inthishandbook,thebasetemperatureis18.0°Candtheperiodisoneyear.Ifthedailyaveragetemperatureisbelowthebasetemperature,thenumberofheatingdegree-days(HDDs)forthatday is the difference between the two temperatures. However, if the daily average temperature is equal to or higher than the base temperature, the numberofHDDsforthatdayiszero.ThenumberofHDDsforalongerperiodisthesumofthedailyHDDsforthedaysinthatperiod.
Heating Degree-Day Index: Ameasureofhowrelativelycold(orhot)ayearwaswhencomparedwiththeheatingdegree-day(HDD)average.WhentheHDDindexisabove(below)1,theobservedtemperatureiscolder(warmer)thannormal.TheHDDnormalrepresentsaweightedaverageofthe 1951–1980HDDs observed in a number ofweather stations acrossCanada.Itsvaluevariesfromyeartoyearbecauseofpopulationflow.
Heavy Truck: Atruckwithagrossvehicleweightthat ismorethan,orequalto,14970kilograms(kg)(33001pounds[lb.]).Thegrossvehicleweight is the weight of the empty vehicle plus the maximum anticipated load weight.
Household: Apersonoragroupofpeopleoccupyingonedwellingunitisdefined as a household. The number of households will, therefore, be equal to the number of occupied dwellings.
Housing Stock: The physical number of dwellings is referred to as the housingstock.Asopposedtothenumberofhouseholds,whichreferstothenumber of occupied dwellings, housing stock includes both occupied and unoccupied dwellings.
Kilowatt-hour (kWh): The commercial unit of electricity energy equivalent to1000watt-hours.Akilowatt-hourcanbestbevisualizedastheamountof electricity consumed by ten 100-watt bulbs burning for an hour. One kilowatt-hour equals 3.6 million joules (see Watt).
Light Truck: Atruckofupto3855kg(8500lb.)ofgrossvehicleweight.Thegross vehicle weight is the weight of the empty vehicle plus the maximum anticipated load weight. This class of vehicles includes pickup trucks, minivans and sport utility vehicles.

Glossary of Terms Glossary of Terms CAppendix
CAppendix
www.nrcan.gc.ca/eneene/index-eng.phpEnergy Use Data Handbook, 1990 to 2010 — February 2013166 167
Pulping Liquor: Asubstanceprimarilymadeupof lignin,otherwoodconstituents and chemicals that are by-products of the manufacture of chemical pulp.Itcanproducesteamforindustrialprocesseswhenburnedinaboilerand/or produce electricity through thermal generation.
Sector: The broadest category for which energy consumption and intensity are considered within the Canadian economy (e.g. residential, commercial/institutional, industrial, transportation, agriculture and electricity generation).
Single Attached (dwelling): Each half of a semi-detached (double) house and each section of a row or terrace are defined as single attached dwellings. Asingledwellingattachedtoanon-residentialstructurealsobelongstothiscategory.
Single Detached (dwelling): This type of dwelling is commonly called a single house (i.e. a house containing one dwelling unit and completely separated on all sides from any other building or structure).
Space Cooling: Conditioning of room air for human comfort by a refrigeration unit (e.g. air conditioner or heat pump) or by the circulation of chilled water through a central- or district-cooling system.
Space Heating: The use of mechanical equipment to heat all or part of a building.Includestheprincipalspaceheatingunitandanysupplementaryequipment.
Standard Industrial Classification (SIC): Aclassificationsystemthatcategorizes establishments into groups with similar economic activities.
Terajoule (TJ): One terajoule equals 1 × 10¹² joules (see Petajoule).
Tonne-kilometre (Tkm): Anactivitymeasureforthefreighttransportationsub-sector describing the transportation of one tonne over a distance of one kilometre.
Vintage: The year of origin or age of a unit of capital stock (e.g. a building or a car).
Liquefied Petroleum Gases (LPG) and Gas Plant Natural Gas Liquids (NGL): Propane and butane are liquefied gases extracted from natural gas (i.e. gas plant NGL) or from refined petroleum products (i.e. LPG) at the processing plant.
Medium Truck: A truck with a gross vehicle weight ranging from3856to14969kg(8501to33000lb.).Thegrossvehicleweight is theweight of the empty vehicle plus the maximum anticipated load weight.
Megajoule (MJ): One megajoule equals 1 × 10⁶ joules (see Petajoule).
Mobile Home: Amoveable dwelling designed and constructed to betransported by road on its own chassis to a site and placed on a temporary foundation(suchasblocks,postsorapreparedpad).Ifrequired,itcanbemoved to a new location.
Model Year: Anannualperiodinwhichanationalautomotiveindustryorganizes its operations and within which new models are announced. For example,ifthe“modelyear”is2004,itbeginsSeptember1,2003,andendsAugust31,2004.
Multifactor Productivity: The ratio of output per unit of combined inputs (capital services and labour services).
North American Industry Classification System (NAICS): Aclassificationsystem that categorizes establishments into groups with similar economic activities.ThestructureoftheNorthernAmericanIndustryClassificationSystem,adoptedbyStatisticsCanadain1997toreplacethe1980StandardIndustrialClassification,wasdevelopedbythestatisticalagenciesofCanada,MexicoandtheUnitedStates.
Passenger-kilometre (Pkm): An activity measure in the passengertransportation sub-sector describing the transportation of one passenger over a distance of one kilometre.
Petajoule (PJ): One petajoule equals 1 x 10¹⁵ joules.A joule is theinternational unit of measure of energy – the energy produced by the power of one watt flowing for a second. There are 3.6 million joules in one kilowatt-hour (see Kilowatt-hour).

Appendix D – List of Abbreviations D
www.nrcan.gc.ca/eneene/index-eng.php 169
Glossary of TermsCAppendix
Energy Use Data Handbook, 1990 to 2010 — February 2013168
$2002bbl.
CAFCCANSIM
CEUMCIEEDAC
ECEERGDP GHG
GJ GO
GWhkmkW
kWh L
LPGm2
m3 MJ
Mt of CO2eNAICSn.e.c.NEUD
NGLNRCan
OEEPJ
PkmRESDREUMSEER
SICTEUM
TJ TkmUEC
WWh
Constant 2002 dollarsBarrelCompany Average Fuel ConsumptionCanadian Socio-Economic Information Management SystemCommercial/Institutional End-Use ModelCanadian Industrial Energy End-Use Data and Analysis CentreEnvironment CanadaEnergy Efficiency Ratio Gross Domestic ProductGreenhouse GasGigajoule = 1 × 10⁹ joulesGross OutputGigawatt-hour = 1 × 10⁹ Wh KilometreKilowattKilowatt-hour = 1 × 10³ WhLitreLiquefied Petroleum Gases Square MetreCubic MetreMegajoule = 1 × 10⁶ joulesMegatonne of Carbon Dioxide Equivalent = 1 × 10⁶ tonnes North American Industry Classification SystemNot Elsewhere Classified National Energy Use DatabaseNatural Gas Liquids Natural Resources CanadaOffice of Energy EfficiencyPetajoule = 1 × 10¹⁵ joulesPassenger-kilometreReport on Energy Supply and Demand in CanadaResidential End-Use ModelSeasonal Energy Efficiency Ratio Standard Industrial ClassificationTransportation End-Use ModelTerajoule = 1 × 10¹² joulesTonne-kilometreUnit Energy Consumption WattWatt-hour
Waste Fuel: Anameappliedtoanynumberofenergysourcesotherthanconventionalfuelsusedinthecementindustry.Itincludesmaterialssuchastires, municipal waste and landfill off-gases.
Water Heater: Anautomaticallycontrolledvesseldesignedforheatingwaterand storing heated water.
Water Heating: The use of energy to heat water for hot running water, as well as the use of energy to heat water on stoves and in auxiliary water heating equipment for bathing, cleaning and other non-cooking applications.
Watt (W): Ameasureofpower.Forexample,a40-wattlightbulbuses40wattsof electricity (see Kilowatt-hour).
Wood Waste: Fuel consisting of bark, shavings, sawdust, low-grade lumber and lumber rejects from the operation of pulp mills, sawmills and plywood mills.


Natural Resources Canada’s Office of Energy EfficiencyLeading Canadians to Energy Efficiency at Home,
at Work and on the Road