Embed Size (px)
Citation preview

Energy use and usage perceptions in the Niger Delta
Stakeholder Democracy Network
A survey carried out for the SUNGAS project

2 Survey on energy uSe and uSage perceptionS in the niger delta
First published by the International Institute for Environment and Development 2011.
Authors
Olumide Oyebamiji, Stakeholder Democracy Network
Rita Kigbara. Stakeholder Democracy Network
The SUNGAS project
The SUNGAS project aims to catalyse development of Nigeria’s natural gas and renewable energy markets through innovation, demonstration, policy dialogue and advocacy. Small demonstration projects for both renewables and gas-to-power will show that community-based energy facilities are technically viable, financially sustainable, and can ensure better access to modern energy services for rural communities. The project is funded by the European Union and is being implemented by the International Institute for Environment and Development (IIED), the Niger Delta Wetlands Centre (NDWC) and the Living Earth Foundation (LEF).
This publication has been produced with the financial assistance of the European Union. However, the contents of the publication are the sole responsibility of the SUNGAS project partners.
For further information please contact:
Emma Wilson, International Institute for Environment and Development (IIED), 80–86 Gray’s Inn Road, London WC1X 8NH, UK. Tel: +44 (0)20 3463 7399; Fax: +44 (0)20 3514 9055 E-mail: [email protected]
3
TABLE OF CONTENTS
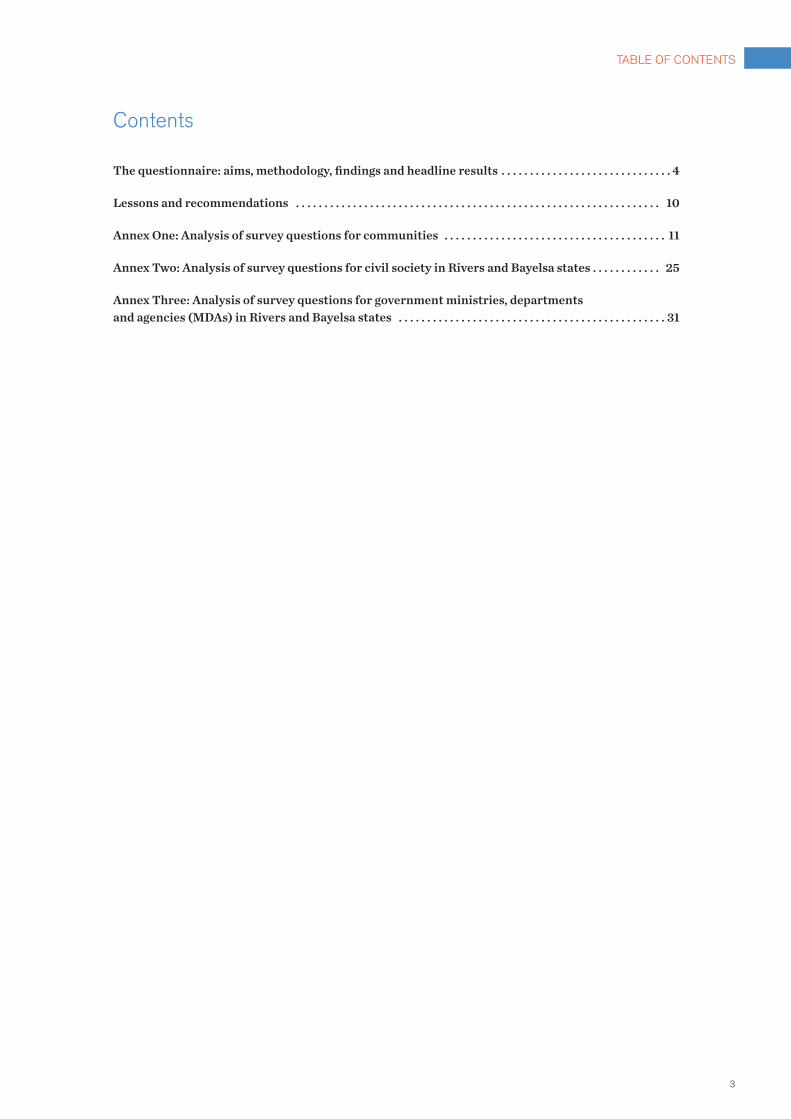
Contents
The questionnaire: aims, methodology, findings and headline results � � � � � � � � � � � � � � � � � � � � � � � � � � � � � � 4
Lessons and recommendations � � � � � � � � � � � � � � � � � � � � � � � � � � � � � � � � � � � � � � � � � � � � � � � � � � � � � � � � � � � � � � � � 10
Annex One: Analysis of survey questions for communities � � � � � � � � � � � � � � � � � � � � � � � � � � � � � � � � � � � � � � � 11
Annex Two: Analysis of survey questions for civil society in Rivers and Bayelsa states � � � � � � � � � � � � 25
Annex Three: Analysis of survey questions for government ministries, departments and agencies (MDAs) in Rivers and Bayelsa states � � � � � � � � � � � � � � � � � � � � � � � � � � � � � � � � � � � � � � � � � � � � � � � 31
4 Survey on energy uSe and uSage perceptionS in the niger delta
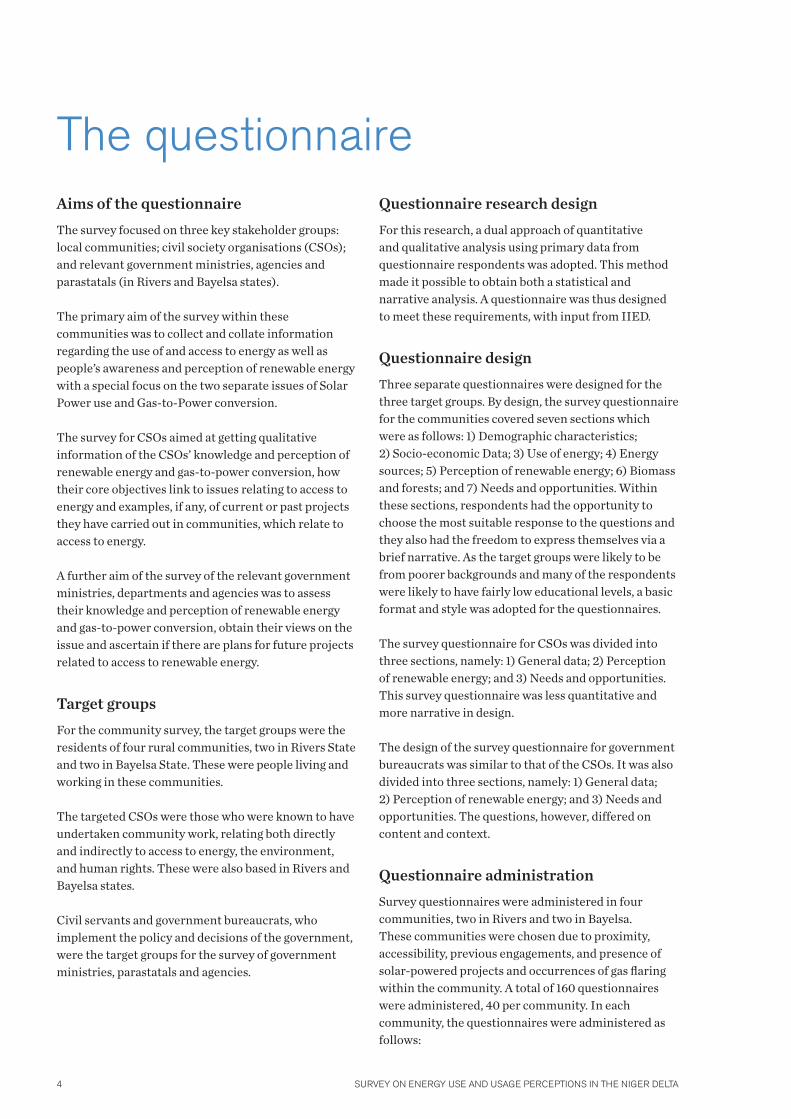
Aims of the questionnaire
The survey focused on three key stakeholder groups: local communities; civil society organisations (CSOs); and relevant government ministries, agencies and parastatals (in Rivers and Bayelsa states).
The primary aim of the survey within these communities was to collect and collate information regarding the use of and access to energy as well as people’s awareness and perception of renewable energy with a special focus on the two separate issues of Solar Power use and Gas-to-Power conversion.
The survey for CSOs aimed at getting qualitative information of the CSOs’ knowledge and perception of renewable energy and gas-to-power conversion, how their core objectives link to issues relating to access to energy and examples, if any, of current or past projects they have carried out in communities, which relate to access to energy.
A further aim of the survey of the relevant government ministries, departments and agencies was to assess their knowledge and perception of renewable energy and gas-to-power conversion, obtain their views on the issue and ascertain if there are plans for future projects related to access to renewable energy.
Target groups
For the community survey, the target groups were the residents of four rural communities, two in Rivers State and two in Bayelsa State. These were people living and working in these communities.
The targeted CSOs were those who were known to have undertaken community work, relating both directly and indirectly to access to energy, the environment, and human rights. These were also based in Rivers and Bayelsa states.
Civil servants and government bureaucrats, who implement the policy and decisions of the government, were the target groups for the survey of government ministries, parastatals and agencies.
Questionnaire research design
For this research, a dual approach of quantitative and qualitative analysis using primary data from questionnaire respondents was adopted. This method made it possible to obtain both a statistical and narrative analysis. A questionnaire was thus designed to meet these requirements, with input from IIED.
Questionnaire design
Three separate questionnaires were designed for the three target groups. By design, the survey questionnaire for the communities covered seven sections which were as follows: 1) Demographic characteristics; 2) Socio-economic Data; 3) Use of energy; 4) Energy sources; 5) Perception of renewable energy; 6) Biomass and forests; and 7) Needs and opportunities. Within these sections, respondents had the opportunity to choose the most suitable response to the questions and they also had the freedom to express themselves via a brief narrative. As the target groups were likely to be from poorer backgrounds and many of the respondents were likely to have fairly low educational levels, a basic format and style was adopted for the questionnaires.
The survey questionnaire for CSOs was divided into three sections, namely: 1) General data; 2) Perception of renewable energy; and 3) Needs and opportunities. This survey questionnaire was less quantitative and more narrative in design.
The design of the survey questionnaire for government bureaucrats was similar to that of the CSOs. It was also divided into three sections, namely: 1) General data; 2) Perception of renewable energy; and 3) Needs and opportunities. The questions, however, differed on content and context.
Questionnaire administration
Survey questionnaires were administered in four communities, two in Rivers and two in Bayelsa. These communities were chosen due to proximity, accessibility, previous engagements, and presence of solar-powered projects and occurrences of gas flaring within the community. A total of 160 questionnaires were administered, 40 per community. In each community, the questionnaires were administered as follows:
The questionnaire

5
THE QUESTIONNAIRE
a) Women – including businesswomen/teachers/health care workers
b) Council of chiefs/elders c) Community Development Council (CDC) –
including businessmen, etc.d) Youths e) Business/enterprise (welding machines, tailors,
hair-dressers) – including, e.g. women, chiefs, youth owning or working businesses
f ) Teachers g) Health care h) Farmers
The majority of the populations of these communities represented an ethnic mix which included: Ogoni; Ekpeye; Ijaw; and Itsekiri amongst others.
The survey questionnaires for CSOs were administered to CSOs and NGOs based in Rivers and Bayelsa states. In Rivers State, six CSOs were chosen, namely: Social Action, Centre for Environment Human Right and Development (CEHRD), Movement for the Survival of Ogoni People (MOSOP), Environmental Rights Action (ERA), Pro-natural International and Gender and Development Action (GADA). Two questionnaires were administered in each organisation.
In Bayelsa, seven CSOs were chosen, namely: Golden Planet Foundation (GPF), Peacemaker International, Development Initiators, Health Living Initiatives International, Benny’s Development Initiative, Operation Rescue, and Family Welfare Foundation (FWF).
Questionnaire administration for the government ministries, parastatals and agencies was done in Rivers and Bayelsa states. In Rivers State, the targeted MDAs were the Ministries of Environment, Works, Power, Energy and Natural Resources, Information, Niger Delta Affairs, Water Resources and Rural Development, Power Holding Company of Nigeria (PHCN), and the Niger Delta Development Corporation (NDDC).
In Bayelsa State, the targeted MDAs were the Ministries of Health, Environment, Information, Water Resources, Justice, Energy, and Women Affairs (Gender and Social Development) and the Bayelsa State Water Board.
Field teams
A survey team of four members were engaged to carry out the exercise over a period of four weeks. Each member of the team was involved in the administration of the questionnaires in the communities, CSOs and
government MDAs. It took an average of three days to administer the questionnaires in each community.
The questionnaire for the communities contained 72 questions, lasting approximately 40 minutes. The questionnaire for CSOs contained 23 questions and the survey usually lasted for about 20 minutes per questionnaire. The survey questionnaire for government bureaucrats had only 16 questions and it took between 15 and 20 minutes to complete. Due to bureaucracies present in government MDAs and the nature of the work of its officials, occasionally it became necessary for the team to leave copies of the questionnaires with these officials, for the officials to complete and be collected later.
Sampling technique
A Purposive Random Sampling technique was adopted for this survey because an indiscriminative sample could be collected without diverting from the primary target groups. The questionnaires were administered purposively to three groups: residents of the communities selected from the categories listed in above; high ranking civil servants with decision making/implementing powers; project officers of CSOs. These groups of people were considered the most appropriate for this study as they were in the most appropriate position to provide the relevant data needed.
Within the community ‘randomness’ was ensured by targeting community dwellers and/or workers systematically, which also helped to capture the views of the different groups in the community.
Data analysis
Descriptive Statistical and Graphical Analysis (range, mean, percentages, and charts) was used for data analysis. This method was adopted, not only for its simplicity in understanding, but also its reliability in verification as they provide useful qualitative information from quantitative data survey.
However, due to the fact that some of the data collected cannot to be subjected to statistical or graphical analysis, a descriptive analysis was used to analyse this information.
Research findings
The research findings are contained in Annexes One, Two, and Three

6 Survey on energy uSe and uSage perceptionS in the niger delta
Headline results
CommunitiesThe indicative headline results collected from surveying the four communities are detailed below:
The aggregated results showed that a significant majority (73.7%) of the respondents have lived in these communities for more than 10 years, with 35.6% having lived in their communities for over 20 years. This suggests that the respondents of this survey knew their communities and that they were in a good position to elicit the real/perceived needs of their respective communities.
Farming, fishing and trading (51.3%) still remain the economic mainstay of residents of these communities, although more individuals (25%) are becoming wage earners. The survey showed that expenses relating to education accounted for the largest part of the expenditure of most households in these communities.
Chart 1: Primary household expenses
Although these communities are currently connected to electricity, the main source of power according to the respondents is gas turbine as shown in Chart 2 below
Chart 2: Source of power
It should however be noted that the high figures for gas turbine is based on the unverified perception of many respondents as to the actual source of power provided by the Oil companies or other providers in their community. The generality of community people do not have access to oil company facilities and sites and hence easily assumed that oil companies generate electricity through gas turbines.
An interesting trend observed in the survey was that more people use generators in their homes rather than for business purposes. This is mainly due to the nature of most of the business operated in the communities which do not necessarily require constant power supply. Thus, people prefer to buy small generators for home use, for comfort and pleasure.
From the data collected, it was established that most community residents use kerosene stoves to cook.
60
50
40
30
20
10
0
32
Gas Turbine
Generator
PHCN
21.90%
46.90%
31.20%
Rent
Educa
tion
Health
r
Feedin
gFue
l
Trans
port
32
49
35
1924
33

7
THE QUESTIONNAIRE
Chart 3: Cooking preferences
On their knowledge of renewable energy it was ascertained that the most common type is solar.
It should be noted that most respondents had little knowledge of term ‘renewable’ and what the concept of renewable meant. Most respondents had not heard the word renewable but said they had heard of solar energy, especially as a source of street lighting.
Chart 4: Knowledge of renewable energy types
Other notable headline results included:
i. Hours of electricity supplied daily: 46.2% receive less than two hours of electricity supply daily.
ii. Average cost of fuel in the community: 50.5% said that they buy petrol for N65–N75 per litre, 37.5% respondents buy fuel for between N100–N150 per litre, and 12% said the price varies from N80 to N200.
iii. Amount spent on electricity monthly: 28.7% spend between N1,000.00–N5,000.00 per month on electricity
Kerosene stove
Firewood
Gas
Charcoal
Solar
Hydro Plant
Wind Power
Bio-fuel
No idea
Less than 2 hours
Up to 6 hours
Up to 12 hours
Steady – almost 24 hours
Below N1000
N1000–N5000
N5000–N10000
Above 10000
No expense
44.40%
8.10%
64.40%
1.90%
15%
17.50%73.70%
8.70%8.75%
5.60%
24.50%
46.20%
23.70%
38.10%
21.90%
28.70%
6.90%
4.40%

8 Survey on energy uSe and uSage perceptionS in the niger delta
iv. Willingness to pay more for a reliable power supply: 40.6% said they would be willing to pay more for a reliable power supply.
v. Knowledge of solar-powered projects: 60.6% said they had knowledge of solar-powered products.
Civil society organisationsThe indicative headline results collected from surveying of the four CSOs are detailed below.
i. There is a direct link between core objectives of most of the CSOs surveyed and the issues relating to access to energy. This is so because a large proportion (73.6%) of CSOs said that issues relating access to energy is intrinsic to the objectives of their organisation.
Chart 1: CSOs’ core objectives and direct link to access to energy
ii. More than 84% of CSOs interviewed have a basic knowledge of what renewables are. That is, they have heard of some form of renewable energy. The most common form known to them is solar energy. Eighty per cent of respondents agreed that solar is a practical form of local energy, saying that it can be used for street lights, for low industrial uses and for domestic use in the community. However, 20% of respondents said it is not practical given the poor maintenance culture of our society.
Chart 2: CSOs who have basic understanding of some form of renewable energy
Yes
No
Maybe
No response
Yes
No
No idea
Yes
No
Yes
No
A little
10.60%
32.50%
16.20%
40.60%
33.70%
60.60%
5.70%
73.60%
26.30%
10.50%
84.20%
5.30%
9
THE QUESTIONNAIRE
iii. All the CSOs surveyed said they were interested in joining a coalition for better access to energy.
Government ministries, departments and agenciesThe indicative headline results collected from surveying of the government MDAs are detailed below:
i. About 66.7% of the MDAs surveyed said that there is a direct link between their core objectives and issues relating to access to energy. However, only a small percentage of these could highlight the link.
ii. A large proportion of the respondents from MDAs had knowledge of renewable energy. Over 80% of respondents said they either had a good or some idea of renewable energy.
Chart 1: MDAs who have basic understanding of some form of renewable energy
iii. Only four respondents (Ministries of Water Resources, PHCN, Power and Environment) have an idea of their policy on access to energy and power. The remaining 17 respondents from the MDAs did not have an idea.
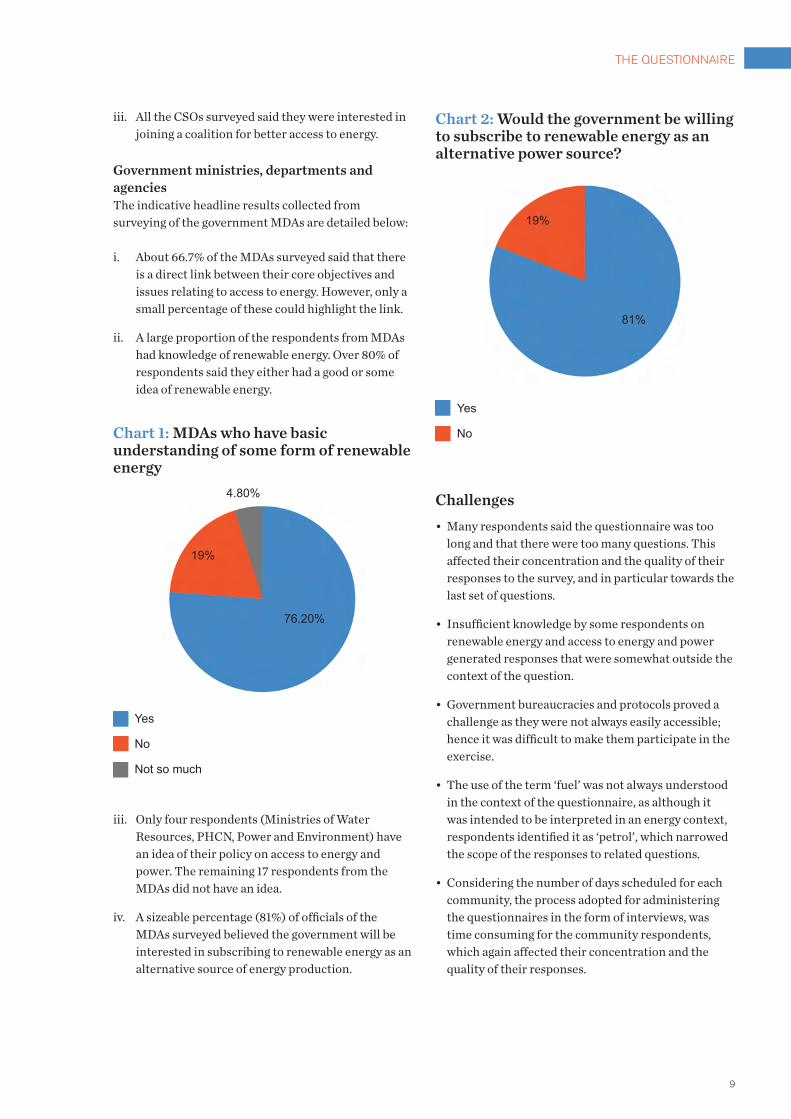
iv. A sizeable percentage (81%) of officials of the MDAs surveyed believed the government will be interested in subscribing to renewable energy as an alternative source of energy production.
Chart 2: Would the government be willing to subscribe to renewable energy as an alternative power source?
Challenges
• Many respondents said the questionnaire was too long and that there were too many questions. This affected their concentration and the quality of their responses to the survey, and in particular towards the last set of questions.
• Insufficient knowledge by some respondents on renewable energy and access to energy and power generated responses that were somewhat outside the context of the question.
• Government bureaucracies and protocols proved a challenge as they were not always easily accessible; hence it was difficult to make them participate in the exercise.
• The use of the term ‘fuel’ was not always understood in the context of the questionnaire, as although it was intended to be interpreted in an energy context, respondents identified it as ‘petrol’, which narrowed the scope of the responses to related questions.
• Considering the number of days scheduled for each community, the process adopted for administering the questionnaires in the form of interviews, was time consuming for the community respondents, which again affected their concentration and the quality of their responses.
Yes
No
Not so much
Yes
No
19%
76.20%
4.80%
81%
19%
10 Survey on energy uSe and uSage perceptionS in the niger delta
• As far as possible, questions for research questionnaires should be designed with less of a demand for analytical responses, as this avoids fatigue setting in. In addition, for the same reason of ensuring a higher quality of responses, questions that may seek the respondents’ opinion in comments or explanations should be placed earlier in the interviews. To tease out some of the opinions and lower fatigue, future research might benefit from combining shorter more focused surveys with focus groups to capture opinion/analytical type questions.
• There should be awareness-raising activities for all the groups interviewed, particularly for communities, on renewable energy so people can make informed decisions on the use of energy generally.
• Given the huge investment required for community solar projects such as boreholes, where these are
implemented a good number of the community members should at least show sufficient knowledge of their existence to create the desired ownership and responsibility for its sustainability. Members of such communities through their experiences would share perceptions based on what they know. More often than not, training and advocacy at project implementation are directed at community leaders, but there is often a failure by the leaders to propagate their new knowledge to other community members. Other forms of information dissemination may help here, such as town hall meetings and billboards (visuals).
• The efficiency and the long-term benefits of renewable energy need to be clearly understood by people. Awareness should be created to enhance its acceptability through a strong analysis of the comparative benefits of renewable energy compared to other energy types.
Lessons and recommendations

11
ANNEX ONE
Section 1: Demographic characteristics
1.3 Gender: Male – 93 (59%) Female – 67 (41%)
1.4 Age bracket: Below 18 years – 1 (0.62%) 18–39 years – 98 (62%) 40–60 years – 53 (34%) Above 60 years – 8 (5%)
1.5 Educational level: Below secondary – 20 (12.5%) Secondary – 82 (51.25%) Tertiary – 56 (35%) Postgraduate – 2 (1.25%)
1.7 Type of housing structure: House + concrete/brick – 145 (90.6%) House + mud – 13 (8.1%) Hut/thatch – 2 (1.3%) Batcher – 1 (0.1%)
Male
Female
59%
41%
Below 18 years
18–39 years
40–60 years
Above 60 years
34%
5%
62%
0.62%
Below secondary
Secondary
Tertiary
Postgraduate
35%
1.25%
51.25%
12.50%
House + concrete/brick
House + mud
Hut/thatch
Batcher
90.60%
8.10%
0.10%1.30%
Annex OneAnalysis of Survey Questions for Communities
Communities: Kaiama, Akala-Olu, Ogbia and Bodo.
12 Survey on energy uSe and uSage perceptionS in the niger delta
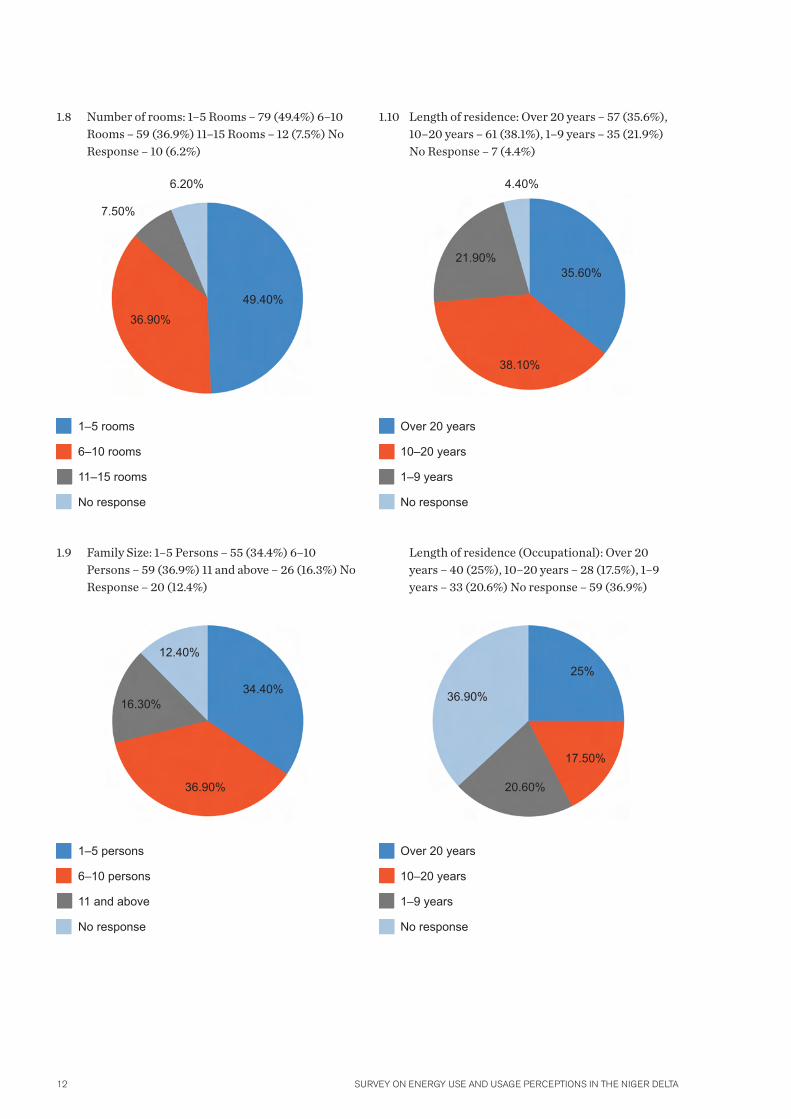
1.8 Number of rooms: 1–5 Rooms – 79 (49.4%) 6–10 Rooms – 59 (36.9%) 11–15 Rooms – 12 (7.5%) No Response – 10 (6.2%)
1.9 Family Size: 1–5 Persons – 55 (34.4%) 6–10 Persons – 59 (36.9%) 11 and above – 26 (16.3%) No Response – 20 (12.4%)
1.10 Length of residence: Over 20 years – 57 (35.6%), 10–20 years – 61 (38.1%), 1–9 years – 35 (21.9%) No Response – 7 (4.4%)
Length of residence (Occupational): Over 20 years – 40 (25%), 10–20 years – 28 (17.5%), 1–9 years – 33 (20.6%) No response – 59 (36.9%)
1–5 rooms
6–10 rooms
11–15 rooms
No response
Over 20 years
10–20 years
1–9 years
No response
36.90%
7.50%
49.40%
6.20%
38.10%
21.90%35.60%
4.40%
16.30%
12.40%
36.90%
34.40%
20.60%
36.90%
17.50%
25%
1–5 persons
6–10 persons
11 and above
No response
Over 20 years
10–20 years
1–9 years
No response
13
ANNEX ONE
Section 2: Socio-economic data
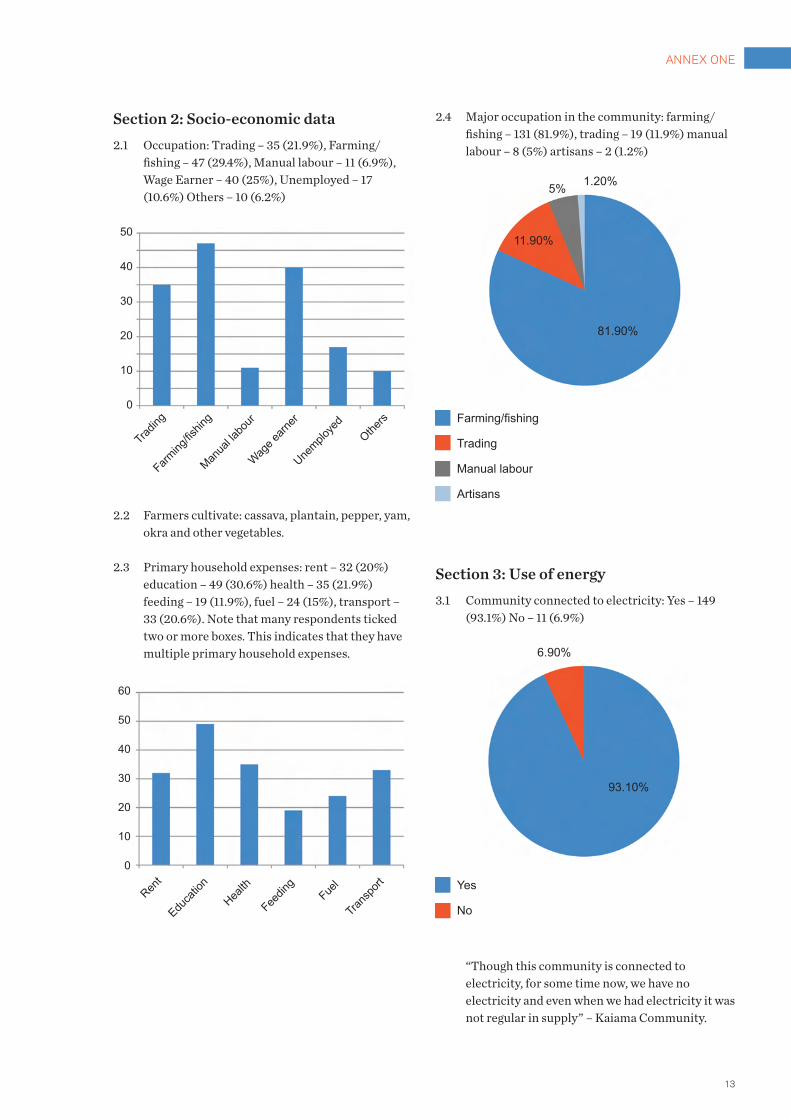
2.1 Occupation: Trading – 35 (21.9%), Farming/fishing – 47 (29.4%), Manual labour – 11 (6.9%), Wage Earner – 40 (25%), Unemployed – 17 (10.6%) Others – 10 (6.2%)
2.2 Farmers cultivate: cassava, plantain, pepper, yam, okra and other vegetables.
2.3 Primary household expenses: rent – 32 (20%) education – 49 (30.6%) health – 35 (21.9%) feeding – 19 (11.9%), fuel – 24 (15%), transport – 33 (20.6%). Note that many respondents ticked two or more boxes. This indicates that they have multiple primary household expenses.
2.4 Major occupation in the community: farming/fishing – 131 (81.9%), trading – 19 (11.9%) manual labour – 8 (5%) artisans – 2 (1.2%)
Section 3: Use of energy
3.1 Community connected to electricity: Yes – 149 (93.1%) No – 11 (6.9%)
“Though this community is connected to electricity, for some time now, we have no electricity and even when we had electricity it was not regular in supply” – Kaiama Community.
50
40
30
20
10
0
Tradin
g
Farming
/fishin
g
Manua
l labo
ur
Wage e
arner
Unemplo
yed
Others
Rent
Educa
tion
Health
Feedin
gFue
l
Trans
port
60
50
40
30
20
10
0
Farming/fishing
Trading
Manual labour
Artisans
93.10%
6.90%
11.90%
5%
81.90%
1.20%
Yes
No
14 Survey on energy uSe and uSage perceptionS in the niger delta
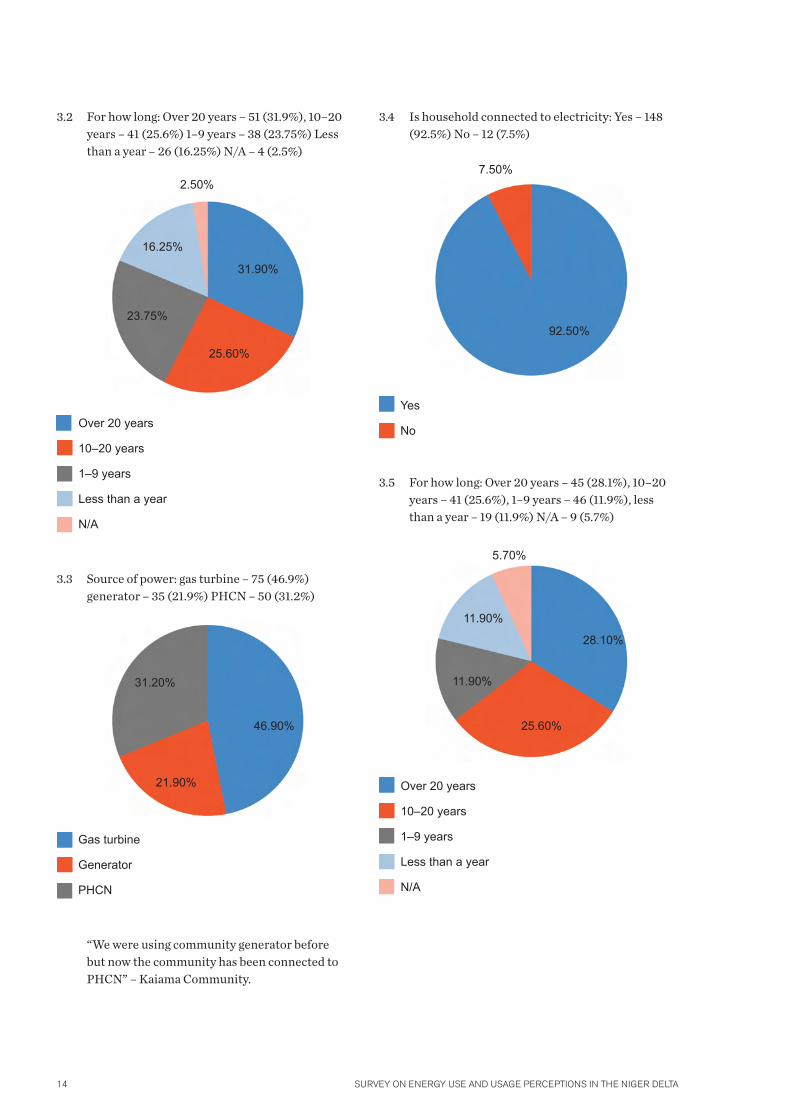
3.2 For how long: Over 20 years – 51 (31.9%), 10–20 years – 41 (25.6%) 1–9 years – 38 (23.75%) Less than a year – 26 (16.25%) N/A – 4 (2.5%)
3.3 Source of power: gas turbine – 75 (46.9%) generator – 35 (21.9%) PHCN – 50 (31.2%)
“We were using community generator before but now the community has been connected to PHCN” – Kaiama Community.
3.4 Is household connected to electricity: Yes – 148 (92.5%) No – 12 (7.5%)
3.5 For how long: Over 20 years – 45 (28.1%), 10–20 years – 41 (25.6%), 1–9 years – 46 (11.9%), less than a year – 19 (11.9%) N/A – 9 (5.7%)
Over 20 years
10–20 years
1–9 years
Less than a year
N/A
Over 20 years
10–20 years
1–9 years
Less than a year
N/A
Gas turbine
Generator
PHCN
Yes
No
16.25%
23.75%
31.90%
25.60%
2.50%
21.90%
46.90%
31.20%
11.90%
11.90%
28.10%
25.60%
5.70%
92.50%
7.50%

15
ANNEX ONE
3.6 Does availability of electricity contribute positively: Yes – 112 (70%), No – 38 (23.75%), Somewhat – 10 (6.25%)
3.7 How constant is electricity: Less than 2 hours – 74 (46.2%) Up to 6 hours – 38 (23.7%) Up to 12 hours – 9 (5.6%), Steady – almost 24 hours – 39 (24.5%)
“The Nigeria power holding syndrome has continued to prevail.” “Electricity is not regular at all. When we had electricity, it could last for six. hours in a day but in the last 3–5 months now, we have no electricity from PHC.” – Kaiama Community
3.8 Use of generator – home: Yes – 88 (55%), No – 72 (45%)
Use of generator – business: Yes – 16 (10%), No – 144 (90%)
Yes
No
Somewhat
Less than 2 hours
Up to 6 hours
Up to 12 hours
Steady – almost 24 hours
Yes
No
Yes
No
23.75%
70%
6.25%
5.60%
24.50%
23.70%
46.20%
55%
45%
90%
10%

16 Survey on energy uSe and uSage perceptionS in the niger delta
3.9 Number of hours generator is used per day: 1–2 hours – 6 (3.75%) 3–4 hours – 27 (16.9%) 6–8 hours – 49 (30.6%) Over 12 hours –12 (7.5%)
3.10 According to the respondents, the negative aspects of the generator are noise and air pollution, cost of purchase, maintenance and the high consumption of fuel.
“The noise is deafening and the cost outrageous. It’s such a nuisance and a source of pollution in addition to being expensive. Being an African child, I have had to live with such negative aspects from my childhood. The use of generator eats deep into my finances. The noise is also terrible mostly when it disturbs other people.”
3.11 Litres of fuel used per day: Less than 1 gallon (4 litres) – 24 (15%) 1 gallon – 32 (20%) 2 gallons – 26 (16.25%) 3 gallons – 13 (8.1%) 4 gallons and above – 8 (5%)
3.12 Fuel generally is sold at the filling station and by Local retailers, who are called ‘black marketers.’ Government marketers sold at N65 per litre while private marketers N70 and N75 respectively. Black marketers sold at N100.
50.5% said they buy petrol for N65–N75 N/litre, 37.5% respondents buy fuel between N100–N150 per litre, and 12% said the price varies from N80 to N200.
3.13 Distance travelled to for fuel: 52.5% (84) respondents said it’s “not far”/ “within the neighborhood”/ “nearby”. 35% (56) said it’s about a kilometer, while 12.5% (20) said it’s about 2 km or more.
3.14 Mode of Transport: Foot – 32 (20%) Okada (motor bike) – 96 (60%) Bicycle – 7 (4.4%) Mini bus/Car – 25 (15.6)
1–2 hours
3–4 hours
6–8 hours
Over 12 hours
35
30
25
20
15
10
5
0
Less
than
1 gall
on1 g
allon
2 gall
ons
3 gall
ons
4 gall
ons a
nd
abov
e
Foot
Okada (motor bike)
Bicycle
Mini bus/car
30.60%
7.50%
16.90%
3.75%
4.40%
15.60%
60%
20%

17
ANNEX ONE
3.15 Time spent buying fuel: Less than 1 hour – 86 (53.7%) More than 1 hour – 74 (46.3%)
3.16 Are there fuel shortages, if so how often? Yes – 129 (80.6%) No –31 (19.4%)
3.17 Causes of shortage: Some of the respondents identified the following as the likely causes of shortage: Tanker drivers strike; breakdown incidences at the refinery; deregulation; excessive demand by consumers and lack of importation of the fuel.
3.18 Primary fuel (kerosene, firewood and charcoal) needs: Cooking – 114 (71.2%), Lighting – 98 (61.2%), Transport – 44 (27.5%), Home business – 13 (8.1%)
Note that many respondents ticked two or more boxes. This indicates that they have multiple primary fuel needs.
3.19 Payment of electricity bills: Yes – 18 (11.3%) No – 142 (88.7%)
“I do not pay electricity bills because the community pays from its purse.” – Kaiama Community
Less than 1 hour
More than 1 hour
Yes
No
120
100
80
60
40
20
0
32
Yes
No
53.70%
46.30%
80.60%
19.40%
Cookin
g
Lighti
ng
Trans
port
Home b
usine
ss
88.70%
11.30%
18 Survey on energy uSe and uSage perceptionS in the niger delta
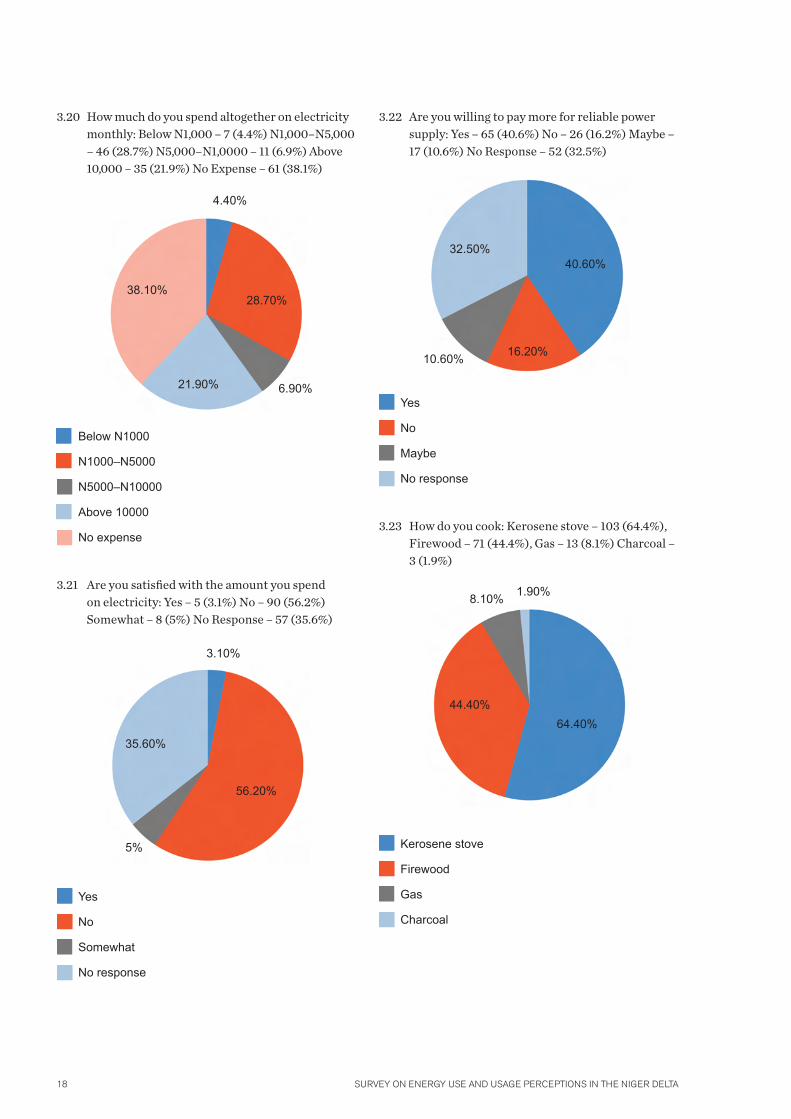
3.20 How much do you spend altogether on electricity monthly: Below N1,000 – 7 (4.4%) N1,000–N5,000 – 46 (28.7%) N5,000–N1,0000 – 11 (6.9%) Above 10,000 – 35 (21.9%) No Expense – 61 (38.1%)
3.21 Are you satisfied with the amount you spend on electricity: Yes – 5 (3.1%) No – 90 (56.2%) Somewhat – 8 (5%) No Response – 57 (35.6%)
3.22 Are you willing to pay more for reliable power supply: Yes – 65 (40.6%) No – 26 (16.2%) Maybe – 17 (10.6%) No Response – 52 (32.5%)
3.23 How do you cook: Kerosene stove – 103 (64.4%), Firewood – 71 (44.4%), Gas – 13 (8.1%) Charcoal – 3 (1.9%)
Below N1000
N1000–N5000
N5000–N10000
Above 10000
No expense
Yes
No
Somewhat
No response
Yes
No
Maybe
No response
Kerosene stove
Firewood
Gas
Charcoal
38.10%
21.90%
28.70%
6.90%
4.40%
10.60%
32.50%40.60%
16.20%
5%
35.60%
56.20%
3.10%
44.40%
8.10%
64.40%
1.90%

19
ANNEX ONE
3.24 Use of Cooking Gas (LPG): Yes – 14 (8.7%) No – 146 (91.3%)
3.25 How much do you spend for it monthly (14 respondents): Below N2,000 – 4 (28.6%) N2,000–N5,000 – 7 (50%) N5,000–N10,000 – 3 (21.4%)
Section 4: Energy sources
4.1 Amount spent on firewood per day: N100 – 7 (4.4%) N200 – 46 (28.8%) N500 – 13 (8.1%) Collect wood by self – 52 (32.5%) Do not use firewood – 42 (26.2%)
4.2 Cost of firewood: N100 – 33 (20.6%) N200 – 21 (13.2%) N500 – 12 (7.5%) Collect wood by self – 52 (32.5%) Do not use firewood – 42 (26.2%)
Yes
No
Below N2000
N2000–N5000
N5000–N10000
N100
N200
N500
Collect wood by self
Do not use firewood
91.30%
8.70%
50%
28.60%21.40%
26.20%
32.50%
28.80%
8.10%
4.40%
26.20%
7.50%
20.60%
13.20%
32.50%
N100
N200
N500
Collect wood by self
Do not use firewood
20 Survey on energy uSe and uSage perceptionS in the niger delta
4.3 The firewood is collected from the mangroves, forest or “bush” as it was referred to.
4.4 Price of charcoal: the price ranged from N1,500 to N2,000 per bag.
4.5 Amount spent on charcoal per day: Only 13 (8.1%) respondent used charcoal to cook and 7 (4.4%) said they make it by themselves while 6 (3.7%) spend between N200–N500.
4.6 It was generally said that the charcoal comes from the firewood from the forest.
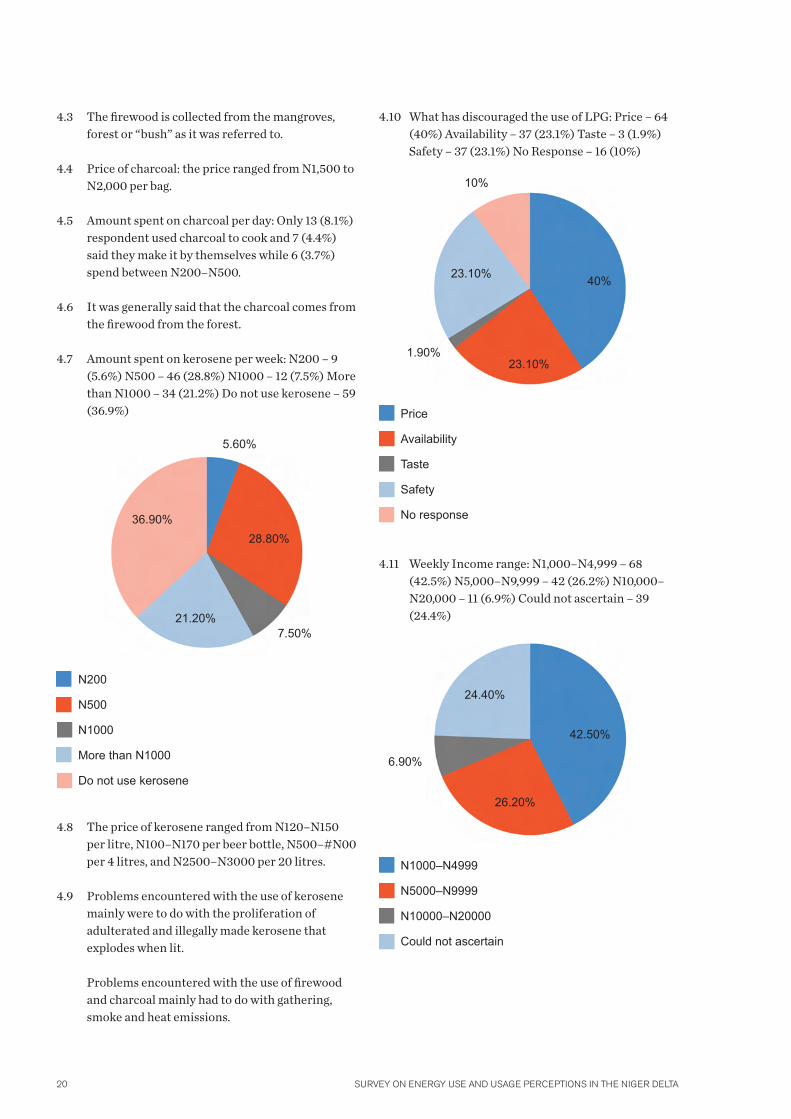
4.7 Amount spent on kerosene per week: N200 – 9 (5.6%) N500 – 46 (28.8%) N1000 – 12 (7.5%) More than N1000 – 34 (21.2%) Do not use kerosene – 59 (36.9%)
4.8 The price of kerosene ranged from N120–N150 per litre, N100–N170 per beer bottle, N500–#N00 per 4 litres, and N2500–N3000 per 20 litres.
4.9 Problems encountered with the use of kerosene mainly were to do with the proliferation of adulterated and illegally made kerosene that explodes when lit.
Problems encountered with the use of firewood and charcoal mainly had to do with gathering, smoke and heat emissions.
4.10 What has discouraged the use of LPG: Price – 64 (40%) Availability – 37 (23.1%) Taste – 3 (1.9%) Safety – 37 (23.1%) No Response – 16 (10%)
4.11 Weekly Income range: N1,000–N4,999 – 68 (42.5%) N5,000–N9,999 – 42 (26.2%) N10,000–N20,000 – 11 (6.9%) Could not ascertain – 39 (24.4%)
Price
Availability
Taste
Safety
No response
N1000–N4999
N5000–N9999
N10000–N20000
Could not ascertain
36.90%28.80%
7.50%21.20%
5.60%
1.90%23.10%
40%23.10%
10%
24.40%
26.20%
42.50%
6.90%
N200
N500
N1000
More than N1000
Do not use kerosene
21
ANNEX ONE
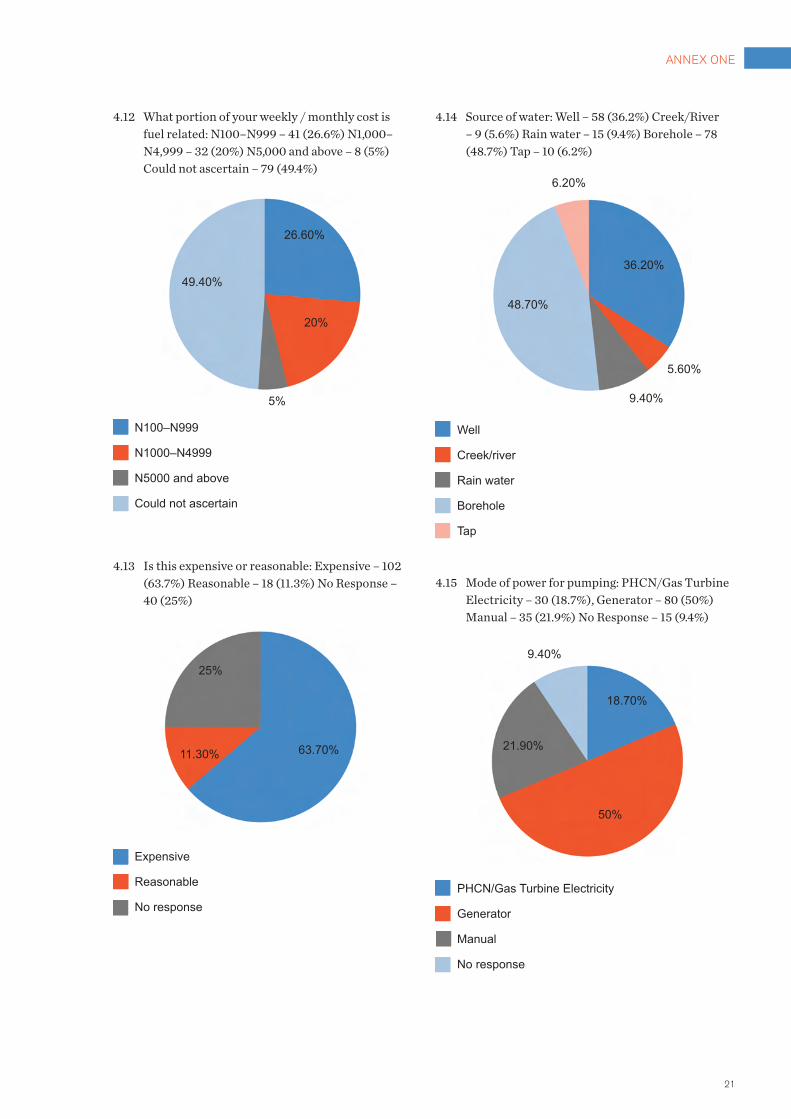
4.12 What portion of your weekly / monthly cost is fuel related: N100–N999 – 41 (26.6%) N1,000–N4,999 – 32 (20%) N5,000 and above – 8 (5%) Could not ascertain – 79 (49.4%)
4.13 Is this expensive or reasonable: Expensive – 102 (63.7%) Reasonable – 18 (11.3%) No Response – 40 (25%)
4.14 Source of water: Well – 58 (36.2%) Creek/River – 9 (5.6%) Rain water – 15 (9.4%) Borehole – 78 (48.7%) Tap – 10 (6.2%)
4.15 Mode of power for pumping: PHCN/Gas Turbine Electricity – 30 (18.7%), Generator – 80 (50%) Manual – 35 (21.9%) No Response – 15 (9.4%)
N100–N999
N1000–N4999
N5000 and above
Could not ascertain
Expensive
Reasonable
No response
Well
Creek/river
Rain water
Borehole
Tap
PHCN/Gas Turbine Electricity
Generator
Manual
No response
49.40%
5%
20%
26.60%
11.30% 63.70%
25%
48.70%
9.40%
36.20%
5.60%
6.20%
21.90%
9.40%
50%
18.70%

22 Survey on energy uSe and uSage perceptionS in the niger delta
Section 5: Perception of renewable energy
5.1 Knowledge of energy types: Solar – 118 (73.7%) Hydro Plant – 28 (17.5%) Wind Power – 24 (15%) Bio-fuel – 14 (8.7%) No Idea – 14 (8.75%)
5.2 Knowledge of renewable energy: Yes – 69 (43.2%) No – 67 (41.8%) No Idea – 24 (15%)
5.3 What have you seen that is powered by renewable energy: Of the 160 respondents, 61 (38.1%) had not seen anything powered by Renewable Energy. The examples of renewable energy provided by the other 99 (61.9%) respondents were street lights, mobile phones and solar-powered boreholes, electronics and hospital refrigerators.
5.4 Cost of solar project: Yes – 14 (8.7%) No – 138 (86.3%) Kind of – 8 (5%)
5.5 Knowledge of solar-powered projects: Yes – 97 (60.6%) No – 54 (33.7%) No Idea – 9 (5.7%)
Yes
No
No idea
80%
60%
40%
20%
0%
Yes
No
No idea
Yes
No
Kind of
41.80%
43.20%
15%
33.70%60.60%
5.70%
86.30%
8.70%5%
Solar
Hydro
Plant
Wind
Pow
er
Bio-fue
l
No ide
a

23
ANNEX ONE
5.6 Solar power being low-power: Yes – 37 (23.2%) No – 110 (68.7%) No Idea – 13 (8.1%)
5.7 Renewable energy project in the community: Yes – 32 (20%) No – 112 (70%) No idea – 16 (10%)
5.8 If yes, what type: The 32 (20%) respondents that said yes mentioned streetlight, cybercafé, borehole and ice-lining machine (at the hospital) as examples of solar-powered products in the communities.
5.9 Is it working: Yes – 9 (28.1%) No – 23 (71.9%)
5.10 If no, why: The reasons the 23 respondents who said “No” were: Poor maintenance and supervision, inadequate funding and poor installation.
5.11 Converting flared gas to power and other products: No idea – 57 (35.6%) Very Good Idea – 103 (64.4%)
“Flaring gas is wasteful and pollutes our environment. Any other beneficial use of the gas is welcome.” – Akala-Olu Community
“It is a welcome development. Flaring gas is dangerous to health therefore it will reduce health hazards.” – Kaiama Community
“I have heard quite a lot about it so it will be good to have it happen. It will reduce related sicknesses and improve way of living.” – Akala-Olu Community
“It will greatly help in reducing cost of fuel.” – Kaiama Community
“This will greatly improve power situation.” – Kaiama Community
Yes
No
No idea
Yes
No
No idea
No idea
Very good idea
68.70%
23.20%
8.10%
70%
20%
10%
35.60%
64.40%
24 Survey on energy uSe and uSage perceptionS in the niger delta
Section 6: Biomass and forest
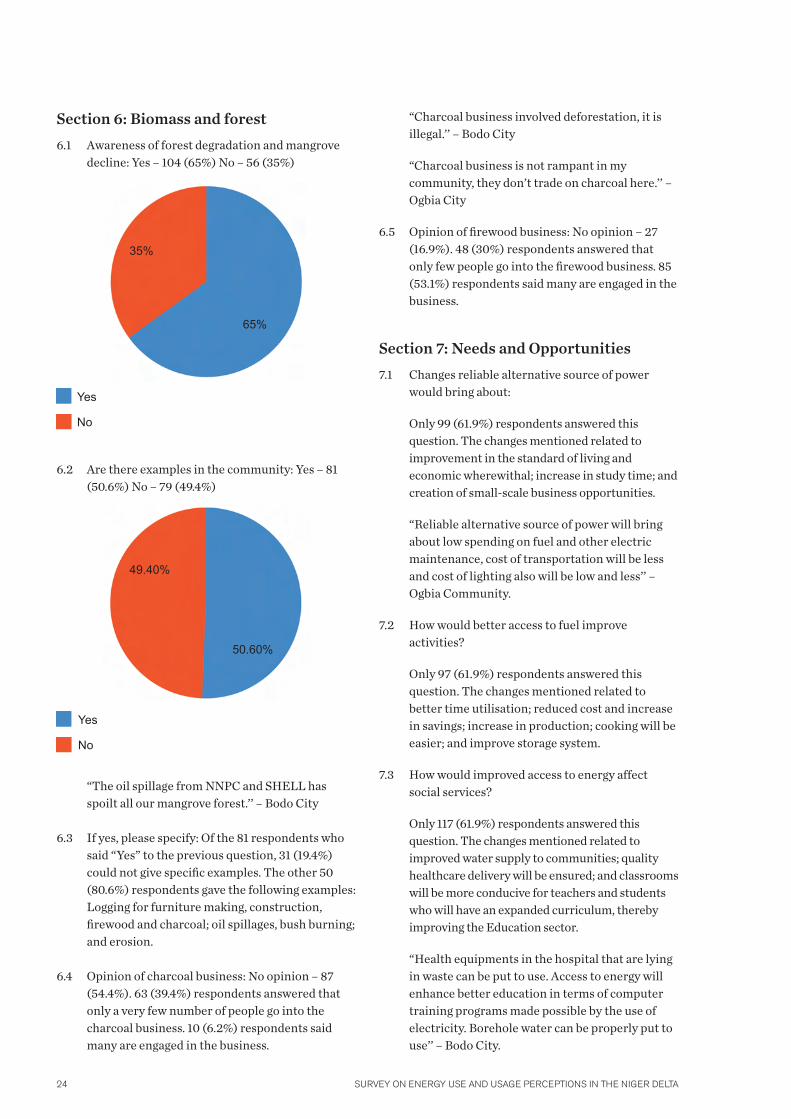
6.1 Awareness of forest degradation and mangrove decline: Yes – 104 (65%) No – 56 (35%)
6.2 Are there examples in the community: Yes – 81 (50.6%) No – 79 (49.4%)
“The oil spillage from NNPC and SHELL has spoilt all our mangrove forest.’’ – Bodo City
6.3 If yes, please specify: Of the 81 respondents who said “Yes” to the previous question, 31 (19.4%) could not give specific examples. The other 50 (80.6%) respondents gave the following examples: Logging for furniture making, construction, firewood and charcoal; oil spillages, bush burning; and erosion.
6.4 Opinion of charcoal business: No opinion – 87 (54.4%). 63 (39.4%) respondents answered that only a very few number of people go into the charcoal business. 10 (6.2%) respondents said many are engaged in the business.
“Charcoal business involved deforestation, it is illegal.’’ – Bodo City
“Charcoal business is not rampant in my community, they don’t trade on charcoal here.’’ – Ogbia City
6.5 Opinion of firewood business: No opinion – 27 (16.9%). 48 (30%) respondents answered that only few people go into the firewood business. 85 (53.1%) respondents said many are engaged in the business.
Section 7: Needs and Opportunities
7.1 Changes reliable alternative source of power would bring about:
Only 99 (61.9%) respondents answered this question. The changes mentioned related to improvement in the standard of living and economic wherewithal; increase in study time; and creation of small-scale business opportunities.
“Reliable alternative source of power will bring about low spending on fuel and other electric maintenance, cost of transportation will be less and cost of lighting also will be low and less’’ – Ogbia Community.
7.2 How would better access to fuel improve activities?
Only 97 (61.9%) respondents answered this question. The changes mentioned related to better time utilisation; reduced cost and increase in savings; increase in production; cooking will be easier; and improve storage system.
7.3 How would improved access to energy affect social services?
Only 117 (61.9%) respondents answered this question. The changes mentioned related to improved water supply to communities; quality healthcare delivery will be ensured; and classrooms will be more conducive for teachers and students who will have an expanded curriculum, thereby improving the Education sector.
“Health equipments in the hospital that are lying in waste can be put to use. Access to energy will enhance better education in terms of computer training programs made possible by the use of electricity. Borehole water can be properly put to use’’ – Bodo City.
65%
35%
50.60%
49.40%
Yes
No
Yes
No

25
ANNEX TWO
No of respondents: 19 (2 respondents from each CSO in Rivers and 1 each from Bayelsa)
Date: 21st to 31st February, 2011
Section 1: General data
1.1 Name of organisations:
CSOs in Rivers: Centre for Environment, Human Rights and Development (CEHRD), Gender and Development Action (GADA), Environmental Rights Action (ERA), Movement for the Survival of Ogoni People (MOSOP), Social Action (SA), Pro Natural International (PNI)
CSOs in Bayelsa: Health Living Initiatives International, Development Initiators, Peacemaker International, Golden Planet Foundation, Family Welfare Foundation, Operation Rescue and Benny’s Development Initiative.
1.2 Core objectives of the organisations:
CEHRD: Interventionists development, improving and defending the Human Rights of people in the Niger Delta.
GADA: Gender equity and equality.
ERA: Defence of the eco system and respect for human rights
PNI: Community development through capacity building, enlightenment and sensitisation.
SA: Educate and empower community people to participate in issues of development especially oil producing communities in the Niger Delta.
MOSOP: Campaign for the protection of the environment, raise awareness of the socio economic rights of the people and participation in institution as a right of the people.
Health Living Initiatives: Providing health education as a means of poverty eradication
Benny’s Development Initiative: To reduce child and maternal mortality through good access to health care services.
Operation Rescue: Health, education, community development and human rights advocacy.
Golden Planet Foundation: To improve the living standards of the rural populace.
Family Welfare Foundation: Improved access to basic essentials of life for the less privileged.
Peacemaker International: Promote peace and sustainable development.
Development Initiators: To ensure Sustainable development in communities and good governance.
1.3 Positions of respondents:
Four Executive Directors, one Executive Secretary, one Coordinator, one Project Director, eight Project/ Programme Officers, one Project Assistant, one Gender Officer, one Senior Administrative Officer and one Programme Adviser.
1.4 Gender of respondents:
Male: 14 (73.4%) Female: 5 (26.3%)
Male
Female
73.40%
26.30%
Annex Two Analysis of survey questions for civil society in Rivers and Bayelsa states

26 Survey on energy uSe and uSage perceptionS in the niger delta
Section 2: Perception of renewable energy
2.1 Do your core objectives have a direct link to access to energy?
Yes: 14 (73.6%) No: 5 (26.3%)
2.2 How does access to energy relate to your core activities?
Energy is the source of power that promotes economic activities in order to eradicate poverty and to power generator for community boreholes (Golden Planet Foundation).
PNI said organisations need energy to operate, they have used solar before, though it didn’t work due to improper maintenance.
MOSOP and ERA believed that protection and managing of the environment is very important because oil and gas extraction creates serious hazards to the people and environment.
Few respondents did not really explain how energy relates to their core activities.
2.3 If available, can you give examples of projects/case studies relating to access to energy that your organisation has worked on or is working on?
39.5% respondents could not give examples of projects/ case studies while 60.5% gave examples of the use of advocacy, sensitisation, solar power water project, campaign against gas flare, and the use of lobby to enable government carry out rural
electrification in some rural communities like Yonkhana, Ikarama, Joinkrama, Rumuekpe and Brass etc.
2.4 What support is there for community projects (access to energy/renewable energy)? E.g. grants, government programmes, NGO projects, etc.
33% have NGO projects for example, PNI and CEHRD have STAND project that linked Government to get energy for communities.
Occasionally, MOSOP support communities for servicing of mono pumps and partnered with MPP3 program to provide amenities in some communities.
Social Action mentioned the Sungas project in which they were involved, which aimed at converting flared gas to energy for community usage.
Others mentioned supplying of generator for communities.
53.3% did not give any support to communities while 14.2% respondents failed to respond.
2.5 Do your communities view access to energy as important?
95.5% respondents view access to energy as important while 4.5% failed to respond.
2.6 What issues do your communities have relating to access to energy?
More than 66% said that a lack of steady power supply was the major issue they faced, 20.5% complained of money shortage, while others mentioned migration and lack of portable water.
2.7 If communities use generators, what are the benefits/disadvantages?
79% of the respondents stated the benefits and disadvantages.
Some of the benefits mentioned were the provision of an alternative source of light, promotion of small-scale businesses, opportunity to decide when to use it, and it can be used for watching television, ironing of clothes etc.
Yes
No
73.60%
26.30%
27
ANNEX TWO
Some of the disadvantages mentioned are noise and air pollution, expensive, high cost of maintenance etc.
16.5% did not see anything good in using the generator.
4.5% failed to respond to the question.
2.8 What benefits would your communities accrue from reliable energy supply?
Small scale business will thrive, employment generation, productivity enhanced, improved livelihood, improved health, life will be more comfortable, enhanced preservation and enhanced increased employment.
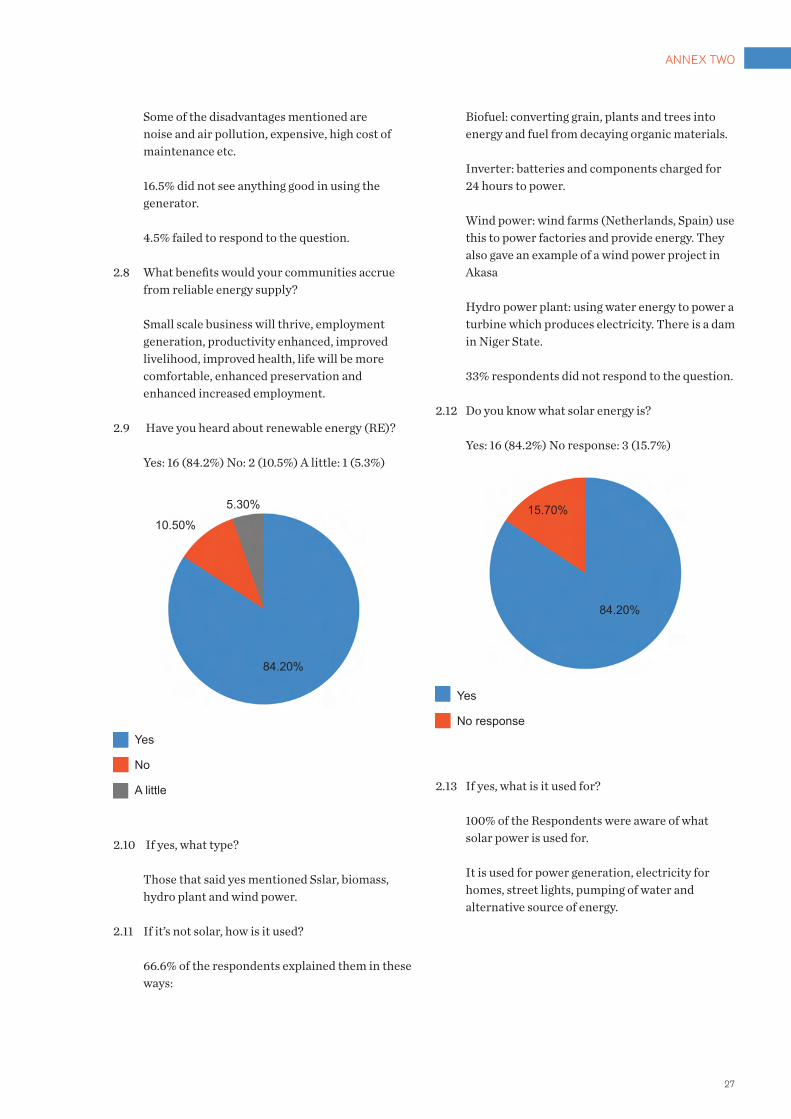
2.9 Have you heard about renewable energy (RE)?
Yes: 16 (84.2%) No: 2 (10.5%) A little: 1 (5.3%)
2.10 If yes, what type?
Those that said yes mentioned Sslar, biomass, hydro plant and wind power.
2.11 If it’s not solar, how is it used?
66.6% of the respondents explained them in these ways:
Biofuel: converting grain, plants and trees into energy and fuel from decaying organic materials.
Inverter: batteries and components charged for 24 hours to power.
Wind power: wind farms (Netherlands, Spain) use this to power factories and provide energy. They also gave an example of a wind power project in Akasa
Hydro power plant: using water energy to power a turbine which produces electricity. There is a dam in Niger State.
33% respondents did not respond to the question.
2.12 Do you know what solar energy is?
Yes: 16 (84.2%) No response: 3 (15.7%)
2.13 If yes, what is it used for?
100% of the Respondents were aware of what solar power is used for.
It is used for power generation, electricity for homes, street lights, pumping of water and alternative source of energy.
Yes
No
A little
5.30%
84.20%
10.50%
Yes
No response
84.20%
15.70%
28 Survey on energy uSe and uSage perceptionS in the niger delta
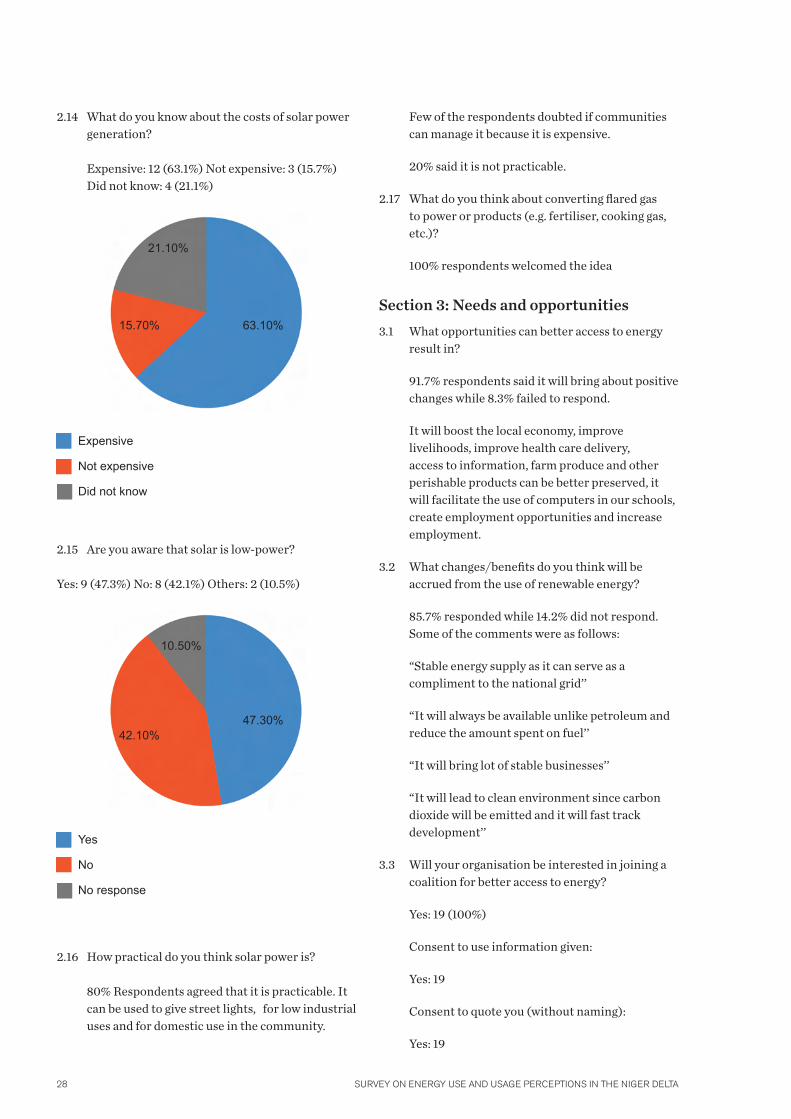
2.14 What do you know about the costs of solar power generation?
Expensive: 12 (63.1%) Not expensive: 3 (15.7%) Did not know: 4 (21.1%)
2.15 Are you aware that solar is low-power?
Yes: 9 (47.3%) No: 8 (42.1%) Others: 2 (10.5%)
2.16 How practical do you think solar power is?
80% Respondents agreed that it is practicable. It can be used to give street lights, for low industrial uses and for domestic use in the community.
Few of the respondents doubted if communities can manage it because it is expensive.
20% said it is not practicable.
2.17 What do you think about converting flared gas to power or products (e.g. fertiliser, cooking gas, etc.)?
100% respondents welcomed the idea
Section 3: Needs and opportunities
3.1 What opportunities can better access to energy result in?
91.7% respondents said it will bring about positive changes while 8.3% failed to respond.
It will boost the local economy, improve livelihoods, improve health care delivery, access to information, farm produce and other perishable products can be better preserved, it will facilitate the use of computers in our schools, create employment opportunities and increase employment.
3.2 What changes/benefits do you think will be accrued from the use of renewable energy?
85.7% responded while 14.2% did not respond. Some of the comments were as follows:
“Stable energy supply as it can serve as a compliment to the national grid’’
“It will always be available unlike petroleum and reduce the amount spent on fuel’’
“It will bring lot of stable businesses’’
“It will lead to clean environment since carbon dioxide will be emitted and it will fast track development’’
3.3 Will your organisation be interested in joining a coalition for better access to energy?
Yes: 19 (100%)
Consent to use information given:
Yes: 19
Consent to quote you (without naming):
Yes: 19
Expensive
Not expensive
Did not know
15.70% 63.10%
21.10%
Yes
No
No response
42.10%47.30%
10.50%

29
ANNEX THREE
Number of respondents: 21 (In Rivers state: two people each from three ministries, two from NDDC, one from PHCN, one each from the Ministry of Works, Power, and Water Resources; in Bayelsa state, one person from each ministry).
Date: 3rd – 24th March, 2011
Section 1: General data
1.1 Name of MDAs:
MDAs surveyed in Rivers State: Ministry of Environment, Ministry of Information, Ministry of Works, Ministry of Power, Ministry of Water Resources, Ministry of Niger Delta Affairs, Power Holding Company of Nigeria (PHCN) and Niger Delta Development Commission (NDDC).
MDAs surveyed in Bayelsa State: Ministry of Information, Ministry of Water Resources, Ministry of Justice, Ministry of Energy, Ministry of Health, Ministry of Environment, Ministry of Women Affairs and Bayelsa State Water Board.
1.2 Core objectives of the MDAs:
Ministry of Works: Construction of roads and infrastructural development.
Ministry of Niger Delta Affairs: Development of infrastructure and human capacity development of the Niger Delta.
Ministry of Power: To ensure constant power supply to all parts of the state
Ministry of Energy: Promotion of an enabling environment for effective generation, transmission, distribution and market of electricity and the formulation of long term energy strategies for the state.
Ministry of Health: Reduction in maternal and neonatal mortality.
Ministry of Environment: To protect, implement and monitor the environment and its inhabitants according to the law and policy and advice the executive governor on such and related matters.
Ministry of Women’s Affairs: Deal with women’s and social problems in general.
Ministry of Justice: Represent the state in cases before the court and to advising the government.
Ministry of Water Resources: Provision of potable water and sanitation facilities to the people.
Ministry of Information: Disseminate government policies and programmes and provide public information.
Ministry of Niger Delta Affairs: Development of infrastructure and human capacity, and development of the Niger Delta.
NDDC: To promote sustainable development in the Niger Delta region.
PHCN: Electricity generation, transmission, distribution and sales.
Bayelsa State Water Board: Operation and maintenance of water projects
1.3 Position of respondents:
Eleven directors, four managers, two heads of department, one senior administrative officer, one accountant, one administrator, and one press officer.
1.4 Gender of respondents:
Male: 21 (100%)
Annex ThreeAnalysis of survey questions for government ministries, departments and agencies (MDAs) in Rivers and Bayelsa states
30 Survey on energy uSe and uSage perceptionS in the niger delta
Section 2: Perception of renewable energy
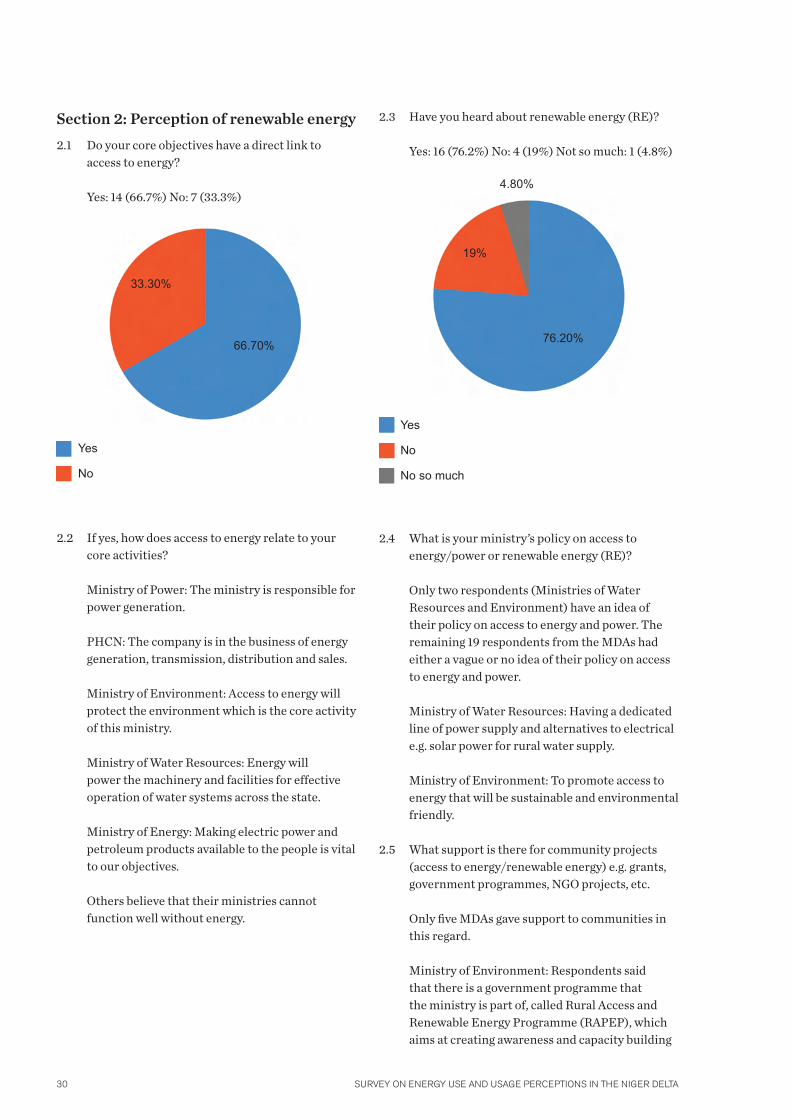
2.1 Do your core objectives have a direct link to access to energy?
Yes: 14 (66.7%) No: 7 (33.3%)
2.2 If yes, how does access to energy relate to your core activities?
Ministry of Power: The ministry is responsible for power generation.
PHCN: The company is in the business of energy generation, transmission, distribution and sales.
Ministry of Environment: Access to energy will protect the environment which is the core activity of this ministry.
Ministry of Water Resources: Energy will power the machinery and facilities for effective operation of water systems across the state.
Ministry of Energy: Making electric power and petroleum products available to the people is vital to our objectives.
Others believe that their ministries cannot function well without energy.
2.3 Have you heard about renewable energy (RE)?
Yes: 16 (76.2%) No: 4 (19%) Not so much: 1 (4.8%)
2.4 What is your ministry’s policy on access to energy/power or renewable energy (RE)?
Only two respondents (Ministries of Water Resources and Environment) have an idea of their policy on access to energy and power. The remaining 19 respondents from the MDAs had either a vague or no idea of their policy on access to energy and power.
Ministry of Water Resources: Having a dedicated line of power supply and alternatives to electrical e.g. solar power for rural water supply.
Ministry of Environment: To promote access to energy that will be sustainable and environmental friendly.
2.5 What support is there for community projects (access to energy/renewable energy) e.g. grants, government programmes, NGO projects, etc.
Only five MDAs gave support to communities in this regard.
Ministry of Environment: Respondents said that there is a government programme that the ministry is part of, called Rural Access and Renewable Energy Programme (RAPEP), which aims at creating awareness and capacity building
Yes
No
Yes
No
No so much
66.70%
33.30%
76.20%
4.80%
19%

31
ANNEX THREE
and making available necessary assistance to rural communities.
Ministry of Information: There are enlightenment programmes on the benefits of renewable energy.
NDDC: There is matching grants for communities for self help projects.
PHCN: There is Rural Electricity Agency, but due to the privatisation policy of the government, it is the core investors who now determine the level of support for community projects.
The remaining respondents either had no idea or their MDA had no provision for such support for communities.
2.6 Of what benefit will a reliable energy source be to the education, health and water sectors?
Education: It will make computer education and ICT programmes in the modern secondary schools possible at the rural areas, and the quality of education will be enhanced.
Health: Improved healthcare, decrease in mortality rate, and it will bring tertiary health care closer to the people, especially those in rural areas.
Water: Improved service delivery of water to the rural water pumps, better sanitation and good health.
All respondents believed that a reliable energy source would be of utmost benefit to the three sectors.
2.7 Is there an alternative to the existing power source? Yes: 12 (57.1%) No: 9 (42.9%)
Respondents believed there are alternatives, such as solar, wind and generator.
2.8 Would the government be willing to subscribe to renewable energy as an alternative power source?
Yes: 17 (81%) Doubtful: 4 (19%)
2.9 What’s your own opinion on renewable energy?
Most of the respondents (19 or 90.5%) support the idea of renewable energy. Some of the responses given included:
It will be more reliable, save cost and will help to reduce the impact of climate change on the environment if fully harnessed.
It will greatly reduce cost of providing energy in our individual home and business premises.
Renewable energy is safer and environmentally friendly but requires further development especially for large-scale usage.
It can save cost, reduce waste and improve mechanised farming.
It can lead to healthy scientific growth, which is very necessary for the society.
However, 2 (9.5%) respondents were sceptical about its workability.
Yes
Doubtful
81%
19%
32 Survey on energy uSe and uSage perceptionS in the niger delta
Section 3: Needs and Opportunities
3.1 In what way(s) do you think your Ministry can promote access to (renewable) energy thereby bring about power sector reform?
Ministry of Energy: ‘’By gradually encouraging the use of hydro, solar and wind energy as sources of power supply and discouraging the use of diesel generator’’ and “through education of the people”.
Ministry of Environment: “Synergise with other MDAs” and “create awareness as it relates to climate change” and “by initiating effective renewable energy policy in the state and relevant legislations which could be followed by awareness creation and capacity building.”
Ministry of Information: By carrying out massive public enlightenment campaigns on the benefits of renewable energy source, especially in the rural areas.
Ministry of Water resources: “Encourage the use and installation of renewable facilities.”
3.2 What changes/benefits do you think will be accrued from the use of renewable energy?
Ministry of Environment: reduction in green-house gas emissions that would affect climate change and the environment is better protected
Ministry of Niger Delta Affairs: Cost reduction in machinery, availability to industries at less cost.
Ministry of Information: Environmental safety and a comparatively cheaper cost of power generation.
Ministry of Energy and Natural Resources: Constant power supply, increased economic and social life of the citizenry.
Other benefits mentioned were that acidic gasses will no longer be emitted; ozone layer will no longer be depleted; increased foreign and local investment; increased productivity; and reliable power supply.
3.3 What opportunities can better access to energy/power bring about?
Water Board: It will create ’employment, self help power dependent projects, Industrialisation and rapid development.
Ministry of Environment: It will bring about reliable energy supply and improve the standard of living of the people.
Ministry of Niger Delta Affairs: It will bring about reduction of cost of business thereby creating employment and increased capacity utilisation of industries.
Ministry of Health: It will lead to improved economic activities, reduced prevalence of diseases, reduced maternal and childhood mortality because hospital equipment that depend on power will be functional.
Ministry of Energy and Natural Resources: Increase in socio-economic activities and reduction in rural-urban migration.
Ministry of Information: Accelerated development through increased productivity and business.
Ministry of Works: It will promote self employment, encourage economic growth and led to development.
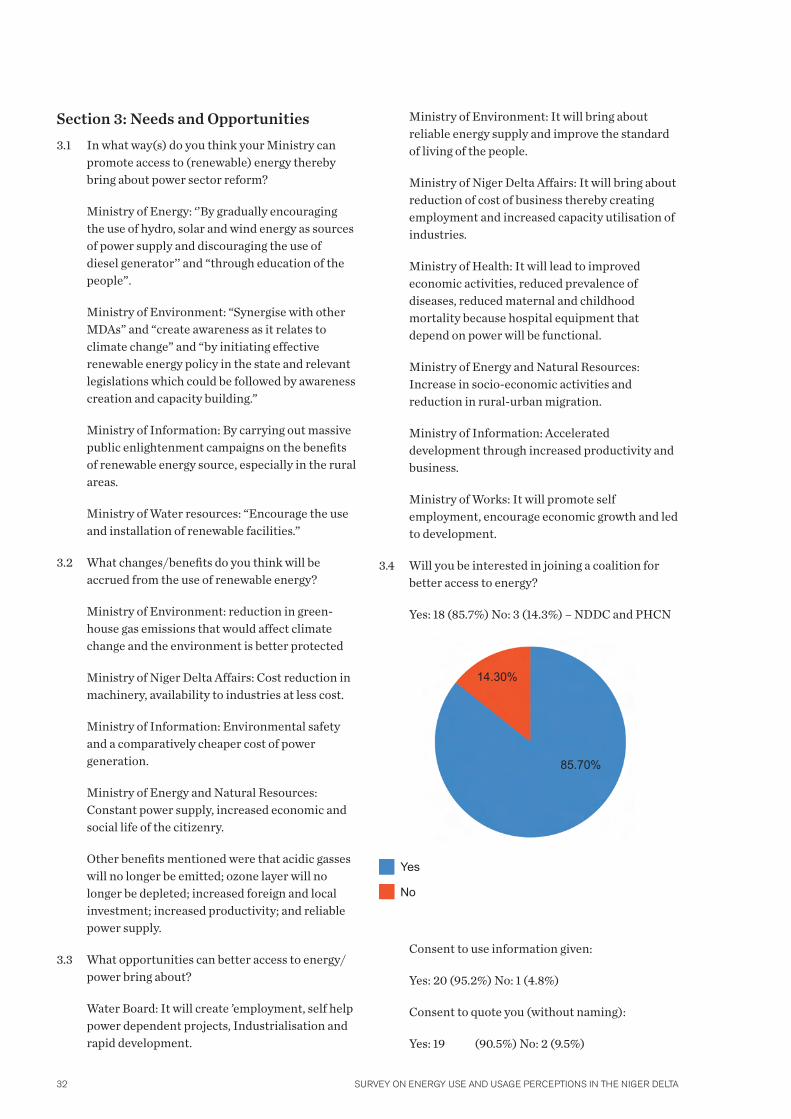
3.4 Will you be interested in joining a coalition for better access to energy?
Yes: 18 (85.7%) No: 3 (14.3%) – NDDC and PHCN
Consent to use information given:
Yes: 20 (95.2%) No: 1 (4.8%)
Consent to quote you (without naming):
Yes: 19 (90.5%) No: 2 (9.5%)
Yes
No
85.70%
14.30%