Embed Size (px)
Citation preview

UNC Energy Services
Energy Supply Alternatives
Carolina North
UNC Energy Services
Energy Supply Alternatives
Carolina North

IntroductionsIntroductions Carolyn Elfland – Assoc. VC for Campus Services
Introduction
Jim McAdam – Manager, Chilled Water Systems Heat Pump Technology & Distributed Solar
Phil Barner – Capital Program Manager Landfill Gas & Wood Products
William Lowery – Senior Engineer, Cogeneration Systems Animal Waste & Carbon Capture
Carolyn Elfland – Assoc. VC for Campus Services Introduction
Jim McAdam – Manager, Chilled Water Systems Heat Pump Technology & Distributed Solar
Phil Barner – Capital Program Manager Landfill Gas & Wood Products
William Lowery – Senior Engineer, Cogeneration Systems Animal Waste & Carbon Capture

Carolina North GoalsCarolina North Goals
CostCost ReliabilityReliability Land useLand use AestheticsAesthetics Carbon Offsite / Distribution Requirements
Operation & Maintenance Resource Conservation Pedagogical Opportunities Health & Wellness
Carbon Offsite / Distribution Requirements
Operation & Maintenance Resource Conservation Pedagogical Opportunities Health & Wellness
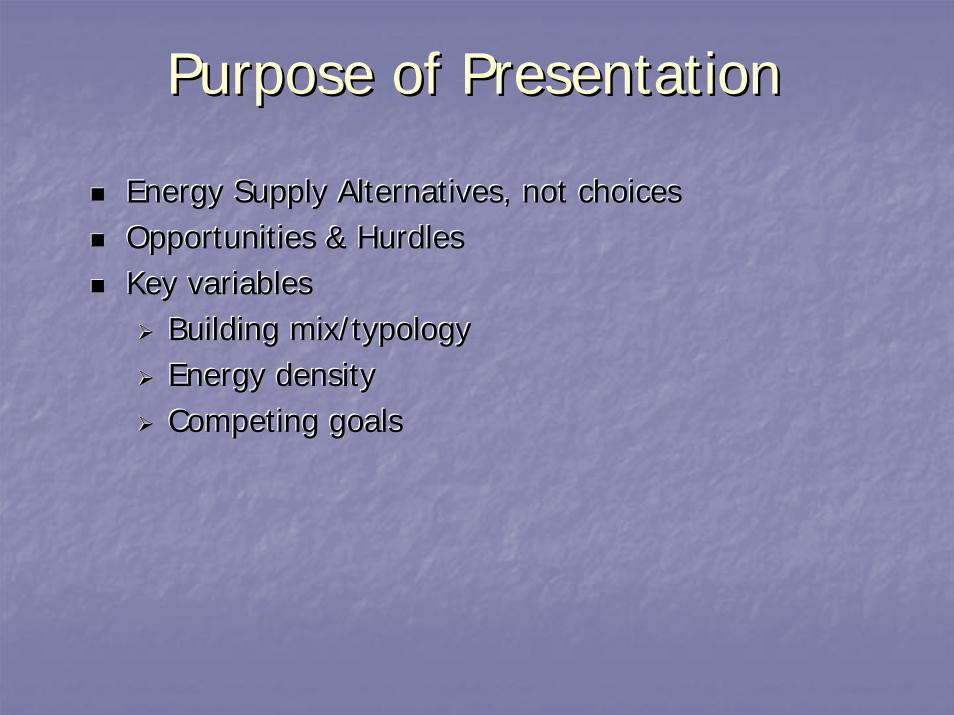
Purpose of PresentationPurpose of Presentation
Energy Supply Alternatives, not choices Opportunities & Hurdles Key variables
Building mix/typology Energy density Competing goals
Energy Supply Alternatives, not choices Opportunities & Hurdles Key variables
Building mix/typology Energy density Competing goals

Heat Pump TechnologyHeat Pump Technology

Water to Water Heat PumpsWater to Water Heat Pumps

Heat Gain Heat RejectedStandardChiller
Water InElectricity In
Current Cooling MethodologyCurrent Cooling Methodology
Heat Gain Heat RejectedStandard Chiller
59 F 95 F
5 Units
Water InElectricity In 1 Unit
1 Unit bought = 5 Units of useful work
The advantage of chillers

Main Campus Load ProfileMain Campus Load Profile 300,000
Cooling Load
Hea
tin
gC
oolin
g MMBtu
Jan Dec25,000,000 Ton-hrs
Cooling Heat Pump Heating

Main Campus Load ProfileMain Campus Load Profile 300,000 MMBtu
25,000,000 Ton-hrs
Hea
tin
gC
oolin
g
Jan Dec
Heat Rejected @95 F
Cooling Heat Pump Heating
Cooling Load

Main Campus Load ProfileMain Campus Load Profile 300,000 MMBtu
25,000,000 Ton-hrs
Cooling Load
Campus Heat Load
Hea
tin
gC
oolin
g
Dec
Heat Rejected @95 F
Jan
Cooling Heat Pump Heating

Heat Pump Opportunity
Heat In Useful Heat“Heat Pump”Chiller
Electricity In
Heat Pump Opportunity
Heat In “Heat Pump” Useful Heat Chiller
Electricity In 2 Units
2 Units bought = 5 + 7 Units of useful work
The advantage of this....
59 F 150 F
5 Units 7 Units

Main Campus Load ProfileMain Campus Load Profile 300,000 MMBtu
Cooling Load
Heat Pump @ 150F
Campus Heat Load
Hea
tin
gC
oolin
g
Chiller @ 95 F
25,000,000 Jan Dec Ton-hrs
Cooling Heat Pump Heating

Production Costs
Gas $0 $1,752,000 $2,657,000
Electric $1,290,000 $554,000 ($126,000)
Water $0 $130,000 $158,000
Annual Cost $1,290,000 $2,436,000 $2,689,000 $/MMBtu (heating and cooling) $4.16 $7.81 $8.63 CO2 (ton/yr) 10,377 17,277 14,621
Production Costs
ASSUMPTIONSASSUMPTIONS
2MW Heat pump, 40F CWS, 155F HWS2MW Heat pump, 40F CWS, 155F HWS
24/7/365 operation24/7/365 operation
Gas = $8/MMBtuGas = $8/MMBtu
Electric = $0.07/kWhElectric = $0.07/kWh
Water = $5/1,000 galWater = $5/1,000 gal
Heat Pump Gas Boiler + Chiller
Gas Cogen + Chiller
Gas $0 $1,752,000 $2,657,000
Electric $1,290,000 $554,000 ($126,000)
Water $0 $130,000 $158,000
Annual Cost $1,290,000 $2,436,000 $2,689,000 $/MMBtu (heating and cooling) $4.16 $7.81 $8.63 CO2 (ton/yr) 10,377 17,277 14,621

Heat Pump TechnologyHeat Pump Technology
Requires coincident Heating & Cooling
This seems illogical – So why do we do it??
Requires coincident Heating & Cooling
This seems illogical – So why do we do it??

Heat Pump Technology
SteamChilled Water
Heat Pump Technology Answer: Dehumidification & Reheating
Chilled Water Steam (from Chiller Plant) (from Cogen Plant)
Cold AirOutside Air 55 F
68 F
Condensate Tempered Dry Air

Heat Pump Technology
ElectricityChilled Water
Heat Pump Technology Answer: Data Centers need cooling all winter...
Chilled Water Electricity (from Chiller Plant) (for Servers)
Recirculated Cold Air Air
55 F

Potential Carolina North Load Profile( 1.5M sqft, 5MW RENCI )
Potential Carolina North Load Profile ( 1.5M sqft, 5MW RENCI )
Cooling
Hea
tin
gC
oolin
g 80,000 MMBtu
Jan7,000,000 Ton-hrs
Dec
Cooling Load

Potential Carolina North Load Profile( 1.5M sqft, 5MW RENCI )
Potential Carolina North Load Profile ( 1.5M sqft, 5MW RENCI )
Cooling Heat Pump Heating
Cooling Load
Hea
tin
gC
oolin
g 80,000 MMBtu
Jan Dec
Heat pump Available Heat
7,000,000 Ton-hrs

Cooling Load
Potential Carolina North Load Profile( 1.5M sqft, 5MW RENCI )
Potential Carolina North Load Profile ( 1.5M sqft, 5MW RENCI )
80,000 MMBtu
Heat pump Available Heat
Campus Heat Load
Hea
tin
gC
oolin
g
Jan Dec
Cooling Load
Cooling Heating Heat Pump Heating
7,000,000 Ton-hrs
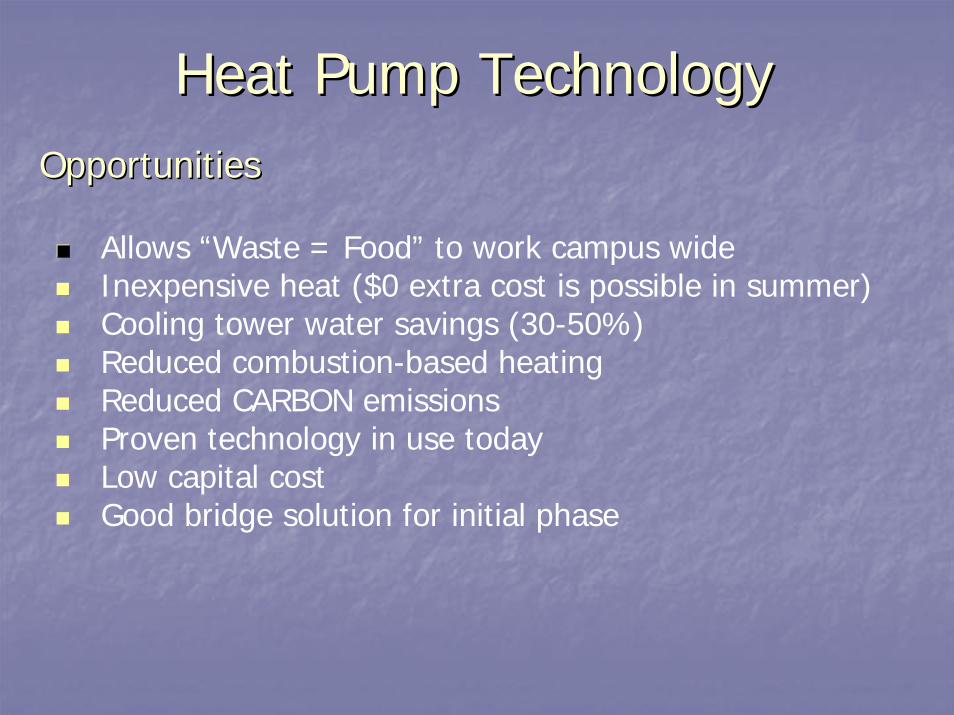
Heat Pump TechnologyOpportunities
Heat Pump Technology Opportunities
Allows “Waste = Food” to work campus wide Inexpensive heat ($0 extra cost is possible in summer) Cooling tower water savings (30-50%) Reduced combustion-based heating Reduced CARBON emissions Proven technology in use today Low capital cost Good bridge solution for initial phase

Heat Pump TechnologyBarriers / Risks
Heat Pump Technology Barriers / Risks
Electric rate sensitivity Reliance on Duke Energy Carbon offsets required to achieve carbon neutral goal Requires hot water distribution system, not steam Serves same heat load that is needed for Cogeneration

Distributed Solar Technology
Distributed Solar Technology
150F
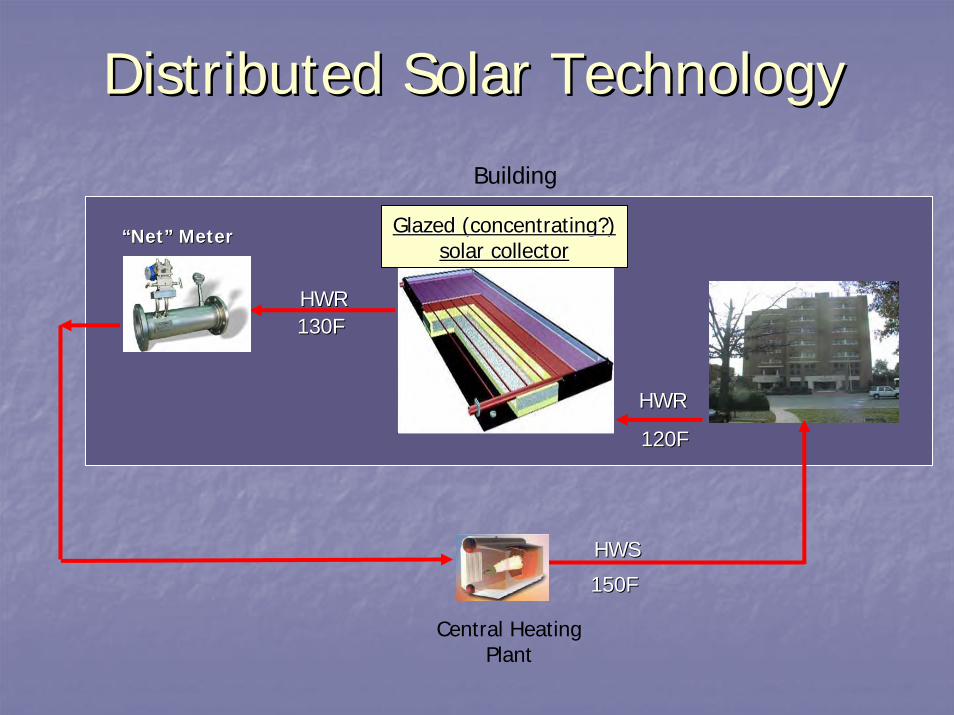
Distributed Solar TechnologyDistributed Solar Technology Building
120F120F
HWRHWR
130F130F HWRHWR
HWSHWS
““NetNet”” MeterMeter Glazed (concentrating?)Glazed (concentrating?) solar collectorsolar collector
150F
Central Heating Plant

Distributed Solar TechnologySolar Assisted Heat Pump
42FHWSSolar Derived Btus
Cost = $6/MMBtu
Gas = $8/MMBtu
150F
Distributed Solar Technology Solar Assisted Heat Pump
Building
Bare tube solar collectorBare tube solar collector
CheapestCheapest ANDAND Most EfficientMost Efficient
55F55F CWRCWR
CWSCWS
65F65F CWRCWR
“Net” Meter
42F HWSSolar Derived Btus
Cost = $6/MMBtu
Gas = $8/MMBtu
150F “Heat Pump”

Distributed Solar TechnologyOpportunities
Distributed Solar Technology Opportunities
Solar is 100% renewable and available onsite
Grid connection lowers installed cost and maximizes economic benefits
All solar energy is used and no local storage is required
Potential to finance significant building-level renewables with utility rate

Distributed Solar TechnologyBarriers / Risks
Distributed Solar Technology Barriers / Risks
Possible central plant/grid disruption
Interconnections standards needed
Metering complexity

Landfill GasLandfill Gas

Landfill GasLandfill Gas
Orange County Eubanks Road Landfill
~ 2 miles from Carolina North Site
Capacity to produce 0.75 MW of power and heat 100k to 200k GSF of building space
Source will diminish over time with peak output around 2010
Orange County Eubanks Road Landfill
~ 2 miles from Carolina North Site
Capacity to produce 0.75 MW of power and heat 100k to 200k GSF of building space
Source will diminish over time with peak output around 2010

2010
2015
2020
2025
2030
2035
Landfill GasLandfill Gas
0
50
100
150
200
250
300
350
400
450
2008
2009
2011
2012
2013
2014
2016
2017
2018
2019
2021
2022
2023
2024
2026
2027
2028
2029
2031
2032
2033
2034
Year
Gas
Ava
ilabl
e (C
FM)
0
100
200
300
400
500
600
700
800
900
1000
1100
1200
Power
(kW
)
Gas Avalible
Power

Wood WasteWood Waste

Wood WasteWood Waste
Use Urban Waste Wood and Forest Residue from ~ 50 mile radius
Combustion Technology well understood
Gasification possibility
Intermediate to Long Term Solution, depending on supply
Use Urban Waste Wood and Forest Residue from ~ 50 mile radius
Combustion Technology well understood
Gasification possibility
Intermediate to Long Term Solution, depending on supply

Wood WasteWood Waste
Requires Large Fuel Handling and Preparation area – Can be Offsite
Local Supply (~50 mile radius) required
Local Supply appears adequate
Requires Large Fuel Handling and Preparation area – Can be Offsite
Local Supply (~50 mile radius) required
Local Supply appears adequate

Animal WasteAnimal Waste

Hog WasteHog Waste
Mid 80’s: over 15,000 farms, 2.4 million hogs Mid 90’s: 3600 farms, 8 million hogs Currently: 2400 farms, 10 million hogs Second leading producer behind IOWA (16 million) 11 lbs of manure per hog per day 4000 to 6000 Btu / lbm (when fresh ☺)
Mid 80’s: over 15,000 farms, 2.4 million hogs Mid 90’s: 3600 farms, 8 million hogs Currently: 2400 farms, 10 million hogs Second leading producer behind IOWA (16 million) 11 lbs of manure per hog per day 4000 to 6000 Btu / lbm (when fresh ☺)

Hog WasteHog Waste

Hog Waste SolidsHog Waste Solids

Hog Waste SolidsOpportunities
Renewable source of energy located in NCMitigates other environmental problemsLegislative incentivesBoost to economically depressed portion of the State
HurdlesLots of solids handling, energy, effort to create pelletExpensive, specialized boiler technology for clean burnSolids handling at the boiler facility, before and after the combustorStorage degrades the Btu content
Hog Waste Solids Opportunities
Renewable source of energy located in NC Mitigates other environmental problems Legislative incentives Boost to economically depressed portion of the State
Hurdles Lots of solids handling, energy, effort to create pellet Expensive, specialized boiler technology for clean burn Solids handling at the boiler facility, before and after the combustor Storage degrades the Btu content

Hog Waste BiogasHog Waste Biogas

Hog Waste Biogas
Typical BiogasMethane, CH4 55 – 75%
Carbon Dioxide, CO2 25 – 45%
Nitrogen, N2 0 - 0.3%
Hydrogen, H2 1 – 5%
Hydrogen sulphide, H2S 0 – 3%
Oxygen, O2 0.1 - 0.5%
Ammonia, 2 NH3 0 – 2%
Hog Waste Biogas
Typical Biogas Methane, CH4 55 – 75%
Carbon Dioxide, CO2 25 – 45%
Nitrogen, N2 0 - 0.3%
Hydrogen, H2 1 – 5%
Hydrogen sulphide, H2S 0 – 3%
Oxygen, O2 0.1 - 0.5%
Ammonia, 2 NH3 0 – 2%

Hog Waste Biogas
Hog waste Biogas60% Methane, 40% CO2
0.4% Hydrogen Sulphide0.5% Ammonia100% Saturated Moisture Content
Hog Waste Biogas
Hog waste Biogas 60% Methane, 40% CO2
0.4% Hydrogen Sulphide 0.5% Ammonia 100% Saturated Moisture Content

Hog Waste BiogasGas Advantage (over solid waste)
No solids handling off the farm, final solids as fertilizerClean burning, commercial productLots of standard equipment can use the fuelStorage and delivery is well understood75 MW of gas, possibly more with superbugs
HurdlesGet the waste to centralized large scale digestersFarms could us much of the gas onsite if done at each farmSupply goes away if industry goes away
Hog Waste Biogas Gas Advantage (over solid waste)
No solids handling off the farm, final solids as fertilizer Clean burning, commercial product Lots of standard equipment can use the fuel Storage and delivery is well understood 75 MW of gas, possibly more with superbugs
Hurdles Get the waste to centralized large scale digesters Farms could us much of the gas onsite if done at each farm Supply goes away if industry goes away

Carbon CaptureCarbon Capture

Carbon CaptureCarbon Capture
Mid 70’s to Mid 90’s DOE studies algae for fuel production
Identifies 300 varieties of green algae and diatoms
Best ones blue-green algae 50% oil by weight
Concluded 15,000 gal / acre of biodiesel is possible
Mid 70’s to Mid 90’s DOE studies algae for fuel production
Identifies 300 varieties of green algae and diatoms
Best ones blue-green algae 50% oil by weight
Concluded 15,000 gal / acre of biodiesel is possible

Carbon CaptureCarbon Capture Green Fuel Technologies (Cambridge Mass.)Green Fuel Technologies (Cambridge Mass.)
Sunlight
Flue Gas In
Flue Gas In
Algae consumes CO2 & NOX
Scrubbed flue gas
Algal BioFuel Out

Carbon CaptureCarbon Capture
Green Fuel Technologies (Cambridge Mass.) Small scale pilot project Capture average 86% NOx Capture average 50% of CO2, peak capture of 82% Sequester or produce fuel Estimated 1000 MW plant – 40 million gal. of biodiesel and 50 million gal. of ethanol are possible
Requires 2000 acre farm next to plant

Carbon CaptureCarbon Capture
Greenshift Corporation (New Jersey) Algae based filter Prototype handles 140 cubic meters of flue gas per minute 3 megawatt power plant
Greenshift Corporation (New Jersey) Algae based filter Prototype handles 140 cubic meters of flue gas per minute 3 megawatt power plant

Thank You for Your Time !
Questions ???
Thank You for Your Time !
Questions ???


![SME08 RE Supply - The Alternatives to China[1]](https://img.pdfslide.us/doc/110x75/577cc2af1a28aba711945e30/sme08-re-supply-the-alternatives-to-china1.jpg)