Embed Size (px)
Citation preview

12
1This is almost always true for private tran
can rely on rails or overhead wires to transm
not have fixed routes and also require porta
q 2007 by Taylor & Francis Group, LLC
Energy StorageTechnologies
Roel Hammerschlag and
Christopher P. SchaberInstitute for Lifecycle Environmental
Assessment
12.1 Overview of Storage Technologies................................... 12-1
12.2 Principal Forms of Stored Energy ................................... 12-3
12.3 Applications of Energy Storage ....................................... 12-3
12.4 Specifying Energy Storage Devices.................................. 12-4
12.5 Specifying Fuels................................................................. 12-6
12.6 Direct Electric Storage...................................................... 12-7
sportation
it electric e
ble energy
Ultracapacitors † Superconducting Magnetic Energy
Storage
12.7 Electrochemical Energy Storage ...................................... 12-8
Secondary Batteries † Lead–Acid † Lithium–Ion † Nickel–Cadmium † Nickel–Metal Hydride †
Sodium–Sulfur † Zebra † Flow Batteries † Electrolytic
Hydrogen
12.8 Mechanical Energy Storage............................................ 12-13
Pumped Hydro † Compressed Air † Flywheels12.9 Direct Thermal Storage .................................................. 12-15
Sensible Heat † Latent Heat12.10 Thermochemical Energy Storage................................... 12-19
Biomass Solids † Ethanol † Biodiesel † SyngasReferences ..................................................................................... 12-21
12.1 Overview of Storage Technologies
Energy storage will play a critical role in an efficient and renewable energy future; much more so than it
does in today’s fossil-based energy economy. There are two principal reasons that energy storage will
grow in importance with increased development of renewable energy:
† Many important renewable energy sources are intermittent, and generate when weather dictates,
rather than when energy demand dictates.
† Many transportation systems require energy to be carried with the vehicle.1
systems, and usually untrue for public transportation systems, which
nergy. However, some public transportation systems such as buses do
storage.
12-1
12-2 Energy Management and Conservation Handbook
Dow
nloa
ded
by [
Uni
vers
iti T
ekno
logi
Mal
aysi
a -
Skud
ai]
at 0
1:37
09
Janu
ary
2016
Energy can be stored in many forms: as mechanical energy in rotating, compressed, or elevated
substances; as thermal or electrical energy waiting to be released from chemical bonds; or as electrical
charge ready to travel from positive to negative poles on demand.
Storage media that can take and release energy in the form of electricity have the most universal value,
because electricity can efficiently be converted either to mechanical or heat energy, whereas other energy
conversion processes are less efficient. Electricity is also the output of three of the most promising
renewable energy technologies: wind turbines, solar thermal, and photovoltaics. Storing this electricity in
a medium that naturally accepts electricity is favored, because converting the energy to another type
usually has a substantial efficiency penalty.
Still, some applications can benefit from mechanical or thermal technologies. Examples are when the
application already includes mechanical devices or heat engines that can take advantage of the
compatible energy form; lower environmental impacts that are associated with mechanical and
thermal technologies; or low cost resulting from simpler technologies or efficiencies of scale.
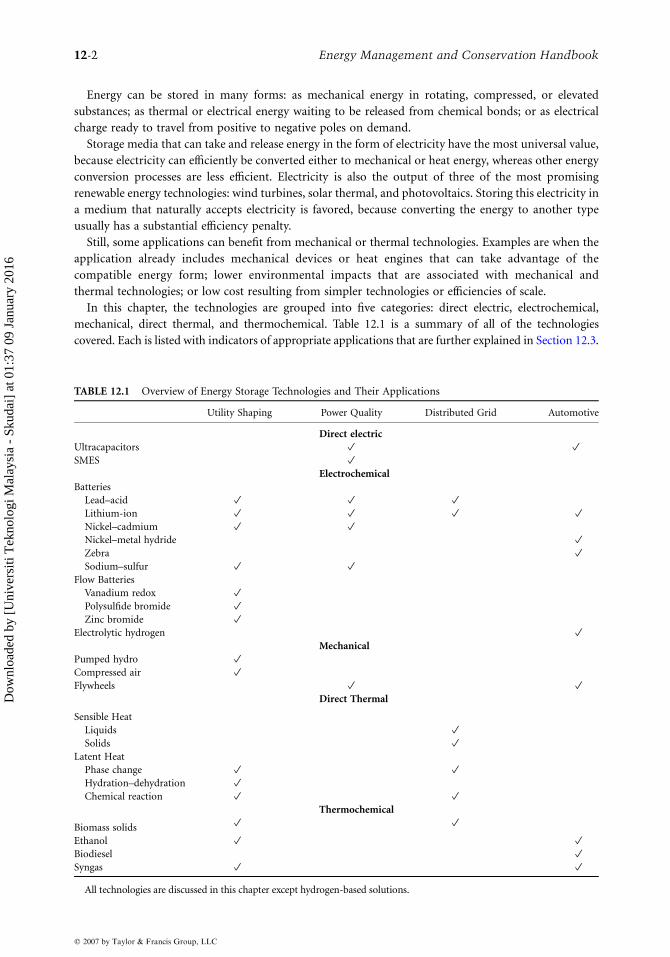
In this chapter, the technologies are grouped into five categories: direct electric, electrochemical,
mechanical, direct thermal, and thermochemical. Table 12.1 is a summary of all of the technologies
covered. Each is listed with indicators of appropriate applications that are further explained in Section 12.3.
TABLE 12.1 Overview of Energy Storage Technologies and Their Applications
Utility Shaping Power Quality Distributed Grid Automotive
Direct electric
Ultracapacitors # #
SMES #
Electrochemical
Batteries
Lead–acid # # #
Lithium-ion # # # #
Nickel–cadmium # #Nickel–metal hydride #
Zebra #
Sodium–sulfur # #
Flow Batteries
Vanadium redox #
Polysulfide bromide #
Zinc bromide #
Electrolytic hydrogen #Mechanical
Pumped hydro #
Compressed air #Flywheels # #
Direct Thermal
Sensible Heat
Liquids #
Solids #
Latent Heat
Phase change # #
Hydration–dehydration #
Chemical reaction # #
Thermochemical
Biomass solids # #
Ethanol # #Biodiesel #
Syngas # #
All technologies are discussed in this chapter except hydrogen-based solutions.
q 2007 by Taylor & Francis Group, LLC

Energy Storage Technologies 12-3
Dow
nloa
ded
by [
Uni
vers
iti T
ekno
logi
Mal
aysi
a -
Skud
ai]
at 0
1:37
09
Janu
ary
2016
12.2 Principal Forms of Stored Energy
The storage media discussed in this chapter can accept and deliver energy in three fundamental forms:
electrical, mechanical, and thermal. Electrical and mechanical energy are both considered high-quality
energy because they can be converted to either of the other two forms with fairly little energy loss
(e.g., electricity can drive a motor with only about 5% energy loss, or a resistive heater with no
energy loss).
The quality of thermal energy storage depends on its temperature. Usually, thermal energy is
considered low quality because it cannot be easily converted to the other two forms. The theoretical
maximum quantity of useful work Wmax (mechanical energy) extractable from a given quantity of
heat Q is
Wmax ZT1 KT2
T1
!Q;
where T1 is the absolute temperature of the heat and T2 is the surrounding, ambient absolute
temperature.
Any energy storage facility must be carefully chosen to accept and produce a form of energy consistent
with either the energy source or the final application. Storage technologies that accept and/or produce
heat should, as a rule, only be used with heat energy sources or with heat applications. Mechanical and
electric technologies are more versatile, but in most cases electric technologies are favored over
mechanical because electricity is more easily transmitted, because there is a larger array of useful
applications, and because the construction cost is typically lower.
12.3 Applications of Energy Storage
In Table 12.1 above, each technology is classified by its relevance in one to four different, principal
applications:
† Utility shaping is the use of very large capacity storage devices to answer electric demand, when a
renewable resource is not producing sufficient generation. An example would be nighttime
delivery of energy generated by a solar thermal plant during the prior day.
† Power quality is the use of very responsive storage devices (capable of large changes in output over
very short timescales) to smooth power delivery during switching events, short outages, or plant
run-up. Power-quality applications can be implemented at central generators, at switchgear
locations, and at commercial and industrial customers’ facilities. Uninterruptible power supplies
(UPS) are an example of this category.
† Distributed grid technologies enable energy generation and storage at customer locations, rather
than at a central (utility) facility. The distributed grid is an important, enabling concept for
photovoltaic technologies that are effective at a small scale and can be installed on private homes
and commercial buildings. When considered in the context of photovoltaics, the energy storage
for the distributed grid is similar to the utility shaping application in that both are solutions to an
intermittent, renewable resource, but distributed photovoltaic generation requires small
capacities in the neighborhood of a few tens of MJ, while utility shaping requires capacities in
the TJ range.2 Renewable thermal resources (solar, geothermal) can also be implemented on a
distributed scale, and require household-scale thermal storage tanks. For the purposes of this
chapter, district-heating systems are also considered a distributed technology.
2Storage capacities in this chapter are given in units of MJ, GJ, and TJ: 1 MJ Z0.28 kWh, 1 GJ Z280 kWh, and 1 TJ Z
280 MWh.
q 2007 by Taylor & Francis Group, LLC

12-4 Energy Management and Conservation Handbook
Dow
nloa
ded
by [
Uni
vers
iti T
ekno
logi
Mal
aysi
a -
Skud
ai]
at 0
1:37
09
Janu
ary
2016
† Automotive applications include battery-electric vehicles (EVs), hybrid gasoline–electric vehicles,
plug-in hybrid electric vehicles (PHEVs), and other applications that require mobile batteries
larger than those used in today’s internal combustion engine cars. A deep penetration of
automotive batteries also could become important in a distributed grid. Large fleets of EVs or
PHEVs that are grid connected when parked would help enable renewable technologies, fulfilling
utility shaping and distributed grid functions as well as their basic automotive function.
Additional energy storage applications exist, most notably portable electronics and industrial
applications. However, the four applications described here make up the principal components that
will interact in a significant way with the global energy grid.
12.4 Specifying Energy Storage Devices
Every energy storage technology, regardless of category, can be roughly characterized by a fairly small
number of parameters. Self-discharge time, unit size, and efficiency serve to differentiate the various
categories. Within a category, finer selections of storage technology can be made by paying attention to
cycle life, specific energy, specific power, energy density, and power density.
Self-discharge time is the time required for a fully charged, noninterconnected storage device to reach a
certain depth of discharge (DOD). DOD is typically described as a percentage of the storage device’s
useful capacity, so that, for instance, 90% DOD means 10% of the device’s energy capacity remains.
The relationship between self-discharge time and DOD is rarely linear, so self-discharge times must be
measured and compared at a uniform DOD. Acceptable self-discharge times vary greatly, from a few
minutes for some power-quality applications, to years for devices designed to shape annual
power production.
Unit size describes the intrinsic scale of the technology, and is the least well-defined of the parameters
listed here. If the unit size is small compared to the total required capacity of a project, complexity and
supply shortages can increase the cost relative to technologies with a larger unit size. Some technologies
have a fairly large unit size that prohibits small-scale energy storage.
Figure 12.1 maps all of the technologies discussed in this chapter, according to their unit size and 10%
self-discharge time. The gamut of technologies available covers many orders of magnitude on each axis,
illustrating the broad choice available. Utility shaping applications require a moderate self-discharge time
and a large unit size; power-quality applications are much less sensitive to self-discharge time but require
a moderate unit size. Distributed grid and automotive applications both require a moderate self-
discharge time and a moderate unit size.
Efficiency is the ratio of energy output from the device, to the energy input. Like energy density and
specific energy, the system boundary must be carefully considered when measuring efficiency. It is
particularly important to pay attention to the form of energy required at the input and output
interconnections, and to include the entire system necessary to attach to those interconnections. For
instance, if the system is to be used for shaping a constant-velocity, utility wind farm, then presumably
both the input and output will be AC electricity. When comparing a battery with a fuel cell in this
scenario, it is necessary to include the efficiencies of an AC-to-DC rectifier for the battery, an
AC-powered hydrogen generation system for the fuel cell system, and DC-to-AC converters associated
with both systems.
Efficiency is related to self-discharge time. Technologies with a short self-discharge time will require
constant charging to maintain a full charge; if discharge occurs much later than charge in a certain
application, the apparent efficiency will be lower because a significant amount of energy is lost in
maintaining the initial, full charge.
Cycle life is the number of consecutive charge–discharge cycles a storage installation can undergo
while maintaining the installation’s other specifications within certain, limited ranges. Cycle-life
specifications are made against a chosen DOD depending on the application of the storage device.
q 2007 by Taylor & Francis Group, LLC

1010
109
108
107
106
105
104
103
102
101
100 102 104 106 108
Sel
f-di
scha
rgr
to 1
0% D
OD
, s
Intrinsic unit size, J
Ultracaps
Flywheels
Heat
SMES
Pumpedhydro
Hydrogen
(Biofuel)
BiomassBiofuel
Flowbatteries
(Hydrogen)Compressed air
Secondarybatteries
(Heat)
1010 1012 1014 1016 1018 1020
FIGURE 12.1 All storage technologies, mapped by self-discharge time and unit size. Not all hidden lines are shown.
Larger self-discharge times are always more desirable, but more or less important depending on the application.
Intrinsic unit size does not have a desirability proportional to its value, but rather must be matched to the application.
Energy Storage Technologies 12-5
Dow
nloa
ded
by [
Uni
vers
iti T
ekno
logi
Mal
aysi
a -
Skud
ai]
at 0
1:37
09
Janu
ary
2016
In some cases, for example pressurized hydrogen storage in automobiles, each cycle will significantly
discharge the hydrogen canister and the appropriate DOD reference might be 80% or 90%. In other
cases, for example a battery used in a hybrid electric vehicle, most discharge cycles may consume only
10% or 20% of the energy stored in the battery. For most storage technologies, cycle life is significantly
larger for shallow discharges than deep discharges, and it is critical that cycle-life data be compared
across a uniform DOD assumption.
Specific energy is a measure of how heavy the technology is. It is measured in units of energy per mass,
and in this chapter this quantity will always be reported in MJ/kg. The higher the specific energy, the
lighter the device. Automotive applications require high specific energies; for utility applications, specific
energy is relatively unimportant, except where it impacts construction costs.
Energy density is a measure of how much space the technology occupies. It is measured in units of
energy per volume, and in this chapter we will always report this quantity in MJ/L. The higher the energy
density, the smaller the device. Again, this is most important for automotive applications, and rarely
important in utility applications. Typical values for energy density associated with a few automotive-scale
energy technologies are listed in Table 12.2, together with cycle-life and efficiency data.
Energy-density and specific-energy estimates are dependent on the system definition. For example, it
might be tempting to calculate the specific energy of a flow battery technology by dividing its capacity by
the mass of the two electrolytes. But it is important to also include the mass of the electrolyte storage
containers, and of the battery cell for a fair and comparable estimate of its specific energy. Therefore, the
energy density and specific energy are dependent on the size of the specific device; large devices benefit
from efficiency of scale with a higher energy density and specific energy. Specific power and power density
are the power correlates to specific energy and energy density.
q 2007 by Taylor & Francis Group, LLC

TABLE 12.2 Nominal Energy Density, Cycle Life and Efficiency of Automotive Storage Technologies
Energy Density MJ/L Cycle Life at 80% DODa Electric Efficiency %
Ultracapacitors 0.2 50,000 95
Li-ion batteries 1.8 2,000 85
NiMH batteries 0.6 1,000 80
H2 at 350 bar 3.0 n/ab 47
H2 at 700 bar 5.0 n/a 45
Air at 300 bar !0.1 n/a 37
Flywheels !0.1 20,000 80
Ethanol 23.4 n/a n/a
Electric efficiencies are calculated for electric-to-electric conversion and momentary storage.aDepth of discharge.bNot applicable.
12-6 Energy Management and Conservation Handbook
Dow
nloa
ded
by [
Uni
vers
iti T
ekno
logi
Mal
aysi
a -
Skud
ai]
at 0
1:37
09
Janu
ary
2016
12.5 Specifying Fuels
A fuel is any (relatively) homogenous substance that can be combusted to produce heat. Though the
energy contained in a fuel can always be extracted through combustion, other processes may be used to
extract the energy (e.g., reaction in a fuel cell). A fuel may be gaseous, liquid, or solid. All energy storage
technologies in the thermochemical category store energy in a fuel. In the electrochemical category,
electrolytic hydrogen is a fuel.
A fuel’s lower heating value (LHV) is the total quantity of sensible heat released during combustion of
a designated quantify of fuel. For example, in the simplest combustion process, that of hydrogen,
2 H2 CO2 /2 H2OðvaporÞCLHV;
or for the slightly more complex combustion of methane,
CH4 C2 O2 /CO2 C2 H2OðvaporÞCLHV:
In this chapter, the quantity of fuel is always expressed as a mass, so that LHV is a special case of specific
energy. Like specific energy, LHV is expressed in units of MJ/kg in this chapter.
Higher heating value (HHV) is the LHV, plus the latent heat contained in the water vapor resulting
from combustion.3 For the examples of hydrogen and methane, this means
2 H2 CO2 /2 H2OðliquidÞCHHV;
and
CH4 C2 O2 /CO2 C2 H2OðliquidÞCHHV:
The latent heat in the water vapor can be substantial, especially for the hydrogen-rich fuels typical in
renewable energy applications. Table 12.3 lists LHVs and HHVs of fuels discussed in this chapter; in the
most extreme case of molecular hydrogen, the HHV is some 18% higher than the LHV. Recovery of the
latent heat requires controlled condensation of the water vapor.
In this chapter, all heating values are reported as HHV rather than LHV. HHV is favored for two
reasons: (1) its values allow easier checking of energy calculations with the principle of energy
3The concepts of sensible and latent heat are explained further in Section 12.9.
q 2007 by Taylor & Francis Group, LLC

TABLE 12.3 Properties of Fuels
Chemical Formula Density g/L LHV MJ/kg HHV MJ/kg
Methanol CH3OH 794 19.9 22.7
Ethanol C2H5OH 792 26.7 29.7
Methane CH4 0.68 49.5 54.8
Hydrogen H2 0.085 120 142
Dry syngas, airless processa 40H2 C21CO
C10CH4 C29CO2
0.89 11.2 12.6
Dry syngas, air processa 25H2 C16CO C5CH4
C15CO2 C39N2
0.99 6.23 7.01
aChemical formulae and associated properties of syngas are representative; actual composition of syngas will vary widely
according to manufacturing process.
Source: From All except syngas from U.S. Department of Energy, Properties of Fuels, Alternative Fuels Data Center 2004.
Energy Storage Technologies 12-7
Dow
nloa
ded
by [
Uni
vers
iti T
ekno
logi
Mal
aysi
a -
Skud
ai]
at 0
1:37
09
Janu
ary
2016
conservation, and (2) when examining technologies for future implementation, it is wise to keep an
intention of developing methods for extracting as much of each energy source’s value as possible.
12.6 Direct Electric Storage
12.6.1 Ultracapacitors
A capacitor stores energy in the electric field between two oppositely charged conductors. Typically, thin
conducting plates are rolled or stacked into a compact configuration with a dielectric between them. The
dielectric prevents arcing between the plates and allows the plates to hold more charge, increasing the
maximum energy storage. The ultracapacitor—also known as supercapacitor, electrochemical capacitor,
or electric double layer capacitor (EDLC)—differs from a traditional capacitor in that it employs a thin
electrolyte, on the order of only a few angstroms, instead of a dielectric. This increases the energy density
of the device. The electrolyte can be made of either an organic or an aqueous material. The aqueous
design operates over a larger temperature range, but has a smaller energy density than the organic design.
The electrodes are made of a porous carbon that increases the surface area of the electrodes and further
increases energy density over a traditional capacitor.
Ultracapacitors’ ability to effectively equalize voltage variations with quick discharges make them
useful for power-quality management and for regulating voltage in automotive systems during regular
driving conditions. Ultracapacitors can also work in tandem with batteries and fuel cells to relieve peak
power needs (e.g., hard acceleration) for which batteries and fuel cells are not ideal. This could help
extend the overall life and reduce lifetime cost of the batteries and fuel cells used in hybrid and electric
vehicles. This storage technology also has the advantage of very high cycle life of greater than 500,000
cycles and a 10- to 12-year life span.1 The limitations lie in the inability of ultracapacitors to maintain
charge voltage over any significant time, losing up to 10% of their charge per day.
12.6.2 Superconducting Magnetic Energy Storage
An superconducting magnetic energy storage (SMES) system is well suited to storing and discharging
energy at high rates (high power.) It stores energy in the magnetic field created by direct current in a coil
of cryogenically cooled, superconducting material. If the coil were wound using a conventional wire such
as copper, the magnetic energy would be dissipated as heat due to the wire’s resistance to the flow of
current. The advantage of a cryogenically cooled, superconducting material is that it reduces electrical
resistance to almost zero. The SMES recharges quickly and can repeat the charge/discharge sequence
thousands of times without any degradation of the magnet. A SMES system can achieve full power within
100 ms.2 Theoretically, a coil of around 150–500 m radius would be able to support a load of 18,000 GJ at
q 2007 by Taylor & Francis Group, LLC

12-8 Energy Management and Conservation Handbook
Dow
nloa
ded
by [
Uni
vers
iti T
ekno
logi
Mal
aysi
a -
Skud
ai]
at 0
1:37
09
Janu
ary
2016
1000 MW, depending on the peak field and ratio of the coil’s height and diameter.3 Recharge time can be
accelerated to meet specific requirements, depending on system capacity.
Because no conversion of energy to other forms is involved (e.g., mechanical or chemical), the energy
is stored directly and round-trip efficiency can be very high.2 SMES systems can store energy with a loss of
only 0.1%; this loss is due principally to energy required by the cooling system.3 Mature, commercialized
SMES is likely to operate at 97%–98% round-trip efficiency and is an excellent technology for providing
reactive power on demand.
12.7 Electrochemical Energy Storage
12.7.1 Secondary Batteries
A secondary battery allows electrical energy to be converted into chemical energy, stored, and converted
back to electrical energy. Batteries are made up of three basic parts: a negative electrode, positive
electrode, and an electrolyte (Figure 12.2). The negative electrode gives up electrons to an external load,
and the positive electrode accepts electrons from the load. The electrolyte provides the pathway for
charge to transfer between the two electrodes. Chemical reactions between each electrode and the
electrolyte remove electrons from the positive electrode and deposit them on the negative electrode. This
can be written as an overall chemical reaction that represents the states of charging and discharging of a
battery. The speed at which this chemical reaction takes place is related to the internal resistance that
dictates the maximum power at which the batteries can be charged and discharged.
Some batteries suffer from the “memory effect” in which a battery exhibits a lower discharge voltage
under a given load than is expected. This gives the appearance of lowered capacity but is actually a voltage
depression. Such a voltage depression occurs when a battery is repeatedly discharged to a partial depth
and recharged again. This builds an increased internal resistance at this partial depth of discharge and the
battery appears as a result to only be dischargeable to the partial depth. The problem, if and when it
occurs, can be remedied by deep discharging the cell a few times. Most batteries considered for modern
renewable applications are free from this effect, however.
Electrolyte
Pos
itive
ele
ctro
de
Neg
ativ
e el
ectr
ode
Load
− Ions
+ Ions
+ −
e−
FIGURE 12.2 Schematic of a generalized secondary battery. Directions of electron and ion migration shown are for
discharge, so that the positive electrode is the cathode and the negative electrode is the anode. During charge,
electrons and ions move in the opposite directions and the positive electrode becomes the anode while the negative
electrode becomes the cathode.
q 2007 by Taylor & Francis Group, LLC

Energy Storage Technologies 12-9
Dow
nloa
ded
by [
Uni
vers
iti T
ekno
logi
Mal
aysi
a -
Skud
ai]
at 0
1:37
09
Janu
ary
2016
12.7.2 Lead–Acid
Lead–acid is one of the oldest and most mature battery technologies. In its basic form, the lead–acid
battery consists of a lead (Pb) negative electrode, a lead dioxide (PbO2) positive electrode and a separator
to electrically isolate them. The electrolyte is dilute sulfuric acid (H2SO4), which provides the sulfate ions
for the discharge reactions. The chemistry is represented by:
PbO2 CPb C2 H2SO4 42 PbSO4 C2 H2O:
(In all battery chemistries listed in this chapter, left-to-right indicates battery discharge and right-
to-left indicates charging.)
There are three main types of lead–acid batteries: the flooded cell, the sealed gel cell, and the sealed
absorbed glass mat (AGM) lead–acid battery. The wet cell has a liquid electrolyte that must be replaced
occasionally to replenish the hydrogen and oxygen that escape during the charge cycle. The sealed gel cell
has a silica component added to the electrolyte to stiffen it. The AGM design uses a fiberglass-like
separator to hold electrolyte in close proximity to the electrodes, thereby increasing efficiency. For both
the gel and AGM configurations, there is a greatly reduced risk of hydrogen explosion and corrosion from
disuse. These two types do require a lower charging rate, however. Both the gel cells and the AGM
batteries are sealed and pressurized so that oxygen and hydrogen produced during the charge cycle are
recombined into water.
The lead–acid battery is a low-cost and popular storage choice for power-quality applications. Its
application for utility shaping, however, has been very limited due to its short cycle life. A typical
installation survives a maximum of 1500 deep cycles.4 Yet, lead–acid batteries have been used in a few
commercial and large-scale energy management applications. The largest one is a 140-GJ system in
Chino, California, built in 1988. Lead–acid batteries have a specific energy of only 0.18 MJ/kg and would
therefore not be a viable automobile option apart from providing the small amount of energy needed to
start an engine. It also has a poor energy density at around 0.25 MJ/L. The advantages of the lead–acid
battery technology are low cost and high power density.
12.7.3 Lithium-Ion
Lithium-ion and lithium polymer batteries, although primarily used in the portable electronics market,
are likely to have future use in many other applications. The cathode in these batteries is a lithiated metal
oxide (LiCoO2, LiMO2, etc.) and the anode is made of graphitic carbon with a layer structure. The
electrolyte consists of lithium salts (such as LiPF6) dissolved in organic carbonates; an example of Li-ion
battery chemistry is
LixC CLi1KxCoO2 4LiCoO2 CC:
When the battery is charged, lithium atoms in the cathode become ions and migrate through the
electrolyte toward the carbon anode where they combine with external electrons and are deposited
between carbon layers as lithium atoms. This process is reversed during discharge. The lithium polymer
variation replaces the electrolyte with a plastic film that does not conduct electricity but allows ions to
pass through it. The 608C operating temperature requires a heater, reducing overall efficiency slightly.
Lithium-ion batteries have a high energy density of about 0.72 MJ/L and have low internal resistance;
they will achieve efficiencies in the 90% range and above. They have an energy density of around
0.72 MJ/kg. Their high energy efficiency and energy density make lithium-ion batteries excellent
candidates for storage in all four applications considered here: utility shaping, power quality, distributed
generation, and automotive.
q 2007 by Taylor & Francis Group, LLC
12-10 Energy Management and Conservation Handbook
Dow
nloa
ded
by [
Uni
vers
iti T
ekno
logi
Mal
aysi
a -
Skud
ai]
at 0
1:37
09
Janu
ary
2016
12.7.4 Nickel–Cadmium
Nickel–cadmium (NiCd) batteries operate according to the chemistry:
2 NiOOH C2 H2O CCd42 NiðOHÞ2 CCdðOHÞ2:
NiCd batteries are not common for large stationary applications. They have a specific energy of about
0.27 MJ/kg, an energy density of 0.41 MJ/L and an efficiency of about 75%. Alaska’s Golden Valley
Electric Association commissioned a 40-MW/290-GJ nickel–cadmium battery in 2003 to improve
reliability and to supply power for essentials during outages.5 Resistance to cold and relatively low cost
were among the deciding factors for choosing the NiCd chemistry.
Cadmium is a toxic heavy metal and there are concerns relating to the possible environmental hazards
associated with the disposal of NiCd batteries. In November 2003, the European Commission adopted a
proposal for a new battery directive that includes recycling targets of 75% for NiCd batteries. However,
the possibility of a ban on rechargeable batteries made from nickel–cadmium still remains and hence the
long-term viability and availability of NiCd batteries continues to be uncertain. NiCd batteries can also
suffer from “memory effect,” where the batteries will only take full charge after a series of full discharges.
Proper battery management procedures can help to mitigate this effect.
12.7.5 Nickel–Metal Hydride
The nickel–metal hydride (NiMH) battery operates according to the chemistry:
MH CNiOOH4M CNiðOHÞ2;
where M represents one of a large variety of metal alloys that serve to take up and release hydrogen.
NiMH batteries were introduced as a higher energy density and more environmentally friendly version of
the nickel–cadmium cell. Modern nickel–metal hydride batteries offer up to 40% higher energy density
than nickel–cadmium. There is potential for yet higher energy density, but other battery technologies
(lithium-ion, in particular) may fill the same market sooner.
Nickel–metal hydride is less durable than nickel–cadmium. Cycling under heavy load and storage at
high temperature reduces the service life. Nickel–metal hydride suffers from a higher self-discharge rate
than the nickel–cadmium chemistry. Nickel–metal hydride batteries have a specific energy of 0.29 MJ/kg,
an energy density of about 0.54 MJ/L and an energy efficiency of about 70%. These batteries have been an
important bridging technology in the portable electronics and hybrid automobile markets. Their future
is uncertain because other battery chemistries promise higher energy storage potential and cycle life.
12.7.6 Sodium–Sulfur
A sodium–sulfur (NaS) battery consists of a liquid (molten) sulfur positive electrode and liquid (molten)
sodium negative electrode, separated by a solid beta-alumina ceramic electrolyte (Figure 12.3). The
chemistry is as follows:
2 Na Cx S4Na2Sx:
When discharging, positive sodium ions pass through the electrolyte and combine with the sulfur to
form sodium polysulfides. The variable x in the equation is equal to 5 during early discharging, but after
free sulfur has been exhausted a more sodium-rich mixture of polysulfides with lower average values of x
develops. This process is reversible as charging causes sodium polysulfides in the positive electrode to
release sodium ions that migrate back through the electrolyte and recombine as elemental sodium. The
battery operates at about 3008C. NaS batteries have a high energy density of around 0.65 MJ/L and a
specific energy of up to 0.86 MJ/kg. These numbers would indicate an application in the automotive
sector, but warm-up time and heat-related accident risk make its use there unlikely. The efficiency of this
q 2007 by Taylor & Francis Group, LLC

Na+
Na
Load
Beta-alumina electrolyte
S + Na2Sx
−
e−
+
FIGURE 12.3 Sodium–sulfur battery showing discharge chemistry. The sodium (Na) and sulfur (S) electrodes are
both in a liquid state and are separated by a solid, beta-alumina ceramic electrolyte that allows only sodium ions to
pass. Charge is extracted from the electrolytes with metal contacts; the positive contact is the battery wall.
Energy Storage Technologies 12-11
Dow
nloa
ded
by [
Uni
vers
iti T
ekno
logi
Mal
aysi
a -
Skud
ai]
at 0
1:37
09
Janu
ary
2016
battery chemistry can be as high as 90% and would be suitable for bulk storage applications while
simultaneously allowing effective power smoothing operations.6
12.7.7 Zebra
Zebra is the popular name for the sodium–nickel-chloride battery chemistry:
NiCl2 C2 Na4Ni C2 NaCl:
Zebra batteries are configured similarly to sodium–sulfur batteries (see Figure 12.3), and also operate
at about 3008C. Zebra batteries boast a greater than 90% energy efficiency, a specific energy of up to
0.32 MJ/kg and an energy density of 0.49 MJ/L.7 Its tolerance for a wide range of operating
temperature and high efficiency, coupled with a good energy density and specific energy, make its
most probable application the automobile sector, and as of 2003 Switzerland’s MES-DEA is pursuing
this application aggressively.8 Its high energy efficiency also makes it a good candidate for the
utility sector.
12.7.8 Flow Batteries
Most secondary batteries use electrodes both as an interface for gathering or depositing electrons, and as
a storage site for the products or reactants associated with the battery’s chemistry. Consequently, both
energy and power density are tied to the size and shape of the electrodes. Flow batteries store and release
electrical energy by means of reversible electrochemical reactions in two liquid electrolytes. An
electrochemical cell has two compartments—one for each electrolyte—physically separated by an ion
exchange membrane. Electrolytes flow into and out of the cell through separate manifolds and undergo
chemical reaction inside the cell, with ion or proton exchange through the membrane and electron
exchange through the external electric circuit. The chemical energy in the electrolytes is turned into
electrical energy and vice versa for charging. They all work in the same general way but vary in chemistry
of electrolytes.9
q 2007 by Taylor & Francis Group, LLC

12-12 Energy Management and Conservation Handbook
Dow
nloa
ded
by [
Uni
vers
iti T
ekno
logi
Mal
aysi
a -
Skud
ai]
at 0
1:37
09
Janu
ary
2016
There are some advantages to using the flow battery over a conventional secondary battery. The
capacity of the system is scaleable by simply increasing the amount of solution. This leads to cheaper
installation costs as the systems get larger. The battery can be fully discharged with no ill effects and has
little loss of electrolyte over time. Because the electrolytes are stored separately and in large containers
(with a low surface area to volume ratio), flow batteries show promise to have some of the lowest self-
discharge rates of any energy storage technology available.
Poor energy densities and specific energies remand these battery types to utility-scale power shaping
and smoothing, although they might be adaptable for distributed-generation use. There are three types of
flow batteries that are closing in on commercialization: vanadium redox, polysulfide bromide, and
zinc bromide.
12.7.8.1 Vanadium Redox
The vanadium redox flow battery (VRB) was pioneered at the University of New South Wales, Australia,
and has shown potentials for long cycle life and energy efficiencies of over 80% in large installations.10
The VRB uses compounds of the element vanadium in both electrolyte tanks. The reaction chemistry at
the positive electrode is:
V5C CeK4V4C;
and at the negative electrode,
V2C4V3C CeK:
Using vanadium compounds on both sides of the ion-exchange membrane eliminates the possible
problem of cross-contamination of the electrolytes and makes recycling easier.11 As of 2005, two small,
utility-scale VRB installations are operating, one 2.9-GJ unit on King Island, Australia and one 7.2-GJ
unit in Castle Valley, Utah.
12.7.8.2 Polysulfide Bromide
The polysulfide bromide battery (PSB) utilizes two salt solution electrolytes, sodium bromide (NaBr) and
sodium polysulfide (Na2Sx). PSB electrolytes are separated in the battery cell by a polymer membrane
that only passes positive sodium ions. The chemistry at the positive electrode is
NaBr3 C2 NaC C2 eK43 NaBr;
and at the negative electrode,
2 Na2S2 4Na2S4 C2 NaC C2 eK:
The PSB battery is being developed by Canada’s VRB Power Systems, Inc.12 This technology is
expected to attain energy efficiencies of approximately 75%.13 Although the salt solutions themselves are
only mildly toxic, a catastrophic failure by one of the tanks could release highly toxic bromine gas.
Nevertheless, the Tennessee Valley Authority released a finding of no significant impact for a proposed
430-GJ facility and deemed it safe.14
12.7.8.3 Zinc Bromide
In each cell of a zinc bromide (ZnBr) battery, two different electrolytes flow past carbon-plastic
composite electrodes in two compartments separated by a microporous membrane. Chemistry at the
positive electrode follows the equation:
Br2ðaqÞC2 eK42 Br;
and at the negative electrode:
Zn4Zn2C C2eK:
q 2007 by Taylor & Francis Group, LLC

Energy Storage Technologies 12-13
Dow
nloa
ded
by [
Uni
vers
iti T
ekno
logi
Mal
aysi
a -
Skud
ai]
at 0
1:37
09
Janu
ary
2016
During discharge, Zn and Br combine into zinc bromide. During charge, metallic zinc is deposited as a
thin-film on the negative electrode. Meanwhile, bromine evolves as a dilute solution on the other side of
the membrane, reacting with other agents to make thick bromine oil that sinks to the bottom of the
electrolytic tank. During discharge, a pump mixes the bromine oil with the rest of the electrolyte. The
zinc bromide battery has an energy efficiency of nearly 80%.15
Exxon developed the ZnBr battery in the early 1970 s. Over the years, many GJ-scale ZnBr batteries
have been built and tested. Meidisha demonstrated a 1-MW/14-GJ ZnBr battery in 1991 at Kyushu
Electric Power Company. Some GJ-scale units are now available preassembled, complete with plumbing
and power electronics.
12.7.9 Electrolytic Hydrogen
Diatomic, gaseous hydrogen (H2) can be manufactured with the process of electrolysis; an electric
current applied to water separates it into components O2 and H2. The oxygen has no inherent energy
value, but the HHV of the resulting hydrogen can contain up to 90% of the applied electric energy,
depending on the technology.16 This hydrogen can then be stored and later combusted to provide heat or
work, or to power a fuel cell.
The gaseous hydrogen is low density and must be compressed to provide useful storage. Compression
to a storage pressure of 350 bar, the value usually assumed for automotive technologies, consumes up to
12% of the hydrogen’s HHV if performed adiabatically, although the loss approaches a lower limit of 5%
as the compression approaches an isothermal ideal.17 Alternatively, the hydrogen can be stored in liquid
form, a process that costs about 40% of HHV using current technology, and that at best would consume
about 25%. Liquid storage is not possible for automotive applications, because mandatory boil-off from
the storage container cannot be safely released in closed spaces (i.e., garages).
Hydrogen can also be bonded into metal hydrides using an absorption process. The energy penalty of
storage may be lower for this process, which requires pressurization to only 30 bar. However, the density
of the metal hydride can be between 20 and 100 times the density of the hydrogen stored. Carbon
nanotubes have also received attention as a potential hydrogen storage medium.18
12.8 Mechanical Energy Storage
12.8.1 Pumped Hydro
Pumped hydro is the oldest and largest of all of the commercially available energy storage technologies,
with existing facilities up to 1000 MW in size. Conventional pumped hydro uses two water reservoirs,
separated vertically. Energy is stored by moving water from the lower to the higher reservoir, and
extracted by allowing the water to flow back to the lower reservoir. Energy is stored according to the
fundamental physical principle of potential energy. To calculate the stored energy, Es, in joules, use the
formula:
Es Z Vdgh;
where V is the volume of water raised (m3), d is the density of water (1000 kg/m3), g is the acceleration of
gravity (9.8 m/s2), and h is the elevation difference between the reservoirs (m) often referred to as
the head.
Though pumped hydro is by nature a mechanical energy storage technology, it is most commonly used
for electric utility shaping. During off-peak hours electric pumps move water from the lower reservoir to
the upper reservoir. When required, the water flow is reversed to generate electricity. Some high dam
hydro plants have a storage capability and can be dispatched as pumped hydro storage. Underground
pumped storage, using flooded mine shafts or other cavities, is also technically possible but probably
prohibitively expensive. The open sea can also be used as the lower reservoir if a suitable upper reservoir
q 2007 by Taylor & Francis Group, LLC

12-14 Energy Management and Conservation Handbook
Dow
nloa
ded
by [
Uni
vers
iti T
ekno
logi
Mal
aysi
a -
Skud
ai]
at 0
1:37
09
Janu
ary
2016
can be built at close proximity. A 30-MW seawater pumped hydro plant was first built in Yanbaru, Japan
in 1999.
Pumped hydro is most practical at a large scale with discharge times ranging from several hours to a
few days. There is over 90 GW of pumped storage in operation worldwide, which is about 3% of global
electric generation capacity.19 Pumped storage plants are characterized by long construction times and
high capital expenditure. Its main application is for utility shaping. Pumped hydro storage has the
limitation of needing to be a very large capacity to be cost-effective, but can also be used as storage for a
number of different generation sites.
Efficiency of these plants has greatly increased in the last 40 years. Pumped storage in the 1960s had
efficiencies of 60% compared with 80% for new facilities. Innovations in variable speed motors have
helped these plants operate at partial capacity, and greatly reduced equipment vibrations, increasing
plant life.
12.8.2 Compressed Air
A relatively new energy storage concept that is implemented with otherwise mature technologies is
compressed air energy storage (CAES). CAES facilities must be coupled with a combustion turbine, so
are actually a hybrid storage/generation technology.
A conventional gas turbine consists of three basic components: a compressor, combustion chamber,
and an expander. Power is generated when compressed air and fuel burned in the combustion chamber
drive turbine blades in the expander. Approximately 60% of the mechanical power generated by the
expander is consumed by the compressor supplying air to the combustion chamber.
A CAES facility performs the work of the compressor separately, stores the compressed air, and at a
later time injects it into a simplified combustion turbine. The simplified turbine includes only the
combustion chamber and the expansion turbine. Such a simplified turbine produces far more energy
than a conventional turbine from the same fuel, because there is potential energy stored in the
compressed air. The fraction of output energy beyond what would have been produced in a conventional
turbine is attributable to the energy stored in compression.
The net efficiency of storage for a CAES plant is limited by the heat energy loss occurring at
compression. The overall efficiency of energy storage is about 75%.20
CAES compressors operate on grid electricity during off-peak times, and use the expansion turbine to
supply peak electricity when needed. CAES facilities cannot operate without combustion because the
exhaust air would exit at extremely low temperatures causing trouble with brittle materials and icing. If
100% renewable energy generation is sought, biofuel could be used to fuel the gas turbines. There might
still be other emissions issues but the system could be fully carbon neutral.
The compressed air is stored in appropriate underground mines, caverns created inside salt rocks or
possibly in aquifers. The first commercial CAES facility was a 290-MW unit built in Hundorf, Germany
in 1978. The second commercial installation was a 110-MW unit built in McIntosh, Alabama in 1991.
The third commercial CAES is a 2,700-MW plant under construction in Norton, Ohio. This nine-unit
plant will compress air to about 100 bar in an existing limestone mine 2200 ft. (766 m) underground.21
The natural synergy with geological caverns and turbine prime movers dictate that these be on the
utility scale.
12.8.3 Flywheels
Most modern flywheel energy storage systems consist of a massive rotating cylinder (comprised of a rim
attached to a shaft) that is supported on a stator by magnetically levitated bearings that eliminate bearing
wear and increase system life. To maintain efficiency, the flywheel system is operated in a low vacuum
environment to reduce drag. The flywheel is connected to a motor/generator mounted onto the stator
that, through some power electronics, interact with the utility grid.
q 2007 by Taylor & Francis Group, LLC

Energy Storage Technologies 12-15
Dow
nloa
ded
by [
Uni
vers
iti T
ekno
logi
Mal
aysi
a -
Skud
ai]
at 0
1:37
09
Janu
ary
2016
The energy stored in a rotating flywheel, in joules, is given by
E Z1
2Iu2
where I is the flywheel’s moment of inertia (kg m2), and u is its angular velocity (sK2). I is proportional
to the flywheel’s mass, so energy is proportional to mass and the square of speed. In order to maximize
energy capacity, flywheel designers gravitate toward increasing the flywheel’s maximum speed rather than
increasing its moment of inertia. This approach also produces flywheels with the higher specific energy.
Some of the key features of flywheels are low maintenance, a cycle life of better than 10,000 cycles, a
20-year lifetime and environmentally friendly materials. Low-speed, high-mass flywheels (relying on I for
energy storage) are typically made from steel, aluminum, or titanium; high-speed, low-mass flywheels
(relying on u for energy storage) are constructed from composites such as carbon fiber.
Flywheels can serve as a short-term ride-through before long-term storage comes online. Their low
energy density and specific energy limit them to voltage regulation and UPS capabilities. Flywheels can
have energy efficiencies in the upper 90% range depending on frictional losses.
12.9 Direct Thermal Storage
Direct thermal technologies, although they are storing a lower grade of energy (heat, rather than electrical
or mechanical energy) can be useful for storing energy from systems that provide heat as a native output
(e.g., solar thermal, geothermal), or for applications where the energy’s commodity value is heat
(e.g., space heating, drying).
Although thermal storage technologies can be characterized by specific energy and energy density like
any other storage technology, they can also be characterized by an important, additional parameter: the
delivery temperature range. Different end uses have more or less allowance for wide swings of the delivery
temperature. Also, some applications require a high operating temperature that only some thermal
storage media are capable of storing.
Thermal storage can be classified into two fundamental categories: sensible heat storage and latent heat
storage. Applications that have less tolerance for temperature swings should utilize a latent heat technology.
Input to and output from heat energy storage is accomplished with heat exchangers. The discussion
below focuses on the choice of heat storage materials; the methods of heat exchange will vary widely
depending on properties of the storage material, especially its thermal conductivity. Materials with higher
thermal conductivity will require a smaller surface area for heat exchange. For liquids, convection or
pumping can reduce the need for a large heat exchanger. In some applications, the heat exchanger is
simply the physical interface of the storage material with the application space (e.g., phase-change
drywall, see below).
12.9.1 Sensible Heat
Sensible heat is the heat that is customarily and intuitively associated with a change in temperature of a
massive substance. The heat energy, Es, stored in such a substance is given by:
Es Z ðT2 KT1ÞcM;
where c is the specific heat of the substance (J/kg 8C) and M is the mass of the substance (kg); T1 and T2
are the initial and final temperatures, respectively (8C). The specific heat c is a physical parameter
measured in units of heat per temperature per mass: substances with the ability to absorb heat energy
with a relatively small increase in temperature (e.g., water) have a high specific heat, whereas those that
get hot with only a little heat input (e.g., lead) have a low specific heat. Sensible heat storage is best
accomplished with materials having a high specific heat.
q 2007 by Taylor & Francis Group, LLC

12-16 Energy Management and Conservation Handbook
Dow
nloa
ded
by [
Uni
vers
iti T
ekno
logi
Mal
aysi
a -
Skud
ai]
at 0
1:37
09
Janu
ary
2016
12.9.1.1 Liquids
Sensible heat storage in a liquid is, with very few exceptions, accomplished with water. Water is unique
among chemicals in having an abnormally high specific heat of 4,186 J/kg K, and furthermore has a
reasonably high density. Water is also cheap and safe. It is the preferred choice for most nonconcentrating
solar thermal collectors.
Liquids other than water may need to be chosen if the delivery temperature must be higher than 1008C, or
if the system temperature can fall below 08C. Water can be raised to temperatures higher than 1008C, but the
costs of storage systems capable of containing the associated high pressures are usually prohibitive. Water
can be mixed with ethylene glycol or propylene glycol to increase the useful temperature range and
prevent freezing.
When a larger temperature range than that afforded by water is required, mineral, synthetic, or silicone
oils can be used instead. The tradeoffs for the increased temperature range are higher cost, lower specific
heat, higher viscosity (making pumping more difficult), flammability, and, in some cases, toxicity.
For very high temperature ranges, salts are usually preferred that balance a low specific heat with a high
density and relatively low cost. Sodium nitrate has received the most prominent testing for this purpose
in the U.S. Department of Energy’s Solar Two Project located in Barstow, California.
Liquid sensible heat storage systems are strongly characterized not just by the choice of heat-transfer
fluid, but also by the system architecture. Two-tank systems store the cold and hot liquids in separate
tanks (Figure 12.4). Thermocline systems use a single tank with cold fluid entering or leaving the bottom
of the tank and hot fluid entering or leaving the top (Figure 12.5). Thermocline systems can be
particularly low cost because they minimize the required tank volume, but require careful design to
prevent mixing of the hot and cold fluid.
One particularly interesting application of the thermocline concept is nonconvecting, salinity-gradient
solar ponds that employ the concept in reverse. Solar ponds are both an energy collection and energy storage
technology. Salts are dissolved in the water to introduce a density gradient, with the densest (saltiest) water on
the bottom and lightest (freshest) on top. Solar radiation striking the dark bottom of the pond heats the
densest water, but convection of the heated water to the top cannot occur because the density gradient
prevents it. Salinity-gradient ponds can generate and store hot water at temperatures approaching 958C.22
C
H
Heatsource
Cold tank
Hot tank
Load
FIGURE 12.4 Two-tank thermal storage system; hot water is shown in gray and cold water is shown in white. When
the heat source is producing more output than required for the load, valve H is turned to deposit hot liquid in the
tank. When it is producing less than required for the load, the valve is turned to provide supplemental heat from the
storage tank. Note that each tank must be large enough to hold the entire fluid capacity of the system.
q 2007 by Taylor & Francis Group, LLC

H
Heatsource Tank Load
C
FIGURE 12.5 Thermocline storage tank. Thermocline storage tanks are tall and narrow to encourage the gravity-
assisted separation of hot and cold fluid, and include design features (especially at the input/output connectors) to
prevent mixing in the stored fluid.
Energy Storage Technologies 12-17
Dow
nloa
ded
by [
Uni
vers
iti T
ekno
logi
Mal
aysi
a -
Skud
ai]
at 0
1:37
09
Janu
ary
2016
12.9.1.2 Solids
Storage of sensible heat in solids is usually most effective when the solid is in the form of a bed of small
units, rather than a single mass. The reason is that the surface-to-volume ratio increases with the number
of units, so that heat transfer to and from the storage device is faster for a greater number of units. Energy
can be stored or extracted from a thermal storage bed by passing a gas (such as air) through the bed.
Thermal storage beds can be used to extract and store the latent heat of vaporization from water
contained in flue gases.
Although less effective for heat transfer, monolithic solid storage has been successfully used in
architectural applications and solar cookers.
12.9.2 Latent Heat
Latent heat is absorbed or liberated by a phase change or a chemical reaction and occurs at a constant
temperature. A phase change means the conversion of a homogenous substance among its various solid,
liquid, or gaseous phases. One very common example is boiling water on the stovetop: though a
substantial amount of heat is absorbed by the water in the pot, the boiling water maintains a constant
temperature of 1008C. The latent heat, Es, stored through a phase change is:
Es Z lM;
where M is the mass of material undergoing a phase change (kg), and l is the latent heat of vaporization
(for liquid–gas phase changes) or the latent heat of fusion (for solid–liquid phase changes), in J/kg; l is
measured in units of energy per mass. Conservation of energy dictates that the amount of heat absorbed
in a given phase change is equal to the amount of heat liberated in the reverse phase change.
Although the term phase change is used here to refer only to straightforward freezing and melting,
many sources use the term phase-change materials or PCMs to refer to any substance storing latent heat
(including those described in Section 12.9.2.2 and Section 12.9.2.3, as well.)
12.9.2.1 Phase Change
Practical energy storage systems based on a material phase change are limited to solid–solid and solid–
liquid phase changes. Changes involving gaseous phases are of little interest due to the expense associated
with containing a pressurized gas, and difficulty of transferring heat to and from a gas.
q 2007 by Taylor & Francis Group, LLC

12-18 Energy Management and Conservation Handbook
Dow
nloa
ded
by [
Uni
vers
iti T
ekno
logi
Mal
aysi
a -
Skud
ai]
at 0
1:37
09
Janu
ary
2016
Solid–solid phase changes occur when a solid material reorganizes into a different molecular structure
in response to temperature. One particularly interesting example is lithium sulfate (Li2SO4) which
undergoes a change from a monoclinic structure to a face-centered cubic structure at 5788C, absorbing
214 J/g in the process, more than most solid–liquid phase changes.23
Some common chemicals, their melting points and heats of fusion are listed in Table 12.4. Fatty acids
and paraffins received particular attention in the 1990s as candidate materials for the heat storage
component of phase-change drywall, a building material designed to absorb and release heat energy near
room temperature for the purpose of indoor temperature stabilization.24 In this application, solids in the
drywall maintain the material’s structural integrity even though the phase-change materials are
transitioning between solid and liquid states.
12.9.2.2 Hydration–Dehydration
In this process, a salt or similar compound forms a crystalline lattice with water below a “melting-point”
temperature, and at the melting point the crystal dissolves in its own water of hydration. Sodium sulfate
(Na2SO4) is a good example, forming a lattice with ten molecules of water per molecule of sulfate
(Na2SO4$10H2O) and absorbing 241 J/g at 328C.25
Hydration–dehydration reactions have not found significant application in renewable energy systems,
although they, too, have been a candidate for phase-change drywall.
12.9.2.3 Chemical Reaction
A wide variety of reversible chemical reactions are available that release and absorb heat (see, for example,
Hanneman, Vakil, and Wentorf26). The principal feature of this category of latent heat storage
technologies is the ability to operate at extremely high temperatures, in some cases over 9008C.
Extremely high temperature applications have focused primarily on fossil and advanced nuclear
applications; to date, none of these chemical methods of heat storage have been deployed in commercial
renewable energy applications.
TABLE 12.4 Melting Points and Heats of Fusion for Solid–Liquid Phase Changes
Melting Point8C Heat of Fusion J/g
Aluminum bromide 97 42
Aluminum iodide 191 81
Ammonium bisulfate 144 125
Ammonium nitrate 169 77
Ammonium thiocyanate 146 260
Anthracine 96 105
Arsenic tribromide 32 37
Beeswax 62 177
Boron hydride 99 267
Metaphosphoric acid 43 107
Naphthalene 80 149
Naphthol 95 163
Paraffin 74 230
Phosphoric acid 70 156
Potassium 63 63
Potassium thiocyanate 179 98
Sodium 98 114
Sodium hydroxide 318 167
Sulfur 110 56
Tallow 76 198
Water 0 335
Source: From Kreith, F. and Kreider J.F., Principles of Solar Engineering, Taylor & Francis,
1978. With permission
q 2007 by Taylor & Francis Group, LLC

Energy Storage Technologies 12-19
Dow
nloa
ded
by [
Uni
vers
iti T
ekno
logi
Mal
aysi
a -
Skud
ai]
at 0
1:37
09
Janu
ary
2016
12.10 Thermochemical Energy Storage
This section provides an overview of biomass storage technologies from an energetic perspective only.
12.10.1 Biomass Solids
Plant matter is a storage medium for solar energy. The input mechanism is photosynthesis conversion of
solar radiation into biomass. The output mechanism is combustion of the biomass to generate
heat energy.
Biologists measure the efficiency of photosynthetic energy capture with the metric net primary
productivity (NPP), which is usually reported as a yield in units similar to dry Mg/ha-yr (dry metric tons
per hectare per year). However, to enable comparisons of biomass with other solar energy storage
technologies, it is instructive to estimate a solar efficiency by multiplying the NPP by the biomass heating
value (e.g., MJ/dry Mg) and then dividing the result by the average insolation at the crop’s location (e.g.,
MJ/ha-yr). The solar efficiency is a unitless value describing the fraction of incident solar energy
ultimately available as biomass heating value. Most energy crops capture between 0.2 and 2% of the
incident solar energy in heating value of the biomass; Table 12.5 shows examples of solar efficiencies
estimated for a number of test crops.
TABLE 12.5 Primary Productivity and Solar Efficiency of Biomass Crops
Location Crop Yield
(dry Mg/ha-yr)
Average Insolation
(W/m2)
Solar
Efficiency(%)
Alabama Johnsongrass 5.9 186 0.19
Alabama Switchgrass 8.2 186 0.26
Minnesota Willow and hybrid poplar 8–11 159 0.30–0.41
Denmark Phytoplankton 8.6 133 0.36
Sweden Enthropic lake angiosperm 7.2 106 0.38
Texas Switchgrass 8–20 212 0.22–0.56
California Euphorbia lathyris 16.3–19.3 212 0.45–0.54
Mississippi Water hyacinth 11.0–33.0 194 0.31–0.94
Texas Sweet sorghum 22.2–40.0 239 0.55–0.99
Minnesota Maize 24.0 169 0.79
West Indies Tropical marine angiosperm 30.3 212 0.79
Israel Maize 34.1 239 0.79
Georgia Subtropical saltmarsh 32.1 194 0.92
Congo Tree plantation 36.1 212 0.95
New Zealand Temperate grassland 29.1 159 1.02
Marshall Islands Green algea 39.0 212 1.02
New South Wales Rice 35.0 186 1.04
Puerto Rico Panicum maximum 48.9 212 1.28
Nova Scotia Sublittoral seaweed 32.1 133 1.34
Colombia Pangola grass 50.2 186 1.50
West Indies Tropical forest, mixed ages 59.0 212 1.55
California Algae, sewage pond 49.3–74.2 218 1.26–1.89
England Coniferous forest, 0–21 years 34.1 106 1.79
Germany Temperate reedswamp 46.0 133 1.92
Holland Maize, rye, two harvests 37.0 106 1.94
Puerto Rico Pennisetum purpurcum 84.5 212 2.21
Hawaii Sugarcane 74.9 186 2.24
Java Sugarcane 86.8 186 2.59
Puerto Rico Napier grass 106 212 2.78
Thailand Green algae 164 186 4.90
Source: From Klass, D. L., Biomass for Renewable Energy, Fuels, and Chemicals, Academic Press, San Diego, CA, 1998.
With permission.
q 2007 by Taylor & Francis Group, LLC

12-20 Energy Management and Conservation Handbook
Dow
nloa
ded
by [
Uni
vers
iti T
ekno
logi
Mal
aysi
a -
Skud
ai]
at 0
1:37
09
Janu
ary
2016
The principal method for extracting useful work or electricity from biomass solids is combustion.
Therefore, the solar efficiencies listed in Table 12.5 need to be multiplied by the efficiency of any
associated combustion process to yield a net solar efficiency. For example, if a boiler-based electric
generator extracts 35% of the feedstock energy as electricity, and the generator is sited at a switchgrass
plantation achieving 0.30% solar capture efficiency on a mass basis, the electric plant has a net solar
efficiency of 0.30%!35%Z0.11%. Because biomass is a low-efficiency collector of solar energy, it is very
land intensive compared to photovoltaic or solar thermal collectors that deliver energy at solar
efficiencies over 20%. However, the capacity of land to store standing biomass over time is extremely
high, with densities up to several hundred Mg/ha (and therefore several thousand GJ/ha), depending on
the forest type. Standing biomass can serve as long-term storage, although multiple stores need to be used
to accommodate fire risk. For short-term storage, woody biomass may be dried, and is frequently
chipped or otherwise mechanically treated to create a fine and homogenous fuel suitable for burning in a
wider variety of combustors.
12.10.2 Ethanol
Biomass is a more practical solar energy storage medium if it can be converted to liquid form. Liquids
allow for more convenient transportation and combustion, and enable extraction on demand (through
reciprocating engines) rather than through a less dispatchable, boiler- or turbine-based process. This
latter property also enables its use in automobiles.
Biomass grown in crops or collected as residue from agricultural processes consists principally of
cellulose, hemicellulose, and lignin. The sugary or starchy by-products of some crops such as sugarcane,
sugar beet, sorghum, molasses, corn, and potatoes can be converted to ethanol through fermentation
processes, and these processes are the principal source of ethanol today. Starch-based ethanol
production is low efficiency, but does succeed in transferring about 16% of the biomass heating
value to the ethanol fuel.27
When viewed as a developing energy storage technology, ethanol derived from cellulose shows much
more promise than the currently prevalent starch-based ethanol.28 Cellulosic ethanol can be
manufactured with two fundamentally different methods: either the biomass is broken down to
sugars using a hydrolysis process, and then the sugars are subjected to fermentation; or the biomass is
gasified (see below), and the ethanol is subsequently synthesized from this gas with a thermochemical
process. Both processes show promise to be far cheaper than traditional ethanol manufacture via
fermentation of starch crops, and will also improve energy balances. For example, it is estimated that
dry sawdust can yield up to 224 L/Mg of ethanol, thus recovering about 26% of the higher heating
value of the sawdust.29 Because the ethanol will still need to be combusted in a heat engine, the gross,
biomass-to-useful-work efficiency will be well below this. In comparison, direct combustion of the
biomass to generate electricity makes much more effective use of the biomass as an energy storage
medium. Therefore, the value of ethanol as an energy storage medium lies mostly in the convenience of
its liquid (rather than solid) state.
12.10.3 Biodiesel
As starch-based ethanol is made from starchy by-products, most biodiesel is generated from oily by-
products. Some of the most common sources are rapeseed oil, sunflower oil, and soybean oil. Biodiesel
yields from crops like these range from about 300 to 1000 kg/ha-yr, but the crop as a whole produces
about 20 Mg/ha-yr, meaning that the gross solar capture efficiency for biodiesel from crops ranges
between 1/20 and 1/60 the solar capture efficiency of the crop itself. Because of this low solar-capture
efficiency, biomass cannot be the principal energy storage medium for transportation needs.30
Biodiesel can also be manufactured from waste vegetable or animal oils; however, in this case, the
biodiesel is not functioning per se as a solar energy storage medium, so is not further treated in this work.
q 2007 by Taylor & Francis Group, LLC
Energy Storage Technologies 12-21
Dow
nloa
ded
by [
Uni
vers
iti T
ekno
logi
Mal
aysi
a -
Skud
ai]
at 0
1:37
09
Janu
ary
2016
12.10.4 Syngas
Biomass can be converted to a gaseous state for storage, transportation, and combustion (or other
chemical conversion).31 Gasification processes are grouped into three different classes: pyrolysis is the
application of heat in anoxic conditions; partial oxidation is combustion occurring in an oxygen-starved
environment; reforming is the application of heat in the presence of a catalyst. All three processes form
syngas, a combination of methane, carbon monoxide, carbon dioxide and hydrogen. The relative
abundances of the gaseous products can be controlled by adjusting heat, pressure, and feed rates. The
HHV of the resulting gas can contain up to 78% of the original HHV of the feedstock, if the feedstock is
dry.29 Compositions and heating values of two example syngases are listed in Table 12.3.
The equivalent of up to 10% of the gas HHV will be lost when the gas is pressurized for transportation
and storage. Even with this loss, gasification is a considerably more efficient method than ethanol
manufacture for transferring stored solar energy to a nonsolid medium.
References
1. Linden, D. and Reddy, T. B. 2002. Handbook of Batteries, 3rd Ed., pp. 40–163. McGraw Hill,
New York.
2. Luongo, C. A. 1996. Superconducting storage systems: An overview. IEEE Transactions on
Magnetics, Vol. 32, 2214–2223.
3. Cheung, K. Y. C., Cheung, S. T. H. et al. 2003. Large Scale Energy Storage Systems, pp. 40–163.
Imperial College London, London.
4. EA Technology,, Review of Electrical Energy Storage Technologies and Systems and of their Potential
for the UK, pp. 40–163. Department of Trade and Industry, London, UK.
5. DeVries, T. 2002. World’s biggest battery helps stabilize Alaska. Modern Power Systems, 22, 40.
6. Nourai, A. 2003. NaS battery demonstration in the USA. Electricity Storage Association Spring
Meeting, Electricity Storage Association, Morgan Hill, California.
7. Sudworth, J. L. 2001. Sodium/nickel chloride (Zebra) battery. Journal of Power Sources, 100,
149–163.
8. Fleets and Fuels. 2003. The Zebra, (February 17), 8.
9. Price, A. 2000. Technologies for energy storage, present and future: Flow batteries. 2000 Power
Engineering Society Meeting. IEEE Power Engineering Society, Piscataway, New Jersey.
10. Skyllas-Kazacos, M. 2000. Recent Progress with the Vanadium Redox Battery, pp. 27–148. University
of New South Wales, Sydney.
11. Menictas, C. 1994. Status of the vanadium battery development program. Proceedings of the
Electrical Engineering Congress, Sydney.
12. VRB Power Systems, Inc. http://www.vrbpower.com (accessed August 15, 2005).
13. Wilks, N. 2000. Solving current problems. Professional Engineering, 13, 27.
14. Scheffler, P. 2001. Environmental Assessment for the Regenesys Energy Storage System, pp. 142–148.
Tennessee Valley Authority.
15. Lex, P. and Jonshagen, B. 1999. The zinc/bromide battery system for utility and remote
applications. Power Engineering Journal, 13, 142–148.
16. Kruger, P. 2001. Electric power requirement for large-scale production of hydrogen fuel for the
world vehicle fleet. International Journal of Hydrogen Energy, 26, 1137–1147.
17. Bossel, U., Eliasson, B., and Taylor, G. 2003. The Future of the Hydrogen Economy: Bright or Bleak?
Oberrohrdorf, pp. 1863–1874. European Fuel Cell Forum, Switzerland.
18. Dillon, A. et al. Storage of hydrogen in single-walled carbon nanotubes. Nature, 386, 377–379.
19. Donalek, P. 2003. Advances in pumped storage. Electricity Association Spring Meeting, Chicago, IL.
20. Kondoh, J. et al. 2000. Electrical energy storage systems for energy networks. Energy Conservation
and Management, 41, 1863–1874.
q 2007 by Taylor & Francis Group, LLC

12-22 Energy Management and Conservation Handbook
Dow
nloa
ded
by [
Uni
vers
iti T
ekno
logi
Mal
aysi
a -
Skud
ai]
at 0
1:37
09
Janu
ary
2016
21. van der Linden, S. 2002. The case for compressed air energy system. Modern Power Systems, 22
19–21.
22. Hull, J. et al. 1988. Salinity Gradient Solar Ponds, pp. 393–403. CRC Press, Boca Raton, FL.
23. Sørensen, B. 2004. Renewable Energy: Its Physics, Engineering, Environmental Impacts, Economics
and Planning, 3rd Ed., pp. 393–403. Elsevier Academic Press, Burlington, MA.
24. Neeper, D. A. 2000. Thermal dynamics of wallboard with latent heat storage. Solar Energy, 68,
393–403.
25. Goswami, D. Y., Kreith, F., and Kreider, J. F. 2000. Principles of Solar Engineering, 2nd Ed.,
pp. 631–653. Taylor & Francis, New York.
26. Hanneman, R., Vakil, H., and Wentorf, R. 1974. Closed loop chemical systems for
energy transmission, conversion and storage, Proceedings of the 9th Intersociety Energy
Conversion Engineering Conference, pp. 631–653. American Society of Mechanical Engineers,
New York.
27. Shapouri, H., Duffield, J. A., Wang, M. 2002. The Energy Balance of Corn Ethanol : An Update.
Report 814. USDA Office of Energy Policy and New Uses, Agricultural Economics, Washington,
DC.
28. Hammerschlag, R. 2006. Ethanol’s energy return on investment: A survey of the literature 1990–
Present. Environmental Science and Technology, 40, 1744–1750.
29. Klass, D. L. 1998. Biomass for Renewable Energy, Fuels, and Chemicals, pp. 631–653. Academic
Press, San Diego.
30. Bockey, D. and Korbitz, W. 2003. Situation and Development Potential for the Production of
Biodiesel—An International Study, pp. 631–653. Union zur Forderung von Oel- und Proteinp-
flanzen, Berlin.
31. Bridgwater, A. V. 1995. The technical and economic feasibility of biomass gasification for power
generation. Fuel, 74, 631–653.
q 2007 by Taylor & Francis Group, LLC