Embed Size (px)
Citation preview

Energy Services Update | Q4 2017
Deloitte’s Oiland Gas Price Forecast
Page 4
Industry Transactions
Page 10
Valuation Snapshot
Page 13
Industry Activity Update
Page 18
Q4 2016

Energy Services Update | Q4 2017
4
Deloitte’s Oil and Gas Price Forecast
8
Lessons FromPrivate Equity Event
10
Industry Transactions
13
ValuationSnapshot
18
Industry Activity Update
23
DeloitteContacts
Contents
Oil and Gas Price ForecastPage 4
Lessons From Private EquityPage 8
Industry Activity UpdatePage 18
2
Deloitte, one of Canada's leading
professional services firms, provides audit,
tax, consulting, and financial advisory
services. Deloitte LLP, an Ontario limited
liability partnership, is the Canadian
member firm of Deloitte Touche Tohmatsu
Limited.
Deloitte refers to one or more of Deloitte
Touche Tohmatsu Limited, a UK private
company limited by guarantee, and its
network of member firms, each of which is
a legally separate and independent entity.
Please see www.deloitte.com/about for a
detailed description of the legal structure of
Deloitte Touche Tohmatsu Limited and its
member firms.
© Deloitte LLP and affiliated entities.

Energy Services Update | Q4 2017
THE DATA IS IN for the Q4 2017 Energy Services Update.
This update examines the current M&A environment,
transaction-based valuation multiples and key trends.
This quarter’s featured article is from Deloitte Resource
Evaluation and Advisory’s report "Deloitte’s Oil And Gas
Price Forecast December 31, 2017" and provides a forward
view of the oil and gas market.
Deloitte Corporate Finance distinguishes itself by bringing
deep industry experience and access to buyers anywhere in
the world through a global network and exposure to a
diverse range of capital providers. Our multi-disciplinary
global team combines industry-specific knowledge with
practical and valuable experience. Our corporate finance
professionals provide strategic advice and specialized
assistance with divestitures, acquisitions and capital raising
to a broad base of clients.
3
Introduction
For more information,
or if you have any
questions, please contact:
Jason Ding
Managing Director
Edmonton
Deloitte Corporate Finance
Mobile 780 803 8677
Kevin Becker
Executive Director
Calgary and Vancouver
Deloitte Corporate Finance
Mobile 778 989 8773

Energy Services Update | Q4 2017
Deloitte’s Oil And Gas Price Forecast –December 2017
4
Energy Services Update | Q4 2017
Energy Services Update | Q4 2017
The past year has seen relatively
stable oil prices, with relative
optimism for the future as OPEC
extended its current production
cuts until the end of 2018 and
global oil demand growth remains
strong. Both factors are key steps
towards rebalancing the global
crude oil market and reducing
world crude inventories. Over the
last quarter, crude oil prices rose
on news of continued compliance
by OPEC participating nations and
the expectation the cuts would
continue into 2018; however, the
differential between Brent and WTI
prices has widened over the last
year to over $6 USD/bbl, as Brent
prices have grown more than WTI.
WTI price growth has been
dampened by increased oil
production in the United States
(US), which has resulted in
transportation constraints and
continental oversupply. Rig counts
in the US have risen throughout
the year, leading to near-record oil
production rates in 2017.
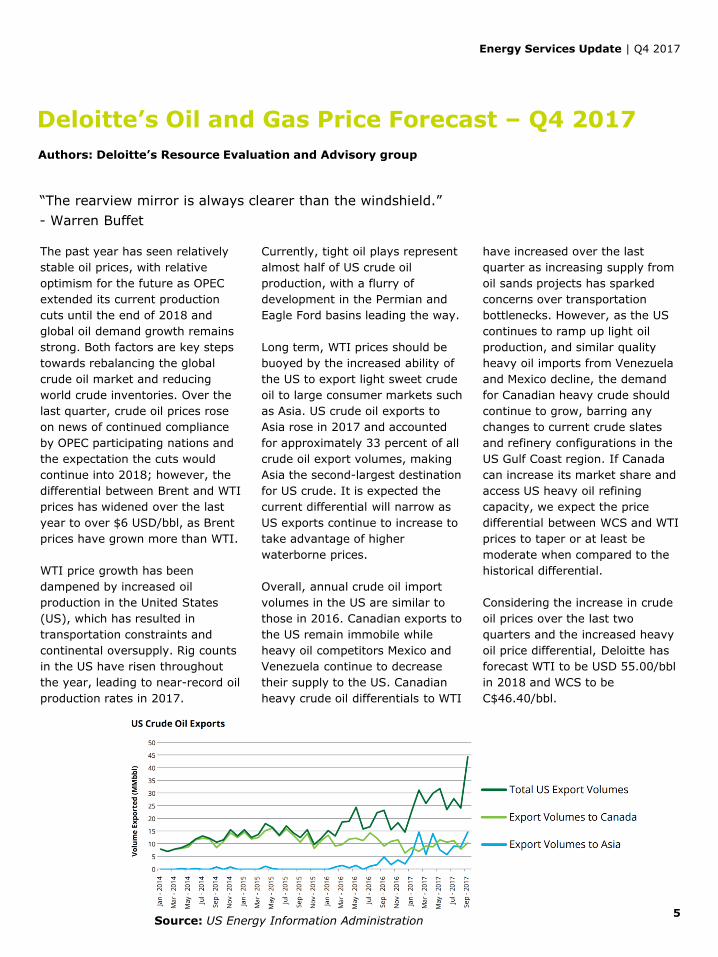
Currently, tight oil plays represent
almost half of US crude oil
production, with a flurry of
development in the Permian and
Eagle Ford basins leading the way.
Long term, WTI prices should be
buoyed by the increased ability of
the US to export light sweet crude
oil to large consumer markets such
as Asia. US crude oil exports to
Asia rose in 2017 and accounted
for approximately 33 percent of all
crude oil export volumes, making
Asia the second-largest destination
for US crude. It is expected the
current differential will narrow as
US exports continue to increase to
take advantage of higher
waterborne prices.
Overall, annual crude oil import
volumes in the US are similar to
those in 2016. Canadian exports to
the US remain immobile while
heavy oil competitors Mexico and
Venezuela continue to decrease
their supply to the US. Canadian
heavy crude oil differentials to WTI
have increased over the last
quarter as increasing supply from
oil sands projects has sparked
concerns over transportation
bottlenecks. However, as the US
continues to ramp up light oil
production, and similar quality
heavy oil imports from Venezuela
and Mexico decline, the demand
for Canadian heavy crude should
continue to grow, barring any
changes to current crude slates
and refinery configurations in the
US Gulf Coast region. If Canada
can increase its market share and
access US heavy oil refining
capacity, we expect the price
differential between WCS and WTI
prices to taper or at least be
moderate when compared to the
historical differential.
Considering the increase in crude
oil prices over the last two
quarters and the increased heavy
oil price differential, Deloitte has
forecast WTI to be USD 55.00/bbl
in 2018 and WCS to be
C$46.40/bbl.
Deloitte’s Oil and Gas Price Forecast – Q4 2017
“The rearview mirror is always clearer than the windshield.”
- Warren Buffet
5
Authors: Deloitte’s Resource Evaluation and Advisory group
Source: US Energy Information Administration

Energy Services Update | Q4 2017
6
Deloitte’s Oil and Gas Price Forecast – Q4 2017continued
On the natural gas side, Canadian
prices were extremely volatile in
2017, with the differential to Henry
Hub fluctuating substantially over
the year, often to great effect on a
day-by-day basis. The summer
months saw large discrepancies
between AECO and Henry Hub
prices as Canadian producers felt
the effects of midstream
infrastructure maintenance
projects amid steady natural gas
production. AECO prices witnessed
traces of recovery in Q4 2017 due
to the resumption of transportation
systems to full capacity operations.
However, it is expected 2018
prices may have similar price
volatility in the summer months as
more maintenance projects are
planned. Historical price
fluctuations over the last 10 years
show AECO prices were on average
20 percent higher in winter months
than summer months. Deloitte has
accounted for this seasonal price
fluctuation when forecasting AECO
prices for 2018.
In addition to infrastructure issues
in Canada, AECO prices have also
been affected by increased US
natural gas production through
both shale gas plays and solution
gas from tight oil fields. Currently,
22 percent of US shale gas
production (11 percent of total gas
production) is attributed to solution
gas from the Permian, Eagle Ford,
and Bakken tight oil drilling. This
equates to over 10 Bcf/d of gas
from oil plays that affect the
supply-and-demand balance. With
increased domestic supply, the US
can export additional volumes to
Mexico by pipeline and abroad
through LNG facilities. The US
grew its natural gas export market
by 31% in 2017, with the majority
of pipeline export volumes directed
to Mexico, and an increase in LNG
export volumes more than three
times 2016 average volumes.
Henry Hub prices reflect US
optionality to export markets as
prices have remained relatively
stable throughout 2017. Natural
gas export volumes from Canada
to the US were flat in 2017,
demonstrating that the US does
not require additional volumes
from Canada to meet domestic
demand.
Canada’s limited ability to access
new markets, combined with
increased US natural gas
production, results in low AECO
pricing as the US continues to
expand its transportation
infrastructure and export markets.
Considering natural gas pricing
seasonality and increased
production in the US, Deloitte has
forecast AECO to be C$2.00/Mcf
and Henry Hub to be USD 2.80/Mcf
in 2018.
Source: US Energy Information Administration

Energy Services Update | Q4 2017
7
Deloitte’s Oil and Gas Price Forecast – Q4 2017continued
Trends to Watch In 2018:
• Q1 2017 saw a surge in
drilling activity, which led to
crew shortages and cost
escalations. More of the same
can be expected in 2018 as
producers take advantage of
stable, growing prices. Drilling
and completion costs will likely
rise as competition for rigs
increases.
• Uncertainty of AECO pricing
in a volatile environment
may hinder Canadian dry
gas producers from moving
forward with their
development plans.
Producers may be quick to shut
in production if there are
similar maintenance outages to
those that occurred in summer
2017. Companies will also likely
hedge significant volumes to
protect against price volatility.
• Light oil development,
particularly in
Saskatchewan and
southeast Alberta, should
continue at a consistent
pace. Expansion of enhanced
oil recovery operations will
most likely be an area of
increased production volumes
in certain conventional plays
such as the Viking and Midale
formations.
• Total bitumen production
may for the first time
exceed 3 MMbl/d.
Incremental production of
existing in-situ operations and
expansion projects are
scheduled to come on-stream
in 2018. The new Sturgeon
refinery, Alberta’s first new
refinery to be built in 30 years,
is scheduled to begin
operations in spring 2018 with
an upgrading capacity of
50,000 bbl/d.
• Producers will continue to
target liquid-rich gas plays
in the Deep Basin.
Condensate prices are
increasing as the domestic
condensate supply does not
meet increased demand for
expanding bitumen production.
It is expected the demand for
condensate will rise due to
increased bitumen capacity
from oil sands expansion
projects. In addition, if
proposed crude oil pipeline
projects move forward,
increased diluent will be
required to transport heavy oil.
Partial upgrading potential and
increased transport capacity by
train would slow the demand
for diluent; however, rail
transport is more costly than
pipelines and partial upgrading
is relatively new to the
industry.
Click here to view the entire forecast
Source: US Energy Information Administration

Energy Services Update | Q4 2017Energy Services Update | Q4 2017
Lessons From Private Equity Event
8

Energy Services Update | Q4 2017
Deloitte has interviewed top Private Equity (PE) firms in Alberta to gain greater insight into value creation strategies for private companies.Please join us for breakfast, networking and a panel discussion on Wednesday, February 28, 2018, where we will discuss lessons learned from PE including the key ingredients for success and how to develop a sustainable framework for your private business.
Jamie Avey and Jason Ding in Deloitte’s Corporate Finance and M&A Advisory practice will moderate an informative panel discussion which will host the following panelists:
• Gord Boersma, Vice President, Investments – Mosaic Capital Corporation
• Alan Lever, Partner –Torquest Partners
• Paul Shaw, Vice President, Private Equity – Regimen Partners
• David Sparrow, Managing Director – Forbes Bros. Capital Ltd.
• Al Stanley, CEO – Universal Rail Systems Ltd.
Top PE firms have a disciplined framework of strategies and tactics that allow them to increase the value of a private company and then exit for a significant return on investment. As a business owner, it is important to understand these perspectives to create the right strategy and structure at your company that will enhance value regardless of your investment horizon or succession plans.We look forward to seeing you on February 28!
Lessons From Private Equity Event
Deloitte is hosting a “Lessons From Private Equity” event in Edmonton on February
28, 2018, following a similar event in Calgary that was hosted last year.
9
Event details:
When: Wednesday February 28, 2018
Where: Varscona Hotel8208 106 Street NW,Edmonton, AB
Registration:7:00 – 7:30am
Breakfast: 7:30 – 8:00am
Presentation and Q&A: 8:00 – 9:00am
Click here to register for the event

Energy Services Update | Q4 2017Energy Services Update | Q4 2017
Industry Transactions
10

Energy Services Update | Q4 2017
The North American energy
services industry had closed 26
transactions in Q4, up from 22 in
Q3, and the highest in one quarter
seen since Q4 2014. Total
transaction value was also up,
from $2.0 billion in Q3 to $7.8
billion in Q4. In 2017, total
transaction value was down
slightly, from $26.2 billion in 2016
to $25.3 billion in 2017. This is
primarily due to the fact that 2016
included the landmark $22 billion
Cameron/Schlumberger
transaction which closed in April
2016. If we exclude that massive
transaction, transaction value was
up considerably – from $4.2Bn in
2016 to $25.2Bn in 2017.
Of the 26 transactions that closed
in the quarter, 12 disclosed
transaction values, which ranged
from $0.2 million to $3.0 billion,
for a combined $8.6 billion.
Two transactions were greater
than $1 billion – one at $2.3Bn and
one at 3.0Bn. The only transaction
that involved a Canadian company
and disclosed a transaction value
was the acquisition of C&J’s
Production Services Canada group
by Calgary-based CWC Energy
Services for approximately $38
million.
In addition to the transactions that
closed in Q4 2017, which are
highlighted on the following page,
a significant transaction which has
been announced in 2018 is the
acquisition of Energy Transfer
Partners LP’s CDM Resource
Management by Austin-based USA
Compression Partners (USACP) for
approximately USD 1.7 billion.
Through this acquisition, USACP
will roughly double their fleet and
expand its footprint to all major
basins in the US, including the
Eagle Ford, the Gulf Coast, and the
Rockies. While the price per
horsepower was higher than
USACP’s existing valuation, the
EV/EBITDA multiple was lower
than USACP’s, implying that CDM’s
assets are better at generating
earnings than USACP’s existing
assets.
Industry Transactions
11

Energy Services Update | Q4 2017
Select North American transactions include:
October 6, 2017Ensco plc (“Ensco”) acquired
Atwood Oceanics, Inc. (“Atwood”)
for USD 2.2 billion to create a
powerhouse ocean drilling rig
company. The combined company’s
fleet consists of 27 floating rigs
(semisubmersibles and drillships),
of which 23 are ultra-
deepwaterdrilling rigs that are
capable of drilling in water depths
of 7,500 feet or greater. The
combined fleet also comprises 38
jackuprigs, for a combined total of
65 drilling rigs.
October 30, 2017Global Infrastructure Partners
(“GIP”) purchased Medallion
Gathering and Processing
(“Medallion”) for USD 1.8 billion.
Medallion is the largest privately-
held crude oil transportation
system in the Midland Basin of
West Texas, with over 800 miles of
pipeline, approximately 670,000
dedicated acres, and total areas of
mutual interest approaching four
million acres. Medallion is widely
regarded as the leading source of
crude oil transportation in the
Midland Basin.
October 30, 2017C&J Energy Services (“C&J)
completed two transactions in
October, the first an acquisition of
O-Tex Pumping (“O-Tex”) for
USD 245.4 million, and the second
a divestiture of their C&J
Production Services Canada asset
(“Canada”) for $37.5 million.
Through the acquisition of O-Tex,
the US’s fourth largest provider of
oilfield cementing services, C&J
continued to strengthen its position
as a leading oilfield services
provider with a best-in-class well
construction, intervention and
completions platform.
Simultaneously, C&J sold Canada
to CWC Energy Services, allowing
C&J to focus their efforts on the
US.
12
26 transactions accounted for $7.8 billion in North American Energy Services
M&A activity in the fourth quarter of 2017.
Industry Transactions continued
North American Energy Equipment and Services M&A Activity
0.0x 5.6x 8.5x 4.3x 7.5x 8.4x 7.8x 7.6x 4.6x 19.7x 4.5x 4.1x 0.0x 8.9x 0.0x 0.0x 16.1x 12.5x 206.5x 5.3x
16
26
3833
4747
42 43
1924
1822 22 21
17
2421 20 22
26
1014 13 14
2218 23
14
8 9
3
9 117 6
128
11 912
0
12
24
36
48
60
0.0x
5.0x
10.0x
15.0x
20.0x
Q1 Q2 Q3 Q4 Q1 Q2 Q3 Q4 Q1 Q2 Q3 Q4 Q1 Q2 Q3 Q4 Q1 Q2 Q3 Q4
2013 2014 2015 2016 2017
Nu
mb
er o
f tr
an
sacti
on
s
clo
sed
Averag
e E
V/EB
ITD
A
Average disclosed EV/EBITDA Number of closed transactions Closed transactions with disclosed values

Energy Services Update | Q4 2017Energy Services Update | Q4 2017
Valuation Snapshot
13

Energy Services Update | Q4 2017
The forecast consensus median
EV/NTM EBITDA multiple (“multiple”)
for Drilling and Drilling Services
companies increased to 8.5x in Q4
2017, significantly higher than Q3’s
7.9x, and another step up from Q2’s
low of 6.4x. Q4 2017 multiples are
now a full turn above than their five-
year rolling average of 7.4x. Steady
strengthening in oil prices during the
second half of the year likely led to
the increase in share prices while
analyst NTM EBITDA forecasts
decreased slightly on average,
resulting in a higher multiple.
14
Drilling and Drilling Services (all values in CAD mm)
Valuation Snapshot
EV multiples
Company Enterprise
value (EV)
LTM
EBITDA
NTM
EBITDA
LTM
EBITDA
NTM
EBITDA
Precision Drilling Corporation 2,763 278 323 9.9x 8.6x
Ensign Energy Services Inc. 1,716 194 227 8.9x 7.6x
Pason Systems Inc. 1,387 69 112 20.2x 12.4x
Total Energy Services Inc. 1,016 51 122 20.1x 8.3x
Trinidad Drilling Ltd. 953 83 132 11.5x 7.2x
Western Energy Services Corp. 344 27 36 12.9x 9.5x
High Arctic Energy Services Inc 190 64 46 3.0x 4.2x
PHX Energy Services Corp. 157 7 34 22.5x 4.6x
Xtreme Drilling Corp. 148 (1) 15 NM 9.8x
AKITA Drilling Ltd. 128 (4) 10 NM 13.5x
Cathedral Energy Services Ltd. 84 10 14 8.1x 6.2x
McCoy Global Inc. 32 (9) 2 NM 14.4x
Adjusted average 10.2x 8.8x
Adjusted median 9.9x 8.5x
Drilling and Drilling Services Median EV/NTM EBITDA
0.0x
2.0x
4.0x
6.0x
8.0x
10.0x
12.0x
14.0x
16.0x
Q1 Q2 Q3 Q4 Q1 Q2 Q3 Q4 Q1 Q2 Q3 Q4 Q1 Q2 Q3 Q4 Q1 Q2 Q3 Q4
2013 2014 2015 2016 2017
Median EV / NTM EBITDA Rolling five-year average

Energy Services Update | Q4 2017
0.0x
2.0x
4.0x
6.0x
8.0x
10.0x
12.0x
14.0x
16.0x
Q1 Q2 Q3 Q4 Q1 Q2 Q3 Q4 Q1 Q2 Q3 Q4 Q1 Q2 Q3 Q4 Q1 Q2 Q3 Q4
2013 2014 2015 2016 2017
Median EV / NTM EBITDA Rolling five-year average
Production and Well Services Median EV/NTM EBITDADuring Q4 2017, Production and
Well Services companies’ median
EV/NTM EBITDA decreased to 7.7x,
0.5x lower than the previous
quarter. The steady decline in
multiples began in Q2 2016 when
our dataset reached a high of 14.5x,
and has now fallen well-below the
five-year rolling average of 8.9x.
While analyst consensus NTM
EBITDA estimates continued to
improve in Q4 2017, EVs remained
stable quarter-over-quarter, which
continues to decrease the multiples.
15
Driven by oil prices that continue to strengthen, well completion activity is
likely expected to be higher during the next 12 months than the last 12
months, leading to a positive EBITDA impact. As a result, median EV/NTM
EBITDA (7.7x) is lower compared to LTM EBITDA (10.3x).
Production and Well Services (all values in CAD mm)
Valuation Snapshot continued
EV multiples
Company Enterprise
value (EV)
LTM
EBITDA
NTM
EBITDA
LTM
EBITDA
NTM
EBITDA
CES Energy Solutions Corp. 2,158 111 184 19.4x 11.7x
ShawCor Ltd. 1,967 190 180 10.3x 10.9x
Calfrac Well Services Ltd. 1,749 92 265 18.9x 6.6x
Secure Energy Services Inc. 1,700 118 177 14.4x 9.6x
Trican Well Service Ltd. 1,556 107 253 14.6x 6.2x
Newalta Corporation 434 45 50 9.6x 8.7x
CWC Energy Services Corp. 138 11 - 12.4x NM
Strad Energy Services Ltd. 124 24 32 5.1x 3.9x
Essential Energy Services Ltd. 124 14 34 8.8x 3.7x
Adjusted average 10.8x 7.7x
Adjusted median 10.3x 7.7x

Energy Services Update | Q4 2017
0.0x
2.0x
4.0x
6.0x
8.0x
10.0x
12.0x
14.0x
16.0x
Q1 Q2 Q3 Q4 Q1 Q2 Q3 Q4 Q1 Q2 Q3 Q4 Q1 Q2 Q3 Q4 Q1 Q2 Q3 Q4
2013 2014 2015 2016 2017
Median EV / NTM EBITDA Rolling five-year average
Continuing the year’s see-saw,
Transportation and Logistics’
EV/NTM EBITDA multiples fell back
to 8.1x, from Q1’s 9.1x, Q2’s 8.1x,
and Q3’s 9.1x. The multiple still
remains higher than the five-year
rolling average of 7.8x.
Transportation and Logistics’
median EV/NTM EBITDA multiples
within our dataset have tended to
lay within a relatively tight range
from 6x - 8x and seem to have
returned towards historical
normalcy once again.
16
The Transportation and Logistics sub-sector has historically been less volatile
than the other energy services sub-sectors. The sub-sector this year has
bounced between 8.1x-9.1x, which is higher than the historical range of
6.1x-8.0x.
Transportation and Logistics (all values in CAD mm)
Valuation Snapshot continued
EV multiples
Company Enterprise
value (EV)
LTM
EBITDA
NTM
EBITDA
LTM
EBITDA
NTM
EBITDA
TFI International Inc. 4,463 508 560 8.8x 8.0x
Gibson Energy Inc. 3,695 262 332 14.1x 11.1x
Mullen Group Ltd. 2,047 169 190 12.1x 10.8x
Civeo Corporation 792 82 96 9.6x 8.2x
Horizon North Logistics Inc. 280 26 42 10.6x 6.7x
Black Diamond Group Limited 254 29 33 8.8x 7.6x
Adjusted average 10.7x 8.7x
Adjusted median 10.1x 8.1x
Transportation and Logistics Median EV/NTM EBITDA

Energy Services Update | Q4 2017
0.0x
2.0x
4.0x
6.0x
8.0x
10.0x
12.0x
14.0x
16.0x
Q1 Q2 Q3 Q4 Q1 Q2 Q3 Q4 Q1 Q2 Q3 Q4 Q1 Q2 Q3 Q4 Q1 Q2 Q3 Q4
2013 2014 2015 2016 2017
Median EV / NTM EBITDA Rolling five-year average
The Oilfield and Facility
Construction sub-sector median
EV/NTM EBITDA multiple has
generally remained within a
relatively narrow range. We note
that despite the narrow range of
the group median, individual
companies within our sample vary
considerably from 4.0x to 10.1x
EV/NTM EBITDA. Quarter over
quarter, the median EV/NTM
EBITDA remains relatively stable
(Q4 2017 of 6.3x compared to Q3
2017 of 6.4x) and equal to the
five-year rolling average of 6.3x.
17
In Q4 2017, oilfield and facility construction company median multiples
remained relatively flat at 6.3x EV/NTM EBITDA. The sub-sector’s valuation
is at the five-year rolling average of 6.3x, and it remains within the historical
range of 4.6x - 7.0x.
Oilfield and Facility Construction (all values in CAD mm)
Valuation Snapshot continued
EV multiples
Company Enterprise
value (EV)
LTM
EBITDA
NTM
EBITDA
LTM
EBITDA
NTM
EBITDA
Aecon Group Inc. 1,675 151 195 11.1x 8.6x
Enerflex Ltd. 1,563 195 263 8.0x 6.0x
Bird Construction Inc. 403 25 40 16.0x 10.1x
North American Energy Partners Inc. 270 54 68 5.0x 4.0x
Stuart Olson Inc. 258 22 41 11.7x 6.3x
Adjusted average 8.9x 7.0x
Adjusted median 9.6x 6.3x
Oilfield and Facility Construction Median EV/NTM EBITDA
Energy Services Update | Q4 2017
Industry Activity Update
18
Energy Services Update | Q4 2017

Energy Services Update | Q4 2017
(50%)
(40%)
(30%)
(20%)
(10%)
0%
10%
20%
30%
Jan-17 Mar-17 May-17 Jul-17 Sep-17 Nov-17 Jan-18
Industry Activity Update
This is a deconstruction of the broader energy services sector into specific sub-sectors,
demonstrating monthly returns between January 1, 2017 and December 31, 2017.
19
2017 Sub-sector Returns (Dec 31, 2016 – Dec 31, 2017)
The sub-sector returns are based
on stock prices, weighted by
market capitalization, and is
adjusted for dividends.
The graph below illustrates the
importance of understanding sub-
sector fundamentals, as
performance has differed
considerably between the various
groups. Simply put, sub-sectors
matter within the larger energy
services industry.
With many oil and gas price
forecasts remaining relatively flat
in the near term, adaptation to
regulatory restraints for E&P and
midstream companies ongoing,
and the sector generally being out
of favor to investors, companies
are visibly adapting to a new
environment that is no longer
perceived as temporary.
While only two of the eight
subsectors referred to in the
graph below have experienced
positive returns in 2017, all
subsectors are beginning to trend
upwards. Even the drilling sub-
sector, which had been down each
month from January through
August, saw the freefall end.
Though the fall saw a recovery in
value, the end of the year was
mostly flat for oilfield services
providers.
Supermajors (15.7%)
Exploration and Geophysical 15.2%
Oilfield and Facility Construction 10.7%
Drilling Equipment (6.7%)
Transportation and Logistics (6.7%)
Enviro. and Waste Management (26.3%)
Production and Completion (12.7%)
Drilling (34.6%)
Energy Services Update | Q4 2017
0
200
400
600
800
1,000
1,200
1,400
Jan Feb Mar Apr May Jun Jul Aug Sep Oct Nov Dec
0%
10%
20%
30%
40%
50%
60%
70%
80%
Jan Feb Mar Apr May Jun Jul Aug Sep Oct Nov Dec
20
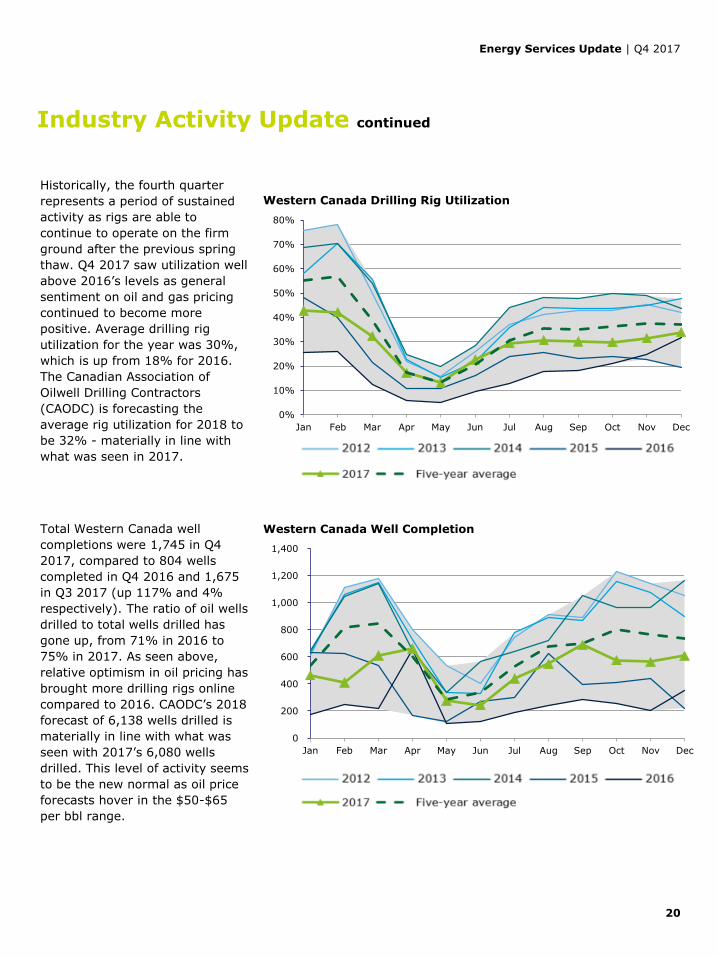
Western Canada Drilling Rig Utilization
Historically, the fourth quarter
represents a period of sustained
activity as rigs are able to
continue to operate on the firm
ground after the previous spring
thaw. Q4 2017 saw utilization well
above 2016’s levels as general
sentiment on oil and gas pricing
continued to become more
positive. Average drilling rig
utilization for the year was 30%,
which is up from 18% for 2016.
The Canadian Association of
Oilwell Drilling Contractors
(CAODC) is forecasting the
average rig utilization for 2018 to
be 32% - materially in line with
what was seen in 2017.
Industry Activity Update continued
Total Western Canada well
completions were 1,745 in Q4
2017, compared to 804 wells
completed in Q4 2016 and 1,675
in Q3 2017 (up 117% and 4%
respectively). The ratio of oil wells
drilled to total wells drilled has
gone up, from 71% in 2016 to
75% in 2017. As seen above,
relative optimism in oil pricing has
brought more drilling rigs online
compared to 2016. CAODC’s 2018
forecast of 6,138 wells drilled is
materially in line with what was
seen with 2017’s 6,080 wells
drilled. This level of activity seems
to be the new normal as oil price
forecasts hover in the $50-$65
per bbl range.
Western Canada Well Completion

Energy Services Update | Q4 2017
$0
$500
$1,000
$1,500
$2,000
$2,500
$3,000
$3,500
$4,000
$4,500
$
$50
$100
$150
$200
$250
$300
$350
$400
$450
Q1 Q2 Q3 Q4 Q1 Q2 Q3 Q4 Q1 Q2 Q3 Q4 Q1 Q2 Q3 Q4 Q1 Q2 Q3 Q4
2013 2014 2015 2016 2017
$ /
Hecta
re
Bonuses
(CAD
millions)
BC Total Saskatchewan Total Alberta Total
BC $ / Hectare Saskatchewan $ / Hectare Alberta $ / Hectare
21
Western Canada Land Sales
Land sales continued their robust
climb through 2017, reaching
highs in quarterly bonuses paid
not seen since 2015. This
continues the steady climb since
the beginning of 2016. The
largest land sales were in
Alberta’s petroleum and natural
gas regions, specifically in the
the Plains and Northern regions.
On a per-hectare basis across
Western Canada, the average
price paid decreased 30% to
$382/hectare as compared to
the previous quarter’s
$543/hectare, but up 30% from
a year prior (Q4 2016). In AB,
prices per hectare are at highs
not seen since Q3 2014, at
$424/hectare, up 364% since
the low of $92/hectare seen in
Q2 2015.
Companies are clearly looking to
expand, and the company that
purchased the most AB land (and
spent the most money) in the
quarter was Stomp Energy,
purchasing 43,810 hectares for a
total of $33 million. Pro West
Land Services paid the most per
hectare, at $6,180/hectare for
3,584 hectares ($22 million).
Total hectares sold in W. Canada were up 51% in 2017 compared to 2016.
Total bonus paid in W. Canada was up 289% in 2017 compared to 2016.
As a result, bonus per hectare was up 258% in 2017 compared to 2016.

Energy Services Update | Q4 2017
Abbreviations
22
Abbreviation Definition
$ Canadian dollars
USD U.S. dollars
EV Enterprise value
EBITDA Earnings before interest, tax, depreciation and amortization
LTM Last twelve months
NTM Next twelve months
QoQ Quarter over quarter - change from last quarter to this one
YTD Year to date
S&P TSX Standard & Poor's Toronto Stock Exchange Index
WCS Western Canadian Select (Alberta heavy oil price)
WTI West Texas Intermediate (oil price)
Bbl Barrel (of oil)
Ha Hectares

Energy Services Update | Q4 2017
Brian Heald Managing Director
Calgary Oil and Gas Leader
403 267 0508
Jason DingManaging Director
Edmonton Leader
780 803 8677
Contacts
23
David LamSenior Managing Director
Western Canada Leader
604 219 3878
Deloitte Corporate Finance professionals
Paul ChildersSenior Vice President
Brisbane, AU
+61 7 3308 7205
Shaun ReynoldsVice President & Director
Aberdeen, UK
+44 1224 84 7319
Global Energy Services Corporate Finance professionals
Chad Potter Assistant Director
London, UK
+44 20 7007 8952
James MillerVice President
Charlotte, NC
704 731 8230
Kong Meng YapDirector
Kuala Lumpur, Malaysia
+60 3 7610 8858
Eric AndreozziSenior Vice President
Charlotte, NC
704 333 0518
Canadian oil and gas professionals
Jamie AveyPartner
Transaction Services
403 503 1353
Paul ZonneveldPartner, Enterprise Risk Leader
Energy and Resources
403 503 1356
Kevin BeckerExecutive Director
Calgary Energy Services Leader
778 989 8773
Robert OlsenPresident
National Leader
416 726 4614
Jeff LyonsPartner
Financial Advisory
403 267 1708
Andrew LuetchfordSenior Managing Director
Debt and Capital Advisory Leader
416 601 5227
Alyson QuanVice President
Edmonton
780 421 3638
Chris LeeManaging Partner, Alberta
403 267 1751
Marc JoinerDeloitte Private leader, Prairies
403 503 1346
Andrew BotterillPartner
Resource Evaluation and Advisory
403 648 3239
Tim LynnAnalyst
Edmonton
780 686 9753
Adam FroeseAnalyst
Edmonton
780 421 3765


![Q4 FY16 Industry Update & Key Performance Highlights [Company Update]](https://img.pdfslide.us/doc/110x75/577c7f491a28abe054a3ead7/q4-fy16-industry-update-key-performance-highlights-company-update.jpg)