Embed Size (px)
Citation preview
ID!E3 1E l
3 El O E
1 t!.1C W
El l a El-
El El 0 E3El El ES} m O U*2 Um 1E22 ElS
m El El E} 2=3[a1: 0 E _w_
C}EI -
EINHE elij
Pub
lic D
iscl
osur
e A
utho
rized
Pub
lic D
iscl
osur
e A
utho
rized
Pub
lic D
iscl
osur
e A
utho
rized
Pub
lic D
iscl
osur
e A
utho
rized
ENERGY SECTOR MANAGEMENT ASSISTANCE PROGRAM
PURPOSE
The World Bank/UNDP/Bilateral Aid Energy Sector Management Assistance Program(ESMAP) was launched in 1983 to complement the Energy Assessment Program which had beenestablished three years earlier. The Assessment Program was designed to identify the most seriousenergy problems facing some 70 developing countries and to propose remedial action. ESMAP wasconceived, in part, as a preinvestment facility to help implement recommendations made during thecourse of assessment. Today ESMAP is carrying out preinvestment and prefeasibility activities inabout 60 countries and is providing a wide range of institutional and policy advice. The programplays a signiitcant role in the overall international effort to provide technical assistance to thee-nergy sector of developing countries. It attempts to strengthen the impact of bilateral andmultilateral resources and private sector investment. The findings and recommendations emergingfrom ESMAP? country activities provide governments, donors, and potential investors with theinformation needed to identify economically and environmentally sound energy projects and toaccelerate their preparation and implementation. ESMAP's policy and research work analyzingcross-country trends and issues in specific energy subsectors make an important contribution inhighlighting critical problems and suggesting solutions.
ESMAP's operational activities are managed by three units within the Energy StrategyManagement and Assessment Division of the Industry and Energy Department at the World Bank.
- The Energy Efficiency and Strategy Unit engages in energy assessments addressinginstitutional financial, and policy issues, design of sector strategies, the strengthening ofenergy sector enterprises and sector management, the defining of investment programs,efficiency improvements in energy supply, and energy use, training and research.
- The Household and Renewable Energy Unit addresses tech-nical, economic, financial,institutional and policy issues in the areas of energy u-e by urban and rural households andsmall industries, and includes traditional and modenm fue; supplies, prefeasibility studies,pilot activities, technology assessments, seminars and workshops, and policy and researchwork.
- The Natural Gas Development Unit addresses gas issues and promotes the development anduse of natural gas in developing countries through preinvestment work, formulating naturalgas development and related environmental strategies, and research.
FUNDING
The ESMAP Program is a major international effort supported by the World Bank, theUnited Nations Development Programme, and Bilateral Aid from a number of countries includingAustralia, Belgium, Canada, Denmark, Finland, France, Iceland, Ire!and, Italy, Japan, theNetherlands, New Zealand, Norway, Portugal Sweden, Switzerland, the United Kingdom, and theUnited States.
FURTHER INFORMATION
For further information or copies of the completed ESMAP reports listed at the end of thisdocument, contact:
Energy Strategy Managen.ent OR Division for Global and Interregional Programsand Assessment Division United Nations Development Programme
Industry and Energy Department One United Nations PlazaThe World Bank New York, NY 100171818 H Street N.W. USA
Washington. D.C. USA 20433
INDONESIA
URBAN HOUSEHOLD ENERGY STRATEGY STUDY
TECHNICAL APPENDICES
FEBRUARY 1990
VOLUME II
. 1 -
APPENDIX I
INDONESIA: URBAN HOUSEHOLD ENERGY SURVEY
FEBRUARY 1990
-2-
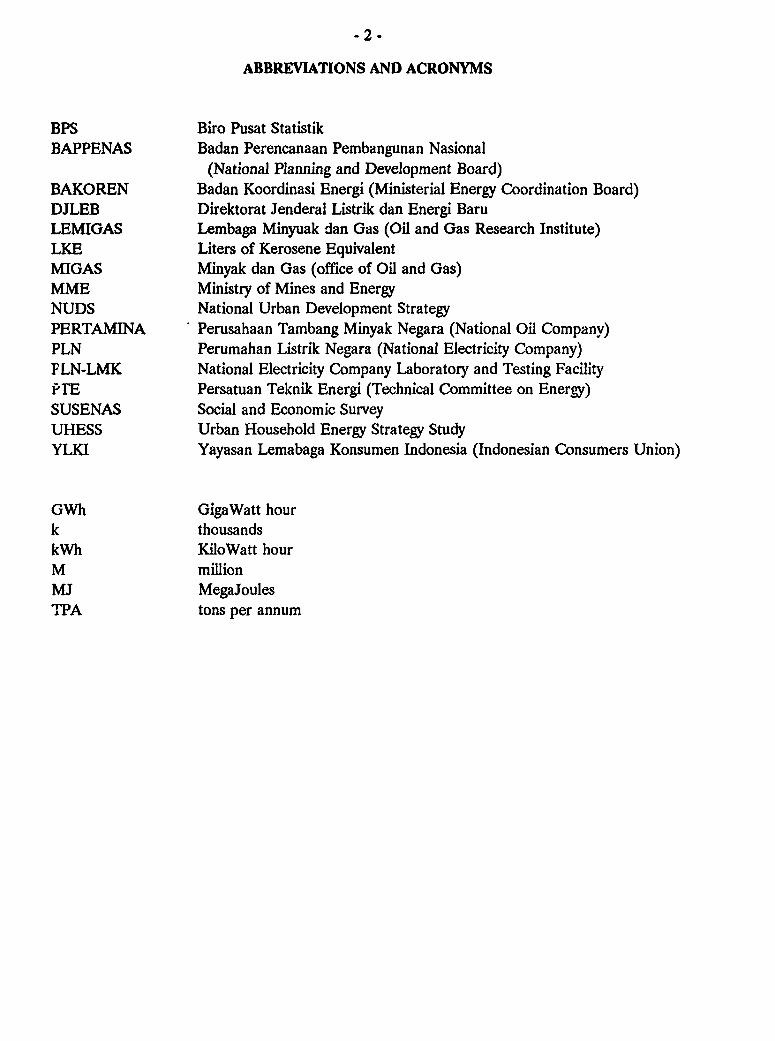
ABBREVIATIONS AND ACRONYMS
BPS Biro Pusat StatistikBAPPENAS Badan Perencanaan Pembangunan Nasional
(National Planning and Development Board)BAKOREN Badan Koordinasi Energi (Ministerial Energy Coordination Board)DJLEB Direktorat Jenderal Listrik dan Energi BaruLEMIGAS Lembaga Minyuak dan Gas (Oil and Gas Research Institute)LKE Liters of Kerosene EquivalentMIGAS Minyak dan Gas (office of Oil and Gas)MME Ministry of Mines and EnergyNUDS National Urban Development StrategyPERTAMINA Perusahaan Tambang Minyak Negara (National Oil Company)PLN Perumahan Listrik Negara (National Electricity Company)FLN-LMK National Electricity Company Laboratory and Testing FacilityPrE Persatuan Teknik Energi (Technical Committee on Energy)SUSENAS Social and Economic SurveyUHESS Urban Household Energy Strategy StudyYLKI Yayasan Lemabaga Konsumen Indonesia (Indonesian Consumers Union)
GWh GigaWatt hourk thousandskWh KiloWatt hourM mlllionMJ MegaJoulesTPA tons per annum
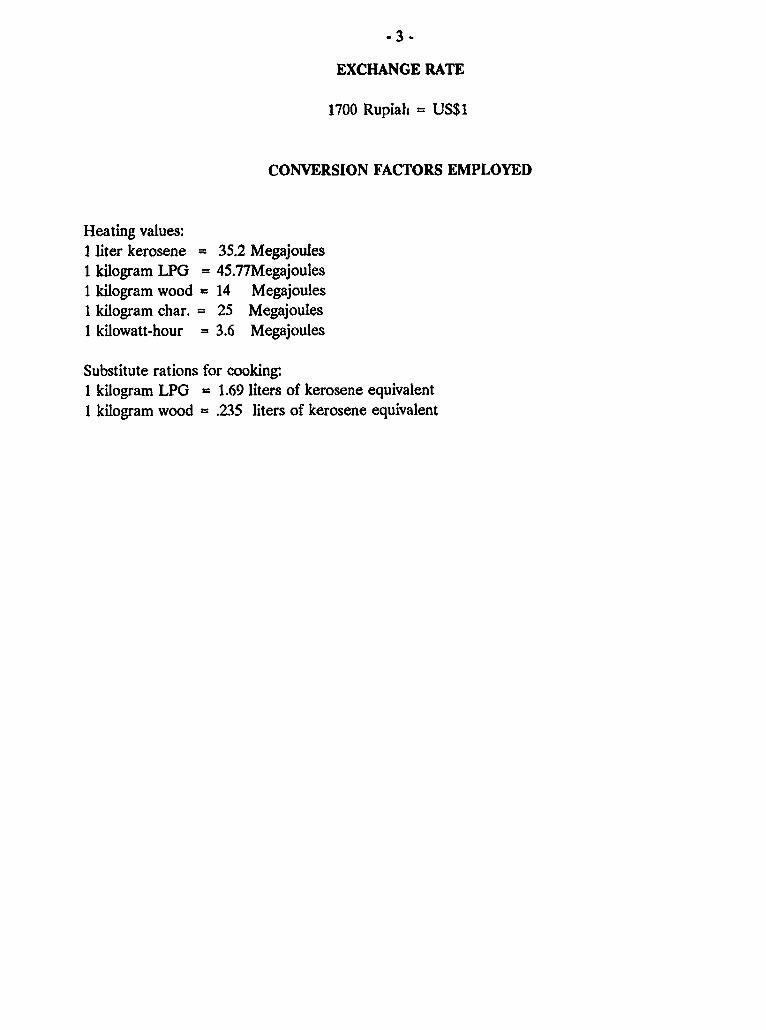
EXCHANGE RATE
1700 Rupiah = US$1
CONVERSION FACTORS EMPLOYED
Heating values:I liter kerosene = 35.2 Megajoules1 kilogram LPG = 45.77Megajoules1 kilogram wood = 14 Megajoules1 kilogram char. = 25 Megajoules1 kilowatt-hour = 3.6 Megajoules
Substitute rations for cooking:1 kilogram LPG = 1.69 liters of kerosene equivalent1 kilogram wood = .235 liters of kerosene equivalent
-4 -
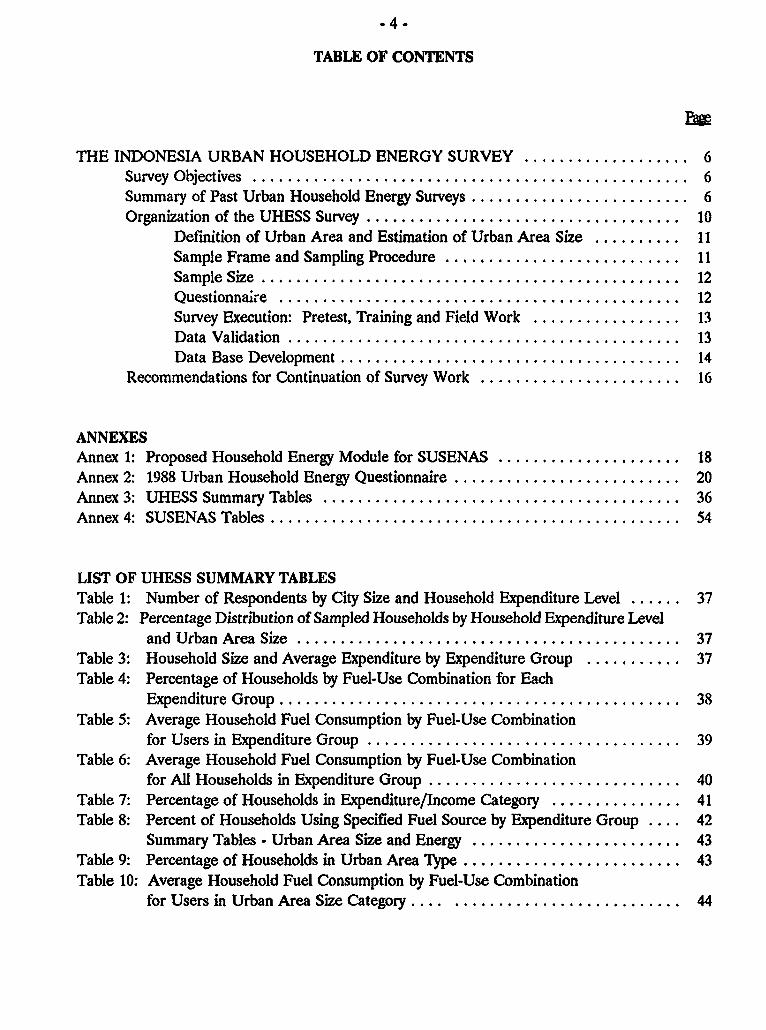
TABLE OF CONTENTS
THE INDONESIA URBAN HOUSEHOLD ENERGY SURVEY ................... 6Survey Objectives .............. .................................... 6Summary of Past Urban Household Energy Surveys ......................... 6Organization of the UHESS Sutvey .................................... 10
Definition of Urban Area and Estimation of Urban Area Size .... ...... 11Sample Frame and Sampling Procedure ........................... 11Sample Size ............. ................................... 12Questionnaire .............................................. 12Survey Execution: Pretest, Training and Field Work ................. 13Data Validation ............................................. 13Data Base Development ....................................... 14
Recommendations for Continuation of Survey Work ....................... 16
ANNEXESAnnex 1: Proposed Household Energy Module for SUSENAS ..................... 18Annex 2: 1988 Urban Household Energy Questionnaire .......................... 20Annex 3: UHESS Summary Tables ......................................... 36Annex 4: SUSENAS Tables ............................................... 54
LIST OF UHESS SUMMARY TABLESTable 1: Number of Respondents by City Size and Household Expenditure Level ...... 37Table 2: Percentage Distribution of Sampled Households by Household Expenditure Level
and Urban Area Size ............................................ 37Table 3: Household Size and Average Expenditure by Expenditure Group .... ....... 37Table 4: Percentage of Households by Fuel-Use Combination for Each
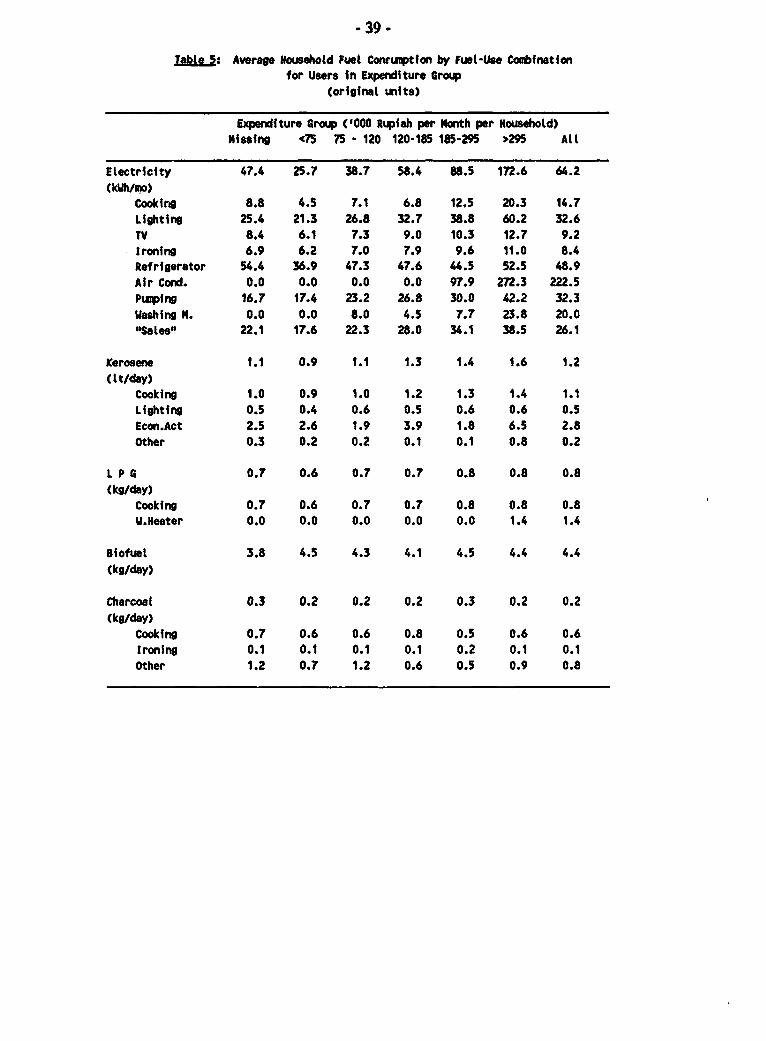
Expenditure Group .............................................. 38Table 5: Average Household Fuel Consumption by Fuel-Use Combination
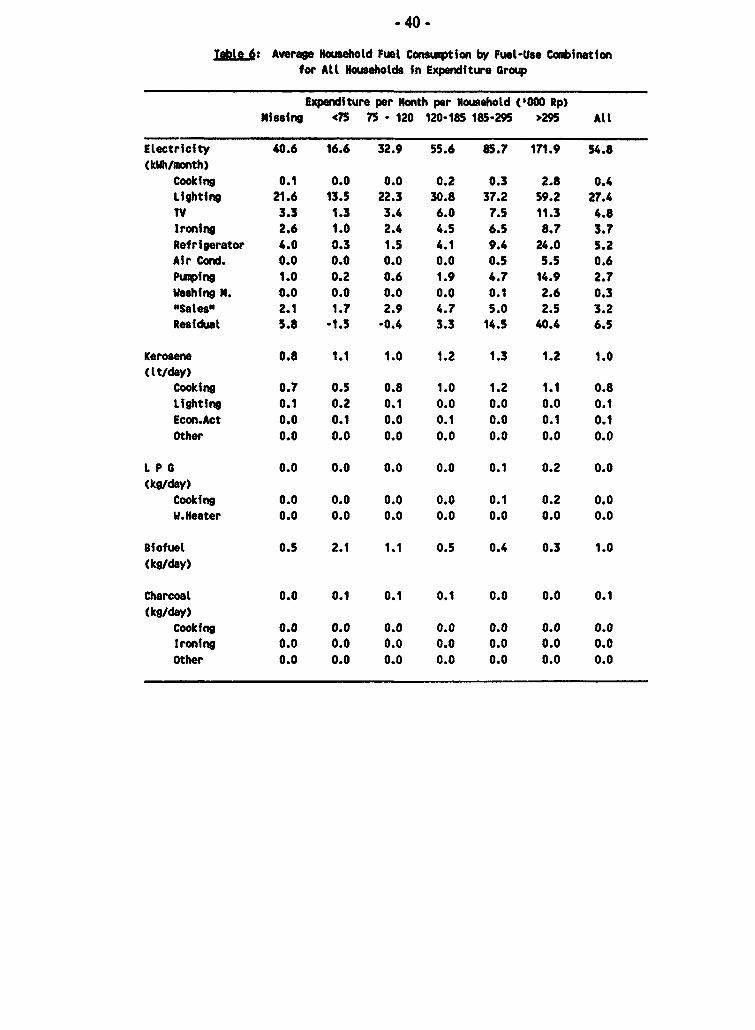
for Users in Expenditure Group .................................... 39Table 6: Average Household Fuel Consumption by Fuel-Use Combination
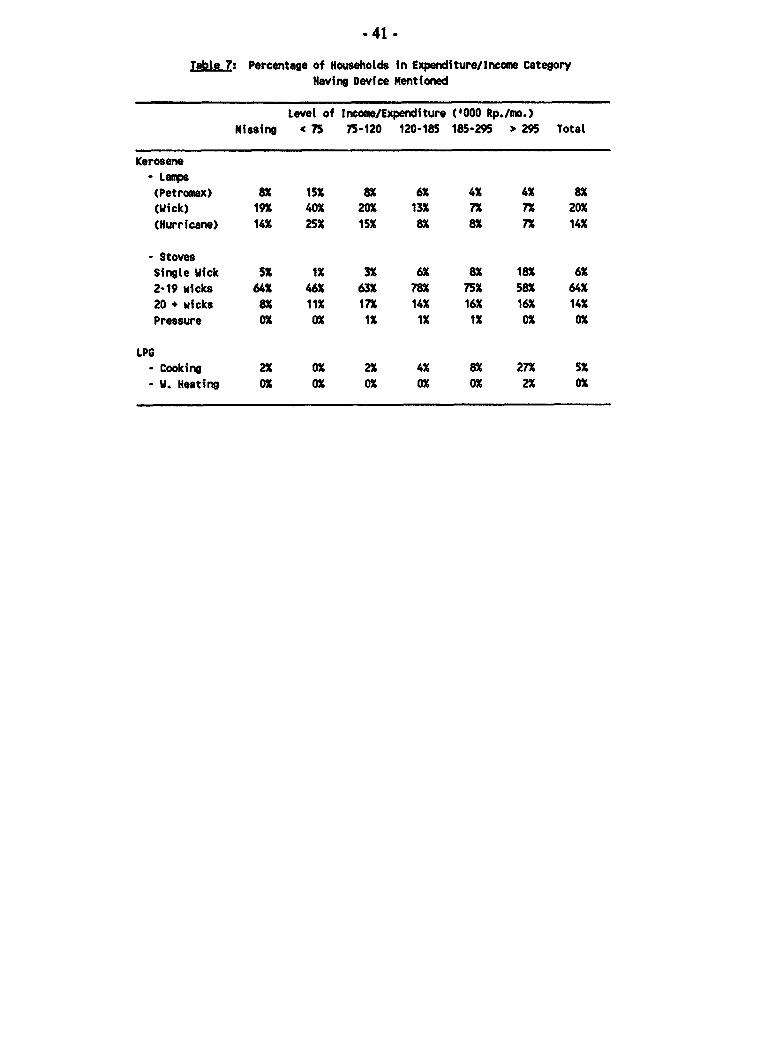
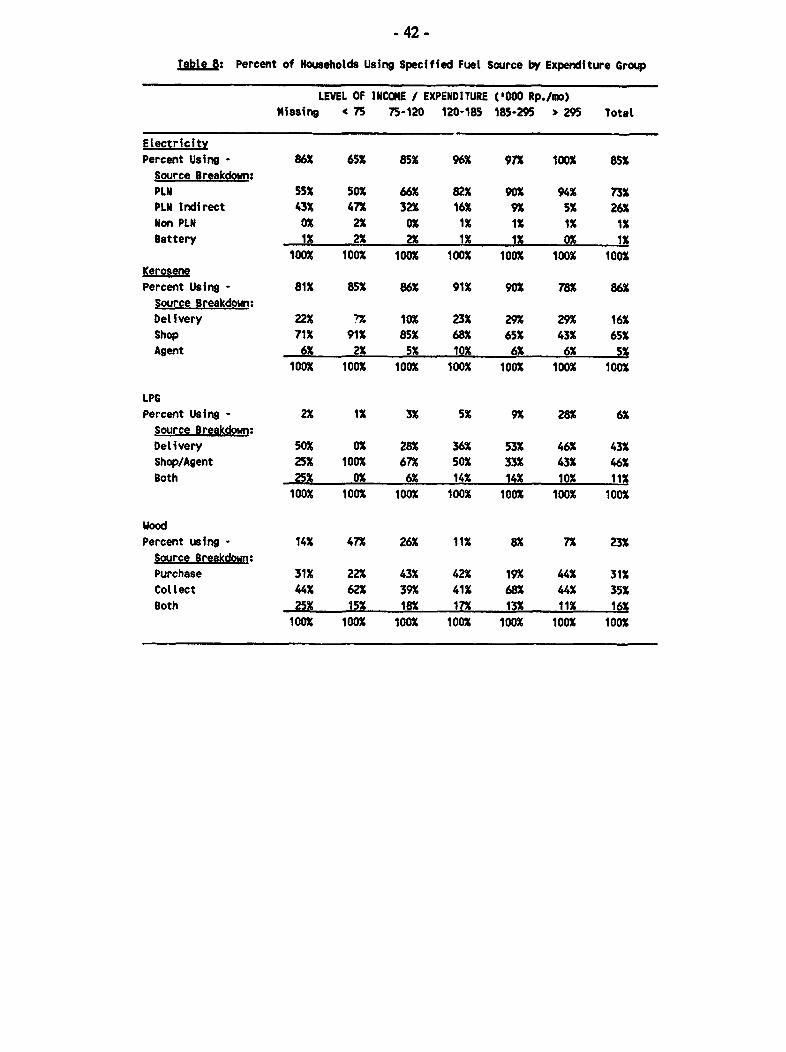
for All Households in Expenditure Group ............................. 40Table 7: Percentage of Households in Expenditure/Income Category ..... .......... 41Table 8: Percent of Households Using Specified Fuel Source by Expenditure Group .... 42
Summary Tables - Urban Area Size and Energy ........................ 43Table 9: Percentage of Households in Urban Area Type ......................... 43Table 10: Average Household Fuel Consumption by Fuel-Use Combination
for Users in Urban Area Size Category .... .......................... 44
-5-
Table 11: Average Household Fuel Consumption by Fuel-Use Combinationfor All Households in Urban Area Size Category ....................... 45
Table 12: Average Household Expenditures on Fuel-Usefor All Households in Urban Area Size Category ....................... 46
Table 13: Percent of Households Using Specified Fuel Sourceby Urban Area Size ............. ................................ 47
Table 14: Household Member with Major Influence on Purchase and Useof Device Mentioned ............ ................................ 48
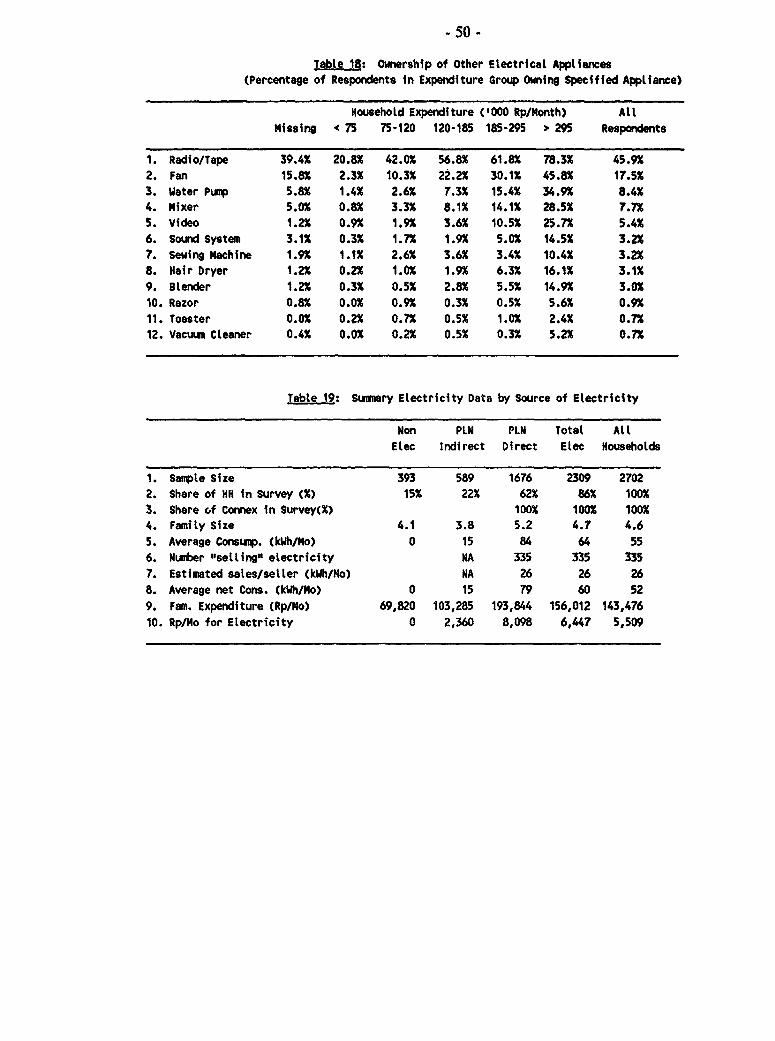
Table 15: Reasons Non-Electrified Households Do Not Use Electricity ..... ......... 48Table 16: Percentages of Households Electrified by "Income" and Urban Area Size ..... 48Table 17: Pattern of Ownership and Use of Selected Electric Appliances ..... ........ 49Table 18: Ownership of Other Electrical Appliances ............................. 50Table 19: Summary Electricity Data by Source of Electricity ....................... 50Table 20: Bulbs per Thousand Households by Type and Use-Level .................. 51Table 21: Distribution of Electricity Use (kWh) for Lighting by Bulb Type
and Use-Level ............. ................................... 51Table 22: Average Household Cooking Fuel Use and Mix
by Urban Area Size and Expenditure Group ........................... 52Table 23: Main Reasons for Use/Non-Use of Cooking Fuel ....................... 53
LIST OF SUSENAS SUMMARY TABLESTable 1: Urban Household Characteristics by Province and Year .................. 54Table 2: Average Fuel Use of Using Urban Households ......................... 55Table 3: Total Fuel Use of Urban Households by Province and Year ..... .......... 56Table 4: Percentage of Urban Households Using Fuel by Province and Year .... ...... 57Table 5: Avcrage Fuel Use of Urban Households by Province and Year .... ......... 58Table 6: Urban Household Characteristics by Expenditure Group and Year .... ...... 59Table 7: Number of Urban Households Using Fuel by Expenditure Group
All Indonesia . .................................................. 60Table 8: Average Fuel Use of Using Urban Household .......................... 61Table 9: Total Fuel Use of Urban Households by Fuel and Expenditure .... ......... 62Table 10: Percentage of Urban Households Using Fuel
by Expenditure Group ........................................... 63Table 11: Average Fuel Use of Urban Households
by Fuel and Expenditure .................................... 64Table 12: Average Fuel Expenses by Using Urban Households by Expenditure Group ... 65Table 13: Average Fuel Expenditure by Urban Households by Expenditure Group ...... 66Table 14: Percent of Total Expenditure on Fuel by Urban Household
Expenditure Group .............. ................................ 67
-6-
THE INDONESIA URBAN HOUSEHOLD ENERGY SURVEY
Survey Objectives
1. The urban household energy survey (UHESS) was undertaken both to support theformulation of an urban household energy strategy, and to provide a continuing source ofinformation for policy decisions. The funding and effort expended in past urban household energysurveys (see below) indicate the importance numerous organizations attach to understandinghousehold energy use patterns. The UHESS survey attempts to move towards a consolidatedsurvey instrument, capable of addressing the diverse concerns of the numerous organizationsinvolved in household energy issues. Many of these concerns are discussed in the bodv of thisreport.
2. The strategy development, around which this report centers, relies heavily on the surveydata. For example, the proposal for a kerosene stove program draws on survey data concerningcooking habits. The proposal for an electric appliance conservation program draws on applianceownership and use data. The analysis of kerosene-LPG substitution draws on fuel choice and usedata, as well as inter-fuel substitution ratios derived statistically from the survey data. All of thestrategy components utilize energy demand projections based on relations between energy usepatterns anl household characteristics identified in the survey. The summary tables distilled fromthe survey data also provide important contextual information for all of the strategy components.Indeed, during the course of the strategy analysis, nearly all of the survey data was used in oneform or another.
3. In addition to this one-time analysis of the survey data, future policy decisions will requirealternative treatments of the data. During the course of developing the information campaigns forthe kerosene stove and electric appliance programs, for example, it will be necessary to re-accessthe data in order to analyze which of the mass media will best reach the target households (e.g.refrigerator owners, or household with factory stoves), and who in the household is likely to bedeciding on the type of energy-using device to be purchased. In order to facilitate the continuinguse of the data, a data base was developed.
Summary of Past Urban Household Energy Surveys
4. During the first half of the 1980's, in the course of more than five independent surveyefforts, energy-use surveys were administered to over 10,000 urban households in Indonesia. In1982, the State Gas Company (PGN) enlisted the aid of the Central Bureau of Statistics (BPS) toadminister a survey of almost 3,000 households in nine major cities in order to ascertain thepotential demand for piped gas. At about the same time, the Directorate General for Oil and Gas(MIGAS) administered a survey of over 2,000 preponderantly urban households in Java, in theattempt to improve their understanding of household kerosene demands and requirements(MIGAS), 1983). In 1984, the Department of Public Works commissioned a survey of energy use
- 7 -
in over 2,000 urban households in Java, in order to help assess the potential market for charcoalimported from transmigration areas. In 1985, the State Electric Company (PLN) administered asurvey of almost 2,0Z0 electrified households in 19 major cities in Indonesia, in order to assess theirappliance ownership and electricity use patterns (PLN,1985). Also in 1985, the Directorate Generalfor Electricity and New Energy (DJLEB), working with a U.S. consulting firm (E/DI), oversaw adetailed survey of over 1,600 urban households in nine major cities in Indonesia (DJLEB-E/DI,1985). Although some of these surveys concentrated on a particular fuel or policy issue, the overlapwas considerable.
5. Unfortunately, the lack of systematic sampling procedures or survey instruments makescomparisons very difficult. Only the results of tbe 1985 DJLEB-E/DI survey, whose objectives weresomewhat similar to the UHESS survey, will be summarized here. The DJLEB-E/DI survey wasenvisaged as a "pilot effort", undertaken as part of a broader attempt to collect "baseline energyconsumption data" in support of the energy planning activities of DJLEB. It was designed to collectinformation on:
(a) household characteristics (e.g. size and income);
(b) household fuel consumption by end-use (including transport);
(c) fuel availability and price;
(d) energy-using device ownership and usage patterns.
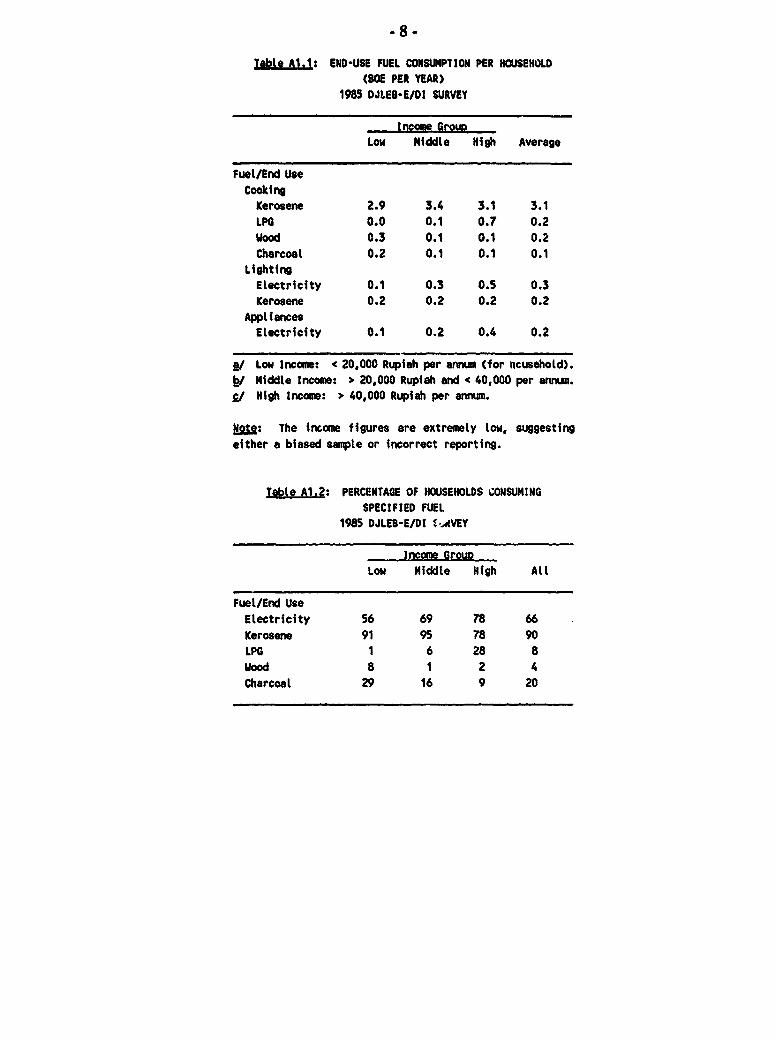
6. A summary of the results is provided in the Tables below. The households surveyed werefrom nine of Indonesia's largest cities, including 7 in Java: Jakarta, Bogor, Bandung, Semarang,Yogyakarta, Surabaya, Malang, Ujung Pandang, and Medan. The sample was selected fromhouseholds previously surveyed for the BPS-administered SUSENAS survey. The fieldwork wasundertaken by University students, and supervised by staff of the Institute of Technology atBandung, with the assistance of foreign (U.S.) consultants.
-8-
Table A1.1: END-USE FUEL CONSUMPTION PER HOUSEHOLD(tOM PER YEAR)
1985 DJLEB-E/DI SURVEY
Income GroupLow Middle High Average
Fuel/End UseCooking
Kerosene 2.9 3.4 3.1 3.1LPG 0.0 0.1 0.7 0.2Wood 0.3 0.1 0.1 0.2Charcoal 0.2 0.1 0.1 0.1
LightingElectricity 0.1 0.3 0.5 0.3Kerosene 0.2 0.2 0.2 0.2
AppliancesEtectricity 0.1 0.2 0.4 0.2
M/ Low Income: < 20,000 Rupiah per ann (for hcusehotd).W Middtle Income: > 20,000 Rupiah and < 40,000 per anrum.g/ High Income: > 40,000 Rupiah per annum.
: The inmome figures are extremely low, suggestingeither a biased sample or incorrect reporting.
Table A1.2: PERCENTAGE OF HWSEHOLDS CONSUMINGSPECIFIED FUEL
1985 DJLEB-E/DI --AVEY
Income GrouwLow Middle High All
Fuel/End UseElectricity 56 69 78 66Kerosene 91 95 78 90LPG 1 6 28 aWood 8 1 2 4Charcoal 29 16 9 20
-9 -
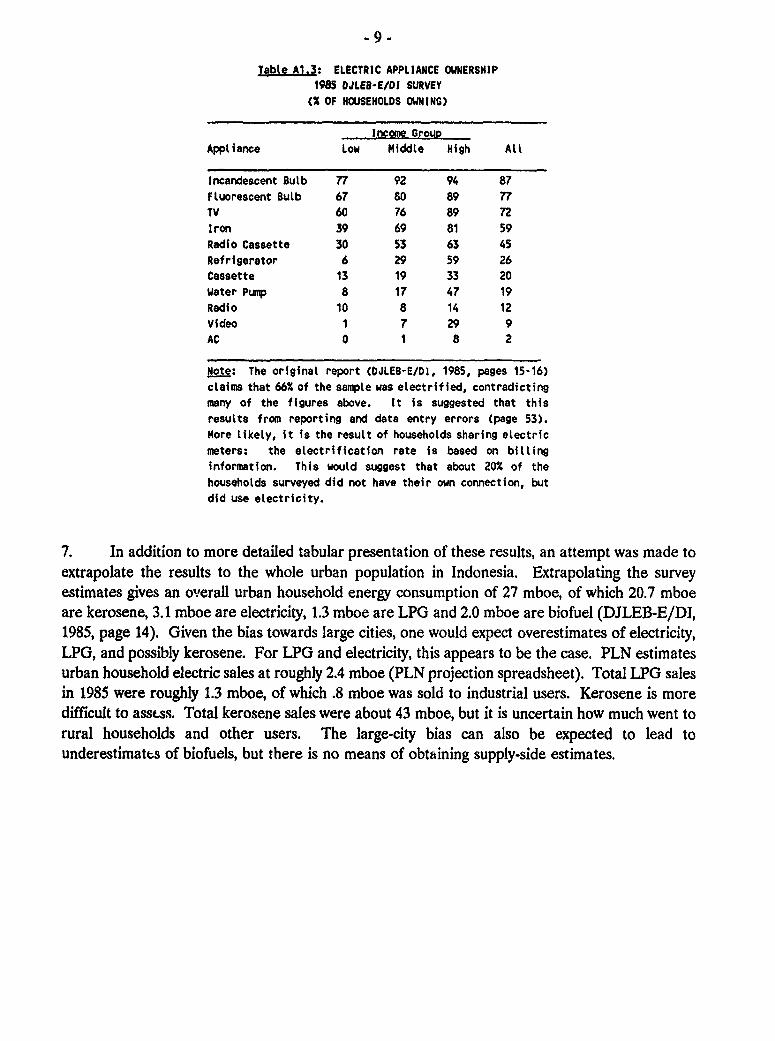
Table A1.3: ELECTRIC APPLIANCE OWNERSHIP1985 DJLEB-E/DI SURVEY
(% OF HOUSEHOLDS OWNING)
Income Group
Appliance Low Middle High Ali
Incandescent Bulb 77 92 94 87Fluorescent Bulb 67 80 89 77
TV 60 76 89 72
Iron 39 69 81 59
Radio Cassette 30 53 63 45
Refrigerator 6 29 59 26Cassette 13 19 33 20
Water Pump 8 17 47 19
Radio 10 8 14 12
Video 1 7 29 9AC 0 1 8 2
Note: The original report (DJLEB-E/DI. 1985, pages 15-16)
claims that 66% of the sample was electrified, contradicting
many of the figures above. It is suggested that thisresults from reporting and data entry errors (page 53).
More likely, it is the result of househotds sharing etectric
meters: the electrification rate is based on billing
information. This would suggest that about 20% of the
households surveyed did not have their own connection, but
did use electricity.
7. In addition to more detailed tabular presentation of these results, an attempt was made toextrapolate the results to the whole urban population in Indonesia. Extrapolating the surveyestimates gives an overall urban household energy consumption of 27 mboe, of which 20.7 mboeare kerosene, 3.1 mboe are electricity, 1.3 mboe are LPG and 2.0 mboe are biofuel (DJLE13-E/DI,1985, page 14). Given the bias towards large cities, one would expect overestimates of electricity,LPG, and possibly kerosene. For LPG and electricity, this appears to be the case. PLN estimatesurban household electric sales at roughly 2.4 mboe (PLN projection spreadsheet). Total LPG salesin 1985 were roughly 1.3 mboe, of which .8 mboe was sold to industrial users. Kerosene is morediffilcult to asscss. Total kerosene sales were about 43 mboe, but it is uncertain how much went torural households and other users. The large-city bias can also be expected to lead tounderestimates of biofuels, but there is no means of obtaining supply-side estimates.
10 -
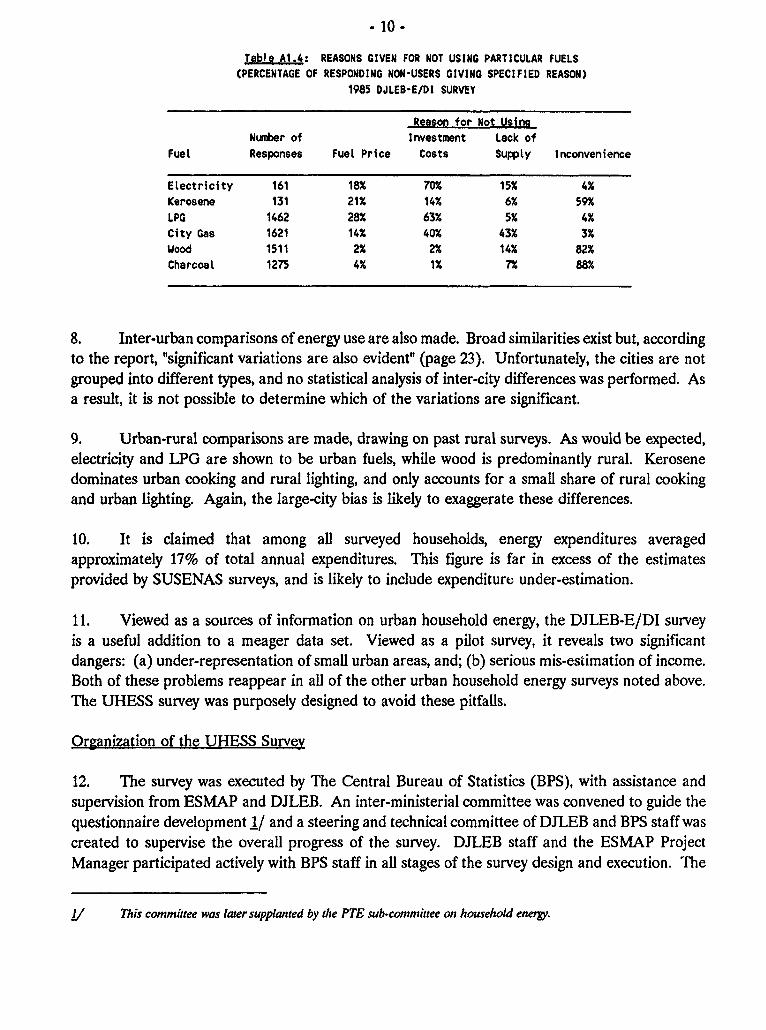
Table A1.4: REASONS GIVEN FOR NOT USING PARTICULAR FUELS(PERCENTAGE OF RESPONDING NON-USERS GIVING SPECIFIED REASON)
1985 DJLEB-E/DI SURVEY
Reason for Not UsingNumber of Investment Lack of
Fuel Responses Fuel Price Costs Supply Inconvenience
Electricity 161 18% 70% 15% 4%
Kerosene 131 21% 14% 6% 59%
LPG 1462 28% 63% 5% 4%City Gas 1621 14% 40% 43% 3%
Wood 1511 2% 2% 14% 82%
Charcoal 1275 4% 1% 7% 88%
8. Inter-urban comparisons of energy use are also made. Broad similarities exist but, accordingto the report, "significant variations are also evident" (page 23). Unfortunately, the cities are notgrouped into different types, and no statistical analysis of inter-city differences was performed. Asa result, it is not possible to determine which of the variations are significant.
9. Urban-rural comparisons are made, drawing on past rural surveys. As would be expected,electricity and LPG are shown to be urban fuels, while wood is predominantly rural. Kerosenedominates urban cooking and rural lighting, and only accounts for a small share of rural cookingand urban lighting. Again, the large-city bias is likely to exaggerate these differences.
10. It is claimed that among all surveyed households, energy expenditures averagedapproximately 17% of total annual expenditures. This figure is far in excess of the estimatesprovided by SUSENAS surveys, and is likely to include expenditure; under-estimation.
11. Viewed as a sources of information on urban household energy, the DJLEB-E/Dl surveyis a useful addition to a meager data set. Viewed as a pilot survey, it reveals two significantdangers: (a) under-representation of small urban areas, and; (b) serious mis-estimation of income.Both of these problems reappear in all of the other urban household energy surveys noted above.The UHESS survey was purposely designed to avoid these pitfalls.
Organization of the UHESS Survey
12. The survey was executed by The Central Bureau of Statistics (BPS), with assistance andsupervision from ESMAP and DJLEB. An inter-ministerial committee was convened to guide thequestionnaire development 1/ and a steering and technical committee of DJLEB and BPS staff wascreated to supervise the overall progress of the survey. DJLEB staff and the ESMAP ProjectManager participated actively with BPS staff in all stages of the survey design and execution. The
LI This committee was later supplanted by thle PTE sub-committee on household eneVy.
11 X
survey represented the first cooperative effort involving DJLEB and BPS. The validated data wassent to Lemigas for further processing and analysis by the project team.
Definition of Urban Area and Estimation of Urban Area Size
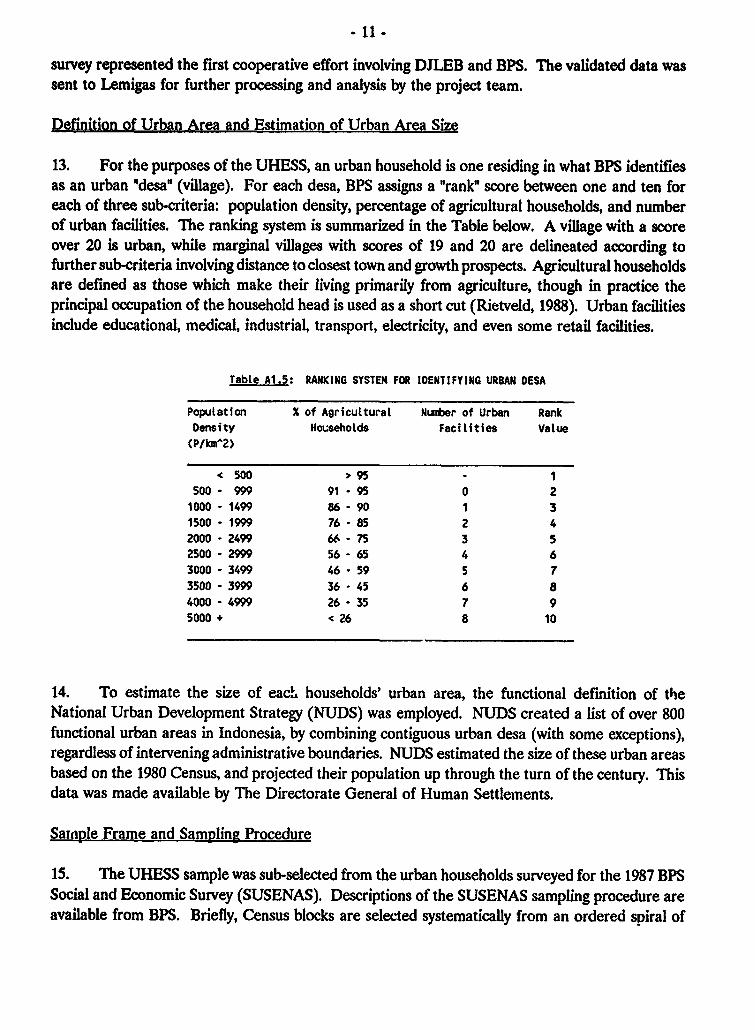
13. For the purposes of the UHESS, an urban household is one residing in what BPS identifiesas an urban "desa" (village). For each desa, BPS assigns a "rank" score between one and ten foreach of three sub-criteria: population density, percentage of agricultural households, and numberof urban facilities. The ranking system is summarized in the Table below. A village with a scoreover 20 is urban, while marginal villages with scores of 19 and 20 are delineated according tofurther sub-criteria involving distance to closest town and growth prospects. Agricultural householdsare defined as those which make their living primarily from agriculture, though in practice theprincipal occupation of the household head is used as a short cut (Rietveld, 1988). Urban facilitiesinclude educational, medical, industrial, transport, electricity, and even some retail facilities.
Tabte A1.5: RANKING SYSTEM FOR IDENTIFYING URBAN DESA
Population X of Agricultural Number of Urban RankDensity Households Facilities Value(P/WA2)
< 500 > 95 - 1500- 999 91 - 95 0 2
1000 - 1499 86 - 90 1 31500 - 1999 76 - 85 2 42000 - 2499 66 - 75 3 52500 - 2999 56 - 65 4 63000 - 3499 46 - 59 5 73500 - 3999 36 - 45 6 84000 - 4999 26 - 35 7 95000 + < 26 8 10
14. To estimate the size of each. households' urban area, the functional definition of theNational Urban Development Strategy (NUDS) was employed. NUDS created a list of over 800functional urban areas in Indonesia, by combining contiguous urban desa (with some exceptions),regardless of intervening administrative boundaries. NUDS estimated the size of these urban areasbased on the 1980 Census, and projected their population up through the turn of the century. Thisdata was made available by The Directorate General of Human Settlements.
Sample Frame and Sampling Procedure
15. The UHESS sample was sub-selected from the urban households surveyed for the 1987 BPSSocial and Economic Survey (SUSENAS). Descriptions of the SUSENAS sampling procedure areavailable from BPS. Briefly, Census blocks are selected systematically from an ordered spiral of
- 12 -
blocks extending from the center to the outskirts of each urban area (at least for those urban areasof sufficient size to create a spiral). Households within selected blocks are pre-surveyed, orderedin terms of expected income class, and households are taken at fixed intervals from the resultinglist. The number of households selected within a block is proportional to the size of the block, butgenerally lies between five and twenty.
16. For reasons of cost, the UHESS survey was administered only in Java. Given the choicebetween restricting the survey to large cities and restricting it to Java, the latter was consideredpreferable. The results confirm that variation among different sized urban areas is far moresignificant than inter-island differences, though in future surveys it would be preferable to includeall the island groups.
17. To select UHESS households from the SUSENAS sample, the SUSENAS-Java sample wasfirst stratified by 1980 urban area size, as defined by the National Urban Development StrategyStudy (NUDS). The UHESS blocks were selected to ensure proportional representation of eachurban area size category. Over sixty urban areas are represented in the UHESS sample.
18. In case of houses no longer in the Sample Frame location, it was agreed that the newresidents (or, failing that, a neighbor) would be administered both the UHESS survey and theSUSENAS expenditure module.
Sample Size
19. The sample included 2,702 households, spread out over about seventy urban areas and twohundred and twenty blocks (slightly less than half of the SUSENAS blocks). As is made evidentin the data analysis, this number of households and blocks is sufficient for the purposes envisaged.Users should understand the limits to the data set, however. For example:
(a) The sample size is not sufficient for city specific analysis of energy use in any but the largestcities;
(b) The sample size is not sufficient for analyzing the characteristics of appliances owned by lessthan about 5% of the population, such as air conditioners, and other luxury white goods;
(c) The number of blocks are insufficient for the relatively rare and regionally clustered energytechnologies, such as city gas and high-power electric tariffs (i.e. R3 and R4).
Questionnaire
20. A translation of the final household questionnaire is provided below. The questionnaire wasdeveloped in November and December of 1987, and pre-tested on thirty households in Bogor inmid-January of 1988. BPS, DJLEB, and ESMAP were all involved in the questionnaire design, andcomments were received from a multi-Ministerial task force. Most of the questions are directed
- 13 -
at household members (the principal man and woman of the household). Surveyors were instructedto observe appliances, to corroborate household responses, and to engage in direct measurementin certain cases. Specifically, wood-fuel consumption and kerosene consumption for secondarypurposes were physically measured over a two day period for all surveyed households. Disregardingthe direct measurement (which required multiple visits), the questionnaire could be finished foralmost all households in less than one hour, and often in as little as half an hour.
21. To complement the household data, a small data set was collected by a supervisor for eachof the blocks surveyed. The questions concerned fuel supply and availability.
Survey Execution: Pretest. Training and Field Work
22. Surveyor instructors and other BPS staff administered the pre-test surveys to thirtyhouseholds in Bogor in mid-January 1988, with the help of DJLEB and ESMAP staff. As a resultof the pre-test, several questions were dropped, and improvements were introduced. The mostimportant finding of the pre-test was the importance of inter-household electricity sales, with themetered households selling to their neighbors.
23. From the questionnaire and the experience fo the pre-test, a manual for surveyors andsupervisors was developed. Eight instructors were trained February 7-9, 1988. One-hundred-and-forty-one surveyors and sixty-nine supervisors were trained between the 11th and 20th of February,with separate sessions in each of the five provinces (Jakarta, West Java, Central Java, Yogyakarta,and East Java). The surveyors and supervisors were BPS professionals.
24. The field work was carried out in March, 1988. Since the surveyors live in the vicinity ofthe households to be surveyed, the precise dates were determined by the surveyors and theirsupervisors. Inspection teams, including DJLEB and/or ESMAP staff, were sent out from the BPScentral office to each province.
Data Validation
25. BPS was charged with the preliminary data processing. The questionnaires were reviewedby supervisors, according to procedures outlined in the supervisors' handbook. Surveyors wererequested to revisit household when anomalies arose. Regional officers also reviewed thequestionnaires.
26. Tne data was entered directly into Personal Computers. BPS developed a data validationprogram designed to detect both intermal inconsistencies and unreasonable values. TheQuestionnaires failing the validation tests were reviewed, and the flagged inconsistencies resolved.Three iterations were required before BPS considered the data to be suitable for analysis. The datawere then transferred to Lemigas, where further data validation was undertaken using interactivesoftware. The majority of the errors uncovered at this stage involved unrealistic technologycharacteristics, particularly with regard to electric appliances.
- 14 -
Data Base Development
27. The data base development was undertaken by Lemigas. Seven files were created, in bothSPSS and @Base versions. Each fie has the same first household identifier variables, includingsummary fuel-use data, and household characteristics likely to be relevant to most aspects of energyuse. The remaining variables depend on the file topics, which may be functional or fuel-specific:
(a) File One - General;
(b) File Two - Cooking,
(c) File Three - Lighting;
(d) File Four - Electricity;
(e) File Five - Kerosene;
(f) File Six - LPG; and
(g) File Seven - Biofuel.
28. A list of the variables included in each file is provided in the UJHESS Data BaseDevelopment Report by Lemigas. There is considerable overlap between .he files. To the extentthat the file organization is successful, there should be a single file providing all of the variablesrelevant to any given substantive issue. Different government agencies are likely to be interestedin a different subset of files.
29. In many cases the variables were not directly from the validated survey data, but involvedcomputations. All energy consumption figures are expressed on a daily basis in the data-base, whilethe questionnaire includes a variety of units and periods. Most conversions were straightforward,and involved simple linear transformations, but in some cases more elaborate estimation procedureswere required.
30. The most complex data processing was for the estimation of electricity use by appliance.Three sources of information regarding appliance energy use were employed: (a) survey-basedestimates of wattage and hours of use available for every household; (b) crude technical estimatesof expected appliance use for "average" appliances sold in Indonesia; and (c) statistical analysis ofthe relation between appliance use and recorded electricity consumption. The first source alonewas insufficient. To a rough approximation, hours of use times appliance wattage equals watt-hours of electricity consumption. However, there are appliances for which hours of "use" are notequivalent to 'on-time" (e.g. automatic water pumps and refrigerators), the wattage informationcoLlected is not appropriate (e.g. it may be maximum wattage) or systematic mis-estimation occurs(e.g. it is more likely for households to omit lamps that exist than to include ones that don't). For
- 15 -
these reasons, whenever the survey based watt-hour estimates were contradicted by statisticalanalysis, efforts were made to improve the original estimates on the basis of technical or statisticalanalysis.
31. To detect mniestimation statistically required several steps: (a) selecting heaseholds withmetered electricity and no commercial uses of electricity; (b) regressing electricity consumption onthe estimates of individual appliance electricity use; (c) identifying appliances whose regressioncoefficients were significantly different from one. For televisions, refrigerators 2/, and irons, thestatistical analysis corroborated the original watt-hour estimates. For pumping, air conditioning andcooking, the statistical analysis indicated significant errors in the original estimates. For waterpumping, technical estimates of expected appliance electricity consumption also indicated that theoriginal estimates were in error. Furthermore, there was an obvious source of error in the originalestimates: households are often not aware of how long their pumps operate. For air conditioners,a technically based estimate lay somewhere between the original estimate and the statisticalestimate. Again, there was a possible source of error: confusion over the treatment of second andthird air-conditioning units, with a resulting loss of information. In both cases, the householdappliance estimates were multiplied by a constant designed to ensure that the average consumptionper appliance corresponded to the technical estimate. The possible bias in the cooking estimateswere ignored given the relative unimportance of elecfic cooking, and the likelihood of omittedvariable bias in the OLS coefficient. ./
32. For lighting, the statistical analysis suggested a 26% underestimate of watt-hours in thesurvey data. Furthermore, average household electricity use with the sum of ioentified applianceuse indicated an overly large residual for "other electric appliances". In response, all householdlighting estimates were increased by 1.36 to compensate for this underestimation. More recentanalysis suggests that the lighting underestimation was actually limited to households with a largenumber of lamps. Further detailed analysis of lighting should extend this procedure to account forthis observation.
Z/ Refngerts we asnumed to operae 65% of the tine.
/ Households wih ie-coorkes are also more likely to own appliances omitted for the equation, thereby biasing thecoeficiaent upws. The same bias may akso exi for aiconditioner.
- 16 -
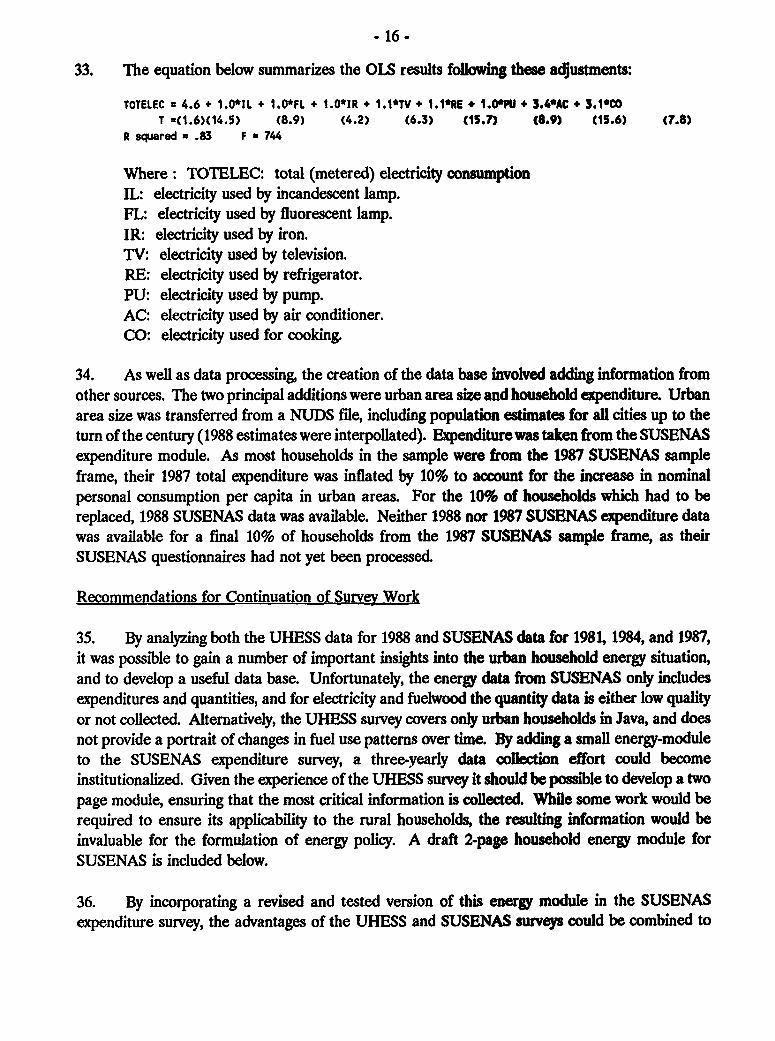
33. The equation below summarizes the OLS results following these adjustments:
TOTELEC a 4.6 + 1.0*11 + 1.0*FL + 1.0*IR + 1.1*TV, 1.I*RE + 1.O*PU + 3.4*AC + 3.1MCOT =(1.6)(14.5) (8.9) (4.2) (6.3) (15.7) (8.9) (15.6) (7.8)
R squared u .83 F 744
Where: TOIELEC: total (metered) electricity consumptionIL: electricity used by incandescent lamp.FL: electricity used by fluorescent lamp.IR: electricity used by iron.TV: electricity used by television.RE: electricity used by refrigerator.PU: electricity used by pump.AC: electricity used by air conditioner.CO: electricity used for cooking.
34. As well as data processing, the creation of the data base involved adding information fromother sources. The two principal additions were urban area size and household expenditure. Urbanarea size was transferred from a NUDS file, including population estimates for all cities up to theturn of the century (1988 estimates were interpollated). Expenditure was taken from the SUSENASexpenditure module. As most households in the sample were from the 1987 SUSENAS sampleframe, their 1987 total expenditure was inflated by 10% to account for the increase in nominalpersonal consumption per capita in urban areas. For the 10% of households which had to bereplaced, 1988 SUSENAS data was available. Neither 1988 nor 1987 SUSENAS expenditure datawas available for a final 10% of households from the 1987 SUSENAS sample frame, as theirSUSENAS questionnaires had not yet been processed.
Recommendations for Continuation of Survey Work
35. By analyzing both the UHESS data for 1988 and SUSENAS data for 1981, 1984, and 1987,it was possible to gain a number of important insights into the urban household energy situation,and to develop a useful data base. Unfortunately, the energy data from SUSENAS only includesexpenditures and quantities, and for electricity and fuelwood the quantity data is either low qualityor not collected. Alternatively, the UHESS survey covers only urban households in Java, and doesnot provide a portrait of changes in fuel use patterns over time. By adding a small energy-moduleto the SUSENAS expenditure survey, a three-yearly data collection effort could becomeinstitutionalized. Given the experience of the UHESS survey it should be possible to develop a twopage module, ensuring that the most critical information is collected. While some work would berequired to ensure its applicability to the rural households, the resulting information would beinvaluable for the formulation of energy policy. A draft 2-page household energy module forSUSENAS is included below.
36. By incorporating a revised and tested version of this energy module in the SUSENASexpenditure survey, the advantages of the UHESS and SUSENAS surveys could be combined to

- 17 -
provide a dynamic picture of the energy transition currently in process among urban households.The implementation of a coherent urban household energy strategy would be greatly facilitated.Perhaps more important, an important part of the information needed to develop a rural householdenergy strategy would become available. Finally, policies, such as kerosene pricing, which affectsboth urban and rural households, could fnally be based on a solid foundation of knowledgeconcerning both who bears the cost of kerosene price changes, and how they react.
- 18 -
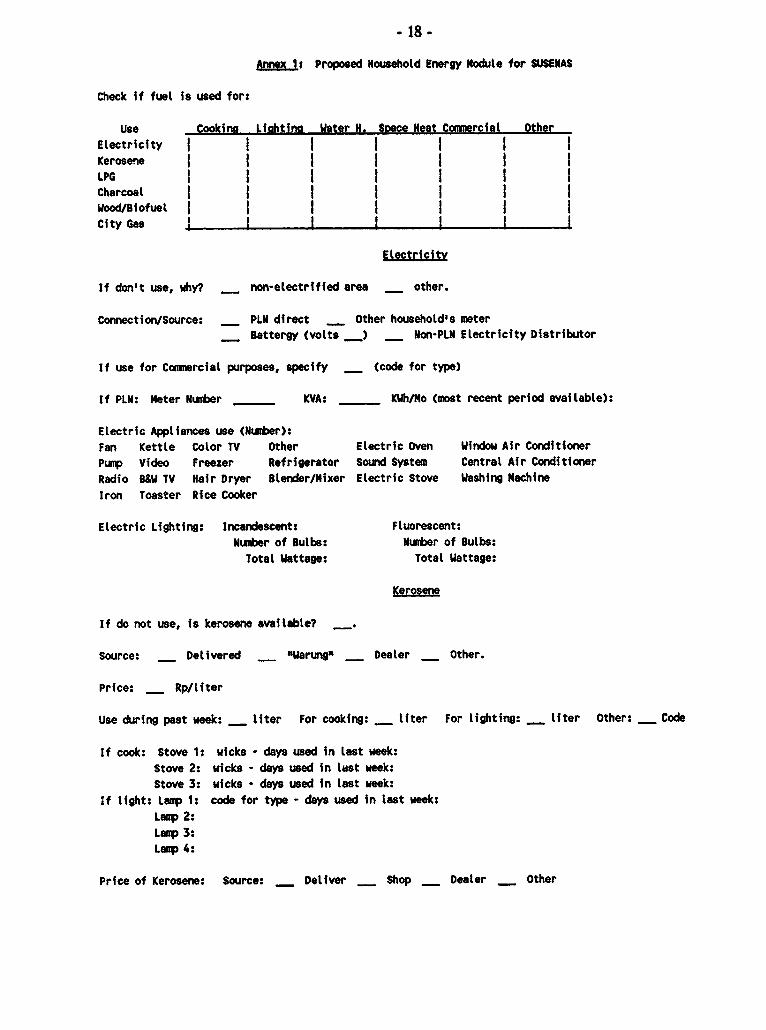
Annex 1: Proposed Household Energy Module for SUSENAS
Check if fuel is used for:
Use Cookina Lishtins Water H. Space Heat Com*ercial Other
Electricity l I I I l l l
Kerosene j l l l l l
LPG l l I l l l 1Charcoal t l l l l l l
Wood/Biofuel t l l l l l l
City Gas j _ _ I | IElectricity
If don't use, why? _ non-electrified area _ other.
Connection/Source: _ PLN direct _ Other household's meterBattergy (volts __) _ Non-PLN Electricity Distributor
If use for Commercial purposes, specify - (code for type)
If PLN: Meter Number KVA: KWh/Mo (most recent period available):
Electric Appliances use (Number):
Fan Kettle Color TV Other Electric Oven Window Air Conditioner
Pump Video Freezer Refrigerator Sound System Central Air Conditioner
Radio 8&W TV Hair Dryer Blender/Mixer Electric Stove Washing Machine
Iron Toaster Rice Cooker
Electric Lighting: Incandescent: Fluorescent:
Number of Bulbs: Number of Bulbs:
Total Wattage: Total Wattage:
Kerosene
If do not use, is kerosene available?
Source: _ Delivered _ "Warung" _ Dealer _ Other.
Price: _ Rp/liter
Use during past week: _ liter For cooking: _ liter For lighting: _ liter Other: _ Code
If cook: Stove 1: wicks - days used in last week:
Stove 2: wicks - days used in last week:Stove 3: wicks - days used in last week:
if light: Lanp 1: code for type - days used in last week:
Laup 2:
Lamp 3:Lamp 4:
Price of Kerosene: Source: _ Deliver _ Shop _ Dealer _ Other
- 19 -
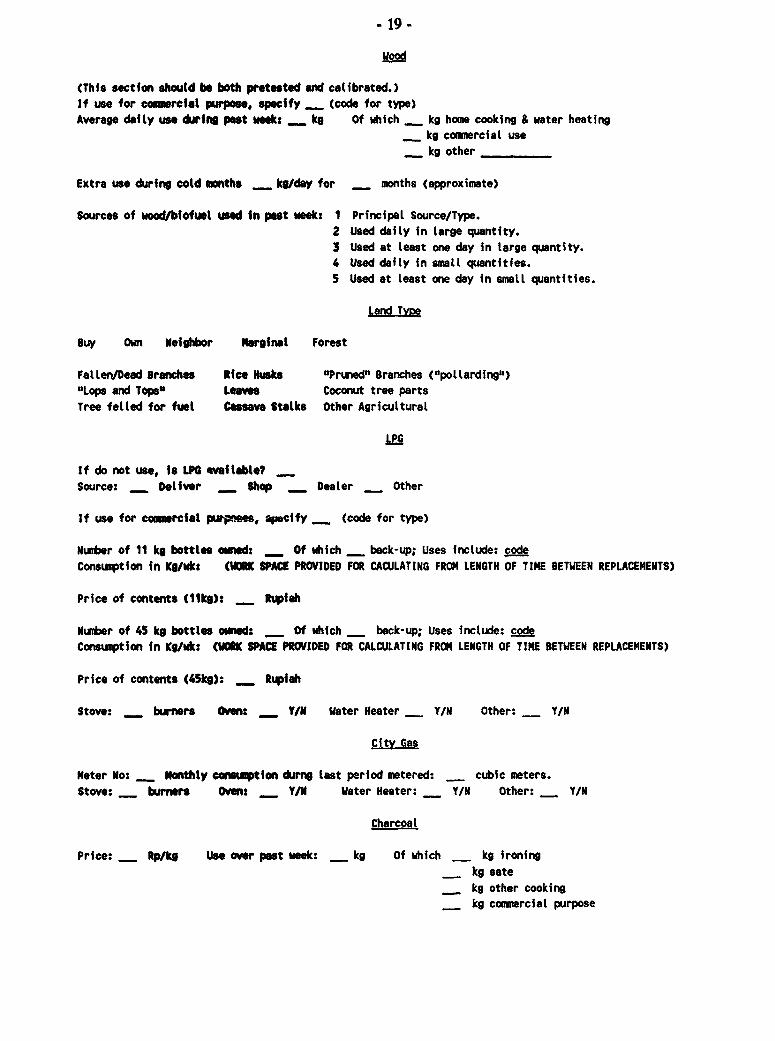
Wood
(Thfs sectfon should be both pretested and calibrated.)if use for commercl purpose, specify _ (code for type)Average daely use during pest week: _ kg Of which kg home cooking & water heating
kg commercial usekg other
Extra use during cold months _ kg/day for _ months (approximate)
Sources of wood/biofuel used in pest week: I Principal Source/Type.2 Used daily In large quantity.3 Used at least one day in large quantity.4 Used daily In small quantities.5 Used at least one day in small quantities.
Land Tvye
Buy Own Neighbor Marginal Forest
Fallen/Dead 8ranches Rice Nusks uPruwed" Branches ("pollarding')"Lops and Topse Leaves Coconut tree partsTree fetled for fuel Cassava Stalks Other Agricultural
LPG
If do not use, Is LPO available? _
Source: _ Deliver _ Shop _ Dealer _ Other
if use for commercial purposes specify _ (code for type)
Number of 11 kg bottles ouned: _ Of which _ back-up; Uses include: codeConsumption in Kg/wk: (WMRK SPACE PROVIDED FOR CACULATING FROM LENGTH OF TIME BETWEEN REPLACEMENTS)
Price of contents (1ikg): - Rupiah
Number of 45 kg bottles owsed: _ Of which _ back-up; Uses include: codeConsumption in Kg/wk: (WORK SPACE PROVIDED FOR CALCULATING FROM LENGTH OF TIME BETWEEN REPLACEMENTS)
Price of contents (45kg): _ Rupfah
Stove: _ burners Ovnn: -_ Y/I Water Heater _ Y/N Other: _ Y/N
City Gas
Meter No: _ Monthly co_rnu tion durng last period metered: _ cubic meters.Stove: _ burners Om.n: _ Y/N Water Heater: _ Y/N Other: _ Y/N
Charcoal
Price: _ Rp/kg Use over past week: _ kg Of which - kg ironing
- kg sate- kg other cooking_ kg commercial purpose
*20 -
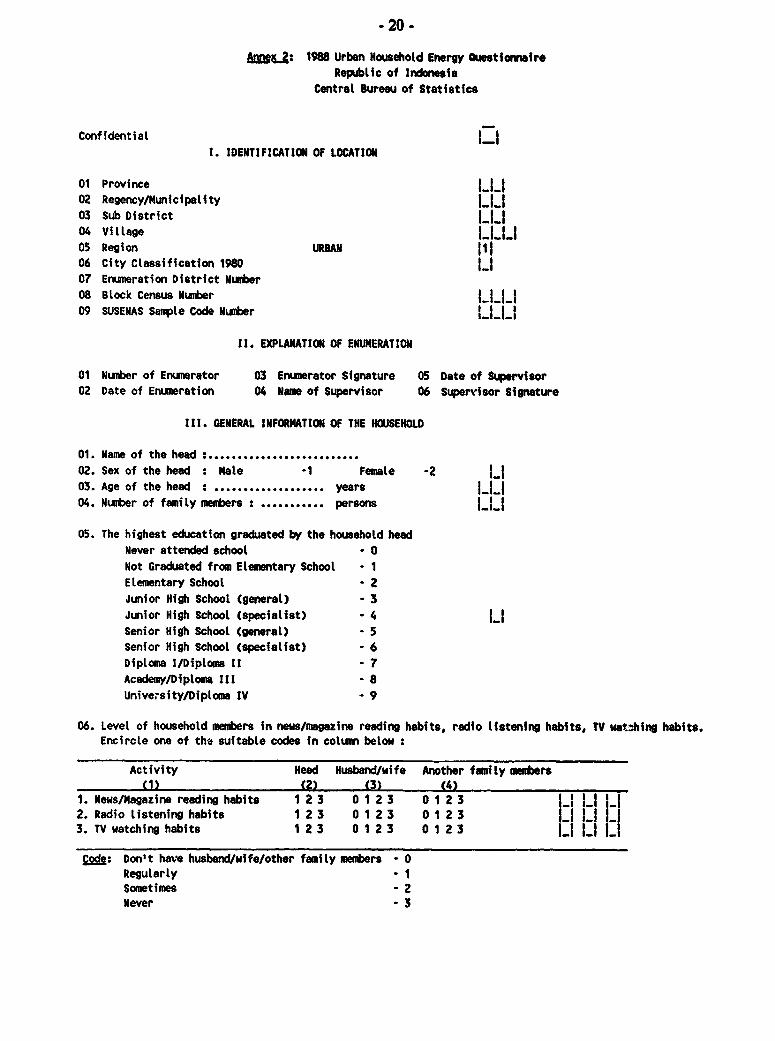
Anr*4 : 1988 Urban Household Energy QuestionnaireRepublic of Indonesia
Central Bureau of Statistics
Confidential1. IDENTIFICATION OF LOCATION
01 Province l li02 Regency/Municipality Iii03 Sub District |__04 Village ll_I05 Region URBAN06 City Classification 1980 LI07 Enumeration District Number08 Block Census Number l_|}09 SUSENAS Satple Code Nurber L i
It. EXPLANATION OF ENUMERATION
01 Number of Enumerator 03 Enumerator Signature 05 Date of Supervisor02 Date of Enumeration 04 Name of Supervisor 06 Supervisor Signature
111. GENERAL INFORNATION OF THE HOUSEHOLD
01. Name of the head :..........................02. Sex of the head : Male -1 Female -203. Age of the head: . .......... years LJI04. Number of family members: . .......... persons LJJ
05. The highest education graduated by the household headNever attended school -0Not Graduated from Elementary School - 1
lemtentary School - 2Junior High School (general) - 3Junior High School (specialist) . 4 LISenior High School (general) - 5Senior High School (specialist) - 6Diploma I/Diploma It - 7Academy/Diploma III - 8University/Diploma IV - 9
06. Level of household members in neis/magazine reading habits, radio listening habits, TV watching habits.Encircle one of the suitable codes in coluin below:
Activity Head Husband/wife Another family mebers(1) (2) (3) (4)
1. News/Magazine reading habits 1 2 3 0 1 2 3 0 1 2 3 l_ Ii lI2. Radio listening habits 1 2 3 01 2 3 01 2 33. TV watching habits 1 2 3 0 1 2 3 0 1 2 3 L
Code: Don't have husband/wife/other family menbers - 0Regularly . 1Sometimes - 2Never . 3
- 21 -
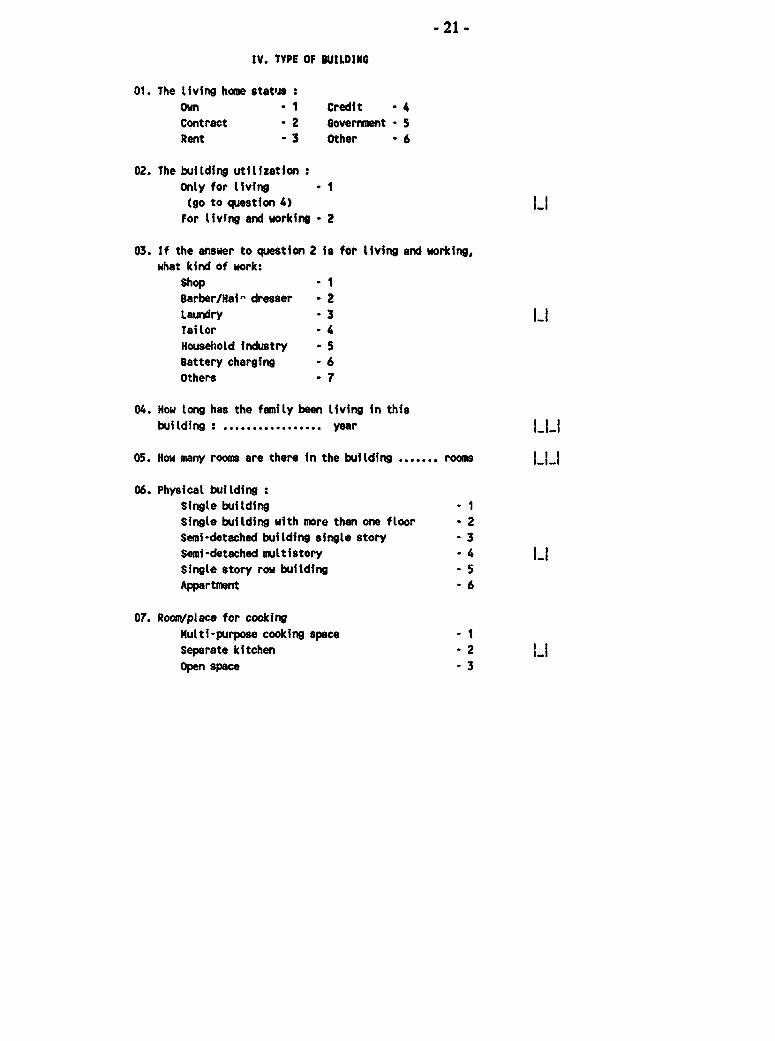
IV. TYPE OF BUILDING
01. The living home status :Own -1 Credit - 4Contract - 2 Government - 5
Rent - 3 Other * 6
02. The building utilization :Only for living *(go to question 4) LFor livfng and working - 2
03. If the answer to question 2 is for living and working,what kind of work:
Shop '1Barber/Hai" dresser * 2Laundry - 3 |_Tailor - 4Household industry - 5Battery charging - 6Others - 7
04. How long has the family been living in thisbuilding : .. ... year I_I_
05. How many rooms are there in the building ....... rooms Li
06. Physical building :Single building - 1Single building with more than one floor - 2Semi-detached building single story - 3Semi-detached multistory - 4Single story row building - 5
Appartment -6
07. Room/place for cookingMulti-purpose cooking space - 1Separate kitchen - 2 LIOpen space - 3
* 22 -
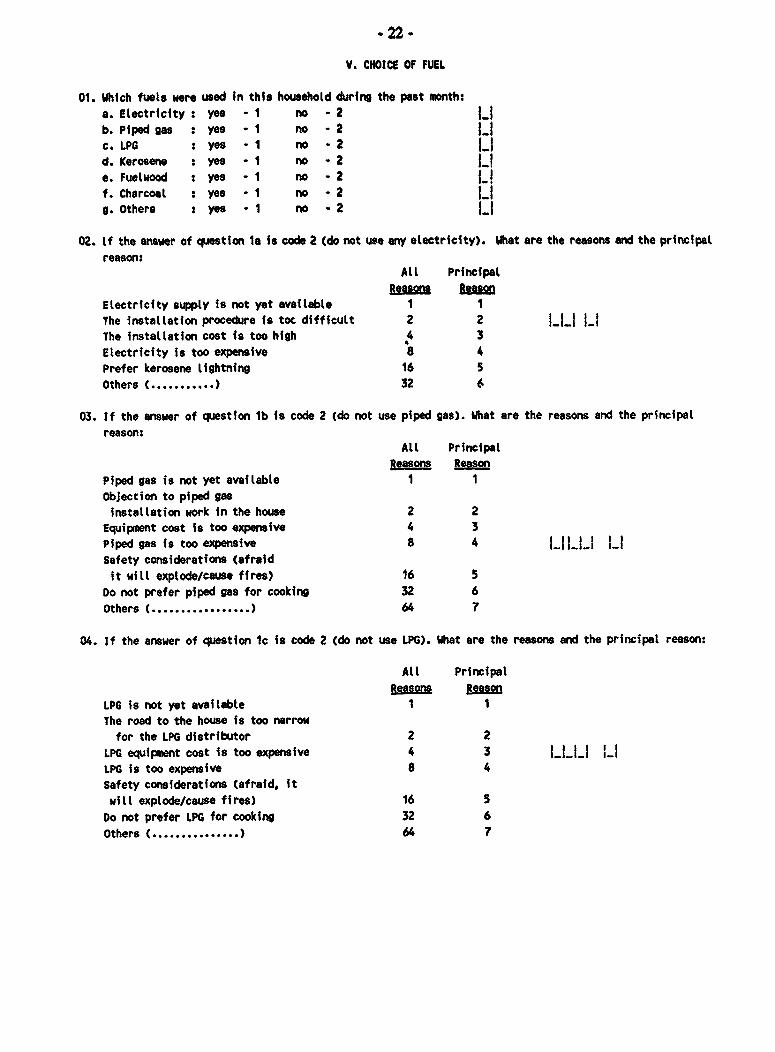
V. CHOICE OF FUEL
01. Which fuets were used in this household during the post month:
a. Electricity : yes - 1 no -2 2b. Piped gas : yes - 1 no -2 2c. LPG : yes -1 no -2 2d. Kerosene : yes -1 no -2 2e. Fuelwood : yes -1 no - 2
f. Charcoal : yes -1 no -2 2g. Others : yes -1 no -2 2
02. If the answer of question la is code 2 (do not use any electricity). What are the reasons and the principalreason:
All Principal
Reasons RsmasnElectricity supply is not yet available 1 1The installation procedure is toc difficult 2 2 |__ |_The installation cost is too high 4 3
Electricity is too expensive 8 4Prefer kerosene lightning 16 5Others (. .... ) 32 6
03. If the answer of question lb is code 2 (do not use piped gas). What are the reasons and the principalreason:
All PrincipalReasons Reason
Piped gas is not yet available 1 1Objection to piped gas
installation work in the house 2 2Equipment cost is too expensive 4 3Piped gas is too expensive 8 4 L1LU |_Safety considerations (afraidit will explode/cause fires) 16 5
Do not prefer piped gas for cooking 32 6Others ( ..... ) 64 7
04. If the answer of question 1c is code 2 (do not use LPG). What are the reasons and the principal reason:
All PrincipalReasons Reason
LPG is not yet available 1 1The road to the house is too narrow
for the LPG distributor 2 2LPG equipment cost is too expensive 4 3 L 'l|LPG is too expensive 8 4Safety considerations (afraid, itwill explode/cause fires) 16 5
Do not prefer LPG for cooking 32 6Others ( .... ) 64 7
* 23-
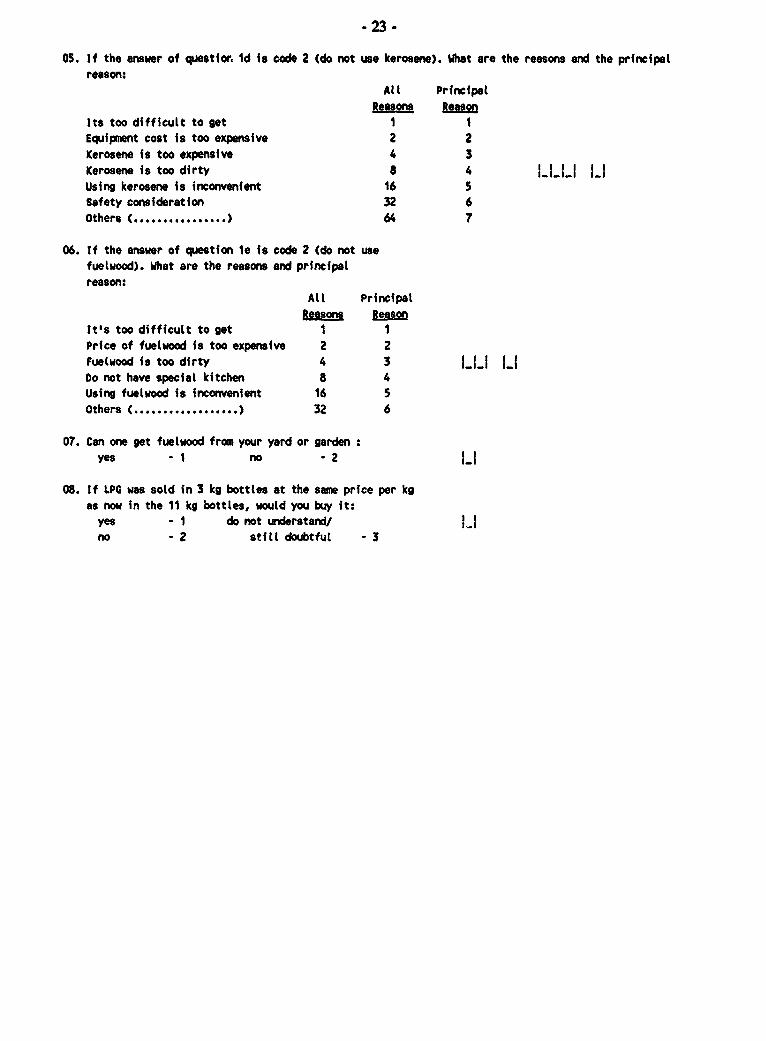
05. If the answer of question Id is code 2 (do not use kerosene). What are the reasons and the principalreason:
All PrincipalReasons ~Reas
Its too difficult to get I 1Equipment cost is too expensive 2 2Kerosene is too expensive 4 3Kerosene is too dirty 8 4 I_I_|_' lIUsing kerosene is ineonvenient 16 5Safety consideration 32 6Others t ........... .... ) 64 7
06. If the answer of question 1e is code 2 (do not usefuelwood). What are the reasons and principalreason:
All Principal8aasmna Reason
It's too difficult to get 1 1Price of fuelwood is too expensive 2 2fuetwood is too dirty 4 3 |_|_| |Do not have special kitchen 8 4using fuelwood is inconvenient 16 5Others t . ... ) 32 6
07. Can one get fuelwood from your yard or gardenyes l1 no -2 2_
08. If LPG was sold in 3 kg bottles at the sane price per kgas now in the 11 kg bottles, would you buy it:yes I do not understandV 5no - 2 stfIlt doubtful - 3
-24 -
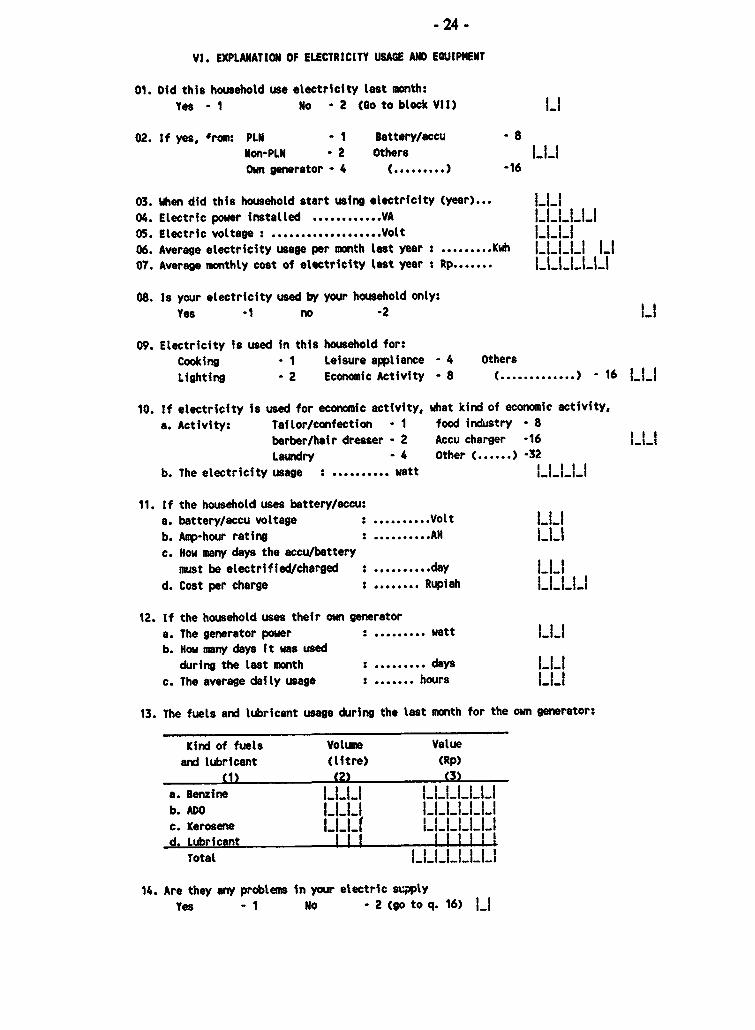
VI. EXPLANATION OF ELECTRICITY USAGE AND EQUJIPMENT
01. Did this household use electricity last month:
Yes -1 No - 2 (Go to block VII)
02. If yes, 'rom: PLN - I Battery/accu - 8
Non-PLN - 2 Others I_t_Own generator - 4 t .. ....) -16
03. When did this household start using electricity (year) ... L04. Electric power installed ............. VA .
05. Electric voltage : ................... Volt 06. Average electricity usage per month last year :......... Kwh LI.i.J.i l
07. Average monthly cost of electricity last year Rp .L.....
08. Is your electricity used by your household only:Yes -1 no -2 L
09. Electricity is used in this household for:Cooking - 1 Leisure appliance - 4 othersLighting - 2 Economic Activity - 8 t .) - 16 LI
10. If electricity is used for economic activity, what kind of economic activity,a. Activity: Tailor/confection - 1 food industry - 8
barber/hair dresser - 2 Accu charger -16 LULaundry - 4 Other (. ) -32
b. The electricity usage : .......... watt L
11. If the household uses battery/accu:a. battery/accu voltage :..Volt LU... tt
b. Amp-hour rating :..AH.... I _|_
c. How many days the accu/batterymust be electrified/charged : .. day 1... da
d. Cost per charge :. . Rupiah LLLLI
12. If the household uses their own generatora. The generator power :. watt ... w1ab. How many days it was used
during the last month :.. days ... dayc. The average daily usage :. . hours l_}
13. The fuels and lubricant usage during the last month for the own generator:
Kind of fuels Volume Valueand lubricant (litre) (Rp)
(1) (2) (3)a. Benzine ___ ______
b. ADO l____||
c. Kerosene r..f 1
d. Lubricant t IIj| i Total t
14. Are they any problems in your electric se;ptyYes - 1 No - 2 (go to q. 16) |
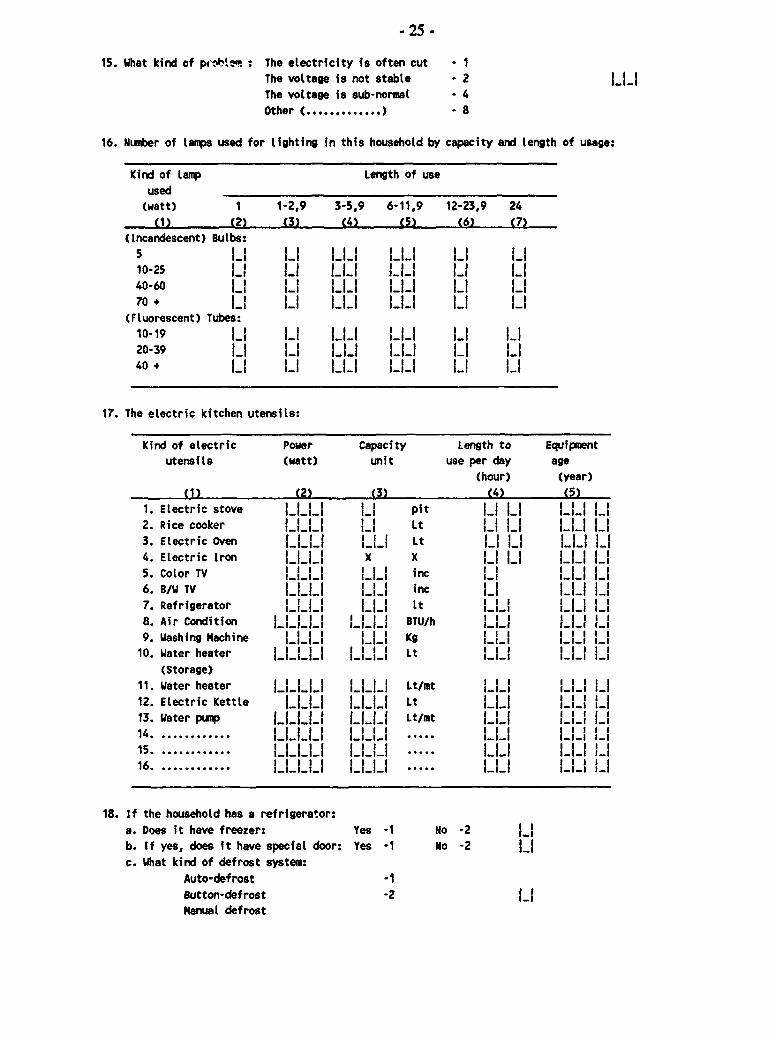
- 25 -
15. What kind of pbIMtem : The electricity is often cut IThe voltage is not stable - 2The voltage is sub-normal - 4
Other ( ... ) - 8
16. Number of lamps used for lighting in this household by capacity and length of usage:
Kind of lanp Length of use
used(watt) 1 1-2,9 3-5,9 6-11,9 12-23,9 24
(1) (2) (3) (4) (5) t6) (7)
(Incandescent) Bulbs:
5 1 1 _1 11 1. 1-1- 1_1. 1-110-25 U LI L._. LU U 40-60 LI H_} 1_ Ii I i_i
70 + _1 11 1_ 1| 1_ _
(Fluorescent) Tubes:10-19 1 _t || _1' l20-39 1 _§ l0_ _|l l_ l40 + 1_ _l l|_ _|} l_ _
17. The electric kitchen utensils:
Kind of electric Power Capacity Length to Equipmentutensils (watt) unit use per day age
(hour) (year)
(1) (2) (3) (4) (5)
1. Electric stove hit I | pit I_
2. Rice cooker L LI Lt3. Electric Oven 1 L Lt 1_1 1_
4. Electric Iron LLLI x X LI LI U_I LI5. Color TV III LLI inc 1L6. B/W TV L_._. L.. inc7. Refrigerator 111. _[ I t LL LLI LI8. Air Condition JJJj, J 8TUWh III J H9. Washing Machine I.. I Kg L.._. I.. , ._.
10. Water heater 11111 tIll Lt III III LI(Storage)
11. Water heater 111 1 Lt/mt _ II12. Electric Kettle 1111 1 Lt I_._. III LI13. Water pump | | | | Lt/mt IU l LI14 . ............I|l||l}'} __ _
Is5. -............ _, ll III 1111116.. ............ LL.. I I
18. If the household has a refrigerator:a. Does it have freezer: Yes -1 No -2b. If yes, does it have special door: Yes -1 No -2
c. What kind of defrost system:
Auto-defrost -1
Button-defrost -2 IIHanual defrost
- 26 .
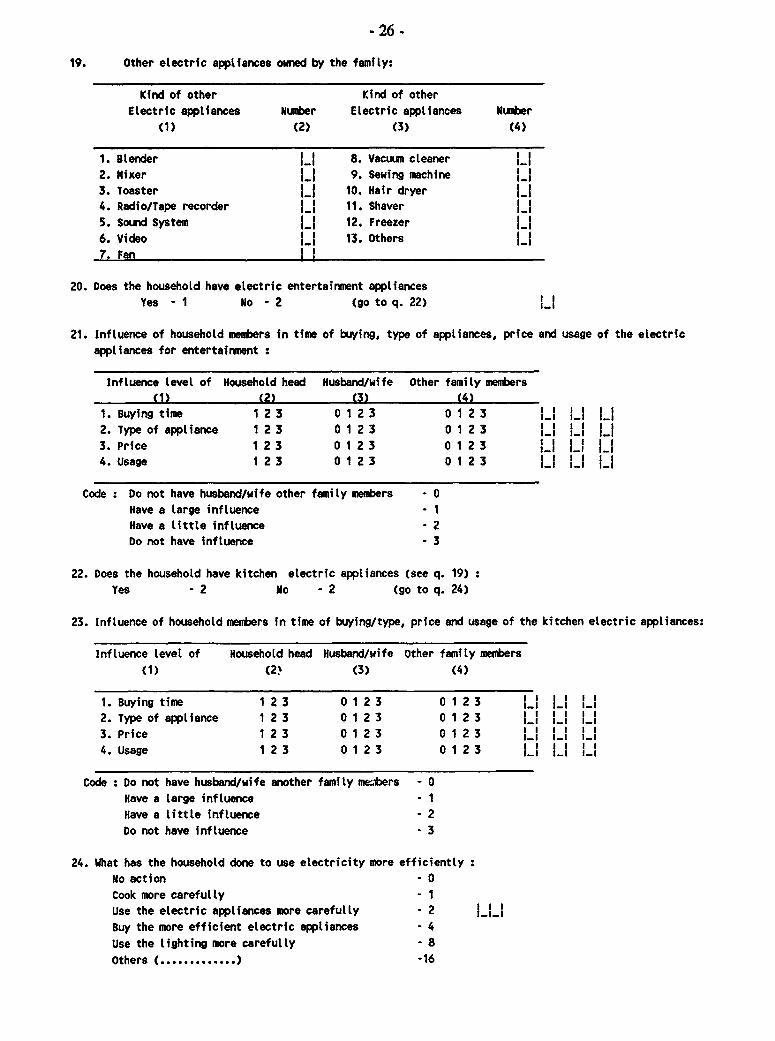
19. Other electric appliances owned by the family:
Kind of other Kind of otherElectric appliances Number Electric appliances Number
(1) (2) (3) (4)
1. Blender L a 8. Vacuun cleaner2. Mixer [ 9. Sewing machine II3. Toaster jj 10. Hair dryer4. Radio/Tape recorder J 11. Shaver 1.15. Sound System LI 12. Freezer LI6. Video H 13. Others
7. Fan II
20. Does the household have electric entertainment appliancesYes - 1 No - 2 (go to q. 22)
21. Influence of household members in time of buying, type of appliances, price and usage of the electricappliances for entertainment :
Influence level of Household head HusbandVwife Other family members(1) (2) (3) (4)
1. Buying time 1 2 3 0 1 2 3 0 1 2 3 H L 2. Type of appliance 1 2 3 0 1 2 3 0 1 2 3 7 L I_3. Price 1 2 3 0 1 2 3 0 1 2 3 LI4. Usage 1 2 3 0 1 2 3 0 1 2 3 L I
Code : Do not have husband/wife other family menbers - 0Have a large influence - 1
Have a little influence - 2
Do not have influence - 3
22. Does the household have kitchen electric appliances (see q. 19)Yes - 2 No -2 (go to q. 24)
23. Influence of household members in time of buying/type, price and usage of the kitchen electric appliances:
Influence level of Household head Husband/wife other family members(1) (2' (3) (4)
1. Buying time 1 2 3 0 1 2 3 0 1 2 3 U U LI2. Type of appliance 1 2 3 0 1 2 3 0 1 2 3 LI L3. Price 1 2 3 0 1 2 3 0 1 2 3 |
4. Usage 1 2 3 0 1 2 3 0 1 2 3 U LI Ul
Code : Do not have husband/wife another family mebers - 0Have a large influence - 1Have a little influence - 2Do not have influence - 3
24. What has the household done to use electricity more efficientlyNo action - 0Cook more carefully - 1Use the electric appliances more carefully - 2Buy the more efficient electric appliances - 4Use the lighting more carefully - 8Others (. .... ) -16
- 27 -
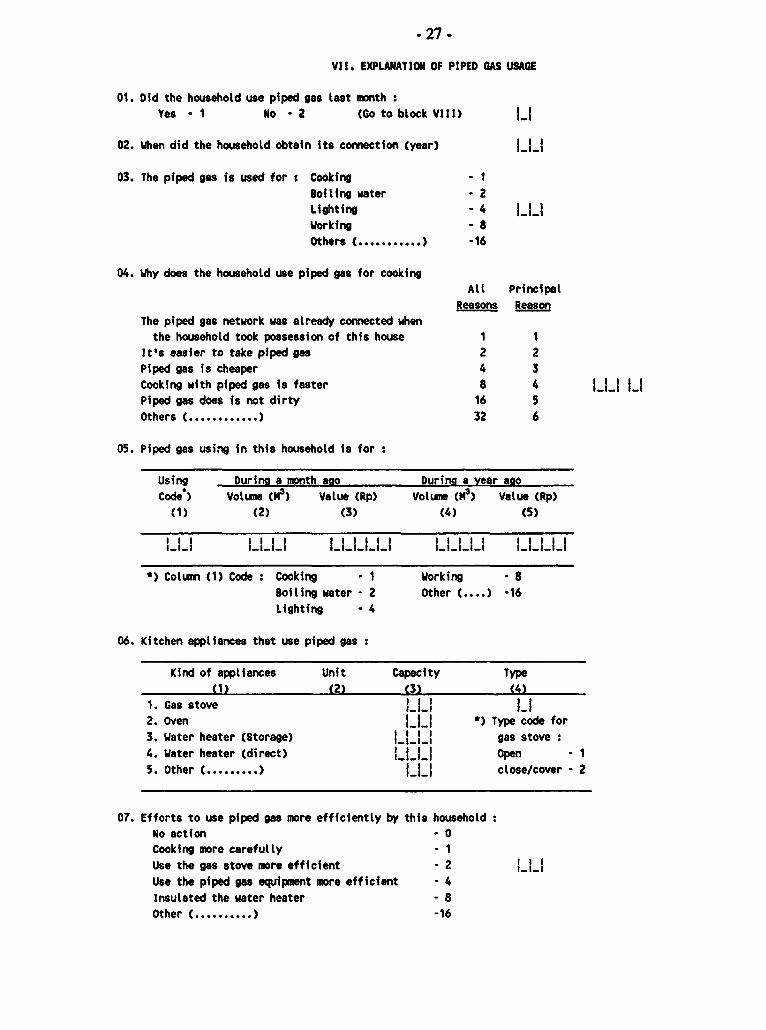
VII. EXPLANATION OF PIPED GAS USAGE
01. Did the household use piped gas last month :
Yes - I No - 2 (Go to block VIII) LI
02. When did the household obtain its connection (year) IH
03. The piped gas is used for : Cooking - IBoiling water 2
Lighting - 4 I_I_Working -8
Others ( . .... ) -16
04. Why does the household use piped gas for cookingAll Principal
Reasons ReasonThe piped gas network was already connected when
the household took possession of this house 1 1It's easier to take piped gas 2 2Piped gas is cheaper 4 3
Cooking with piped gas is faster 8 4 tPiped gas does is not dirty 16 5
Others ( .... ) 32 6
05. Piped gas using in this household is for
Using During a month aao Durina a vear ago
Code ) Volume (N3) Value (Rp) Voltume (l 3) Value (Rp)(1) (2) (3) (4) (5)
') Column (1) Code : Cooking - 1 Working 8
Boiling water - 2 Other ....) -16
Lighting - 4
06. Kitchen appliances that use piped gas :
Kind of appliances Unit Capacity Type(1) (2) (3) (4)
1. Gas stove 11_1.2. Oven I_I_I *) Type code for3. Water heater (Storage) gas stove
4. Water heater (direct) HII Open 15. Other ( ...... ) I close/cover - 2
07. Efforts to use piped gas more efficiently by this householdNo action -0 Cooking more carefully - 1
Use the gas stove more efficient - 2Use the piped gas equipment more efficient * 4
Insulated the water heater - 8
Other ( ... ) -16
-28-
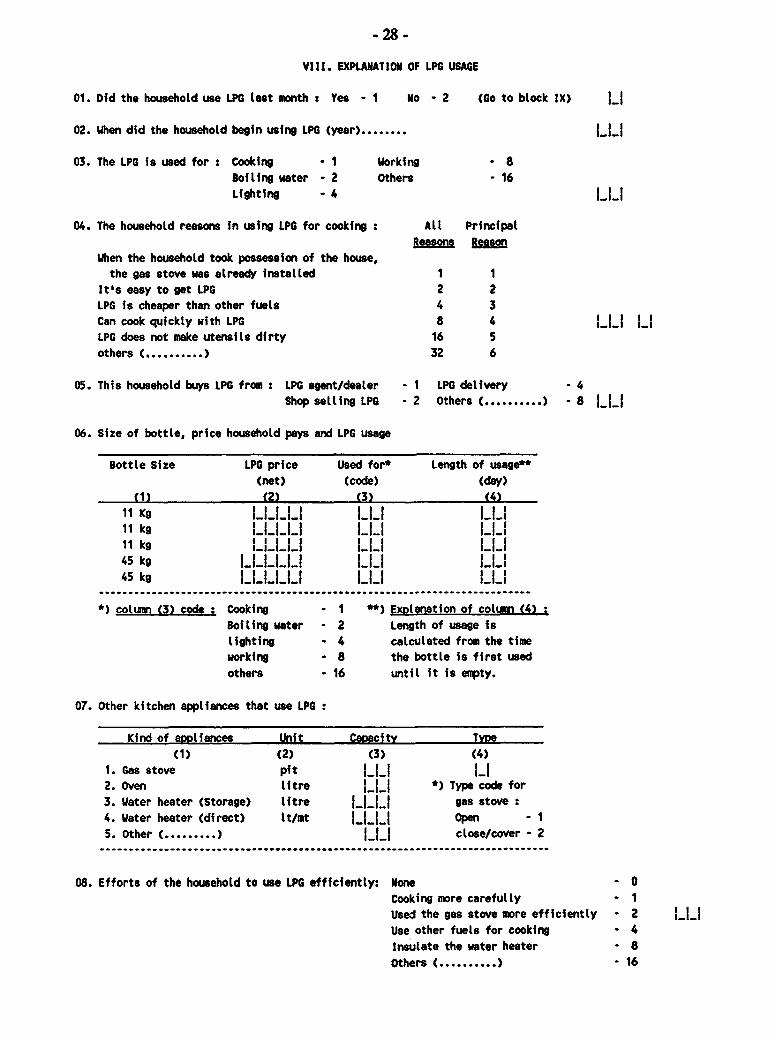
VIII. EXPLANATION OF LPG USAGE
01. Did the household use LPG tast month : Yes - I No - 2 (Go to block IX) LI
02. When did the household begin using LPG (year) .....
03. The LPG is used for : Cooking I Working - 8
Boiling water - 2 Others 16
Lighting - 4 L.LI
04. The household reasons in using LPG for cooking : All PrincipalReasons Reason
When the household took possession of the house,the gas stove was already installed 1 1
It's easy to get LPG 2 2
LPG is cheaper than other fuels 4 3Can cook quickly with LPG 8 4 L.L LILPG does not make utensils dirty 16 5others (. .... ) 32 6
05. This household buys LPG from : LPG agent/dealer - I LPG delivery - 4Shop seLling LPG - 2 Others ( . ) - 8 L.. .
06. Size of bottle, price household pays and LPG usage
Bottle Size LPG price Used for* Length of usage**
(net) (code) (day)
(1) (2) (3) (4)
11 Kg t_|B l wat 2 Lnt o11 kg ____ __ __
11 kg ____ _ _
45 kg _____ _ __
45 kg _____ _ _ ................................... . ... ..................... ............................ ...
*)cotumn (3) code : Cooking - I * Exotanatfon of cotumn (4):
Boiling water - 2 Length of usage islighting - 4 calculated from the timeworking - 8 the bottle is first used
others - 16 until it is empty.
07. Other kitchen appliances that use LPG:
Kind of atoliances Unit Capacitv Tvze(1) (2) (3) (4)
1. Gas stove pit I_i-i LI2. Oven litre *) Type code for3. Water heater (Storage) litre 1111 gas stove :
4. Water heater (direct) It/mt liii Open - 1
5. other ( ....... ) I close/cover - 2
08. Efforts of the household to use LPG efficiently: None - OCooking more carefully - 1Used the gas stove more efficiently - 2
Use other fuels for cooking . 4
Insulate the water heater 8Others ( .... ) - 16
- 29 -
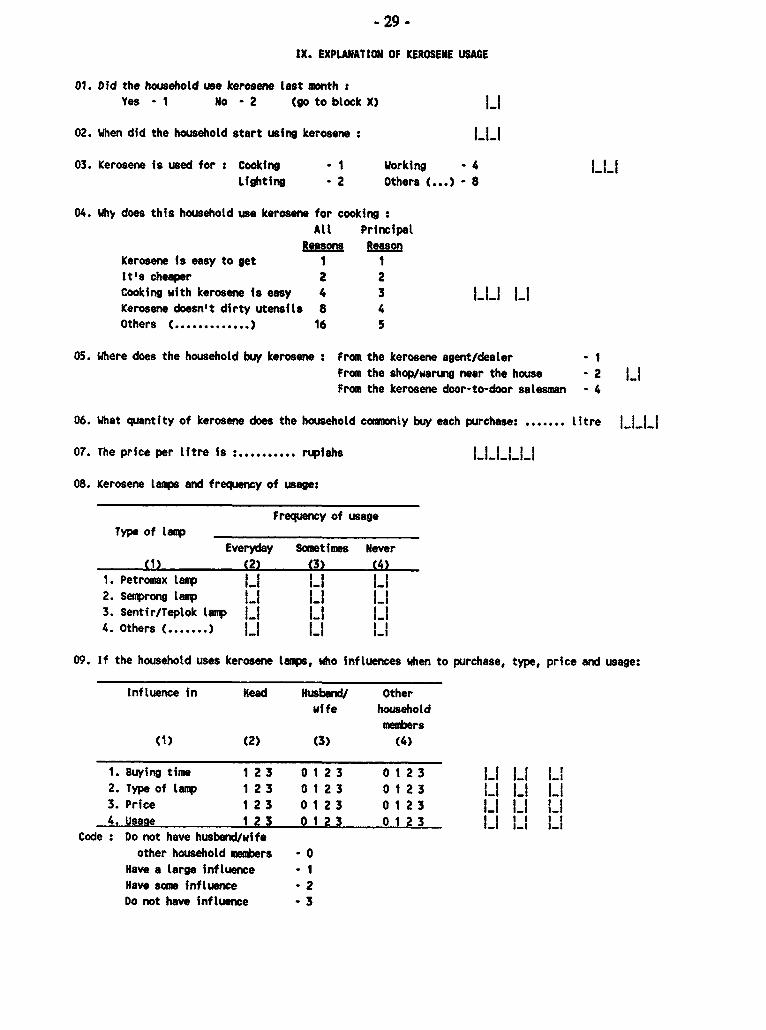
IX. EXPLANATION OF KEROSENE USAGE
01. Did the household use kerosene last month :Yes - 1 No - 2 (so to block X) lI
02. When did the household start using kerosene : l_|_|
03. Kerosene is used for : Cooking 1 Working - 4 LLLighting - 2 Others C...) - 8
04. Wh, does this household use kerosene for cooking :At. Principal
Reasons Reason
Kerosene is easy to get 1 1It's cheaper 2 2Cooking with kerosene is easy 4 3 jjj l_|Kerosene doesn't dirty utensils 8 4Others ( ..... ) 16 5
05. Where does the household buy kerosene : From the kerosene agent/dealer - 1From the shop/warung near the house - 2 l_From the kerosene door-to-door salesman - 4
06. What quantity of kerosene does the household commonly buy each purchase: ....... itre
07. The price per litre is : .......... rupiahs ...I..J
08. Kerosene lamps and frequency of usage:
Frequency of usageType of lamp __ ______
Everyday Sometimes Never(1) (2) (3) (4)
1. Petromax lamp U I L|2. Semprong lamp LI L|3. Sentir/Teplok lamp lI I lI4. Others ( ....... ) LI
09. If the household uses kerosene lamps, who influences when to purchase, type, price and usage:
Influence in Head Husband/ Otherwife household
members(1) (2) (3) (4)
1. Buying time 1 2 3 0 1 23 0 1 2 3 L L L2. Type of lamp 1 2 3 0 1 23 01 2 3 LIt l _3. Price 1 2 3 0 1 23 01 2 3 I L LI4. Usace 1 2 3 0 1 23 01 2 3 LI |
Code : Do not have husband/wifeother household members - 0
Have a large influence - INave some influence - 2Do not have influence - 3
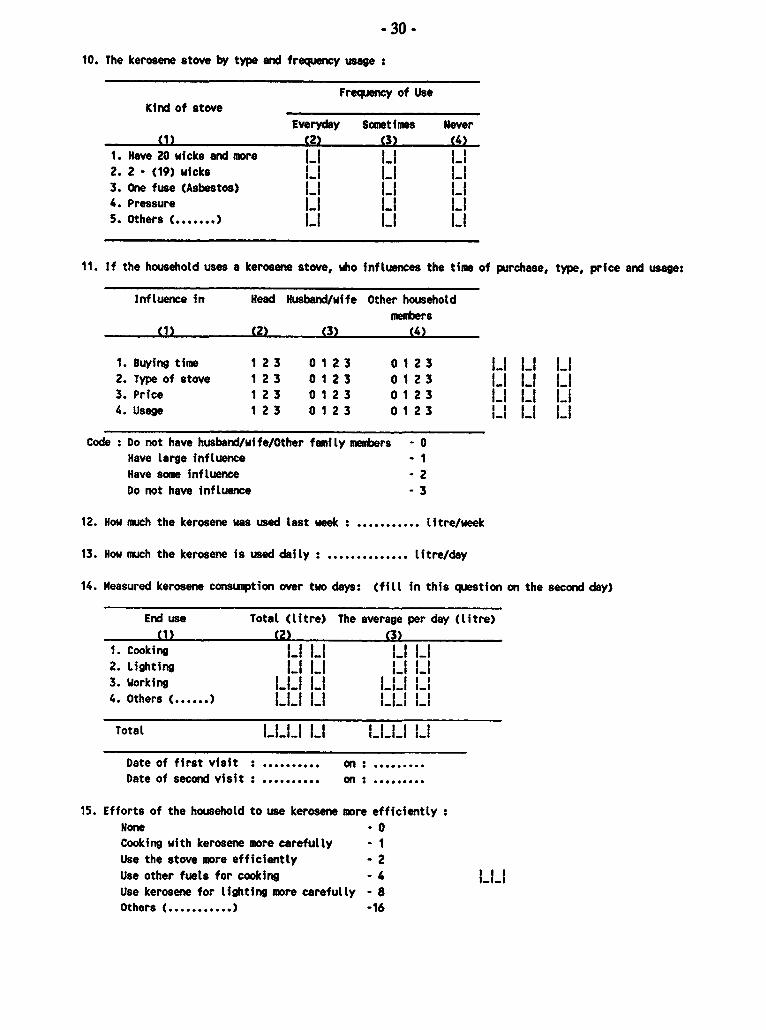
- 30 -10. The kerosene stove by type and frequency usage :
Frequency of UseKind of stove
Everyday Sacetimes Never(1) (2) (3) (4)
1. Have 20 wicks and more |_ |_ |_|2. 2 - (19) wicks |_ |_ L3. One fuse (Asbestos) |_4. Pressure |_ |_| 5 1S. Others ( ......-.)|_ |||_
11. If the household uses a kerosene stove, who influences the time of purchase, type, price and usage:
Influence in Head Husband/wife Other householdmembers
(1) (2) (3) (4)
1. Buying time 1 23 0 1 23 0 1 2 3 | | 2. Type of stove 1 23 0 1 23 0 1 2 3 |_| LI |_|3. Price 1 23 0 1 23 0 1 2 3 LI L 4. Usage 1 23 0 1 23 0 1 2 3 |_ L
Code : Do not have husband/wife/Other family mtmbers - 0Have large influence - 1Have some influence - 2Do not have influence - 3
12. How much the kerosene was used last week : ...... i..... ttre/week
13. How much the kerosene is used daily : ....... ....... litre/day
14. Measured kerosene consumption over two days: (fill in this question on the second day)
End use Total (litre) The average per day (litre)(1) (2) (3)
1. Cooking|_|_||||2. Lighting LI |_ |_| |_|3. Working |__ Li LI5 1 LI4. Others ( .. ) LL. LI LI.
Total LLL L L 1 1
Date of first visit : ........ n .........Date of second visit : ....... on :.........
15. Efforts of the household to use kerosene more efficientlyNone - OCooking with kerosene more carefully - IUse the stove more efficiently - 2Use other fuels for cooking - 4 |_|_|Use kerosene for lighting more carefully - 8Others ( ..... ) -16
- 31 -
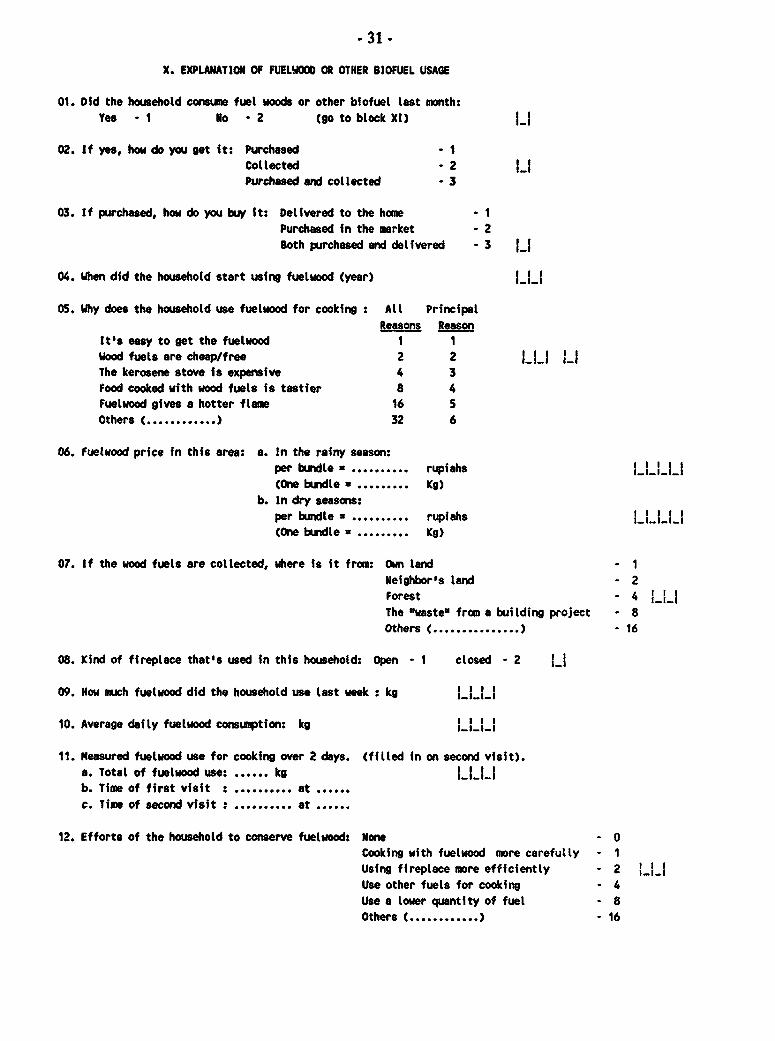
X. EXPLANATION OF FUELWOOD OR OTHER BIOFUEL USAGE
01. Did the household conesue fuel woods or other blofuel last month:Yes - 1 No - 2 (go to blockXl) LX
02. If yes, how do you get it: Purchased - 1Collected - 2Purchased and collected - 3
03. If purchased, how do you buy it: Delivered to the home 1Purchased in the market - 2Both purchased and delivered -3 L
04. When did the household start using fuelwood (year) L.Il
05. Why does the household use fuetwood for cooking : All PrincipalReasons Reason
It's easy to get the fuelwood 1 1Wood fuels are cheap/free 2 2 LLI LI-8 The kerosene stove is expensive 4 3Food cooked with wood fuels is tastier 8 4Fueluood gives a hotter flame 16 5Others ( ..... ) 32 6
06. fuetwood price in this area: a. In the ralny season:per bundle- .rupiahs(One bundle . Kg)
b. In dry seasons:per bundle .rupiahs LLLLI(one bundle .Kg)
07. If the wood fuels are collected, where is it from: Own land - 1Neighbor's land - 2Forest - 4 I_I_IThe "waste" from a building project - 8Others (.....) - 16
08. Kind of fireplace that's used in this household: Open - 1 closed - 2 t_
09. Now miuch fuelwood did the household use last week : kg t l
10. Average daily fuelwood consuption: kg
11. Measured fuelwood use for cooking over 2 days. (filled in on second visit).a. Total of fuelwood use: ...... kg lb. Time of first visit : .at c. Time of second visit .at .
12. Efforts of the household to conserve fuelwood: None - 0Cooking with fuelwood more carefully - 1Using fireplace more efficiently - 2Use other fuels for cooking - 4Use a lower quantity of fuel - 8Others ( .... ) - 16
- 32 -
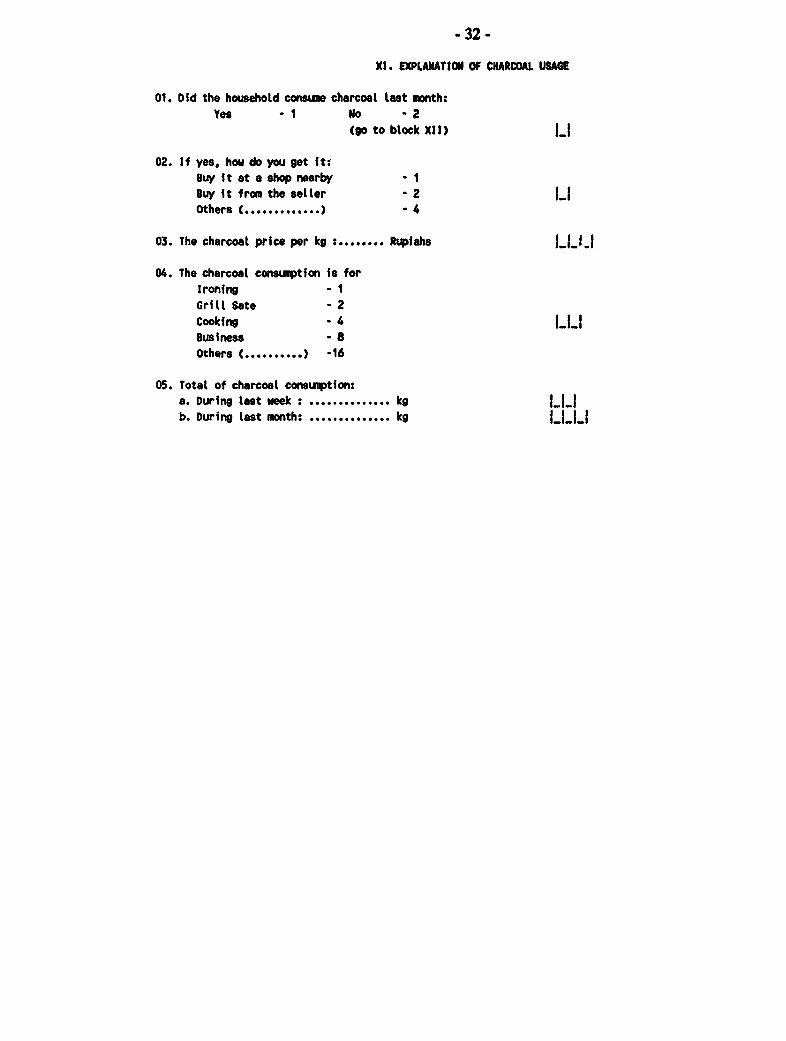
XI. EXPLANATION OF CHARCOAL USAGE
01. Did the household consume charcoal Last month:Yes -1 No -2
(go to block XII) jj
02. If yes, how do you get it:Buy it at a shop nearby - 1Buy it from the seller 2 2Others (.. .... ) 4
03. The charcoal price per kg :........ Rupfiahs L IJ
04. The charcoal consuwption is forIroning - 1Grill Sate - 2Cooking - 4 L1Business - 8
Others (.......... ) -16
05. Total of charcoal consumption:a. During last eek : .............. kg ILlb. During last month: .............. kg J
- 33 -
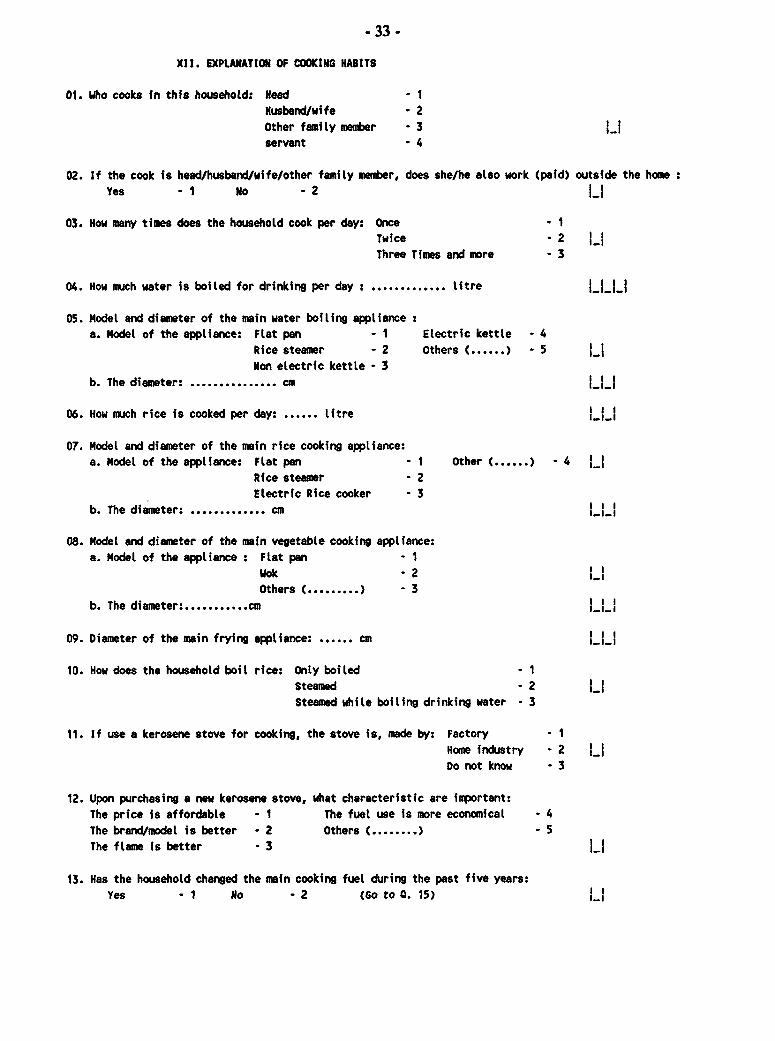
XII. EXPLANATION OF COOKING HABITS
01. Who cooks in this household: Head - IHusband/wife 2Other family memter - 3servant - 4
02. If the cook is head/husband/wife/other family memter, does she/he also work (paid) outside the homeYes -1 No - 2
03. How many times does the household cook per day: Once - ITwice -2 L2Three Times and more - 3
04. How much water is boiled for drinking per day : ............. litre liLt
05. Model and diameter of the main water boiling appliance :a. Model of the appliance: Flat pan - 1 Electric kettle - 4
Rice steamer - 2 Others ( ......) - 5
Non electric kettle - 3b. The diameter: ........ ....... cm LLI
06. How much rice is cooked per day: . litre L..i
07. Model and diameter of the main rice cooking appliance:a. Model of the appliance: Flat pan - I Other C....) - 4
Rice steamer - 2Electric Rice cooker - 3
b. The diameter: .......... cm LL
08. Model and diameter of the main vegetable cooking appliance:a. Model of the appliance : Flat pan - 1
Wok -2 L2Others t ..... ) - 3
b. The diameter: .......... cm
09. Diameter of the main frying appliance: ...... cm
10. How does the household boil rice: Only boiled - 1Steamed -2 L2Steamed while boiling drinking water - 3
11. If use a kerosene stove for cooking, the stove is, made by: Factory - IHome industry -2 2Do not know - 3
12. Upon purchasing a new kerosene stove, what characteristic are inmortant:The price is affordable - 1 The fuel use is more economical 4 4The brand/model is better - 2 Others ........) - 5
The flame is better - 3 LI
13. Has the household changed the main cooking fuel during the past five years:Yes -1 No -2 (Go to O. 15) Li
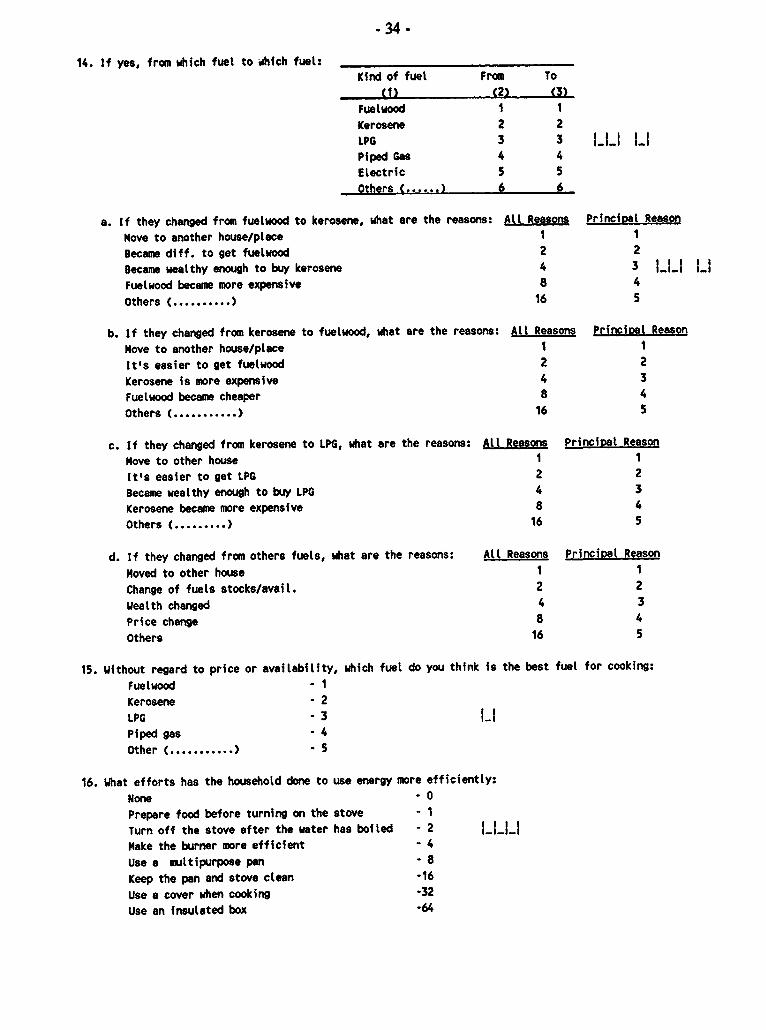
34 -
14. If yes, fron which fuel to which fuel: _
Kind of fuel From To
(1) (2) (3)
Fuetwood I 1
Kerosene 2 2
LPG 3 3 I l IPiped Gas 4 4
Electric 5 5
Others ( ...... 6 6
a. If they changed from fuetwood to kerosene, what are the reasons: Att Reasons Principal Reason
Move to another house/place I I
Became diff. to get fuelwood 2 2
Became wealthy enough to buy kerosene 4 3 LII LiFuelwood became more expensive 8 4
Others t. .... ) 16 5
b. If they changed from kerosene to fuelwood, what are the reasons: All Reasons Princihal Reason
Move to another house/place I I
It's easier to get fuelwood 2 2
Kerosene is more expensive 4 3
Fuetwood became cheaper 8 4
Others (. .... ) 16 S
c. If they changed from kerosene to LPG, what are the reasons: All Reasons Princioal Reason
Move to other house I I
It's easier to get LPG 2 2
Became wealthy enough to buy LPG 4 3
Kerosene became more expensive 8 4
Others (. .... ) 16 5
d. If they changed from others fuels, what are the reasons: All Reasons Princial Reason
Moved to other house 1 1
Change of fuels stocks/avail. 2 2
Wealth changed 4 3
Price change 8 4
Others 16 5
15. without regard to price or availability, which fuel do you think is the best fuel for cooking:
Fuelwood 1
Kerosene 2
LPG -3 LIPiped gas - 4
Other ( .... ) -5
16. What efforts has the household done to use energy more efficiently:
None .0
Prepare food before turning on the stove - I
Turn off the stove after the water has boiled - 2 I...LIMake the burner more efficient - 4
Use a multipurpose pan -8
Keep the pan and stove clean -16
Use a cover when cooking -32
Use an insulated box -64
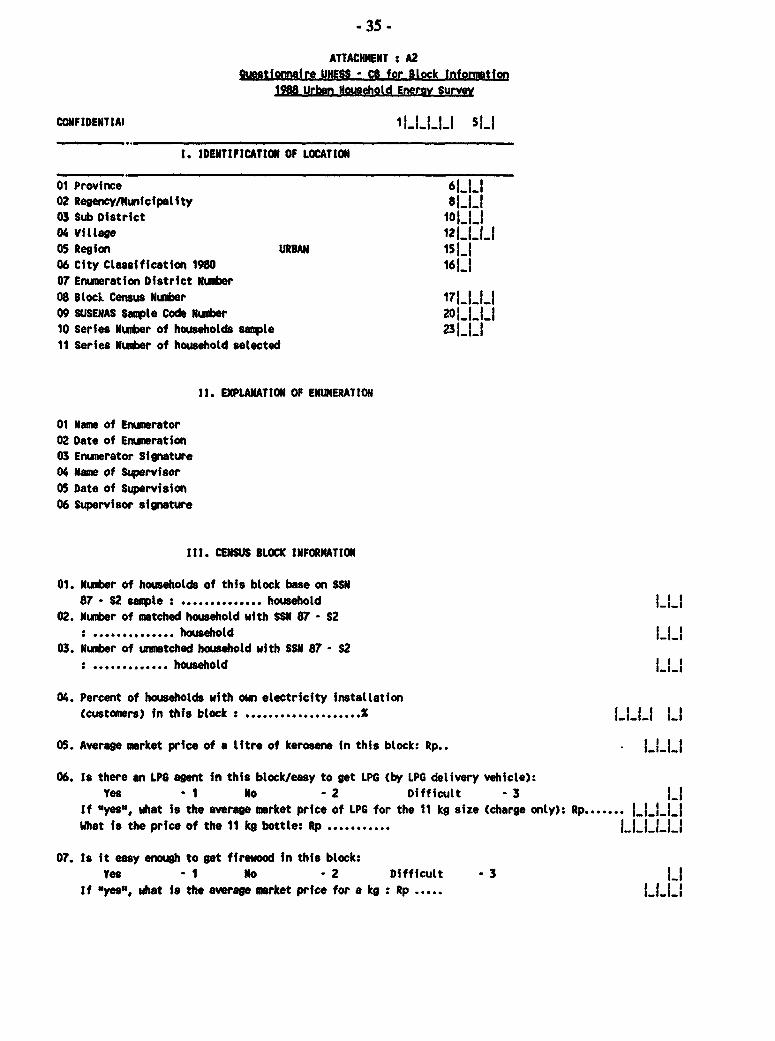
- 35 -ATTACHMENT : A2
Ouestionnaire UHESS - CO for Block Information1988 Urban Household Energy Survey
CONFIDENTIAI 1_|_ 5jj
1. IDENTIFICATION OF LOCATION
01 Province 6_1_1
02 Regency/Nunicipelity 81.ji_03 Sub District 101t1104 Village 12i_1__1
05 Region URBAN 15|_|
06 City Classification 1980 161_107 Enumeration District Number
08 Block Census Number 171 1 1 109 SUSENAS Sample Code Nuder 20_1_1_110 Series Nuwber of households sample 231_|_1
11 Series Numer of household selected
It. EXPLANATION OF ENUMERATION
01 Name of Enmerator02 Date of Enmueration03 Enumerator Signature
04 Name of Supervisor05 Date of Supervision
06 Supervisor signature
111. CENSUS BLOCK INFORNATION
01. Number of households of this block base on SSN87 - S2 sample : ........... household l_|
02. Number of mtched household with SSN 87 - S2v.......ol....hs.. ehol_d|
03. Number of unmatched household with SSM 87 - S2
: household hold
04. Percent of households with own electricity installation
(customers) in this block : . ......... % L l
05. Average market price of a litre of kerosene in this block: Rp.. |___
06. Is there an LPG agent in this block/easy to get LPG (by LPG delivery vehicle):Yes - 1 No - 2 Difficult -3 |_|
If "yes", what is the average market price of LPG for the 11 kg size (charge only): Rp..|
What is the price of the 11 kg bottle: Rp ...........
07. Is it easy enough to get firewood in this block:Yes -1 No - 2 Difficult -3 lI
If "yes", what i8 the average market prfce for a kg : Rp .....

- 36 -
Annex 3: UHESS Summafy Tables
Java Urban Households
1988
- 37 .
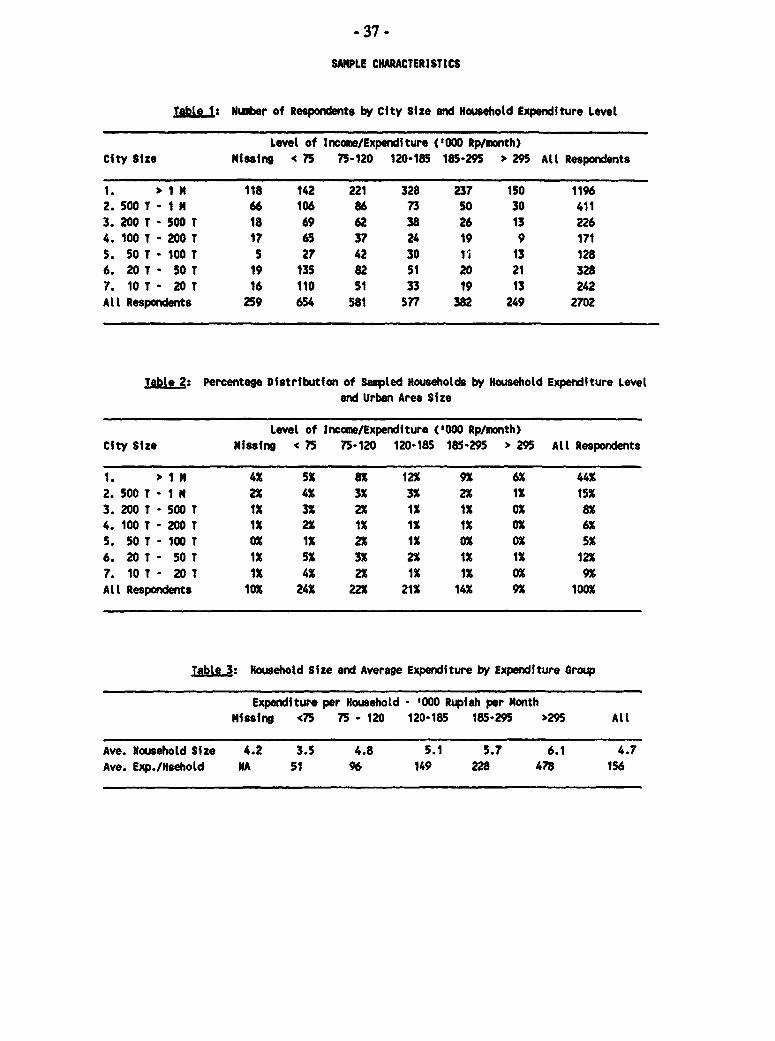
SAMPLE CHARACTERISTICS
Table 1: Nutber of Respondents by City Size and Household Expnditure Level
Level of Income/Expenditure C000 Rp/month)city Size Missins 4 75 75-120 120-185 185-295 m 295 All Respondents
1. 1 " 118 142 221 328 237 150 11962. 500 T -I 66 106 86 73 50 30 4113. 200 T 500 T 18 69 62 38 26 13 2264. 100 T 200 T 17 65 37 24 19 9 171
5. 50 T 100 T 5 27 42 30 1S 13 128
6. 20 T 50 T 19 135 82 51 20 21 328
7. 10 T 20 T 16 110 51 33 19 13 242
All Respondents 259 654 581 577 382 249 2702
Table 2: Percentage Distribution of Sampled Households by Household Expenditure Leveland Urban Area Size
Level of Income/Expenditure ('000 Rp/month)City Size Missing < 75 75-120 120-185 185-295 > 295 All Respondents
1. >1M 4% 5% 8% 12% 9% 6% 44%
2. 500 T -I N 2% 4% 3% 3% 2% 1% 15%
3. 200 T -500 T 1% 3% 2% 1% 1% 0% 8%4. 100 T -200 T 1% 2% 1% 1% 1% 0% 6%
5. 50 T -100 T 0% 1% 2% 1% OX 0% 5%
6. 20 T - 50 T 1% 5% 3% 2% 1% 1% 12%
7. 10 T - 20 T 1% 4% 2% 1% 1% 0% 9%
All Respondents 10% 24% 22% 21% 14% 9% 100%
Table 3: Household Size and Average Expenditure by Expenditure Group
Expenditure per Household - '000 Rupiah per Month
Nissing <75 75 - 120 120-185 185-295 >295 All
Ave. Household Size 4.2 3.5 4.8 5.1 5.7 6.1 4.7
Ave. Exp./Hsehold NA 51 96 149 228 478 156
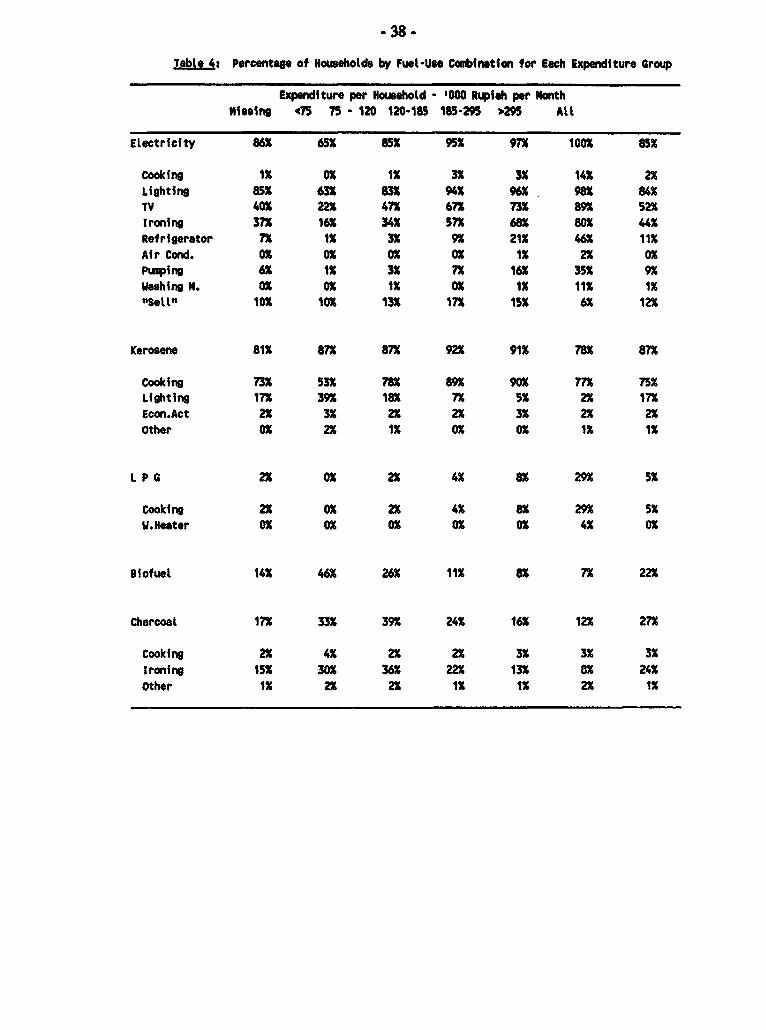
- 38 -
Tabts 4: Percentage of Households by Fuel-Use Cobirnation for Each Expenditure Group
Expenditure per Household - 000 Rupiah per NonthMissing 475 75 - 120 120-185 185-29S 295 All
Electricity 86X 65X 85X 9SX 9TX 100X 85X
Cooking 1X 0X 1X 3X 3X 14X 2XLighting 85X 63X 83X 94X 96X 98X 84UTV 40X 22X 47X 67X 73n 894 52XIroning 37X 16X 34K 57X 68X 80K 44KRefrigerator 7X 1X 3X 9X 21K 46K 11XAir Cond. 0X 0X 0X 0X 1K 2X 0XPumping 6a 1K 3K 7X 16X 35K 9Xwashin N. 0X 0X 1K OK 1K 11K 1X"Sell" 10X 10X 13X 17X 15X 6a 12X
Kerosene 81K 87X 87X 92X 91K 78K 87X
Cooking 73X 53K 78X 894 90K nx 75XLighting 17X 39X 18X 7X 5 2X 17XEcon.Act 2X 3K 2X 2X 3K 2X 2XOther 0X 2X 1K 0X 0X 1S 1K
L P G 2X 0X 2X 4X 8X 29X 5X
Cooking 2X 0X 2X 4K 8X 294 5KW.Heater 0X 0X 0X 0X 0X 4K oX
siofuel 14K 46X 26K 11X 8X 7X 22X
Charcoat 17X 33X 39X 24K 16K 12X 27X
Cooking 2X 4X 2X 2X 3K 3K 3KIroning 15X 30X 36K 22X 13K 8X 24KOther 1K 2X 2X 1K 1K 2X 1K
- 39 -
Iable 5: Average Household Fuel Contuiptfon by Fuel-Use Combinationfor Users In Expenditure Group
(original units)
Expenditure Group ('000 Rupiah per Nonth per Household)Nissing <75 75 - 120 120-185 185-295 >295 All
Electricity 47.4 25.7 38.7 58.4 88.5 172.6 64.2(kWhlno)
Cooking 8.8 4.5 7.1 6.8 12.5 20.3 14.7Lighting 25.4 21.3 26.8 32.7 38.8 60.2 32.6TV 8.4 6.1 7.3 9.0 10.3 12.7 9.2Ironing 6.9 6.2 7.0 7.9 9.6 11.0 8.4Refrigerator 54.4 36.9 47.3 47.6 44.5 52.5 48.9Air Cond. 0.0 0.0 0.0 0.0 97.9 272.3 222.5Pumping 16.7 17.4 23.2 26.8 30.0 42.2 32.3Washing M. 0.0 0.0 8.0 4.5 7.7 23.8 20.0"Sales" 22.1 17.6 22.3 28.0 34.1 38.5 26.1
Kerosene 1.1 0.9 1.1 1.3 1.4 1.6 1.2(tt/day)
Cooking 1.0 0.9 1.0 1.2 1.3 1.4 1.1Lighting 0.5 0.4 0.6 0.5 0.6 0.6 0.5Econ.Act 2.5 2.6 1.9 3.9 1.8 6.5 2.8Other 0.3 0.2 0.2 0.1 0.1 0.8 0.2
L P G 0.7 0.6 0.7 0.7 0.8 0.8 0.8(kg/day)
Cooking 0.7 0.6 0.7 0.7 0.8 0.8 0.8U.Heater 0.0 0.0 0.0 0.0 0.0 1.4 1.4
Biofuel 3.8 4.5 4.3 4.1 4.5 4.4 4.4(kg/day)
Charcoal 0.3 0.2 0.2 0.2 0.3 0.2 0.2(kg/day)
Cooking 0.7 0.6 0.6 0.8 0.5 0.6 0.6Ironing 0.1 0.1 0.1 0.1 0.2 0.1 0.1Other 1.2 0.7 1.2 0.6 0.5 0.9 0.8
-40 -
abte6: Average Household Fuel Consumption by Fuel-Use Coabinationfor Att Households in Expenditure Group
Expenditure per Month per Household ('000 Rp)Missing 75 75 - 120 120-185 185-295 >m95 All
Electricity 40.6 16.6 32.9 55.6 85.7 171.9 54.8(kWh/month)
Cooking 0.1 0.0 0.0 0.2 0.3 2.8 0.4Lighting 21.6 13.5 22.3 30.8 37.2 59.2 27.4TV 3.3 1.3 3.4 6.0 7.5 11.3 4.8Ironing 2.6 1.0 2.4 4.5 6.5 8.7 3.7Refrigerator 4.0 0.3 1.5 4.1 9.4 24.0 5.2Air Cond. 0.0 0.0 0.0 0.0 0.5 5.5 0.6Puiping 1.0 0.2 0.6 1.9 4.7 14.9 2.7Washing N. 0.0 0.0 0.0 0.0 0.1 2.6 0.3"Salesn 2.1 1.7 2.9 4.7 5.0 2.5 3.2Residual 5.8 -1.5 -0.4 3.3 14.5 40.4 6.5
Kerosene 0.8 1.1 1.0 1.2 1.3 1.2 1.0(tit/day)
Cooking 0.7 0.5 0.8 1.0 1.2 1.1 0.8Lighting 0.1 0.2 0.1 0.0 0.0 0.0 0.1Econ.Act 0.0 0.1 0.0 0.1 0.0 0.1 0.1Other 0.0 0.0 0.0 0.0 0.0 0.0 0.0
L P 0 0.0 0.0 0.0 0.0 0.1 0.2 0.0(kg/day)
Cooking 0.0 0.0 0.0 0.0 0.1 0.2 0.0W.Heater 0.0 0.0 0.0 0.0 0.0 0.0 0.0
Biofuel 0.5 2.1 1.1 0.5 0.4 0.3 1.0(kg/day)
Charcoal 0.0 0.1 0.1 0.1 0.0 0.0 0.1(kg/day)
Cooking 0.0 0.0 0.0 0.0 0.0 0.0 0.0Ironing 0.0 0.0 0.0 0.0 0.0 0.0 0.0Other 0.0 0.0 0.0 0.0 0.0 0.0 0.0
-41.
Table 7: Percentage of Households in Expenditure/lncome Category
Having Device Mentioned
Level of Income/Expenditure ('000 Rp./mo.)
Missing 75 75-120 120-185 185-295 > 295 Total
Kerosene
(Petromax) 8a 15X 8X 6X 4X 4X 8a(Wick) 19X 401 201 131 71 71 201
(Hurricane) 141 251 151 81 81 7% 14X
- StovesSingle Wick 5S 1X 31 61 81 18x 6X
2-19 wicks 641 461 63X 78X 75X 58s 641
20 + wicks 81 11X 171 141 161 161 14%
Pressure 0 01 1X 1X 1% 0 0
LPG-Cooking 2X 0 21 4X 8a 271 5
- W. Heating 0 01 0 0 01 21 0
- 42-
Tsble 8: Percent of Households Using Specified Fuel Source by Expenditure Group
LEVEL OF INCOME / EXPENDITURE ('000 Rp./mo)missing * 75 75-120 120-185 185-295 > 295 Total
ElectricityPercent Using - 86% 65% 85% 96% 97% 100% 85X
Source Breakdown:PLN 55% 50% 66% 82% 90% 94% 73%
PLU Indirect 43% 47% 32% 16% 9% 5% 26%
Non PLN 0% 2% 0% 1% 1% 1% 1%
Battery 1% 2% 2% 1% 1% 0% 1%100% 100% 100% 100% 100% 100% 100%
KerosenePercent Using - 81% 85% 86% 91% 90% 78% 86%
Source Breakdown:
Delivery 22% 7% 10% 23% 29% 29% 16%
Shop 71% 91% 85% 68% 65% 43% 65%
Agent 6% 2% 5% 10X 6% 6% 5%
100% 100% 100% 100% 100% 100% 100%
LPGPercent Using - 2% 1% 3% 5% 9% 28% 6%
Source Breakdown:Delivery 50% 0% 28% 36% 53% 46% 43%Shop/Agent 25% 100% 67% 50% 33% 43% 46%
Both 25% 0% 6% 14% 14% 10% 11%
100% 100% 100% 100% 100% 100% 100%
WoodPercent using - 14% 47% 26% 11% 8% 7% 23%
Source Breakdown:
Purchase 31% 22% 43% 42% 19% 44% 31%
Collect 44% 62% 39% 41% 68% 44% 35%
Both 25% 15% 18% 17% 13% 11% 16%
100% 100% 100% 100% 100% 100% 100%
- 43.
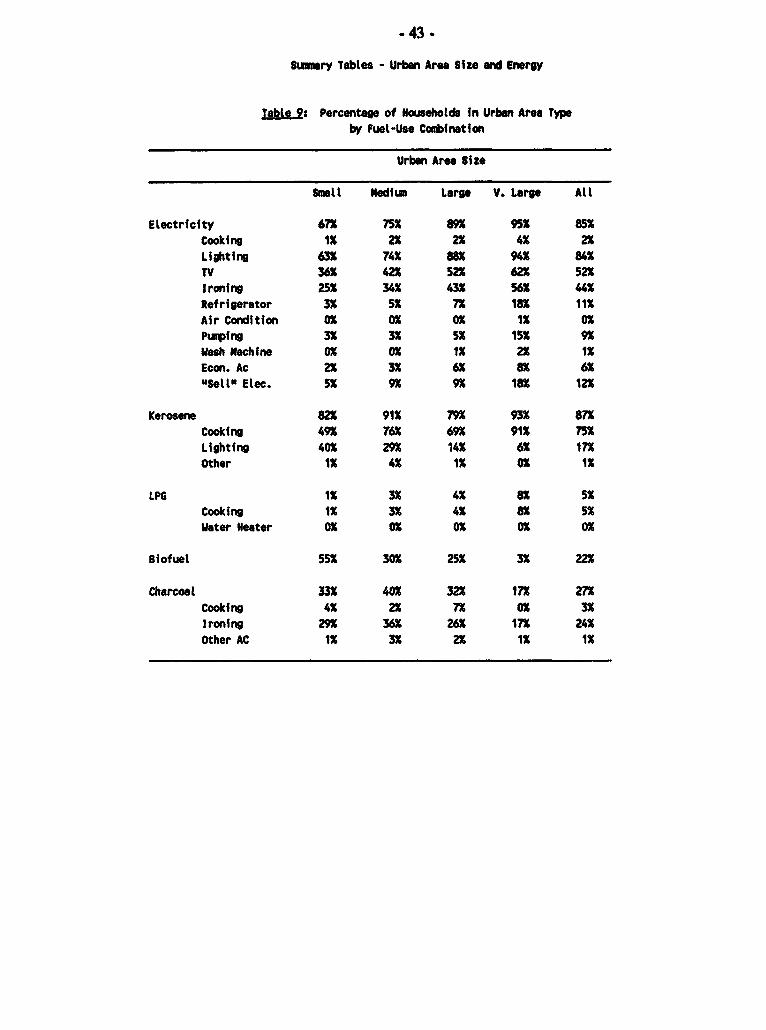
Summary Tables - Urban Area Size and Energy
Table 9: Percentage of Households fn Urban Area Typeby Fuel-Use Combination
Urban Area Size
Small Medium Large V. Large All
Electricity 67X 75X 89X 95f 85X
Cooking 1X 2X 2X 4X 2X
Lighting 63X 74X 88X 94K 84X
TV 36X 42X 52X 62K 52X
Ironing 25X 34X 43X 56X 44X
Refrigerator 3K 5X 7K 18X 11KAir Condition OK OK OK 1X OKPumping 3X 3X 5K 15K 9KWash Machfne OX OX 1X 2X 1KEcon. Ac 2X 3X 6K 8X 6X
uSell Elec. 5K 9X 9K 18X 12X
Kerosene 82X 91K 79X 93X 87X
Cooking 49K 76K 69K 91X 75K
Lighting 40X 29X 14X 6K 17X
other 1K 4X 1X OX 1X
LPG 1X 3X 4X 8X 5X
Cooking 1K 3K 4K 8X 5S
Water Heater OK OX OX OX OX
Biofuel 55 30K 25X 3X 22X
Charcosl 33X 48X 32X 17X 27X
Cooking 4K 2X 7X OX 3X
Ironing 29X 36K 26X 17X 24K
Other AC 1X 3X 2X 1K 1X
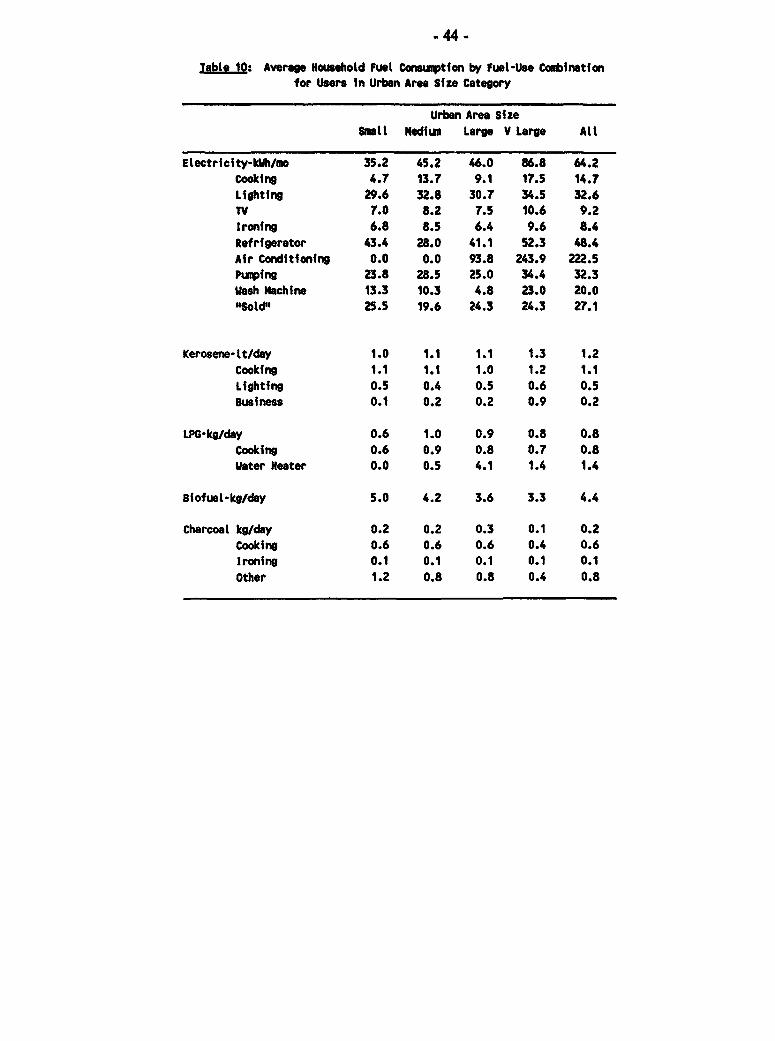
-44 -
Table lO: Average Household Fuel Consumption by Fuel-Use Coabinationfor Users in Urban Area Size Category
Urban Area SizeSntIl Medium Large V Large All
Electricity-kWh/mo 35.2 45.2 46.0 86.8 64.2Cooking 4.7 13.7 9.1 17.5 14.7Lightino 29.6 32.8 30.7 34.5 32.6TV 7.0 8.2 7.5 10.6 9.2Ironing 6.8 8.5 6.4 9.6 8.4Refrigerator 43.4 28.0 41.1 52.3 48.4Air Conditioning 0.0 0.0 93.8 243.9 222.5Pumping 23.8 28.5 25.0 34.4 32.3Wash Machine 13.3 10.3 4.8 23.0 20.0"Sold" 25.5 19.6 24.3 24.3 27.1
Kerosene-It/day 1.0 1.1 1.1 1.3 1.2Cooking 1.1 1.1 1.0 1.2 1.1Lighting 0.5 0.4 0.5 0.6 0.5Business 0.1 0.2 0.2 0.9 0.2
LPG-kg/day 0.6 1.0 0.9 0.8 0.8Cooking 0.6 0.9 0.8 0.7 0.8Water Heater 0.0 0.5 4.1 1.4 1.4
Biofuet-kg/day 5.0 4.2 3.6 3.3 4.4
Charcoal kg/day 0.2 0.2 0.3 0.1 0.2Cooking 0.6 0.6 0.6 0.4 0.6Ironing 0.1 0.1 0.1 0.1 0.1Other 1.2 0.8 0.8 0.4 0.8
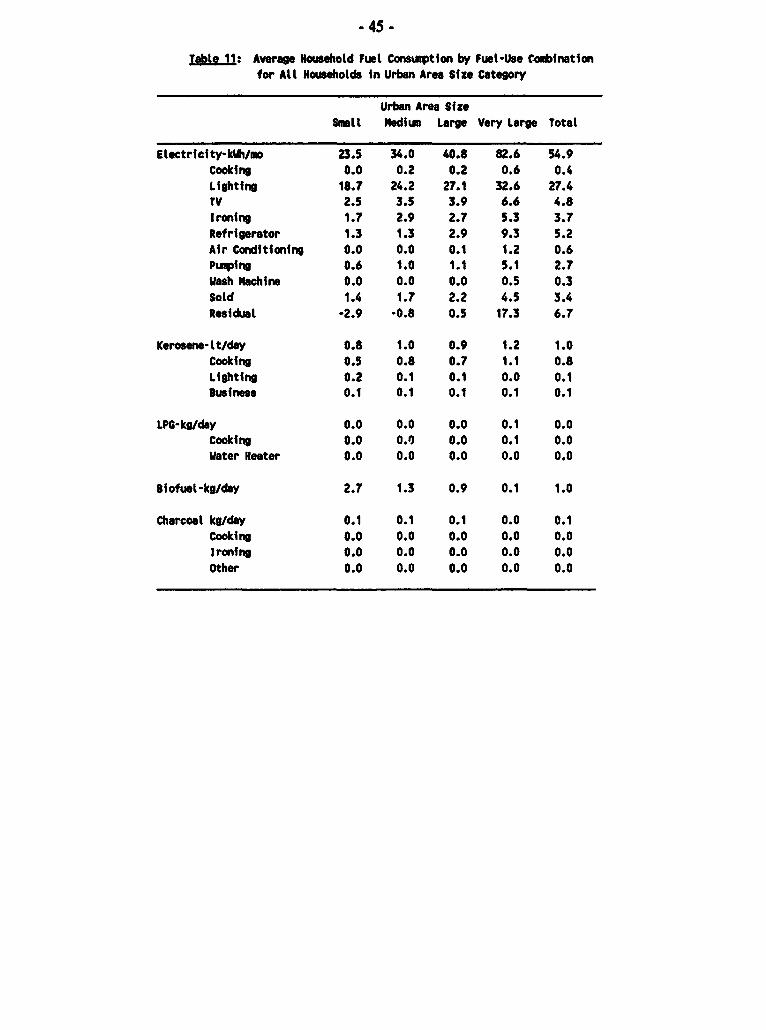
. 45 -
Tabte II: Average Household Fuel Consumption by Fuel-Use C.oubInationfor Alt Households in Urban Area Size Category
Urban Area SfzeSmtll edium Large Very Large Total
Electricity-kWh/mo 23.5 34.0 40.8 82.6 54.9Cooking 0.0 0.2 0.2 0.6 0.4Lighting 18.7 24.2 27.1 32.6 27.4TV 2.5 3.5 3.9 6.6 4.8Ironing 1.7 2.9 2.7 5.3 3.7Refrigerator 1.3 1.3 2.9 9.3 5.2Air Conditioning 0.0 0.0 0.1 1.2 0.6Pumping 0.6 1.0 1.1 5.1 2.7Wash Machine 0.0 0.0 0.0 0.5 0.3Sold 1.4 1.7 2.2 4.5 3.4Residual -2.9 -0.8 0.5 17.3 6.7
Kerosene-It/day 0.8 1.0 0.9 1.2 1.0Cooking 0.5 0.8 0.7 1.1 0.8Lighting 0.2 0.1 0.1 0.0 0.1eusiness 0.1 0.1 0.1 0.1 0.1
LPG-kg/day 0.0 0.0 0.0 0.1 0.0Cooking 0.0 0.0 0.0 0.1 0.0Water Heater 0.0 0.0 0.0 0.0 0.0
Biofuel-kg/day 2.7 1.3 0.9 0.1 1.0
Charcoal kg/day 0.1 0.1 0.1 0.0 0.1Cooking 0.0 0.0 0.0 0.0 0.0
Ironing 0.0 0.0 0.0 0.0 0.0Other 0.0 0.0 0.0 0.0 0.0
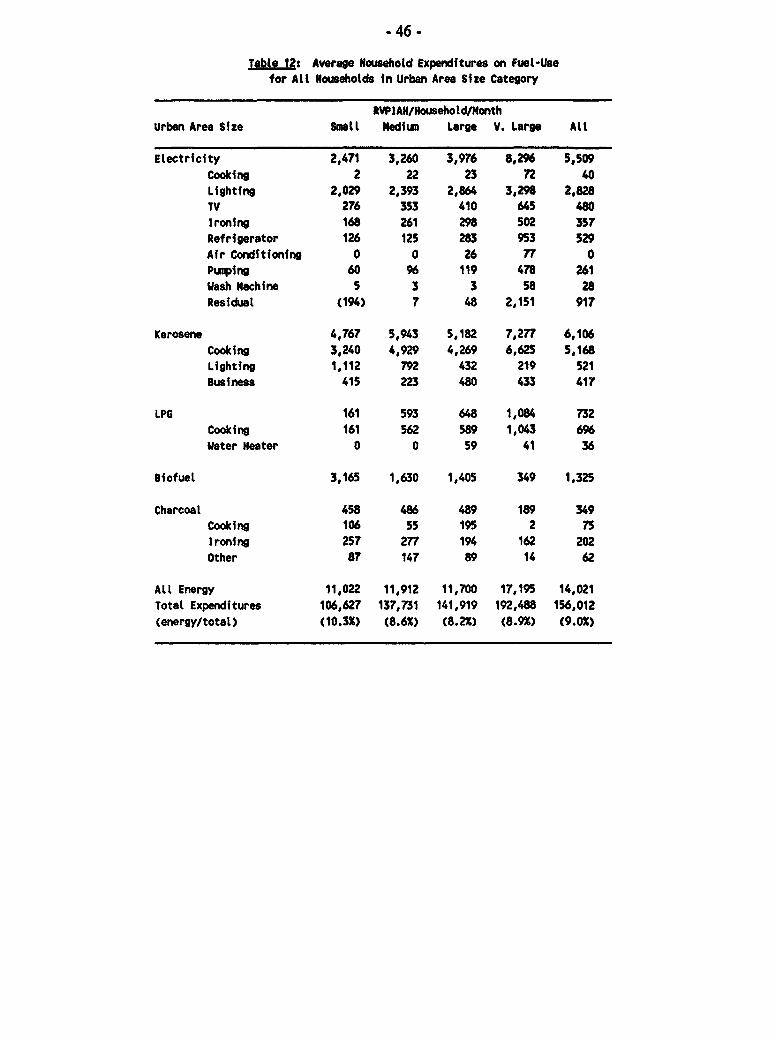
- 46 -
tgble 12: Average Household Expenditures on Fuel-Usefor All Households in Urban Area Size Category
RVPIAH/HouseholtdMonthUrban Area Size Small Mediun Large V. Large All
Electricity 2,471 3,260 3,976 8,296 5,509
Cooking 2 22 23 72 40
Lighting 2,029 2,393 2,864 3,298 2,828TV 276 353 410 64S 480
Ironing 168 261 298 502 357
Refrigerator 126 125 283 953 529Air Conditioning 0 0 26 77 0Pumping 60 96 119 478 261Wash Machine 5 3 3 58 28Residual (194) 7 48 2,151 917
Kerosene 4,767 5,943 5,182 7,277 6,106
Cooking 3,240 4,929 4,269 6,625 5,168Lighting 1,112 792 432 219 521
Business 415 223 480 433 417
LPG 161 593 648 1,084 732
Cooking 161 562 589 1,043 696
water Heater 0 0 59 41 36
Biofuel 3,165 1,630 1,405 349 1,325
Charcoal 458 486 489 189 349Cooking 106 55 195 2 75
ironing 257 277 194 162 202
Other 87 147 89 14 62
All Energy 11,022 11,912 11,700 17,195 14,021
Total Expenditures 106,627 137,731 141,919 192,488 156,012
(energy/total) (10.3X) (8.61) (8.21) (8.9%) (9.01)
.47 -
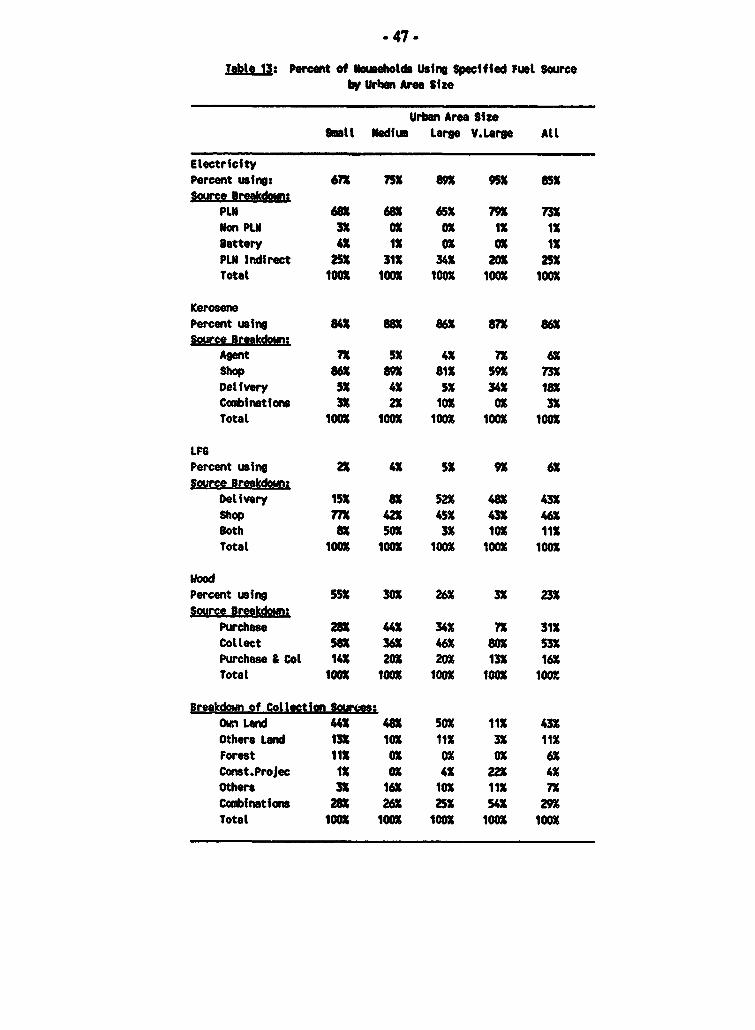
tatle 13: Perecnt of Households Using Specified fuel Sourceby Urbcn Area Size
Urban Area SizeSath Nediuw Large V.Large Att
ElectriecityPercent using: 67X 75S 89X ffX 85XMMrc Brefkdomin
PLN 68K 68X 65K 79X 73XNon PLN 3X 0X oX 1X 1XBattery 4K 1X oX oX 1XPLN Indirect 25X 31K 34K 20K 25KTotal 10OX 100 100K 100K 100
KerosenePercent using 84K 88K 86% 87K 86XSource Breakdown:
Agent 7X 5X 4K 7% 6aShop 86S 89X 81% 59X 73%Delivery 5K 4X 5K 34X 18Xcoebinations 3K 2% 10K 0X 3XTotal 100 100% 100K 100 100
LPGPercent using 2X 4K 5X 9X 6SSource Breakdown.
Delivery 15X 8K 52X 48X 43XShop 77K 42X 45K 43X 46K3oth 8X 50X 3X 10X 11KTotal 1OOX 100K 100X 100X 100K
WoodPercent using 55K 30X 26X 3X 23KSource Breekdom:
Purchase 28X UX 34K 7K 31XCollect 58X 36S 46K 80K 53KPurchase & Col 14K 20K 20X 13X 16XTotal tOOK lOOK 100X ioOn 100X
Breakdown of Collectiln Sournes:O,n Land 44 48X 50X 11K 43XOthers Land 13X 10X 11 3X 11Forest 11K 0X oX 0X 6XConst.Projec 1X 0X 4X 22X 4XOthers 3X 16K 10K 11 7XCobfinations 2 26K 25K 54K 29XTotal 1008 100K IonK 100K 100l
- 48 -
Miscellaneous Tables
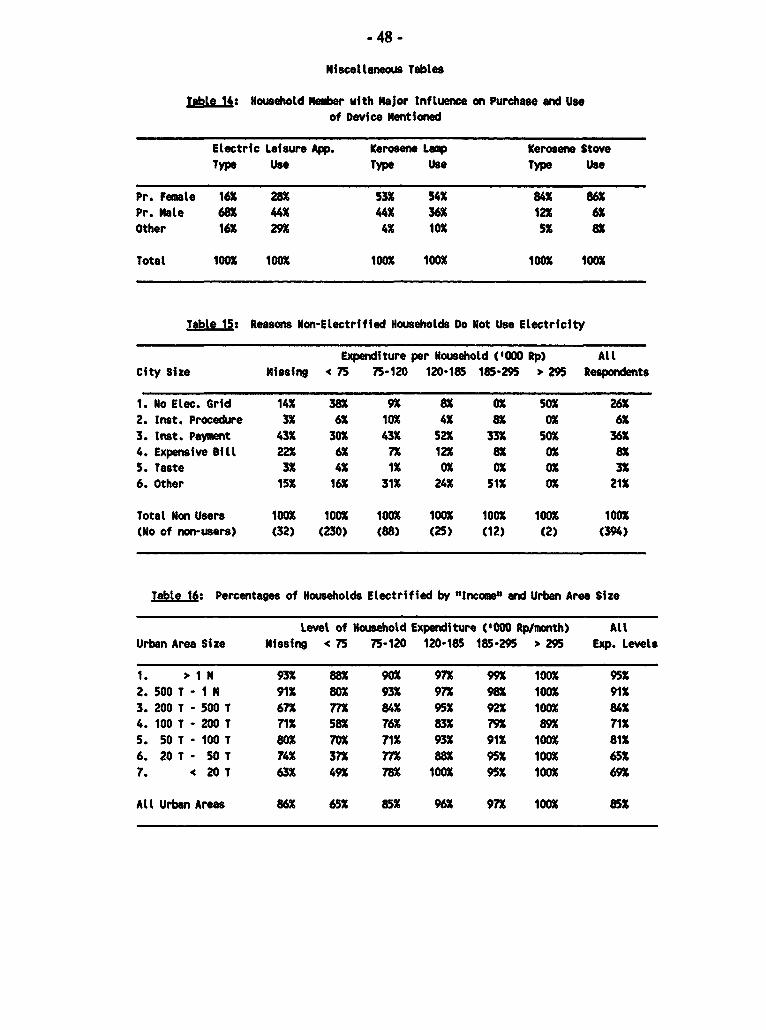
table 14: Household Iubner with Major Inftuence on Purchase and Useof Device Nentioned
Electric Leisure App. Kerosene Lamp Kerosene StoveType Use Type Use Type Use
Pr. Female 16% 28% 53% 54% 84% 86%Pr. Kale 68% 44% 44% 36% 12X 6%Other 16% 29X 4% 10% 5% 8%
Total 10GX 100% 100% 100% 100% 100%
Tbtle 15: Reasons Non-Electrified Households Do Not Use Electricity
Expenditure per Household ('000 Rp) AllCity Size Missing 4 75 75-120 120-185 185-295 > 295 Respondents
1. No Elec. Grid 14% 38% 9% 8% 0% 50% 26%2. Inst. Procedure 3% 6% 10% 4% 8% 0% 6%3. Inst. Payment 43% 30% 43% 52% 33% 50% 36X4. Expensive Bill 22% 6% 7% 12% 8% 0% 8%5. Taste 3% 4% 1% 0% 0% OX 3%6. Other 15% 16% 31% 24% 51% 0% 21%
Total Non Users 100% 100% 100% 100% 100% 100% 100%(No of non-users) (32) (230) (88) (25) (12) (2) (394)
Table 16: Percentages of Households Electrified by mInco e and Urban Area Size
Level of Household Expenditure ('000 Rp/month) AllUrban Area Size MissIng < 75 75-120 120-185 185-295 > 295 Exp. Levels
1. > IN 93% 88% 90% 97% 99X 100% 95%2. 500 T - I M 91% 80% 93% 97% 98% 100% 91%3. 200 T - 500 T 67% 77% 84% 95% 92% 100% 84%4. 100 T - 200 T 71% 58% 76% 83% 79% 89% 71%5. 50T - 100 T 80% 70% 71% 93% 91% 100% 81%6. 20 T - 50 T 74% 37% 77% 88% 95% 100% 65%7. < 20 T 63% 49% 78% 100% 95% 100% 69%
All Urban Areas 86% 65% 85% 96% 97% 100% 85%
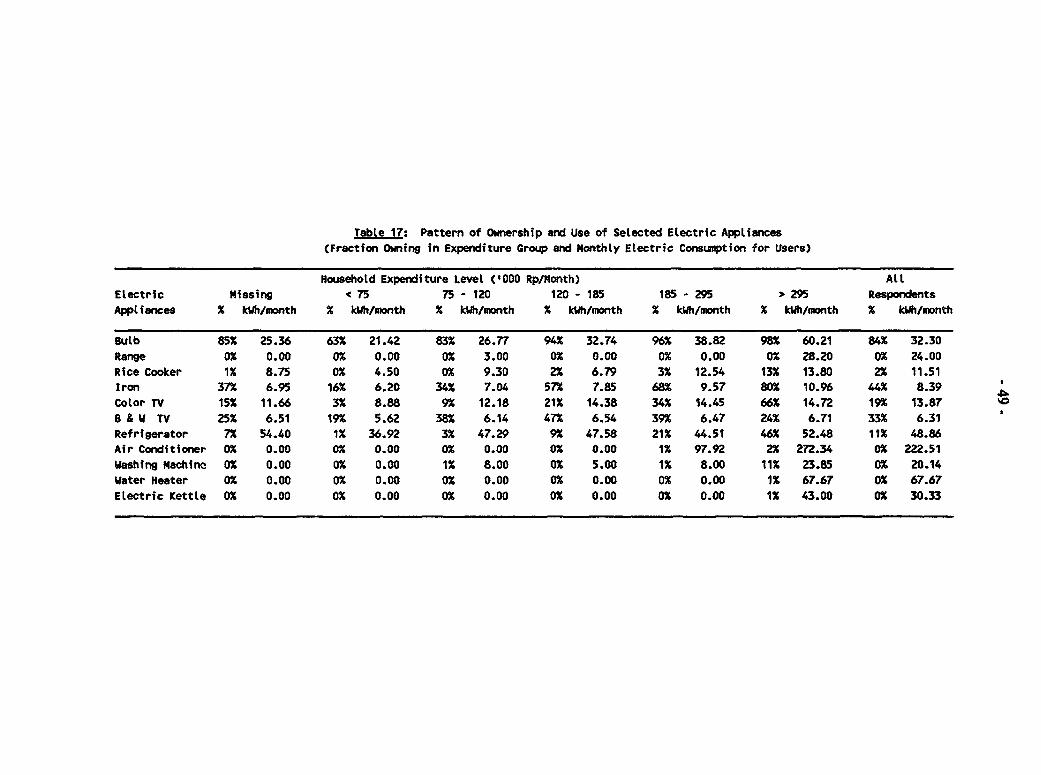
TabLe 17: Pattern of Ownership and Use of Selected Electric AppLiances(Fraction Owning in Expenditure Group and Monthly Electric Consumption for Users)
Household Expenditure Level ('000 Rp/Month) AltElectric Missing < 75 75 - 120 120 - 185 185 - 295 > 295 RespondentsAppliances % kWh/month X kWh/month % kWhtmonth % kWh/month % kWh/month % kWh/month % kWh/month
Bulb 85% 25.36 63% 21.42 83% 26.77 94% 32.74 96% 38.82 98% 60.21 84% 32.30Range 0% 0.00 0% 0.00 0% 3.00 0% 0.00 0% 0.00 0% 28.20 0% 24.00Rice Cooker 1% 8.75 ox 4.50 0% 9.30 2% 6.79 3% 12.54 13% 13.80 2% 11.51Iron 37% 6.95 16% 6.20 34% 7.04 57% 7.85 68% 9.57 80% 10.96 44% 8.39Color TV 15% 11.66 3% 8.88 9% 12.18 21% 14.38 34% 14.45 66% 14.72 19% 13.87B & W TV 25% 6.51 19% 5.62 38% 6.14 47% 6.54 39% 6.47 24% 6.71 33% 6.31Refrigerator 7% 54.40 1% 36.92 3% 47.29 9% 47.58 21% 44.51 46% 52.48 11% 48.86Air Conditioner 0% 0.00 0% 0.00 0% 0.00 0% 0.00 1% 97.92 2% 272.34 0% 222.51Washing Machinm 0% 0.00 0% 0.00 1% 8.00 0% 5.00 1% 8.00 11% 23.85 0% 20.14Water Heater 0% 0.00 0% 0.00 0% 0.00 0% 0.00 0% 0.00 1% 67.67 0% 67.67Electric Kettle 0% 0.00 0% 0.00 0% 0.00 0% 0.00 0% 0.00 1% 43.00 0% 30.33
- 50 ^
Table 18: Ownership of Other Electrical Appliances(Percentage of Respondents in Expenditure Group Owning Specified Appliance)
Household Expenditure ('000 Rp/Month) All
Missing < 75 75-120 120-185 185-295 > 295 Respondents
1. Radio/Tape 39.4% 20.8% 42.0% 56.8% 61.8% 78.3% 45.9%2. Fan 15.8% 2.3% 10.3% 22.2% 30.1% 45.8% 17.5%3. Water Pump 5.8% 1.4% 2.6% 7.3% 15.4% 34.9% 8.4%4. Mixer 5.0% 0.8% 3.3% 8.1% 14.1% 28.5% 7.7%5. Video 1.2% 0.9% 1.9% 3.6% 10.5% 25.7% 5.4%6. Sound System 3.1% 0.3% 1.7% 1.9% 5.0% 14.5% 3.2%7. Sewing Machine 1.9% 1.1% 2.6% 3.6% 3.4% 10.4% 3.2%8. Hair Dryer 1.2% 0.2% 1.0% 1.9% 6.3% 16.1% 3.1%9. Blender 1.2% 0.3% 0.5% 2.8% 5.5% 14.9% 3.0%10. Razor 0.8% 0.0% 0.9% 0.3% 0.5% 5.6% 0.9%11. Toaster 0.0% 0.2% 0.7% 0.5% 1.0% 2.4% 0.7%12. Vacuum Cleaner 0.4% 0.0% 0.2% 0.5% 0.3% 5.2% 0.7%
Table 19: Sumary Electricity Data by Source of Electricity
Non PLN PLN Total All
Elec Indirect Direct Elec Households
1. Sanple Size 393 589 1676 2309 27022. Share of NH In Survey (%) 15% 22% 62% 86% 100%3. Share of Connex in Survey(X) 100X 100% 100%4. Family Size 4.1 3.8 5.2 4.7 4.65. Average Consump. (kWh/No) 0 15 84 64 556. Number "selling" electricity NA 335 335 3357. Estimated sales/seller (kWh/Mo) NA 26 26 268. Average net Cons. (kWh/No) 0 15 79 60 529. Fam. Expenditure (Rp/Mo) 69,820 103,285 193,844 156,012 143,47610. Rp/Mo for Electricity 0 2,360 8,098 6,447 5,509
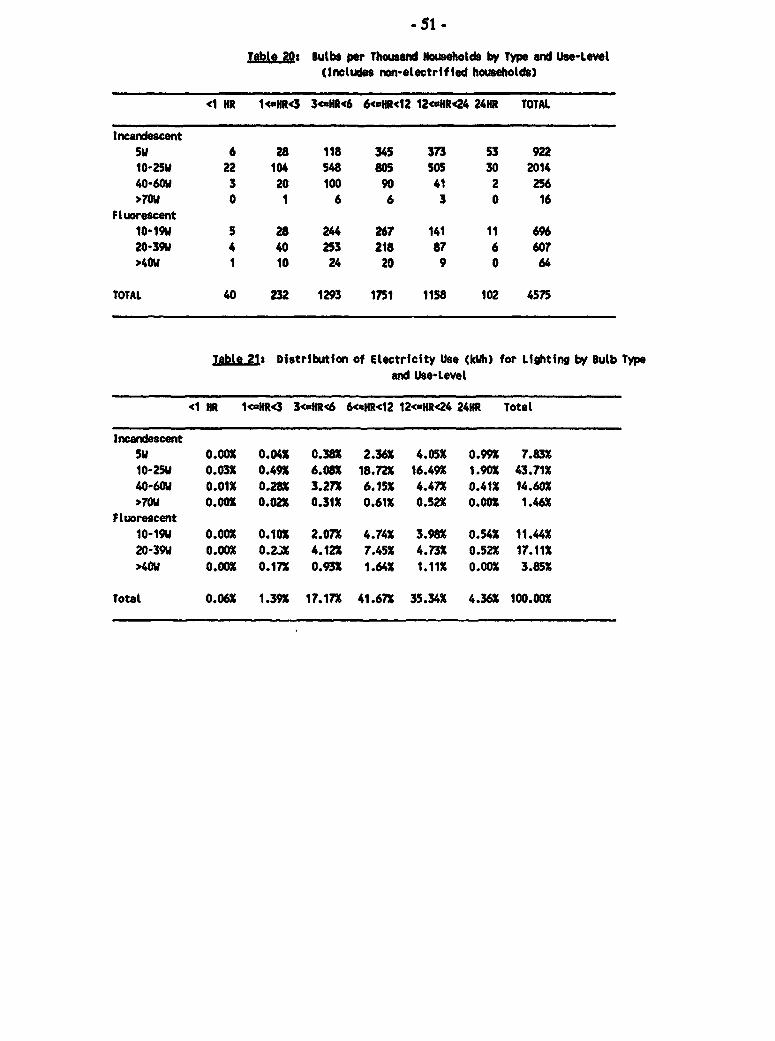
S1.
IIabtAe : Bulbs per Thousand Households by Type and Use-Lewl(Includes non-electrif led households)
<1 HR 14HR 3<aHR<6 6uHRc12 124uHRc24 24HR TOTAL
IncandescentSW 6 28 118 345 373 53 92210-25W 22 104 548 805 505 30 201440-60W 3 20 100 90 41 2 256)7Ow 0 1 6 6 3 0 16
Fluorescent10-19W 5 28 244 267 141 11 69620-39W 4 40 253 218 87 6 607>40W 1 10 24 20 9 0 64
TOTAL 40 232 1293 1751 1158 102 4575
Tabte 21: Distribution of Electricity Use (kWh) for Lighting by Sutb Typeand Use-Level
d1 HR 1HR<3 3<uHR<6 6<sHR<12 12<=HRc24 24HR Total
Incandescent5W 0.00% 0.04% 0.382 2.36% 4.05% 0.99X 7.83%10-25W 0.03X 0.49% 6.08% 18.72 16.49% 1.90% 43.71%40-60W 0.01% 0.28X 3.27X 6.15% 4.47% 0.41% 14.60X>70W 0.00% 0.02% 0.31% 0.61% 0.52% 0.00% 1.46%
Fluorescent10-19W 0.00% 0.10% 2.07% 4.74% 3.98% 0.54% 11.44%20-39W 0.00% 0.2,;% 4.12% 7.45% 4.73% 0.52% 17.11%>40W 0.00% 0.17% 0.93% 1.64% 1.11% 0.00% 3.85%
Total 0.06X 1.39% 17.17% 41.67% 35.34% 4.36% 100.00%
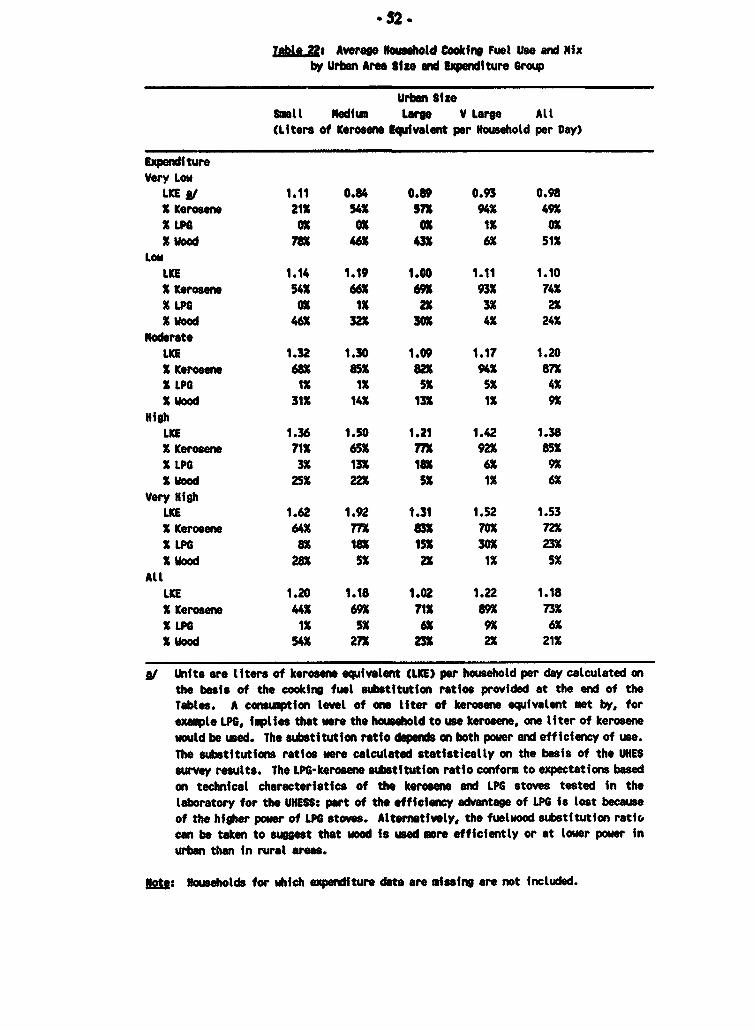
S52-
Table 22t Averag Nouhbold Cooking Fuel Use and Nixby Urban Am Sie and penditure Group
Urban SizeSamll lNdiuw Lare V Large Alt(Liters of Kerosene Euivalent per Household per Day)
ExpenditureVery LoW
LKE W 1.11 0.84 0.89 0.93 0.98% Kerosene 21% 54% 37X 94% 49%% LPG OX OX OX 1% OX% Wood 78X 46X 43X a 51%
LowIME 1.14 1.19 1.00 1.11 1.10
% Kerosene 54% 66X 69X 93% 74%% LPG 0% 1% 2X 3% 2%% Wood 46% 32% 30% 4% 24%
NoderateLKE 1.32 1.30 1.09 1.17 1.20% Kerosene 68% 85% 82% 94% 87%X LPG 1% 1% 5% 5% 4%% Wood 31% 14% 13X 1% 9%
HighLKE 1.36 1.50 1.21 1.42 1.38% KIerosene 71% 65% 77X 92% 85%% LPG 3% 13% 18 6% 9%% Wood 25% 22% 5% 1% 6a
very HighLKE 1.62 1.92 1.31 1.52 1.53% Kerosene 64% 77% 83% 70X 72X% LPG 8% 18X 15X 30% 23%% lood 28% 5% 2% 1% 5%
AllLKE 1.20 1.18 1.02 1.22 1.18% Kerosene 4% 69% 71% 89% 73%% LPG 1% 5% a 9% 6%% Wood 54% 27% 23X 2% 21%
A/ Units are liters of kerosene equivalent (LIE) per household per day calculated onthe basis of the cooking fuel substitution ratios provided at the end of theTables. A consuption level of one liter of kerosene equivalent met by, forexample LPG, implies that were the household to use kerosne, one liter of kerosenewould be used. The substitution ratio depends on both power and efficiency of use.The substitutions ratios were calculated statistically on the basis of the UHESsurvey results. The LPG-kerosene substitution ratio conform to expectations basedon technical characteristics of the kerowene and LPG stoves tested in thelaboratory for the UHESS: part of the efficiency advantage of LPG is lost becauseof the hfgher power of LPG stoves. Alternatively, the fuelwood substitution ratilocan be taken to sugest that wood is used more efficiently or at lower power inurban than In rural areas.
jM: Households for .ihich expenditure data are missing are not lncluded.
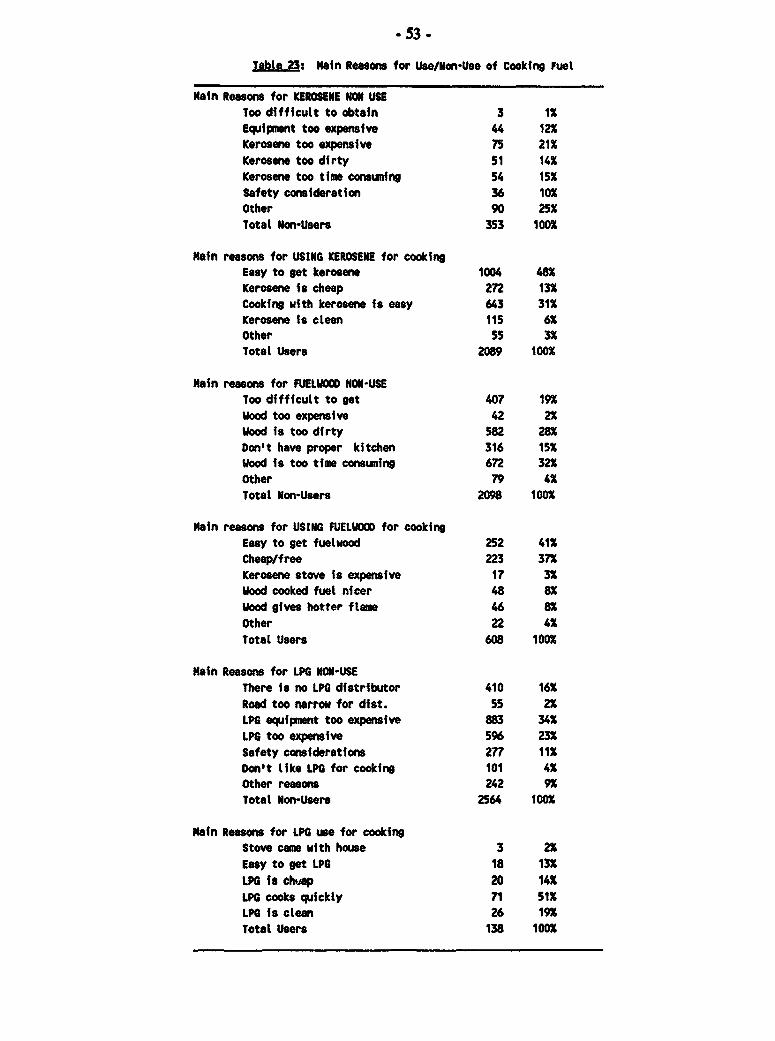
* 53 -
Tkale 23: Main Reasons for Use/Non-Use of Cooking Fuel
Main Reasons for KEROSENE NON USEToo difficutt to obtain 3 1X
Equipment too expensive 44 12X
Kerosene too expensive 75 21X
Kerosene too dirty 51 14XKerosene too time conwming 54 15X
Safety consideration 36 10X
Other 90 251Totat Non-Users 353 1001
Main reasons for USING KEROSENE for cookingEasy to get kerosene 1004 48X
Kerosene is cheap 272 13XCooking with kerosene is easy 643 311Kerosene Is clean 115 61Other 55 31
Total Users 2089 1001
Nain reasons for FUELWOOD NON-USEToo difficult to get 407 191
wood too expensive 42 21Wood is too dirty 582 281
Don't have proper kitchen 316 151Wood is too time consuing 672 321
Other 79 41
Totat Non-Users 2098 1001
Main reasons for USING FUELWCOD for cookingEasy to get fuelwood 252 411Cheap/free 223 371Kerosene stove is expensive 17 31Wood cooked fuel nicer 48 81Wood gives hotter ftlame 46 8X
Other 22 41Totat Users 608 1001
Main Reasons for LPG NON-USEThere is no LPG distributor 410 161
Road too narrow for dist. 55 2XLPG equipment too expensive 883 341LPG too expensive 596 231
Safety considerations 277 11X
Don't tike LPG for cooking 101 41Other reasons 242 91
Total Non-Users 2564 1001
Main Reasons for LPG use for cookingStove came with house 3 2X
Easy to get LPG 18 131LPG is chuap 20 141LPG cooks quickly 71 51XLPG is clean 26 191
Total Users 138 1001
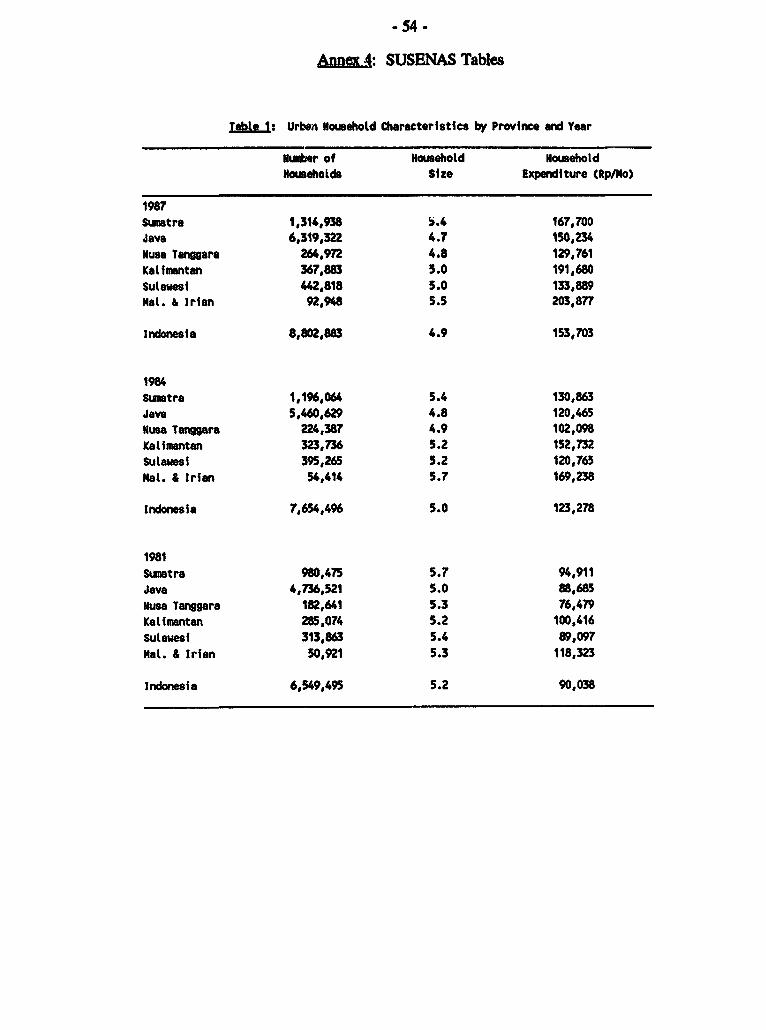
.54.
Annmw: SUSENAS Tables
Tabte 1: Urbeo Household Characteristics by Province and Year
Number of Household NouseholdNousehoids Size Expenditure (Rp/Io)
1987Sumatra 1,314,938 5.4 167,700Java 6,319,322 4.7 150,234Musa Tanggara 264,972 4.8 129,761Kalimantan 367,883 5.0 191,680Sulawesi 442,818 5.0 133,889
Hat. & Irian 92,948 5.5 203,877
Indonesia 8,802,883 4.9 153,703
1984Sumatra 1,196,064 5.4 130,863
Java 5,460,629 4.8 120,465
Musa Tanggare 224,387 4.9 102,098
Kalimantan 323,736 5.2 152,732Sulawesi 395,265 5.2 120,765Mal. & Irian 54,414 5.7 169,238
Indonesia 7,654,496 5.0 123,278
1981Sumatra 980,475 5.7 94,911
Java 4,736,521 5.0 88,685Musa Tanggara 182,641 5.3 76,479
Kalimantan 285,074 5.2 100.416Sulawesi 313,863 5.4 89,097Nal. & Irian 50,921 5.3 118,323
Indonesia 6,549,495 5.2 90,038
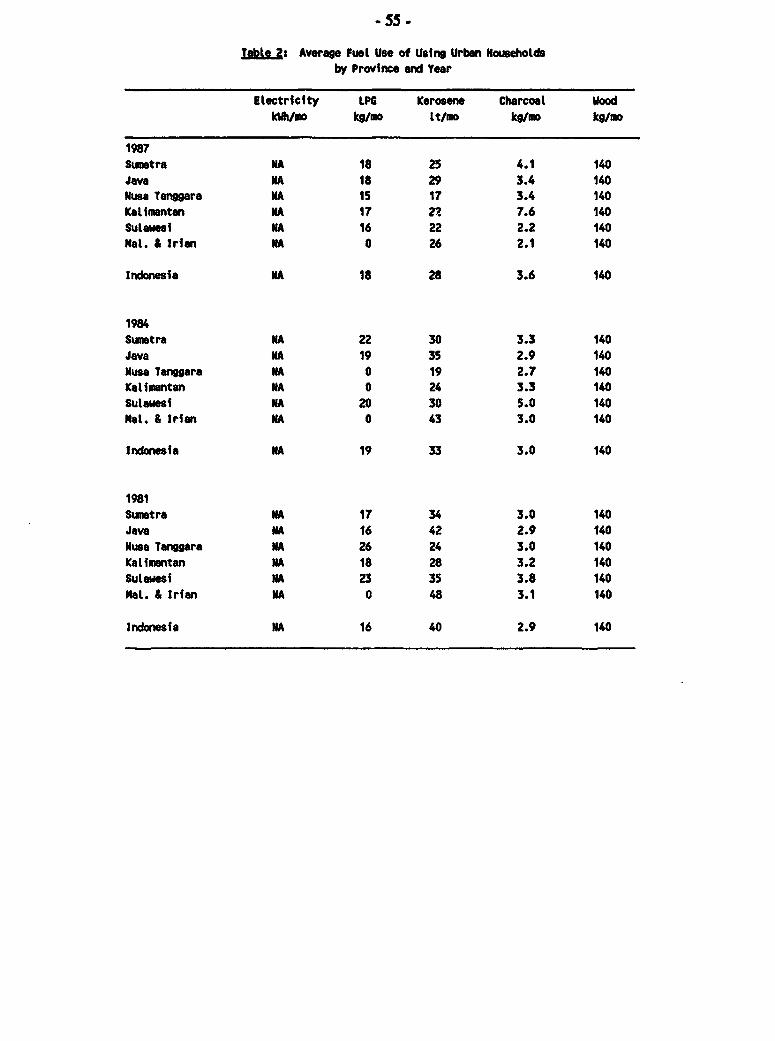
55 -
Table 2: Averao Fuel Use of Using Urban Householdsby Province and Year
Electricity LPG Kerosene Charcosl WoodkMh/mo kg/mo lt/mo kg/mo kg/mo
1987
Sumtra MA 18 25 4.1 140
Java MA 18 29 3.4 140Nusa Tanggara NA 15 17 3.4 140
Kalimantan MA 17 22 7.6 140Sulawesi MA 16 22 2.2 140
Mal. & Irian MA 0 26 2.1 140
Indonesia MA 18 28 3.6 140
1984Sumatra MA 22 30 3.3 140Java MA 19 35 2.9 140Nusa Tanggara MA 0 19 2.7 140Kalimantan MA 0 24 3.3 140Sulaweui MA 20 30 5.0 140Nal. & Irian MA 0 43 3.0 140
Indonesia MA 19 33 3.0 140
1981Sumatra MA 17 34 3.0 140Java MA 16 42 2.9 140Nusa Tanggara MA 26 24 3.0 140KaLimantan MA 18 28 3.2 140Sulawesi MA 23 35 3.8 140Hat. & Irian MA 0 48 3.1 140
Indonesia NA 16 40 2.9 140
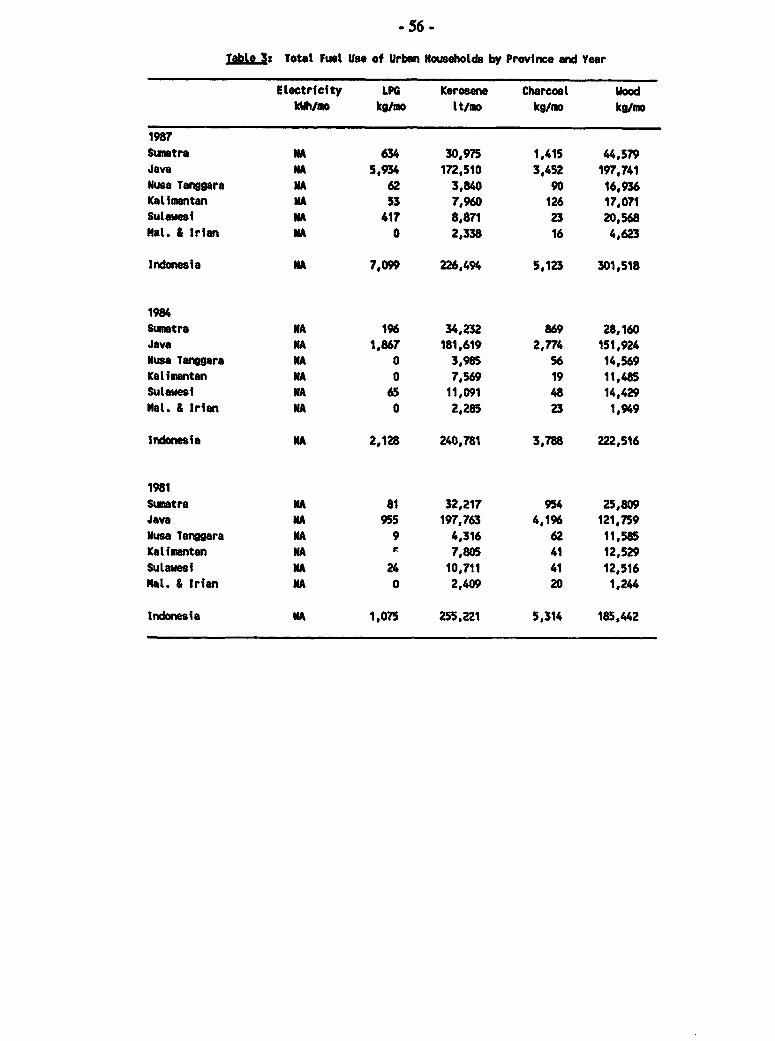
-56 -
tablet3: Total Fuel Us. of Urban Households by Province and Year
Etectricity LPG Kerosene Charcoal WoodkWh/mo kg/mo lt/mo kg/mo kg/mo
1987Sumatra NA 634 30,975 1,415 44,579Java MA 5,934 172,510 3,452 197.741Nusa Tangp ra NA 62 3,840 90 16,936Kalimantan MA 53 7,960 126 17,071Sulawesi NA 417 8,871 23 20,568Mal. & Irian NA 0 2,338 16 4,623
Indonesia NA 7,099 226,494 5,123 301,518
1984Sumatra NA 196 34,232 869 28,160Java MA 1,867 181,619 2,774 151,924Nusa Tan3gara NA 0 3,985 56 14,569Kalimantan MA 0 7,569 19 11,485Sutawesi MA 65 11,091 48 14,429Nal. & Irian MA 0 2,285 23 1,949
Indonesia NA 2,128 240,781 3,788 222,516
1981
Sunatra NA 81 32,217 954 25,809Java NA 955 197,763 4,196 121,759Nusa Tanggara NA 9 4,316 62 11,585Kalimantan NA r 7,805 41 12,529Sulavesi NA 24 10,711 41 12,516Mal. & Irian NA 0 2,409 20 1,244
Indomesia NA 1,075 255,221 5,314 185,442
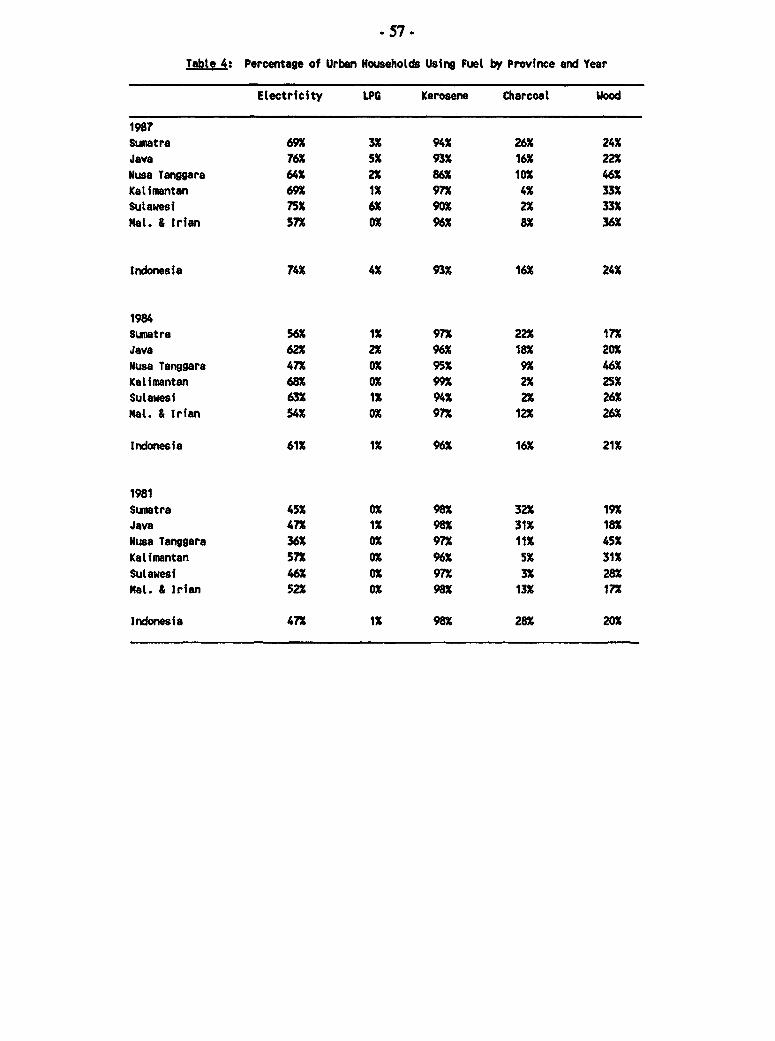
- 57-
Table 4: Percentage of Urban Households Using Fuel by Province and Year
Electricity LPG Kerosene Charcoal Wood
1987Sumatra 692 32 942 26X 242
Java 762 5 932 16X 22X
Nusa Tanggara 64X 22 86X 102 462
Kalimantan 692 12 972 42 332Sulawesi 752 62 902 22 332
Mal. & Irian 572 02 96X ax 362
Indonesia 742 42 932 162 24X
1984Sumatra 562 12 97? 222 172
Java 622 2X 96% 182 202
Nusa Tanggara 472 02 952 9X 462
Kalimantan 682 02 992 22 252
Sulawesi 632 12 942 22 262
Mat. & Irian 54X 02 972 122 262
Indonesia 61X 12 962 162 212
1981
Sumatra 452 02 982 322 192Java 472 1% 982 312 182
Nusa Tanggara 362 OX 972 112 452
Kalimantan 572 02 962 52 312
Sulawesi 462 02 97X 32 282Cal. & Irian 522 OX 982 132 17?
Indonesia 47X 12 98X 282 202
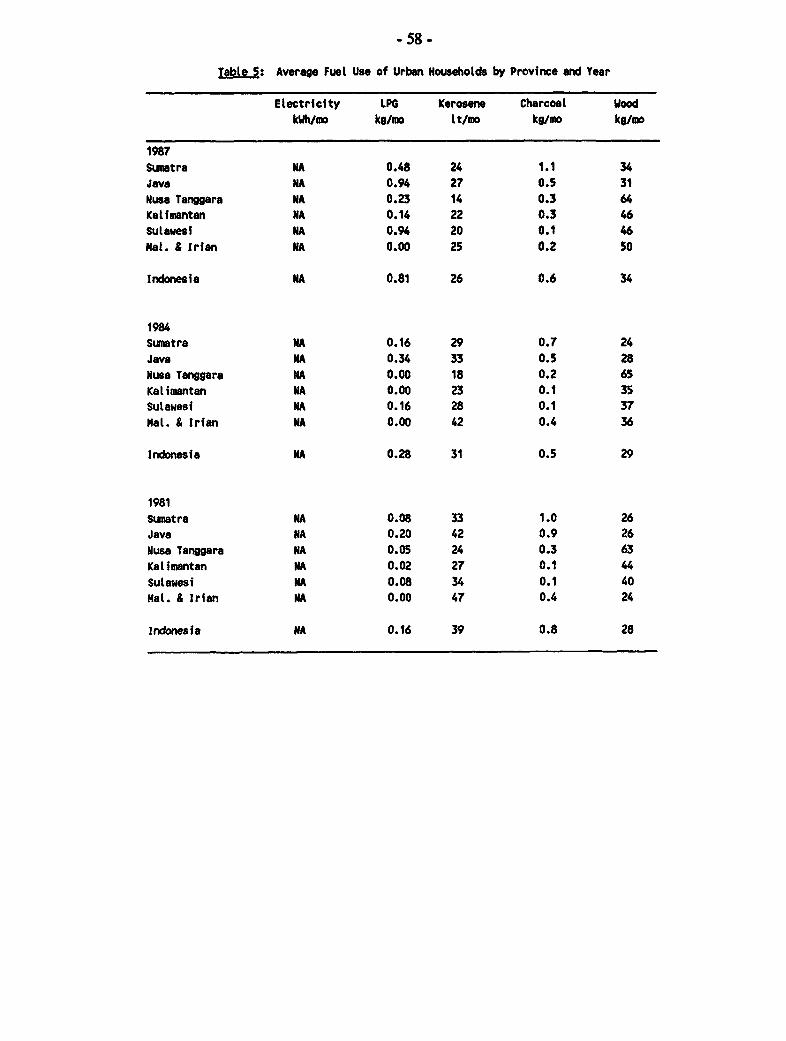
- 58 -
Table 5: Average Fuel Use of Urban Households by Province end Year
Electricity LPG Kerosene Charcoal WoodkWh/mo kg/mo lt/mo kg/mo kg/mo
1987Sunatra NA 0.48 24 1.1 34
Java NA 0.94 27 0.5 31
Nusa Tanggara NA 0.23 14 0.3 64
Kalimantan NA 0.14 22 0.3 46
Sulatwesi MA 0.94 20 0.1 46
Mal. & Iruan MA 0.00 25 0.2 50
Indonesia NA 0.81 26 0.6 34
1984Sumatra NA 0.16 29 0.7 24
Java NA 0.34 33 0.5 28
Nusa Tanggara NA 0.00 18 0.2 65
Kalimantan NA 0.00 23 0.1 35Sulaiesi NA 0.16 28 0.1 37
Mal. & Irian NA 0.00 42 0.4 36
Indonesia NA 0.28 31 0.5 29
1981
Sunatra NA 0.08 33 1.0 26Java NA 0.20 42 0.9 26
Nusa Tanggara NA 0.05 24 0.3 63
Katimantan NA 0.02 27 0.1 44
Sulawesi NA 0.08 34 0.1 40
Nat. & irNan NA 0.00 47 0.4 24
Indonesia NA 0.16 39 0.8 28
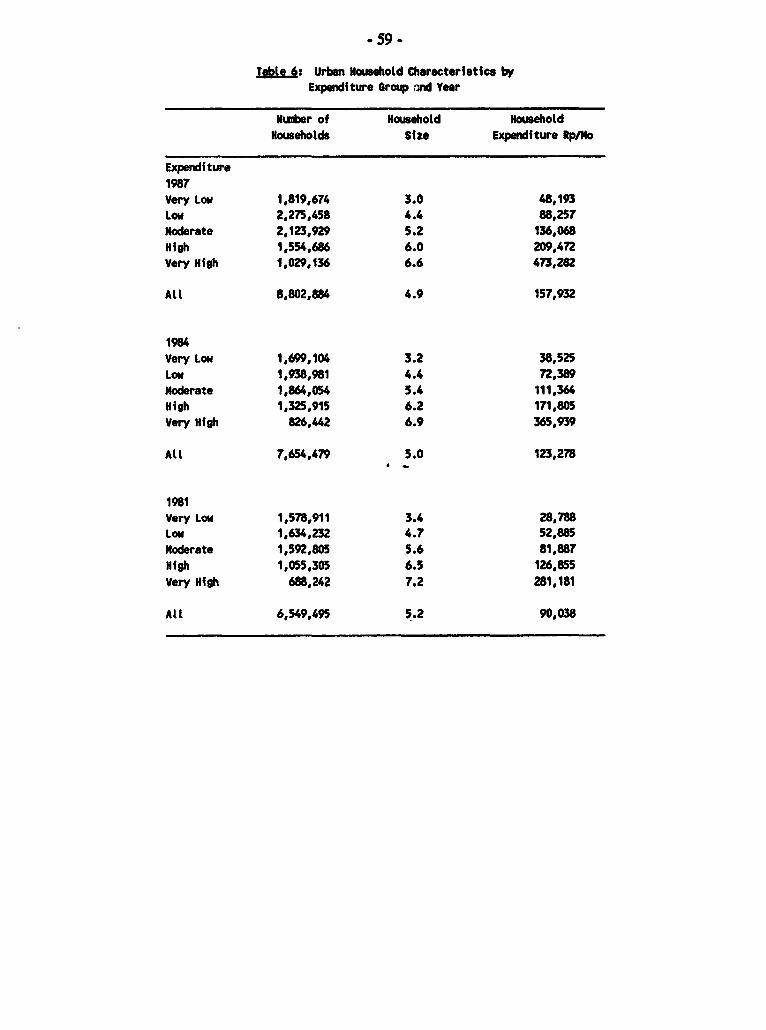
.59 -
tabte 6: Urban Household Characteristics byExpenditure Group and Year
Number of Housdold HouseholdHouseholds Size Expenditure Rp/No
Expenditure1987Very Low 1,819,674 3.0 48,193Low 2,275,458 4.4 88,257Moderate 2,123,929 5.2 136,068High 1,554,686 6.0 209,472Very High 1,029,136 6.6 473,282
All 8,802,884 4.9 157,932
1984Very Low 1,699,104 3.2 38,525Low 1,938,981 4.4 72,389Moderate 1,864,054 5.4 111,364High 1,325,915 6.2 171,805Very High 826,442 6.9 365,939
All 7,654,479 5.0 123,278S _
1981Very Low 1,578,911 3.4 28,788Low 1,634,232 4.7 52,885Moderate 1,592,805 5.6 81,887High 1,055,305 6.5 126,855Very High 688,242 7.2 281,181
All 6,549,495 5.2 90,038
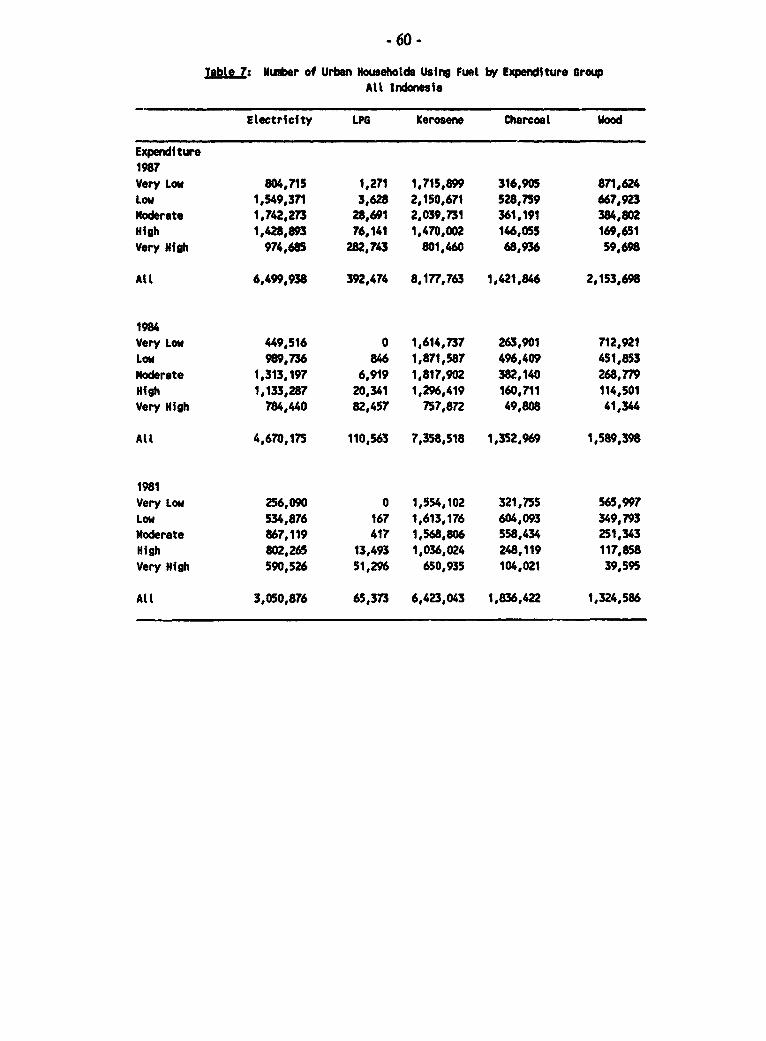
- 60 -
Tabte 7: Nuiber of Urban Households Using Fuel by Expenditure GrowpAtl Indonesia
Electricity LPG Kerosene Charcoal Wood
Expenditure1987Very Low 604,715 1,271 1,715,899 316,905 871,624Low 1,549,371 3,628 2,150,671 528,759 667,923Moderate 1,742,273 28,691 2,039,731 361,191 384,802High 1,428,893 76,141 1,470,002 146,055 169,651Very High 974,685 282,743 801,460 68,936 59,698
Alt 6,499,938 392,474 8,177,763 1,421,846 2,153,698
1984Very Low 449,516 0 1,614,737 263,901 712,921Low 989,736 846 1,871,587 496,409 451,853Moderate 1,313,197 6,919 1,817,902 382,140 268,779High 1,133,287 20,341 1,296,419 160,711 114,501Very High 784,440 82,457 757,872 49,808 41,344
All 4,670,175 110,563 7,358,518 1,352,969 1,589,398
1981Very Low 256,090 0 1,554,102 321,755 565,997Low 534,876 167 1,613,176 604,093 349,793Noderate 867,119 417 1,568,806 558,434 251,343High 802,265 13,493 1,036,024 248,119 117,858Very High 590,526 51,296 650,935 104,021 39,595
All 3,050,876 65,373 6,423,043 1,836,422 1,324,586
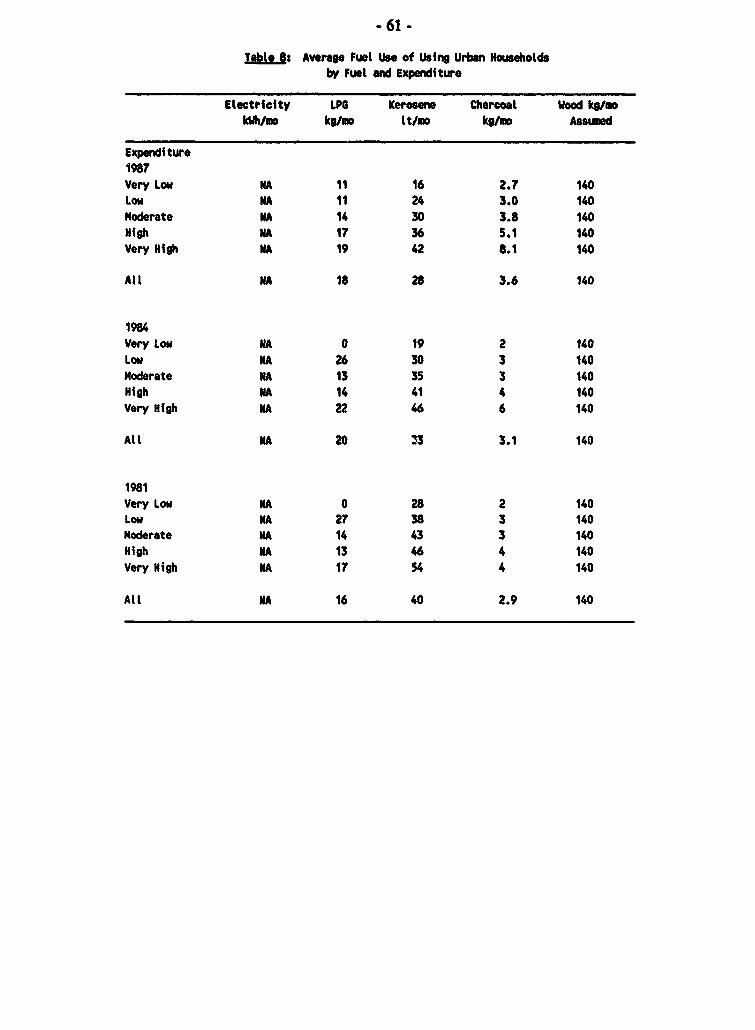
- 61 -
Tabte 8: Average Fuel Use of Using Urban Householdsby Fuel and Expenditure
Electricity LPG Kerosene Charcoal Wood kgftnkWh/mo kg/uo lt/Mo kg/mo Assumed
Expenditure1987Very Low MA 11 16 2.7 140Low MA 11 24 3.0 140Moderate NA 14 30 3.8 140High MA 17 36 5.1 140Very High MA 19 42 8.1 140
All NA 18 28 3.6 140
1984Very Low MA 0 19 2 140Low NA 26 30 3 140Moderate NA 13 35 3 140High MA 14 41 4 140Very High NA 22 46 6 140
All NA 20 33 3.1 140
1981Very Low MA 0 28 2 140Low MA 27 38 3 140Noderate MA 14 43 3 140High MA 13 46 4 140Very High MA 17 54 4 140
All NA 16 40 2.9 140
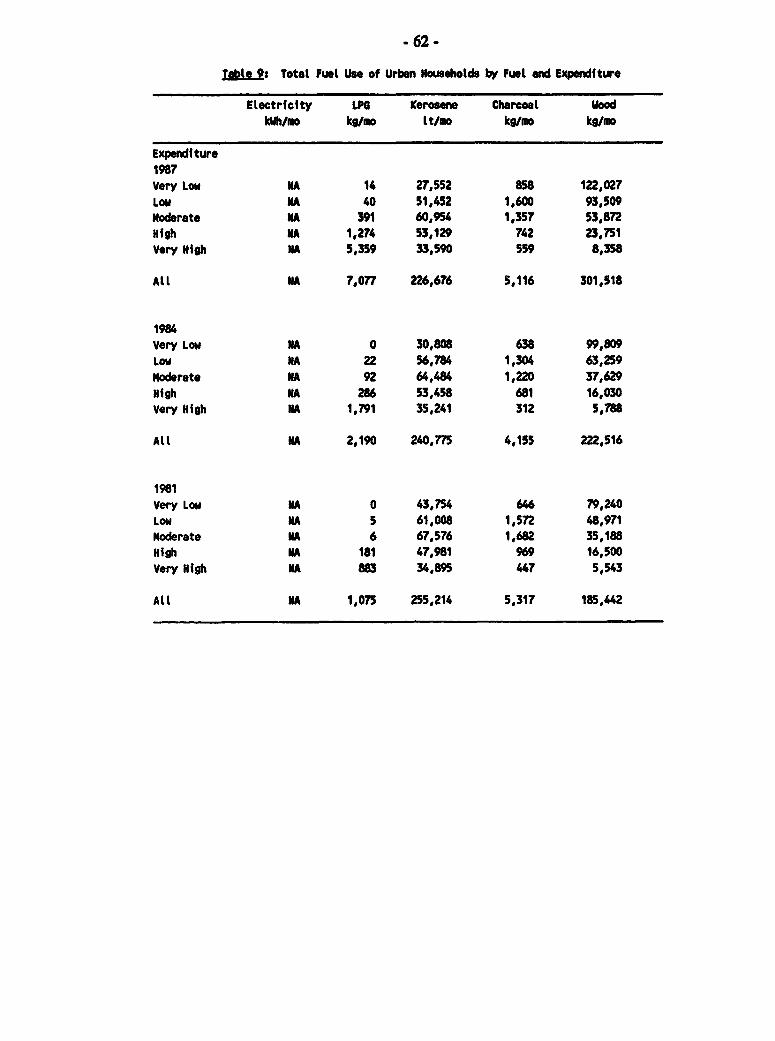
.62-
Table 9s Totat Fuel Use of Urban Households by Fuel and Expenditure
Electricity LPG Kerosene Charcoal WoodkWh/mo kg/mo lt/mo kg/mo kg/mo
Expenditure1987Very Low MA 14 27,552 as8 122,027LoW MA 40 51,452 1,600 93,509Moderate MA 391 60,954 1,357 53,872High MA 1,274 53,129 742 23,751Very High MA 5,359 33,590 559 8,358
All MA 7,077 226,676 5,116 301,518
1984Very Low MA 0 30,808 638 99,809Low MA 22 56,784 1,304 63,259Moderate NA 92 64,484 1,220 37,629High MA 286 53,458 681 16,030Very High MA 1,791 35,241 312 5,788
Allt A 2,190 240,775 4,155 222,516
1981Very Low NA 0 43,754 646 79,240Low MA 5 61,008 1,572 48,971Moderate MA 6 67,576 1,682 35,188High MA 181 47,981 969 16,500Very High MA 883 34,895 447 5,543
All MA 1,075 255,214 5,317 185,442
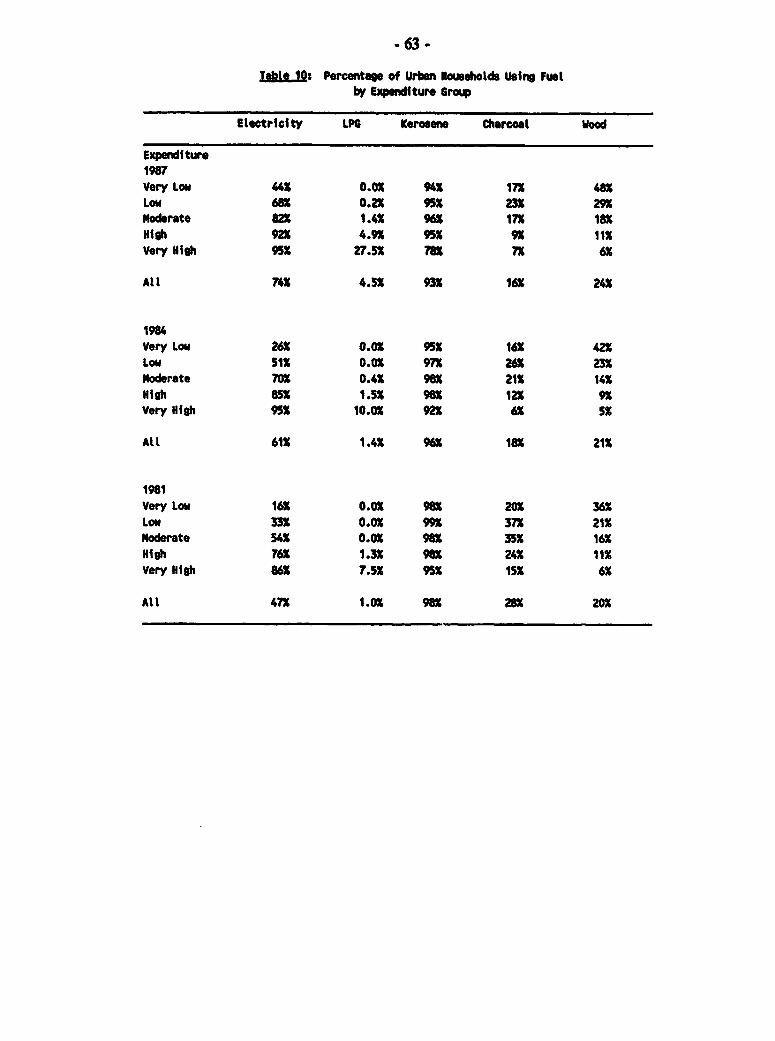
- 63 -
Table lOs Percentage of Urban Households Using Fuelby Expenditure Group
Electricity LPG Kerosene Charcoal Iood
Expenditure1987Very Low 44X 0.0 94X 17X 48XLow 68X 0.2X f5f 231 29XModerate 82X 1.42 96X 17X 18XHigh 921 4.9X 95f 9X 11XVery High 95f 27.5X 78X 71 6X
Atl 74X 4.5X 93X 16X 242
1984Very Low 26X 0.0 951 16X 42XLow 51X 0.01 971 262 23XModerate 701 0.4X 961 21X 141High 852 1.5X 961 121 9XVery High 952 10.01 921 6X SX
ALL 61X 1.4X 961 181 211
1981Very Low 162 0.01 961 202 36XLow 332 0.01 99X 371 212Moderate 542 0.01 98X 35X 16XHigh 76X 1.31 961 242 11XVery High 862 7.52 951 15X 6X
All 47X 1.0 986 281 20X
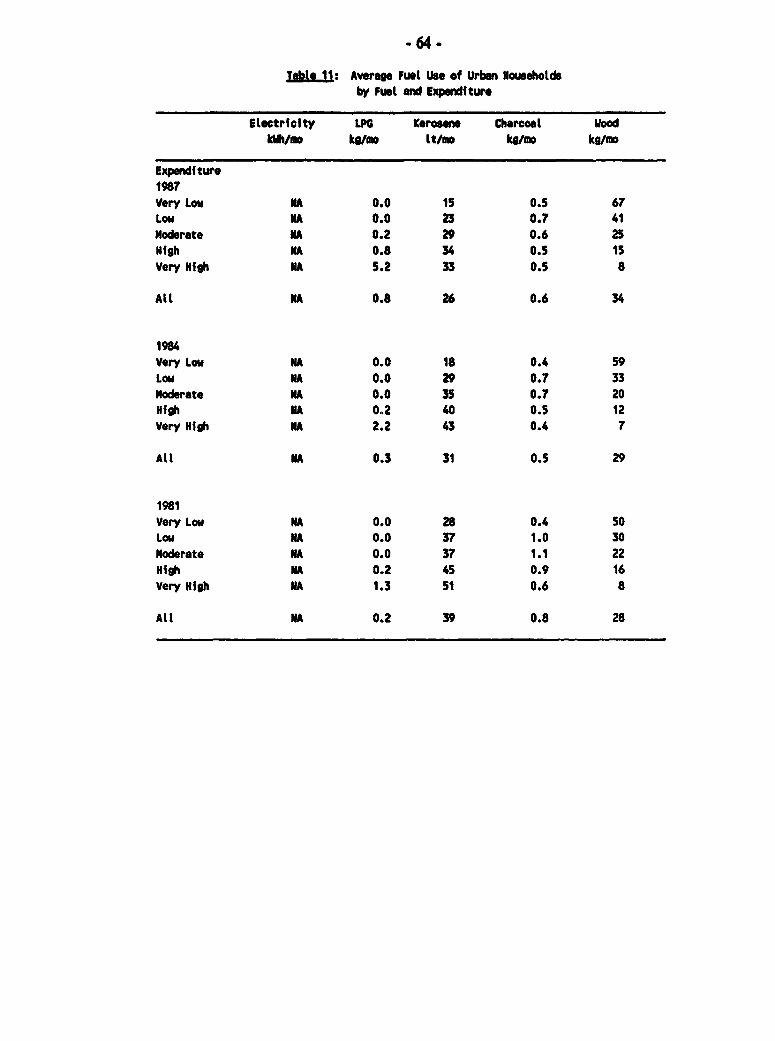
-64-
Tale 11: Averae Fuel Use of Urban Householdsby Fuel and Expenditure
Electricfty LPG Kerosene Charcoal WoodkWAh/so kg/mo Lt/mo kg/m kg/mo
Expenditure1987Very Low NA 0.0 1S 0.5 67Low NA 0.0 23 0.7 41Moderate NA 0.2 29 0.6 25High NA 0.8 34 0.5 15Very NHgh NA 5.2 33 0.5 8
All NA 0.8 26 0.6 34
1984Very Low NA 0.0 18 0.4 59Low NA 0.0 29 0.7 33Moderate NA 0.0 35 0.7 20High NA 0.2 40 0.5 12Very High NA 2.2 43 0.4 7
All NA 0.3 31 0.5 29
1981Very Low NA 0.0 28 0.4 50Low NA 0.0 37 1.0 30Moderate NA 0.0 37 1.1 22High NA 0.2 45 0.9 16Very High NA 1.3 51 0.6 8
All NA 0.2 39 0.8 28
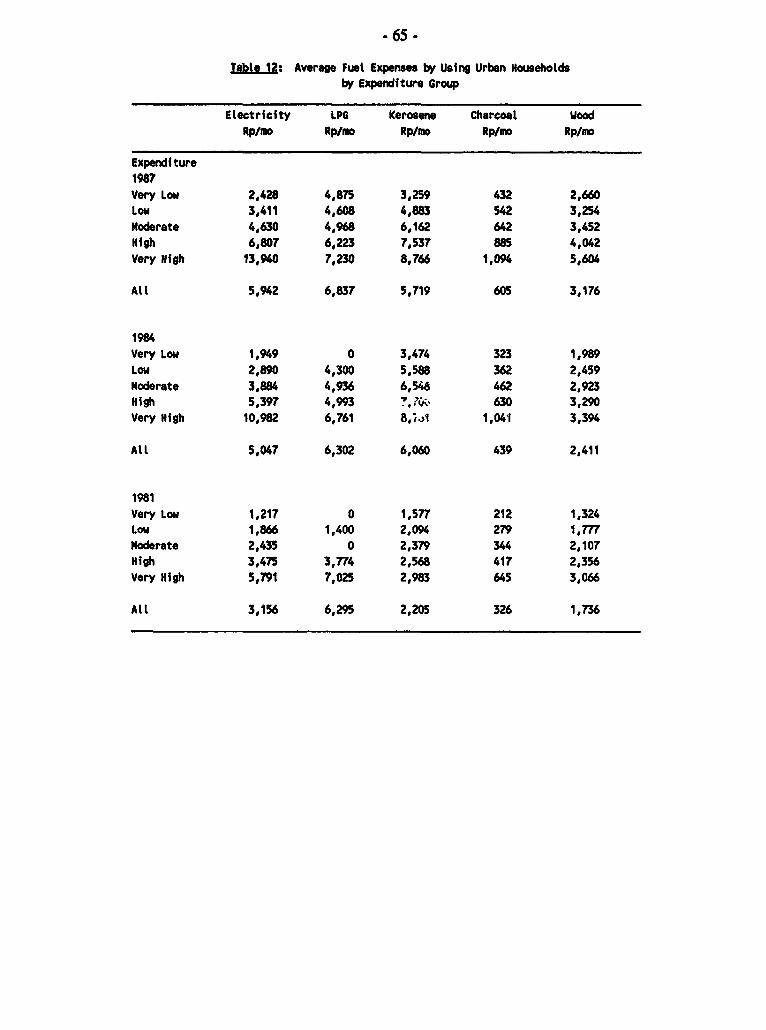
* 65 -
Table 12: Average Fuel Expenses by Using Urban Householdsby Expenditure Group
Etectricity LPG Kerosene Charcoal WoodRpImo Rp/mo Rp/mo Rp/mo Rp/mo
Expenditure1987
Very Low 2,428 4,875 3,259 432 2,660Low 3,411 4,608 4,883 542 3,254
Moderate 4,630 4,968 6,162 642 3,452
High 6,807 6,223 7,537 885 4,042Very Nigh 13,940 7,230 8,766 1,094 5,604
All 5,942 6,837 5,719 605 3,176
1984
Very Low 1,949 0 3,474 323 1,989
Low 2,890 4,300 5,588 362 2,459
Moderate 3,884 4,936 6,546 462 2,923High 5,397 4,993 '(4' 630 3,290
Very High 10,982 6,761 8,;41 1,041 3,394
All 5,047 6,302 6,060 439 2,411
1981Very Lou 1,217 0 1,577 212 1,324Low 1.866 1,400 2,094 279 1,77
Moderate 2,435 0 2,379 344 2,107
High 3,475 3,774 2,568 417 2,356
Very High 5,791 7,025 2,983 645 3,066
All 3,156 6,295 2,205 326 1,736
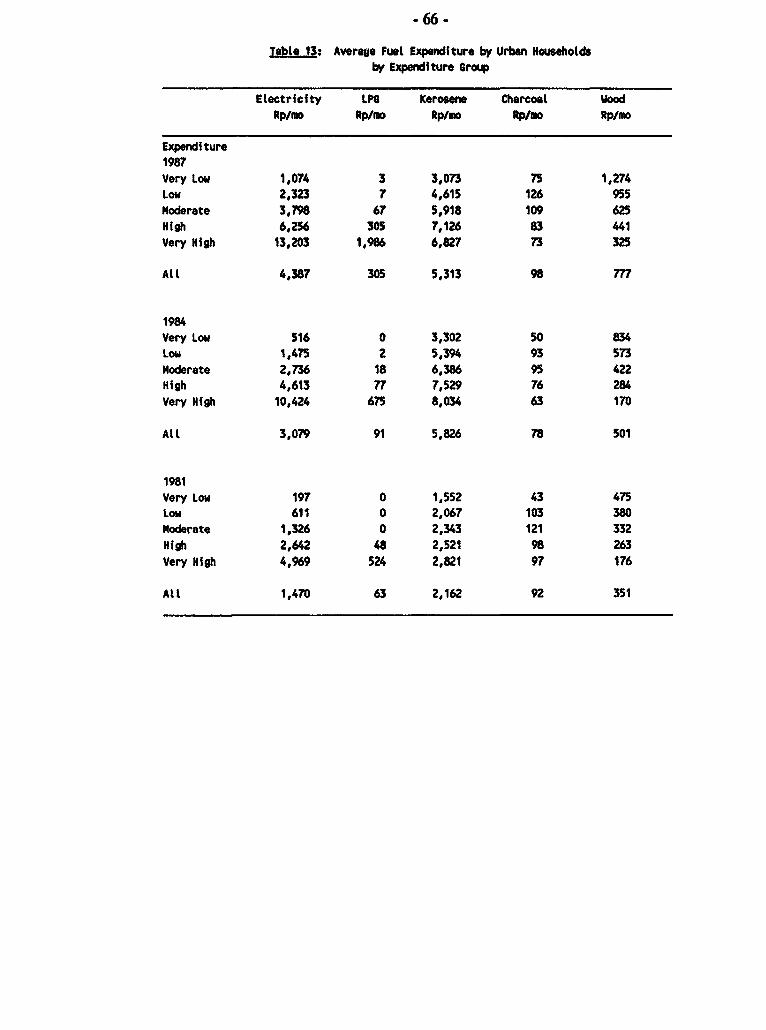
-66-
Table 13: Average Fuel Expenditure by Urban Householdsby Expenditure Group
Electricity LPG Kerosene Charcosl WoodRp/mo Rp/mo Rp/mo Rp/mo Rp/mo
Expenditure1987Very Low 1,074 3 3,073 75 1,274Low 2,323 7 4,615 126 955Moderate 3,798 67 5,918 109 625High 6,256 305 7,126 83 "IVery High 13,203 1,986 6,827 73 325
Alt 4,387 305 5,313 98 777
1984Very Low 516 0 3,302 50 834LoW 1,475 2 5,394 93 573Moderate 2,736 18 6,386 95 422High 4,613 77 7,529 76 284Very High 10,424 675 8,034 63 170
All 3,079 91 5,826 78 501
1981Very Low 197 0 1,552 43 475Low 611 0 2,067 103 380Moderate 1,326 0 2,343 121 332High 2,642 48 2,521 98 263Very High 4,969 524 2,821 97 176
All 1,470 63 2,162 92 351
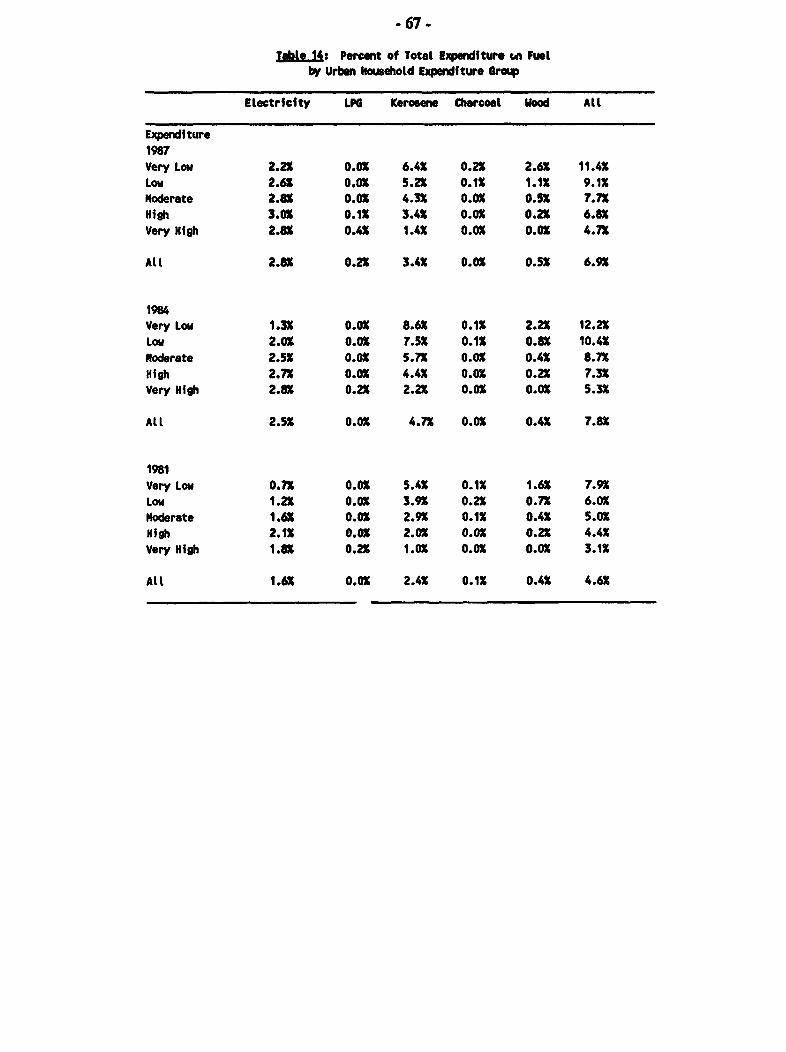
- 67.
Tabie 14: Percent of Total Expenditure ia Fuelby Urban household Expenditure Group
Electricity LPG Kerosene Charcoal iood All
Expenditure1987Very Low 2.2% 0.0% 6.4% 0.2% 2.6% 11.4%Low 2.6X O.OX 5.2% 0.1% 1.1% 9.1%Noderate 2.8X 0.0% 4.3% 0.0% 0.5% 7.7%Nigh 3.0% 0.1% 3.4% 0.0% 0.2% 6.8%Very High 2.8% 0.4% 1.4% 0.0% 0.0% 4.7%
Alt 2.8% 0.2X 3.4% 0.0% 0.5% 6.9X
1984Very Low 1.3% 0.0% 8.6% 0.1% 2.2% 12.2%Low 2.0% 0.0% 7.5% 0.1% 0.8% 10.4%Moderate 2.5% 0.0% 5.7% 0.0% 0.4% 8.7%High 2.7% 0.0% 4.4% 0.0% 0.2% 7.3%Very High 2.8X 0.2% 2.2% 0.0% 0.0% 5.3%
Att 2.5% 0.0% 4.7% 0.0% 0.4% 7.8X
1981Very Low 0.7% 0.0% 5.4% 0.1% 1.6% 7.9%Low 1.2% 0.0% 3.9% 0.2% 0.7% 6.0%Moderate 1.6X 0.0% 2.9% 0.1% 0.4% 5.0%High 2.1% O.OX 2.0% 0.0% 0.2% 4.4%Very High 1.8% 0.2% 1.0% 0.0% 0.0% 3.1%
Att 1.6X 0.0% 2.4% 0.1% 0.4% 4.6%
.68 -
APPENDIX I
KEROSENE STOVE PERFORMANCE AND USE IN INDONESIA:
PROPOSAL FOR A PILOT KEROSENE STOVE IPROVEMENT PROGRAM
FEBRUARY 1990
* 69 .
TABLE OF CONTENTS
I. BACKGROUND AND INTRODUCTION ........ ......................... 71
II. STOVE TECHNOLOGY ........................................... . 73Introduction ..................................................... 73Stove Types ..................................................... 74Power and Efficiency: Laboratory Stove Tests ....... ..................... 74Safety ..... 77Modifications ............................................. 79
HI. THE COOKING PROCESS .. ......................................... 81Controled Cooking Tests ........................................... 81Household Monitoring ..................... ........................ 83
IV. HOUSEHOLD STOVE CHOICE ...................................... 87
V. KEROSENE STOVE PRODUCION AND MARKETING ................ .... 89Factory Production ................................................ 89
Design .................................................... 89Production Technology ........................................ 90Economics ................................................. 90Adaptability . . . .............. 90
Artisanal Production ................... 91Design.. ... ............... 91Production Technology ........................................ 91Economics . . . .............. 91Adaptability . . . .............. 92
Stove Market .................... 92
VI. PROPOSED KEROSENE STOVE PILOTPROGRAM ...................... 94Standards, Endorsements and Factory Stove Improvement ................... 95
Two Region Program (First 18 months) ........................... 96Expand to all Cities over 500,000 in Population (Second 18 Months) ..... 97
Artisanal Stove lnprovement ........... ............................. 97Kerosene Stove Research ............ ............................... 98Consumer Awareness/Involvement .................................... 99
VII. EVALUATION OF THE PROPOSED KEROSENE STOVE PILOT PROGRAM .. 100Summary of Findings .............................................. 100Kerosene Use Projection ............................................ 100Program-specific Assumptions ........................................ 102
Program Budget ............................................. 104Economic Evaluation ............................................... 105
- 70-
Conversion Factors .......................................... 105Costs .................................................. . 106Beneefts ................................................... 106Government Budget and Balance of Payments ...................... 106
Financial Analysis ................................................. 108
VIII. LPGAND BIOFUELSTOVE POLICY ................................ 109
ANNEXESAnnex 1: Quality and Test Procedures for Kerosene Wick Stoves ........ ........... 111Annex 2: The Kerosene Stove Market in Jakarta ............................... 114
TABLESTable 5.1: Estimated Share of the Different Stoves Sold on Jakarta
Markets and the Number of Different Types in Each Group ..... ......... 93Table 7.1: Urban Stove Market Projections ................................... 103Table 7.2: Stove Improvement Program Budget (US$ millions) ..................... 104Table 7.3: Conversion Factors . ............................................ 105Table 7.4: Economic Evaluation of Kerosene Stove Pilot Program .................. 107Table 7.5: Financial Evaluation of Kerosene Stove Pilot Program ................... 108
FIGURESFigure 2.1: Power and Efficiency of Indonesian Stoves ........................... 76Figure 2.2: Efficiency and Price of Indonesian Stoves ............................ 77Figure 2.3: Burner Configuration and Efficiency of Indonesian Stoves ..... .......... 78Figure 2.4: Effects of Simple Improvements on Efficiency and Power ................ 80Figure 3.1: Controlled Cooking Test Results: Specific Fuel Consumption ..... ........ 81Figure 3.2: Stove Power and Cooking Time ................................... 83Figure 3.3: Household Members and Rice Consumption ......................... 85Figure 3A: Household Members and Kerosene Use ............................. 86Figure 4.1: Present Value of Kerosene Conservation ............................ 87
- 71 -
I. BACKGROUND AND INTRODUCrION
1.1 An effective program to upgrade existing kerosene stoves is economically desirable,and would have a significant impact on both household (particularly women's) welfare and nationaloil consumption. The stove analysis undertaken for this project has uncovered important technicalpossibilities for stove improvement. There are numerous non-technical obstacles to improvingkerosene stoves, however. The challenge facing any kerosene stove program will be in translatingthe large technological and economic opportunities into actual improvements in the cooking stoves.
1.2 In 1986, roughly one seventh of Indonesia's consumption of refined oil products wasconsumed in kerosene stoves, most of which were used by urban households. At a price of US$18a barrel, these 135 Petajoules of kerosene per annum would be worth over US$400,000,000. Thisis more, in both energy and value terms, than the total consumption of petroleum products forelectricity generation in 1986 by the public electricity company (PLN).
1.3 Kerosene is used as a cooking fuel by about 75% of urban households in Indonesia.For most urban households, kerosene is a major expenditure item: many low income householdsprobably spend more on kerosene than on any other commodity except rice. Between 1981 and1984, in response to economic pressures, the Government of Indonesia (GOI) more than doubledthe real price of kerosene, bringing it more in line with international prices. Following these priceincreases, national kerosene consumption declined 6% in 1984,3% in 1985 and remained constantthrough 1986.
1.4 There are four reasons why the fuel use of kerosene stoves can still be expected tobe uneconomically high. First, consumers purchasing a stove cannot ascertain its fuel-economy,either through physical inspection or reputation. Second, stove producers are also ignorant of theirstoves' fuel economy, and are generally too small scale to engage in research and development toimprove fuel-economy. Third, the habits of both consumers and producers developed under lowprice conditions, and have not fully adjusted to existing prices. Fourth, kerosene remainssubsidized.
1.5 Stoves are produced both in factories and by household industry, or artisans.Factories produce between 5,000 and 100,000 stoves per annum, and generally use presses to makemany of the stove parts from new materials. Artisans can produce as little as three hundred stovesper annum, though artisanal complexes also exist, producing up to about 5 thousand. Artisanstypically use old metal sheeting, and can be severely constrained by the availability of thesematerials. The artisans rarely use a press.
1.6 Test results indicate that the efficiency and quality of the kerosene stoves used inIndonesia varies considerably, although the majority are wick stoves of similar design. Many stovesare of low efficiency, and there is little relation between stove price or producer type and efficiency.
- 72 -
The technical changes required to save kerosene and/or increase the power of most existingkerosene stoves are simple 1/, and need not be expensive.
1.7 The economics of kerosene cooking suggest that a 5% change in a stove's keroseneconsumption would be worth over Rp 4,000 to a typical consumer, assuming a discount rate of10%. The additional production costs of achieving such a change through efficiency improvementswould, for most stoves, be considerably less. For example, a 300 Rp (or less) air-flow controlleromitted in most artisanal stoves could lead to efficiency improvements of up to 19%, leading to anaverage kerosene conservation of between 6 and 3% (and in the latter case faster cooking).
1.8 Simple behavioral changes can save considerable amounts of kerosene, but may alsorequire some facilitating technical changes. For example, many households boil and steam rice atthe same high power, although, for a wide power range, power has no perceptible effect on thespeed of rice steaming or the quality of the cooked rice. Turning down the power during the ricesteaming phase could save up to 12% of daily kerosene used in cooking. Assuming this turn downoperation required a minute of the cooks time, the return would be 1000 Rupiah per hour: 5 timesthe average wage. On the other hand, if it required that the stove be monitored for the whole 15minute steaming phase because of flame instability at low power, the return would only be 65Rupiah per hour. In short, the ease with which low power cooking can be carried out is intertwinedwith cooking behavior and fuel economy.
1.9 The effects of technical and behavioral changes are also interdependent. For atypical meal, an increase in efficiency from 41% to 45% will save 3% of the kerosene if the stovecontinues to be used at the same power setting. If the power is reduced by 10%, so that the heatdelivered to the pan remains as it was before the efficiency increase, this same efficiency increasewill save 6% of the kerosene. Cooking tests performed in the laboratory indicate that the smallersavings are probably more realistic, although it is possible that long run adjustments would lead tolarger savings. Except where otherwise mentioned, efficiency changes will be assumed to have thesmaller effect.
1.10 Prior to this study, research on kerosene stoves already indicated the diverseperformance of stoves on the Indonesian market. With this study, it has been possible to betteridentify some of the key determinants of stove performance. Furthermore, a better understandingof household needs and desires has been obtained. It is now appropriate to move beyond thelaboratory and the survey, and to work with the producers and users of kerosene stoves.
./ An increase in the tchnolog efficiency of a stove means mom heat is delivered to the pan for a given amount ofkerosene. If the powerof stove operation is not adjusted down commensurately, thefuel savings will not mefea thefultincrase in efficiency, especiallyforopetonssuch assteamning wherein higherpowergoes agely to produce moa wasteheat.
- 73 -
II. STOVE TECHNOLOGY
Introduction
2.1 This chapter reviews generic kerosene and LPG stove features, summarizes theresults of the stove tests undertaken for the UHESS, and describes the stove modificationsundertaken in an effort to improve kerosene stove performance. The kerosene stove analysisdemonstrates the large potential for improving kerosene stoves with minor modifications.
2.2 The nature of kerosene stoves is such that both power and efficiency can varysignificantly among stoves. LPG stoves, on the other hand, can be expected to vary considerablyin power, but relatively little in efficiency. For this reason, and given the dominance of keroseneas the major urban cooking fuel, the bulk of the work was on kerosene stoves.
2.3 Past work on testing kerosene stoves in Indonesia already supplied informationabout the characteristics of the types available in the market. Kerosene cookers, used in about 80%of the urban Indonesian kitchens, all have a comparable basic design. Differences are not essentialand relate to cooking speed and type of material used. But these apparently minor differencescause the performance to vary widely. Fires due to exploding stoves are common and can beprevented by better designs. Past tests also reveal the existence of a wide range in power andefficiency. The wide variation in their fuel use implied by these results suggests a large scope forimprovements.
2.4 However, prior to the UHESS, these test results were never thoroughly analyzedwith respect to how performance is influenced by the stove design. In the work described in arecent World Bank report v/ a first attempt was made to link design features to performance for20 stoves from all over the world. For the UHESS, the stove work was aimed at extending thisinsight into the determinants of the performance of Indonesian stoves.
2.5 Lemigas conducted extensive testing on the performance of 18 kerosene and 2 LPGstoves. The work consisted of a detailed description of the stove followed by a series ofperformance tests. First the power of the stove was determined by weighing the fuel use in halfan hour. This was followed by an efficiency test, where the percentage heat which is utilized isobtained. Each efficiency test lasted one hour and was repeated three times to decrease errors.Finally, safety was evaluated by a five hour long test during which the temperatures of differentstove parts, including the kerosene, were monitored. This resulted in an overall picture of thequality of each stove, concerning both fuel use and safety aspects. The wide variation inperformance was again confirmed.
2.6 An analysis of the stove test results indicates that, controlling for pan size, morecompact burners are more efficient. Alternatively, pan supports with rings touching the pan appearto result in lower efficiency. On the other hand, no strong relationship appears to exist between:
i/ Sowre: Test Results on Kerosene and OrherStovesforDeveloping Countnes: Energ Depatment PaperNo.27, August1985, The Wotfd Bank
- 74.
1) efficiency and power; 2) price and efficiency; 3) producer type and efficiency, or; 4) age andefficiency.
2.7 In collaboration with a visiting stove expert, several attempts were made to improvethe kerosene stoves tested. Two modifications were found to improve the efficiency of a numberof stoves. First, restricting the amount of air entering through the inner flameholder was found toincrease the efficiency of those stoves which did not already have a built-in flow-restrictor. Second,inverting the pan support was found to increase the efficiency of stoves whose pan supports hadrings touching the pans. The average percentage change in efficiency resulting from thesemodifications were 8% and 13% respectively 3/.
2.8 The LPG stove analysis was limited to two stoves. One was deemed typical ofcurrent LPG stoves used, while the other was chosen because of its low cost and expected lowpower. A wide power variation was indeed found, with the high power LPG stove being more thantwice as powerful, at maximum power, than the average for kerosene stoves. The low power gasstove, on the other hand, had a power comparable to most common kerosene stoves for reasonsdiscussed below.
Stove Types
2.9 Cotton wicks transport the kerosene from the tank to the flameholder. Thekerosene evaporates and burns in between the two cylinders of the flameholder. These cylindersare perforated to let air enter, causing the kerosene vapor to burn with an almost invisible blueflame. A wick adjustment lever allows the user to change the height of the wicks, therebyregulating the power. 4/ A shield surrounds the flameholder, both to prevent accidental touchingand also to decrease radiation losses. The pan is placed on top of the frame, often on a separatepan support.
2.10 Most gas stoves have two identical burners, one of which is shown in this figure.The gas flow can be changed with a regulator before it enters the venturi where it is mixed with air.With this particular type, the burner had two rings of holes. The gas supply to the outer ringsautomatically ceased at low power.
Power and Efficiency: Laboratory Stove Tests
2.11 The amount of fuel used over a certain period of time is called the stove power andis related to cooking time required. The higher the power the shorter the time to fulfil certaincooking tasks such as boiling water. For other dishes the cooking time is more or less fixed anddoes not depend on the power. Each stove has a range over which the power can be adjusted byregulating the fuel supply. When too much fuel is supplied, red flames appear, resulting in blackpans. The highest position giving blue flames is called the (blue flame) maximum power. As the
t/ All changes in effidency in this to ar relauiw changes. E.8, a 10% effiiency inemase means changingftrwm 40)% to44%.
1/ Actuao power adjustments dwing cooking ar somev*at difficdt. Not only ls it Sfficult to obsenve theflane, but atlow power the buwing process oten becomes igdrar and instable.
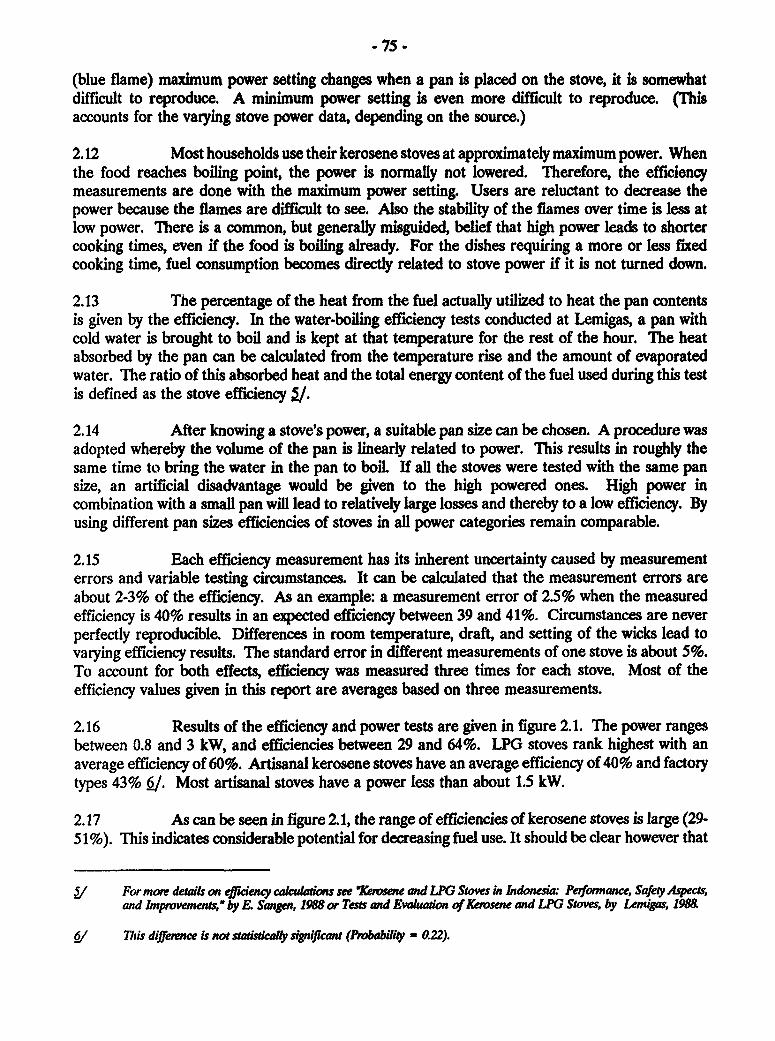
- 75 .
(blue flame) maximum power setting changes when a pan is placed on the stove, it is somewhatdifficult to reproduce. A minimum power setting is even more difficult to reproduce. (Thisaccounts for the vatying stove power data, depending on the source.)
2.12 Most households use their kerosene stoves at approximately maximum power. Whenthe food reaches boiling point, the power is normally not lowered. Therefore, the efficiencymeasurements are done with the maximum power setting. Users are reluctant to decrease thepower because the flames are difficult to see. Also the stability of the flames over time is less atlow power. There is a common, but generally misguided, belief that high power leads to shortercooking times, even if the food is boiling already. For the dishes requiring a more or less fixedcooking time, fuel consumption becomes directly related to stove power if it is not turned down.
2.13 The percentage of the heat from the fuel actually utilized to heat the pan contentsis given by the efficiency. In the water-boiling efficiency tests conducted at Lemigas, a pan withcold water is brought to boil and is kept at that temperature for the rest of the hour. The heatabsorbed by the pan can be calculated from the temperature rise and the amount of evaporatedwater. The ratio of this absorbed heat and the total energy content of the fuel used during this testis defined as the stove efficiency J/.
2.14 After knowing a stove's power, a suitable pan size can be chosen. A procedure wasadopted whereby the volume of the pan is linearly related to power. This results in roughly thesame time to bring the water in the pan to boiL If all the stoves were tested with the same pansize, an artificial disadvantage would be given to the high powered ones. High power incombination with a small pan will lead to relatively large losses and thereby to a low efficiency. Byusing different pan sizes efficiencies of stoves in all power categories remain comparable.
2.15 Each efficiency measurement has its inherent uncertainty caused by measurementerrors and variable testing circumstances. It can be calculated that the measurement errors areabout 2-3% of the efficiency. As an example: a measurement error of 2.5% when the measuredefficiency is 40% results in an expected efficiency between 39 and 41%. Circumstances are neverperfectly reproducible. Differences in room temperature, draft, and setting of the wicks lead tovarying efficiency results. The standard error in different measurements of one stove is about 5%.To account for both effects, efficiency was measured three times for each stove. Most of theefficiency values given in this report are averages based on three measurements.
2.16 Results of the efficiency and power tests are given in figure 2.1. The power rangesbetween 0.8 and 3 kW, and efficiencies between 29 and 64%. LPG stoves rank highest with anaverage efficiency of 60%. Artisanal kerosene stoves have an average efficiency of 40% and factorytypes 43% V/. Most artisanal stoves have a power less than about 1.5 kW.
2.17 As can be seen in figure 2.1, the range of efficiencies of kerosene stoves is large (29-5 1%). This indicates considerable potential for decreasing fuel use. It should be clear however that
g For more details on efciny calcutons see 'ioesene and LPG Stows in Indonesia Perfonnance, Safet Aspects,and Impromme, m by E. Sangen, 1988 or Tests and Evaluation of Kensene and LPG Stoves, by LAmigas, 1988
This diffeance is not staaly signipcant (Probabily = 0.22).
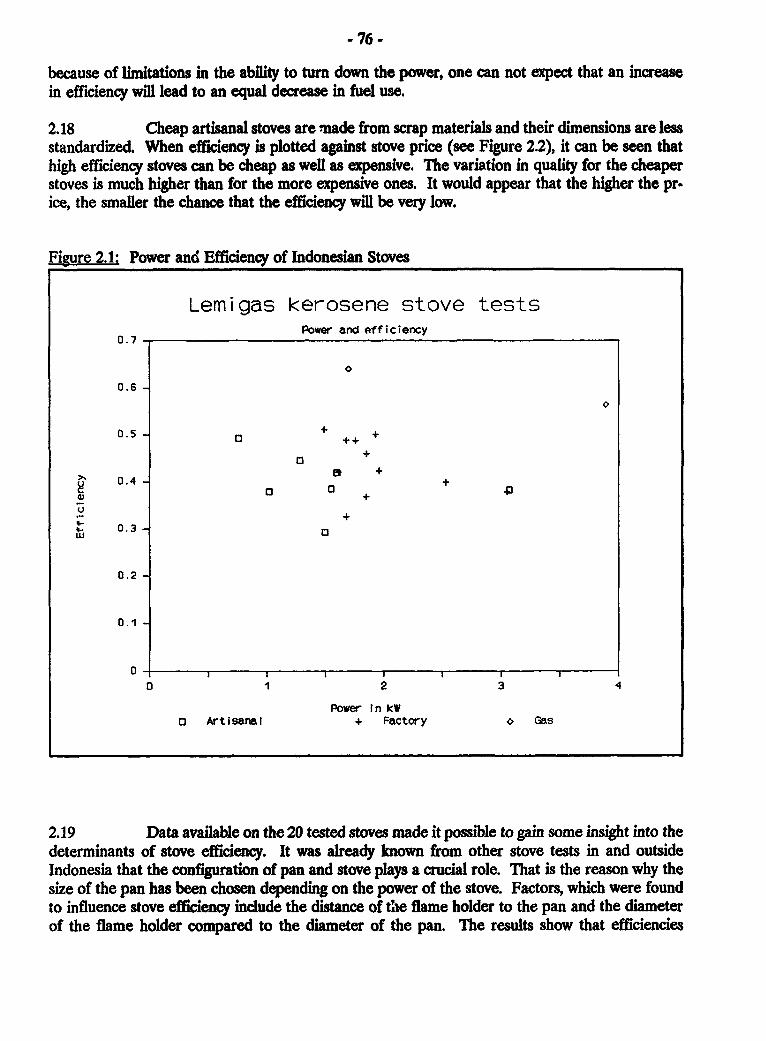
-76-
because of limitations in the ability to turn down the power, one can not expect that an increasein efficiency wil lead to an equal decrease in fuel use.
2.18 Cheap artisanal stoves are made from scrap materials and their dimensions are lessstandardized. When efficiency is plotted against stove price (see Figure 2.2), it can be seen thathigh efficiency stoves can be cheap as well as expensive. The variation in quality for the cheaperstoves is much higher than for the more expensive ones. It would appear that the higher the pr-ice, the smaller the chance that the efficiency wil be very low.
Figure 2.1: Power and Efficiency of Indonesian Stoves
Lemigas kerosene stove testsPower and officiency
0.6-
0.5 +0+ +
a ~~+
>1 0.4 i t +
+i- O0.3 _
0.2
0.1
0 - , . , , I
0 1 2 3 4
Power In kWo Artisanal + Factory o Gas
2.19 Data available on the 20 tested stoves made it possible to gain some insight into thedeterminants of stove efficiency. It was already known from other stove tests in and outsideIndonesia that the configuration of pan and stove plays a crucial role. That is the reason why thesize of the pan has been chosen depending on the power of the stove. Factors, which were foundto influence stove efficiency include the distance of the flame holder to the pan and the diameterof the flame holder compared to the diameter of the pan. The results show that efficiencies
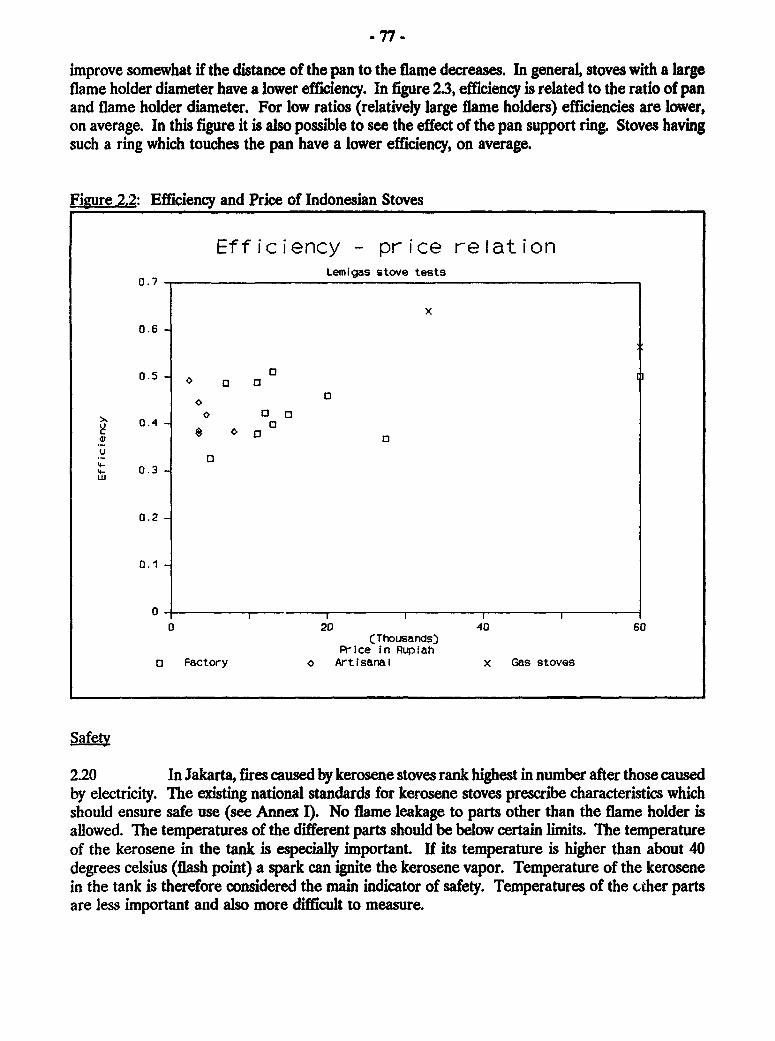
. 77 -
improve somewhat if the distance of the pan to the flame decreases. In general, stoves with a largeflame holder diameter have a lower efficiency. In figure 2.3, efficiency is related to the ratio of panand flame holder diameter. For low ratios (relatively large flame holders) efficiencies are lower,on average. In this figure it is also possible to see the effect of the pan support ring. Stoves havingsuch a ring which touches the pan have a lower efficiency, on average.
Figure 2.2: Efficiency and Price of Indonesian Stoves
Efficiency - price relation_.7 Lemigas stove tests
x
0.5
0.5 o 0
>' 0.4 - 0 03
Y 0
v
4- 0.3 -w
0.2 -
0.1
0 20 40 60(Thousands)
Price in Rupiah0 Factory o Artisanal x Gas stoves
Saety
2.20 In Jakarta, fires caused by kerosene stoves rank highest in number after those causedby electricity. The existing national standards for kerosene stoves prescribe characteristics whichshould ensure safe use (see Annex I). No flame leakage to parts other than the flame holder isallowed. The temperatures of the different parts should be below certain limits. The temperatureof the kerosene in the tank is especially important. If its temperature is higher than about 40degrees celsius (flash point) a spark can ignite the kerosene vapor. Temperature of the kerosenein the tank is therefore considered the main indicator of safety. Temperatures of the other partsare less important and also more difficult to measure.
* 78-
eigure 2.3: Burner Configuration and Efficiency of Indonesian Stoves
Effect of compactness of burneron the stove efficiency
0.68
0.5 _ 0
Do
Y~~~~~~~~~ XO0.4 0 X
0 ~~~~~~~~~~x0.3 -
'-
0.2 -
0.1O-
0 - I p III
0 1 2 3 4
Ratio pan/burner oiametero no ring x ring touches pan
2.21 Each kerosene stove was tested for a five hour period, during which it burned atmaximum power. Temperatures of the different parts were measured each hour. Flame stabilityand leakages were noted. Tests started with a half full tank, so that at the end of the five hourperiod about 10% of the original fuel volume was left over. The results of the temperaturemeasurements are shown in Annex m. (On the horizontal axis the percentage is given of the fuelwhich is higher than the 50°C limit allowed according to the safety standards at the time of themeasurement.) For a few stoves the safety tests had to be stopped because temperatures becameso high that the kerosene began to evaporate and started burning from the air vents.
2.22 The large variation in the temperature curves suggests that the current method ofburning until 10% of the fuel is left over is not optimaL Approximately three to four hours afterstarting, most curves are more or less horizontaL To improve reproducibility it might be better touse a three hour period in combination with a lower temperature, e.g. 45 degrees celsius.
2.23 Some of the other requirements for the standards were fulfilled by all the stoves.For all tested stoves, the thickness of the tank material is higher than the prescribed minimum of
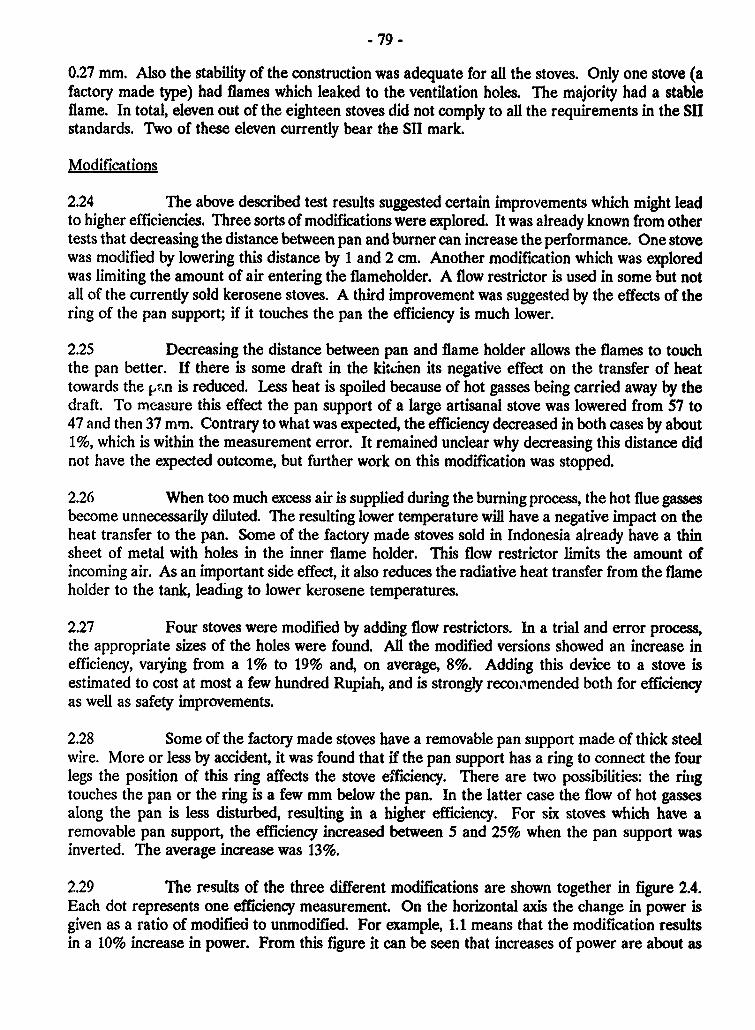
- 79 -
0.27 mm. Also the stability of the construction was adequate for ali the stoves. Only one stove (afactory made type) had flames which leaked to the ventilation holes. The majority had a stableflame. In total, eleven out of the eighteen stoves did not comply to all the requirements in the SIIstandards. Two of these eleven currently bear the SII mark.
Modifications
2.24 The above described test results suggested certain improvements which might leadto higher efficiencies. Three sorts of modifications were explored. It was already known from othertests that decreasing the distance between pan and burner can increase the performance. One stovewas modified by lowering this distance by 1 and 2 cm. Another modification which was exploredwas limiting the amount of air entering the flameholder. A flow restrictor is used in some but notall of the currently sold kerosene stoves. A third improvement was suggested by the effects of thering of the pan support; if it touches the pan the efficiency is much lower.
2.25 Decreasing the distance between pan and flame holder allows the flames to touchthe pan better. If there is some draft in the kitcnen its negative effect on the transfer of heattowards the pan is reduced. Less heat is spoiled because of hot gasses being carried away by thedraft. To measure this effect the pan support of a large artisanal stove was lowered from 57 to47 and then 37 mm. Contrary to what was expected, the efficiency decreased in both cases by about1%, which is within the measurement error. It remained unclear why decreasing this distance didnot have the expected outcome, but further work on this modification was stopped.
2.26 When too much excess air is supplied during the burning process, the hot flue gassesbecome unnecessarily diluted. The resulting lower temperature will have a negative impact on theheat transfer to the pan. Some of the factory made stoves sold in Indonesia already have a thinsheet of metal with holes in the inner flame holder. This flow restrictor limits the amount ofincoming air. As an important side effect, it also reduces the radiative heat transfer from the flameholder to the tank, leadi'g to lower kerosene temperatures.
2.27 Four stoves were modified by adding flow restrictors. In a trial and error process,the appropriate sizes of the holes were found. All the modified versions showed an increase inefficiency, varying from a 1% to 19% and, on average, 8%. Adding this device to a stove isestimated to cost at most a few hundred Rupiah, and is strongly recoi.1mended both for efficiencyas well as safety improvements.
2.28 Some of the factory made stoves have a removable pan support made of thick steelwire. More or less by accident, it was found that if the pan support has a ring to connect the fourlegs the position of this ring affects the stove efficiency. There are two possibilities: the ringtouches the pan or the ring is a few mm below the pan. In the latter case the flow of hot gassesalong the pan is less disturbed, resulting in a higher efficiency. For six stoves which have aremovable pan support, the efficiency increased between 5 and 25% when the pan support wasinverted. The average increase was 13%.
2.29 The results of the three different modifications are shown together in figure 2.4.Each dot represents one efficiency measurement. On the horizontal axis the change in power isgiven as a ratio of modified to unmodified. For example, 1.1 means that the modification resultsin a 10% increase in power. From this figure it can be seen that increases of power are about as
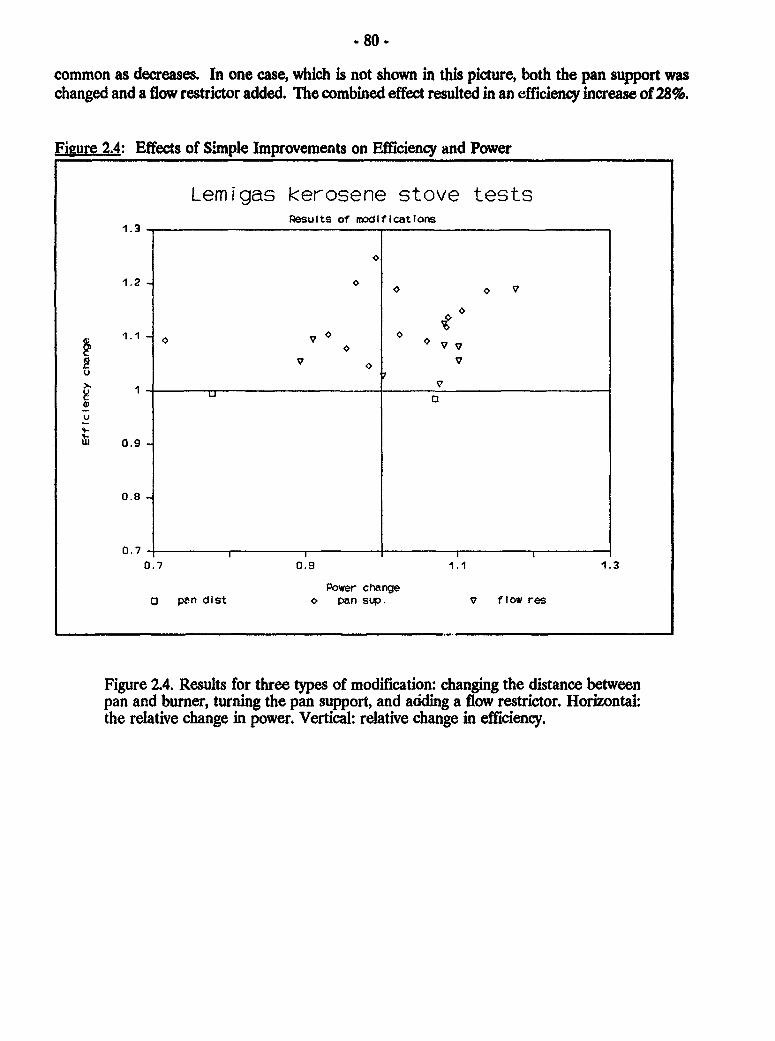
* 80.
common as decreases. In one case, which is not shown in this picture, both the pan support waschanged and a flow restrictor added. The combined effect resulted in an efficiency increase of 28%.
Figure 2.4: Effects of Simple Improvements on Efficiency and Power
Lemigas kerosene stove testsResults of modifications
1.3
e~~~~~~~~~~~~~~~~~? VV
0.9_ r X l .8 a
0.7-0.7 0.9 1.1 1.3
Power changea pen list o pan sup. v flow res
Figure 2A. Results for three types of modification: changing the distance betweenpan and burner, turning the pan support, and adding a flow restrictor. Horizontal:the relative change in power. Vertical: relative change in efficiency.
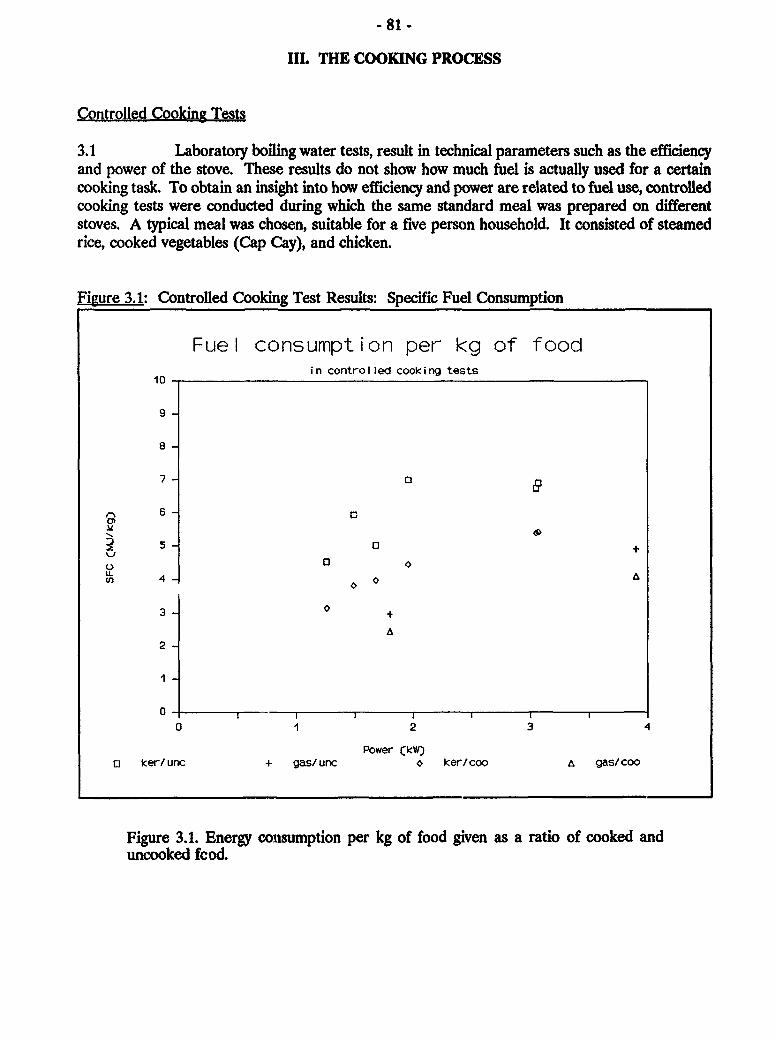
- 81 -
IIL THE COOKING PROCESS
Controlled Cooking Tests
3.1 Laboratory boiling water tests, result in technical parameters such as the efficiencyand power of the stove. These results do not show how much fuel is actually used for a certaincooking task. To obtain an insight into how efficiency and power are related to fuel use, controlledcooking tests were conducted during which the same standard meal was prepared on differentstoves. A typical meal was chosen, suitable for a five person household. It consisted of steamedrice, cooked vegetables (Cap Cay), and chicken.
Figure 3.1: Controlled Cooking Test Results: Specific Fuel Consumption
Fuel consumption per kg of foodin controlled cooking tests
109 -
8
7 13 e9
6-
i 5
5 004.
en 4 o °
3 O +
A2
1
0 1 2 3 4
Power CkW)o ker/unc + gas/unc o ker/coo a gas/coo
Figure 3.1. Energy consumption per kg of food given as a ratio of cooked anduncooked fcod.
- 82 -
3.2 Rice was prepared in two stages. First it was brought to boil with a sufficientamount of water. It was allowed to boil for about five minutes until all the water was absorbed.A steamer takes the place of the pan. After the water started boiling, the rice was put in the uppercompartment of the steamer, where it remained for about 20 minutes 2/. A wok was used toprepare both vegetables and chicken in a process which is a combination of frying and boiling.
3.3 The energy needed for cooking the meal can be presented as a ratio of the totalenergy divided by the weight of the food, to correct for small differences among the ingredients.Two ratios can be calculated, one based on the amount of dry food and the other on the amountof cooked food. Both are shown in figure 3.1 for the results of eight tests. From this graph it canbe seen that the higher the power the higher the fuel consumption. Though the gas stoves have asomewhat lower energy consumption, they also show this relation of higher consumption with higherpower. As expected, the data using the dry food ratio are above those for cooked food.
3.4 Contrary to original expectations, It was found that fuel use did not depend on theefficiency. A graph of the data showed no trends, and this was confirmed by statistical analysis V/.The absence of a dependence on the efficiency is caused by the fact that this dish, like most dishes,require a more or less fixed cooking time. From the in-depth household interviews, it was foundthat it is not common to turn down the power of a stove when the contents boil. If used at a const-ant power, the fuel use of a stove becomes directly related to the power.
3.5 Figure 3.2 shows that the cooking time depends only slightly on the power. For thekerosene stoves, with power ratings varying by a factor of 2, the cooking time varies only about20%. Both gas stoves allowed for fast cooking. Though this could be inherent to gas stoves, itmight also be caused by the expectation of the cook to be able to cook faster.
3.6 Besides the meals also water is heated on the stove, not only for drinking but some-times also for bathing. Because heating water is essentially what happens during the water boilingefficiency tests these data could be used to calculate an average daily energy consumption in casekerosene is used for cooking. It was assumed that daily amount of food cooked is twice the amountused in the controlled cooking tests. This meal is prepared once, after which it is reheated.Calculating the daily energy needs results in:
Etot = 6.6 + 3.8 * Power + 3.2 / eta [MJ/day]
Eta is here the efficiency. For typical values of efficiency and power, about 1/3 of the energyconsumption is constant, 1/3 depends on the power and another 1/3 on the efficiency. For examplean efficiency increase of 30% can be expected to result in a decrease of 10% of the daily cookingenergy consumption. When this efficiency improvement is accompanied by a 30% decrease inpower, a daily fuel consumption decrease of 20% can be expected. The cooking time will remain
Z/ The household survey indicates that this is the most common way to prepac nice in wban areas. About 70% ofhouseholds use a steaner, while 24% use only a pan.
I/ Multiple regression on the data of the sikerosenestoves resudted in an insignificant value (t = -066 probabi'ity = 0.56)of the pammeter for the efficiency.
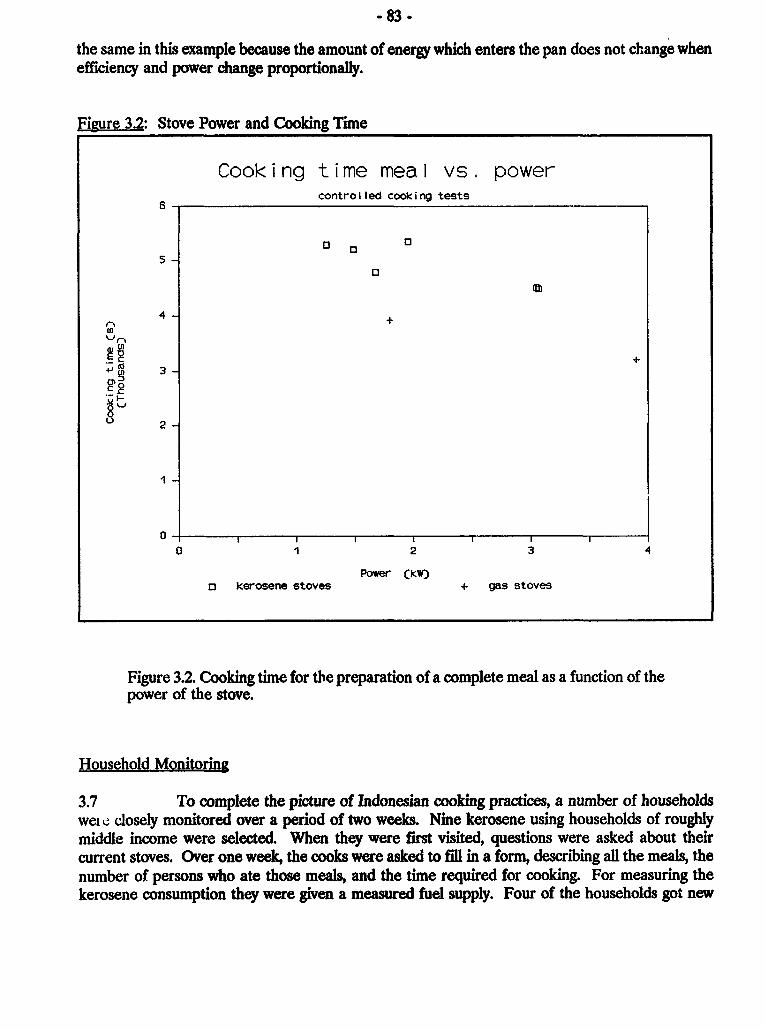
*83 -
the same in this example because the amount of energy which enters the pan does not change whenefficiency and power change proportionally.
Figure 3.2: Stove Power and Cooking Time
Cook i ng t i me mea I vs. powercontrolled cooking tests
0 0
0
4 ~~~~~~~~+
+
6T
'D~~~~~~~~~~1
2 -+
2-
I -
0- l I I I I I0 1 2 3 4
Power CkW)o kerosene stoves + gas stoves
Figure 3.2. Cooking time for the preparation of a complete meal as a function of thepower of the stove.
Household Monitoring
3.7 To complete the picture of Indonesian cooking practices, a number of householdswel c closely monitored over a period of two weeks. Nine kerosene using households of roughlymiddle income were selected. When they were first visited, questions were asked about theircurrent stoves. Over one week, the cooks were asked to fill in a form, describing all the meals, thenumber of persons who ate those meals, and the time required for cooking. For measuring thekerosene consumption they were given a measured fuel supply. Four of the households got new
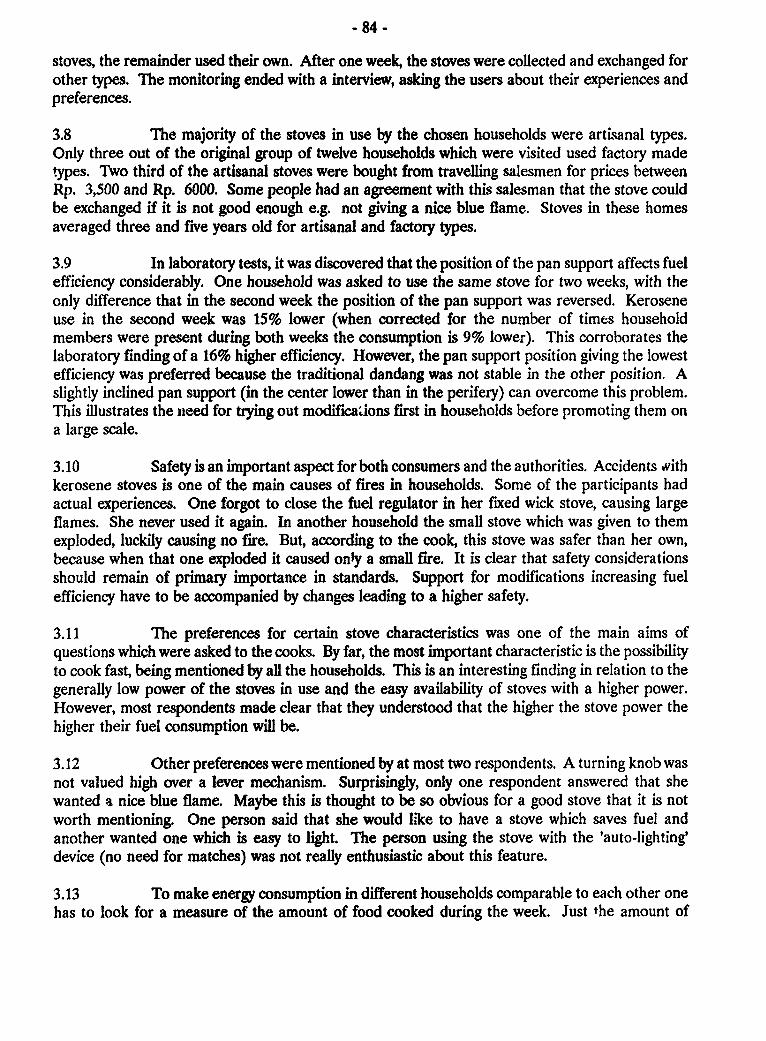
-84-
stoves, the remainder used their own. After one week, the stoves were collected and exchanged forother types. The monitoring ended with a interview, asking the users about their experiences andpreferences.
3.8 The majority of the stoves in use by the chosen households were artisanal types.Only three out of the original group of twelve households which were visited used factory madetypes. Two third of the artisanal stoves were bought from travelling salesmen for prices betweenRp. 3,500 and Rp. 6000. Some people had an agreement with this salesman that the stove couldbe exchanged if it is not good enough e.g. not giving a nice blue flame. Stoves in these homesaveraged three and five years old for artisanal and factory types.
3.9 In laboratory tests, it was discovered that the position of the pan support affects fuelefficiency considerably. One household was asked to use the same stove for two weeks, with theonly difference that in the second week the position of the pan support was reversed. Keroseneuse in the second week was 15% lower (when corrected for the number of times householdmembers were present during both weeks the consumption is 9% lower). This corroborates thelaboratory finding of a 16% higher efficiency. However, the pan support position giving the lowestefficiency was preferred because the traditional dandang was not stable in the other position. Aslightly inclined pan support (in the center lower than in the perifery) can overcome this problem.This illustrates the need for trying out modifica.ions first in households before promoting them ona large scale.
3.10 Safety is an important aspect for both consumers and the authorities. Accidents withkerosene stoves is one of the main causes of fires in households. Some of the participants hadactual experiences. One forgot to close the fuel regulator in her fixed wick stove, causing largeflames. She never used it again. In another household the small stove which was given to themexploded, luckily causing no fire. But, according to the cook, this stove was safer than her own,because when that one exploded it caused only a small fire. It is clear that safety considerationsshould remain of primary importance in standards. Support for modifications increasing fuelefficiency have to be accompanied by changes leading to a higher safety.
3.11 The preferences for certain stove characteristics was one of the main aims ofquestions which were asked to the cooks. By far, the most important characteristic is the possibilityto cook fast, being mentioned by all the households. This is an interesting finding in relation to thegenerally low power of the stoves in use and the easy availability of stoves with a higher power.However, most respondents made clear that they understood that the higher the stove power thehigher their fuel consumption will be.
3.12 Other preferences were mentioned by at most two respondents. A turning knob wasnot valued high over a lever mechanism. Surprisingly, only one respondent answered that shewanted a nice blue flame. Maybe this is thought to be so obvious for a good stove that it is notworth mentioning. One person said that she would like to have a stove which saves fuel andanother wanted one which is easy to light. The person using the stove with the 'auto-lighting'device (no need for matches) was not really enthusiastic about this feature.
3.13 To make energy consumption in different households comparable to each other onehas to look for a measure of the amount of food cooked during the week. Just the amount of
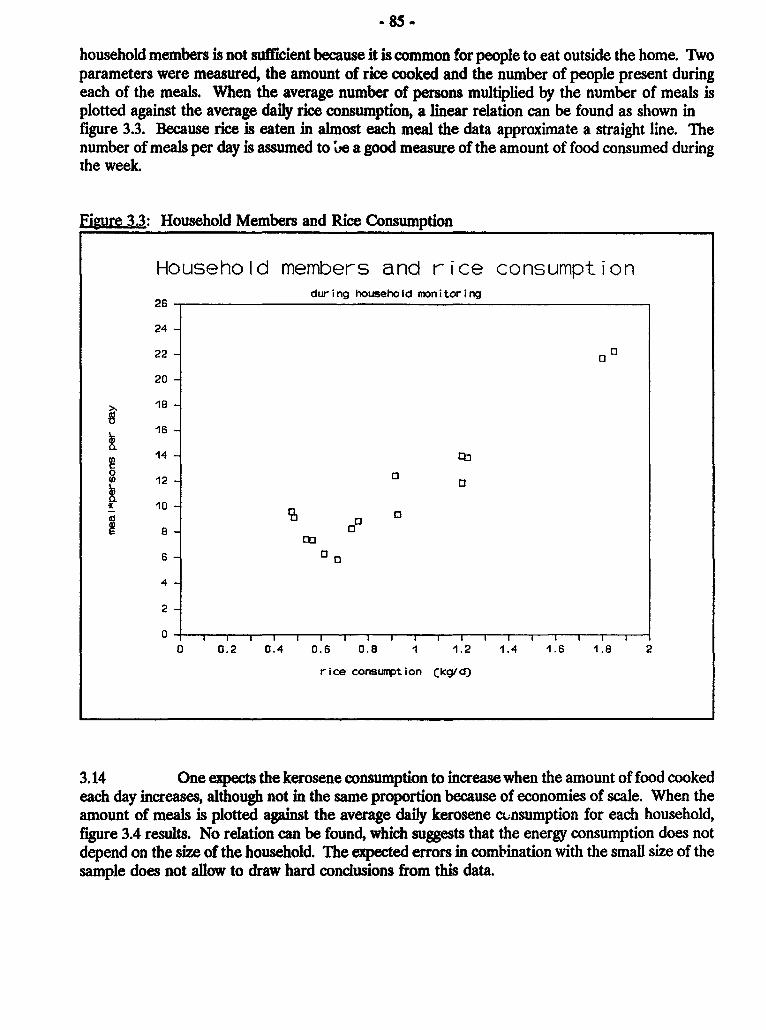
* 85 -
household members is not sufficient because it is common for people to eat outside the home. Twoparameters were measured, the amount of rice cooked and the number of people present duringeach of the meals. When the average number of persons multiplied by the number of meals isplotted against the average daily rice consumption, a linear relation can be found as shown infigure 3.3. Because rice is eaten in almost each meal the data approximate a straight line. Thenumber of meals per day is assumed to ve a good measure of the amount of food consumed duringthe week.
Figuare 33: Household Members and Rice Consumption
Household members and rice consumption26 dur ing household monitoring
24-
22-or
20-
16-
14-C
0 0'fl 12 X
10 0 08~~~~~~~~
4
2
0 0.2 0.4 0.6 0.8 1 1.2 1.4 1.6 1.8 2
rice consumption Ckg/d)
3.14 One expects the kerosene consumption to increase when the amount of food cookedeach day increases, although not in the same proportion because of economies of scale. When theamount of meals is plotted against the average daily kerosene cunsumption for each household,figure 3.4 results. No relation can be found, which suggests that the energy consumption does notdepend on the size of the household. The expected errors in combination with the small size of thesample does not allow to draw hard conclusions from this data.
,86-
Eigure 3.4: Household Members and Kerosene Use
Household members and kerosene use2. during household monitoring
1.9
1.8
1.7
1.6
1.3
1.4
1 0 2- l1.
0.1 400 0~
0 0970
0.40.3
0.20.1
0 48 112 1'6 2024
meal-persons per day
3.15 Further statistical analysis proved to be fruitless. Energy consumption is not relatedin a simple manner to stove power and efficiency. A high (negative) correlation between householdsize and stove power makes it difficult to draw conclusions. The simple model to calculatehousehold kerosene consumption for cooking described above could not be validated. The averagedaily consumption of 0.85 liters of kerosene per day (for an average household size of 5.3) issomewhat higher than the simple model predicts (0.71 l/d). This can be explained by the fact thesome of the respondents used their stoves also to heat bathing water, which is not included in themodeL
3.16 A gas stove was given to one of the households who used a kerosene stove in thefirst week. The average daily energy consumption went down from 39.6 MJ/d to 21.6 MJ/d. Thisis caused by both the much higher efficiency (64% compared to 37%) as well as the possibility toturn down the gas stove. Her own fixed wick kerosene stove could not be regulated.
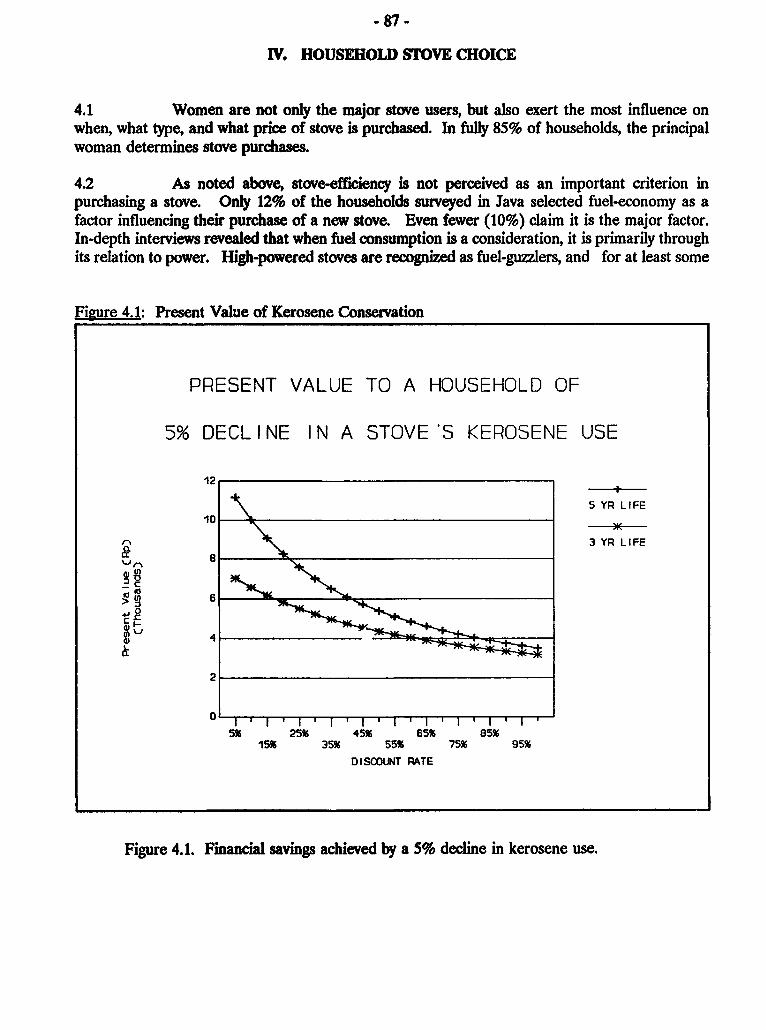
- 87 -
IV. HOUSEHOLD STOVE CHOICE
4.1 Women are not only the major stove users, but also exert the most influence onwhen, what type, and what price of stove is purchased. In fully 85% of households, the principalwoman determines stove purchases.
42 As noted above, stove-efficiency is not perceived as an important criterion inpurchasing a stove. Only 12% of the households surveyed in Java selected fuel-economy as afactor influencing their purchase of a new stove. Even fewer (10%) claim it is the major factor.In-depth interviews revealed that when fuel consumption is a consideration, it is primarily throughits relation to power. High-powered stoves are recognized as fuel-guzzlers, and for at least some
Figure 4.1: Present Value of Kerosene Conservation
PRESENT VALUE TO A HOUSEHOLD OF
5% DECLINE IN A STOVE'S KEROSENE USE
'12
5 YR LIFE10 -
3 YR LIFE
'-'I-'
+J04)~~~~
2
0 I ' i' I~ l ,1|
SX 25X 45X 65X 85X15% 35% 55% 75% 95%
D I SCOUNT RATE
Figure 4.1. Financial savings achieved by a 5% decline in kerosene use.
- 88 -
households the choice of stove is guided by a trade-off between the faster cooking of a high-powered stove and the lower kerosene use of a low-powered stove. 2/
4.3 Superficially, purchasers' neglect of efficiency (and more generally, fuel economy)appears economically irrational. At the extremely high discount rate of 100%, 10Q/ the present valueof a 5% decline in the kerosene consumption is over 2000 Rupiah, even if the stove only lasts twoyears. This is roughly oiie third the cost of a moderately priced stove. Given the wide v3riationin efficiency of stoves on the market, this would suggest that efficiency should be a very importantparameter in choosing a stove. Even under pessimistic assumptions, a 15% change in stoveefficiency should lead to a more than 5% change in kerosene consumption, and such differencesare commonplace.
4.4 Rather than irrationality, however, the most obvious explanation is a lack ofinformation. It is not possible to ascertain a stoves efficiency simply by examining its features 11/.Once in use, the large variation in the amount of cooking done easily hides a 5% change in averagekerosene consumption. Even when the Project provided measuring devices to monitor households'kerosene consumption, differences between stoves were swamped by other factors, along withremaining measurement problems. Briefly, under existing circumstances it would not be rationalfor a purchaser to use efficiency as a criterion for selecting stoves since s/he cannot know theefficiency.
4.5 Three important policy-relevant observations can be made from this analysis ofhousehold stove choice. First, attempts to promote more efficient stoves will not be supported byconsumers unless something is done to help consumers ascertain which stoves are efficient.Second, consumer preferences vary considerably, and no single stove design can satisfy all users.By implication, a program to improve existing stoves is likely to be more successful than one aimedat propagating particular models. Third, consumers are likely to be attracted to efficiencyimprovements in part because they allow faster cooking, although faster cooking dissipates someof the potential fuel economy of a more efficient stove. This has important implications for thepromotion of efficient stoves.
2/ This trade-off only etis because power adjustmew is not easy for most kerosene stoves.
j/ A 100% discount rate approimates tight cash flow constraints on many households a. exhibited by comnnon stovepurchasing pattens.
L/ All other things being equai a bue flame is more Mefflcient"than a yellow flame, and blue flpames aoprefemnd. Flamecolor is not a good indicator of stove efficiency, however.
- 89 -
V. KEROSENE STOVE PRODUCTION AND MARKETING
5.1 For a stove program it is indispensable to know something about how stoves areproduced, on what scale, and in what quantities. Furthermore, it is important to understand thestove marketing system. In this chapter, the differences in technology used by f-.ctories andartisans are described, and related to the opportunities for improving stove quality. This isfollowed by a discussion of the stove market. The discussion is limited to locally produced stoves,imports being insignificant.
5.2 Both factory and artisanal stove production are amenable to the modificationsdiscussed in Chapter II. Factories, being both larger scale and having more ready access to capital,are a more obvious target. Even the smallest artisanal producer should, however, be able to adda flow-restrictor and/or produce efficient pan supports. Furthermore, artisanal producers areoften clustered in one area, so;netimes all making the same model of stove.
5.3 Materials are the major cost for both factories and artisans. For artisans, reliabilityof material supply is also crucial. This could provide an opportunity for government assistance,linked to a stove improvement program. (Factory production, being more standardized, could beaffected through official stove standards.)
5.4 A small survey of the Jakarta market indicates that artisanal stoves account for about80% of sales, or, given shorter lifetimes, about 70% of the stoves used. The UHES survey showsthat 50-60% of the stoves used are artisanal types. More than half of the artisanal stoves are solddoor-to-door, making Standard Product Information sheets inappropriate. The payment schemesfor the door-to-door sales tend to involve very high implicit interest rates, suggesting that costlyimprovements are unlikely to be popular among artisanal stove buyers.
Factory Production
Design
5.5 An overwhelming variety of stove designs can be found in Indonesia. Round orsquare frames, using sheet metal or aluminum, and luring the potential buyer with a finish of paintor enamel. Though largely irrelevant for the performance, these features affect consumers'decisions on which type to buy. Factory made stoves have a standardized design, made possibleby the use of machinery such as presses. They can also be distiniguished from artisanal types bythe use of new materials, since most artisanal stoves are fabricated from scrap material.
5.6 l he design characteristics which are most relevant to the performance aredimensions of the flameholder and the form of the pan support. Both are important for the fuelefficiency. Existence of a flow restrictor influences both efficiency as well as safety via lowertemperatures of kerosene in the tank. Some of the currently available stoves already have highefficiencies, making them difficult to improve on. Others only need small modifications in thedesign such as changing the pan support. The rest might need more fundamental changes.Results from work on modifications in this project suggest that most kerosene stoves can beimproved by small design modifications.
* 90-
Production Technology
5.7 Hand tools can be sufficient to make a good quality stove. However, to producehomogeneous series with the same dimensions and appearances, machines are indispensable.Certain stove parts, especially the flame holders, have critical dimensions and need to fit well toensure a steady blue flame. Consumers are supposed to prefer stoves with a nice appearance,giving the impression of a higher quality than stoves made by hand tools.
5.8 Machines are mainly used for tasks which can not be done by hand, such as pressingthe frame parts. The use of dies in these presses guarantee that the sizes of the different partsare exactly the same for each stove. Some factories have a small workshop, allowing for theproduction of dies. A typical workshop is equipped with a lathe, drilling and welding machines andhand tools. A spot welding machine is sometimes used to make the flameholder, and to fix theplate which supports the wicks and the wick setting mechanism. Finishing is done by paint sprayinstallations.
5.9 A considerable part of the work in a stove factory, such as the assembling andseaming of the wick pipes, is still being done by hand, not much diff-zresn from artisanal production.An increase of the labor productivity is probably not the most important stimulus for
mechanization. In the three visited factories the share of the labor cost was only 10-15% of theproduction costs. The daily output is between 3 and 4 stoves per employee, which is only aboutdouble the daily amount made by an artisanal producer.
Economics
5.10 From two of the three factories visited, data were obtained to estimate productioncosts. In the case of a 16 wick stove made of thin sheet metaL with a retail price of Rp. 6,000,the share of the material cost was about 50% and the share of labor 15%. The costs fordistribution, overhead, profits and retail margin is 35% of the total. For an aluminum stove witha retail price of Rp. 9,500 the share of the material cost is about 63% and of labor 10%. Pricesof aluminum rose about 50% in 1988, making it difficult to produce an aluminum stove at acompetitive price.
Adaptability
5.11 Modifications of stoves to improve safety and efficiency can be grouped into threeclasses. First, the modifications which only require a minor change in the production process butinvolves no extra material. An example of this is making a pan support for which the ring doesnot touch the pan. This can be accomplished with the tools which are already in u,'. The secondgroup are the modifications requiring only low cost adaptations. An example would be insertinga flow restrictor, which will not change the total production costs very much. It will add only asmall amount to the material costs, and requires no different technology, because it is essentiallycomparable to the flameholder. The third group consists of more fundamental changes in thedesign, leading to extra material cost or increasee use of machines. This will be the case whendimensions of critical parts need to be changed.
- 91 -
5.12 Risk aversion and the wish to minimize costs favor the design modifications whichonly require low extra costs. During this project, two low cost modifications were identified, givinga considerable improvement in efficiency and safety. These should have the highest priority inimplementation, because of their large chance of being successful. In the longer term, these shouldbe complemented with modifications requiring more fundamental changes. The latter should beaccompanied by research and support from outside. Producers will probably only be interested ifthere is a clear, effective demand from the public for these modified stoves. An extra incentivecould be some financial support for extra investments.
Artisanal Production
Desien
5.13 Almost all of the stoves produced by artisans have a cylindrical shape and all haveten or more wicks. Designs are simple, omitting less crucial parts to keep the costs as low aspossible. Artisans are often concentrated in certain areas where they all produce more or less thesame type. The variety in shapes is much less than the variety available in factory made stoves.Because they often bear no brand name, and are painted either blue or green, artisanal stove typesare difficult to distinguish between each other.
Production Technolo
5.14 Extremely simple tools can produce reasonably good looking stoves. A hammer andchisel, a dye for the wick holder and some soldering equipment are the most important tools.Most of the stove parts can be made from oil drums and old cans. The use of these scrapmaterials and the absence of machine tools cause the dimensions of certain parts of the stove tovary considerably within a series of one stove maker. It is common knowledge among users thatthe quality, especially of the flame, can differ widely for the same stove type. This is corroboratedby efficiency tests of four stoves of the same type, showing that the highest efficiency is 1.46 timeshigher than the lowest 1/.
Economics
5.15 In the artisanal complex Penggilingan, the 16-wick type is sold to distributors forabout Rp. 3,500 a piece. The largest share of these costs are the material cost (36%) and thelabor cost (34%). Overhead takes 16% and profits 14% of the total. The retail price of this typeis about Rp. 5,000. These cost shares are assumed to be typical for artisanal production, thoughon the average the overhead is probably somewhat lower.
5.16 As could be expected, the share of the material cost is smaller compared to thefactories, but it is still the main cost. Together with the new materials, the price of the scrapmaterials continue to rise, causing problems for the small producers. A regular, guaranteed supplyfor reasonable prices would benefit their business.
21/ See: Zests and Evaluation of Kerosene and LPG StovesT b Lemigas.
.92.
Adaptability
5.17 Performance improvements can be expected from design modifications comparableto the ones mentioned for the factory stoves. Adding a flow restrictor, which is generally absentat the moment, is the main change which should be focused on. Large differences in fuelefficiencies of stoves of one stove maker suggest that a good design is necessary but not a sufficientcondition for a satisfactory performance. A well-designed stove can have low quality flamesbecause critical parts such as the flameholder cylinders are not well fitted. Therefore it ispreferable to lay the major emphasis on production quality improvements with some additionalminor design changes dealing with safety.
5.18 One of the steps in quality improvement is the use of suitable materials. Artisansare interested in a guaranteed supply of basic materials of which the quality is not too variable.Currently most of the handicraft stoves are made from scrap. The flame holder, which is the mostcritical part when performance is concerned, is often made from whatever is available. Thereexists a national program in which large industries support small ones (the 'anak angkat' program).Within this program the delivery of constant supply of basic materials could be more or lessguaranteed. This would be most easily executable if the artisans worked together in cooperatives.
5.19 At the moment, most artisans use a minimal amount of tools. A simple set costingabout one million Rupiah can increase appearance of the stove, its quality and also the productivity.The high cost and added risks have to be overcome by capital support, preferably via the existingcredit programs for the support of small industries (KIK/KMKP). A research and testinginstitution can play the role of intermediary between credit suppliers and the artisans.
Stove Market
5.20 Almost all stoves used in Indonesia are produced locally. Imported kerosene stovesare seldom seen, although Japanese names and labels are often used to promote sales, especiallyfor stoves from Surabaya.
5.21 In Jakarta, most people purchase their stoves from a market or from a travellingsalesman. Buying from a salesman has three advantages: a) you can exchange the stove in caseof unsatisfactory performance; b) it relieves women from carrying the sometimes heavy stoves; c)salesmen are more inclined to offer credit. Some people agree on two installments, others are soshort of cash that they pay in up to 30 installments. The price, up to 50% higher, is partly acompensation for the need of daily collection of these small amounts of typically only Rp. 200.
5.22 The stove market is very much divided in regions, each area having its own factoriesand groups of artisanal producers. Many factory stoves are also available in Jakarta. Stocks ofstoves available in six market places in Jakarta were counted to get a first impression of marketshares of the different types. Under the assumption that the rate of sales is directly related to theamounts in stock, the shares are given in table 5.1. In total 923 stoves were counted and 60different types were identified. For details on assumptions, the calculation procedure, and a listof stoves, see the Annex II. The crudeness of the method cause the results in Table 5.1 to be onlyrough estimates.
v 94 -
VI. PROPOSED, KEROSENE STOVE PILT PROGRAM
6.1 This chapter describes a kerosene stove program intended to improve the kerosene-economy of urban cooking stoves. Rather than attempting to identify and promote the "best" stove,the objective of the proposed program is to raise the quality of existing stoves. This strategy wasselected because: 1) there are numerous obstacles to marketing a new stove; 2) tastes in stoves varyso that no single stove can satisfy the diverse requirements; and 3) simple modifications shouldbe able to raise the efficiency of most existing stoves.
6.2 The kerosene stove program described here-in moves beyond kerosene stoveanalysis, towards direct involvement with kerosene stove producers and users. The precedingchapters demonstrate the large technical potential for low cost improvements in kerosene stoves.Furthermore, they indicate a need for government to bridge the 'information gap', and enablekerosene producers and users to make informed, rational choices affecting kerosene use. Aneffective program must provide both technical support for improving kerosene stoves, and theinformation to enable users to demand better stoves.
6.3 The proposed program involves four components: 1) Factory stove improvement;2) Artisanal stove improvement; 3) Kerosene stove research; and 4) Consumer awareness/advocacy,promoting high performance kerosene stoves and kerosene-saving cooking techniques. No radicalstove design changes or cooking changes are envisaged. Rather, the program emphasizes minorchanges which would almost certainly be implemented given better informaticn. As describedbelow, the program focuses on kerosene economy. Safety aspects should be added to the program,but their evaluation is beyond the scope of this study.
6.4 Guidance and monitoring for the energy aspects of the program would be providedby the Directorate General for Electricity and New Energy (DJLEB), based on its prior experiencewith energy conservation. The Ministry of Industry would be responsible for the technical side ofthe program. The regional offices of the Ministry of Industry (Kanwil) would foster contacts withproducers. The Ministry's laboratories (Balai Besar Penelitian Bahan dan Barang Teknik), whichhave considerable experience testing kerosene stoves for safety, would provide the facilities. TheIndonesian Consumer Organization (YLKI) and local womens' Education for Family Welfaregroups (Pendidikan Kesejahteran Keluarga) would assist in disseminating information, and providefeedback. A research group could be located at one of the technical universities.
6.5 Work with factories would emphasize standards and endorsements, whereas workwith artisanal producers would emphasize direct support in improving the production process.There are several reasons for distinguishing between artisanal and factory stoves. Artisans producethe majority of kerosene stoves, but are not readily amenable to standards, and are of too smallscale to receive individual attention. Work with artisans would, at least initially, be limited to thelarge complexes of artisans, which may already be involved in government supported activities.Factories are more amenable to standards and endorsements, and produce on a larger scale. Thatsome factories are already willing to go to some effort to obtain the little publicized "SII" suggeststhat they will be very interested in endorsements promoted through a publicity campaign.
- 93 .Table 5.1: Estimated Share of the Different Stoves Sold on Jakarta
Markets and the Number of Different TIpes in Each Group
Group Market Share U types
Surabya made (Butterfly and Toyo series) 7X 16Twc targe Jakarta producers 21X 5Rest of the factory iWde stoves 8X 26Artisanat production 64X 13+
Totats: 100X 60+
5.23 From the responses of 20 households, lifetimes of stoves were estimated to be threeyears for the artisanal and five years for the factory types. These are rough estimates and are nottrue for all stoves; sturdy artisanal types can last for 10 years. Using these lifetimes and theassumption that on average a household owns one and a half stove, the yearly number of stoveswhich are bought in Jakarta can be calculated to be about 473,000 (see Annex II). Based on salesdata of the two large Jakarta producers, the total sales of ali factory types was estimated to be93,000 per year. This results in the following percentages: 20% of the stoves sold in Jakarta arefactory made, 30% are handicraft types bought on markets and the remaining 50% are handicraftstoves obtained from travelling salesmen. The finding that most artisanal stoves are sold in door-to-door sales is corroborated by the in-depth household survey result that only 4 out of the 11visited households bought their artisanal stove on the market.
5.24 From the table in A.nnex II it can be seen that about 30% of the artisanal stoves soldin markets bear brand names. When it is assumed that this is also the case for the door-to-doorsales, then about 44% of the total amount of kerosene stoves sold :n Jakarta have a brand name.After taking into account the estimated differences in lifetime it. .an be calculated that 51% of the
Jakarta population use factory or artisanal stoves with brand names. This can be compared withthe survey result of 40 - 50%.
* 95 -
6.6 A sub-program to improve consumer awareness, and solicit consumer participationin the program, will also be necessary. Improved consumer awareness will be very important.Without pressure from consumers it will be far more difficult to convince producers to improvestove quality. Standards and endorsements must be understood by the consumers as vell asproducers, so that consumers can assess the costs of purchasing a sub-standard stove.Simultaneously, the knowledge and preferences of consumers (or consumer representatives) mustbe tapped to insure that the standard/endorsement program is appropriate to their needs.
6.7 Applied research based on "trial and error" would be an integral part of the effortto advise on kerosene stove improvements. In addition, it would be worthwhile to support a smallscale research program, complementary to the overall stove program. This research would drawon the stove test results, but its objective would be to better understand the general determinantsof stove performance, rather than possible improvements in particular models. Though useful, thisresearch would not be strictly necessary to the stove-improvement program.
Standards. Endorsements and Factory Stove Improvement
6.8 Efficiency tests should eventually be incorporated into existing kerosene stovestandards so as to ensure minimum efficiency. In addition, high efficiency stoves should receivespecial endorsement. The Ministry of Industry organizes the testing of kerosene stoves fromfactories wishing production licenses. Research organizations (the "Balai Besar") regularly teststoves according to the "Standard Industry Indonesiae (SII). 13 Currently the Standard isconcerned only with safety. Within the next four years, efficiency should be added to this standard.Also, the existing standard should be reviewed and simplified so as to ensure that the testsemployed are reproducible. Prior to the inclusion of efficiency in the "SI", regional programsshould be implemented to improve kerosene stoves in these regions. In the course of theseregional programs, the necessary experience would be gathered to facilitate the adoption ofefficiency standards and endorsements nationally.
6.9 Currently, few stoves meet the 'SIP, and even fewer are entitled to bear the "SIP"1aLal, indicating they comply. Partly as a result, the standards have not been strictly enforced.Tests undertaken at Lemigas 14/ illustrate two additional problems inherent in stove standards.First, the performance of different stoves from a single producer can vary significantly. This hasbeen clearly demonstrated for two artisanal stove producers, and some variation can also beexpected among factory stoves from a single producer. Second, measurement difficulties, especiallyfor such parameters as the temperature of different stove parts, make the "SII" tests difficult toreproduce. As an example of these difficulties, neither of the two stoves tested at Lemigas andbearing the "SIP" label passed the Lemigas "SIl" tests. Similar difficulties apply to efficiencymeasurements, as mentioned above. Under such circumstances, it will be necessary to improve thereproducibility of the Standards and/or to include second round stove tests for stoves within a
/ Details of this Standarepni *ed in Annexi, and wem used to guide the Lemigas Stove Tesdng undeflaken for theUHESS.
1/ Test and Evaation of Kvsene and LPG stoves, Lemigas, Jakata, September 1988.
- 96 -
specified range of the allowable performance. Fvrthermore, some criteria should be developed toidentify the worst offenders.
6.10 The producer side of the program would thus consist of two phases. During the firstphase, the program would be limited to two regions, and would include a re-working of the "SIIT",as well as stove testing and extension work to improve the kerosene stoves produced in theseregions. During the second phase, the efficiency standards and/or endorsements would be includedin the revised "SIP to be applied nation-wide.
Two Region Program (First 18 months)
6.11 The two region program would be analogous to a pilot project: by the end of twoyears a systematic and reproducible procedure for kerosene stove testing and improvement shouldhave been developed. The two region program would include, for example, Jakarta and Surabaya.Many of the stoves tested for the UHESS were made in Jakarta, and the modifications uncoveredare definitely appropriate, making Jakarta an obvious program area. Surabaya is the source ofmany of the better known factory stoves. The timing could be simultaneous or sequential. Thesix activities envisaged during this first phase are described below.
Revision of Standards
6.12 First, a new "SIP" standard would be developed. This new Standard would: 1)incorporate efficiency (via water boiling tests) and/or efficiency endorsements; 2) simplify the safetytests and ensure repor&ucibility; and 3) allow stoves to be ranked with respect to safetv.
Creation of Standard Product Information Data Sheet
6.13 The format of a Data Sheet, eventually to be provided to consumers with eachfactory stove, would be developed. The data would include information on maximum power,efficiency and safety. The information would, however, be in a form accessible to users. Thus,for example, efficiency could be summarized in terms of the kerosene required to bring one literof water to boil, or combined with power estimates to calculate an "average" daily kerosenerequirement.
Purchase of Stoves
6.14 Sample stoves would be purchased directly from all factories and artisanal complexesin each region, informing the producers of the purposes of the program. Simultaneously, summarydata would be collected on production levels by stove type and technology employed.
Stove Testing
6.15 Up to 40 stoves would be tested in each region, according to the new standard,informing producers of the results and providing them with a sample Standard Product Informationdata sheet for their stove.
- 97 -
Modification of Selected Stoves
6.16 Starting with the more popular low quality stoves, the tested stoves would beexamined for possible improvements (especially air flow restrictor and pan holder, at least in initialstages). The suggested improvements would be discussed with the producers. Producers failingto meet the standards would be notified that standards will be enforced in the near future. Testsof any modifications made by a producer would be made free of charge. For stoves for whichsignificant improvements seem possible, and the producer is agreeable, household tests would alsobe undertaken free of charge if deemed necessary. During this activity, applied research wouldalso be undertaken to extend the list of possible stove-improvements. Also, the adoption ofproposed modifications would be monitored, and barriers to adoption would be reassessed.
Revise Proposal 'for SII and Second Phase of Program
6.17 Based on the work of Phase one, the proposed Standard for kerosene stoves wouldbe formalized. Also, the details of the second phase of the program would be proposed,systematizing the procedures employed.
Phase IIExand to al Cities over 500.000 in Population (Second 18 Months)
6.18 By 1990 there will be about 14 cities over 500,000 in population, accounting foralmost half of the urban population of Indonesia, and well over half of the large scale kerosenestove producers. During Phase 2, the program would be cxpanded to include these cities.
Adopt New "SII' on National Scale
6.19 By the end of the second phase of the program it should be possible to adopt therevised stove standards and endorsements on a national scale.
Artisanal Stove Improvement
6.20 While standards and endorsements are not appropriate to artisanal stoves, artisansshould receive support in improving their stoves. Not only do artisans produce the majority ofstoves, but their production is more labor intensive, thus providing more employment per stove.Also, any attempt to coerce artisans into abiding by stove standards will risk simply breaking-upexisting artisanal stove complexes, and further reducing their opportunities for improvement.
6.21 The standard-endorsement program should therefore include extension work withartisanal producers. This would involve testing and advising on the more popular, low quality,artisanal stoves. It is expected that introducing flow-restrictors would have a large impact on thekerosene-economy of many artisanal stoves.
-98 -
6.22 Government programs already involving kerosene stove producers should also beexpanded to include efficiency and power considerations. The 0Anak Angkat" program could bea useful vehicle: a state company whose waste includes used sheet metal (e.g. used oil barrels)could "adopt" a complex of stove producers, ensure a continuous supply of raw material, and solicitadvice on stove improvements from the group working on factory stove tests. (Alternatively,experience in modifying artisanal stoves could be obtained by working with the prisoners who arealready producing kerosene stoves in significant quantities in, for example, West Java's Cirebonregency county prison.) More generally, a training program could be developed following the firstphase of factory stove improvement.
6.23 The improvement of artisanal stoves should include modifications of the productionprocess itself. As noted above, one of the disadvantages with artisanal stoves is the large variationin the performance of stoves, even from the same producer. Especially with safety, the range ofquality is very important: it is not enough that the "typical" stove from a given producer is safe.Technical suppoi t aimed at improving the production process is expected to have a positive effecton quality.
Kerosene Stove Research
6.24 The work with producers above inherently involves applied research. Developingof improved stoves can draw on and extend the "trial and error" research described briefly above,and in more detail in a working paper. .L/ However, important aspects of the burning process arestill insufficiently understood, providing a barrier to stove improvement. As such, there is a needfor a small research project as an integral part of the stove program. The aim of this additionalresearch will be to identify and quantify the determinants of kerosene stove efficiency, power andsafety. This will enable stove improvements to be identified more rapidly and systematically.
6.25 Close cooperation will be necessary between the stove-testing group and the researchgroup. Ideally, the research group would work directly with stove testers, so as to ensure thetransfer of practical knowledge on available stoves to the research group, in return for the stovetesters gaining insight into the fundamentals of the burning process. The research would be smallscale (no more than one senior expert and one or two assistants). It would be directed towardsapplications, though not to particular stoves. Testers would have to obtain regular reports onresults, and provide input into the research program.
6.26 A possible base for this proposed research group is a technical university. Low costand simple construction make kerosene stoves a good subject of research for students. Thelaboratory requirements include balances, temperature sensors, a micro-computer for data loggingand analysis, and a location with adequate ventilation but minimal drafts.
W 'Kimsene and LPG stows hu lIonesia' Einew SanFgu, Ausw 19088
. 99 .
Consumer Awareness/Involvement
6.27 For the success of the kerosene stove improvement program, it is important bothfor consumers to be made aware of how to obtain a more efficient (and safer) stove, and for theprogram to be made aware of consumer preferences. If consumers "demand" improved stoves,producers will be far more inclined to adopt modifications. Furthermore, only consumersthemselves can ever be fully aware of the advantages and disadvantages of the modifications.
6.28 Consumer awareness should emphasize knowledge currently not available tokerosene stove users. Ideally, thiis knowledge would be disseminated via local television: 65% ofthe persons with a major influence on purchasing kerosene stoves watch television regularly. Itshould be oriented to women, who account for 85% of these influential persons. The awarenesscampaign should be linked to the program of standards and endorsements, initially in the tworegions selected and later expanding to the rest of Indonesia. Information would cover both howto interpret the endorsements, Standard Product Information data sheets, as well as details on thenew kerosene stove Standards for factory stoves. Also minimal information would be included, ina form which most users can understand, to demonstrate that, for example:
(a) Flow Restrictors can improve stove performance, leading to lower kerosene use andfaster cooking.
(b) Pan Supports with rings touching the pan lead to more kerosene consumption andslower cooking.
(c) Steaming rice at high power wastes kerosene & water.
6.29 Consumer and Women's organizations (Yayasan Lembaga Konsumen Indonesia,YLKI) and Pendidikan Kesejahteran Keluarga (PKK)) should both spread this information, obtainfeedback, and act as consumer advocates. While household tests can be undertaken within thestove modification program, alone this would be insufficient. The Indonesian ConsumerOrganization already has some experience with kerosene stoves, and should eventually play a majorrole in providing critical information on kerosene stoves. The program for family welfare (PKK)has neighborhood groups, and could provide a much-needed direct link with kerosene stove users.
- 100 -
VII. EVALUATION OF THE PROPOSED KEROSENE STOVE PILOT PROGRAM
7.1 The first section of this chapter summarizes the findings of the evaluation. This isfollowed by a discussion of the projected urban kerosene use and the presentation of a tentativetotal kerosene use estimate. The third section contains a presentation of the various otherparameters used, some of which were estimated by the project. The fourth and last section givesa more detailed overview of the evaluation of the stove programme. This assessment covers thepotential value of the program to (a) the national economy and to (b) the government in terms ofits budget and the balance of payments as well as (c) to the consumer.
Summary of Findings
7.2 The program is a very attractive proposition from an economic point of view.Discounted at the opportunity cost of capital (10%) net returns over the program period of tenyears would be about six times the cost. In the base case, the net present values (NPVs) of theflows of gross benefits, costs, and ne-t benefits are calculated to be US$16.6, 2.2 and 14.4 millionrespe^tively. In terms of the government budget, the program is expected to be more than budget-neutral by showing a net benefit NPV-discounted at a 'soft' loan rate of 10% of US$2.7 million.The balance of payments is expected to benefit quite significantly, over the program period. Theprogram is estimated to have an import oantent of about 40%. This cost is dwarfed by the inflowof funds generated by the sale of saved kerosene in the international market. Over the program,net benefits are accumulated with an NPV of about US$12.3 million (at 10%).
7.3 The financial analysis, which looks at the program from the consumers' point of view,has a lower flow of benefits because the border value exceeds the financial price of kerosene byabout 30%. However, it has also significantly lower costs because the program costs are notincluded as the consumer is not expected to pay for them. As a result, the returns are similar tothose of the economic analysis.
Kerosene Use Projection
7.4 Since the stove program is aimed at the urban population, the relevant projectionconcerns the urban use of kerosene for cooking purposes. The UHESS household survey has foundthat in 1988 kerosene was the main, or only, fuel used for cooking by about 70% of urbanhouseholds. However, this share is subject to change as kerosene has several substitutes includingLPG, fuelwood, town gas and electricity. A relative change in consumer access to any of these fuelswill change their position in the urban market.
7.5 Access may change as a result of a change in both the (physical) availability ofparticular fuels and purchasing power because of adjustments in price and/or income levels. Towngas is at present a very minor source of cooking fuel largely as a result of its very limitedavailability. Electricity, on the other hand, is widely available in urban areas. In Java, some 85%of the urban households presently use electricity for lighting and virtually all urban households areexpected to have electricity by the turn of the century. However, the use of electricity for cookingrequires both a considerable investment in cooking equipment and a fairly drastic change in cooking
- 101-
practices. For these reasons neither town gPs nor electricity is expected to change its currentmarginal position, at least within the time horizon of the project.
7.6 The use of fuehwood is expected to actually decline as cities continue to grow In sizeand income increases. The household survey has found an inverse correlation between city sizeand the importance of fuelwood as a fuel source for cooking. This is something one would expectto see. Widening city limits encroach on agricultural land, making it scarcer and as a resultfuelwood production declines. As cities grow in size, fuelwood becomes a more cumbersome, lesspractical fuel. Distances increase and fewer dwellings accommodate the use of fuelwood. Also, asincomes rise more people adopt lifestyles in which reducing the time spent on cooking choresbecomes more important.
7.7 Kerosene and, to a much lesser extent, LPG will be the two main cooking fuels.Urban kerosene use for lighting is expected to fall as electrification progresses. Its use for purposesother than lighting and cooking, is minor and likely to fall. As income levels rise, more householdswill switch to LPG; providing access of consumers to LPG also increased. 16/ At lower incomelevels, however, kerosene will replace fuelwood. As more people are expected to switch at theupper end of the income scale than at the lower end, a decline in the use of kerosene for cooking.ould be expected. However, as incomes rise, the average household use of kerosene also rises.Overall, in fact, the use of kerosene is expected to increase in urban areas.
7.8 Fuel use projections are illustrated in Chapter HI of the main report. Kerosene useis projected to grow at 3.4% per year over the next 12 years. Fuelwood use is expected to growmarginally. LPG is expected to double its share of urban cooking fuel demand and triple inabsolute terms over the period.
Population Growth Assumption
7.9 The urban population of 45.3 million is expected to increase to 82.3 million by theyear 2000; implying a growth rate averaging 4.1% over the period concerned. At present the urbanhousehold consists on average of 4.85 persons and, for simplicity, is assumed to stay constant.
Share of Househu.ds Cooking With Kerosene
7.10 At present almost 70% of the urban households use kerosene as their main fuel forcooking. As mentioned earlier, growing cities and rising incomes are expected to bring about asubstitution of kerosene for fuelwood as weli as an increase in the kerosene use per average urbanhousehold. The combined effect is estimated to increase the share from 70% to slightly more than77% of all urban households by the turn of the century. Many urban households possess morethan one stove. The average for urban kerosene using households is 1.6 stoves. This average wouldrise, but only very slightly, with the rise in income. The present average use of 250 It of keroseneper stove per year is not expected to change.
1W Not only in tenns of phjkal availability but also in tenns of the initial investment required -i.e. in bottles and cookingequipment. It woudd seem that what keeps potentid consumer awayfmm LPG is nor so much the pnce of LPG itselfbut nwtherthe prce of the inital (set oj) LPG bottles, which ponedly go forpsices considerably higher than the officialpices, and the ptice of the LPG stow.
-102 -
Kerosene Price and Cost of Supply
7.11 Kerosene prices are set by government. It is subject to a uniform pricing system atthe (Pertamina) central depot level. From the depot to the end-user, a system of fixed regionaltransport and uniform trade margins regulates price. The government subsidy on the average re-tail price and the border price of kerosene were calculated based on the third quarter 1989Singapore posted price as shown in Chapter of II of the main report. The average retail price ofRp 203 per liter comes from the household survey. At this price, kerosene includes an averagesubsidy of Rp 92 per liter.
Prouram-specific Assumptions
7.12 Of the kerosene stoves used by urban households most have been made by artisans.Only some 30% are estimated to be factory-made. This has implications for the average lifetimeof the stoves as the factory-made stoves are thought to be more durable. A factory stove will needto be replaced on average every five years. The lifetime of artisanal stoves is estimated to be notmore than three years. This reduces the average replacement period of urban stoves to 3.9 years.
7.13 The program design includes a start-up period of 18 months with two units; one eachin two large urban areas in Java. A unit would comprise two local experts and two local tech-nicians. After this first phase the number of units in these two areas is planned to double and fouradditional units would be established to cover four urban conglomerates in the outer islands. Du-ring both phases of the program an expatriate expert would direct and co-ordinate the various units.
7.14 Each unit is expected to test on average 55 stoves per year: i.e. 20 factory-madestoves and 35 models produced by (large complexes of) artisans. Half of factory stoves andartisanal stoves are expected to offer useful opportunities for effective low cost design improve-ments. It is anticipated that the response of factory owners will be such that half of the improve-ments wii be adopted. With regard to artisanal stoves the expected "success rate" is about two-fifths. More specifically, each unit is expected to bring on average 5 factory stove models and 7artisanal stoves up to "improved" standards every year. The effect of the modifications made shouldresult in an average efficiency improvement of 15% for each improved stove. A 15% improvementin efficiency is expected to lead to a savings in kerosene use of 5%. 17/
7.15 The average production run of factory stoves is estimated to be 5,000 units per year.Artisan complexes are thought to average 2,000 units. The design improvements emanating fromone stove improvement unit could therefore lead to 25 thousand factory and 14 thousand artisanalimproved stoves being put on the market every year that the program operates. With two teamsin the first one-and-a-half years of the program, and 8 units in the following years, the numbersinvolved would be some 78 thousand improved stoves in year two, an additional 200 thousand orso units in year three and another 300 thousand stoves by the end of year four. By the end of thefourth year there could be a stock of improved stoves in the urban households of close to 600thousand units.
Jj/ A gmaterstwve efiicincymay leadhouseholds to cookat lowerpowersenings and increasefuelsavings. However, thisreladonship is farfrom clear, and such savings have remfom been ignored in the evauation of the progiwn.
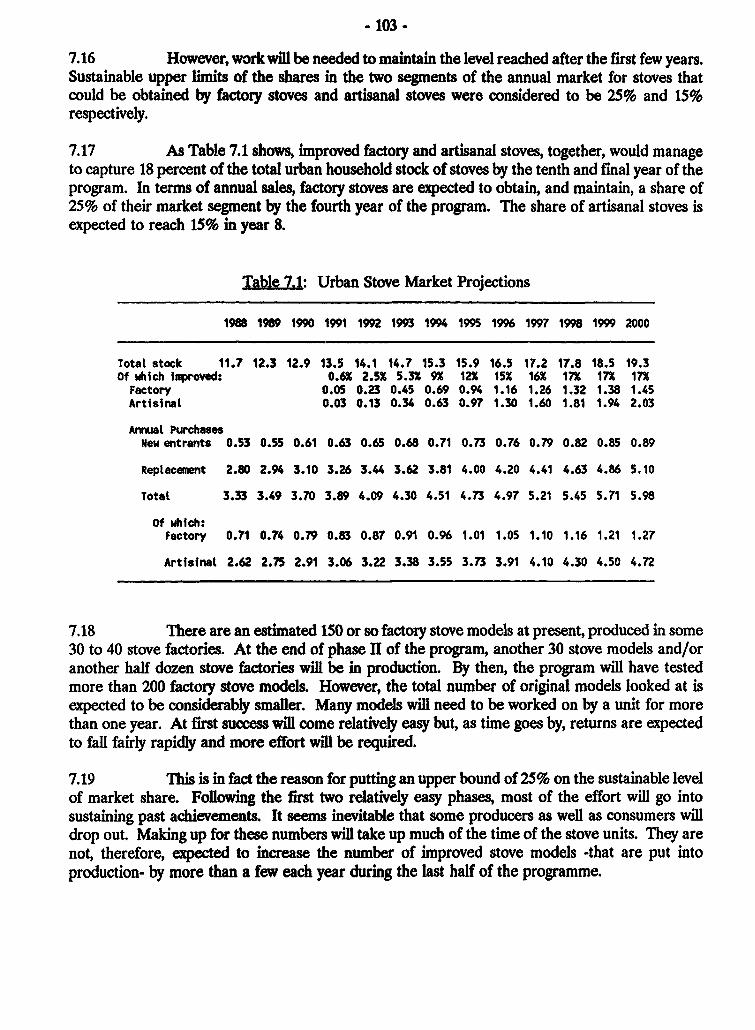
- 103-
7.16 However, work will be needed to maintain the level reached after the first few years.Sustainable upper limits of the shares in the two segments of the annual market for stoves thatcould be obtained by factory stoves and artisanal stoves were considered to be 25% and 15%respectively.
7.17 As Table 7.1 shows, improved factory and artisanal stoves, together, would manageto capture 18 percent of the total urban household stock of stoves by the tenth and final year of theprogram. In terms of annual sales, factory stoves are expected to obtain, and maintain, a share of25% of their market segment by the fourth year of the program. The share of artisanal stoves isexpected to reach 15% in year 8.
Table 7.1: Urban Stove Market Projections
1988 1989 1990 1991 1992 1993 1994 1995 1996 1997 1998 1999 2000
Total stock 11.7 12.3 12.9 13.5 14.1 14.7 15.3 15.9 16.5 17.2 17.8 18.5 19.3of which improved: 0.62 2.52 5.32 9X 12X 15X 16X 172 172 172Factory 0.05 0.23 0.45 0.69 0.94 1.16 1.26 1.32 1.38 1.45Artisinal 0.03 0.13 0.34 0.63 0.97 1.30 1.60 1.81 1.94 2.03
Annual PurchasesNew entrants 0.53 0.55 0.61 0.63 0.65 0.68 0.71 0.73 0.76 0.79 0.82 0.85 0.89
Replacement 2.80 2.94 3.10 3.26 3.44 3.62 3.81 4.00 4.20 4.41 4.63 4.86 5.10
Total 3.33 3.49 3.70 3.89 4.09 4.30 4.51 4.73 4.97 5.21 5.45 5.71 5.98
of which:Factory 0.71 0.74 0.79 0.83 0.87 0.91 0.96 1.01 1.05 1.10 1.16 1.21 1.27
Artisinal 2.62 2.75 2.91 3.06 3.22 3.38 3.55 3.73 3.91 4.10 4.30 4.50 4.72
7.18 There are an estimated 150 or so factory stove models at present, produced in some30 to 40 stove factories. At the end of phase IH of the program, another 30 stove models and/oranother half dozen stove factories will be in production. By then, the program will have testedmore than 200 factory stove models. However, the total number of original models looked at isexpected to be considerably smaller. Many models will need to be worked on by a unit for morethan one year. At first success will come relatively easy but, as time goes by, returns are expectedto fall fairly rapidly and more effort will be required.
7.19 This is in fact the reason for putting an upper bound of 25% on the sustainable levelof market share. Following the first two relatively easy phases, most of the effort will go intosustaining past achievements. It seems inevitable that some producers as well as consumers willdrop out. Making up for these numbers will take up much of the time of the stove units. They arenot, therefore, expected to increase the number of improved stove models -that are put intoproduction- by more than a few each year during the last half of the programme.
. 104-
7.20 Ir. the artisanal sector of the stove market there are many more models than in thefactory sector. There will be no dearth of artisanal stove models for the program to test. Becauseof the much more individual approach to stove-making, progress is expected to be significantlyslower than in the factory segment. Capturing 15% of this sector after about 7 years, however,should he possible.
Program Budget
7.21 Total base cost of the first two phases of the program is estimated to be US$1.3million in constant 1988 US dollars. Some 60% would cover the cost of project personnel. About12% would be spent on transportation and 14% would go to renting space. A publicity campaign(5%), support of fundamental research activities (3%), sundry expenses (3%) would account for therest of the budget.
Table 7.2: Stove Improvement Program Budget(US$ millions)
Item Unit Unit 1990 1991 1992 Total
BuildingsRent 1.0 month 24.0 60.0 96.0 180.0
Equipment 11.0 33.0 4.0Scale 2.0 4.0 12.0 16.0Computers 2.5 5.0 15.0 20.0Other equipment 1.0 2.0 6.0 8.0
Transport 25.0 75.0 100.0Van 10.0 20.0 60.0 80.0Motorbike 2.5 5.0 15.0 20.0
Personnel 174.0 255.0 336.0 765.0Local experts 1.5 mm 36.0 90.0 144.0 270.0Foreign experts 10.0 mm 120.0 120.0 120.0 360.0Technicians 0.75 mm 18.0 45.0 72.0 135.0
Publicity capaign 10.0 20.0 30.0 60.0
Sundry 15.0 15.0 15.0 45.0Household testingArtisan trainingStove and fuel purchases
Research 15.0 15.0 15.0 45.0
Institutional support 4.0 4.0 4.0 12.0
Transport Om 7.0 17.5 28.0 52.5Van 6.0 15.0 24.0 45.0Motorbike 1.0 2.5 4.0 7.5
Base cost 285.0 494.5 524.0 1303.5Contingencies 10X 28.5 49.5 52.4 130.4Total cost 313.5 544.0 576.4 1433.9
105 -
7.22 Phase I and II would include 720 man-months of local experts/technicians and 36man-months of expatriate expertise. Transport would include 8 light vans and 8 motorbikes.Annual operating and maintenance costs were estimated to be 30% and 20% of the initial invest-ment cost of vans and motorbikes, respectively. Contingencies were included at a rate of 10% tocover possible cost increases of, particularly, she publicity campaign, institutional support and su-ndry expenses.
7.23 The program design covers a period of ten years in all. The expatriate coordinatoris not expected to need more than three years to help set up -'Ie program and transfer his exper-tise to one or more of his local experts. As mentioned before, much of the program's efforts duringthe following seven years will need be concentrated on program "maintenance", ie, keeping upmarket share. The cost of the "Phase IIIP is estimated to be US$300 thousand per year (in current1988 US$). After ten years this need is not expected to have been fully met, but the period in-volved is long enough for it to have beer. considerably reduced. Some testing, however, will still berequired for a long time afterwards.
7.24 The ten year time horizon for the program was chosen because after a full decadethe program ought to be completely institutionalized. Moreover, because costs and benefits arediscounted, extending this period further would affect the cost benefit analysis only slightly.
Economic Evaluation
Conversion Factors
7.25 Conversion factors (CFs) are used to convert financial values into economic values.Such factors adjust financial prices by correcting for prevailing market distortions and excludingtransfer payments such as taxes. For instance, the border price calculation implies a CF forkerosene of about about 1.43, as the economic cost (the border price) of kerosene is 1.43 timesits average financial price. Except for household fuels such as kerosene, the estimation of CFswould clearly be beyond the scope of the present project. Therefore, use has been made ofavailable estimates presented in Table 7.3. The official exchange rate (OER) used in the analysisis US$1.00 = Rp 1,700. For the sake of convenience, economic values have been denominated inUS dollars rather than Rupiah.
Table 7.3: Conversion Factors
Standard conversion factor 0.9Rural unskilled labour: Java 0.7
Elsewhere 0.8Industrial plant and machinery 0.9Other traded manufactures 0.8Construction 0.8Non-traded services 0.8Transport 1.0General project costs 0.8Opportunity cost of capital, .a. 10%
- 106-
Costs
7.26 There are two cost sources. In addition to the cost of operating the program, thereis a cost incurred by implementing the recommended design improvements. The latter is expectedto be only a sma'l cost on average because (a) the program is expected to focus specifically on lowcost improvements, and (b) in many cases design improvements should be input-neutral, i.e. justusing the same amount of inputs in a different way, even when (b) more inputs are required, thecost increase involved should be quite minor as both material and labour costs are rather low. Theaverage cost of bringing a stove model up to the improved standard was estimated to amount toRp 250 per stove produced. The CFs applied to program costs and additional stove productioncosts, respectively averaged out at 0.80 each.
Benefits
7.27 The benefits generated by the program are the savings in kerosene used valued atthe border price of this fuel. Savings of kerosene are expected to reach a level of some 40 millionlitres by the tenth year of the program, or an economic value of about LUS$2.7 million per year.The value of the flow of net benefits, after accounting for costs, over the ten year period of theprogram discounted at the opportunity cost of capital (10%) amounts to LJS$ 16.6 million. This isabout six times cost (of US$ 2 million, discounted). In fact, with an outcome of this magnitude theresult of the internal rate of return (IRR) calculation is not meaningful. This is a very attractiveprogram as it would still show a reasonable return even if only half of the expected benefits wereobtained (a savings of only 2.5% instead of 5%) and the costs would double. Both possibilities arequite remote. If anything, costs would be expected to be somewhat lower than budgeted,particularly after year 3.
Government Budget and Balance of Payments
7.28 The government budget is affected in two ways. It has been assumed that the GOIwill be able to obtain a soft loan to cover program expenditures (their financial value). Therefore,a discount rate of 10% has been used. Secondly, by not selling the kerosene (domestically) the GOIneed not pay out the subsidy on kerosene (of Rp 92 per liter). In the base case, the GOI budgetwould show a net benefit of US$ 2.75 million.
7.29 The balance of payments effect consists of the import requirement emanating fromthe program and the revenues from the international sales of kerosene saved. The import elementof the various budget items was estimated to average about 40%. In the base case, the balance ofpayments would improve by almost US$ 12 million over the period concerned.
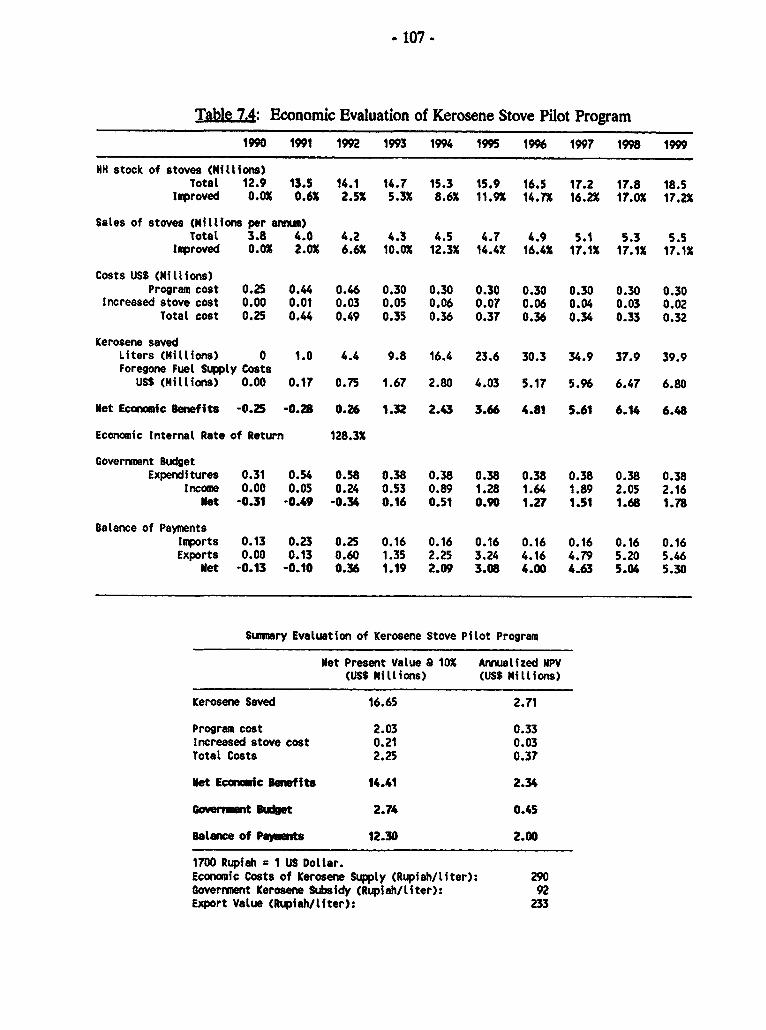
- 107 -
Table 7.4: Economic Evaluation of Kerosene Stove Pilot Program
1990 1991 1992 1993 1994 1995 1996 1997 1998 1999
HH stock of stoves (Milliois)Total 12.9 13.5 14.1 14.7 15.3 15.9 16.5 17.2 17.8 18.5
improved 0.0% 0.6% 2.5X 5.3% 8.6% 11.9% 14.72 16.22 17.0% 17.2%
Sales of stoves (Millions per wanum)Total 3.8 4.0 4.2 4.3 4.5 4.7 4.9 5.1 5.3 5.5
Improved 0.0% 2.0% 6.6% 10.0% 12.32 14.4X 16.42 17.12 17.1% 17.12
Costs USS (Mitlions)Program cost 0.25 0.44 0.46 0.30 0.30 0.30 0.30 0.30 0.30 0.30
Increased stove cost 0.00 0.01 0.03 0.05 0.06 0.07 0.06 0.04 0.03 0.02Total cost 0.25 0.44 0.49 0.35 0.36 0.37 0.36 0.34 0.33 0.32
Kerosene savedLiters (Millions) 0 1.0 4.4 9.8 16.4 23.6 30.3 34.9 37.9 39.9Foregone Fuel Supply Costs
USS (Millions) 0.00 0.17 0.75 1.67 2.80 4.03 5.17 5.96 6.47 6.80
Net Economic Benefits -0.25 -0.28 0.26 1.32 2.43 3.66 4.81 5.61 6.14 6.48
Economic Internal Rate of Return 128.3%
Government BudgetExpenditures 0.31 0.54 0.58 0.38 0.38 0.38 0.38 0.38 0.38 0.38
Income 0.00 0.05 0.24 0.53 0.89 1.28 1.64 1.89 2.05 2.16Net -0.31 -0.49 -0.34 0.16 0.51 0.90 1.27 1.51 1.68 1.78
Balance of Paymentsimports 0.13 0.23 0.25 0.16 0.16 0.16 0.16 0.16 0.16 0.16Exports 0.00 0.13 0.60 1.35 2.25 3.24 4.16 4.79 5.20 5.46
Met -0.13 -0.10 0.36 1.19 2.09 3.08 4.00 4.63 5.04 5.30
Summary Evaluation of Kerosene Stove Pilot Program
Net Present Value O 10% Annualized NPV(USS Millions) (USS Millions)
Kerosene Saved 16.65 2.71
Program cost 2.03 0.33Increased stove cost 0.21 0.03Totat Costs 2.25 0.37
Net Economic Benefits 14.41 2.34
Gowvenment Bisdt 2.74 0.45
Balance of Pa)nts 12.30 2.00
1700 Rupiah = I US Dollar.Economic Costs of Kerosene Supply (Rupiah/liter): 290Government Kerosene Subsidy (Rupiah/liter): 92Export Value (Rupiah/liter): 233
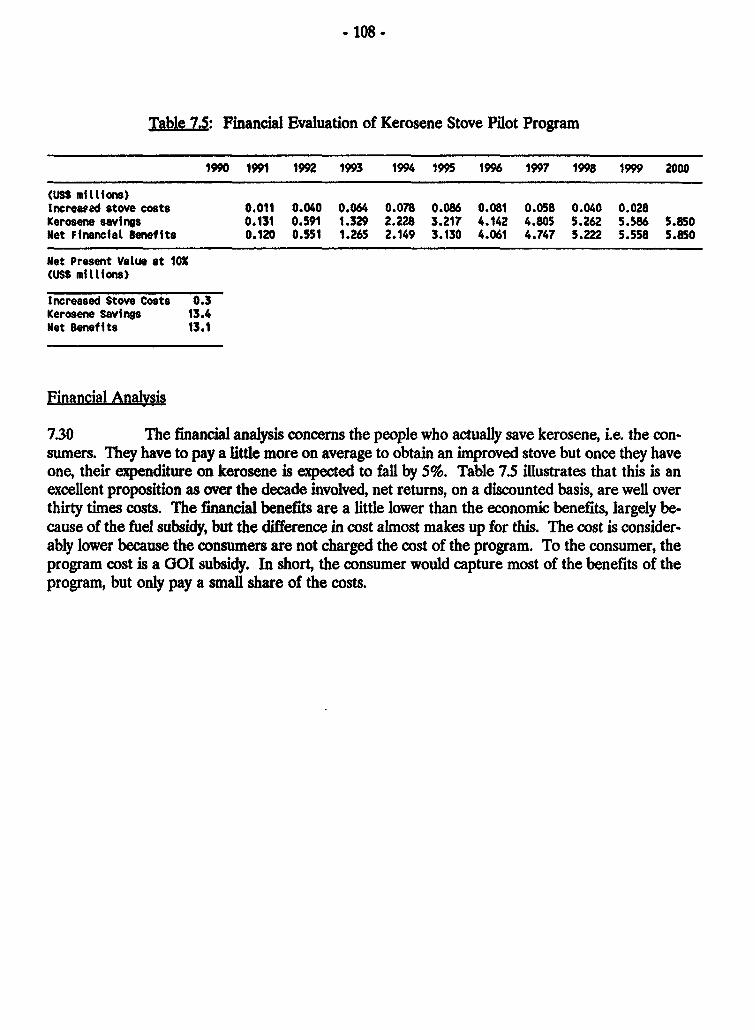
- 108-
Table 7.: Financial Evaluation of Kerosene Stove Pilot Program
1990 1991 1992 1993 1994 1995 1996 1997 1998 1999 2000
(US$ mitlions)Increased stove costs 0.011 0.040 0.064 0.078 0.086 0.081 0.058 0.040 0.028Kerosene savings 0.131 0.591 1.329 2.228 3.217 4.142 4.805 5.262 5.586 5.850Net Financial Benefits 0.120 0.551 1.265 2.149 3.130 4.061 4.747 5.222 5.558 5.850
Met Present Value at 10X(US$ millions)
Increased Stove Costs 0.3Kerosene Savings 13.4Net Benefits 13.1
Financial Analysis
7.30 The financial analsis concerns the people who actually save kerosene, i.e. the con-sumers. They have to pay a little more on average to obtain an improved stove but once they haveone, their expenditure on kerosene is expected to fail by 5%. Table 7.5 illustrates that this is anexcellent proposition as over the decade involved, net returns, on a discounted basis, are well overthirty times costs. The financial benefits are a little lower than the economic benefits, largely be-cause of the fuel subsidy, but the difference in cost almost makes up for this. The cost is consider-ably lower because the consumers are not charged the cost of the program. To the consumer, theprogram cost is a GOI subsidy. In short, the consumer would capture most of the benefits of theprogram, but only pay a small share of the costs.
- 109 -
VIII. LPG AND BIOFUEL STOVE POLICY
8.1 Kerosene stoves deserve and receive the focus of this report. However, both LPGand biofuel are significant household fuels. LPG will grow in importance, and is already used byover 10% of the households in Jakarta. Woody biofuel is used by about 22% of the householdsin urban Indonesia, and is especially important among low income households residing in thesmaller urban areas. For both these fuels, the quality of the stoves will be important to futuredevelopments, and there are possibilities for small scale programs. In this chapter, the two fuelsare reviewed in turn, and the most important policy issues identified.
Ltiquified Petroleum Gas
8.2 LPG is now used by roughly 5% of the urban households in Indonesia, with a totalconsumption of over 150 metric tons per year. The market has been growing rapidly, despite ashortage of bottles and attempts to constrain demand by raising fuel and bottle prices. One of thestrategy options examined in the UHESS is the promotion of LPG as a household fuel. Theattractiveness of this option depends upon the amount of kerosene displaced by LPG. Thisdepends, in turn, on the quality of the kerosene and LPG stoves.
8.3 As discussed in Chapter II, the current LPG stoves in use in Indonesia are highpowered when compared to typical kerosene stoves. This dissipates a large part of the savingsresulting from the higher efficiency of LPG, if the higher power is used during such operations assteaming rice. An econometric analysis of households using LPG and kerosene for cooking amongupper income households (see main report) suggests that one kilogram of LPG substitutes for 1.7liters of kerosene. This implies that LPG cooking requires about one quarter less energy. By wayof contrast, looking only to efficiency (which averages about 50% higher for LPG), one might expectLPG cooking to require one third less energy.
8.4 Especially if LPG is to be promoted, this observation has important policyimplications. First, consumers should be made aware of the costs incurred by using high powerLPG stoves. Ihis information could be disseminated via Standard Product Information sheets anda small publicity campaign. Second, any obstacles to local production of low power stoves shouldbe removed X8/. In particular, low power stoves should be demonstrated to local LPG stoveproducers who currently model their stoves on high powered stoves suitable only for very highincome consumers. At least one producer willing to market low-power stoves vigorously shouldbe identified, and, if necessary, assisted.
a/ Tlis power issue is especialy imponan for one and tKw burmer LPG stoves which do not often have the low powerbuner supplied with the four bwner models.

. 110 -
Biofuel
8.5 As incomes rise, biofuel may eventually cease to be a sinificant urban cooking fuel.However, the results of the UHESS survey clearly indicate that biofuel is not an exclusively ruralcooking fuel Furthermore, biofuel being more scarce in urban areas, urban users can be expectedto be partulary attracted to improved stoves. While there is no justification for an urban wood-stove program, there is a clear opportunity for extending a rural stove program to urban areas.
- 111 -
Anna 1-: Qualy nd Test Prcedures for Kerosene Wlck StovesIndonesian Industrial Standard SII0135-76
1. Introduction: These standards consist of regulations about the quality and testing procedureof kerosene wick stoves.
2. Definition: A kerosene wick stove is a stove having one or more wicks, and using keroseneas fuel in a tank which is not pressurized.
3. Quality regulations
3.1 Temperature
3.1.1. Fuel: The maximum temperature of the kerosene in the tank is 50 °C
3.1.2. Stove surface temperatures:* Maximum surface temperature of frequently touched parts is 80 ec.* Maximum surface temperatures for other parts, except the fuel tank is 94 oc.
3.2 Construction
3.2.1. Fuel tank and fuel transport system:* All connections below the fuel level have to fit neatly to prevent leakages.* If the tank is made from steel plate with an anti-corrosion layer, the minimum
thickness is 0.27 mm.* If the tank does not have an anti-corrosion layer, the minimum thickness of the steel
plate is 0.35 mm.* If the flame holder is not directly connected with the tank, the fuel transport system
should be firm and not leaking* The fuel tank should have a ventilation hole which is situated far from the flame
holder.
3.2.2. Flame regulator: The flame regulator should be made as follows:* Not leaking.* It should be possible to adjust the height of the wicks fast and smoothly.* The wick should be sufficiently tight in the wick tubes to prevent falling.* The construction should be firm.* It should be easy to light.
3.2.3. Stability: If placed on a plane with an inclination of 15 degrees the stove should remainstable in all directions, without spilling kerosene.
3.3. Flames: During the time the stove is used it should have stable flames, which do not leakto other parts and which does not give black smoke on the position of the wickregulator.
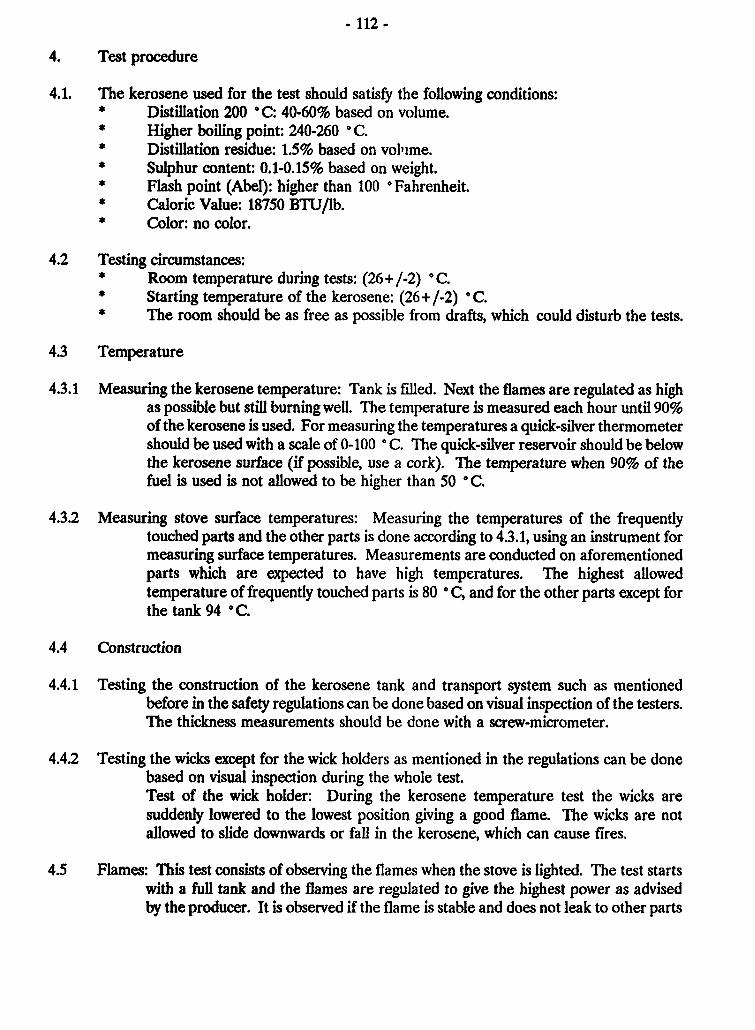
- 112 -
4. Test procedure
4.1. The kerosene used for the test should satisfy the following conditions:* Distillation 200 ec: 40-60% based on volume.* Higher boiling point: 240-260 ° C.* Distillation residue: 1.5% based on volime.* Sulphur content: 0.1-0.15% based on weight.* Flash point (Abel): higher than 100 ° Fahrenheit.
Caloric Value: 18750 BTU/lb.* Color: no color.
4.2 Testing circumstances:* Room temperature during tests: (26 + /-2) °C.* Starting temperature of the kerosene: (26 + /-2) "C.* The room should be as free as possible from drafts, which could disturb the tests.
4.3 Temperature
4.3.1 Measuring the kerosene temperature: Tank is filled. Next the flames are regulated as highas possible but still burning well. The temperature is measured each hour until 90%of the kerosene is used. For measuring the temperatures a quick-silver thermometershould be used with a scale of 0-100 ° C. The quick-silver reservoir should be belowthe kerosene surface (if possible, use a cork). The temperature when 90% of thefuel is used is not allowed to be higher than 50 °C.
4.3.2 Measuring stove surface temperatures: Measuring the temperatures of the frequentlytouched parts and the other parts is done according to 4.3.1, using an instrument formeasuring surface temperatures. Measurements are conducted on aforementionedparts which are expected to have high temperatures. The highest allowedtemperature of frequently touched parts is 80 " C, and for the other parts except forthe tank 94 ° C.
4.4 Construction
4.4.1 Testing the construction of the kerosene tank and transport system such as mentionedbefore in the safety regulations can be done based on visual inspection of the testers.The thickness measurements should be done with a screw-micrometer.
4.4.2 Testing the wicks except for the wick holders as mentioned in the regulations can be donebased on visual inspection during the whole test.Test of the wick holder: During the kerosene temperature test the wicks aresuddenly lowered to the lowest position giving a good flame. The wicks are notallowed to slide downwards or fall in the kerosene, which can cause fires.
4.5 Flames: This test consists of observing the flames when the stove is lighted. The test startswith a full tank and the flames are regulated to give the highest power as advisedby the producer. It is observed if the flame is stable and does not leak to other parts

- 113 -
until 90% of the fuel is used. This test is repeated with flames dimmed to halfpower.
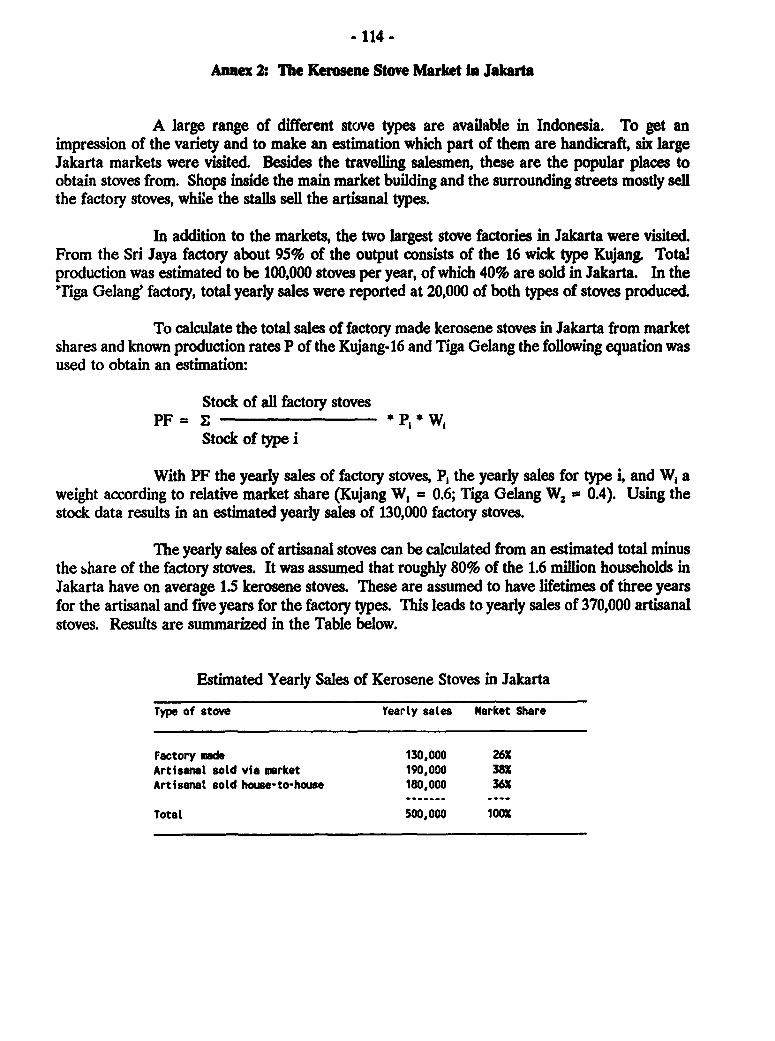
- 114-
Annex 2: Tbe Kerosene Stove Market In Jakarta
A large range of different stove types are available in Indonesia. To get animpression of the variety and to make an estimation which part of them are handicraft, six largeJakarta markets were visited. Besides the travelling salesmen, these are the popular places toobtain stoves from. Shops inside the main market building and the surrounding streets mostly sellthe factory stoves, while the stalls sell the artisanal types.
In addition to the markets, the two largest stove factories in Jakarta were visited.From the Sri Jaya factory about 95% of the output consists of the 16 wick type Kujang. Totalproduction was estimated to be 100,000 stoves per year, of which 40% are sold in Jakarta. In theIriga Gelang' factory, total yearly sales were reported at 20,000 of both types of stoves produced.
To calculate the total sales of factory made kerosene stoves in Jakarta from marketshares and known production rates P of the Kujang-16 and Tiga Gelang the following equation wasused to obtain an estimation:
Stock of all factory stovesPF = E: p *P W
Stock of type i
With PF the yearly sales of factory stoves, P, the yearly sales for type L and W1 aweight according to relative market share (Kujang W, = 0.6; Tiga Gelang W2 0.4). Using thestock data results in an estimated yearly sales of 130,000 factory stoves.
The yearly sales of artisanal stoves can be calculated from an estimated total minusthe share of the factory stoves. It was assumed that roughly 80% of the 1.6 million households inJakarta have on average 1.5 kerosene stoves. These are assumed to have lifetimes of three yearsfor the artisanal and five years for the factory types. This leads to yearly sales of 370,000 artisanalstoves. Results are summarized in the Table below.
Estimated Yearly Sales of Kerosene Stoves in Jakarta
Type of stove Yearly sales Market Share
Factory made 130,000 26XArtisanal sold via market 190,000 38XArtisanal sold house-to-house 180,000 36X
Total 500,000 100X
- 115.
APPENDIX Im
A POUCY AND PROGRAM STRATEGY FOR
MORE EFFICIENT HOUSEHOLD ELECICITY USE IN INDONESIA 1/
FEBRUARY 1990
1/ Prepared by Lee Sd*p, L.www Betey LAbcwtoy.
- 116 -
TABLE OF CONTENTS
I. THE PATTERN OF HOUSEHOLD ELECTRICITY CONSUMPTION INI)ONESA ..................................................... 118Introduction: The Household Energy Survey ............................ 118Main Findings: Household Electricity Use in Urban Java ... ............. ... 120
International Comparisons ............... ...................... 129
EL PRESENT SITUATION IN INDONESI: EXISTING AND NEW APPLIANCES ..... 132Survey: Existing Appliances ......................................... 132
Lighting ................................................... 133Refrigerators and Freezers ..................................... 133Air Conditioners ............................................ 136Washing Machines ........................................... 136Television ................................................. 136WaterPumps ............................................... 137Irons . ................................................... 137Fans . ..................................................... 137Rice Cookers ............................................... 137Other Appliances ............................................ 138
Issues in the Appliance Market ....................................... 138Appliance Manufacturers in Indonesia .................................. 139
The Role of Foreign Producers of Electric Appliances Sold in Indonesia ... 140
AIL POTENTIAL FOR IMPROVING THE EMCIENCY OF ELECTRICITY USE ...... 142Technical Conservation Potential ................................ 143Behavioral/Management Strategies ............................... 149
Barriers to More Efficient Electricity use in Indonesia ...................... 152Information ................................................ 152Buying Habits and Environment ................................. 152First Cost and Quality ........................................ 153Electricity Prices ............................................ 154Other Problems ............................................. 154
IV. REGULATIONS: TESTING, STANDARDS, AND NORMS FOR ELECTRICAPPLIANCES .................................................... 155
Regulation and Standards ...................................... 155Regulations in Indonesia that Apply to Household Appliances .... ...... 156Establishing Testing and Regulatory Standards for Electric Appliances in
Indonesia ................................................ 157
V. AN ELECTRICITY EFFICIENCY PROGRAM FOR INDONESIA ..... ........... 162Introduction . ..................................................... 162Proposed Electricity Conservation Program for Indonesia .................... 169
- 117-
Information Interventions ....................................... 170Available Information on Appliances .......... .. ................. 170Testing and Labelling of New Appliances ......... .. ............... 170Metering of Actual Appliance Energy Use .......... ............... 173Labelling and Information Requirements ......... ................. 173Consumer Outreach: Increasing Consumer Appliance Literacy .......... 174Demonstrations and Government Procurement ......... ............. 175Information Program: Summary and Time Frame ........ ............ 176
Technical Interventions: Producing and Selling More Efficient Appliances ........ 177Voluntary Agreements: Targets for Efficiency .......... ............. 177Minimum Efficiency Standards ............... ................... 178Research in Indonesia .................. ...................... 179Technical Interventions: Summary and Time Frame ....... ........... 180
Incentive Programs ................................................ 180Indicative Benefits and Costs of the Efficiency Program ......... ............ 181
TABLESTable 1.1: Urban Residential Electricity Consumption by Tariff Category .... ......... 119Table 1.2: Electricity Consumption by Expenditure Group ........................ 121Table 1.3: Electricity Consumption per Appliance by Expenditure Group .... ......... 123Table 2.1: Percentage of Households in Tariff-source Category Using Each Device ...... 132Table 5.1: Components of Future Electricity Use and Potential Savings ..... ......... 163Table 5.2: Urban Electricity Conservation Program Costs and Benefits ..... ......... 183
FIGURESFigure 1.1: Appliance Ownership On Java, UHESS Survey ........................ 122Figure 1.2: Monthly Urban Residential Electricity Use and Expenditure, UHESS Survey . 124Figure 1.3: Urban Residential Electricity Use By Major End Use ................... 126Figure 1.4: Household Electricity Use For Common Appliances, UHESS Survey .... ... 127Figure 1.5: Household Electricity Use For Uncommon Appliances, UHESS Survey ...... 128Figure 1.6: Urban Residential Electricity Use in Indonesia and Major OECD Countries . . 130Figure 2.1: Appliances Ownership by Expenditure Group, UHESS Survey .... ........ 135Figure 3.1: Wattage vs. Size of 2 Door + Refrigerators .......................... 146Figure 3.2: Energy Efficiency Ratio vs. Capacity of Room Air Conditioners .... ....... 147Figure 3.3: Wattage vs. Size of Color Television in Indonesia ..................... 148Figure 3.4: Electricity Use of Common Appliances in Indonesia: Present Stock and
Advanced Models ........................................... 150Figure 3.5: Electricity Use of Uncommon Appliances in Indonesia: Present Stock and
Advanced Models ........................................... 151Figure 5.1: Impact of More Efficient Appliances on Future Electricity Use .... ........ 166Figure 5.2: Household Electricity use on Java: Potential Impact of Greater
Efficiency in 2008 ............................................ 167
REFERENCES
* 118 -
I. THE PATrERN OF HOUSEHOLD ELECTICITY CONSUMPTION IN INDONESIA
Introduction: The Household Energy Survey
1.1 In order to quantify the potential for more efficient household energy use inIndonesia, it was necessary to carry out a detailed survey of energy and e.lectricity use, under theUrban Household Energy Strategy Study (UHESS). While this survey is described in detail inAppendix 1, we review some of its important features as they pertain to electricity use, efficiency,and conservation potential.
1.2 The UHIESS survey was based on a sample of 2700 households chosen at randomfrom the existing SUSENAS sample frame. The sample was stratified by urban area size so as tobe representative of all of Urban Java. (Previous urban surveys reached only larger cities.) Themain questions covered household size, total household expenditures, information about cookingand other energy uses for fossil fuels or biomass, and detailed questions about electricity usingequipment and consumption patterns. These questions covered electricity tariff type, applianceownership and characteristics (size, age, features like no-frost), average wattage and/or hours ofuse, why appliance bought, and who decided about buying the appliance. The survey also recordedtotal electricity consumption (as well as consumption of other forms of energy) over the previousyear. The answers to all of these questions varied significantly among sample households.
1.3 Other aspects of consumption that were investigated include hours of use ofappliances, wattage of appliances, age of appliance, and whether nor not the interviewed householdengaged in sharing of electricity (as a buyer or seller) with neighbors. Estimates of usage and agewere fraught with uncertainty, but these were used as clues to the average electricity use for eachappliance.
1.4 Table 1.1 shows important characteristics of the different consuming households onJava. According to the UHESS, approximately 15% of surveyed households had no source ofelectricity, while 22% obtained electricity from neighbors. 5% were connected to PLN through the"social" tariff, while the majority of the remaining homes were connected to PLN through one ofthe tariffs R1-R4. (Tariff types are explained below). About 1% of homes surveyed either boughtelectricity from non-PLN generation sources, or used batteries. Thus the present survey goesbeyond previous efforts through coverage of a significant number of homes that are officially"unelectrified" yet obtain electricity indirectly from the grid.
1.5 Weighting the sample to the entire population proved difficult. The correctweightings of the numbers of consumers in each tariff group that yield total urban electricity usewere elusive, since previous surveys, as well as PLNs own definitions of rural and urban used fortheir own billing, used different definitions of urban and different choices of cities. Sinceconsumption varies greatly between different tariff groups, total electricity consumption for theentire population, which depends on the weightings of the different tariff groups, is also uncertain.As a result, the extrapolation of the results from this survey to obtain total consumption on Javamay be uncertain, giving a total electricity use that is 10% higher or lower than the total sales asrecorded by PLN. In fact, differences in the relative numbers of customers by tariff group probably

Table 1.1: Urban Residential Eleccricity Consumption by Tariff Category
PL PLN Totat AllNon-Etec Indirect Si RI R2 R3 p R4 Direc Elec Households
1. Sauple Size 393 589 146 1,279 242 8 1 1,676 2,309 2,702
2. Share of HH in Survey lx) 14.5X 21.8% 5.4% 47.3% 9.0% 0.3% 0.0% 62.0% 85.5% 100.0X
3. Share of Conmex in Survey (X) - - 8.7X 76.3% 14.4% 0.5% 0.1% 100.0% 1 100.0%
4. FamiLy Size 4.1 3.8 4.6 5.1 5.9 6.4 6.0 5.2 4.7 4.6
S. Averase Consumption (kWh/no) 0 15 35 60 183 1,190 2,527 84 64 55
6. Number TSelling8 Electricity - 0 37 274 24 0 0 335 335 335
7. Estimated Sales/Seller (kWh/Mo) - 0 17 24 66 0 0 26 26 26
8. Average Net Cons. (kUh/io) 0 15 31 55 177 1,190 2527 79 60 52
9. Family Expenditure (Rp/No) 69,820 103,285 156,964 171,248 316,336 599,571 976,061 193,844 156,012 143,476 v
10. Rp/No for Electricity 0 2,360 2,824 5,238 18,146 172,032 382,739 8,098 6,447 5,509
11. Rp with Fixed Charge - - 4,924 7,338 20,246 175,112 385,419 - - -
12. Share of Exp. for Electricity - 2.3% 1.8% 3.1% 5.7% 28.7% 39.2% 4.2% 4.1% 3.8%
13. Share with Fixed Cost - - 3.1% 4.3% 6.4% 29.2% 39.5% - - -
14. Maxmumn Load, kVA - - <0.20 0.25-0.5 0.5-2.2 2.2-6 >6 - - -
15. Fixed monthly Charge - - 2,100 2,100 2,100 3,080 2,680
16. Rps/kWH, 1988 Tariff - - 0 70.5 84.5 126.5 158
p At least 1 R3 Household and the R4 Household, were engaged in business activities.
- 120 -
accounts for a great deal of the difference between the present results and those in an earlier PLNsurvey, which found significantly higher electricity use per customer. But the present survey stilldescribes in detail the consumption patterns of different households which taken together, representthe situation in 1988 on Java.
1.6 The number of homes using PLN electricity as supplied by neighbors is very large,nearly 22% of all households surveyed. Table 1.1 shows which households "sold" electricity, about20% of Si and Rl households, and 10% of R2 households (It is likely that R3 and R4 householdsare found only in neighborhoods of virtual saturation of electricity connections, hence there a, e no"customers" for these households. Sales by SI and Ri are limited by the low value of connected loadthat these customers are permitted. The consumption of the buyers/users was estimated, not billed,but was thought to be very low, around 15 kWh/mo. This electricity, which was billed to the Si,RI, and R2 customers, is reallocated to the 25% of households with electricity who buy from PLNcustomers in our own analysis. This means that electricity use per home with electricity isapproximately 25% less than electricity consumption per electrified PLN customer, another factoraccounting for differences between the present survey and previous surveys. Indeed, when thisfactor is applied, the consumption per official connection, which first appeared high by internationalstandards, falls close to levels experienced in other urban LDC areas. It appears. therefore, thatselling of electricity between households has an important impact on the interpretation of the surveyresults.
Main Findings: Household Electricity Use in Urban Java
1.7 We examined first the consumption in households as a function of the tariff they use.Consumption among PLN customers, as shown in Table 1.1, varies greatly between tariff groups,although the majority of users consume less than 75 kWh/mo. The number of high (Tariff groupsR3 and R4) consumers is very small, but their consumption is very high, which raises the averageper electrified household to 85 kWh/mo among PLN customers. This value is high by internationalstandards for urban LDC consumers. The high standard deviation is not unusual and is intrinsic tothe way residential electricity use differs even among similar households But the small number ofR3 and R4 households and the large scatter among R2 consumers limits our ability to probepatterns further using tariff category as an important strata.
1.8 The ownership of appliances varies significan.ly among these tariff groups. This isnot surprising, since average household expenditures, which indicate a household's ability to affordappliances, vary significantly from one tariff group to the next. Among households obtainingelectricity from neighbors ("non-PLN" in Fig. 1.1), appliance holdings are very low. Ever. amongSi (social) customers, only TV was found in more than 50% of homes (mostly BW), while irons andfans were found in less than 30% of homes, and heavy appliances (water pump, refrigerators, A/C,washers) in less than 2% of homes. In RI-type households, small appliances are more common,but large appliance holdings are still limited (refrigerators, 10%; pump, 9%). Recall, too (Table 1.1)that the connected load for SI and RI customers is very limited; these homes cannot have manylarge appliances running at any one time. Ownership of appliances in the smaller R2 group issignificantly higher than in RI. But appliance ownership among households surveyed that used the
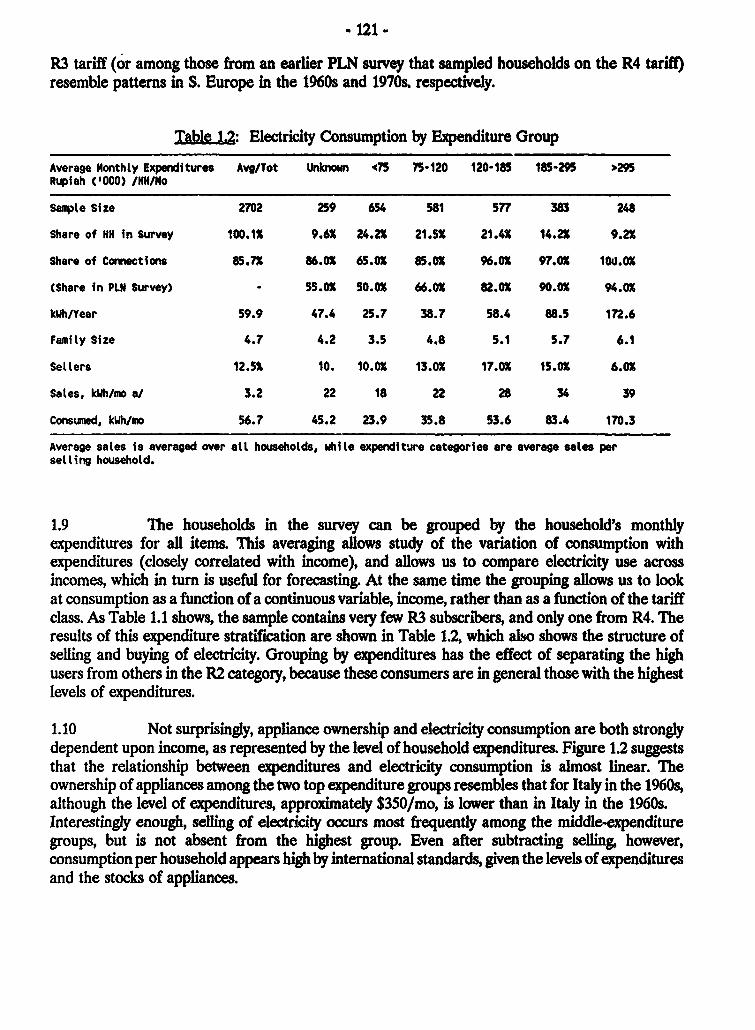
- 121 -
R3 tariff (or among those from an earlier PLN survey that sampled households on the R4 tariff)resemble patterns in S. Europe in the 1960s and 1970s. respectively.
TabJl 1.2: Electricity Consumption by Expenditure Group
Average Monthty Expenditures Avg/Tot Unknown <75 75-120 120-185 185-295 2495Rupiah (t000) /IN/No
Sample Size 2702 259 654 581 577 383 248
Share of NH in Survey t00.1X 9.62 24.22 21.5X 21.4X 14.2X 9.2X
Share of Connections 85.7 8$6.0X 65.02 85.02 96.02 97.02 100.02
(Share in PLN Survey) - 55.02 50.02 66.02 82.02 90.02 94.02
kWh/Year 59.9 47.4 25.7 38.7 58.4 88.5 172.6
Family Size 4.7 4.2 3.5 4.8 5.1 5.7 6.1
Setters 12.52 10. 10.02 13.02 17.02 15.02 6.02
Sates, kWh/mo a/ 3.2 22 18 22 28 34 39
Consumed, kWh/mo 56.7 45.2 23.9 35.8 53.6 83.4 170.3
Average sales is averaged over alt households, while expenditure categories are average sates perselling household.
1.9 The households in the survey can be grouped by the household's monthlyexpenditures for all items. This averaging allows study of the variation of consumption withexpenditures (closely correlated with income), and allows us to compare electricity use acrossincomes, which in turn is useful for forecasting. At the same time the grouping allows us to lookat consumption as a function of a continuous variable, income, rather than as a function of the tariffclass. As Table 1.1 shows, the sample contains very few R3 subscribers, and only one from R4. Theresults of this expenditure stratification are shown in Table 1.2, which also shows the structure ofselling and buying of electricity. Grouping by expenditures has the effect of separating the highusers from others in the R2 category, because these consumers are in general those with the highestlevels of expenditures.
1.10 Not surprisingly, appliance ownership and electricity consumption are both stronglydependent upon income, as represented by the level of household expenditures. Figure 1.2 suggeststhat the relationship between expenditures and electricity consumption is almost linear. Theownership of appliances among the two top expenditure groups resembles that for Italy in the 1960s,although the level of expenditures, approimately $350/mo, is lower than in Italy in the 1960s.Interestingly enough, selling of electricity occurs most frequently among the middle-expendituregroups, but is not absent from the highest group. Even after subtracting selling, however,consumption per household appears high by international standards, given the levels of expendituresand the stocks of appliances.
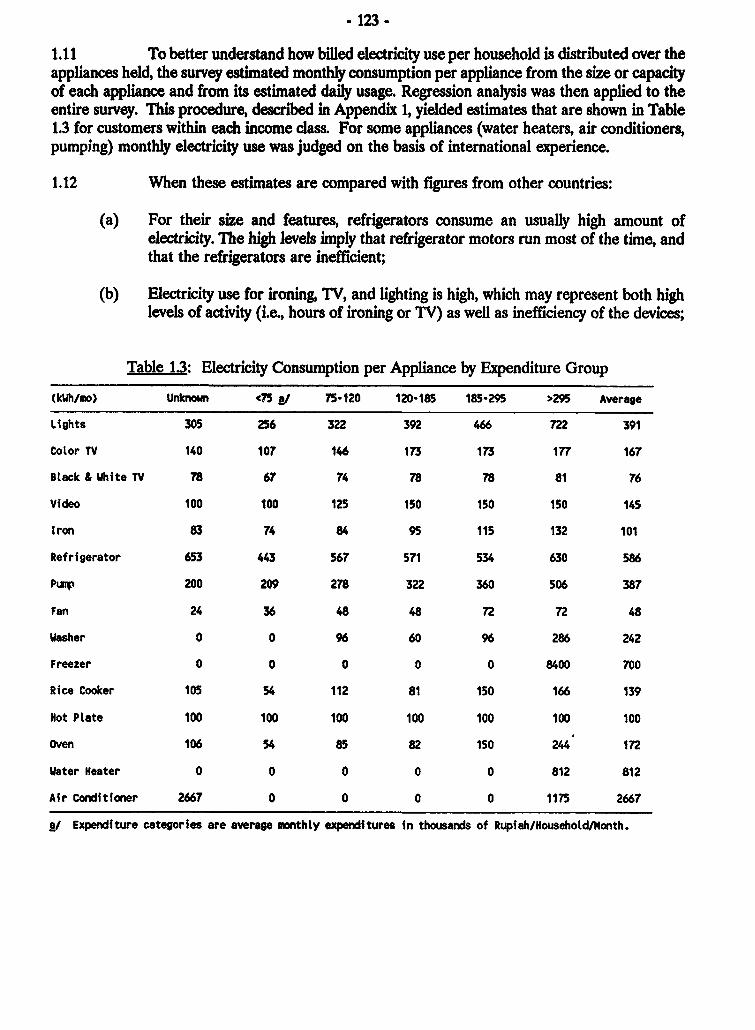
- 123 -
1.11 To better understand how billed electricity use per household is distributed over theappliances held, the survey estimated monthly consumption per appliance from the size or capacityof each appliance and from its estimated daily usage. Regression analysis was then applied to theentire survey. This procedure, descrbed in Appendix 1, yielded estimates that are shown in Table1.3 for customers within each income class. For some appliances (water heaters, air conditioners,pumping) monthly electricity use was judged on the basis of international experience.
1.12 When these estimates are compared with figures from other countries:
(a) For their size and features, refrigerators consume an usually high amount ofelectricity. The high levels imply that refrigerator motors run most of the time, andthat the refrigerators are inefficient;
(b) Electricity use for ironing, TV, and lighting is high, which may represent both highlevels of activity (i.e., hours of ironing or TV) as well as inefficiency of the devices;
Table 1.3: Electricity Consumption per Appliance by Expenditure Group
(kWh/mo) Unknowin <75 P/ 75-120 120-185 185-295 >295 Average
Lights 305 256 322 392 466 722 391
Color TV 140 107 146 173 173 177 167
Black & White TV 78 67 74 78 78 81 76
Video 100 100 125 150 150 150 145
Iron 83 74 84 95 115 132 101
Refrigerator 653 443 567 571 534 630 586
,ump 200 209 278 322 360 506 387
Fan 24 36 48 48 72 72 48
Washer 0 0 96 60 96 286 242
Freezer 0 0 0 0 0 8400 700
Rice Cooker 105 54 112 81 150 166 139
Hot Plate 100 100 100 100 100 100 100
Oven 106 54 85 82 150 244 172
Water Heater 0 0 0 0 0 812 812
Air Conditioner 2667 0 0 0 0 1175 2667
A/ Expenditure categories are average monthly expenditures in thousands of Rupiah/Household/Month.
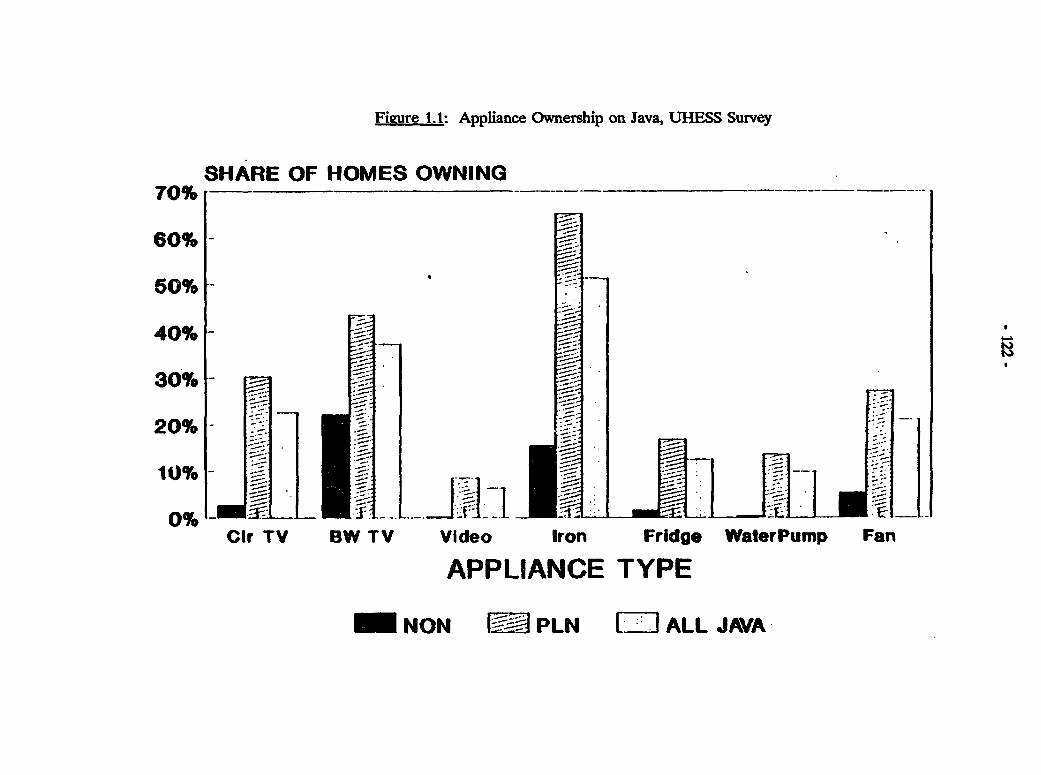
Figure 1.1: Appliance Ownership on lava, UHESS Survey
SHARE OF HOMES OWNING70%
60%-
60%-
40%-
30%-
20%-
10%-
0%- A Cir TV SW TV Video Iron Fridge WaterPump Fan
APPLIANCE TYPE
NON F PLN ZALL JAVA
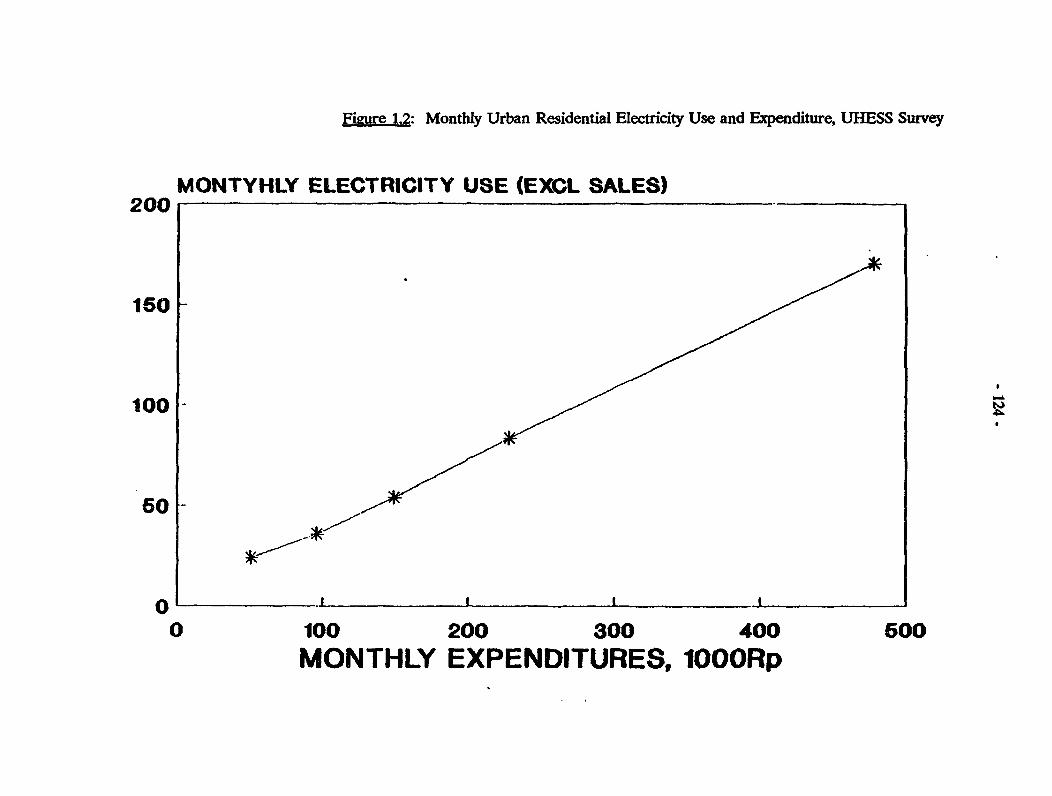
Figure 1.2: Monthly Urban Residential Electricity Use and Expenditure, UHESS Survey
MONTYHLY ELECTRICITY USE (EXCL SALES)200
160
100-
60-
0 _0 100 200 300 400 600
MONTHLY EXPENDITURES, 100ORp
-125-
(c) Unit consumption for most purposes is likely to be higher in higher income (uppertariff) households, because these house-holds own larger appliances.
1.13 It is always possible that these unit consumption levels are overestimated. If thiswere true, however, the "miscellaneous" or unaccounted-for consumption would have been muchhigher than is shown in the summary tables (Appendix 1). But this would imply that either thesurvey omitted important end-uses, which is not the case, or that the few miscellaneouses uses weregrossly underestimated. Both of these possibilities are ruled out by experience in other countries(Schipper et al. 1987). We believe therefore that these unit consumptions estimates are reasonable.The picture presented here then gives an accurate portrayal of household electricity use in urbanJava and allows us to conclude that electricity use in homes in Indonesia is unusually high.
1.14 From the survey and the estimates of unit consumption we can derive the shares oftotal electricity use devoted to the major end-uses. These are illustrated in Figure 1.3. It can beseen that for all households in the survey, lighting is the most important use, followed b", ironing,then TV, then refrigeration. Use for water heating and cooking is small because few householdshave major appliances that provide these services; use for washing is also minor today because thefew washing machines utilize ambient water with no heating. But this aggregate picture ismisleading. If we estimate the shares of electricity used for each purpose for each expendituregroup, the shares of use for each purpose vary considerably (Fig. 1A). For low income homes,lighting and TV still dominate, as expected. For the highest incomes, refrigeration, pumping, and"other", which includes cooking and water heating and cooling (shown in Fig. 1.5) increase inimportance. (Water heating appears to be a minor end use, but we expect it to increase as it hasin other warm developing countries, such as Brasil). A conservation program must be aimed bothat uses that predominate today, as well as uses that will be important in the future.
1.15 Using average electricity prices in each tariff group, we calculated the ratio ofexpenditures on electricity to total expenditures (Table 1.1). This ratio rises rapidly from the levelof non-PLN households (2% of expenditures) to R2 households (6%). One reason is that theownership of appliances rises rapidly as households approach the level of expenditures of R2households. Electricity consumption patterns among R2 consumers represent those of homes thathave had connections long enough to accumulate appliances. The patterns of the R3 group areheavily influenced by the use of air conditioning (even more so for the R4 customers surveyedpreviously by PLN; the one R4 in the present survey is an anomaly, and may have been runninga business). High consumption in R3 is suggestive of elevated levels of use for lighting (2400kWh/year, or twice the U.S. level) and refrigeration (1000 kWh/yr per refrigerator, close to the U.S. level). Such high levels imply considerable room for more efficient use of electricity.
1.16 The comparisons across tariff group are reflected by comparisons across expendituregroups. The R2 group has an average expenditure level midway between those of the two highestexpenditure groups (as tabulated by the present survey). Appliance ownership levels in these homesare comparable to those in many other urban areas of developing countries. This comparisonsuggests that the R2 group, or alternatively, the groups with the highest expenditures, representmodels for consumption patterns we can expect to arise in Indonesia as incomes grow. That is,household electricity use will grow rapidly during a certain period in which a home is rapidlyacquiring minor and then major appliances. A doubling of household income in Indonesia (14 yearsgrowth at 5%/annum), if applied to all levels of incomes/expenditures, would allow the "moderate"
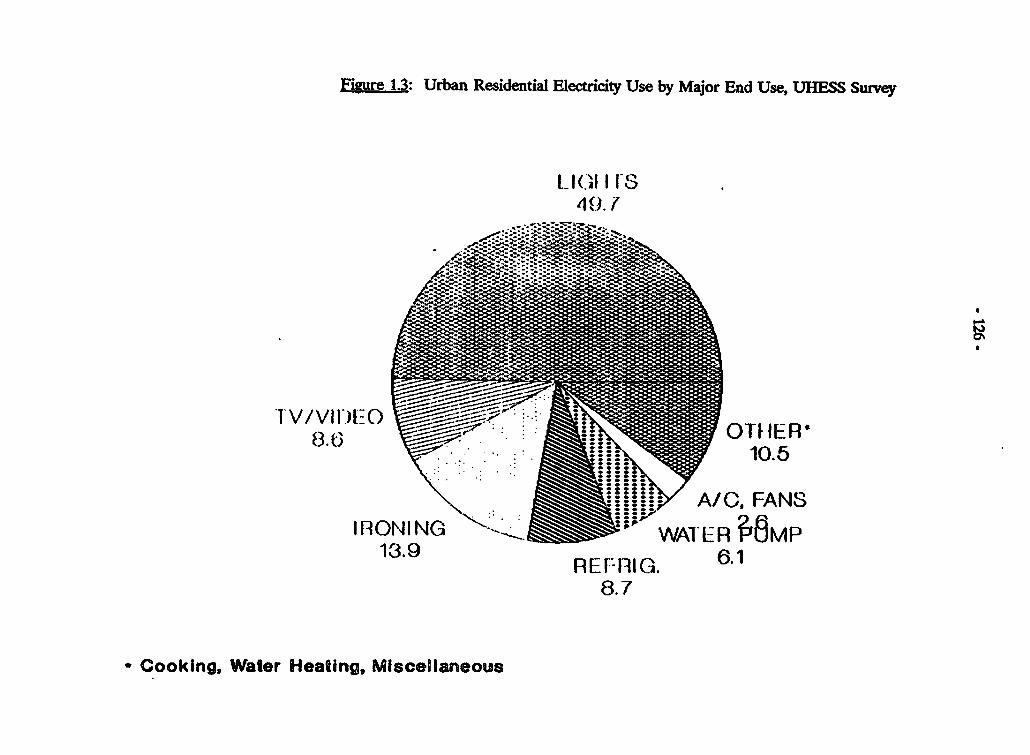
Figure 1.3: Urban Residential Electricity Use by Major End Use, UHESS Survey
LIG(I II-S49'.1
1 V/E3VII; I C) tgOTT /ERN ~~10.6
A/C, FANSIRONING \-- WAl1ER P'MP
13.9 FREFRIG. 6.1
8.7
Cooking, Water Heating, Miscellaneous
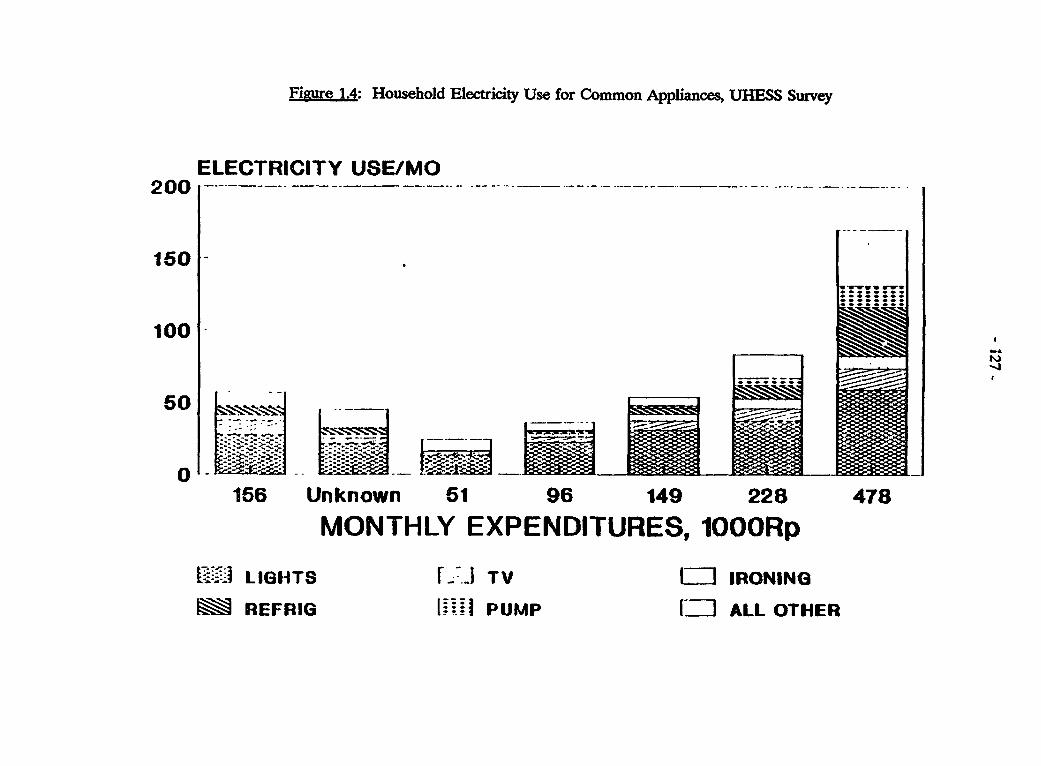
Figure 1.4: Household Electricity Use for Common Appliances, UHESS Survey
ELECTRICITY USE/MO
150-
100
50
156 Unknown 61 96 149 228 478
MONTHLY EXPENDITURES, 100ORp
- LIGHTS I T TV L T IRONING
M REFRIG I --- PUMP LI ALL OTHER
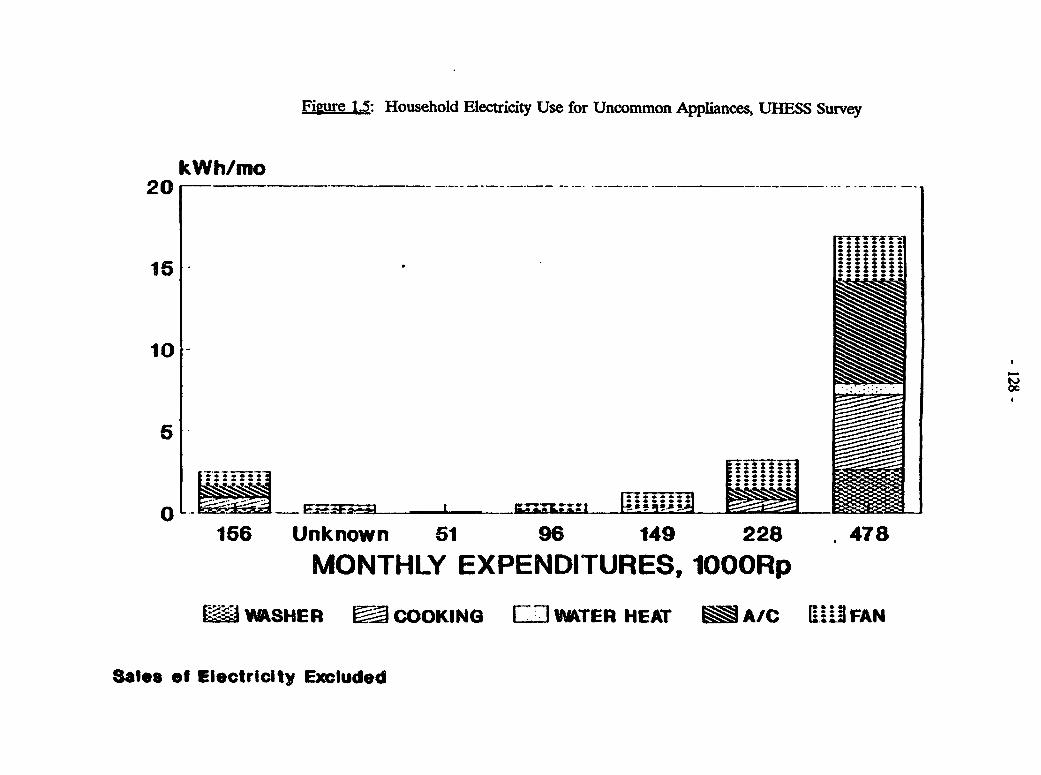
Figure 1.5: Household Electricity Use for Uncommon Appliances, UHESS Survey
kWh/mo20-
15 ........
10 -
I i. ixx.:: W Fi
166 Unknown 51 96 149 228 478
MONTHLY EXPENDITURES, 100ORp
MI VPHHER IZCOOKING EVQER HEAT A/C 10U1FAN
8a1es of Electricity Excluded
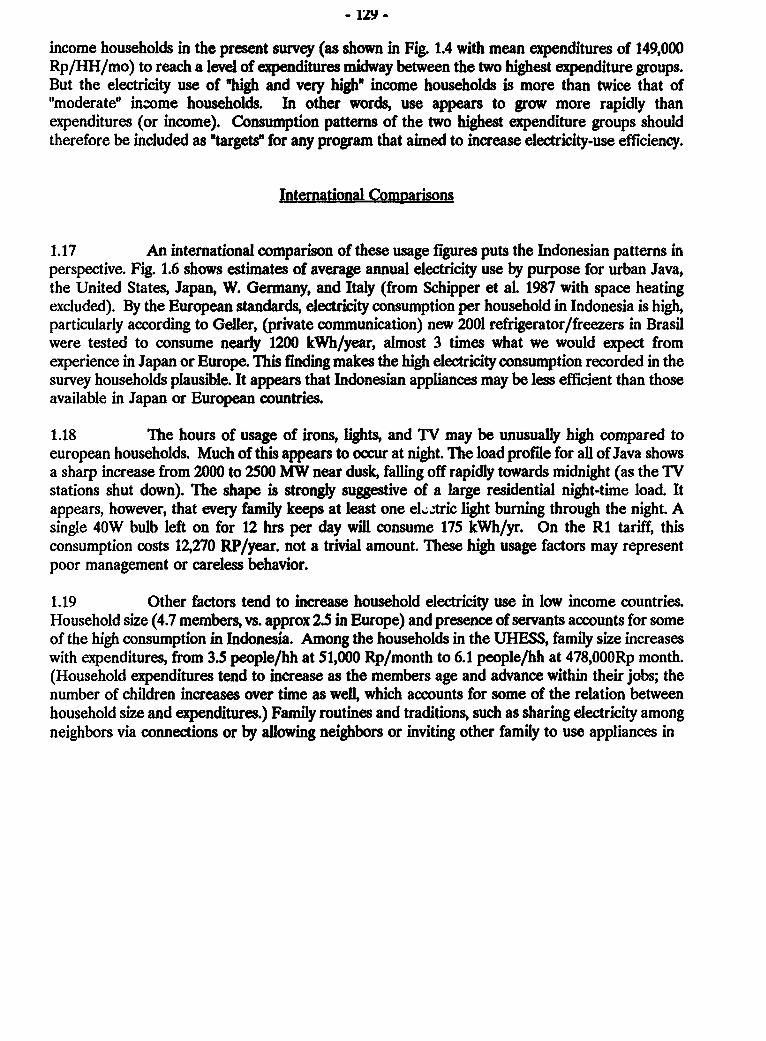
- 1Z9 -
income households in the present survey (as shown in Fig. 1.4 with mean expenditures of 149,000Rp/HH/mo) to reach a level of expenditures midway between the two highest expenditure groups.But the electricity use of 'high and very high" income households is more than twice that of"moderate" income households. In other words, use appears to grow more rapidly thanexpenditures (or income). Consumption patterns of the two highest expenditure groups shouldtherefore be included as "targets" for any program that aimed to increase electricity-use efficiency.
International Compaisons
1.17 An international comparison of these usage figures puts the Indonesian patterns inperspective. Fig. 1.6 shows estimates of average annual electricity use by purpose for urban Java,the United States, Japan, W. Germany, and Italy (from Schipper et aL 1987 with space heatingexcluded). By the European standards, electricity consumption per household in Indonesia is high,particularly according to Geller, (private communication) new 2001 refrigerator/freezers in Brasilwere tested to consume nearly 1200 kWh/year, almost 3 times what we would expect fromexperience in Japan or Europe. This finding makes the high electricity consumption recorded in thesurvey households plausible. It appears that Indonesian appliances may be less efficient than thoseavailable in Japan or European countries.
1.18 The hours of usage of irons, lights, and TV may be unusually high compared toeuropean households. Much of this appears to occur at night. The load profile for all of Java showsa sharp increase from 2000 to 2500 MW near dusk, falling off rapidly towards midnight (as the TVstations shut down). The shape is strongly suggestive of a large residential night-time load. Itappears, however, that every family keeps at least one el"tric light burning through the night. Asingle 40W bulb left on for 12 hrs per day will consume 175 kWh/yr. On the RI tariff, thisconsumption costs 12,270 RP/year. not a trivial amount. These high usage factors may representpoor management or careless behavior.
1.19 Other factors tend to increase household electricity use in low income countries.Household size (4.7 members, vs. approx 2.5 in Europe) and presence of servants accounts for someof the high consumption in Indonesia. Among the households in the UHESS, family size increaseswith expenditures, from 3.5 people/hh at 51,000 Rp/month to 6.1 people/hh at 478,00ORp month.(Household expenditures tend to increase as the members age and advance within their jobs; thenumber of children increases over time as well, which accounts for some of the relation betweenhousehold size and expenditures.) Family routines and traditions, such as sharing electricity amongneighbors via connections or by allowing neighbors or inviting other family to use appliances in
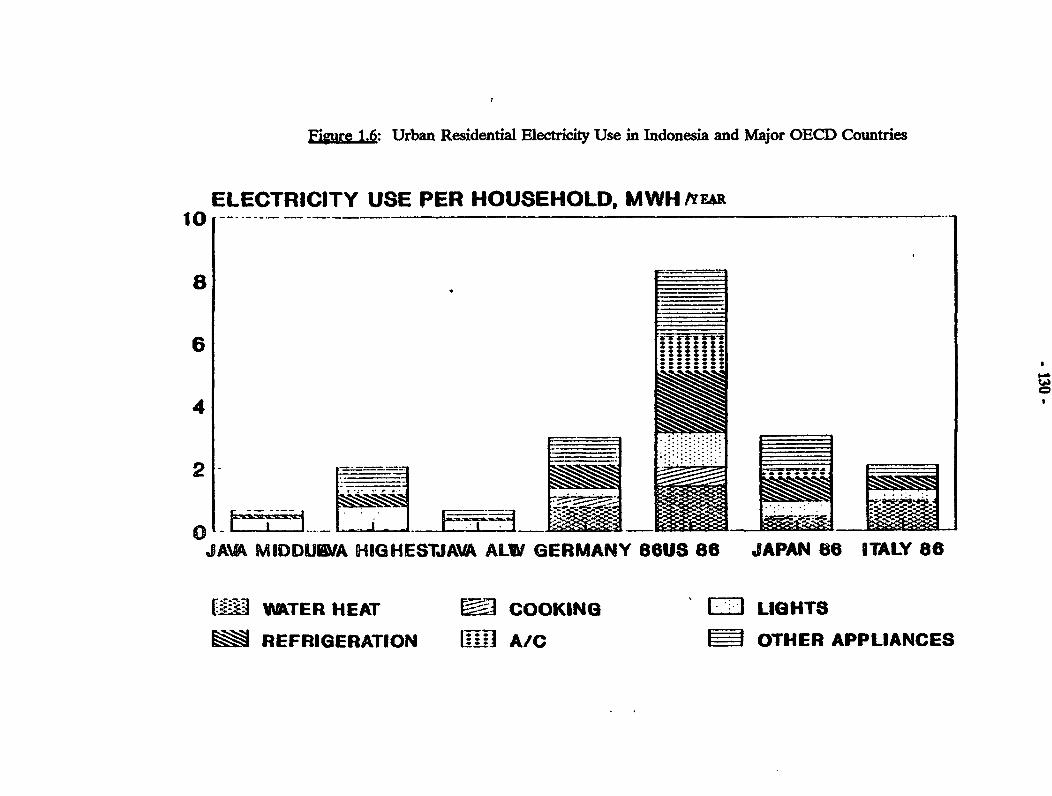
Figure 1.6: Urban Residential Electricity Use in ndonesia and Major OECD Countries
ELECTRICITY USE PER HOUSEHOLD, MWH /YEaR10 ......
4
2 _ _
JANA MIDDULJA HIGHESTJAVA ALW GERMANY SOUS 86 JAPAN 86 ITALY 86
VER HEAT - COOKING ] LIeHTSREFRIGERATION lL A/C OTHER APPLIANCES
- 131 -
households that are electrified also increases household use. It is also likely that some "homes" maybe businesses taking advantage of lower rates as residential customers. But it is diffi'cult not toconclude that on average, residential electricity use in Indonesia is high compared with the numberand kinds of appliances present in homes. This means that use is inefficient.
1.20 An efficiency program that encouraged more efficient appliances (and more carefuluse) could affect electricity use by changing the first two of these three components of highelectricity use, technology and behavior/management. Gradual evolution of lifestyles in Indonesia,as families become smaller and more consumers have their own electricity and appliances, will likelyreduce high use caused by the third factor. In the following chapters, we investigate in detail howsuch a program might be structured.
1.21 The present survey addresses electricity use in urban Java alone. Since Javarepresents the greatest concentration of wealth (and appliance availability) in Indonesia, the surveyresults do not reflect consumption patterns in other parts of Indonesia, or in rural areas. Indeed,the PLN urban survey confirms that homes in other parts of Indonesia tend to use less electricitythan homes in Java, even controlling for Tariff class. But the appliances are basically similar in allof Indonesia, although size and features may vary around the country. The basic uniformity of theappliance stock, however, implies that the same inefficient use that apparently characterizes urbanJava may apply to other regions. Similarly, efforts to improve the stock of appliances in Java woulddoubtless have an impact on other islands. Therefore, the thrust of our discussion, while basedprimarily on survey results and other information from Java, will have general validity in all ofurban Indonesia.
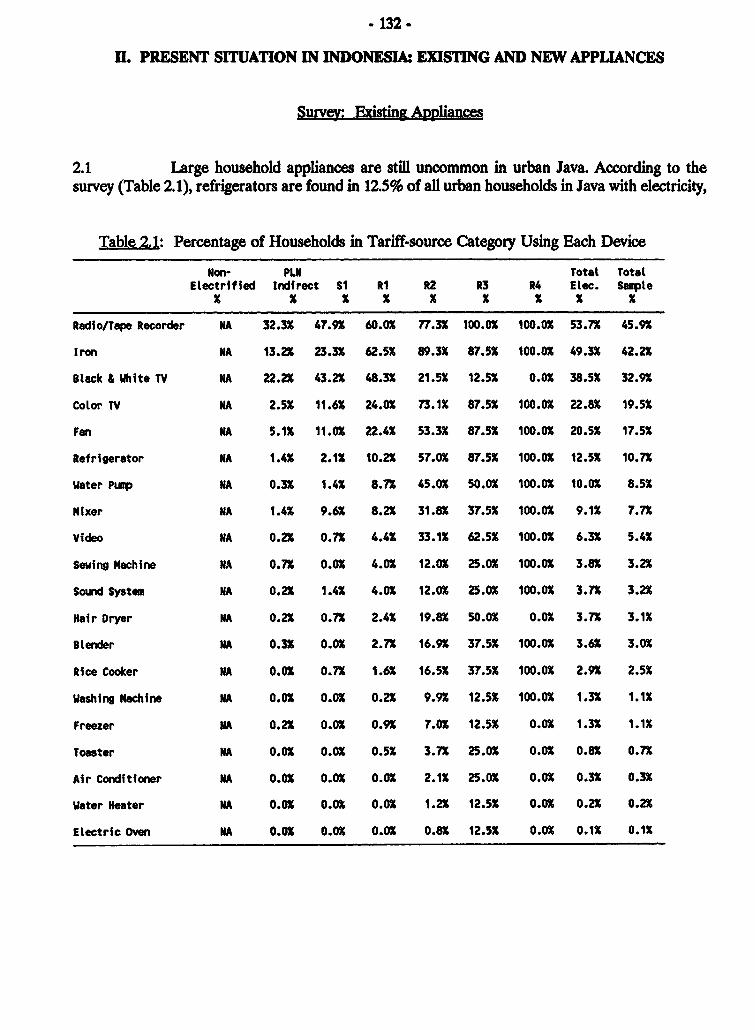
* 132-
H. PRESENT SrrUATION IN INDONESIA: EXISTING AND NEW APPLIANCES
SuRvey: Existing Appliances
2.1 Large household appliances are still uncommon in urban Java. According to thesurvey (Table 2.1), refrigerators are found in 12.5% of all urban households in Java with electricity,
Table 2,1: Percentage of Households in Tariff-source Category Using Each Device
Non- PLN Total TotalEtectrified Indirect S1 RI R2 R3 R4 Elec. Sampte
Radio/Tape Recorder NA 32.32 47.92 60.0X 77.32 100.02 100.02 53.7K 45.92
Iron NA 13.22 23.32 62.52 89.3X 87.5X 100.0X 49.32 42.22
Black & White TV NA 22.22 43.22 48.32 21.52 12.5X 0.0 38.52 32.92
Color TV NA 2.52 11.62 24.02 73.12 87.52 100.02 22.82 19.52
Fan NA 5.12 11.02 22.42 53.3X 87.52 100.02 20.5X 17.52
Refrigerator NA 1.42 2.1X 10.22 57.02 87.52 100.02 12.52 10.72
Water Pump NA 0.32 1.42 8.72 45.02 50.02 100.02 10.02 8.52
Mixer NA 1.42 9.62 8.22 31.82 37.52 100.02 9.12 7.72
Video NA 0.2X 0.72 4.42 33.12 62.52 100.02 6.32 5.42
Sewing Machine NA 0.72 0.02 4.02 12.02 25.02 100.02 3.82 3.2X
Sound System NA 0.22 1.42 4.02 12.02 25.0X 100.0X 3.72 3.2X
Hair Dryer NA 0.2X 0.7X 2.42 19.82 50.02 0.02 3.7X 3.12
Blender NA 0.32 0.02 2.72 16.92 37.52 100.02 3.62 3.02
Rice Cooker NA 0.02 0.72 1.62 16.52 37.52 100.02 2.92 2.52
Washing Machine NA 0.02 0.02 0.22 9.9X 12.52 100.02 1.32 1.12
Freezer NA 0.2X 0.02 0.92 7.02 12.52 0.02 1.32 1.12
Toaster NA 0.02 0.02 0.52 3.7X 25.02 0.02 0.82 0.7X
Air Conditioner NA 0.0 0.02 0.02 2.1X 25.02 0.0 0.32 0.32
Water Heater NA 0.02 0.02 0.02 1.22 12.52 0.02 0.22 0.22
Electric Oven NA 0.02 0.02 0.02 0.8K 12.52 0.02 0.12 0.12
* 13i -
washers are found in 2.5% of all homes with electricity, A/C in 0.3% of homes, TV in 58%, andwater pumps in 10% of all homes with electricity. Fans, irons, and small kitchen appliances makeup the other group of appliances found in 20% or more homes. Present residential electricity usein Java is dominated by lighting, TV, and irons.
2.2 "his pattern is changing rapidly. Sales of major appliances are up. In the long run,the ownership e.f the heavy appliances should continue to grow, and the electricity consumption ofthese devices wzill come to dominate total household electricity use. It is important, then, toconsider appliances that are becoming popular, not simply those already in many or most homes.Establishing the pattern of present use, as well as the sales volume and characteristics of newappliances, is a necessary step in finding the most important targets for improving efficiency ofelectricity use.
2.3 To evaluate the present and future appliance market, five majorJapanese/Indonesian appliance companies were interviewed, as was Philips. Official sales data wereobtained (estimated from imports and production in a variety of Indonesian trade and productionstatistics), complemented by data provided by NationaL by Sharp (covering ali Japanese companiesin Indonesia), and from a survey commissioned b: a non-Indonesian company contemplatingentering the market there. These sources showed little agreement on the numbers of appliancesmanufactured or sold in Indonesia, nor did they indicate the share of purchases by households (asopposed to small stores, restaurants, or other establishments). Thus the figures reported here areapproximate. One important trend revealed by the non-Indonesian source is that the size of themarket shrank between 1982 and 1985, presumably in response to the lower oil earnings inIndonesia.
2.4 Table 2.1 and Figure 2.1 review ownership patterns of major appliances in urbanhouseholds. In comparison with the figures for total stock, the sales of refrigerators, freezers,washers, pumps, and A/C are significant: ownership is growing rapidly. Improving the efficiencyof most existing appliances is difficult, although proper maintenance and careful use will reduceelectricity needs. Improving the efficiency of new appliances relative to those already in place willhave a more significant effect on future electricity consumption, because (i) the new appliance stockis growing rapidly, and (ii) new appliances tend to be considerably more efficient than older onesalready in place.
Lighting
2.5 Lighting is found in virtually every electrified home. It appears that most homeshave at least one fluorescent light, as well as 4-5 incandescent lights ranging from 25W to 40W each.According to Philips (with 50% of the market), fluorescent lighting is more common in rural areaswhere grid connection wattage is low, and even PL and SL type lamps are found. The surveyindicates that at least one light is kept on for 12 hours by each household.
Refrigerators and Freezers
2.6 Refrigeration equipment is found in about 12% of urban Java homes (about 700,000homes), according to the UHESS Study (but nearly 39% of homes with PLN electricity in all urbanIndonesia, according to the earlier PLN survey.). In the R2 tariff class, saturation of refrigerators
* 134-
jumps to 53%, and is near 90% in the R3 class, but for most homes saturation is 10% or less.However, the most popular models today are small (< 150 liters) and selling to households in thelower tariff classes. Sales of these one-door models approached 70,000 in 1987. Thus refrigeratorownership is growing rapidly. Even among 2-door models ownership is growing rapidly. Freezersare only found in 1% of Urban homes in Java, but with sales of almost 10,000 units/year (some tocommercial establishments), their importance is also growing. The total market appears to bearound 140,000 units in 1987, down somewhat from 163,000 in 1985.
2.7 Although their share in total electricity use is still small, refrigerators are the mostimportant electricity consumer among maor appliances in Indonesia. In ger.eral, one doorrefrigerators (many with small freezer compartments), one-door freezers under 175 liters, and two-door refrigerator-freezers under 200 liters are assembled in Indonesia. One-door models range insize from 50 liters to almost 200 liters, and range in price from 450,000 Rp (the best selling 135liter Amaryllis of National) to over 4 million Rp for the best and latest 3- and 4-door 400 litertypes imported directly from Japan. The one-door models often have small freezer compartments,UHESS which keep food for a few days, while the larger locally produced two-door types includefull freezers, some of which are rated at three stars, an indication that the freezer can freeze freshfood and store it safely for many months. Japanese-made models that have up to 5 doors are alsoavailable; each door covers a compartment at a certain temperature and humidity. The market isdominated by the one-door types, however. The typical new refrigerator sold in Indonesia in 1988holds roughly 150 liters of food, with one-third of all models having two doors and full freezers.By comparison, average new models sold in Europe today lie between 300 and 400 liters, and nearly2/3 are the two-door type with full (three star) freezers. Refrigerators up to 200 liters in size areassembled in Indonesia.
2.8 The average lifetime of a refrigerator is less than 10 years, according to National.The first owner keeps it for an average of 5 years. It is then sold back to a service center, or tradedfor new one, and then resold until spare parts are no longer available, i.e., < 10 years. This patternapplies to other major appliances.
2.9 The one-door machines have small freezer compartments, but these cannot freezefresh food, and can only keep already frozen food for a limited time. The two-door machines, bycontrast, have true freezers, particularly the better models. Two, three, and four door models areimported from Japan, but in 1985 these appeared to represent only 10% of the total market, ashare confirmed by figures supplied by National for 1987. In the UHESS, respondents indicatedif they had a freezer either as part of their refrigerator or as a separate device. But they did notsay whether the freezer within the refrigerator was contained in a separate compartment with itsown door or not.
2.10 Manufacturers have introduced 'electricity saving" features on their better two-doormodels. These features include rotary compressors (now with 3 year guarantees and increasinglywith circuitry that protects compressors from changes in line voltage), capacitors to limit the initialspike of current when the machine turns on, and a fan system to circulate air better (the so-calledjet system of National).
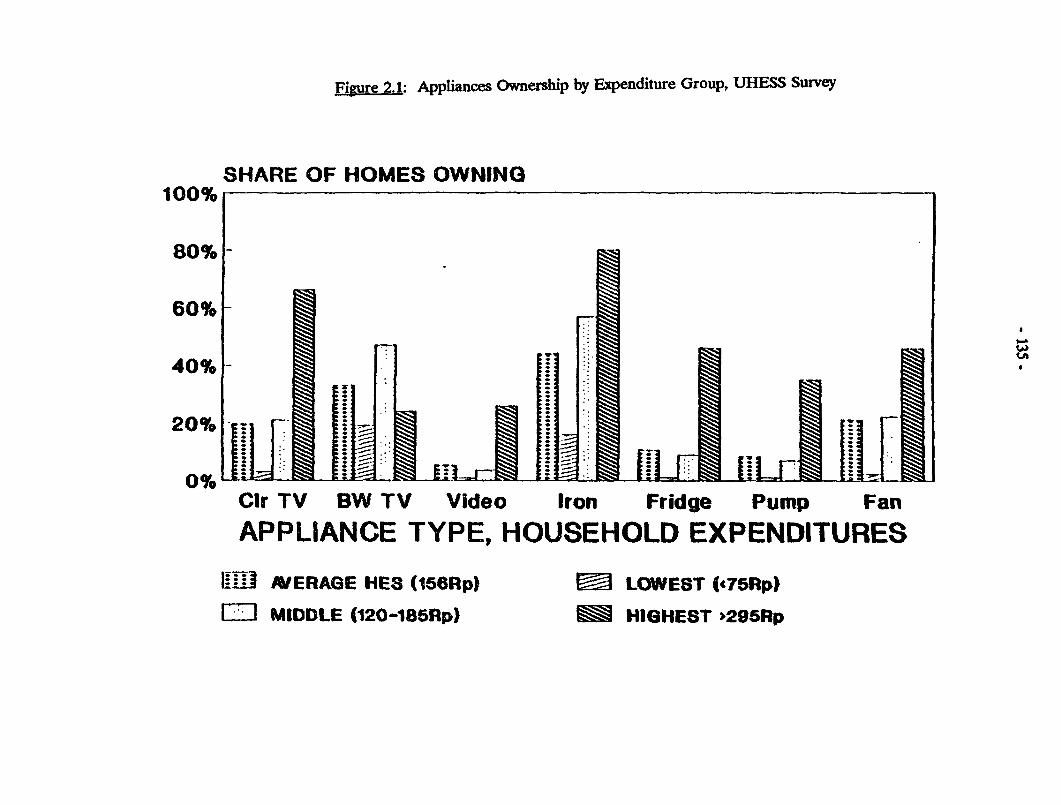
Figure 2.1: Appliances Ownership by Expenditure Group, UHESS Survey
SHARE OF HOMES OWNING100%
80% -
60%-
40%-
0% LEILLF ILCir TV BW TV Video Iron Fridge Pump Fan
APPLIANCE TYPE, HOUSEHOLD EXPENDITURES
I!iJ AVERAGE HES (156Rp) M LOWEST (475Rp)
EDI MIDDLE (120-185Rp) HlGHEST ,295Rp
- 136-
Air Conditioners
2.11 Air conditioners are found in only 0.3% of UHESS survey homes (3% of UrbanIndonesian homes, according to PLN). Like refrigerators and freezers, however, smaller A/C areselling rapidly (with a significant but unknown number sold to smaller stores, offices, and other non-residential buildings with localized air conditioning needs). Recently, National introduced a smallmodel drawing only 300 W which, in spite of its low cooling power (3000 BTU/HR, the smalleston the market), is selling well to households with limited wattage. Given the warm climate inIndonesia, we expect small and medium sized A/C units to grow rapidly in popularity.
2.12 Two kinds of A/C are sold and used in Indonesia: window type systems that coolone room only, and split systems that may cool more than one room. In a split system, the fan andcontrols are mounted in the wall, or on a console on the floor adjacent to the wall. The compressorsits outside the house, connected to the fan by a hose. The window-type systems are locally made,of considerably older technological vintage, relatively low-cost, and have energy efficiency ratios(EERs) between 7 and 11. The split systems, most of which are imported from Japan, are of veryrecent vintage, more expensive (but featuring many sophisticated controls including timers), buthave EERs that range from 10 to nearly 15. Most important, the split systems are far quieter(indoors) than the window units. Typically a unit runs all day and has a rating of 750 W.
2.13 The quality of A/C is improving. Window units dominate the market, but the splittypes are growing in popularity. The lifetime is 4-5 years. Most window-type A/C are assembledin Indonesia, while the more advanced (and generally efficient split-type) are imported. Thecompressor and electrical components are imported.
Washing Machines
2.14 Most washing machines sold and used in Indonesia are of the Japanese type, toploading and connected to ambient temperature water supply. No energy is used to heat water.Electricity powers the agitator/centrifuge and pumps. The centrifuges spin at up to 1200 RPM inthe best models, considered optimal by manufacturers since this speed removes about 50% of allmoisture in clothes. However, about 13,000 washing machines were imported from Italy in 1985.These presumably have coils to heat incoming water, the practice in Italy. They may become morepopular in the future, which could more than quadruple electricity use for a single wash.
2.15 Washing machines were found in only 1.5% of the surveyed households, almostexclusively in those with R3 connections. Since approximately 45,000 washers were imported orassembled in 1985, however, their numbers are growing significantly. Most experts referred to thelow cost of household servants as the main reason why washing machines were so uncommon.Energy consumption was estimated at over 100 kwh/yr by PLN; by contrast, similar machines arethought to consume far less electricity in Japan. However, much of the difference between thesefigures could be caused by differences in the number of washes per day.
Television
2.16 In Western countries, television is not a significant component of householdelectricity use. In Indonesia, however, television is responsible for 7% of consumption, and video
- 137 -
for another 1% (Figures from PLN are even higher). TVs are found in 37% of homes (B/W) and23% of homes (color) respectively, video in 6% of homes. National and other companies explainedthat the wattage of TV has decreased by nearly 50% during the past 10 years. Offsetting this trendhas been a gradual switch from B/W to color. In 1985, net purchases of TV lay at approximately500,000 for BW and 230,000 for color, but according to National, the BW market has shrunkconsiderably while the color market has held steady. Color TVs consume at least 2-3 times moreelectricity than B/W. But B/W TV still commands an important share of the market for ruralconsumers (low wattage 14' TV can run from batteries or even solar photovoltaic systems) andconsumers wishing to limit their connected loads for other reasons.
2.17 Most television sets are assembled in Indonesia. The average size is 20'; for B/W14" is the most common size, as it can be run from a 12-volt car battery in homes withoutelectricity. In 1988, 14" color units make up 50% of total sales. Following the world-wide trend,TV electricity consumption has fallen. A 14' model needed 80 Watts 5 years ago; now 57 W; a 21inch model required 130 W 5 years ago; now 79 W. The big market for small, efficient TV is thegroup of households with the <450 VA connections.
Water Pumps
2.18 Water pumps represent an important use of electricity, accounting for nearly 6% ofkWh in the UHESS sample. Unfortunately, no figures were available on total sales.
Irons
2.19 Irons represent the most widespread of all significant small appliances, being foundin over 50% of surveyed households and nearly 2/3 of those on the RI tariff. According to theUHESS survey, power consumption ranges from 200-750W. If ironing requires 200kWh/yr, thenironing claims a 13% share of household electricity use. Reasons for popularity and high use centeraround the importance of cotton and silk fabric, which require ironing. Official sources give the1985 production/imports as near 200,000, but National set the market at nearly 700,000.
Fans
2.20 Because of their low cost, room fans are far more popular than A/C in all classesof households. Connected wattages are usually well below 100 W. Our best estimate of averageannual kWh consumption is around 50 kWh. According to official data, almost 1 million wereproduced in Indonesia in 1985 (780,000 according to National).
Rice Cookers
2.21 Although only present in 3% of homes, rice cookers are also gaining in popularity.We estimate rice cookers to use less than 100 kWh/yr, giving them a small share (<0.5%) of totalkWh sales. But in most other Asian countries these have become very popular among urbanfamilies, so their presence in homes in Indonesia can be expected to grow. Sharp imports itsmodels from Thailand; other companies are importing models from Japan and Korea.
- 138 -
Other Appliances
2.22 The market for other appliances is small. A few thousand water heaters are soldevery year (from Australia, Italy, Japan, and the U.S.), all as imports. Most run on gas, but electricstorage heaters were found in stores. A few hundred dishwashers and dryers are also imported.Microwave ovens are now available and will probably become popular among upper-incomehouseholds, in part because they use less energy than other cooking devices, and thereby heat upkitchens less. Sales of video recorders and audio tape decks are also growing, some of the latterassembled in Indonesia. While water heaters, dryers, dishwashers, and cookers represent importantenergy uses in the distant future should they become popular and affordable, video, audio, andother small appliances are not expected to ever be significant users of electricity.
Issues in the Appliance Market
2.23 This review of the appliance market has raised several important issues that mustbe confronted if the electricity efficiency of appliances sold and used in Indonesia is to be increased.The most important issue, the role of the manufacturers, is treated later in this chapter, but severalother issues remain.
2.24 The Two Market System. There are two appliance markets in Indonesia. Expatriatesand well-to-do Indonesians buy high quality imported appliances, many of which are among themost energy-efficient in the world. Because of their high ownership of large appliances, thesefamilies have the highest consumption of electricity. By contrast, middle-class Indonesians face asimpler market dominated by locally made appliances of clearly lower quality and lower prices thanis the case for imports. In the National Gobel Catalogue, for example the popular Amaryllisrefrigerator (1 door, 135 1) sells for less than 500,000 Rp. National's imports, while holding lessthan three times the volume, cost roughly 5 times as much or more. The Amaryllis resembles aJapanese refrigerator of 1970s vintage, but the two-door models imported from Japan by mostcompanies resemble more recent models sold there. Even the two-door locally made models lookold, a fact confirmed by discussions with company representatives.
2.25 Quality and Durabflity. It was clear from direct observation that the importedmodels are not only bigger, they are better made, and probably use less electricity per unit ofvolume than locally made models. (Our only available yardstick, connected wattage, confirmed thissuspicion, but wattage itself is a poor measure of average electricity consumption.) Companiesreport that locally made refrigerators (and other appliances) "last" about 5 years in first owners'homes. Thereafter, these are either traded back to dealers for new models (and resold), or solddirectly as second-hand models. The used models then are resold for up to five more years, beyondwhich spare parts become difficult to obtain. The short residence time with first owners suggeststhat quality is low and deteriorates rapidly, although more models are offered with guarantees.
2.26 Energy Efficiency. As noted elsewhere, measures of energy efficiency of TV and A/Cwere obtainable from catalogues. For refrigerators, freezers, pumps, and washing machines, nomeasures were available. Our overall impression, however, formed by inspection of appliances instores as well as catalogues, discussions with local representatives, and discussions with Japanesemanufacturers, suggests that the efficiency of appliances assembled in Indonesia is lower than thoseimported from Japan and, most important, lower than necessary.
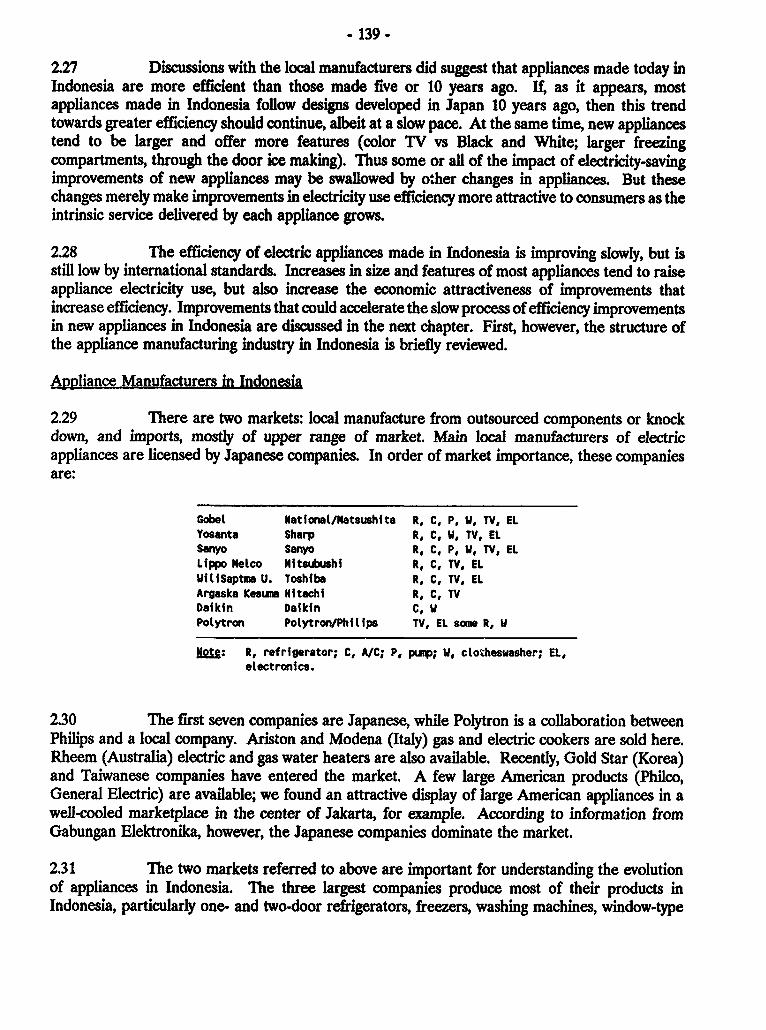
- 139-
2.27 Discussions with the local manufacturers did suggest that appliances made today inIndonesia are more efficient than those made five or 10 years ago. If, as it appears, mostappliances made in Indonesia follow designs developed in Japan 10 years ago, then this trendtowards greater efficiency should continue, albeit at a slow pace. At the same time, new appliancestend to be larger and offer more features (color TV vs Black and White; larger freezingcompartments, through the door ice making). Thus some or all of the impact of electricity-savingimprovements of new appliances may be swallowed by other changes in appliances. But thesechanges merely make improvements in electricity use efficiency more attractive to consumers as theintrinsic service delivered by each appliance grows.
2.28 The efficiency of electric appliances made in Indonesia is improving slowly, but isstill low by international standards. Increases in size and features of most appliances tend to raiseappliance electricity use, but also increase the economic attractiveness of improvements thatincrease efficiency. Improvements that could accelerate the slow process of efficiency improvementsin new appliances in Indonesia are discussed in the next chapter. First, however, the structure ofthe appliance manufacturing industry in Indonesia is briefly reviewed.
Anpliance Manufacturers in Indonesia
2.29 There are two markets: local manufacture from outsourced components or knockdown, and imports, mostly of upper range of market. Main local manufacturers of electricappliances are licensed by Japanese companies. In order of market importance, these companiesare:
GobeL NationatlNatsushita Rf C. P. W, TV, ELYosanta Sharp Rf C, W, TV, ELSanyo Saryo R, C, P, W, TV, ELLippo Nelco Mitsubushi Rf C, TV, ELWitiSaptma U. Toshiba Rf C, TV, ELArgaska Kesuma Hitachi Rf C, TVDfaikin Dalkin C wPolytron Polytron/Phitips TV, EL some Rf U
Note: R, refrigerator; C, A/C; P, pump; WU ctotheswasher; EL,electronics.
2.30 The first seven companies are Japanese, while Polytron is a collaboration betweenPhilips and a local company. Ariston and Modena (Italy) gas and electric cookers are sold here.Rheem (Australia) electric and gas water heaters are also available. Recently, Gold Star (Korea)and Taiwanese companies have entered the market. A few large American products (Philco,General Electric) are available; we found an attractive display of large American appliances in awell-cooled marketplace in the center of Jakarta, for example. According to information fromGabungan Elektronika, however, the Japanese companies dominate the market.
2.31 The two markets referred to above are important for understanding the evolutionof appliances in Indonesia. The three largest companies produce most of their products inIndonesia, particularly one- and two-door refrigerators, freezers, washing machines, window-type
- 140-
A/C, and TV. Components come from all the Asian countries, not just Japan. The designs areJapar.ese, often of relatively older vintage. (For example, small one-door refrigerators are veryuncommon in Japan today.)
2.32 The market shares of each company vary by appliance type. For example, Nationalsold nearly 50% of all one-door refrigerators in 1987, but only 10% of all large (> 200 1) two- andthree-door refrigerators, a market that imports, and Mitsubushi dominate. However, about 110,0001 door refrigerators (and two-door types smaller than 200 1) were sold in 1987, vs. 11,000 large two-door types. Thus National dominates the overall refrigerator market, with Sanyo running second,Mitsubishi third, and Sharp fourth. In the A/C market, National had 45% of the market in 1985,with Sanyo, Daikin, and Mitsubushi around 10-15% each, and Sharp at 8%.
2.33 Local assemblers increasingly are choosing a variety of countries for components.Rotary compressors (from Japan, Taiwan, Singapore) have been introduced in the betterrefrigerators and A/C. Circuits for TV come from Taiwan, Korea, Singapore, and Thailand. Thesecountries are also providing an increasing share of "Japanese" imported products.
The Role of Foreign Producers of Electric Appliances Sold in Indonesia
2.34 The most important characteristic about the electric appliances sold in 1988 inIndonesia is that they are imported or produced (ie., assembled) from imported parts. Almost allof the brands imported are controlled by Japanese companies, although products from Taiwan,Korea, Singapore, and Thailand are gaining in importance. Some devices are imported from Italy(cookers and washing machines), Sweden (small hotel refrigerators), and other European countries,and even from the United States. We discussed the Indonesian market with three majorcompanies, one in Europe, and two in Japan.
2.35 From discussions with these manufacturers, it is evident that progress in improvingefficiency of appliances in Indonesia does depend on the market approach, planning, and technicalapproach of the overseas companies that control the appliance markets in Indonesia. This controlwas described in somewhat negative terms by a senior appliance expert in Indonesia, whomaintained that it was very difficult to "Indonesianize" Japanese-controlled appliances. The reasonfor the difficulty was lack of interest on the part of the technical divisions of the Japanesecompanies.
2.36 Another important conclusion arises from contrasting the European company(Electrolux) with the Japanese companies. Electrolux enters a market when it can sell Europeanlevels of quality in appliances, while the Japanese companies appear to search their older cataloguesfor models (and costs) appropriate to current consumption and style in Indonesia. Philips, acompetitor to Electrolux in Europe, had planned to introduce a refrigerator assembly line inIndonesia, but backed out at the last minute and moved the apparatus to Algeria. Probably, thereason was that Philips decided it would be difficult to manufacture and sell European-standardequipment in Indonesia or other neighboring countries.) The comparison is not meant to fault theJapanese companies, only to highlight the importance of understanding company strategies as thesedirectly or indirectly affect electricity efficiency of products made or sold in Indonesia.
* 141 -
2.37 The role of foreign companies is both a barrier and a potential booster to electricityefficiency of appliances in Indonesia. Until recently, the appliance companies did not appear to putmuch emphasis on electricity use in Indonesian appliances, simply passing on efficiencyimprovements as they arrived from Japan. More recently, "hemat listrik" ("save electricity") hasbegun to appear in brochures and on stickers on models seen in stores, but little or no checking ofthe effectiveness of the technologies offered (or indeed the meaning of the label) has been done.The slow approach to electricity saving appears conscious on the part of manufacturers.
2.38 At the same time, a stepped up campaign to foster a climate where increasedefficiency is rewarded (testin& labellin& etc.) or even required might act as a meaningful stimulusto accelerate savings in Indonesia. This is because the most important suppliers have alreadylearned how to make efficient appliances in other countries (ie., Japan). If the rewards foraccelerating these improvements in Indonesia were clear--information, voluntary standards, etc.--the foreign companies could draw immediately upon their experience with products that saveenergy. Purely local firms would have a more difficult time learning new technologies. (The authorfound that the same was true with energy saving in industry and commerce. Multi-national firmsin Kenya and Thailand are well supplied with energy saving ideas and technologies, while localfirms in these places have considerably less access to knowledge, hardware, and the appreciationof expertise.) The importance of foreign firms is thus both a hindrance to greater electricity-useefficiency, but potentially a blessing in the long run.
- 142 -
m. POTENTIAL FOR IMPROVING THE EFFICIENCY OF ELECTRICITY USE
3.1 There are three components of the electricity requirements for each end-use. Oneis the technical design efficiency of a device, such as the ratio of electricity required to heatremoved by a compressor in a refrigerator. The second is the actual operating efficiency of eachappliance, which may be influenced by maintenance or by ambient conditions. The third is theutilization factor, i.e., the number of hours per year the device is used. A fourth factor, familyroutine, is discussed elsewhere but not considered here as an "efficiency' factor. This chapterfocuses on technical potential, but potential savings from other changes are also discussed. Afterreviewing these potentials, the main barriers to improved efficiency are discussed.
3.2 Electricity prices do play an important role in our considerations. Prices affect theeconomic attractiveness of a particular electricity saving option. They affect manufacturers'perceptions of this attractiveness, their willingness to invest in improvements and to market them.Electricity prices affect consumers attention with regard to choosing more efficient appliances, andaffect consumers' behavior with regard to use and management of electricity use. For example,electricity use per household for lighting in Norway is at least 2 times higher than in Denmark;electricity prices are at least 2 times higher in Denmark. The low electricity price in Norway bluntsconsumer interest in advanced lighting or even in fluorescent bulbs. In the following discussion, wewill assume that average prices will rise at least to those that the ADB finds reflective of present-day marginal costs, about 50% higher than current average residential prices.
3.3 Experience in Brazil supports this reasoning. Geller compared refrigerators madein Brazil with those produced in Europe and Japan and estimated that better American modelsconsumed less electricity than smaller but typical Brazilian models. Geller et al. (1988) noted thatthe most efficient models cost 10-15% more than average models, but estimated that for Brazil, thisextra cost paid back in less than three years. He found this strategy far less costly than supplyingthe equivalent amount of electricity from new powerplants. Since we have essentially made thesame kinds of comparisons, we believe that our estimates of conservation potential and cost-effectiveness will prove to be reasonably accurate. Significant to the economic comparison,Brazilian residential electricity prices in December 1986 (at then exchange rates) varied from$0.048/kWh to $0.053/kWh for monthly consumption of 30-100 and 100-200 kWh/month,respectively. These prices were lower than those in effect in Indonesia at that time. Since wagerates in Indonesia are lower than those in Brazil, it is likely that the extra costs of greater efficiencyin Indonesia will also pay back against Indonesian residential electricity prices.
3.4 There are many studies that document past improvements and future potentialimprovements in electricity-use efficiency. Schipper et al. (1987) found that changes in householdelectricity use in OECD countries between 1972 and 1983 (currently being updated to 1986),pointed to improved efficiency as a major factor in reducing growth in demand. Thorough studyof the United States (Turiel, 1986; Geller, 1988), experimental appliances built by Noergaard andcolleagues in Denmark (Noergaard 1987), and experience in Brazil (Cepel, 1985; Geller 1986;Gelier, Goldemberg et al. 1988) quantified both the electricity savings that could arise if specifiedimprovements are made in the appliances that characterize the U.S., Europe, and Brazil,respectively. For Japan, the improvements since the early 1970s in refrigerators, air conditioners,and TV are well documented (Energy Conservation Center, 1988). Since the UHESS indicates that
- 143 -
appliance unit consumption (electricity/device/year) in Indonesia is high by international standards,we believe the studies of other countries can be applied to Indonesia.
3.5 Although lack of measured consumption data from Indonesian appliances makesprecise quaitification of the cost of improving them and the savings that would result, ourinspection of available specifications, and comparison with appliances sold elsewhere convince usthat large savings could be designed into Indonesian appliances at low cost. Geller (1988) andTuriel (1986) addressed the U.S. situation in generic ways that apply to appliances made or soldanywhere. In general, the kinds of improvements that we recommend are features that both ofthese experts find cost effective and technically practical today in the United States. Many of thesefeatures have been introduced in Japan or Europe without meeting consumer resistance. That is,purchase of the better Japanese appliances today in Indonesia would lead to electricity saving,compared to locally made appliances with similar size and features. Presently, however, the importstend to be larger or more powerful. But the features that make the imports more efficient couldbe applied to simpler domestic models.
3.6 Some of the potential for improved electricity use in Indonesia is immediate. Thebest selling air conditioners in Indonesia, for example, are considerably less efficient than the mostefficient ones available, but few consumers know how to buy efficiency. For refrigerators,confidential information made available by the Japanese parent of one of the major producers ofappliances in Indonesia documents the decline in electricity use in that company's refrigerator-freezers since the early 1970s. Since the models they manufacture and sell in Indonesia resembleJapanese models from the mid-1970s, it is likely that their Indonesian-made models could also beimproved rapidly. Therefore, we believe that the potential described here for increasing theefficiency of appliances sold in Indonesia is realistic, even in the near term.
3.7 Based on the above considerations, we present below our estimates for the technicalpotentials for increased electricity-use efficiency in the major appliances likely to be used inIndonesia in the next twenty years. These estimates were made by comparing unit consumptions(electricity/household or per device) of existing appliance in Indonesia with those in othercountries, notably Japan, W.Germany, and the United States, and careful consideration of technicaland economic studies of conservation potentials in these three countries. The estimates are basedon material by the Lawrence Berkeley Laboratory for the U.S. appliance efficiency program andsurveys of appliance use in major OECD countries, from material Geller has collected for the U.S.,and Europe, and from Geller's own estimates of conservation potential in appliances in Third-World countries. (See Schipper et al. 1987).
Technical Conservation Potential
3.8 Consumers can reduce electricity costs today by choosing more efficient appliancesfrom among those being offered, and manufacturers can improve the efficiencv of all appliances inthe next few years. In this section we review briefly the technical options.
3.9 The refrigerators and freezers imported from Japan appear to be as efficient asthose sold in Japan. Those assembled in Indonesia appear to be considerably less efficient.Unfortunately, available information (wattage) does not give a reliable estimate of total energy use.
-144 -
(Fig. 3.1 shows wattage vs. size for 2+ door refrigerators.) However, a consumer would get a better,more efficient machine if he/she:
(a) bought one with a rotary compressor;
(b) bought one with at least 2" of insulation in the door and sides;
(c) bought one with a low wattage skin heater.
3.10 These features tend to be found in imported appliances or in the best locally madeappliances. If all locally made refrigerators had rotary compressors and improved insulation, forexample, electricity use in locally made refrigerators would be reduced by at least 20%.
3.11 To improve efficiency of all refrigeration equipment, all boxes should be made withrotary compressors (now being added on better models). The efficiency of motors and thecoefficient of performance of the compressor itself should be improved. Insulation levels shouldbe increased to 3", the door seals should be improved, and temperature controls improved as well.Manufacturers should consider putting the compressor/motor above or at least towards back of thedevice and increasing access of air to these elements (for better cooling). Claims that "flat back",or covered evaporator coils, save energy, may have some merit, since the benefit of using the heatfrom these coils to drive away moisture (illustrated in a Sharp catalogue) is increased by settingthese in thermal contact with entire back of the refrigerator. (On the other hand, fresh air cannoteasily blow across the evaporator coils.) Other more advanced improvements are listed in the LBLanalysis for the U.S. Department of Energy.) In summary, we believe t}at electricity use inrefrigerators could be reduced by 40% using the best designs available today, and 60% by the year2000, using advanced technology. For freezers we put these figures at 50% and 65%, respectively.
3.12 Careful consideration of characteristics of other appliances offers importantopportunities for saving electricity:
3.13 Air Conditioners: Currently the efficiency of A/C, as expressed by the EER, can bedetermined from catalogues. Buyers can switch to the highest EER in each size category and save10-50% of their electricity needs for a given amount of cooling. (Fig. 3.2 shows the EER vs.capacity for most models sold in Indonesia. Note that EER appears to fall with increasing modelcapacity, after peaking among the 7000-9000 BTU/hr models.) Even among locally made windowA/C, the buyer can save electricity by buying the best EER available, either by choosing an importor by choosing only from locally made products. Electricity-saving features il clude timers andthermostats, rotary compressors, and the ability to operate the fan without using the compressor.Split-type systems cost more than window-type, but tend to use significantly less electricity.
3.14 To improve the efficiency of A/C manufactured in Indonesia, all models should haverotary compressors, thermostats and timers, and, by the mid-1990s, variable speed motors. The heatexchangers could also be improved. It appears that the average EER today lies around 9.5 asmeasured in Japan. This value should be raised to at least 13-14 by making the improvementsrecommended here. The fact that EER of larger models is lower than that of smaller ones suggestsa significant potential for improved efficiency in these models, too. In the U.S., EER tends toincrease with larger capacity. Thus much can be done to improve air conditioners sold in Indonesia.
- 145 -
In summary, installation of the best akr conditioners avaibble In Indonesia would reduce unitconsumption by 40% compared to today's estimated values for households using air conditioning;installation of advanced technologies after the year 2000 would permit a 60% reduction.
3.15 Washers: Improved motor efficiency and continuous water level adjustments (for partloads) should appear on all models. The water use should be reduced, particularly in models thatuse heated water. But reducing water use in non-heated models saves electricity by reducing theload that the agitator has to move. To avoid need for drying, the spin cycle in washers should reach1200 RPM. (Manufacturers of European washing machines reduced electricity use for themotorsbra by about 33% between 1973 and 1985, and reduced electricity (or gas) requirements forheating water by more than 50% in the same time frame. Similar improvements were made indishwashers.) In summar, the best models today would permit a 20% reduction in electricity use;advanced models ready after 2000 would use 35% less electricity than those in use today.
3.16 Television: Currently buyers can choose a 14" TV using as little as 42W (rather than70W); similar choices are available in all size categories. (Fig. 3.3 shows the variation in wattageamong popular models, as a function of screen size.) Instant on features should be avoided,remote-control on/off chosen instead. In summary, the most efficient color TV would use 25%electricity than the average sets used today; advanced designs will reduce electricity use by 50%.
3.17 Water Heaters: As the popularity of storage water heaters grows, these should allhave heavy insulation, at least a level of R-9 (in U.S. units), which corresponds to about 10cm ofmineral wool. A side benefit of insulation is that the tank heats the house less. In summary, thebest models for water heaters offer a 20% savings compared to typical models. Advanced models,which combine solar heat with electricity, wil offer a 70% reduction over present day demand.
3.18 Electric Ovens: Convection-type ovens use less electricity than conventional ovens;all ovens should be insulated to the standards of European or N. American self-cleaning ovens. Insummary, the best models will allow a 25% reduction in electricity use over typical models.Advanced technology, combining microwave ovens and conventional ovens, will allow 50% reductionin electricity use for ovens.
3.19 Irons: Our inspection of irons suggests that the predominant kinds do not use water,and transfer heat poorly to clothing. This impedes the ironing and slows the process considerbly.Higher quality irons have water fill and good thermostats, which reduces both electricityconsumptior and the time needed to carry out the ironing. Improved irons will require 15% lesselectricity than today's; By the end of the century, we believe these savings will Increase to 25%
3.29 Lighting: The UHESS found that nearly 35% of all bulbs in place were fluorescenttypes. These bulbs are underrepresented among those burning for more than 6hrs/day; thus evenin existing homes, there appears a potential for saving by moving bulbs around where this ispractical. However, the wattage of fluorescents bulbs, according to the survey, is high comparedwith the wattages given for incandescent bulbs, given the greater output and efficacy of fluorescentsvis-a-vis incandescents.
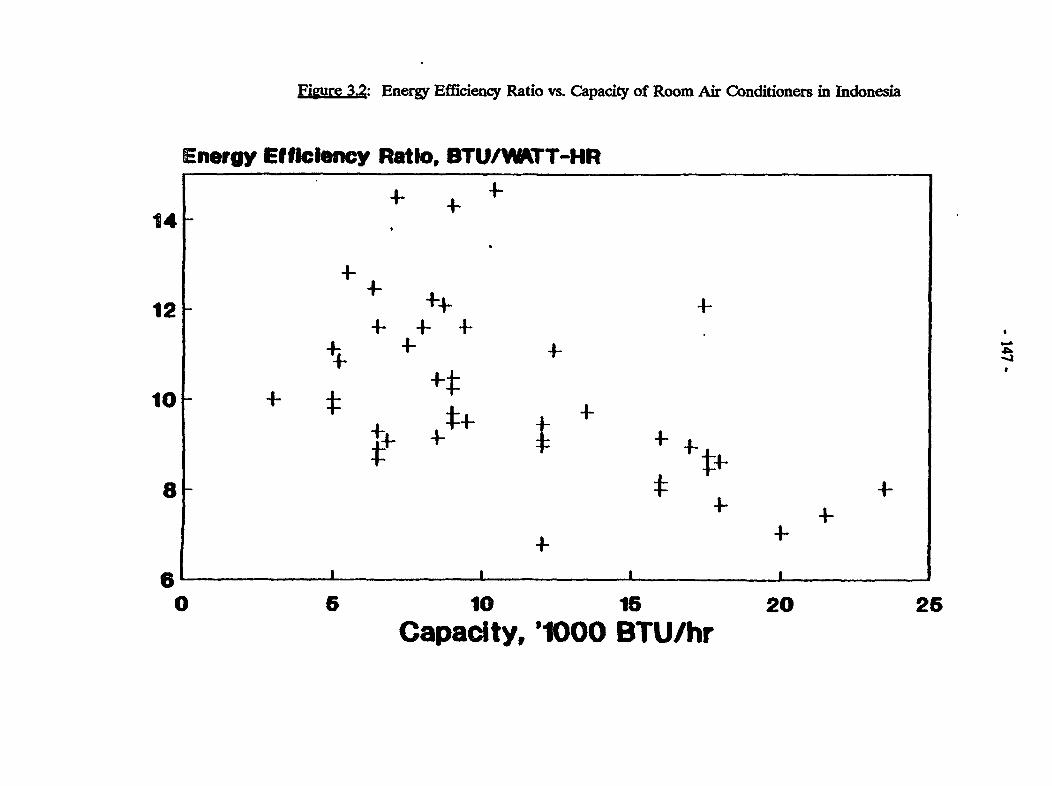
Figure 3.2: Energy Efficiency Ratio vs. Capacity of Room Air Conditioners in Indonesia
Energy Efficiency Ratio, BTU/WTT-HR
14~~~~~~4
12 - +-4
10 -_ .2~~~~~~~ + + +
+~~~~~~~ + +
8 i +
6 0 6 10 1i 20 25
Capacity, '1000 BTU/hr
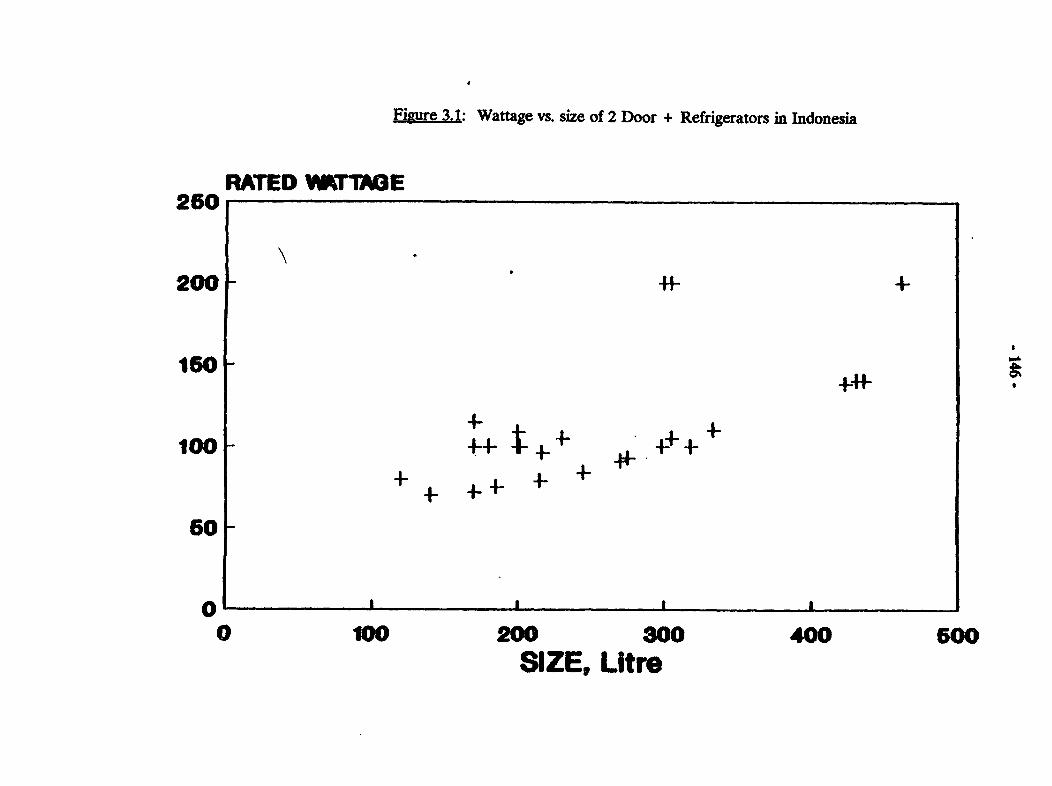
Figlre 3.1: Wattage vs. size of 2 Door + Refrigerators in Indonesia
RATED WTTAME260
200- 44
160 _ 1
100 4-41-4-+ t++ +loo ~ ~ - ++ ++ +
60 -~~~~~4
60
0 100 200 300 400 500SIZE, Litre
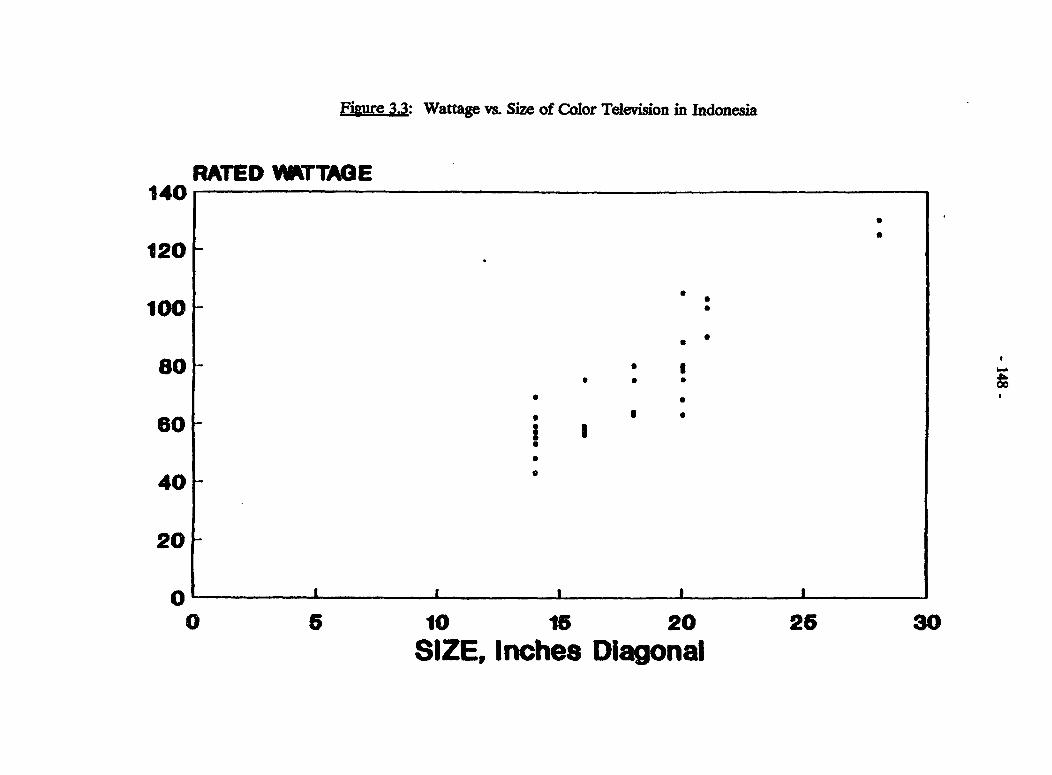
Figure 3.3: Wattage vs. Size of Color Television in Indonesia
RATED VOTTAGE140
120 -
100 *
80 *
60~~ ~ ~~~~~~~~~~~~ ;0
40_
20_
0 5 10 is 20 26 30SIZE, Inches Diagonal
- 149 -
3.21 The economics of switching from incandescents to fluorescents are very attractive,as are the incentives to switch all the way to compact fluorescents (as noted in a previous WorldBank report), but the higher first cost of fluorescents, particularly the compact types, deterconsumers. Compact fluorescents allow as much as 70-80% reduction in electricity use relative toincandescents, depending on the consumption of the ballast. The compact fluorescents have movedvery slowly into the residential markets of Europe and the U.S., principally because of their highcost, but their long lifetime (5000 hrs vs 1000 hrs for incandescents) provides as great an incentiveto using them as does their electricity saving. Geller reports improvements that may both lowercosts and improve performance. In summary, inreased use of conventional flourescent lamps, anduse of one compact flourescent In the most Important lamp in each home could reduce electricityuse for lighting by 25%; by the end of the century, compact flourescents could account for morethan half of the bulbs and 80% of the light In Indonesian homes, resulting In a 50%o reduction inelectricity use for lighting.
3.22 Available data make a precise estimate of the savings from greater efficiency in newelectric appliances impossible. Nevertheless, we summarize in Figures 3.4 and 3.5 our bestestimates of present day use for key appliances, along with the two levels of use that would obtainfrom higher efficiency. Again, the first level is based on estimating what the best appliancescurrently available in Indonesia (or in countries exporting to Indonesia) would consume relative tothe actual mix of appliances in use in Indonesia, while the second estimate incorporates ourjudgement as to improvements in appliances that could occur in the next twenty years. We havealso made estimates of potential savings for a few other appliances (video, fans, rice cookers,pumps), mainly through use of better motors and electronic controls. There seems little doubt thatan enormous potential for electricity conservation exists in Indonesia.
3.23 The estimates we have made are based on assuming that the appliances consumersuse, and the services they receive, wou'd remain constant over time; only the number of householdsand the penetration of these appliances would increase. We have not accounted for the likelyincreases in the levels of services demanded by future Indonesian consumers, i.e., largerrefrigerators and water heaters, hot water in washing machines, wide-screen, high resolution TV,increased water pumping. Taking these changes into account would raise the base-line of electricityuse, and raise the benefits of greater efficiency as well. These estimates yield considerable savingsfor most appliances, even before we consider future technologies. If future ownership levels areconsidered, savings are even larger (see Chapter V).
3.24 The testing and labeling program that we recommend later will allow analysts tomore carefully determine consumption levels in present-day new models. By comparing the actualcomponents of these models with those in more advanced models in other countries, analysts canthen make more precise comparisons of incremental costs and savings as well.
Behavioral/Management Strategies
3.25 Purchasing an efficient appliance is the most important way to evoid high electricitycosts. But there are important management strategies that also reduce operation costs in existing(and even new, efficient) appliances by 10-20%. These include: cleaning and maintenance ofrefrigeration and cooling equipment, particularly removing dust from evaporator coils; turning ' fflights, A/C, fans, TV, etc. when not in use (and using timers); using irons, washers, and other
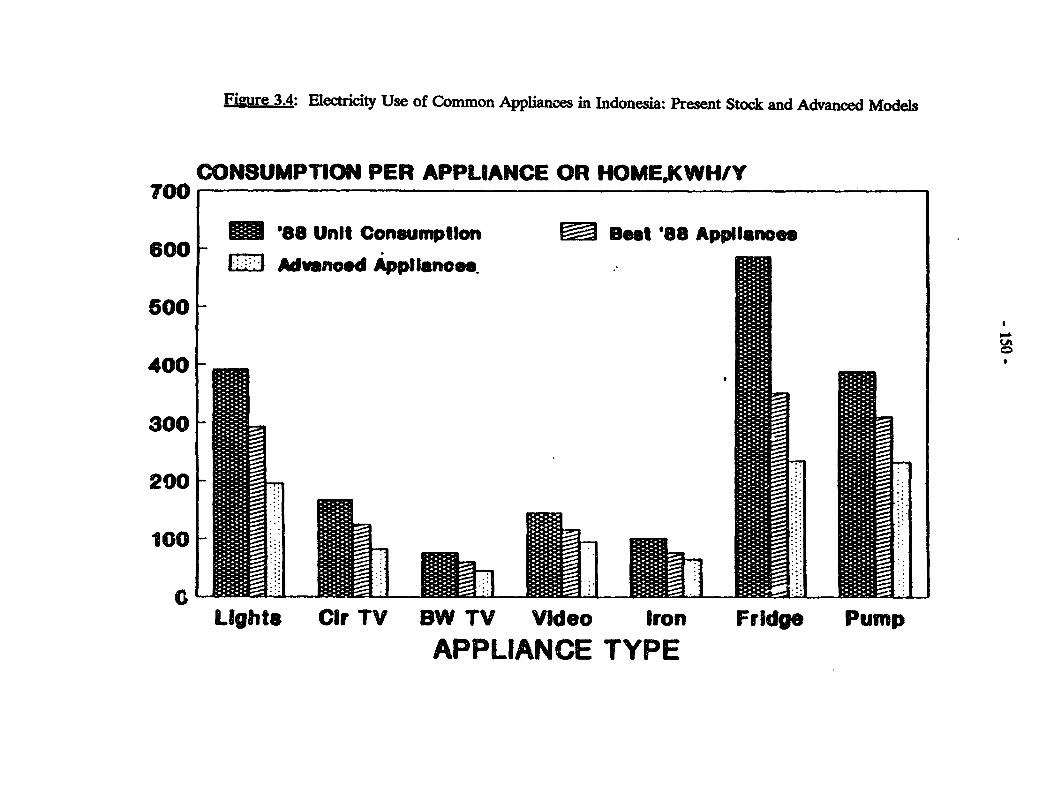
Figure 3.4: Electricity Use of Common Appliances in Indonesia: Present Stock and Advanced Models
CONSUMPTION PER APPLIANCE OR HOME,KWH/Y700
00 '88 Unit Consumption B Beat '88 Appllanoe.600 ] Advanced Appliances.
600
400-
300-
200
100
Lights Clr TV SW TV Video Iron Fridge Pump
APPLIANCE TYPE
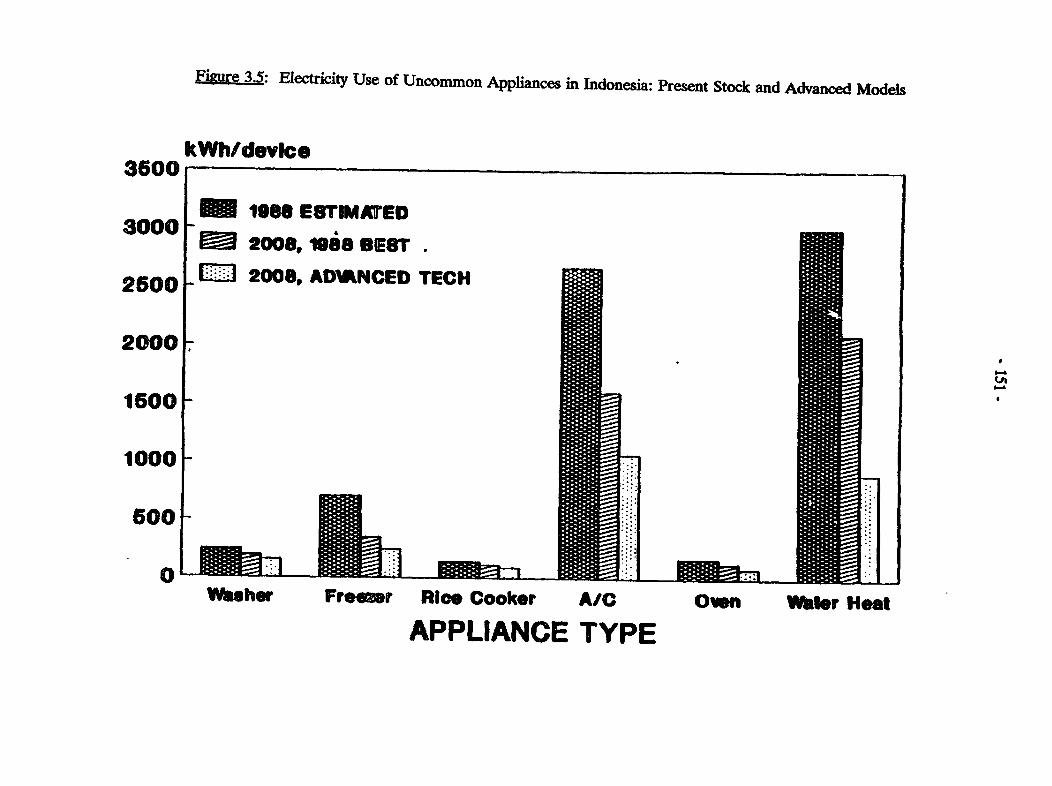
Figure 3.5: Electricity Use of Uncommon Appliances in Indonesia: Present Stock and Advanced Models
kWh/device3600
3000 - 2008, U8S BEST.
2600E 2008, ADiRNCED TECH
2000.
1600
1000
600
0Washer Fresr Rlce Cooker A/C Oven Wbter Heat
APPLIANCE TYPE
* 152-
equipment to fullest capacity (turning on an iron to iron one piece of clothing may double theelectricity required to iron; running a clotheswasher with a full tub of water and only one or twopieces of clothing uses almost as much electricity as running the washer full).
3.26 For air conditioning, terhnology and behavior combine in ways that can yield greatersavings. For example, use of a timer and thermostat allows the consumer to turn back the A/Cwhen asleep or when gone for a short time, as well as to turn the A/C off when gone for a longtime, knowing that the A/C will come back at the desired time. Equipping A/C with a variablespeed motor allows extra capacity for rapid cooling, allowing consumers to turn A/C off even forshorter periods of absence.
3.27 An additional management effort can improve the efficiency if all equipment usingmotors and compressors, namely better control of line voltage. If PLN improves its voltageregulation, or homes are equipped with voltage regulators, then motors and compressors will bestrained less when voltage drops. (According to National, this voltage drop causes serious problemsin Indonesia.)
Barriers to More Efficient Electricity use in Indonesia
3.28 From observations of the way in which electricity is used in Indonesia, and the wayin which appliances and other electricity-using technologies are marketed, we offer the followingsummary comments on barriers to more efficient electricity use.
Information
3.29 lIpical consumers have little information on how much electricity appliances use,particularly how much one model will use compared with another. Stickers on appliances, orslogans in catalogues and advertisements make claims about electricity savings which, whether trueor false, cannot be substantiated or evaluated as to their cost worthiness by buyers. Well educated(and presumably well-off) appliance buyers and users can usually figure out which devices or usepatterns save electricity, but the majority of users (particularly future users) probably lack thesophistication to deal with the meager information available in Indonesia today. The labelling .ndtesting programs we recommend should help this situation greatly, as would the "appliance literacy"campaign we suggest.
Buying Habits and Environment
3.30 Studies at the Lawrence Berkeley Laboratory showed that in the United States,appliance buyers tend to discount future savings of electricity by very high rates. The higher thediscount rate, the shorter the time horizon. In other words, their time horizons are short, farshorter than wolnld be justified by simply applying store or credit-card rates of interest (andcertainly shorter than justified by the savings rates offered by banks). Part of this situation iscaused by the nature of the buying environment. Salespersons are uninformed about energy, buyersare in a rush, stores are noisy and crowded, men buy appliances but women use them, etc.Consideration of these problems weighed heavily in the U.S. decision to place minimum efficiency
- 153 -
standards on products such as refrigerators, because it was felt that pushing manufacturers waseasier than pulling consumers. Nevertheless, labels on appliances, and information in stores andadvertisements, would improve the buying environment greatly. (One informal survey carried outby LBL compared sales of two similar refrigerators by the same company. One refrigerator used33% less electricity than the second, but cost approximately $50 more. In a state where labellingof appliances for their electricity consumption was required, the more efficient model was chosenby 50% of buyers; elsewhere, only 33% opted to invest in the more efficient model The paybacktime was less than 3 years.)
First Cost and Quality
3.31 In most analyses, more efficient appliances have a slightly higher first cost. This isboth because some improvements do cost more (larger heat exchanger surfaces, more copperinstead of other materials, etc.) and because more efficient appliances tend to be of a higherquality. (Indeed, we observed that there were really two appliance markets in Indonesia, one forthe well-to-do, one for the majority of consumers.) But some manufacturers turn the marketingof quality to their advantage by 'gold plating". This means that the higher efficiency features areonly available on top of the line models, even though the costs for the efficiency improvements inparticular may be minor. Goldplating is an understandable marketing strategy, but goldplatingcauses serious problems for electricity efficiency when consumers'incomes for appliance purchasingare iimited.
3.32 Whether efficiency improvements are built into all models or not, greater efficiencyis tied to better quality in the long run. As consumers' incomes rise, they will demand bet, -r (andmore efficient) appliances. To accelerate these improvements, one must face slight increases in firstcost of appliances to cover the costs of energy-related improvements (including the industry's costsfor learning and retooling). These costs will probably meet with some consumer resistance, andcertain resistance from marketing managers. Yet the kinds of improvements we discuss herein (orthe kinds consumers can enjoy from simple changing their choices of what to buy) pay back in afew years and "cost" less than expansions of the electricity-supply system. It is therefore veryimportant to move both consumers and manufacturers of appliances beyond the first-cost barrierthat has so often hindered application of improved technology to electric appliances.
3.33 The acceleration of progress towards greater efficiency through programs, whethervoluntary or mandatory (as explained below) does entail the risk that manufacturers and supplierswill raise prices. Manufacturers may justify such price increases by using costs of greater efficiencyas an excuse (i.e., beyond what is actually justified by the changes in manufacturing costs andequipment features). Or real cost increases may be larger than necessary because of the cost ofretooling manufacturing equipment before its useful life has expired. Both these cost problems canbe minimized by publicity that allows consumers to compare costs (and energy use) of similarmodels that are more and less efficient, by encouraging competition in the marketplace, and byallowing producers sufficient time to retool and reposition themselves in the marketplace. Thegovernment could offset some of these real and illusory cost increases by permiting more favorabletax treatment on production and sales of the most efficient models.
-154 -
Electricity Prices
3.34 According to recent World Bank analysis, most private consumers pay lower pricesthan would be justified by costs of maintaining or expanding the system. If this is true, then apowerful incentive to more efficient choice and use of appliances is weakened. Proper pricing ofelectricity is an important element in any attempt to increase the efficiency of electricity use.
Other Problems
3.35 One potential problem we have discussed is the fact that most decisions about thetechnologies used in household appliances are made by foreign companies, often by experts in Japanor other countries where parent companies reside. These companies may resist efforts on the partof GOI to accelerate efficiency improvements. However, if a program is presented to companieswho are given at least a year or two of warning about testing, efficiency goals, incentives forefficiency, demonstration programs, or even standards, the manufacturers will have time to adjusttheir production and marketing strategies to the new goals of electricity-use efficiency.
3.36 Such a presentation implies that good lines of communication are open among theactors who play a role in determining how appliances are made and used. While we found no openantagonism among the actors, we found that appliance companies, PLN/LMK, DJLEB (or othergovernment groups), YLKI, and appliances dealers had little interaction among each other. Anelectricity-use efficiency program must foster greater communication, or else an individual groupcan either ignore the problem ("someone else takes care of that"), or 'solve" the problem on its ownwithout fitting itself into the fabric that holds all of these groups together. (The importance ofweaving energy efficiency into this fabric, while strengthening the fabric itself, was underscored ina study of how residential energy use became so efficient in Sweden [Schipper et al., 1985].)
- 155 -
IV. REGULATIONS: TESTING, STANDARDS, AND NORMSFOR ELECTRIC APPLIANCES
Regulation and Standards
4.1 In many countries, regulation of electric appliances through "standardsc has beenextended to electricity-using properties such as efficiency. This option may be important forIndonesia. It is therefore worth considering what "standards" mean for electric appliances andrelated goods.
4.2 Standards are laws that affect properties of equipment which are deemed importantto safety, durability, noise or other undesirable properties of equipment. Standards can also placerequirements on overall performance. A given piece of wire should be able to carry a certaincurrent before melting, or withstand a given strain, for example. Standards also specify tolerancelimits relating allowable typical performance of products (or their components) to promised ordesign performance. For example, a standard could require that a given piece of wire withstanda certain temperature beyond its design tolerance, or be able to suspend a certain amount of weight.In other words, a standard should define the margin by which randomly chosen samples of anyproduct could miss the stated performance criterion.
4.3 Standards can used to specify that certain properties of materials or certaincharacteristics of products be present in equipment. For example, standards can require certainamounts of thermal insulation be present in walls and doors of refrigerators. Such a standard couldeither specify thermal resistance values, or require that a certain thickness of commonly usedmaterial be present. Standard-setting through specification of detailed properties of a componentor system is called "prescriptive", while the specification of overall properties of systems is usuallyreferred to as "performance" standards.
4.4 Standards can also be employed to define how products are labelled and classified.In the United States, for example, there are different grades of beef, different kinds of drinks madewith oranges, and, as in many countries, different sizes of TV. "Standardsc specify how the beef isto be graded, how the orange drinks are to be labelled by orange content, and how the TV screenis to be measured. Within limits, however, these standards do nothing more to the product(although other regulations may apply to health and safety aspects, for example). Thus orange juicemakers can choose from products with little orange content to those made only from oranges. Onlythe latter may be labelled "orange juice". Currently there is an analogous, widely recognizedlabelling procedure for refrigerator/freezers that classifies the freezing ability of the freezercompartment according to temperatures attainable. This procedure leaves the manufacturer freeto choose temperatures, but forces him to reveal his choice in a way that makes comparison amongproducts easy.
4.5 It is crucial that the standard setting body specify what properties of materials orequipment are to be measured, how the measurements are to be carried out, and how the resultsof measurements are to be applied. For example, standard-setting bodies could require thatmanufacturers of washing machines test the capacity of each machine (in kg of dry clothes), theamount of water and electricity consumed for a given wash, and the amount of water left over in
- 156-
the clothes when the wash cycle is complete. (In the examples given above, the procedure fortesting content of orange juice or the indoor temperature of the refrigerator compartments mustbe specified.) These measurement procedures are also commonly referred to as standards, but theyreally delineate methods and reporting procedures. No regulatory process of standards can succeedwithout such methods and procedures.
4.6 Standards that specify minimum performance parameters of household goods arenot uncommon. For example, a performance standard could require that a bed be able to withstanda certain temperature before catching fire, without specifying what materials the bed were madefrom. Examples of performance standards that could be applied to electric appliances arerequirements on size, volume, or capacity. For example, the government could specify temperatureranges that refrigerator and freezer compartments of refrigeration equipment had to attain. Or thegovernment could state minimum electricity performance standards for appliances, which mightspecify the maximum energy use allowed for an appliance of a given size and performance. Clearlyit is easier to specify prescriptive standards for simple wiring than for complex devices such aselectric appliances, but in most instances it is easier to specify performance standards for complexdevices than to try to prescribe the properties of each important component, particularly whenenergy or electricity is concerned.
Regulations in Indonesia that Apply to Household Appliances
4.7 There are few regulations affecting properties or performance of electric appliancesin Indonesia. Testing and standards do affect house wiring and light bulbs, however, and thegovernment plans tests for ballasts for fluorescent lights. Electronic ballasts developed in Europeand the United States will be an important element in reducing electricity use for fluorescent lamps.For appliances, however, the government at present can only rely on test results fromproducers/importers, which may arise from local testing or from tests carried out in the country oforigin.
4.8 One standard, SLI 005, could regulate properties of electric appliances, but nothingis yet applied to appliances. Some appliances are already tested for safety by LMK or by LembagaElektronik National LPMB (Ministry of Trade) tests quality of materials, while LIPI/LMK testslamps, following the IEC convention. According to the Ministry of Trade, there is no specificregulation, quality control, or standardization of electric appliances for import or export, only forwires and light bulbs. The general view is that manufacturers are making their own tests for qualitycontrol. Since foreign firms dominate the appliance market, they are not easily "controllable" fromIndonesia.
4.9 Thus there is little regulation of electric appliances at present. However, there isan arrangement for testing equipment that could provide the framework for eitherinformation/labelling or the background for efficiency standards. The laboratories that are usedto test wire, the manufacturers themselves, or LMK could be asked to perform certain tests onappliances that would cover safety, performance and energy use. (We return to this proposal in thefinal section.) The history of standards for ordinary wire are worth reviewing.
- 157 -
4.10 In the late 1970s, after a series of house fires, concern that poor quality wiring hadcontributed to a series of house fires led to establishment of performnce standards for wires.These were promulgated in 1980, with the manufacturers given approximately 3 years to comply.
4.11 Enforcement is carried out by random testing of wire. The government buys samplesat ordinary outlets. They remove any means of identifying the manufacturer, then pass threesamples to factories for testing. If the tests come back below a certain standard, then further testsare ordered at a national laboratory. Manufacturers themselves have to pay the costs of these tests.
4.12 Suppose a particular brand of wire is found not to comply with the standards. First,the company is issued an oral warning. If their standards do not improve, they are issued a writtenwarning. If there is still no improvement, the written notification is circulated among theassociation of cable manufacturers. This third step is usually effective.
4.13 How could this procedure be extended to cover household electric appliances? Forappliances, it is impossible to "de-identify" the manufacturer. Nevertheless, it is possible to havemanufacturers test each other's products (which is often done in other countries out of competitivepressure) as a short run measure, while introducing a new institution to test appliances in the longrun. In the final chapter we discuss this new institution more fully.
Establishing Testing and Regulatory Standards for Electric Appliances in Indonesia
4.14 Minimum efficiency standards can be an effective tool for reducing electricitydemands in new electric appliances, as the experience of individual states in the United States hasshown. If the GOI were to pursue regulatory options that involve setting appliance efficiencystandards or goals, GOI would have to establish quantitative standards covering importantproperties of electric appliances, establish or empower a recognized testing authority to carry outtesting (or to pass on information from recognized test procedures carried out elsewhere), andensure that a reporting system were established to both warn the government of products that donot meet standards as well as show consumers the amount by which acceptable products exceedstandards. The government would then prohibit products that did not meet standards from reachingthe market.
4.15 The key ingredient in any country's program for effilciency standards is theorganization of authority for information and testing. In most countries, responsibilty for theelements of a testing/labelling/standards program are dispersed among different authorities. Eachcountry has its own electrical equipment safety lab, without whose approval it is almost impossibleto sell anything that connects to the mains. For electricity consumption, however, the "authority"lies vested (or simply has sprung up) in different kinds of groups. In Sweden, for example,Konsumentverket (KoV), an official body supported mainly by government (but which accepts a feefrom manufacturers in order to carry out unbiased tests), tests some appliances (washing machines)for many consumer features including energy consumption. For refrigerators, KoV specifies teststo be carried out by manufacturers and reports these results. In Germany, Stiftung Warentest testsall devices for most properties of interest to consumers, while in the United States, Consumer'sUnion accepts manufacturer's energy-related tests, makes its own evaluation of other properties,and then publishes all results. The energy-related tests were initially established by the U.S.
- 158 -
Department of Commerce, National Bureau of Standards, but these have been superseded by thosepromulgated by the U.S. Departmert of Energy.
4.16 The U.S. example illustrates an important step to be considered by GOT. Indvidualcompanies using procedures established by authorities (i.e., the test procedures established by theU.S. Department of Energy, or by the Swedish Konsumentverket (for refrigerators) can carry outtests. The government or consumer authority must police these tests from time to time. Theadvantage of this approach is that appliances do not need to be bought and then resold. Since mostmanufacturers test appliances through quality control for some properties in Indonesia, extendingsuch quality control to energy or electricity consumption should present no problems. Theadvantage of using an existing consumer/technical authority, on the other hand, is that such a grouptends to be both well established technically, well respected by both producers and consumers and,most important, relatively independent of influence by these groups (or by the government itself).In short, an independent test authority and/or set of procedures are necessary for credibleimplementation of energy and electricity efficiency standards. But this step costs more thanmanufacturer testing. In the conclusion, we will recommend that the manufacturers initiate testing,to be taken over by a consumer or electricity authority once procedures are well established,understood, and proven to be practicable.
4.17 Although there are no appliance testing programs in Indonesia, the government,through DJLEB, is proposing certain safety standards for refrigerators. This proposal could beextended to cover electricity consumption properties. DJLEB would provide a list of componentsthat must be specified by the manufacturer or seller/important of major appliances. Thesecomponents include insulation thickness, wattage of the compressor, the fan(s), the skin heater, etc.of refrigerators or freezers, the efficiency of motors (refrigerators, freezers, washers), etc. Theseproperties do not reveal directly the exected or actual electricity use, but they are useful to manyobservers who wish to compare devices. On the other hand, no performance testing is necessary;only a check to see if a motor of a particular rated efficiency, or insulation of a given thickness, isactually present in each device.
4.18 Actual electricity consumption, however, is the most important information for theconsumer. In order to make performance comparisons meaningful, an authority must specify testconditions under which washers, refrigeration equipment, and other appliances would be tested inthe factory. Such procedures are well established in virtually every country, although the conditionsvary from country to country. These tests only approximate actual conditions under which newappliances will perform in homes. However, the tests (like the testing of automobiles for fueleconomy) are usually reliable enough to show the relative performance of different machines.Information from these tests can be used to both follow progress within the industry, as well as toprovide consumers with reliable indicators of the expected relative performance of different deviceson the market. At present, the only device for which an indicator of energy performance isprovided is A/C.
4.19 Two properties of electricity consumption are important to consumers. The first isthe maximum power consumed by the device (in watts), and, where important, the average poweras well. Maximum power is uf great concern in most households in Indonesia, because most homespay for tariff that provides a relatively low total wattage to the consumer. (Overloading ofhousehold circuits is common.) Related to maximum power is the output under such conditions:
- 159 -
cooling capacity, washing load, TV picture and sound output, etc. The second figure of interest toconsumers is the total electricity consumption under either typical or standardized operatingconditions. This is because wattage is not always directly related to electricity consumption.
4.20 The most important measurements by appliance are summarized below. In addition,other properties that should be specified by manufacturers and tested occasionally are noted:
(a) For television, maximum wattage is important to the consumer on a limited wattageconnection to PLN, but average wattage is a better measure of energy use: averagewattage times viewing time gives total use. Fortunately, average wattage tends tobe proportional to maximum wattage, so a ranking of TV by size and maximumwattage is meaningful.
(b) For refrigeration equipment, maximum wattage is not a reliable indicator of energyuse, because different components (compressor, fans, light, skin heater, emullionheater [between the refrigerator compartment and the freezer compartment])operate for different periods of time during the day. This means that eachrefrigerator must be tested to see how much is consumed. The energy consumptiontests must be developed carefully. For refrigerators, for example, authorities specifythe design temperatures for the refrigerator compartment, the freezer compartment(combined or separate), and the temperature of the room. A certain number ofdoor openings per hour can also be specified. The machine is then run for a periodof up to several days to measure its electricity consumption. (At present, there areno data on electricity consumption of refrigerators available in Indonesia, althoughcareful comparison of imported models with Japanese catalogues allows comparisonof these models tested under Japanese conditions.) The test allows the manufacturerto specify kWh/month of expected electricity use.
(c) Manufacturers of refrigerators should also specify motor efficiency, skin-heaterwattage, defrost cycle electricity consumption, compressor coefficienct ofperformance (efficiency), insulation thickness and values for walls and doors.
(d) For washers, a test specifies the quantity of water and weight of clothes that are tobe run through certain cycles. The manufacturer then specifies kWh/cycle, andestimates a standard number of cycles per month in order to arrive at monthlyelectricity consumption. If the washing machine includes a water-heating element,electricity consumption for heating water through each cycle should also bemeasured. Manufactuters should also specify motor efficiency, and waterconsumption for each cycle.
(e) For air-conditioners, the test measures the amount of heat a given device removesfrom a given room under specified outdoor and indoor temperature and humidityconditions. Further tests show consumers how quickly a room of a given size canbe cooled down from a given initial temperature under a given outdoor temperature.Finally, the noise level under different performance conditions can be measured.
- 160-
Manufacturers should also specify compressor coefficient of performance, motorefficiencies, and heat-exchanger efficiency under specified temperature and humidityconditions.
(f) For water pumps, the test should measure electricity and power requirements topump water from a given depth to the level of the pump, and then from below thepump up to a given height (the maximum depth and height are given in pumpcatalogues). The test specifies the diameter of the water pipe. Manufacturersshould also specify the efficiency of the pump motor.
(g) For light bulbs, the most important information concerns the efficacy (output inlumens, divided by power in watts), and the lifetime. These should be tested andspecified together, since they tend to be inversely related. Because the line voltagevaries significantly in Indonesia, bulbs should also be tested for lifestyle and efficacyunder considerably higher and lower than normal line voltage.
(h) Several tests can be applied to cooking appliances. For electric ovens, tests shouldmeasure the amount of electricity required to heat the oven to a specifiedtemperature, and the time required. Then, the amount of electricity required tokeep the oven at the specified temperature should be measured. A similar testshould be carried out on rice cookers, measuring the consumption and time requiredto bring water to a boil and then to sustain the cooking rice for a given time.Manufacturers should specify the insulation values of the walls and door of the oven.
(i) For water heaters, tests must measure the amount of electricity consumed to keepthe water at a constant temperature. Then, after a given amount of water iswithdrawn, the test measures the electricity consumed to heat up incoming water tothe desired temperature. Manufacturers should specify these two quantities, themaximum wattage of the unit, and the level of insulation in the water heater.
4.21 At present, there is enough information available for consumers to choose wiselyamong A/C and TV, but no reliable information on refrigeration equipment, washing machines, orpumps. As noted above, the wattage of TV sets is published in catalogues. For A/C,manufacturers already specify the energy-efficiency ratio (EER) of virtually every model sold inIndonesia. This ratio is defined as cooling power (in BTU/hr) over wattage. Values for importedmodels are taken from manufacturers' specifications--one company even notes the EER with anoutdoor temperature of 32°C and with one of 35°C. Since we found no evidence that local modelsare tested for cooling power, we assume that EER figures for these model--mostly windowtypes--are either guessed from calculations or derived from specifications for the Japanese modelson which the local models are produced. Information on efficacy and lifetime of lightbulbs is noteasily obtainable. In no cases were any of these data supported by tests carried out in Indonesia.
4.22 Other appliances can be compared from existing product information and testedfurther. For irons, the wattage depends both on the model and the setting, so a test to determineenergy use is not really meaningful. However, tests can compare how much of the electricityconsumed is converted to heat on the bottom of the iron. For light bulbs, locally madeincandescent bulbs have a poor reputation for lifetime and reliability. A test of output per unit of
- 161-
power (usually expressed in lumens/watt) would be useful, as this measure, called efficacy, can varyby as much as 20% among bulbs of a similar type. For water storage water heaters, manufacturersin the U.S. express the efficiency as the amount of energy lost in keeping the water in the tank ata certain temperature. The same figure of merit is used for ovens (keeping the oven at a certaintemperature). In both cases, the level of insulation in the device determines the amount of energyrequired.
4.23 There are certain special conditions that characterize Indonesia that shouldultimately be reflected in the tests carried out on appliances. First, ambient indoor conditions(temperature, humidity, etc., which affect energy use, product lifetime, rusting, etc.) are differentfrom those in Japan or many other countries where products are made. These conditions requirethat some products be tested in Indonesia. Second, habits of Indonesian consumers (refrigeratordoor opening, washing machine use, particularly choice of detergents) should be reflected in energy-related tests. Finally, the relative instability of electric power voltage (i.e., both fluctuations andbrown-outs) has important effects on appliance components, light bulbs, and, most important,energy consumption and lifetimes of most equipment. Tests should be established that "tortureequipment to see how serious the effects of power instability really are.
4.24 As noted elsewhere, little of this testing is carried out in Indonesia, either forelectricity use or for other consumer features. However, private companies do carry out their owntesting of some features in order to maintain quality control and most of their products are testedand rated by their mother company in Japan. In requiring testing, one issue that arises is thetreatment of smaller companies, particularly those that import, but do not manufacture or assembleproducts Indonesia. These companies would have to call on the services of an independentlaboratory to have their products tested. An advantage of adhering to certain well-establishedtesting norms, such as JIS (Japan International Standard) is that imported products from a varietyof countries would likely be tested in country of origin (usually Japan, but possibly other Asiancountries as well). If this were the case, companies importing products that are tested and labelledwould only need to give the information available from the country of origin.
- 162 -
V. AN ELECTRICITY EFFICIENCY PROGRAM FOR INDONESIA
Introduction
5.1 Data from ,.., present household energy survey, and examination of the appliancescurrently on the market in Indonesia, suggest that electricity is used inefficiently in Indonesianhomes. This inefficiency has two components, 'uninformed behavior" and inefficient technology.This inefficiency costs Indonesia millions of dollars, much of which could be saved through acarefully designed set of policies and programs that aim to increase electricity use efficiency. Inthis chapter we propose such a program, review the benefits, and sketch out actual programelements. Similar programs have been implemented in Brazil (Procel, 1985. "Energy Conservationin Home Appliances". Informe No. 20. Rio de Janeiro: CEPEL), and proposed for Jamaica (WorldBank 1988). This chapter discusses how elements of these and other programs could be appliedto Indonesia.
5.2 Why is there concern about electric power in energy-rich Indonesia? PLN's capacityexpansion plan calls for 12% growth in installed capacity through the year 2000 and will requireroughly US$ 135 billion (constant 1988 dollars) in capital expenditures each year for investmentsin generation, alone. PLN foresees a nearly four-fold increase in the number of residentialcustomers on Java by the year 2000 (to 8 million), and a similar increase out of Java to nearly 4million. They also foresee a very slow increase in use/household, because the new customers willbe small users. But appliance prices are decreasing in most parts of the world; it is possible thatPLN has underestimated the impact of increases in appliance holdings in newly electrified homes,and therefore future household electricity demand. Meeting this demand will be expensive. Actionsthat reduce these outlays and save consumers money as well could therefore be beneficial toIndonesia's economy, as Geller argues for electricity-rich Brazil (Geller 1986).
5.3 The residential sector is a particularly important sector on which to focus efficiencyprograms. For one thing, residential consumers accounted for about 1/3 of PLN's sales in 1987.Yet most homes did not have refrigerators, washers, waterpumps, or A/C. But appliance ownershipis growing rapidly. Acquisition of these appliances will increase consumption per customer.Moreover, appliances are getting larger and more homes are getting their first appliances, whichwill also boost consumption. Air conditioning, which is just beginning to grow, will add to a daytimepeak load. Finally, more marginal consumers (i.e., small load) being added to the network, willeventually increase their own consumption significantly. For example, consumers in two of thehighest expenditure categories use about two times as much electricity/hh as the average of allconsumers, and three to four times more than those in the two lowest categories. The applianceholdings of the highest expenditure households in Java resemtble those in urban areas in Brazil,Thailand, Singapore, and even SenegaL Since most households in Java will reach levels of incomesimilar to those in these countries by the next century, we expect that the two highest expendituregroups serve as a model for the typical household in urban Java in 20 years. As real applianceprices fall, there is even more reason to expect that appliance ownership will increase rapidly inJava. Setting in motion a program that increases the efficiency of new appliances will assure thatthis growing group of consumers acquires efficient devices in the future. Not doing so could be verycostly as residential electricity use grows.
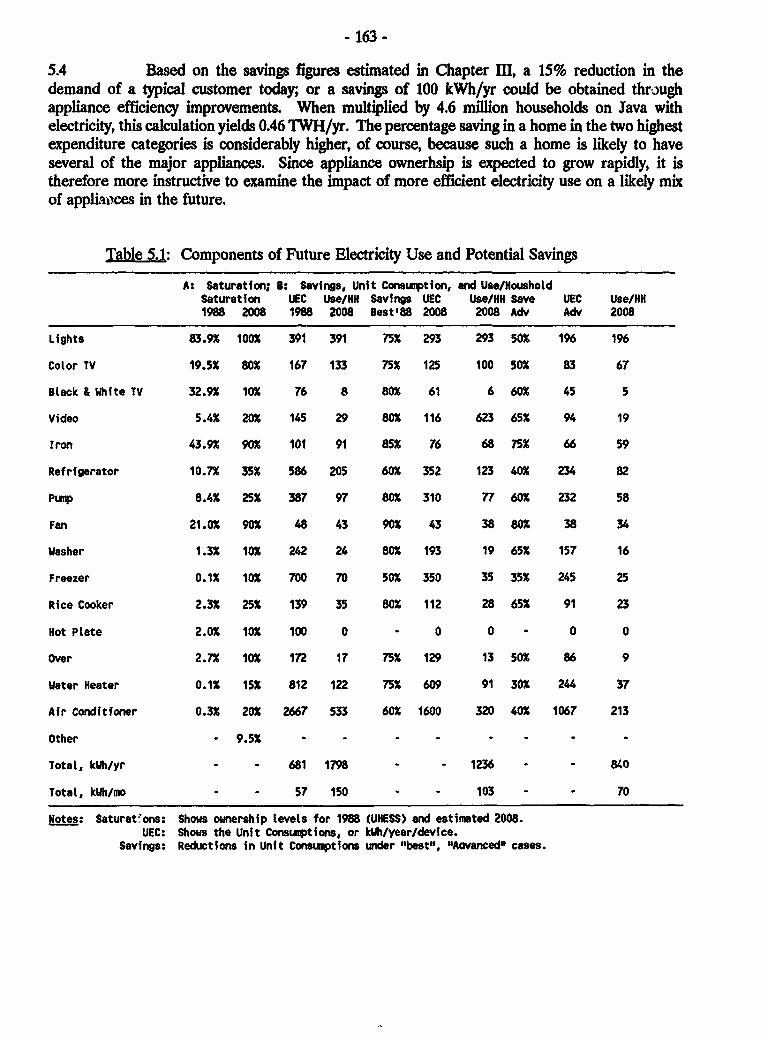
- 163 -
5.4 Based on the savings figures estimated in Chapter m, a 15% reduction in thedemand of a typical customer today; or a savings of 100 kWh/yr could be obtained throughappliance efficiency improvements. When multiplied by 4.6 million households on Java withelectricity, this calculation yields 0.46 TWH/yr. The percentage saving in a home in the two highestexpenditure categories is considerably higher, of course, because such a home is likely to haveseveral of the major appliances. Since appliance ownerhsip is expected to grow rapidly, it istherefore more instructive to examine the impact of more efficient electricity use on a likely mixof appliaoces in the future.
Table 5.1: Components of Future Electricity Use and Potential Savings
A: Saturation; 3: Savings, Unit Consumption, and Use/HousholdSaturation UEC Use/HH Savings UEC Use/NH Save UEC Use/NH1988 2008 1988 2008 Best'88 2008 2008 Adv Adv 2008
Lights 83.9% 100% 391 391 75% 293 293 50% 196 196
Color TV 19.5% 80% 167 133 75% 125 100 50% 83 67
Black & White TV 32.9% 10% 76 8 80% 61 6 60% 45 5
Video 5.4% 20% 145 29 80% 116 623 65% 94 19
Iron 43.9% 90% 101 91 85% 76 68 75% 66 59
Refrigerator 10.7% 35% 586 205 60% 352 123 40% 234 82
Pump 8.4% 25% 387 97 80% 310 77 60% 232 58
Fan 21.0% 90% 48 43 90% 43 38 80% 38 34
Washer 1.3% 10% 242 24 80% 193 19 65% 157 16
Freezer 0.1% 10% 700 70 50% 350 35 35% 245 25
Rice Cooker 2.3% 25% 139 35 80% 112 28 65% 91 23
Hot Plate 2.0% 10% 100 0 0 0 - 0 0
Over 2.7% 10% 172 17 75% 129 13 50% 86 9
Water Heater 0.1% 15% 812 122 75% 609 91 30% 244 37
Air Conditioner 0.3% 20% 2667 533 60% 1600 320 40% 1067 213
Other - 9.5% - - - - - -
Total, kWh/yr - - 681 1798 - - 1236 - - 840
Total, kWh/mo - - 57 150 I 103 - - 70
Notes: Saturat ons: Shows ownership levels for 1988 (UHESS) and estimated 2008.UEC: Shows the Unit Consumptions, or kWh/year/device.
Savings: Reductions in Unit Consumptions under "best", "Aovanced" cases.
- 164 -
5.5 To do this, appliance ownership levels are projected to those that would be obtainedif appliance ownership levels reached the average of those for the two highest consumptionexpenditure categories (see Table 5.1). (Exceptions: Lighting reaches 100% of connections, colorTV, 90%, freezers and ovens, 10%, water heaters, 15%, air conditioning, 20%). Using these futureownership levels, consumption for each major appliance and for all uses are calculated under theassumption that: (i) consumption/appliance remains constant; (ii) consumption/appliance falls withthe introduction of appliances that today are among the most electricity-efficient on the market;and (iii) consumption/appliance falls to levels deemed achievable with technologies that will becommon after the year 2000. Figure 5.1 illustrates electricity consumption per household when eachof the two sets of conservation "potentials" discussed earlier are achieved, and compares theseresults to present-day consumption and to the level that would be obtained if efficiencies werefrozen. (Note the important growth in refrigeration and "other".) The figure shows that moreefficient electricity use could reduce household electricity costs significantly.
5.6 To estimate the overall impact of greater efficiency on electricity sales in 2008,Figure 5.2 presents present consumption (based on 4.6 million households using electricity on Javain 1988), and future consumption based on an estimate of 12 million electricity-using householdsin 2008 (PLN estimates 8.1 million subscribers in 2000; our extrapolation assumes continued growthand includes non-subscribers using elecricity as well). The calculation, as shown in the figure, showsthat increases In electricIty-use effciency permit a savings of 7.4 TWH If today's best models arechosen, and 11.5 TWH Uf advanced models are chosen. (About half of these savings will be realizedby 2000.) Put another way, sales to the residential sector grow by 10%/year if efficiency remainsconstant, but by only 8% and 6%/year respectively if the two efficiency levels are reached. Thedifference between the base case and either of the two efficiency scenarios for 2008 shows theimportant role greater efficiency plays in reducing future growth. As noted previously, increasesin appliance size and features could not only drive the baseline consumption up even more thanillustrated here, but also increase the gap provided by savings. While the calculations are onlyillustrative, they show that the overall impact of greater efficiency can be large: PLN expects to sellaround 18.5 TWH by the year 2000. More efficient household electricity use could reduce thesesales by a considerable amount. As an important additional benefit, these savings will likely bereplicated in the commercial building sector, which buys a significant number of refrigerators, roomA/C, televisions, water heaters, and other appliances.
5.7 These savings affect both connected load (in watts) as well as total use. Room A/Cload could fall to less than 500 w instead of 1000 w, yet still cool one or more rooms. Color TVcould require under 50 W instead of closer to 100 w, while the connected load of lights could bereduced by about 100 w per household. The 500 MW night time peak of Java appears to becomposed of 60% residential and 40% non-residential; it is conceivable that the residential peakload could be reduced by 30-40% (cooling, lights, TV).
5.8 The economic impact of more efficient electricity use is important to Indonesia. Themarginal cost of electricity production is about 150 Rp per kWh, compared with average revenuesfrom residential customers of less than 100 Rp. It has been estimated that the cost of saving about3040% of the electricity used in new appliances would be considerably less than 100 Rp/kWh. 2/The savings from greater efficiency could reduce much of the growth in residential kWh. Thusan intervention that promoted more efficient household electricity use could allow a giveninvestment in PLN + efficiency to stretch further, i.e., electrifying more customers for a given
- 165 -
capacity. Unfortunately, however, there is much evidence that residential customers miss many ormost opportunities for saving electricity (Ruderman et al 1987; Geller 1986; Schipper 1976), andthat manufacturers of equipment, in turn, will not innovate further than consumers' buying choicesdictate (Schipper et al. 1987). Thus, a program that accelerates efficiency improvements inelectricity use may be called for. Such programs have stimulated efficiency improvements in theUnited States and other countries.
5.9 Higher electricity prices appear to be an unavoidable element in the futuredevelopment of the electric power system in Indonesia, given the disparity between prices and coststoday. Moreover, higher prices are an indispensable element to a successful strategy to cut wastein electric power usage. But higher electricity prices alone cannot "fix" a situation in whichconsLmers appear to be underinvesting in conservation and efficiency. This is because consumerstend to have very poor information about which appliances will cost more or less to use, particularlyin Indonesia. Since consumers must also choose from other options not related to energy, such ascolor, features, etc., they may not be able to select the models they want and also select energyefficiency. Programs that improve marketplace information tend to give energy cost considerationsmore weight in the buying decision process.
5.10 Even if information were perfect, a more important problem tends to determine theoutcome of market choices. More efficient appliances often cost slightly more than less efficientones, but pay back the incremental costs in a few years. Consumers must therefore weigh higherfirst cost against lower running costs. But consumers have notably short time horizons. Americanconsumers, for example, tend to select more efficient appliances with a 2-3 year payback or less inmind (Ruderman et al. 1987). This selection reveals an implied discount or interest rate of 40%real or more, far greater than the cost of consumer loans, interest rates offered in banks, or therates of return required by investments in utility capacity. This revealed capital scarcity might beoverlooked, but the capital to provide electricity capacity to cover the extra consumption requiredbecause consumers forego efficiency investments is a problem in Indonesia (as well as in the UnitedStates). Thus a package of programs that lengthen consumers' time horizons vis-a-vis the purchaseof efficiency characteristics in new appliances w benefit any electric uti'ity short of capital. Gellershows that for Brazil, these potential capital savings are worth billions of US Dollars over the nextdecade or so. Similar benefits are possible for Indonesia.
5.11 There are other market imperfections that constrain consumers from buying efficientappliances and discourage manufacturers from producing more efficient devices. Appliance usersare not always purchasers, particularly where well-to-do consumers live in furnished housing oremployees use company flats. Consumers who already own appliances that break down usually rushto replace these with little time for considering alternative purchases. The nature of the marketin Indonesia--many smaller stores, each with limited selections and often located in areas difficultto reach conveniently--makes it unlikely that consumers can shop around vis-a-vis energy, since theycan bargain for a device in any store until the price is mutually satisfactory.
5.12 Manufacturers are hindered from improving their products by many factors, too.For one thing, the majority of assemblers/ manufacturers are saddled with old designs dictated byforeign-dominated companies. At the same time, there are almost no local innovators who couldenter the market with applianccs that were truly adapted to the Indonesian climate, market,
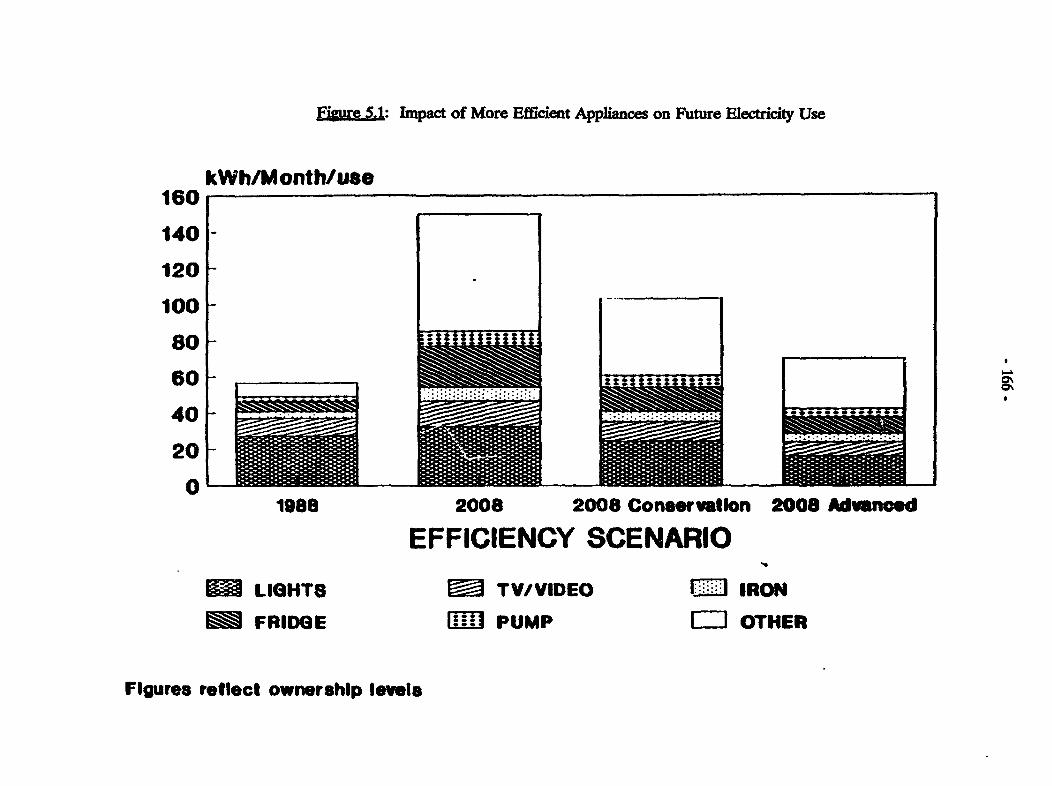
FiurS.w1: Impact of More Efficient Apphances on Future Electicity Use
kWh/Month/use160
140-
120
100
800toL 60 -~~~~~~~~~~~~~~~
40 -
20
01988 2008 2008 Conservatlon 2008 dwanoed
EFFICIENCY SCENARIO
LieHT S TV/VIDEO IRONFRIDGE [11 PUMP El OTHER
Flgures reflect ownership Ionia
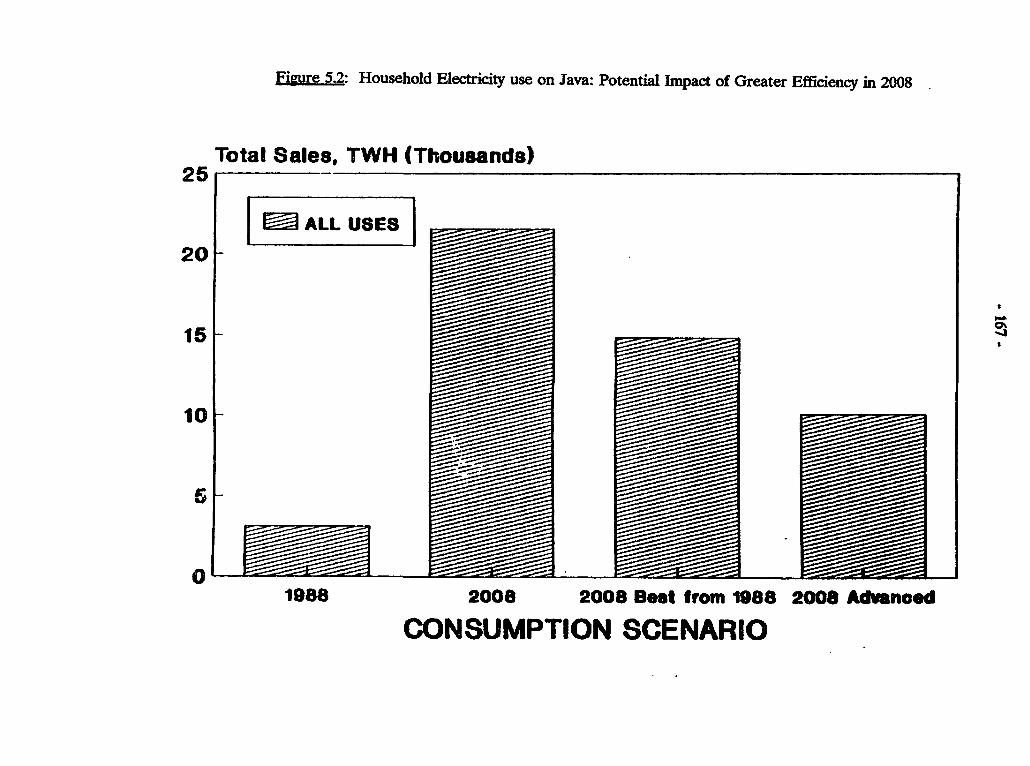
Figure 5.2: Household Electricity use on Java: Potential Impact of Greater Efficiency in 2008
Total Sales, TWH (Thousands)25
20 0 ALL USES20
16
10
6
01988 2008 2008 Best from 1988 2008 Advanced
CONSUMPTION SCENARIO
- 168 -
electricity grid, and, most important, utilization patterns, all of which have an important impact onelectricity needs. As long as the information about actual electricity use in any device is missingor incomplete, manufacturers have no need to improve their products, since there is no measuringstick against which to compare improvements. (Some improvements that allegedly save electricityare noted in some catalogues found in Indonesia, but the buyer cannot ascertain whether thesefeatures really save electricity.) If manufacturers see no real return from improving efficiencysignificantly, they have no rationale for doing so.
5.13 Hence, the marketplace for appliances in Indonesia is so imperfect that neitherconsumers nor manufacturers can be expected to take up many or most of the kinds of efficiencyimprovements that would be justified by the current (or future) price of electricity. A carefullydesigned electricity conservation/efficiency program could remedy many of these failures.
5.14 A reasonable policy goal is to intervene in such a way as to cause changes inelectricity-use efficiency that are worth more (to customers, to PLN, to Indonesia) than the totalcost of intervention. These interventions must be aimed both at consumer and at those who produceelectricity-using equipment. The cost of intervention is both the cost of actual investments orbehavior changes, the direct cost to the government and other institutions of the program, and theindirect political costs. However, many of the investments in greater efficiency would beundertaken over 30 years anyway, as products and consumers become more sophisticated. Forexample, appliance testing and labelling takes place in most developed countries, and is beingimplemented or proposed for developing countries as well (Brazil, Philippines). Therefore, theoverall impact of a conservation program would be to accelerate the maturation processes by whichmanufacturers and consumers move towards more efficient appliances.
5.15 The choice of policy elements for Indonesia depends on the time frame. In the verynear term, higher electricity prices would encourage consumers to use their equipment moreeffectively, perhaps reconsider how many lights should be left burning at night, etc. Although lowerincome consumers might feel the burden of higher prices more immediately, upper incomeconsumers, whose electricity use patterns suggest wide margin for immediate savings, woulddoubtless respond as well to higher prices. Authoritative institutions--the Government, PLN, YLKI,could certainly advise consumers on ways to cut back on consumption by better use of equipment.
5.16 In the medium and long term, however, there is actually scope for greater savings.For example, information programs (as discussed below) could encourage consumers to purchasemore efficient lamps, appliances, and other equipment. Such changes could take place within oneor two years in Indonesia. If consumers responded, manufacturers would see a larger market formore efficient devices. And in the longer term (3-5 years and beyond), this response could befurther reinforced by both new products developed by manufacturers in response to competition,as well as by publicized efficiency targets or even standards, which could be related to improvementsrealized in appliances sold each year. If such improvements were deemed to fall short ofexpectations (as defined in part by the costs of electricity and the investment requirements of PLN),the improvements could be accelerated by setting of minimum efficiency standards. Finally,consumers could be encouraged to choose more efficient appliances if the government itself, andother visible institutions (hotels, restaurants, etc.) also invested in more efficient lights, appliances,and other electricity-using devices.
* 169 -
Proposed Electricity Conservation Program for Indonesia
5.17 Implementing a conservation program requires important considerations of phases,timing, and actors. In this section, we suggest three separate but related kinds of interventions,break these into phases, discuss timing in broad terms and suggest some-but not all--of the actorswho ought to be involved.
5.18 Following Wilson et al. (1988), we classify the proposed interventions as follows:
(a) Information Intervention: Inform consumers about product choices and use. Testthe consumption of new appliances; measure actual consumption in consumers'homes, to relate tested consumption to actual use patterns; display the testedconsumption of new appliances prominently in catalogues, advertising, and labels thatare actually attached to new appliances and the cartons in which they are packed andsold. Prepare a wide publicity campaign to inform consumers, officials, andmanufacturers about the elements of the efficiency program, as well as educatingconsumers, sellers, etc., about efficiency. Information programs can be implementedimmediately in theory; in practice in Indonesia several years of negotiation andtesting are required before substantially complete information about appliances canbe provided to consumers.
(b) Technical Interventions: Change the kinds of products on the market. Essentiallythis approach represents a calculated investment strategy, by which authoritiesencourage or require that new appliances be more efficient, which usually raisestheir prices slightly. Start with voluntary targets for efficiency improvements in newappliances. Announce mandatory efficiency standards to take effect after severalyears of the voluntary program has been in effect. For Indonesia, such interventionsmust await the testing and labelling described above, since, as we describe below,establishing targets or standards
(c) Incentives: Change the conditions of the market. Adjust prices to reflect the costof providing electricity. Design subsidy programs to modify market conditions forelectric appliances. These programs give rebates (either through utilities or throughappliance dealer associations) to customers for buying the most efficient models.
5.19 These strategies interact: higher prices justify interest and investment in efficiency.If electricity prices rise, consumers gain greater benefits from investing in more efficient appliances,and consumers also see greater returns from modifying how they use appliances (or lights). At thesame time the producers, importers, or sellers of appliances see a larger and safer market forimproved, efficient appliances. If the market for efficiency increases, manufacturers tend to bewilling to invest more of their own resources in improving the efficiency of products and ofmarketing these more efficient products. Information advises consumers how to react to higherprices; conversely, higher prices make consumers more interested in finding out about ways to saveelectricity. In the following pages we review elements of each of these phases of intervention.
- 170 -
Information Interventions
5.20 Little can be done to improve the efficiency of electricity use without informationabout current patterns of use and the characteristics of existing and new end-use devices, ie,appliances, water heaters, lights, cookers, etc. In every country where a program has been launchedto spur increased efficiency of electric appliances and other electricity using-devices, an effort hasbeen made to fill this information gap by testing new appliances for energy consumption (and otherproperties as well), and publishing the results as widely as possible. A submetering experimenthelps authorities pin down end-uses where consumption appears excessive because of careless useor where improvements in efficiency are justified by high levels of activity (such as more extensiveuse of lighting, ironing, water boiling, etc.). This information is used by consumers to compareproducts; by government and utilities to evaluate overall improvements in actual efficiency ofdevices on the market, and by manufacturers as goals against which to compete and to measureprogress. Good information also makes it more difficult for manufacturers to make vague claimsabout electricity saving features that may be questionable, rewarding those manufacturers who candemonstrate that their designs do save electricity relative to those of the competition.
Available Information on Appliances
5.21 Currently there are no tests of electricity consumption in new household appliancescarried out in Indonesia. The only major appliances for which important and useful data relatedto electricity consumption are available are air conditioners (A/C) and televisions (TV). For thesedevices, cooling power and size, respectively, can be compared with wattage to provide a usefulmeasure of energy consumption per unit of useful output.
5.22 However, there is no actual checking of this information. For refrigerators, freezers,washers, ovens, water heaters, pumps, and microwave ovens, each appliance must be run over aperiod of time under well-defined conditions to establish energy consumption. Some additionalinformation about appliance electricity use may be readily available in Indonesia from Japaneseproducers of imported appliances. We found in the catalogue from one Japanese manufacturer aclear indicator of electricity use for refrigerators and freezers, expressed in kWh/month. We alsobelieve that information on kWh/kg of clothes for washers is available from Japanese importers.We believe that for most appliances imported into Indonesia, Japanese test results not alreadystated could be found.
Testing and Labelling of New Appliances
5.23 The first step towards helping consumers obtain information about energyconsumption would be a government requirement that all major appliances be labelled as to theirtested energy consumption. Initially, the government could accept testing according to JIS, JapanInternational Standard, which many countries in the Far East use. Where locally assembledproducts that are identical with products in other countries are available in Indonesia, consumptiondata from these other countries must also be provided.
5.24 This first step is only an interim one. Different countries test appliances underdifferent conditions. It is important, therefore, that the GOI, through a ministry or PLN and inconsultation with appliance manufacturers and importers, establish: (a) procedures for adjusting
- 171 -
results of other countries tests to Indonesian conditions; and (b) tests to be carried out in Indonesiafor all products sold in Indonesia. By following these steps, imported products could be comparedfairly with those locally made, using information that reflects Indonesian conditions. We found, forexample, that one Japanese manufacturer of imported A/C stated energy efficiency ratios withoutdoor temperatures of 32°C (appropriate for much of Japan) and 35°C (more appropriate forIndonesia). At this higher temperature, the EER is slightly lower than at the lower temperature.Similar adjustments must be made to refrigerator and freezer tests to account for high indoortemperatures.
5.25 The next step is to promulgate a list of appliances that must be tested in Indonesia.At present, the most important electricity-using devices are light bulbs, TV, irons, and refrigerators.However, air-conditioners, freezers, and water pumps are growing rapidly in importance, andwashing machines could become important as well. In terms of use per appliance (or application),however, ironing is considerably less important than other appliances, while testing of TV wouldadd little information to that already available. Furthermore, the slight differences in energyconsumption/output between lightbulbs of a given type are far less important than the differencesamong the major types. Thus the testing of appliances should focus initially on A/C, refrigerators,freezers, and pumps. Water heaters and clothes washers could be considered for testing at a laterdate. But TV and iron wattage, and water heater insulation levels should be included in labellingto be attached to each device.
5.26 The choice of test conditions and procedures that reflect local conditions and aconsensus of how appliances are actually used is important. Such tests have now been developedin Brazil, and have been proposed for Jamaica, as part of a World Bank Program. Forrefrigerators, for example, door openings, ambient temperature and humidity, variations in localvoltage, etc., should be considered in the tests. Initially, each seller/manufacturer should berequired to test at random a certain number of each model for sale of an appliance on the test list.Any new model introduced must also be tested. After a given period, no appliances of the type onthe test list will be permitted to be sold (or imported and sold) unless they have been tested inIndonesia.
5.27 Test results appear in catalogues of each appliance that list, among other things,tested energy use. In some cases, these results are given in manufacturers' catalogues with technicalinformation or even on the same page where each appliance is presented. In the United States,a label estimating energy use of each appliance, with comparisons to other models, must appear onevery new appliance sold. (We found some of these tags still displayed on new American appliancessold in Jakarta.) In many European countries the results are included as part of overall evaluationsthat note other important qualities of interest to consumers.
5.28 In Japan, the U.S., and most European countries, tests are carried out by eithermanufacturers or by a combination of government or quasi-government labs, private consumerorganizations, or other recognized, independent groups. Manufacturer testing has proven successfulin some countries, such as the U.K, the U.S., or (for some appliances) Sweden. Additionally,however, the U.S. Consumers' Union makes its own evaluation after purchasing appliances fromits local outlets. By purchasing the appliances, they avoid the risk that units supplied bymanufactures might not be representative of the average unit. In Germany, Stiftung Warentest, anindependent group with some government support, carries out this function, using independent
- 172 -
laboratories for the actual tests. In Jamaica it is proposed that the manufacturers test, but theJamaican Bureau of Standards oversees the function. In all countries, test conditions are workedout between government, manufacturers' representatives, consumer groups, and the actual testinglab. Both approaches--manufacturer testing or independent testing--have advantages anddisadvantages.
5.29 Consider first requinrng manufacturers in Indonesia to test appliances. This is theleast costly approach, since devices unpacked and tested can still be used as display models in storesor repackaged. Indeed, manufacturers already carry out spot checks on compressor powerconsumption of refrigerators and other properties of appliances. Requiring energy consumptiontesting means that the appliances actually checked will have to remain under test for several days,so manufacturers will have to dedicate space and personnel to this task. This procedure must bepoliced by an appropriate government body, who must make spot checks to insure that results areobtained correctly and recorded faithfully. (Curtently there is no widely recognized central testingfacility or Bureau of Standards in Indonesia.) And the government will want to purchase a limitednumber of devices to perform their own checking, a function that could be carried out by LMK.But manufacturer testing may enccunter resistance from consumer groups, who may have reasonto doubt the objectivity of such tests.
5.30 The alternative path is for a recognized "neutral" body in Indonesia, or a newlyestablished testing institution, to acquire a sufficient number of each kind of appliance so as to beable to carry out statistically credible tests themselves. These appliances could later be sold as"almost" new, or used in government housing projects. Alternatively, the government could requirethat the manufacturers/sellers "lend" the appointed testing group the required appliances, whichwould be returned to the manufacturers to be used as demonstration devices or sold at a fairdiscount over "new/in box" models (although again the manufacturer might preselect the best modelavailable). If this path were chosen, the most likely group for testing electricity consumption wouldbe LMK. However, it might be desirable to examine other properties of appliances of interest toconsumers, such as noise, vibration, and other characteristics related to quality. For these purposes,it might be more desirable to work with other testing labs and YLKI to develop more thoroughprocedures for testing all major consumer appliances. Such testing is already carried out in mostindustrialized countries, so the effect of choosing this path would be to start such activities at anearly stage in Indonesia's development.
5.31 Comparing the two choices, it is clear that the requirement for manufacturerstesting Is the simplest and least costly, but the requirement for establishment of an independenttest leads to other consumer benefits In the long run, benefits now available from testing ofproducts in most industrialized countries. It Is sensible to start with manufacturer testing to gainexperience at low cost, and then proceed after a few years to independent testing, i.e., to developa laboratory to take over this work after a number of years. Such a laboratory could be designedto test appliances for a number of countries in the region.
5.32 As a result of these tests, buyers of household appliances will have reliableinformation on the relative energy-related performance of each product. Additionally,manufacturers will have a framework of information against which to compete on "energy-saving"properties. These approximate figures will reflect the relative energy use of different appliancesunder actual conditions.
- 173-
5.33 The process of working out test conditions (ie, reference temperatures, wash cycles,etc.) may take many months; in the EEC, disagreements over such details have all but sabotagedany EEC-wide labelling. We expect that publication of draft standard test conditions will lead tosome difficulties that will lead to revisions, although Indonesia will be able to draw on theexperience of many other countries. The sub-metering experiment discussed below is aimed in partat quantifying actuaL rather than theoretical or laboratory patterns of use, in order to clarify testconditions. Some of the information that would be required, such as frequency of use, can beobtained today from the UHESS survey. Additionally, however, the proper label the format ofinformation in catalogues, etc., must be determined.
5.34 Costs for these steps thus far are difficult to determine; for Jamaica, implementationof testing and labelling was estimated to cost close to $US 1 million. Indirect costs includededication of time of %government officials and engineers, and the time spent organizing both thenecessary institutional structure as well as the research into use patterns (and other countries'experiences). Two to three person-years for the first two years, less thereafter, appear to besufficient.
Metering of Actual Appliance Energy Use
5.35 The next vital step in the information program is to perform a submeteringexperiment. In several hundred homes, LMK should put meters on the major appliances of concernto test consumption over a period of not less than three months. Using small electronic meters,consumption could be recorded without bothering occupants or influencing their consumptionpatterns. Alternatively, electro-mechanical meters could be used, but these would have to be readregularly, a disturbance that might influence consumer usage.5.36 This step gives the appliance manufacturers, PLN, and consumers themselvesvaluable information on how appliances are actually used, both as a function of the tested applianceefficiency, and as a function of family size, routines and habits, and special conditions. PLN wiliimprove its own knowledge of customer profiles and end-use structure. And manufacturers will gainbetter insights on how well their appliances actually work.
Labeling and Information Requirements
5.37 The final step in the appliance labelling and testing program is to design labels andcharacterize the information that will be required in catalogues, advertising, and on the cartons inwhich appliances are packaged. Because of its broad appeat we favor the U.S. labeL This labelstates the averaged tested consumption of each appliance under the assumed (and stated)conditions, and shows clearly the range of consumption (from highest to lowest, shown on a linearscale, i.e., a straight line). The label also states the average yearly cost of using the appliance fora range of electricity prices. Thus the label "rates' the appliance against all others available. Astatement of the consumption alone might be misleading to the individual consumer, all that canbe guaranteed is the relative energy and monetary cost of using different machines. The labelshould of course be designed to reach contemporary Indonesian families, perhaps borrowing (withauthorization) the face of some familiar cartoon character or other widely recognized symboL Inmost countries, for example, the name of the conservation program should be prominentlydisplayed. Consumers then come to recognize the label and its purpose immediately.
- 174 -
5.38 Establishment of testing and labelling procedures has an important indirect benefit.The results of the program allow authorities to monitor the changes in efficiency of new appliancesactually sold in Indonesia. This is done by weighing the efficiency of each size or class of appliance(size of refrigerator, capacity of clothes washer, etc.) by the number actually sold, to give the salesweighted efficiency factor, or SWEF. The SWEF will show how the overall stock of appliances isimprovinS even if the size or output rating of a particular type is increasing. SWEFs provide auseful way of establishing goals for improvements in efficiency, much as the CAFE (for corporateaverage efficiency) standards are used to set goals for the improvements in automobiles in the U.S.SWEFS were used in the U.S. and the Federal Republic of Germany as the basis for voluntaryagreements. These agreements, in the case of Germany, were extremely effective in provokingimprovements in all products produced in that countly. The appliance association, ZVEI agreedthat its members would improve the average efficiencies of each appliance sold. The targets for1985, defined as percentage improvements in the SWEFs of key appliances, were agreed to in thelate 1970s for 1985. These targets were fulfilled well ahead of time.
Consumer Outreach: Increasing Consumer Appliance Literacy
539 Another useful part of an information program is to reach out to consumers andothers in the chain between manufacturer and user. Energy consumption is certainly not the onlycriterion for choosing an electric appliance. And the provision of information on energyconsumption, while potentially simple, may not be sufficiently undecstood to be effective. What isrequired is a broader program to increase consumer literacy over how appliances work, how theyare to be maintained, and how quality varies among appliances. The Swedish Board of ConsumerAffairs attempts to judge as many as 10 features of washing machines, including energy use, beforegiving an overall rating. To inform consumers about appliances, particularly the first-time buyersor users who will make the majority of purchases over the next twenty years, will take time andpatience.
5AO One way of increasing "appliance literacy' is for either consumer groups (such asYLI) or PLN to promote appliance clinics, at which proper use of appliances is demonstrated.Some utilities in the US. and Europe have done this through their home economists, othersthrough their own sales outlets for appliances. Whfle there may be a potential conflict of interesthere-the utility is selling both electricity and know-how on eectricity savings--the utility has theubiquitous presence required to reach a maximum number of households. YLKI could also holdsuch clinics, although they are wary of being seen promoting a particular product. The Tradeassociations themselves could organize such clics, which would also tend to boost sales. Somemight see a selleres clinic as simply a promotional stunt, however.
5A1 The second element in improving appliance literacy requires careful production ofattractive written material covering features of appliances including energy consumption. Thismeans that results of energy consumption tests must be displayed prominently in catalogues andprice lists The best display features consumption test results along with other material in eachcatalogue. Inclusion of energy consumption data with a detailed list of other technical specificationsis important, too, but the energy figures should also be seen in the same view as the picture of themodel itself. Finally, the government could consider requiring that consumption test results bedisplayed prommnently in printed and media advertising
- 175 -
5.42 Written material on appliances will include information on energy use and otheraspects of quality. For example, the Swedish Board of Consumer Affairs produces a brochure thatexamines all popular washing machines for energy and other important features. They test fornoise, moisture content after washing and centrifuging, and other properties of interest toconsumers. Most prospective buyers read the booklet before buying. Alternatively, correspondinggroups in the U.S. and Germany describe test results in their monthly publications whenever newtests are performed. The lesson here is again that energy consumption information alone is seldominteresting to consumers, but should be given a prominent place alongside other informationimportant for good consumer choice.
5.43 The sellers of appliances must also be targets for information. They must be taughtwhat the various figures in catalogues and labels mean to consumers; how to work energy efficiencyinto sales arguments; where to turn for more information, particularly when buyers return withoperational questions. Seminars for these vitai actors, as are proposed for Jamaica, should beorganized.
5.44 Some governments have tried to "educate" consumers, beyond information on howto buy and use efficient appliances. This "education" urges not simply care in using electricity, butrather self-denial. For example, the Japanese Energy Conservation Center once distributed hand-held fans that were inscribed with messages saying "Do not turn on the Room A/C until thetemperature reaches 26°C." Few Japanese colleagues paid heed to this message by itself except intimes of clear danger to energy supply, such as in the summer of 1979. Similarly, U.S. utilities doreport some success in getting customers to use less A/C or other major appliances during periodsof capacity shortage or extreme heat. Efforts in France and other countries to "suggest" lesscomfortable indoor temperatures also failed, and similar efforts in the U.S. to urge consumers tosacrifice for saving energy produced few tangible results, other than resentment for the words"energy conservation." Similar efforts in Asian developing countries to discourage A/C, lighting,and even elevator use had little impact except during widely-perceived crises. Since the clear andpresent danger is not a part of the Indonesian environment, it is not likely that the behavioral stickcan have much impact in Indonesia.
5.45 Nevertheless, if information on how to achieve electricity savings is provided wellin advance of announced increases in electricity prices, consumers will probably heed some of theadvice in order to cut costs. Indeed, when Taiwan raised the price of residential electricity in1980/81 after many years of constant or falling prices, sales growth, which had run at nearly 10%a year, was slashed.
5.46 Carrying the whole message to sellers and consumers will require substantial start-up publicity. Manufacturers could pay for labels (as in Jamaica); the government, through PLN,could support activities of LMK, PLN, and YLKI. Funding must come from GOI. The Jamaicanproposal suggests that these publicity costs are small compared to the total volume of appliancesales, as well as compared to the value of the energy saved under the most pessimistic assumptions.
Demonstrations and Government Procurement
5.47 One parallel step the government can initiate immediately is to revise its ownprocurement procedures so as to favor purchase and installation of energy efficient equipment. In
- 176 -
the years following the first oil price shock, many oil-importing countries realized that they couldcontrol as much as 15% of household electricity use because they controlled the housing, eitherbecause the housing was built by public authorities, or because governments support families whooccupy the homes. Additionally, governments purchase hundreds (or thousands) of homeappliances that are used in offices, in military establishments, or to equip government-financedprojects like hotels, schools, or hospitals. The government can demand that all purchases ofappliances be from a select list of the most efficient models available, and that employees or otherusers be instructed in proper use and maintenance. We noticed several government offices wherea room air conditioner was running while windows were open enough to almost neutralize the effectof the A/C.
5.48 In the near term, this procurement program will have to be limited to A/C andlighting, where the choices between more and less efficient are relatively straightforward. Thegovernment could establish as a goal the purchase of A/C with an EER of 12.5 or greater (14.5 isthe highest available in Indonesia, according to Japanese tests). Over time, this goal could be raised.As information became available from tests, the government could make similar requirements forTV, water heating, cooking, washing, and refrigeration equipment, all of which will be needed forschools, hospitals, barracks, and, where joint ventures are planned, for hotels and restaurants aswell. Additionally, the government could assure that most, if not all, new lamps and fixtures itbought would be fluorescent or compact fluorescent. The latter would be appropriate for existingfixtures that hold incandescent lamps. In the longer term the Government could move to purchaseonly compact fluorescent bulbs.
Information Program: Summary and Time Frame
(a) Available information on A/C and TV could be collected rapidly by PLN or YLKIand reproduced in a brochure to be made available to customers in appliances stores,as well as throug.i contacts both PLN and YLKI have with consumers. This couldbe implemented by 1990.
(b) Information on careful use of existing major appliances can be made available withinone year. To this end, a committee composed of representatives of manufacturers,PLN/LMK, and YLKI should develop a list of simple strategies for major appliancesand lighting. Information from the HES will be helpful. The submetering experimentshould also be implemented. These steps can be implemented in 1990.
(c) Information on tested appliance electricity consumption in producer's homecountries, where such information has been produced, could be required of allproduct importers, again by 1990. This information would be used in determiningefficiency goals (see below), as well as in comparing foreign and proposed Indonesiantest results. PLN could collect such information through the Appliance Association.
(d) Test procedures (and the organizations nominated for testing) will require somedevelopment, estimated at as much as two years. This particular phase will requireat least two or three independent engineers who will represent the utility andconsumers in negotiations with manufacturers, judge manufacture capability fortesting, study foreign experience with testing, etc. A reasonable target date for
- 177-
required testing, if a program began in 1990, would be preliminary tests 1991, resultsmade public by late 1991, and requirements for testing published in 1992. By theend of 1992, it would be illegal to sell an appliance in Indonesia without revealingtested energy use.
(e) Even as manufacture testing is beginning, the search for an appropriate institutionfor independent testing should begin. We estimate that within a year of the startoi manufacturing testing, the appropriate independent institution could take over thetesting function. A board composed of representative parties would oversee thefunctions of the independent institution.
(f) With required testing of new appliances, information could be available to consumersin catalogues and brochures within a few months of the testing. This could takeplace in 1992 if preliminary testing efforts (by manufacturers) began in late 1990 orearly 1991. PLN and YLKI should also prepare a brochure for each type of majorappliance, listing models avaiable, tested energy use, and other properties deemedimportant to consumers.
(g) PLNlConsumer Awareness outreach can be implemented by 1991. This programwill initially use leaflets to inform consumers and buyers of the cost of using majorappliances. After better information from testing is available, clinics that showconsumers and consumer groups how to choose and use appliances effetively canbe launched.
(h) Government procurement can be implemented immediately for key appliances likeA/C. By the time testing and labelling is completed, the government will be ableto choose the most efficient appliances for almost all major types.
Technical Interventions: ProJucing and Selling More Efficient Appliances
5.49 Technical interventions alter the make-up of products in the marketplace. Suchinterventions are aimed at the manufacturers and importers of electricity using products. Theseinterventions complement the information and price signals we discussed above.
Voluntary Agreements: Targets for Efficien9t
5.50 The first step in changing the mix of products available on the market in Indonesiais to approach the manufacturers and sellers of appliances with a program of targets for energyefficiency. Initially the government, through PLN/LMvfK. together with representatives ofconsumers, manufacturers and sellers, should establish "voluntary' efficiency targets for 1992 as"Gentlemen's Agreements." Such "gentlemen's agreements! in Japan and W. Germany (Wilson etaL) stimulated manufacturers to stop selling their least efficient models, and at the same time toincrease the efficiency of all models. The agreements also send a strong signal to appliancebuyers/users that efficiency had become important. It took the German government less than oneyear (1977) to negotiate such agreements, which effectively covered targets for the years 1978 - 1980
- 178 -
- 1985. By all estimates, these targets were reached. Manufacturers in other countries improvedtheir products to sell in Germany, which caused tLe German program to lead to improved efficiencyin most countries in Europe.
5.51 How are 'Gentlemen's Agreements" implemented? Efficiency targets can bedesigned progressively: a certain percent improvement within 2 years, a greater improvement widtin5 years. The SWEFs (see above) for Indonesia, or at least the energy consumption of individualappliances that sell particularly well, could be compared with appliances sold in japan, Europe, andNorth America to establish goals for improvement in the near term (2 years) and longer term (4-5 years). Testing of energy use in appliances currently manufactured or imported would allowsdetermination of SWEFS for major appliances sold in the starting year. Yearly progress towardsmeeting these targets is measured using the SWEFs. The manufacturer's association tabulates thedata by weighting the tested consumption of each product by the sales of that product by eachcompany. (A careful system would have to be established to insure confidentiality.) By offeringmanufacturers a goal and offering the public a measuring standard, the market response to improveefficiency and to buy efficiency would be enhanced.
Minimum Efficiency Standards
5.52 If the information from testing and labelling shows that progress is not being madetowards goals, then the government can promulgate minimum efficiency standards. This approachwas taken by many states in the United States, most notably California, and finally adopted by theUnited States as a whole, to take effect in 1990-1992 (depending on the appliance). Put simply, theNational Appliance Efficiency and Conservation Act makes it illegal to sell major appliances (bothgas and electric) after 1992 that do not meet certain minimum performance efficiency standards.(The kinds of criteria were discussed in the Chapter on Regulation and Standards.) The energyperformance standards are based on well established tests of consumption developed for labellingprograms. These standards will be progressively tightened, giving manufacturers near term targetsthat are easier to achieve, but long term targets that are more ambitious. These standardsconsidered analyses of the payback to consumers from buying more efficient appliances thanotherwise. I/
5.53 Which approach is better for Indonesia? The answer is both. If testing and labellingbegins now, a voluntary program along the lines of the Gentlemen's agreements, can begin in a fewyears. If this program succeeds in improving the efficiency of appliances sold in Indonesia, strictenergy norms can be put off. If the voluntary program does not succeed, then the strict programcan be put into place. The size of the Indonesian market is potentially so large that producers andthe countries that represent them would probably find it worthwhile both adjusting the mix ofproducts they market in Indonesia to reflect concerns over efficiency and to develop efficient
LI 7These standards were passed by the U.S. Congress after neatly a decade of debate, dunng which many large states,mcludingCaifornia, implementedeffcieystandardson cerai applances. Thesestatestandanfswerestmngenoughto fomee as much as one-third of availabl produas out of lumaive markets ake California For a time, nationalcataoues that featued appliances sinp( labeled somne 'not available in California.T The economic importance ofthat state (12% of the U.S. GNP) and the gwing list of others with similarstanda-dsfowed the man ufactumes to tumto the government to ask for a latively strong national standard, rmther than produce separate products for differentstates.
- 179 -
models that are truly built for Indonesian climate and conditions. Alternatively, the governmentcould implement the voluntary program for a period of five years and within the first two yearsannounce standards that would be mandatory by the end of the fifth year of the program.
5.54 In implementing standards, the authorities must recognize that while relatively mildrequirements that simply prohibit the sale of the most inefficient appliances could be implementedrapidly (i.e., with one or two year's notice), more ambitious targets must be timed to allowmanufacturers to adjust their production and marketing accordingly. Indeed, it is advantageous forthe authorities to announce both near and longer term standards, since some manufacturers mayfind it advantageous to plan for the more ambitious targets sooner than required if they areotherwise planning a new product line or retooling. These concerns argue for a set of voluntarytargets today that conclude with mandatory standards at the end of the voluntary period, becausethe manufacturers have the most time to meet the standards, as well as goals for improvingefficiency voluntarily up to the time that the standards take effect.
Research in Indonesia
5.55 Developing efficient products in Indonesia is not solely the responsibility of foreigncompanies. It would be possible for the Government, acting through BPPT or PLN, to offerresearch funds for development of efficient, locally produced appliances, possibly through a seriesof competitions. Such an approach was used in Sweden to encourage housing and equipmentcompanies to develop a new generation of technologies for reducing heating in that country(Schipper et al., 1985). And such research at the Technical University of Denmark (Noergard andPedersen, 1987) has yielded a series of energy efficient appliances, one of which (the "Low EnergyRefrigeratort" of Broederne Gram A/S, Denmark) is now under production for the Danish Market.Judging from the experience in Denmark, five to seven years will pass between the first experimentson any given appliance and its entrance into the marketplace.
5.56 One L -:icularly interesting candidate for development in Indonesia would be acombined solar/ele.ric water heater. Currently, water heaters are uncommon except in high-inmcme households; most Indonesians bathe in ambient-temperature water. Gas-fired water heatershave ventilation and safety requirements that make them expensive, and LPG, the most logical fuetis expensive. Instant, electric point of use water heaters are cheaper, but these are difficult to usein Indonesia because of the wattage requirements (as much as 3000 w). Storage water heaters havethe disadvantage that the water they store, as well as their heating elements when active, heat thebathroom and effectively the rest of the house.
5.57 Ir, anticipating that Indonesians will turn to heated water (as have Brazilians livingin similar climates), therefore, the government could sponsor development of low-cost systems thatrely on solar energy for most heat, use outdoor storage, but provide electric boosts when conditionsdo not permit full use of the sun. Since water heaters are much simpler than most other appliances,their development and testing in houses could take place rapidly, within two or three years. Beingrelatively simple to make, these water heaters could be produced by local companies.
5.58 The considerations above reflect knowledge that most appliances manufactured inIndonesia are controlled by powerful and technologicatly advanced companies, some of whichrecognize the need for greater Indonesian participation in design as well as assembly. A research
- 180 -
program would give these companies incentives to utilize their Indonesian partners' capabilitiesmore fully, developing greater technical know-how that any country the size of Indonesia wouldneed anyway.
Technical Interventions: Summary and Time Frame
(a) Efficiency Targets: Gentlemen's Agreements could be developed by late 1990, orroughly one year after testin& labeling, and information programs have beenlaunched. The targets should be specified to take effect one or two years afterannouncement, and be tightened four or five years after announcement.
(b) Standards: Minimum efficiency standards could be announced by 1991 to take effectin 1994 or 1995, ie., three or more years after the Gentlemen's Agreements werein place. Two years' minimum notice to manufacturers would be required beforestandards could become binding; at the same time, a second phase should also beannounced that were stiffer than those in the first phase.
(c) Alternatively, standards for 1994 or 1995 could be announced in 1992, ie., afterenough testing has been undertaken to determine the actual and optimal featuresof products on the market in Indonesia. The Gentlemen's Agreements serve as abridge from the present production and market mix of appliances to thosedetermined by the first set of standards. If the standards are exceeded by the actualproduct mix sold in 1993 or 1994, manufacturers will have a head start towards thesecond round of standards, which should follow the first round by 2 to 3 years.
(d) Development of New Indonesian Appliances. A concerted effort along these linesin Indonesia, using eNisting local appliance companies, could probably developmarketable indigenous appliances by 1995 if research began in 1989.
Incentive Programs
5.59 in the United States, many electric utilities are giving consumers Ix,nuses or rebatesif they purchase appliances from the most efficient available. This incentive focuses attention onthe importance of buying a better appliance, often at a higher initial cost, in order to pay less touse that appliance. Even with relatively high electricity prices (higher than those in Indonesia),American consumers do not always feel the incentive of financial savings from purchase of moreefficient appliances. The utility carrot offers them additional savings. These subsidies are stillpopular in the U.S.
5.60 The subsidies reviewed by Wilson et aL seem to have functioned more to heightenconsumer interest than to significantly lower investment costs of energy saving strategies that payanyway. And the subsidies do attract free riders. But the subsidies solidify the market for proventechnologies. Subsidies can be implemented rapidly, provided that the necessary market researchhas shown that: (a) the products being subsidized save energy and money; (b) these products aren'tbeing bought; (c) the widest conceivable acceptance of the program would not have undue
- 181 -
consequences for revenue and (d) the overall distribution effects of the subsidy are consideredacceptable.
5.61 We believe, however, that such an approach would not work in Indonesia. First, themarket for new appliances is laced with bargaining and other informal elements that make itdifficult to couple a formal rebate to the buying process. Second, most American consumers havegrown up with the major appliances affected by programs, and they have bought these many timesover. The program only exists to tilt the next purchase in the direction of greater efficiency. Butin Indonesia, such a rebate could seriously alter the size (and most likely the electricity consumptionproperties) of major appliances. This is because the size and features of appliances on the marketare seriously limited by what most consumers could afford. A subsidy for efficiency could easilybe converted into a subsidy for larger appliances, without having the effect of encouragingmanufacture and purchase of more efficient appliances. Finally, the cost of improving present-dayappliances is probably less than the size of the subsidy that would be required to encouragesufficient consumers to choose more efficient models than otherwise.
5.62 Nevertheless, subsidies to lower the price of the most efficient light bulbs may beappropriate for Indonesia. Efficient lighting offers significant electricity savings (van der Plas andde Graff (1988: World Bank; see also Geller, 1986). Unfortunately, the most efficient lamps aresimply too expensive in initial cost for most consumers to buy outright, although they pay back,relative to ordinary incandescent lamps, over their lifetime. Subsidies that both reduce the initialprice of these lamps and increase the demand for them (thereby lowering their unit costs) areprobably cost-effective compared with expansion of the utility system. We judge that for the mostefficient compact fluorescent lamps, a subsidy of 25% of the purchase price of the lamp could betested in selected districts. The Stockholm municipal utility has started such a program. PLN couldinitiate such a program in a variety of localities.
Indicative Benefits and Costs of the Efficiency Program
5.63 There are many important benefits of increased electricity-use efficiency. Consumerssave money: The present stock of new appliances appears so inefficient that a considerable (25-35%) savings of electricity will pay back any initial extra costs consumers have to pay in less than3-5 years. This benefit will be realized whent ver a more efficient appliance replaces a less-efficientone, or when a consumer is influenced to choose greater efficiency in the first purchase.
5.64 Additional benefits accrue indirectly to consumers through reductions in costs to theutility. PLN saves money by reducing future borrowing requirements for capacity. This appliesboth to base-load and peaking units. Presently, &3 -ity L affected significantly by lighting and TV,which peak at night. Refrigerators and water heaters, whose importance is growing, operate aroundthe clock .nd thus boost base load capacity needs. As air conditioning grows in importance inIndonesia, its contribution to a daytime peak will increase, along with its potential to disruptelectricity services. A conservation strategy would thus reduce the size and disruptive influenceof the A/C peak and reduce base load growth as well. A conservation program also amelioratesthe impact of the inevitable increase in the price of electricity that will pay for this capacity
- 182-
expansion. If capacity grows more slowly, prices rise less rapidly. If the utility is seen as an activeparticipant in such a program, both the credibility and image of the utility can be increased.
5.65 There are several kinds of costs of greater efficiency that have to be considered, butthese will be minor compared with the benefits. Actual investments in greater efficiency mightincrease the cost of major appliances (refrigerators, freezers, air conditioners, pumps) by as muchas 5%. The trade off between incandescent and compact fluorescent lamps is an exception, but theenergy use is reduced by 80% and lifetime extended 3-5 fold. The savings for a home with the fourmajor appliances, TV, and lights might cost US$100 (or Rp 170,000) in incremental first cost. Thebenefits (savings of 700 kWh @ 85 Rp/kWh - 60,000 Rp/yr), give a simple rate of return of nearly33%.
5.66 There are also public administrative costs. Ener$ave for Jamaica estimates the costof the testing and labelling program at less than US$ 2.00 per appliance sold in the first year of thatprogram (based on manufacturer testing). Similar costs could be expected for Indonesia. Othercosts that arise, including publicity costs, would have benefits beyond energy saving, since these costswould promote better consumer awareness of all aspects of owning and using appliances. That is,many of the activities recommended herein will become desirable in Indonesia for a variety ofpurposes. Clearly, a more detailed examination of costs of the programs suggested here isdesirable, but perusal of programs in other countries suggests that the administration and start-upcosts are small compared to the total benerits to both consumers, PLN, and GOI.
5.67 In the final analysis, the conservation strategies recommended amount to aninvestment strategy for Indonesia that will make more electricity available than similar investmentsin electricity supplies. This conservation investment program must be developed in parallel withefforts to expand electricity supplies. Benefits to Indonesia accrue both directly, in the form oflower appliance operating costs, and indirecty, in the form of avoided costs for expanding thesupply system more than necessary.
5.68 An indicative economic evaluation of the costs and benefits Indonesia could expectfrom an electricity-use efficiency program as described above is shown in Table 5.2. Usingconservative estimates of electricity savings and market penetration, this evaluation shows thatrobust net benefits could be expected to accrue to the national economy from such a program.
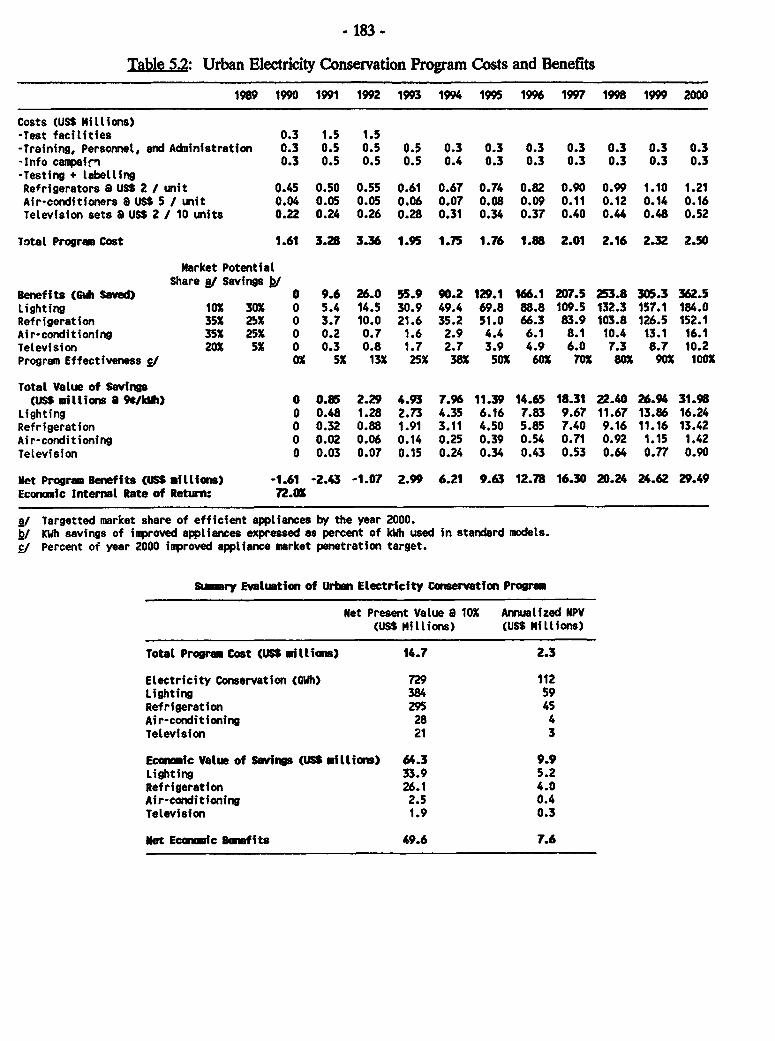
- 183-
Table 5.2: Urban Electricity Conservation Program Costs and Benefits
1989 1990 1991 1992 1993 1994 1995 1996 1997 1998 1999 2000
Costs (Uss millions)-Test facilities 0.3 1.5 1.5-Training, Personnel, and Administration 0.3 0.5 0.5 0.5 0.3 0.3 0.3 0.3 0.3 0.3 0.3-Info campairn 0.3 0.5 0.5 0.5 0.4 0.3 0.3 0.3 0.3 0.3 0.3-Testing + labellingRefrigerators a uss 2 / unit 0.45 0.50 0.55 0.61 0.67 0.74 0.82 0.90 0.99 1.10 1.21Air-conditioners a uss 5 , unit 0.04 0.05 0.05 0.06 0.07 0.08 0.09 0.11 0.12 0.14 0.16Television sets a USS 2 / 10 units 0.22 0.24 0.26 0.28 0.31 0.34 0.37 0.40 0.44 0.48 0.52
Total Program Cost 1.61 3.28 3.36 1.95 1.75 1.76 1.88 2.01 2.16 2.32 2.50
Market PotentialShare g/ Savings h/
Benefits (Gwh Saved) 0 9.6 26.0 55.9 90.2 129.1 166.1 207.5 253.8 305.3 362.5Lighting 101 301 0 5.4 14.5 30.9 49.4 69.8 88.8 109.5 132.3 157.1 184.0Refrigeration 351 25X 0 3.7 10.0 21.6 35.2 51.0 66.3 83.9 103.8 126.5 152.1Air-conditioning 351 251 0 0.2 0.7 1.6 2.9 4.4 6.1 8.1 10.4 13.1 16.1Television 201 5X 0 0.3 0.8 1.7 2.7 3.9 4.9 6.0 7.3 8.7 10.2Program Effectiveness g/ 0% 5X 131 25X 38X 501 602 70M 801 901 100X
Total Value of Savings(US mdtllions a 99/kWh) 0 0.85 2.29 4.93 7.96 11.39 14.65 18.31 22.40 26.94 31.98
Lighting 0 0.48 1.28 2.73 4.35 6.16 7.83 9.67 11.67 13.86 16.24Refrigeration 0 0.32 0.88 1.91 3.11 4.50 5.85 7.40 9.16 11.16 13.42Air-conditioning 0 0.02 0.06 0.14 0.25 0.39 0.54 0.71 0.92 1.15 1.42Television 0 0.03 0.07 0.15 0.24 0.34 0.43 0.53 0.64 0.77 0.90
Met Program Benefits (USS millions) -1.61 -2.43 -1.07 2.99 6.21 9.63 12.78 16.30 20.24 24.62 29.49Economic Internal Rate of Return: 72.01
aJ Targetted market share of efficient appliances by the year 2000.b/ Kwh savings of improved appliances expressed as percent of kWh used in standard models.S/ Percent of year 2000 improved appliance market penetration target.
Suary Evaltation of Urban Electricity Conservation Program
Met Present Value a 101 Anr alized NPV(US$ Millions) (US$ Millionis)
Total Progra Cost (USS mIllions) 14.7 2.3
Electricity Conservation (G*h) 729 112Lighting 384 59Refrigeration 295 45Air-conditioning 28 4Television 21 3
Economic Value of Savings (USS millions) 64.3 9.9Lighting 33.9 5.2Refrigeration 26.1 4.0Air-conditioning 2.5 0.4
television 1.9 0.3
et Economic Benefits 49.6 7.6
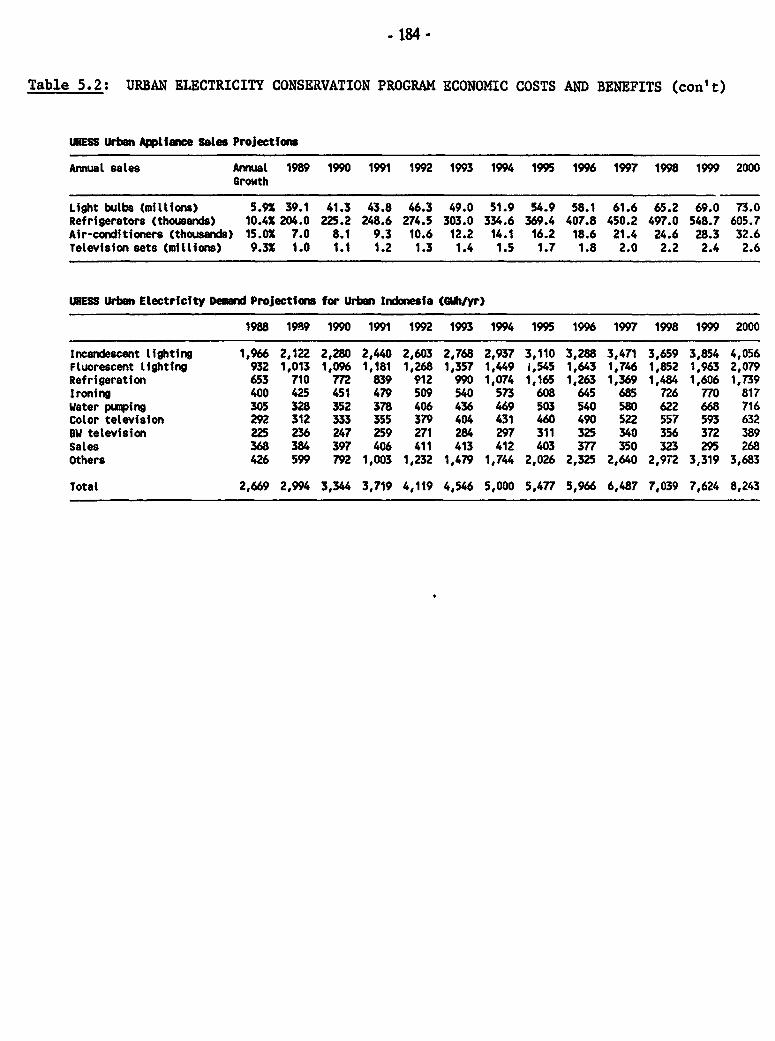
.184-
Table 5.2: URBAN ELECTRICITY CONSERVATION PROGRAM ECONOMIC COSTS AND BENEFITS (con't)
UHESS Urban Applianee Sales Projections
Annual sales Annual 1989 1990 1991 1992 1993 1994 1995 1996 1997 1998 1999 2000Growth
Light bulbs (millions) 5.9X 39.1 41.3 43.8 46.3 49.0 51.9 54.9 58.1 61.6 65.2 69.0 73.0Refrigerators (thousands) 10.4X 204.0 225.2 248.6 274.5 303.0 334.6 369.4 407.8 450.2 497.0 548.7 605.7Air-conditioners (thousands) 15.0X 7.0 8.1 9.3 10.6 12.2 14.1 16.2 18.6 21.4 24.6 28.3 32.6Television sets (millions) 9.3X 1.0 1.1 1.2 1.3 1.4 1.5 1.7 1.8 2.0 2.2 2.4 2.6
UNESS Urban Electricity Demand Projections for Urban Indonesia (GIAIyr)
1988 19R9 1990 1991 1992 1993 1994 1995 1996 1997 1998 1999 2000
Incandescent lighting 1,966 2,122 2,280 2,440 2,603 2,768 2,937 3,110 3,288 3,471 3,659 3,854 4,056Fluorescent lighting 932 1,013 1,096 1,181 1,268 1,357 1,449 1,545 1,643 1,746 1,852 1,963 2,079Refrigeration 653 710 772 839 912 990 1,074 1,165 1,263 1,369 1,484 1,606 1,739Ironing 400 425 451 479 509 540 573 608 645 685 726 770 817Water pumping 305 328 352 378 406 436 469 503 540 580 622 668 716Color television 292 312 333 355 379 404 431 460 490 522 557 593 632SW television 225 236 247 259 271 284 297 311 325 340 356 372 389Sales 368 384 397 406 411 413 412 403 377 350 323 295 268Others 426 599 792 1,003 1,232 1,479 1,744 2,026 2,325 2,640 2,972 3,319 3,683
Total 2,669 2,994 3,344 3,719 4,119 4,546 5,000 5,477 5,966 6,487 7,039 7,624 8,243
- 185 -
REFERENCES
CEPEL, 1985. Energy Conservation in Home Appliances. qInforme", No. 20 (April). Availablefrom Electrobras, Rio De Janerio, Brasil
Ener$ave Jamaica, 1989. Program Plan. Final Report of Phase One Program Development,Jamaica Energy Efficiency Standards and Labelling Project. March 17.
Geller, H., 1986. End-Use Electricity Conservation: Options for Developing Countries. EnergyDepartment Paper No. 32. Washington, D.C.: World Bank Energy Dept.
Geller, 1988. Efficiency of Residential Equipment. Prepared for the Office of TechnologyAssessment, U.S. Congress. Washington, D.C.: Am. Council for an Energy Efficiency Economy.
Geller, H., Goldemberg, J., Moriera, J. R., Hukai, R., Scarpinella, C., and Ysohizawa, M., 1988.Electricity Conservation in Brazil: Potential and Progress. Energy, Vol. 13, No. 6, pp 469-483.
Noergaard, J. and Pedersen, P. B., 1987. Low Electricity Household of the Future. Lyngby,Denmark: Energy Group, Physics Laboratory HI. See also Noergaard, J., and Gulbrandsen, T.,1987. Potentials for Electricity Savings Using Known Technology. Lyngby: Energy Group.
Rudermann, H., MacMahon, J., 1987. Behavior of the Markeplact for Residential Appliances.Energy Economics.
Schipper, L., 1976. Towards More Efficient Energy Utilization. Annual Review of Energy, VoL1. Palo Alto, Ca: Annual Reviews Incorporated.
Schipper, L., Ketoff, A., Meyers, S., and Hawk, D., 1987. Residential Electricity Consumption inIndustrialized Countries: Changes since 1973. Energy, the International Journal.
Schipper, L., and Meyers, S., 1983. Energy Us.. md Conservation in Kenya. Energy Policy (Sept.).
Schipper, L., Meyers, S., and Kelly, H., 1985. Coming in from the Cold: Energy Wise Housingfrom Sweden. Washington, D.C.: Seven Locks Press.
Sudja, N., Widodo, S., and Ibrahim, S., 1988. Indonesia's Load Profile toward the year 2000: AnApproach of Load Forecasting Methodology in a Developing Country. Preprint, available fromPLN, Jakarta.
Turiel, I., 1986. Design Options for Energy Efficiency- Improvement of Residential Appliances.LBL 22372. Berkeley: Lawrence Berkeley Laboratory. (Updated in 1989).
van der Plas, R., and de Graaff, A.B., 1988. A Comparison of Lamps for Domestic Lighting inDeveloping Countrics#.. Industry and Energy Department Working Paper, Energy Series No. 6.Washington, D.C.: World Bank.

- 186.
Wilson, D., 1989. Report from Interationa Energy Studies, Lawrence Berkeley Laboratory (inpreparation) for the U.S. Dept. of Energy. This report describes efficiency activities in Sweden,Japan, France, and the Federal Republic of Germany.