Embed Size (px)
Citation preview
ENERGY SECTOR CHALLENGES
ISSUES AND
OPTIONS
1
SCHEME OF PRESENTATION
2
• Energy scenario • Institutional Architecture • Policy Framework • Evolution of Power Sector • Adequacy – Generation Capacity, Transmission
Infrastructure • Accessibility – Programmes of Government, Village
and Household Electrification. • Affordability - Efficiency in Operation and
competition in electricity cost • Issues and Challenges

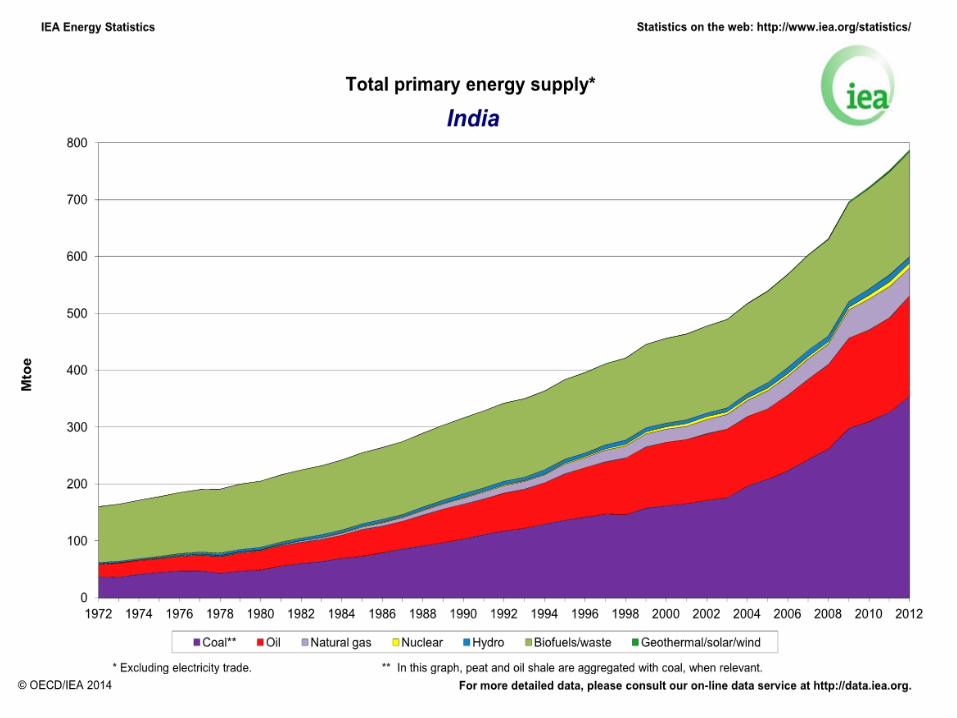

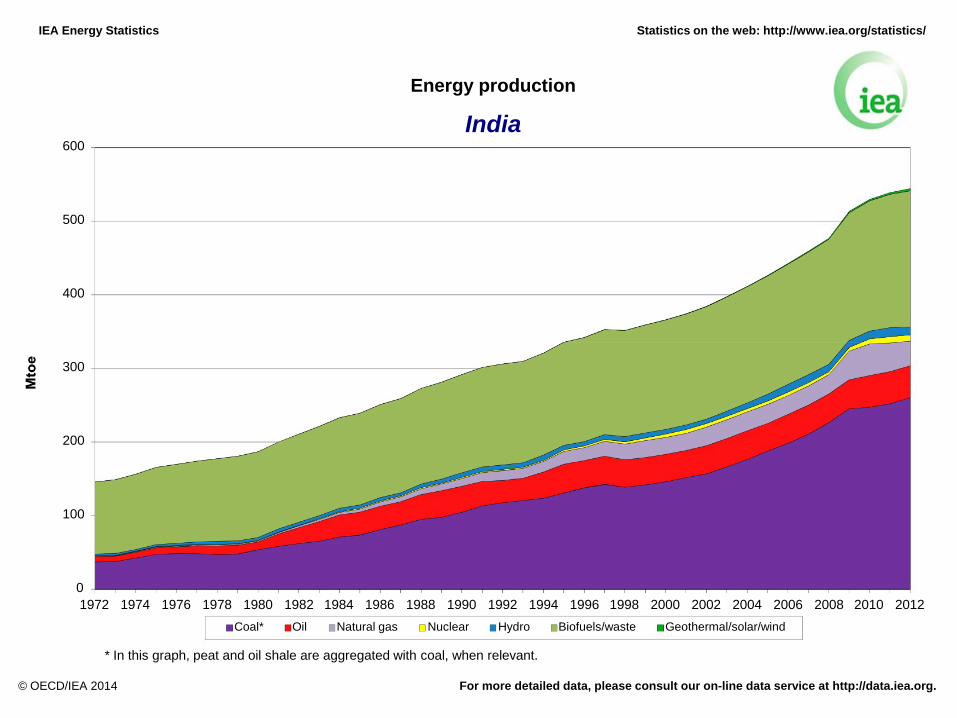
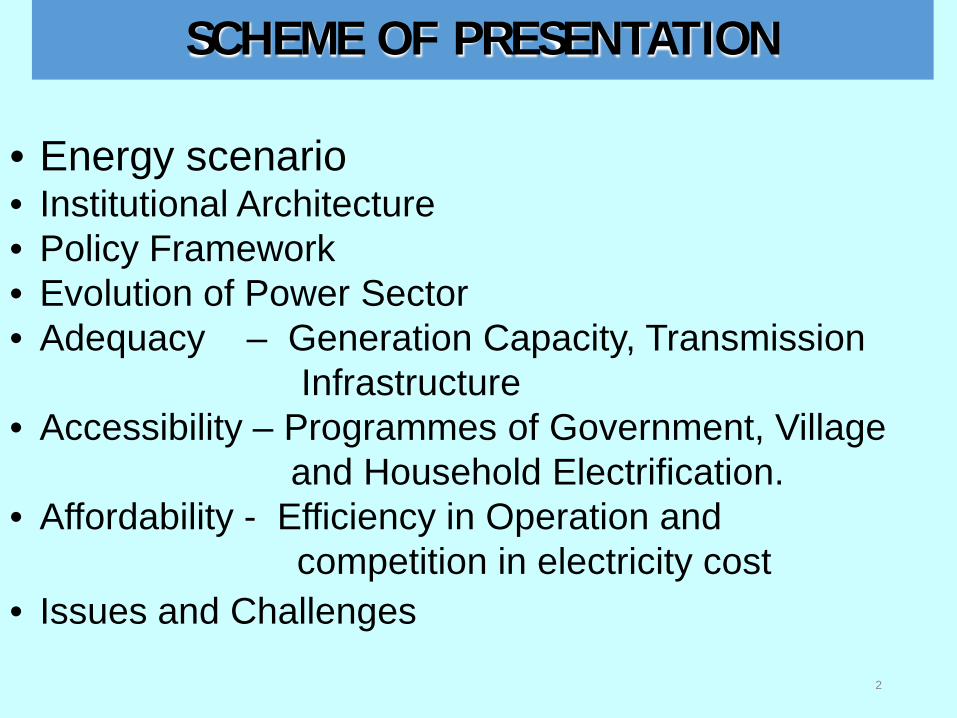
IEA Energy Statistics
Energy production
Statistics on the web: http://www.iea.org/statistics/
India 600
500
400
300
200
100
0 1972 1974 1976 1978 1980 1982 1984 1986 1988 1990 1992 1994 1996 1998 2000 2002 2004 2006 2008 2010 2012 Coal* Oil Natural gas Nuclear Hydro Biofuels/waste Geothermal/solar/wind
* In this graph, peat and oil shale are aggregated with coal, when relevant.
© OECD/IEA 2014 For more detailed data, please consult our on-line data service at http://data.iea.org.
8
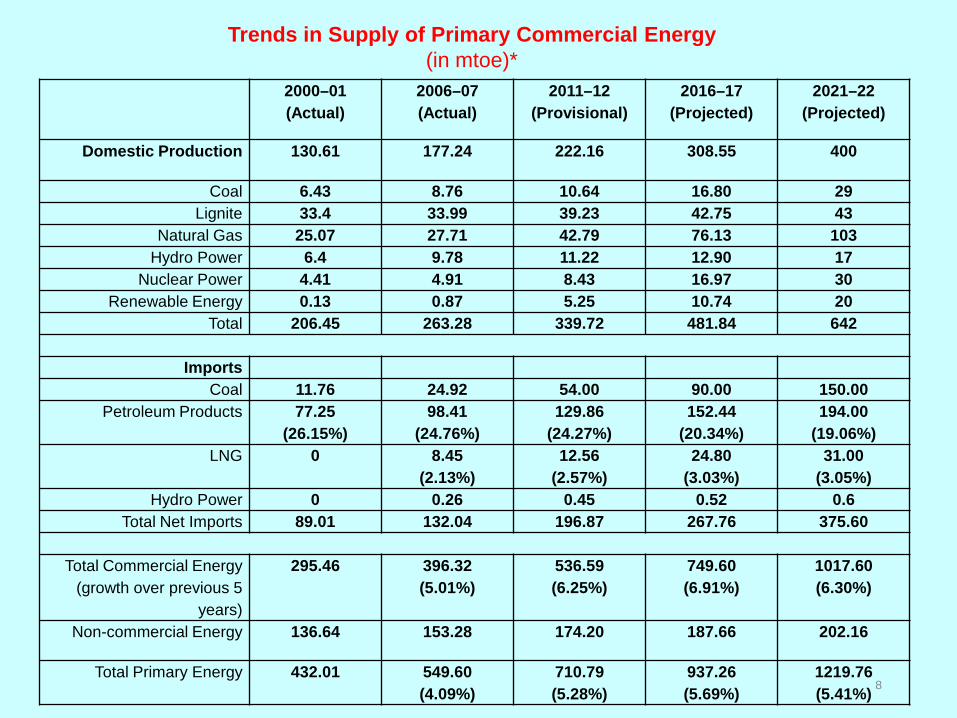
2000–01 (Actual)
2006–07 (Actual)
2011–12 (Provisional)
2016–17 (Projected)
2021–22 (Projected)
Domestic Production 130.61 177.24 222.16 308.55 400
Coal 6.43 8.76 10.64 16.80 29 Lignite 33.4 33.99 39.23 42.75 43
Natural Gas 25.07 27.71 42.79 76.13 103 Hydro Power 6.4 9.78 11.22 12.90 17
Nuclear Power 4.41 4.91 8.43 16.97 30 Renewable Energy 0.13 0.87 5.25 10.74 20
Total 206.45 263.28 339.72 481.84 642
Imports Coal 11.76 24.92 54.00 90.00 150.00
Petroleum Products 77.25 (26.15%)
98.41 (24.76%)
129.86 (24.27%)
152.44 (20.34%)
194.00 (19.06%)
LNG 0 8.45 (2.13%)
12.56 (2.57%)
24.80 (3.03%)
31.00 (3.05%)
Hydro Power 0 0.26 0.45 0.52 0.6 Total Net Imports 89.01 132.04 196.87 267.76 375.60
Total Commercial Energy (growth over previous 5
years)
295.46 396.32 (5.01%)
536.59 (6.25%)
749.60 (6.91%)
1017.60 (6.30%)
Non-commercial Energy 136.64 153.28 174.20 187.66 202.16
Total Primary Energy 432.01 549.60 (4.09%)
710.79 (5.28%)
937.26 (5.69%)
1219.76 (5.41%)
Trends in Supply of Primary Commercial Energy (in mtoe)*

Institutional Architecture
9
Government of India
Niti Aayog Empowered
Group of Ministers
Ministry of Power Ministry of
Petroleum & Natural Gas
Ministry of New & Renewable Energy Ministry of Coal Department of
Atomic Energy
•6PSUs •Central Electricity Authority •Bureau of Energy Efficiency
•15 PSUs •Directorate General of Hydrocarbon •Petroleum Planning and Analysis cell •Petroleum Conservation Research Association
•Indian Renewable Energy Development Agency •Several research institutes
•3 PSUs •5 PSUs •Several research institutes

10
11
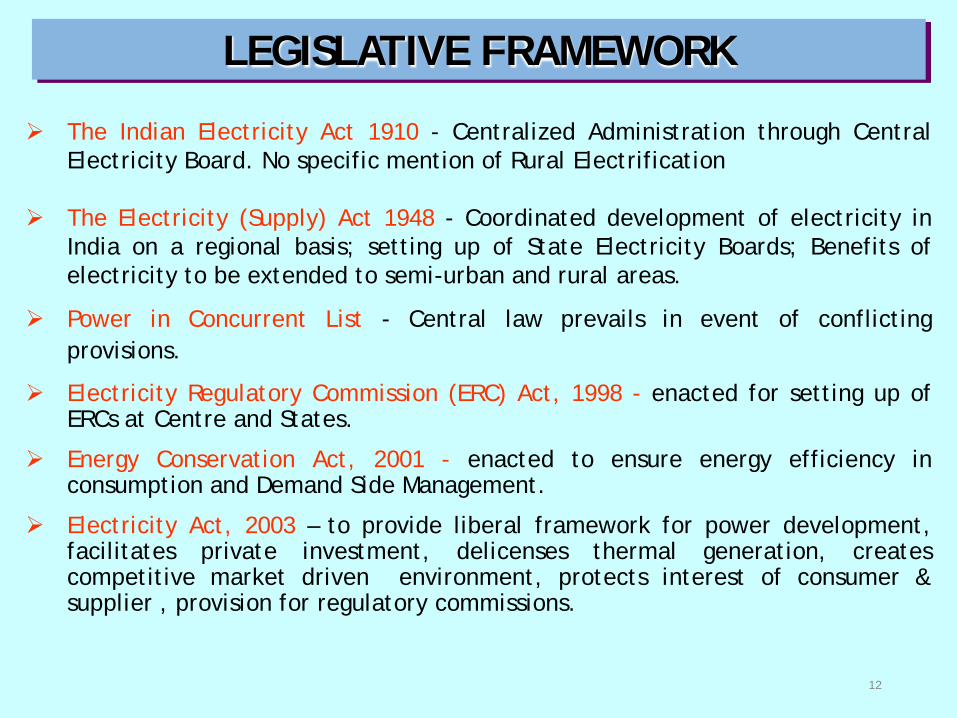
The Indian Electricity Act 1910 - Centralized Administration through Central Electricity Board. No specific mention of Rural Electrification
The Electricity (Supply) Act 1948 - Coordinated development of electricity in India on a regional basis; setting up of State Electricity Boards; Benefits of electricity to be extended to semi-urban and rural areas.
Power in Concurrent List - Central law prevails in event of conflicting provisions.
Electricity Regulatory Commission (ERC) Act, 1998 - enacted for setting up of ERCs at Centre and States.
Energy Conservation Act, 2001 - enacted to ensure energy efficiency in consumption and Demand Side Management.
Electricity Act, 2003 – to provide liberal framework for power development, facilitates private investment, delicenses thermal generation, creates competitive market driven environment, protects interest of consumer & supplier , provision for regulatory commissions.
LEGISLATIVE FRAMEWORK
12
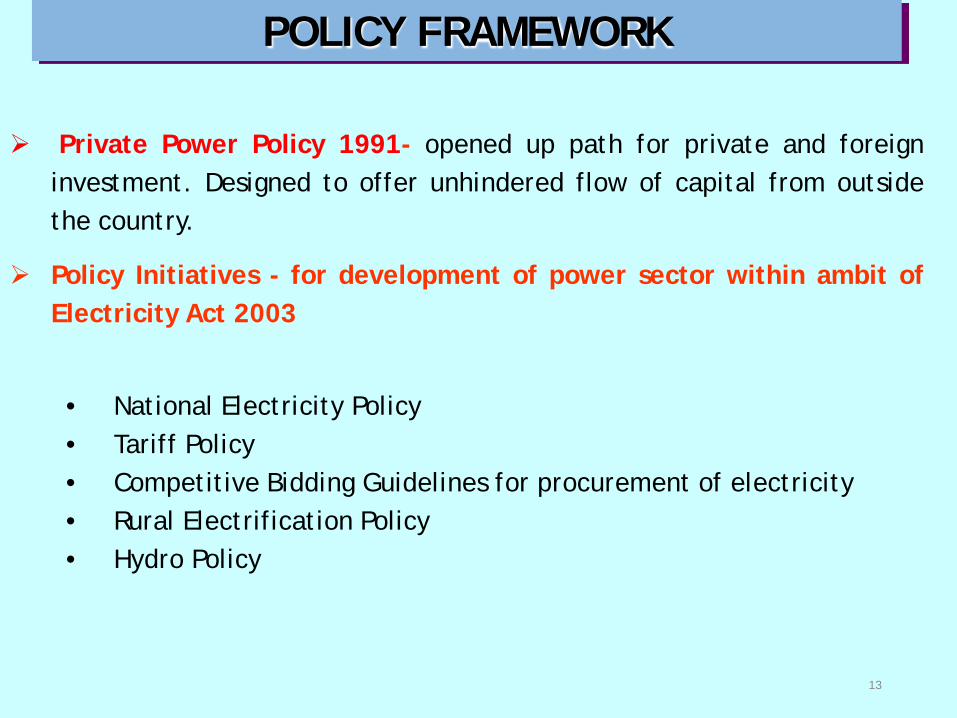
Private Power Policy 1991- opened up path for private and foreign investment. Designed to offer unhindered flow of capital from outside the country.
Policy Initiatives - for development of power sector within ambit of Electricity Act 2003
• National Electricity Policy • Tariff Policy • Competitive Bidding Guidelines for procurement of electricity • Rural Electrification Policy • Hydro Policy
POLICY FRAMEWORK
13
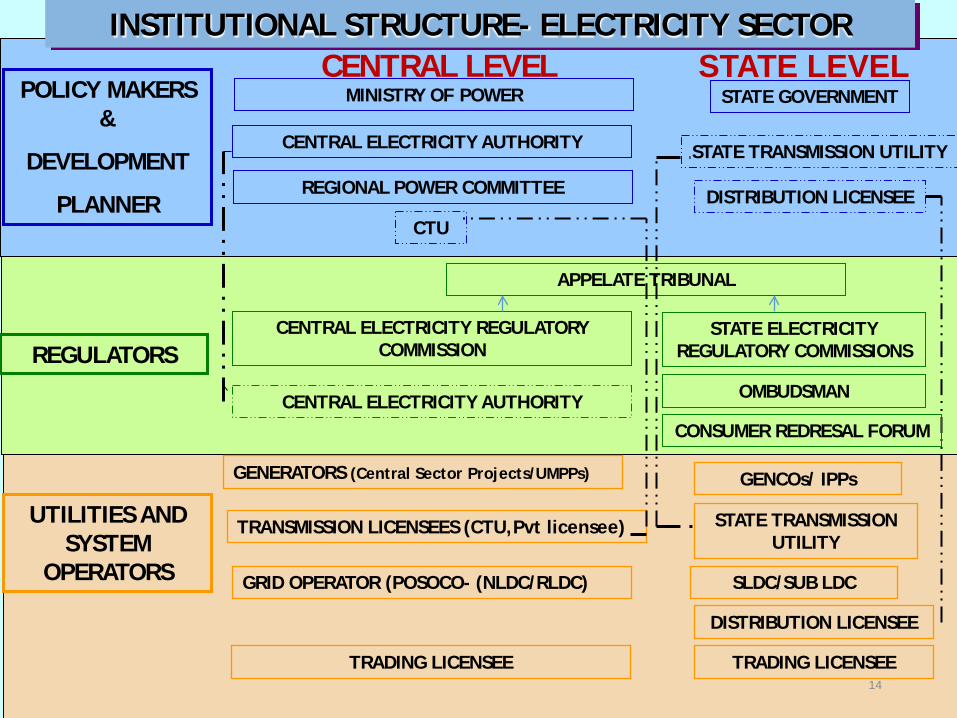
POLICY MAKERS &
DEVELOPMENT
PLANNER
MINISTRY OF POWER
CENTRAL ELECTRICITY AUTHORITY
REGIONAL POWER COMMITTEE
APPELATE TRIBUNAL
CENTRAL ELECTRICITY REGULATORY COMMISSION
CENTRAL ELECTRICITY AUTHORITY
GENERATORS (Central Sector Projects/UMPPs)
TRANSMISSION LICENSEES (CTU,Pvt licensee)
TRADING LICENSEE
GRID OPERATOR (POSOCO- (NLDC/RLDC)
STATE GOVERNMENT
CTU
STATE TRANSMISSION UTILITY
DISTRIBUTION LICENSEE
STATE ELECTRICITY REGULATORY COMMISSIONS
OMBUDSMAN
GENCOs/ IPPs
STATE TRANSMISSION UTILITY
SLDC/SUB LDC
DISTRIBUTION LICENSEE
REGULATORS
UTILITIES AND SYSTEM
OPERATORS
INSTITUTIONAL STRUCTURE- ELECTRICITY SECTOR CENTRAL LEVEL STATE LEVEL
TRADING LICENSEE
CONSUMER REDRESAL FORUM
14

UNIT YEAR 1947 PRESENT
INSTALLED POWER CAPACITY MW 1362 2,74,818 (June, 2015)
TRANSMISSION LINE LENGTH Ckt Km 58 3,16,282 (June, 2015)
GROSS INPUT ENERGY BU 4 967 (2013-14)
PER CAPITA CONSUMPTION kWh 16 957 (2013-14)
VILLAGE ELECTRIFICATION Nos 3,061 (1950)
5,77,758 (May, 2015)
PUMPSET ENERGISATION Nos 2,84,064 (1998)
200,001,120 (May,2015)
PLANT LOAD FACTOR % 52 (1985-86)
65.55 (2013-14)
T&D LOSSES % 34 (2001-02)
23.04 (2012-13)
AT&C LOSSES % 34 (2004-05)
25.38 (2012-13)
EVOLUTION
15
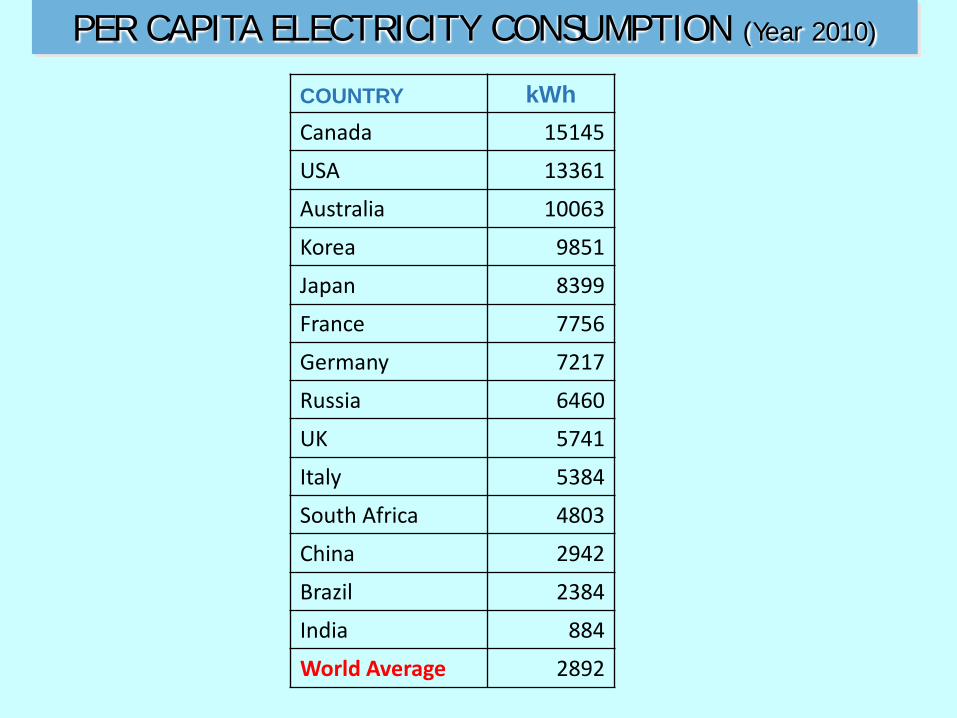
PER CAPITA ELECTRICITY CONSUMPTION (Year 2010)
COUNTRY kWh Canada 15145 USA 13361 Australia 10063 Korea 9851 Japan 8399 France 7756 Germany 7217 Russia 6460 UK 5741 Italy 5384 South Africa 4803 China 2942 Brazil 2384 India 884 World Average 2892

Adequacy – Sufficiency, Reliability and Quality power to all consumers
Accessibility – Every citizen to have access to electricity Affordability – Competitive pricing of power
POWER SECTOR OBJECTIVES – 3 ‘A’s
17

ADEQUACY- INSTALLED CAPACITY (FIGURES IN MW)
INSTALLED CAPACITY AS ON 30.06.2015
SECTOR HYDRO THERMAL NUCLEAR R.E.S TOTAL
COAL GAS DIESEL TOTAL (MNRE)
STATE 27482 59200 6974 439 66613 0.00 1919 96015
PRIVATE 3024 59627 8568 555 68750 0.00 33858 105632
CENTRAL 11491 48380 7520 0.00 55900 5780 0.00 73173
TOTAL 41997 167208 23062 994 191264 5780 35777 274818
% 15.3 60.8 8.4 0.4 69.6 2.1 13.0 100
Commensurate with generation capacity addition, matching capacity addition in transmission and distribution ( Investment in ratio 2:1:1) - to focus on both the urban and the rural consumers
Transmission infrastructure to be flexible enough to take care of Open Electricity
market and merchant generation.

Sl.No.
Input Source Capacity (%) Generation (%)
2012 2017 2030 2012 2017 2030
1 Coal 56 57 42 70 69 58
2 Oil 1 1 0 0 0 0
3 Gas 9 6 3 7 5 3
4 Hydro 20 15 13 14 12 11
5 Renewables 12 17 33 6 9 16
6 Nuclear 2 4 9 3 5 12
7 Total Clean Energy Generation (4+5+6) 23 26 39
Changing Structure of Fuel for Electricity
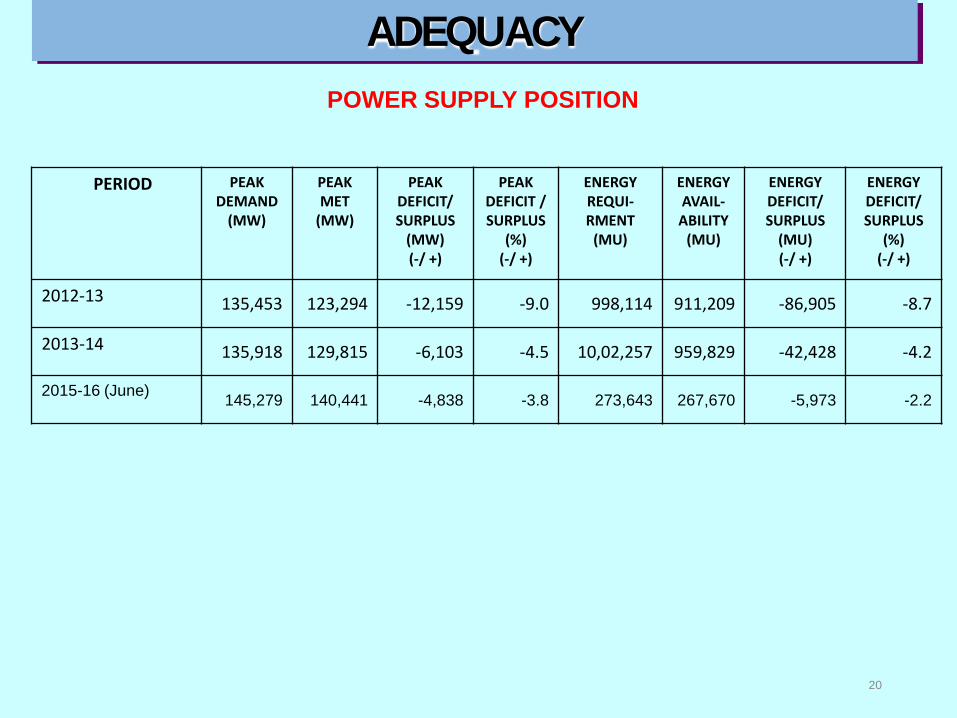
ADEQUACY
20
POWER SUPPLY POSITION
PERIOD PEAK DEMAND
(MW)
PEAK MET
(MW)
PEAK DEFICIT/ SURPLUS
(MW) (-/ +)
PEAK DEFICIT / SURPLUS
(%) (-/ +)
ENERGY REQUI- RMENT
(MU)
ENERGY AVAIL- ABILITY
(MU)
ENERGY DEFICIT/ SURPLUS
(MU) (-/ +)
ENERGY DEFICIT/ SURPLUS
(%) (-/ +)
2012-13 135,453 123,294 -12,159 -9.0 998,114 911,209 -86,905 -8.7
2013-14 135,918 129,815 -6,103 -4.5 10,02,257 959,829 -42,428 -4.2
2015-16 (June) 145,279 140,441 -4,838 -3.8 273,643 267,670 -5,973 -2.2

1947-1992(45Years) 79,455 ckt kms
1992-2015 (23 Years) 3,16,282 ckt km ( upto May,2015)
8th PLAN(92-97) 37,921
9th PLAN(97-02) 34,893
10th PLAN(02-07) 35,286
11th PLAN(07-12) 69,926
12th PLAN (Up to May 2015) PLAN TARGET - 1,07,440
58,801
ADEQUACY - TRANSMISSION LINES/SUBSTATION CAPACITY ADDITION
( 220kV and above)
1947-1992(45Years) 75,322 MVA
1992-2015 (23 Years) 5,19,413 MVA( upto May,2015)
8th PLAN(92-97) 49,720
9th PLAN(97-02) 56,901
10th PLAN(02-07) 75,496
11th PLAN(07-12) 1,52,112
12th PLAN (Up to May 2015) PLAN TARGET - 2,70,000
1,85,194
Tran
smis
sion
line
s Su
b-St
atio
n C
apac
ity
21
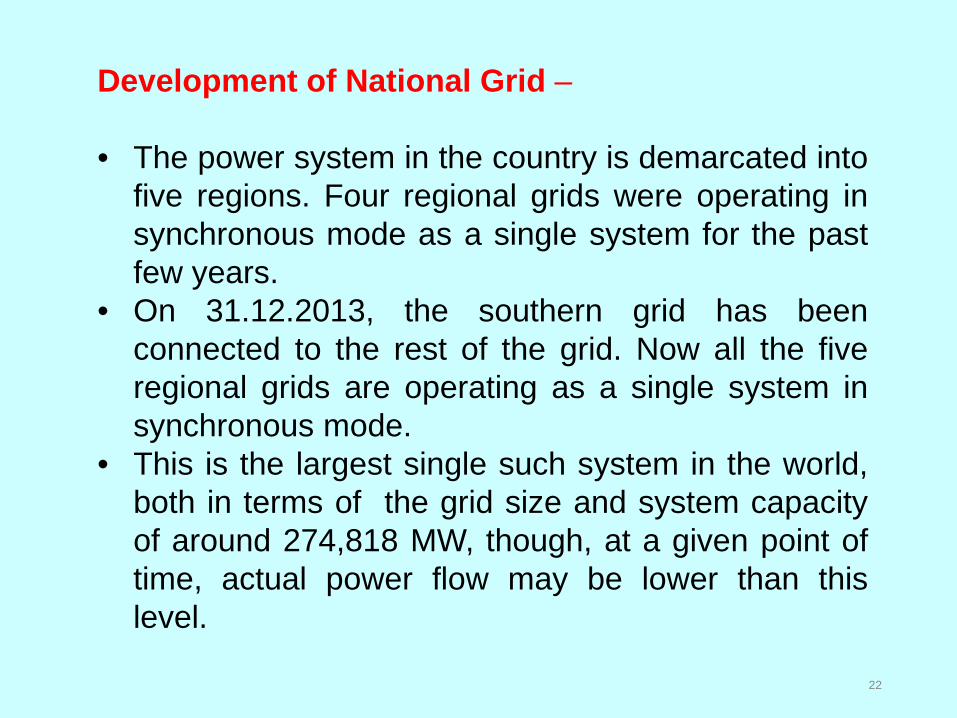
22
Development of National Grid – • The power system in the country is demarcated into
five regions. Four regional grids were operating in synchronous mode as a single system for the past few years.
• On 31.12.2013, the southern grid has been connected to the rest of the grid. Now all the five regional grids are operating as a single system in synchronous mode.
• This is the largest single such system in the world, both in terms of the grid size and system capacity of around 274,818 MW, though, at a given point of time, actual power flow may be lower than this level.
6220MW
14420MW
3620MW
7920MW
1260MW
2860MW
Northern
Region
Western
Region
Southern
Region
Eastern
Region
North-Eastern
Region
TRANSMISSION CAPACITY OF INTER-REGIONAL LINK
March 2014
End of 12th Plan Year 2017
Total 35450 MW
Total 65550MW
23
Additional 600 MW Inter-Regional Capacity at 132 kV level
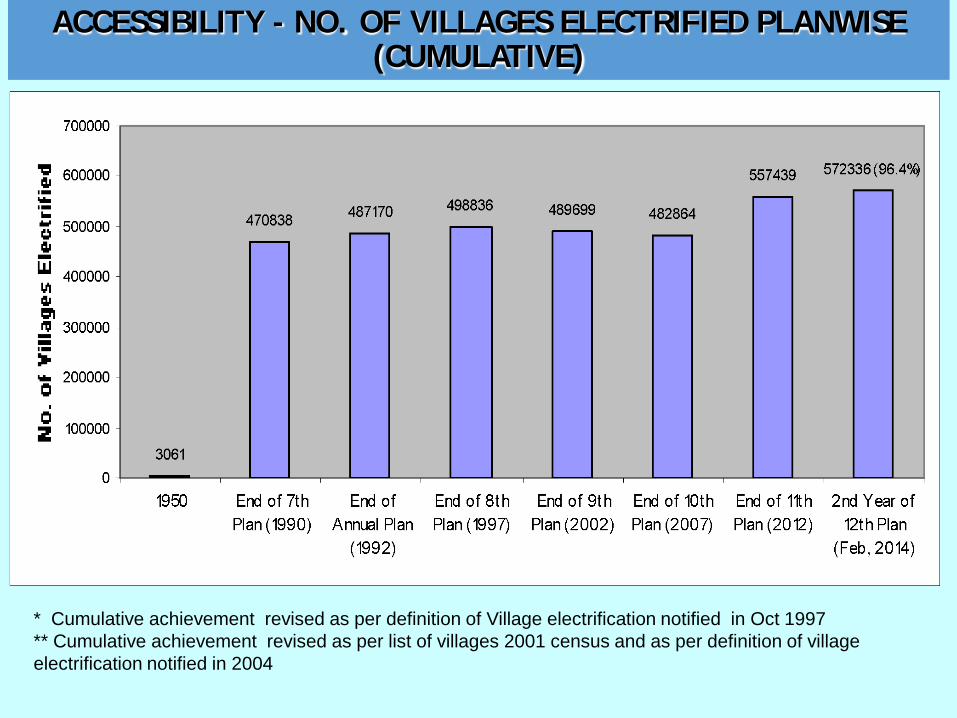
ACCESSIBILITY - NO. OF VILLAGES ELECTRIFIED PLANWISE (CUMULATIVE)
* Cumulative achievement revised as per definition of Village electrification notified in Oct 1997 ** Cumulative achievement revised as per list of villages 2001 census and as per definition of village electrification notified in 2004

ACCESSIBILITY - DEFINITION OF VILLAGE ELECTRIFICATION
Prior to October 1997 Village was classified as electrified if electricity was being used within its
revenue area for any purpose whatsoever. In 1997, definition modified to provide for the use of electricity to village
habitations. A village will be deemed to be electrified if the electricity is used in the
inhabited locality within the revenue boundary of the village, for any purpose whatsoever.
February 2004 – Scope Enlarged A village would be declared electrified if:
• Basic infrastructure such as distribution transformer and distribution lines are provided in the inhabited locality as well as the dalit basti/hamlet where is exists. (For electrification through non-conventional sources a distribution transformer may not be necessary)
• Electricity is provided to public places like schools, panchayat offices, health centres, dispensaries, community centres etc, and
• Number of households electrified should be at least 10% of the total number of households in the village.
25
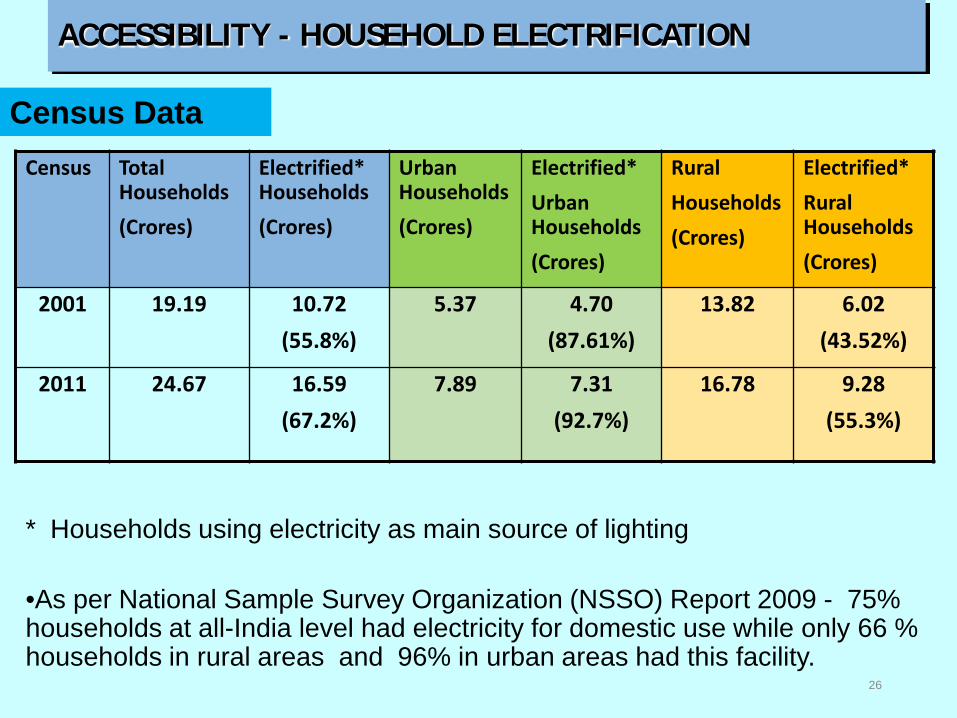
ACCESSIBILITY - HOUSEHOLD ELECTRIFICATION
Census Total Households (Crores)
Electrified* Households (Crores)
Urban Households (Crores)
Electrified* Urban Households (Crores)
Rural Households (Crores)
Electrified* Rural Households (Crores)
2001 19.19 10.72 (55.8%)
5.37 4.70 (87.61%)
13.82 6.02 (43.52%)
2011 24.67 16.59 (67.2%)
7.89 7.31 (92.7%)
16.78 9.28 (55.3%)
* Households using electricity as main source of lighting
•As per National Sample Survey Organization (NSSO) Report 2009 - 75% households at all-India level had electricity for domestic use while only 66 % households in rural areas and 96% in urban areas had this facility.
26
Census Data
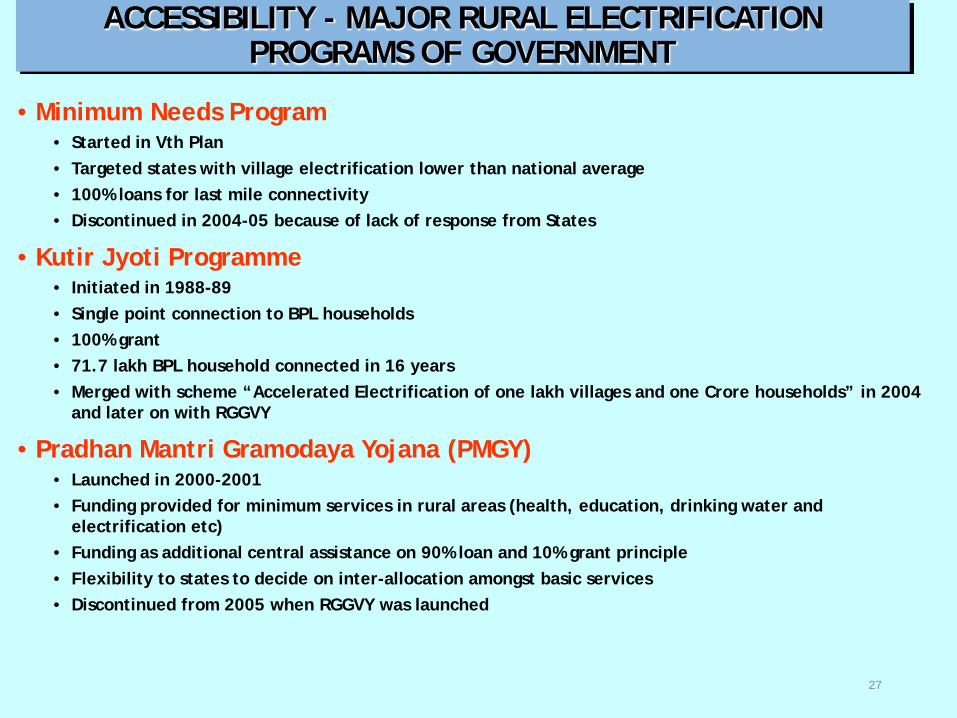
ACCESSIBILITY - MAJOR RURAL ELECTRIFICATION PROGRAMS OF GOVERNMENT
• Minimum Needs Program • Started in Vth Plan • Targeted states with village electrification lower than national average • 100% loans for last mile connectivity • Discontinued in 2004-05 because of lack of response from States
• Kutir Jyoti Programme • Initiated in 1988-89 • Single point connection to BPL households • 100% grant • 71.7 lakh BPL household connected in 16 years • Merged with scheme “Accelerated Electrification of one lakh villages and one Crore households” in 2004
and later on with RGGVY
• Pradhan Mantri Gramodaya Yojana (PMGY) • Launched in 2000-2001 • Funding provided for minimum services in rural areas (health, education, drinking water and
electrification etc) • Funding as additional central assistance on 90% loan and 10% grant principle • Flexibility to states to decide on inter-allocation amongst basic services • Discontinued from 2005 when RGGVY was launched
27

ACCESSIBILITY - MAJOR RURAL ELECTRIFICATION PROGRAMS OF GOVERNMENT
• Accelerated Rural Electrification Program (AREP) • Launched in 2002 • Interest subsidy of 4% • Applicable on loans given through PFC/REC and NABARD for RE works • Merged with scheme “Accelerated Electrification of one lakh villages and one Crore
households” in 2004
• Accelerated Electrification of one lakh villages and one Crore households • Launched in 2004
• 40% capital subsidy and 60% loan
• AREP and Kutir Jyoti schemes merged with the program
• Merged with RGGVY in 2005
• Rajiv Gandhi Grameen Vidyutikaran Yojana (RGGVY) launched in April 2005 10th Plan continued till March, 2015(90:10)
28
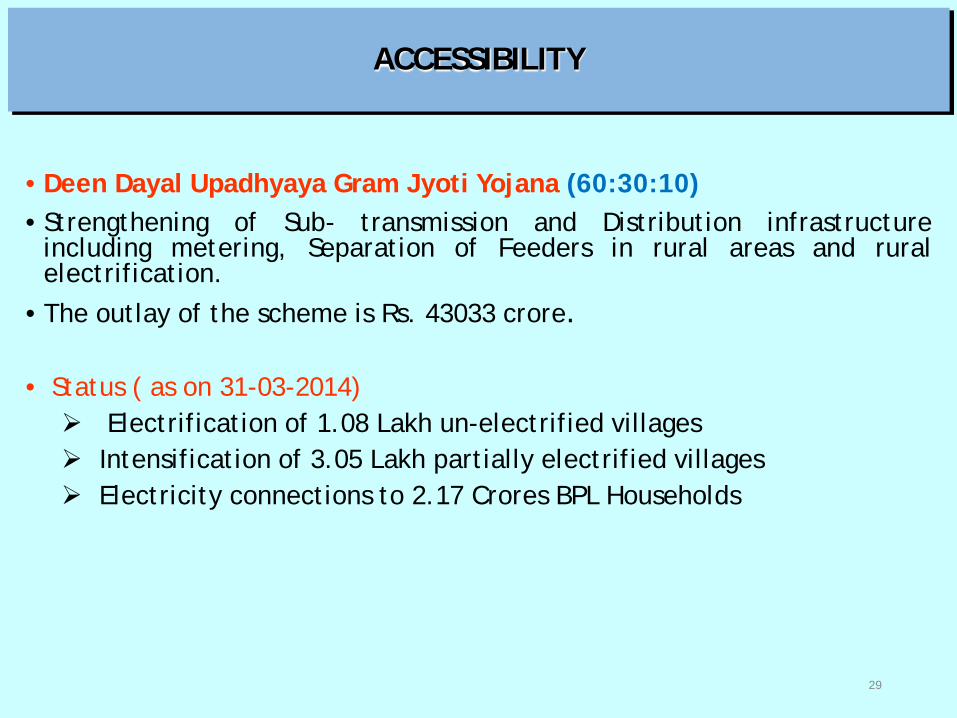
ACCESSIBILITY
• Deen Dayal Upadhyaya Gram Jyoti Yojana (60:30:10) • Strengthening of Sub- transmission and Distribution infrastructure
including metering, Separation of Feeders in rural areas and rural electrification.
• The outlay of the scheme is Rs. 43033 crore. • Status ( as on 31-03-2014) Electrification of 1.08 Lakh un-electrified villages Intensification of 3.05 Lakh partially electrified villages Electricity connections to 2.17 Crores BPL Households
29

AFFORDABILITY
30
• Improvement in Efficiency in Generation • Introduction of open access in transmission and
distribution to promote competition • Procurement of Power through competitive bidding • Modernisation of transmission & distribution
infrastructure for reduction of aggregate technical and commercial (AT&C) losses
• To promote power exchange and trading of electricity • Rationalisation of Tariff • Upfront payment of revenue subsidy by the State Govt.
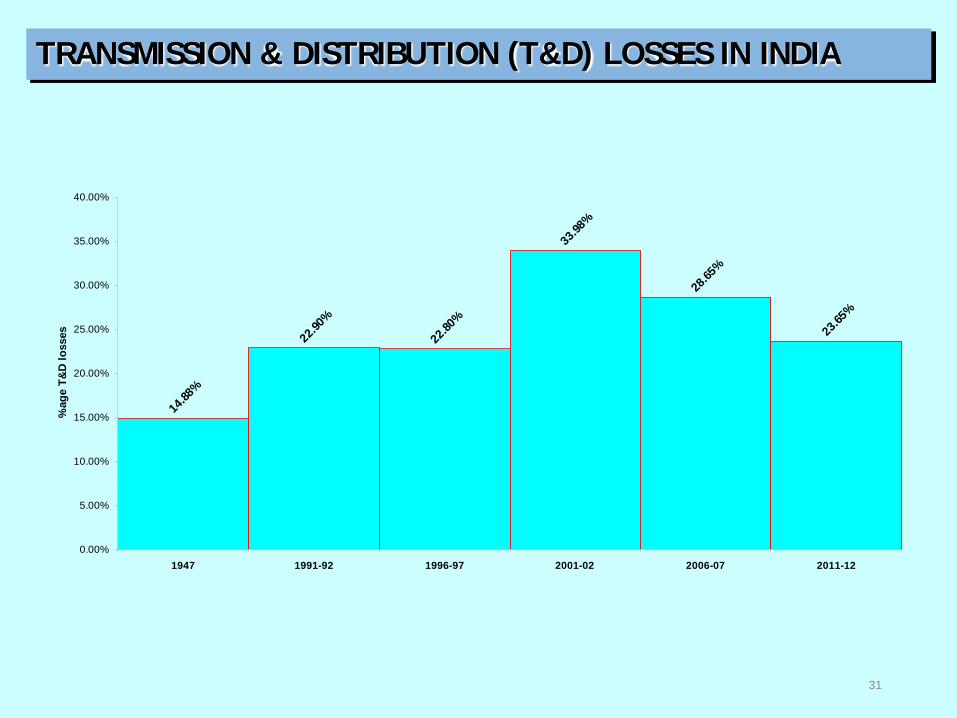
TRANSMISSION & DISTRIBUTION (T&D) LOSSES IN INDIA
14.88
%
22.90
%
22.80
%
33.98
%
28.65
%
23.65
%
0.00%
5.00%
10.00%
15.00%
20.00%
25.00%
30.00%
35.00%
40.00%
1947 1991-92 1996-97 2001-02 2006-07 2011-12
%ag
e T&
D lo
sses
31
32
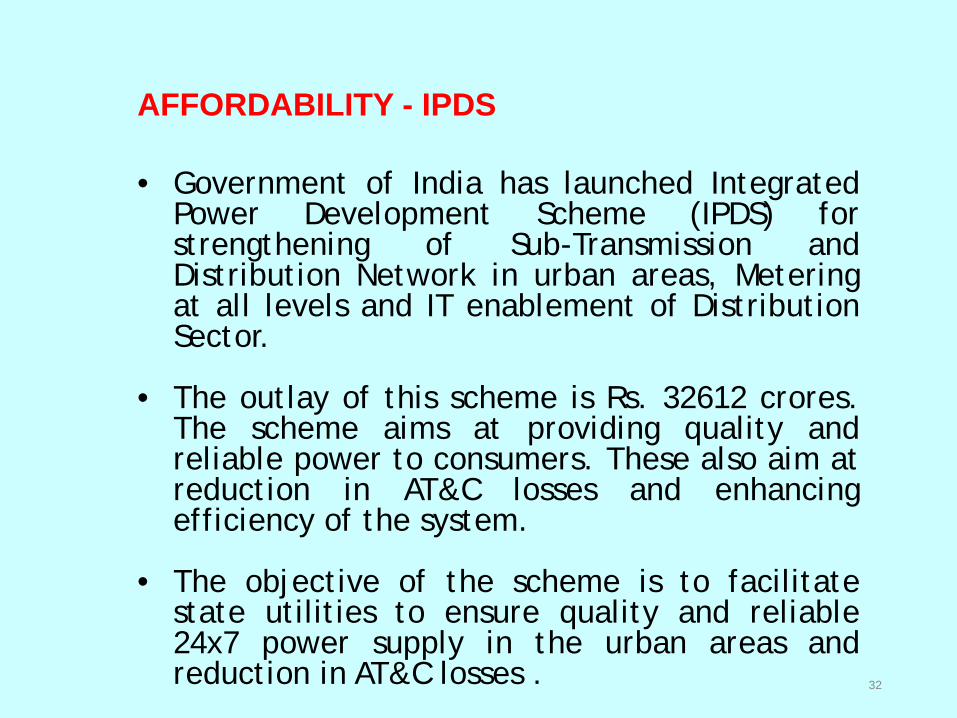
AFFORDABILITY - IPDS
• Government of India has launched Integrated Power Development Scheme (IPDS) for strengthening of Sub-Transmission and Distribution Network in urban areas, Metering at all levels and IT enablement of Distribution Sector.
• The outlay of this scheme is Rs. 32612 crores.
The scheme aims at providing quality and reliable power to consumers. These also aim at reduction in AT&C losses and enhancing efficiency of the system.
• The objective of the scheme is to facilitate
state utilities to ensure quality and reliable 24x7 power supply in the urban areas and reduction in AT&C losses .
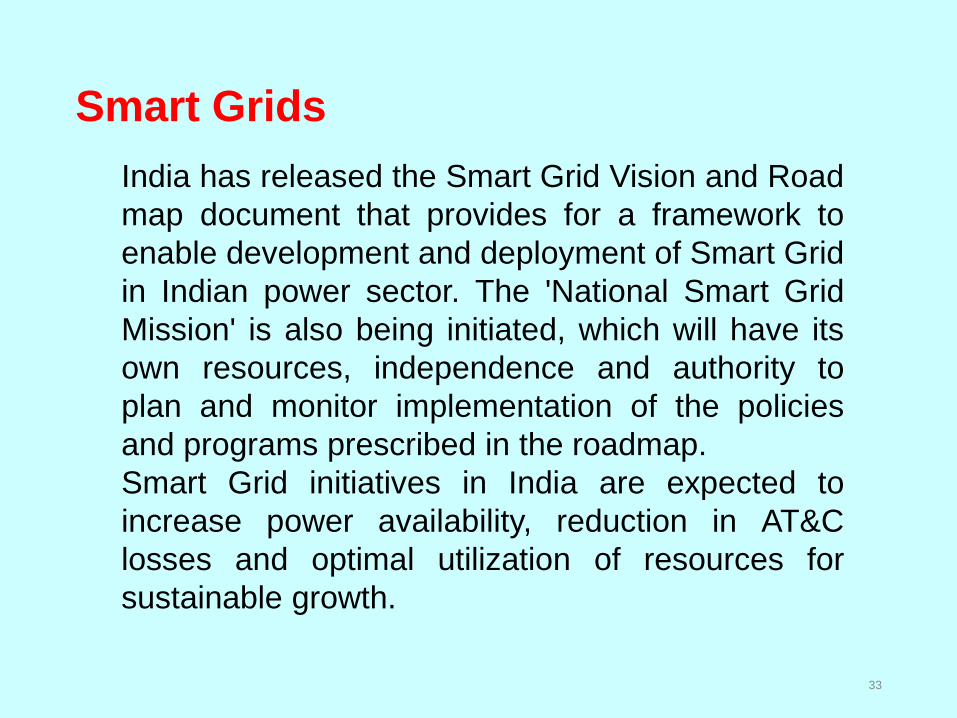
Smart Grids
33
India has released the Smart Grid Vision and Road map document that provides for a framework to enable development and deployment of Smart Grid in Indian power sector. The 'National Smart Grid Mission' is also being initiated, which will have its own resources, independence and authority to plan and monitor implementation of the policies and programs prescribed in the roadmap. Smart Grid initiatives in India are expected to increase power availability, reduction in AT&C losses and optimal utilization of resources for sustainable growth.
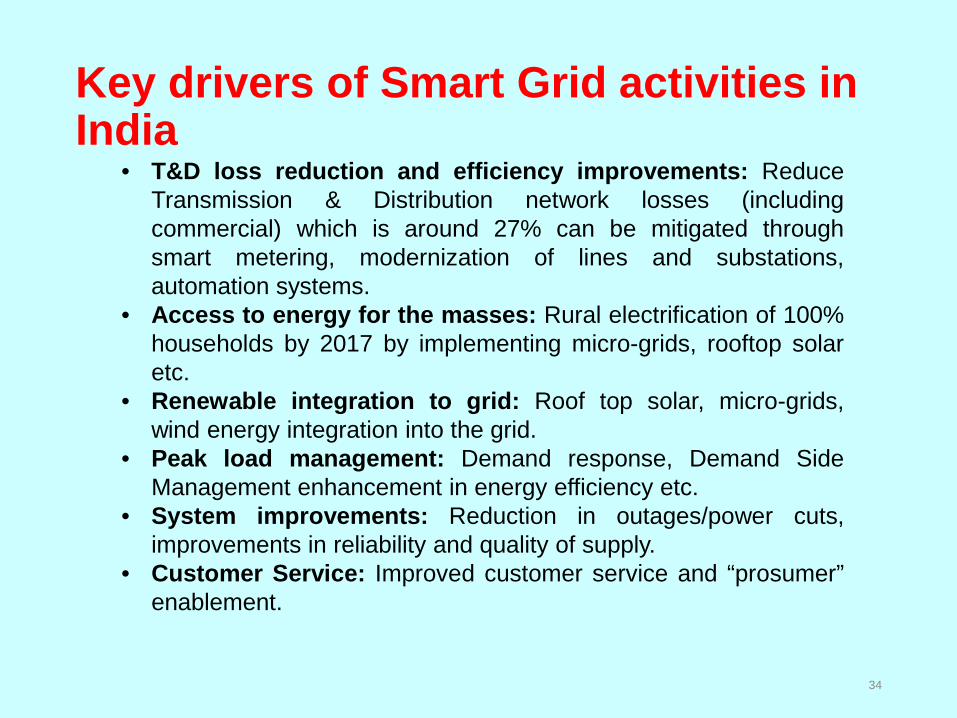
Key drivers of Smart Grid activities in India
34
• T&D loss reduction and efficiency improvements: Reduce Transmission & Distribution network losses (including commercial) which is around 27% can be mitigated through smart metering, modernization of lines and substations, automation systems.
• Access to energy for the masses: Rural electrification of 100% households by 2017 by implementing micro-grids, rooftop solar etc.
• Renewable integration to grid: Roof top solar, micro-grids, wind energy integration into the grid.
• Peak load management: Demand response, Demand Side Management enhancement in energy efficiency etc.
• System improvements: Reduction in outages/power cuts, improvements in reliability and quality of supply.
• Customer Service: Improved customer service and “prosumer” enablement.

• Fuel adequacy for power generation
• Distribution – Improving financial viability of DISCOMs
• Increase renewable power and its integration in electricity
grid
• Reliable operation of expansive grid
• Minimizing carbon footprint of power sector development
35
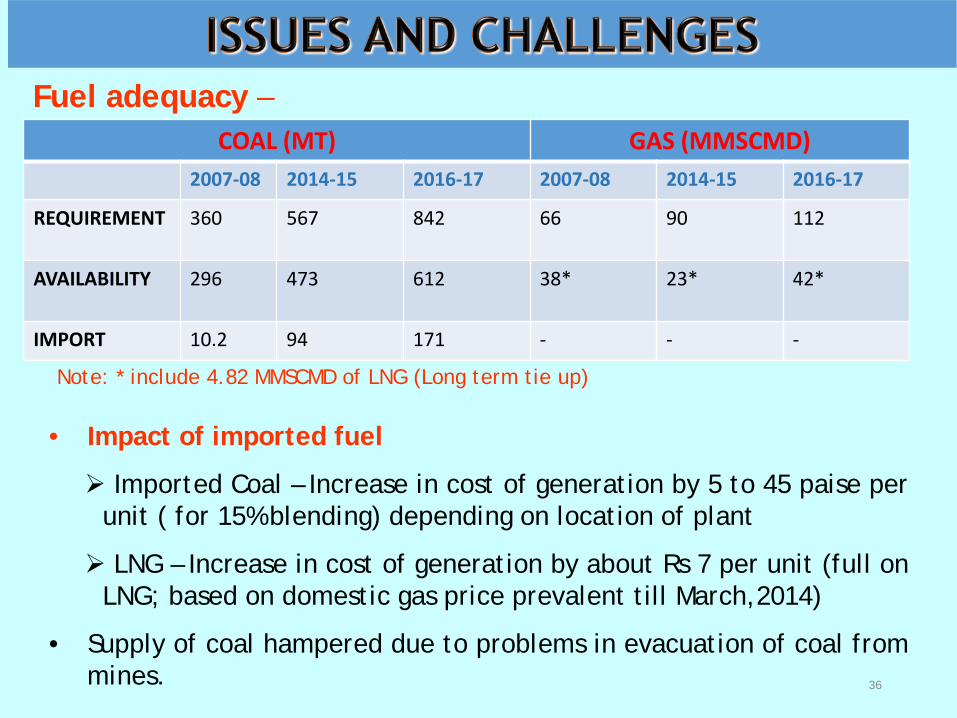
Fuel adequacy –
36
COAL (MT) GAS (MMSCMD) 2007-08 2014-15 2016-17 2007-08 2014-15 2016-17
REQUIREMENT 360 567 842 66
90 112
AVAILABILITY 296 473 612 38*
23* 42*
IMPORT 10.2 94 171 - - -
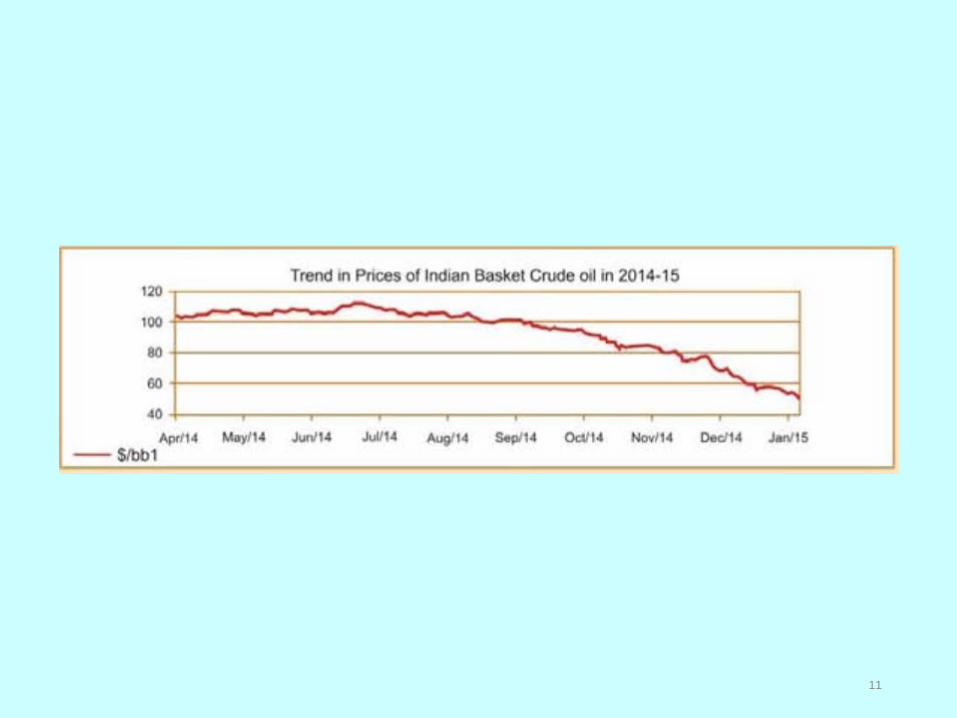
• Impact of imported fuel
Imported Coal – Increase in cost of generation by 5 to 45 paise per unit ( for 15% blending) depending on location of plant
LNG – Increase in cost of generation by about Rs 7 per unit (full on LNG; based on domestic gas price prevalent till March,2014)
• Supply of coal hampered due to problems in evacuation of coal from mines.
Note: * include 4.82 MMSCMD of LNG (Long term tie up)

37
Fuel adequacy (Coal)–
Removing Uncertainties Related to Fuel Supply and Pricing: • The projects commissioned between 2009-10 to 2011-12 (11th Plan)- 24,000 MW
were without FSA. Since non signing of FSA and shortage of coal had created uncertainly on the fuel availability and cost implication of imported coal.
• After the cancellation of 204 Coal Block by the Hon'ble Supreme Court vide its judgment dated 25.08.2014 and order dated 24.09.2014, Government of India has promulgated an Ordinance (now replaced by an Act) stipulating inter-alia the methodology for re-allocation of the canceled Coal Blocks through auction/allotment. So far 46 coal blocks have been allocated through auction/allotment to the power sector. It is expected that coal based thermal power plants having no linkage will be able to secure fuel linkage after the auction / allotment of all the 204 coal blocks is complete.

38
Fuel adequacy ( Gas)–
• Gas based power generation capacity in India constitutes around 9 % of the total installed generation capacity. Out of a total capacity of 24,150 MW gas based power plants in the country, 14305 MW is stranded. At present, Gas based installed capacity in the country is operating at very low average PLF as the production of KG D6 gas has nose-dived.
• Government of India has sanctioned a scheme for importing spot RLNG in 2015-16 and 2016-17 for the stranded gas based power plants as well as for plants receiving domestic gas upto the target PLF selected through a reverse e-bidding process. The scheme provides for financial support from PSDF (Power System Development Fund). The outlay for the support from PSDF has been fixed at Rs. 7500 crores (Rs. 3500 crores and Rs. 4,000 crores for the year 2015-16 and 2016-17 respectively).
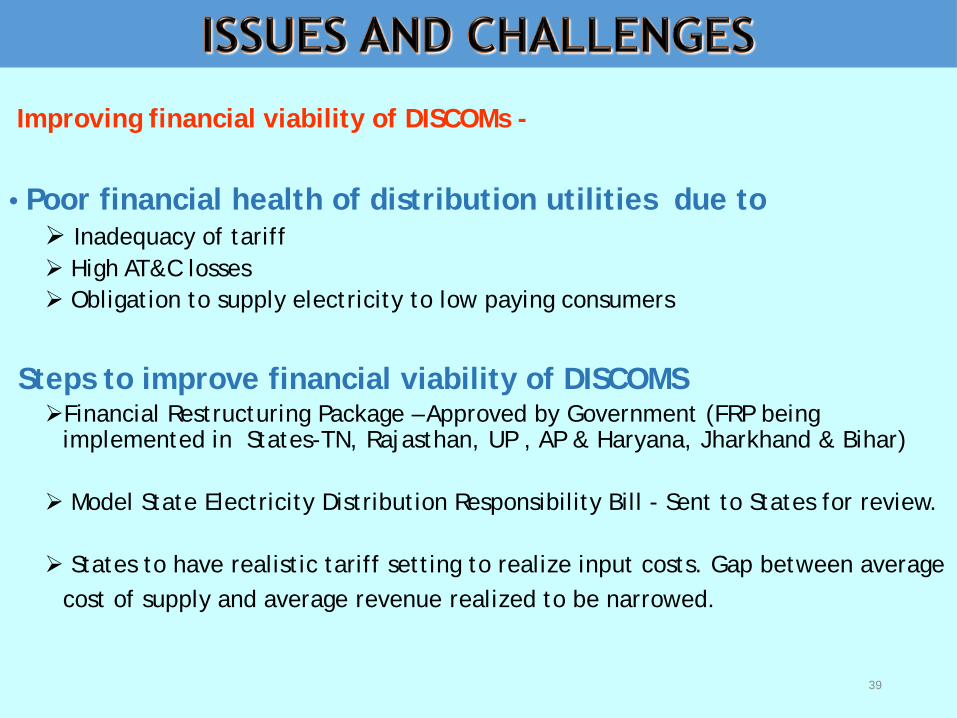
Improving financial viability of DISCOMs -
• Poor financial health of distribution utilities due to Inadequacy of tariff High AT&C losses Obligation to supply electricity to low paying consumers
Steps to improve financial viability of DISCOMS Financial Restructuring Package – Approved by Government (FRP being
implemented in States-TN, Rajasthan, UP , AP & Haryana, Jharkhand & Bihar) Model State Electricity Distribution Responsibility Bill - Sent to States for review.
States to have realistic tariff setting to realize input costs. Gap between average
cost of supply and average revenue realized to be narrowed.
39
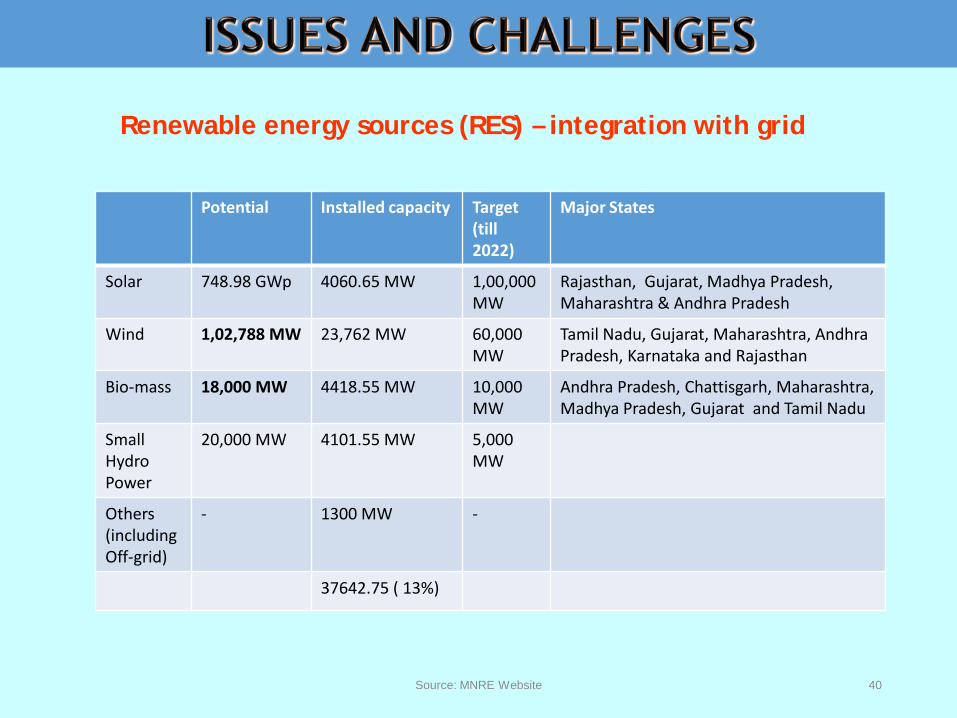
Source: MNRE Website 40
Renewable energy sources (RES) – integration with grid
Potential Installed capacity Target (till 2022)
Major States
Solar 748.98 GWp 4060.65 MW 1,00,000MW
Rajasthan, Gujarat, Madhya Pradesh, Maharashtra & Andhra Pradesh
Wind 1,02,788 MW 23,762 MW 60,000 MW
Tamil Nadu, Gujarat, Maharashtra, Andhra Pradesh, Karnataka and Rajasthan
Bio-mass 18,000 MW 4418.55 MW 10,000 MW
Andhra Pradesh, Chattisgarh, Maharashtra, Madhya Pradesh, Gujarat and Tamil Nadu
Small Hydro Power
20,000 MW 4101.55 MW 5,000 MW
Others (including Off-grid)
- 1300 MW -
37642.75 ( 13%)

41
• Government of India is giving huge thrust to solar, wind and hydro power projects. The capacity of solar and wind power projects is being augmented to 100,000 MW and 60,000 MW respectively, by 2022.
• Accelerated Depreciation (AD) has been given to boost wind power. The paradigm shift in favour of renewable energy is due to the gradually falling prices of solar power projects.
• Since Solar power is expensive and its off-take is very difficult, GOI
decided to blend the solar power with 1000 MW of unallocated coal based power through NTPC Vidyut Vyapar Nigam Ltd. (NVVNL) for projects under phase-I of Jawaharlal Nehru National Solar Mission (JNNSM). The present trend of reducing bid out prices of solar power projects using preferential tariff is improving its off-take by Discoms and is encouraging investments in this segment. Expected grid parity of solar power within next 5 years.
42
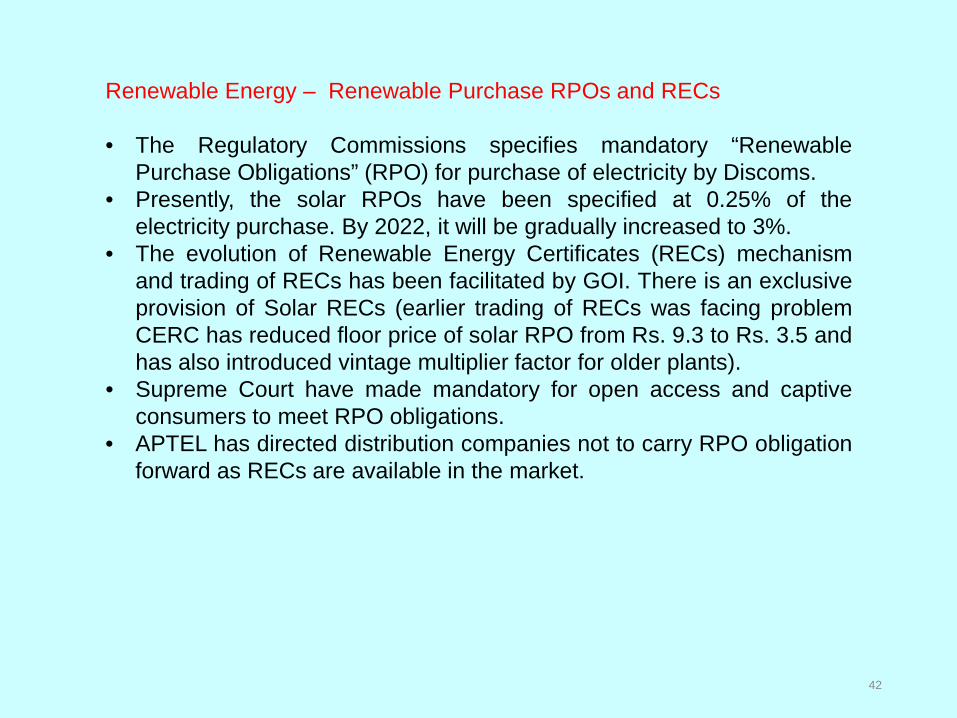
Renewable Energy – Renewable Purchase RPOs and RECs • The Regulatory Commissions specifies mandatory “Renewable
Purchase Obligations” (RPO) for purchase of electricity by Discoms. • Presently, the solar RPOs have been specified at 0.25% of the
electricity purchase. By 2022, it will be gradually increased to 3%. • The evolution of Renewable Energy Certificates (RECs) mechanism
and trading of RECs has been facilitated by GOI. There is an exclusive provision of Solar RECs (earlier trading of RECs was facing problem CERC has reduced floor price of solar RPO from Rs. 9.3 to Rs. 3.5 and has also introduced vintage multiplier factor for older plants).
• Supreme Court have made mandatory for open access and captive consumers to meet RPO obligations.
• APTEL has directed distribution companies not to carry RPO obligation forward as RECs are available in the market.
43
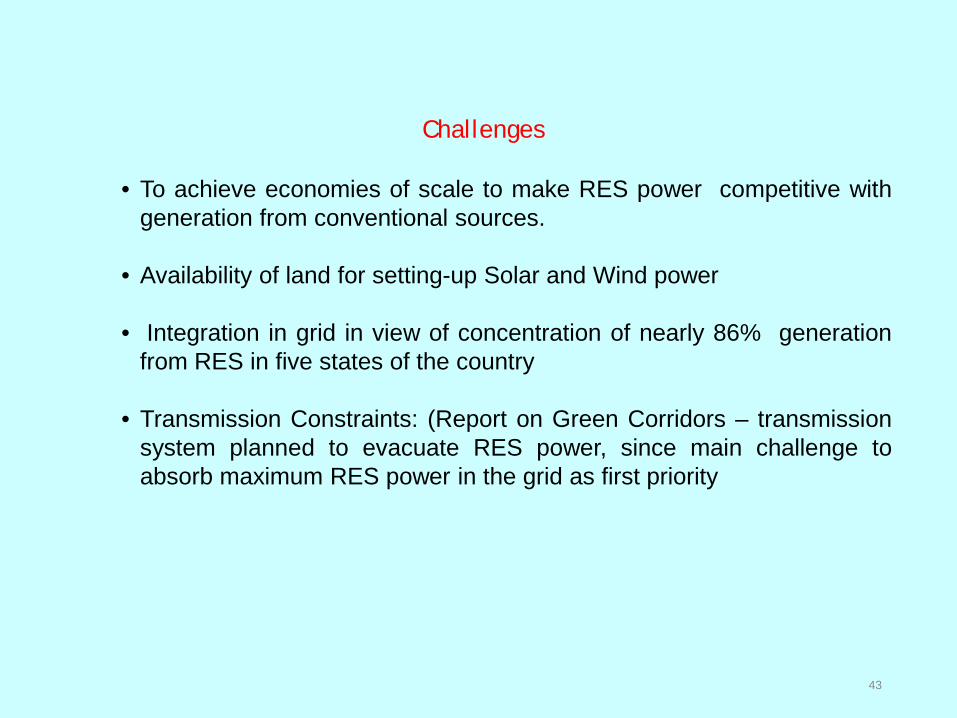
Challenges
• To achieve economies of scale to make RES power competitive with
generation from conventional sources.
• Availability of land for setting-up Solar and Wind power
• Integration in grid in view of concentration of nearly 86% generation from RES in five states of the country
• Transmission Constraints: (Report on Green Corridors – transmission system planned to evacuate RES power, since main challenge to absorb maximum RES power in the grid as first priority

Reliable operation of grid – deficit power situation ( about 4.2 % deficit in energy
and 4.5 % deficit in peak power)
• Necessary to monitor grid closely – Indian Electricity Grid Code (IEGC) details
principles of grid operation; effective defense mechanism ( UFR, Automatic Demand
Management system ), Phasor Measurement Unit ( PMU) installation, Renovation &
up-gradation of protection system
• Location of electricity resources and demand unevenly distributed - Surplus
availability of power and energy during some seasons in certain Regions necessitates
robust transmission network for transfer of such power to deficit areas.
• National Electricity Grid w.e.f 31.12.2014– Strengthening of transmission system is
required especially for SR-NEW Grid inter-regional corridor. .44

Minimizing carbon footprint
• Increasing environmental concerns could impact Indian power sector in multiple ways - influencing price and availability of fuel, fuel mix and demand for power.
• Overall, per capita CO2 emission remains much higher in the developed economies. While India’s overall CO2 generation is high, the per-capita emission is among lowest in the world.
45

46
Improving Efficiency of Coal based generation: • Due to energy security considerations, coal will remain mainstay
of India’s power generation in future. • As India strives for sustainable growth and ramps up its power
generation capacity, it is critical to focus on measures that will mitigate environmental impacts and progressively reduce emission intensity of our GDP.
• One such measure is the deployment of supercritical technology for upcoming coal based plants. The efficiency of Supercritical units is around 38.4 % as compared to 35.1 % of Sub critical units.
• Supercritical technology has been introduced to improve efficiency of coal fired generation which could enable about 5 % lower emissions than the conventional sub-critical units. The first 660 MW unit based on supercritical technology was commissioned in India in December 2010.
• Since then, nearly 27.4 GW of capacity has been commissioned using this technology.

47
Improving Efficiency of Coal based generation:
• A series of policy measures have been taken to promote use of supercritical technology by the Government of India.
• This technology has been made essential for the UMPP projects and for other new projects coming up during 2012-2017. 4 UMPPs have been awarded on the basis of tariff based competitive bidding. 12 more UMPPs are in the pipeline.
• Preference in coal allocation is being given to supercritical projects. It has been decided that from 2017 onwards, only supercritical units will be considered for new capacity addition.
• Further, NTPC has started working on Advanced Ultra Super Critical Units (700 deg.C) – which has efficiency of about 45%.
• For indigenous manufacture of super critical power plant equipment, Indian companies formed a number of JVs.

Minimizing carbon footprint
• Bureau of Energy Efficiency (BEE) and Ministry of Power has started initiatives to enable low Carbon growth strategies through facilitation of their activities under the National Mission on Enhanced Energy Efficiency (NMEEE) which is one of the eight missions under India’s National Action Plan on Climate Change (through Perform Achieve and Trade mechanism) and other programs (including Bachat Lamp Yojana and Standards and Labeling).
• BEE has undertaken several initiatives. These measures have resulted in the savings equivalent to 11, 000 MW of avoided capacity during last 5 years.
• Domestic Efficient Lighting Programme (DELP) has been launched by Hon’ble PM. Till now around 90 lac energy efficient LED bulbs has been distributed.
48
49
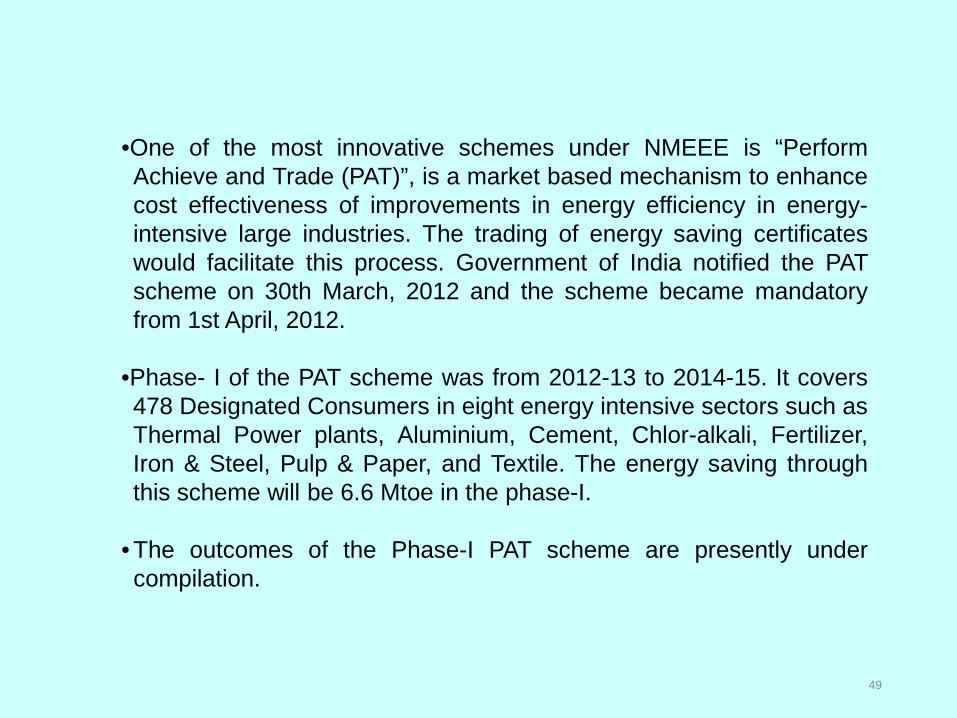
•One of the most innovative schemes under NMEEE is “Perform Achieve and Trade (PAT)”, is a market based mechanism to enhance cost effectiveness of improvements in energy efficiency in energy-intensive large industries. The trading of energy saving certificates would facilitate this process. Government of India notified the PAT scheme on 30th March, 2012 and the scheme became mandatory from 1st April, 2012.
•Phase- I of the PAT scheme was from 2012-13 to 2014-15. It covers 478 Designated Consumers in eight energy intensive sectors such as Thermal Power plants, Aluminium, Cement, Chlor-alkali, Fertilizer, Iron & Steel, Pulp & Paper, and Textile. The energy saving through this scheme will be 6.6 Mtoe in the phase-I.
• The outcomes of the Phase-I PAT scheme are presently under compilation.
50
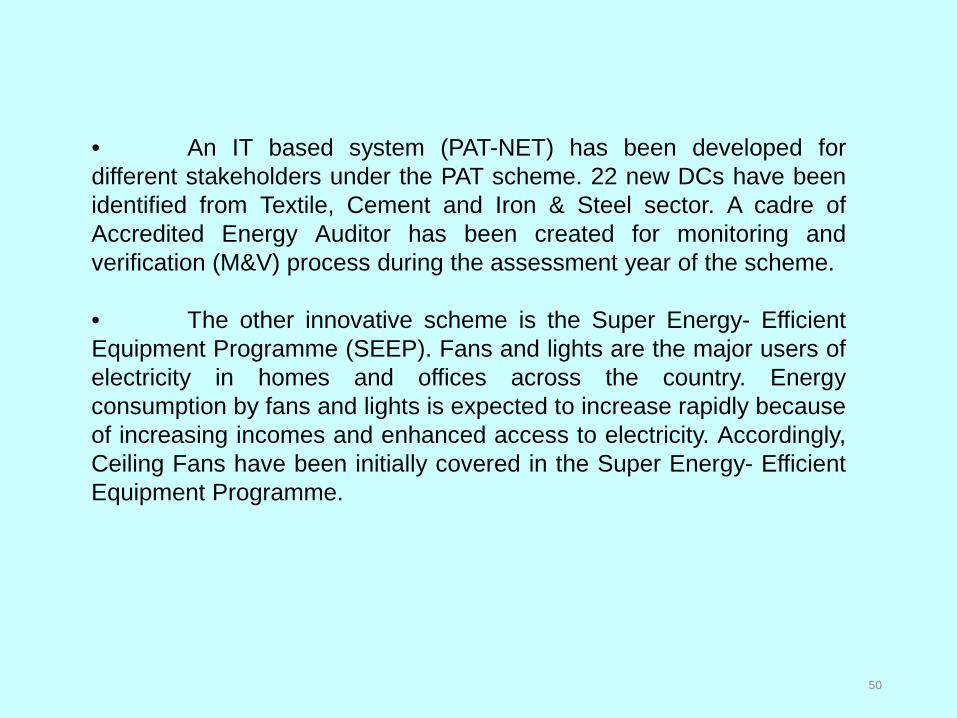
• An IT based system (PAT-NET) has been developed for different stakeholders under the PAT scheme. 22 new DCs have been identified from Textile, Cement and Iron & Steel sector. A cadre of Accredited Energy Auditor has been created for monitoring and verification (M&V) process during the assessment year of the scheme. • The other innovative scheme is the Super Energy- Efficient Equipment Programme (SEEP). Fans and lights are the major users of electricity in homes and offices across the country. Energy consumption by fans and lights is expected to increase rapidly because of increasing incomes and enhanced access to electricity. Accordingly, Ceiling Fans have been initially covered in the Super Energy- Efficient Equipment Programme.
Challenges
51
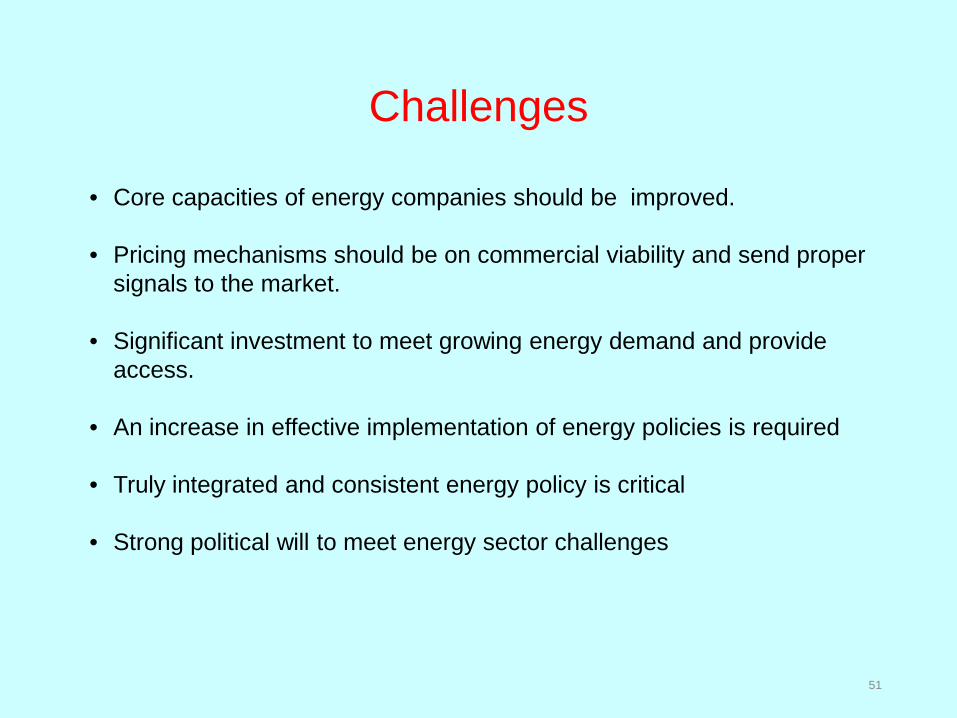
• Core capacities of energy companies should be improved.
• Pricing mechanisms should be on commercial viability and send proper signals to the market.
• Significant investment to meet growing energy demand and provide access.
• An increase in effective implementation of energy policies is required
• Truly integrated and consistent energy policy is critical
• Strong political will to meet energy sector challenges
53
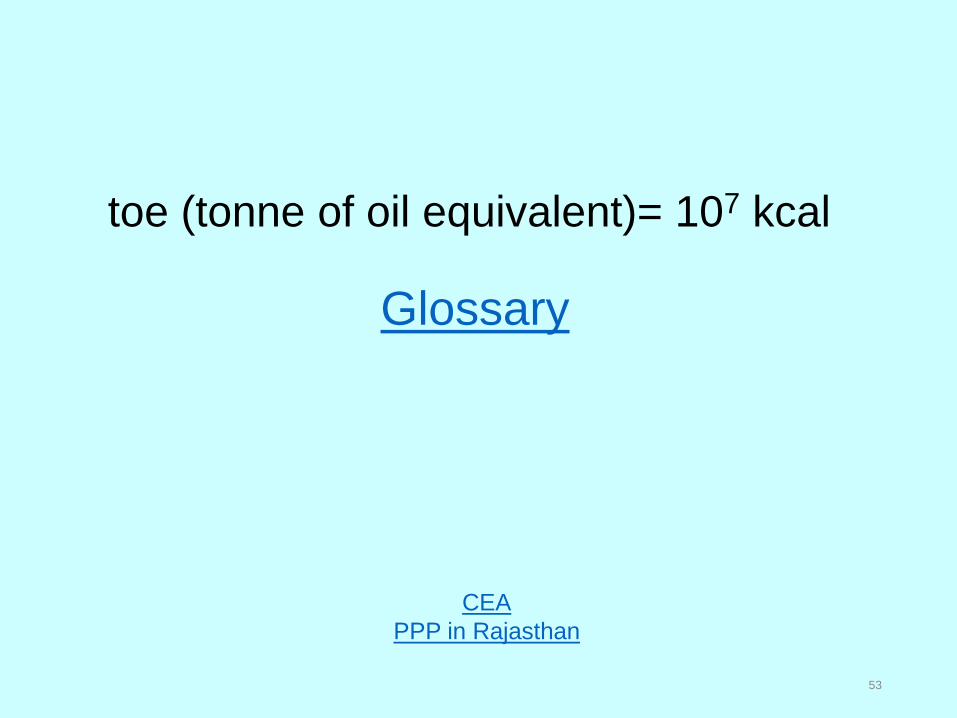
toe (tonne of oil equivalent)= 107 kcal
Glossary
CEA PPP in Rajasthan
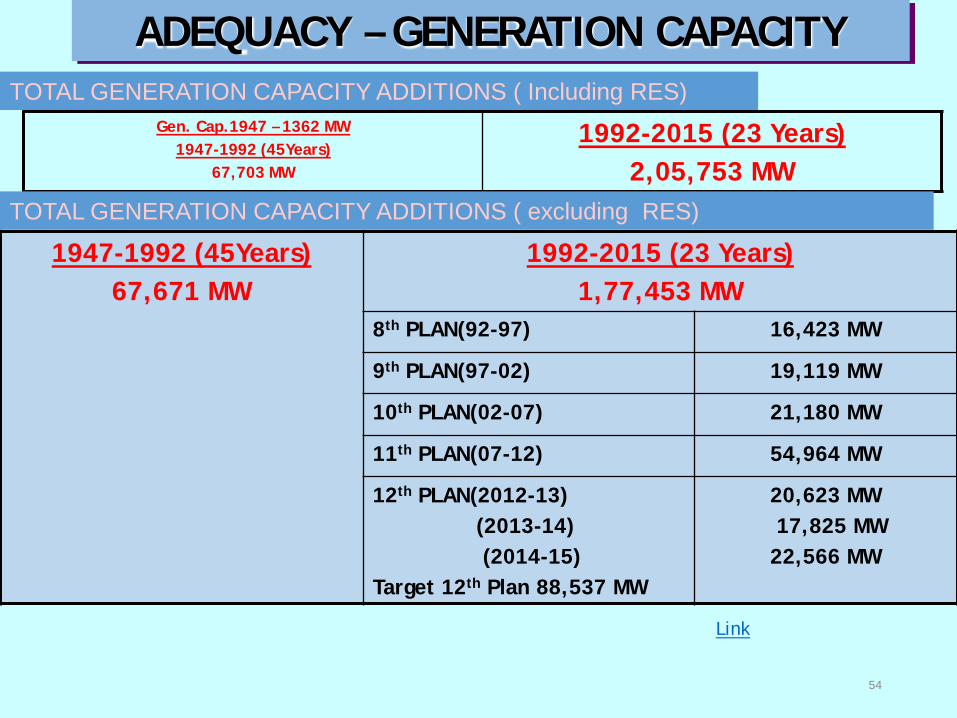
1947-1992 (45Years) 67,671 MW
1992-2015 (23 Years) 1,77,453 MW
8th PLAN(92-97) 16,423 MW
9th PLAN(97-02) 19,119 MW
10th PLAN(02-07) 21,180 MW
11th PLAN(07-12) 54,964 MW
12th PLAN(2012-13) (2013-14) (2014-15) Target 12th Plan 88,537 MW
20,623 MW 17,825 MW 22,566 MW
ADEQUACY – GENERATION CAPACITY
Link
54
Gen. Cap.1947 – 1362 MW 1947-1992 (45Years)
67,703 MW
1992-2015 (23 Years) 2,05,753 MW
TOTAL GENERATION CAPACITY ADDITIONS ( Including RES)
TOTAL GENERATION CAPACITY ADDITIONS ( excluding RES)