Embed Size (px)
Citation preview
Energy scenario in India
• At the present growth rate, Indian economy will double every eight years
• Growing population
• 80% of global population lives in developing areas. Of the 6.0 billion populations
• during the period 2005-2030, the population rise in the developing countries would be higher than the population growth in the developed countries. And, as a result, by the year 2030, the global population in the developed countries would be a little more than 16% and the balance about 84% would in the developing countries.
• As regards energy consumption, 16% of the global population in the developed countries, would consume, by the year 2030, more than 40% of energy and the balance about 84% of the global population in the non-developed areas would consume a little less than 60% of the total energy consumed in the world. No doubt, during the period 2005 to 2030, the rate of growth of energy consumption in the non-developed countries would be higher than in developed countries
• India is one of the countries where the present level of energy consumption, by world standards, is very low. The estimate of annual energy consumption in India is about 330 Million Tones Oil Equivalent (MTOE) for the year 2004. Accordingly, the per capita consumption of energy is about 305 Kilogram Oil Equivalent (KGOE). As compared to this, the energy consumption in some of the other countries is of the order of over 4050 for Japan, over 4275 for South Korea, about 1200 for China, about 7850 for USA, about 4670 for developed countries and the world average is about 1690.
• In so far as electricity consumption is concerned, India has reached a level of about 600-kilowatt hour (kwh) per head per year. The comparable figures for Japan are about 7,800, for South Korea about 7,000, for China about 1380, for USA about 13,000, for OECD countries about 8050 and world average are about 2430.
• India is far behind many countries, and as a matter of fact, behind even the world average.
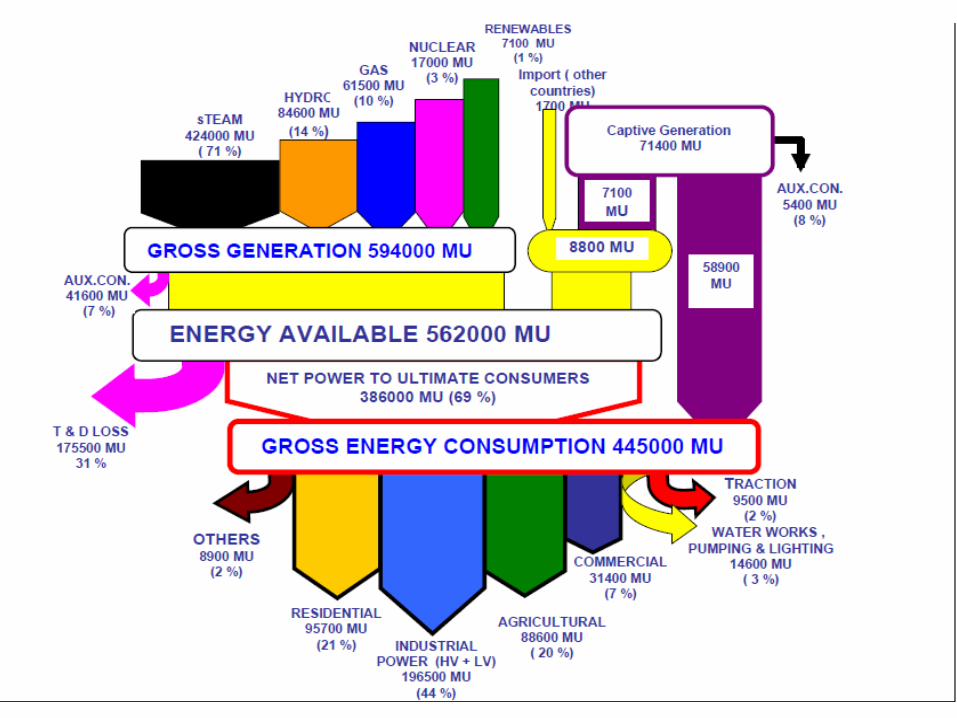
• In the profile of energy sources in India, coal has a dominant position. Coal constitutes about 51% of India’s primary energy resources followed by Oil (36%), Natural Gas (9%), Nuclear (2%) and Hydro (2%).
• On the supply side, the mis-match between demand and supply is so large that India can ill-afford to choose one option in preference to the other. For several years, in fact may be for next few decades, India would need to exploit all possible options to create reasonably large capacity base on the energy side
• On the Demand Side Management, there exists a substantial scope. On the basis of random sampling studies conducted on various segments of energy consumption, it has been established that over 20% of energy is wasted because of in-efficient consumption. The Government of India enacted a legislation called Energy Conservation Act in the year 2001. The Bureau of Energy Efficiency (BEE) has been put in place in pursuance to implementation of this law.
• The Bureau has formulated a number of major action plans to make significant dent on various segments of energy consumption – in the domestic sector, in the agriculture, in service group and in manufacturing sector
• The programmes include Standards and Labeling of energy consuming gadgets, setting and enforcing consumption norms, developing energy efficient building codes, energy audits of large buildings etc
let us examine the various segments of the energy sector and focus on the present status, the areas of challenges and the future perspective.
• Coal Sector • As mentioned earlier, coal constitutes the most
dominant constituent of the energy sector. In the year 2005-06, the coal production was over 370 million tones. Power Sector consumes almost 80% of coal that is produced. India has large coal reserves of the order of 200 Billion Tones, most of these are high ash content coal in the calorific value range of 3000 kilo calorie per kilogram to 4,500 kilo calorie per kilogram and ash content in the range of 30 – 45%.
Some of the issues
• So far as the institutional framework is concerned, coal industry is pre-dominantly managed through a number of coal companies directly under the control of Government of India
• In order to extract maximum amount of extractable coal, a substantial portion of which could be within 150 meters of depth, but a good portion could also lie below 150 meters
issues ……
• Employing latest technologies
• The Coal Mines Denationalization Bill, 2000 has been pending consideration by the Indian Parliament
• As per the present policy, the pricing of coal, which, for a number of years used to be administered by the Government, has been now left to the coal producers.
Issues…..
• Ultimately, coal sector would be developed in a manner that it is the market which would determine the price
• There exists a scope for major research and development programmes. Some of them have been initiated for more environment friendly use of coal.
•

• India has also joined the global initiative on Carbon Sequestration Leadership Forum (CSLF). As a matter of fact, India was one of the first 15 nations in the world.
• India is also the first country in the world, which has joined the USA for the Futuregen Project, which aims at setting up a power plant, which will have zero emission. Some of the Indian companies are also in the process of joining as alliance partners in this project.
OIL SECTOR
• Oil constitutes over 35% of the primary energy consumption in India. It is expected that this would rise both in terms of absolute amount and proportion. The demand about 200 million metric tones , 2011-12
• The Petroleum Regulatory Bill envisages the institution of regulator, which will oversee the down stream aspects of the sector. A major trend in the oil and gas regulation in India is the opening up of this sector to private and foreign investments.
• It is important to bring in technologies and international benchmarks of practices and parameters
GAS SECTOR
• Natural gas constitutes about 9% in the India’s energy profile, as compared to about 25% world average. About 45% of natural gas is consumed by power sector and about 40% by the fertilizer sector. The balance 15% goes for various other consumption. At present about 65 million cubic meters of gas per day is being consumed and it has the potential for increase.
• Both the Power Sector and Fertilizer Sector have been planning for larger consumption of gas and increased capacities so as to produce more power through this environment friendly fuel.
• Because of lack of availability of gas, almost 35% of the capacity remains unutilized and these plants then need to resort to naptha as a substitute fuel which is excessively costly
Some of the issues in the area of gas are as follows
• Power and Fertilizers sectors have been provided gas under the Administered Price Mechanism in last over 20 years .
• Huge resources of gas which have been discovered by Reliance Industry, ONGC, Gujarat Gas, Cairn Energy and others, when produced and supplied, there will be greater clarity on adequacy of supply and predictability of price
• There is predictability about its price, it would be possible to enhance the present projection of gas based power capacity to a higher level
• Domestic reserves will obviously not be sufficient. Gas supply will need to be supplemented through LNG import with appropriate enhancement of LNG Re-gasification facilities
NUCLEAR POWER
• India has established its capability in design, engineering, construction and operation of nuclear power plants. The installed capacity is 3310 MW, less than 3% of total installed capacity of power.
• India believes that nuclear power could be a good source of its power profile and therefore its proportion should increase from 2.6% to say 7 to 8% by 2030 which will mean a capacity of over 55,000 MW
issues
• At present, entire development of nuclear power plants is through Nuclear Power Corporation of India, a company under the control of Government of India. As per the Atomic Energy Act, private sector is not permitted to develop these plants.
Issues…
• Tariff determination for power generated in these plants is also not under the jurisdiction of the Regulatory Commission; the Government of India decides it.
• Management and disposal of waste has been carried out fairly satisfactorily. These plants have demonstrated good track record of safety and waste management. To deal with the issue of safety and related matter, there is an independent Regulatory institution.
Indian Electric Power Survey
• The Central Electrical Authority’s 17th Electric Power Survey was released in May, 2007.
• The Electric Power Survey Committee conducts periodic surveys of electricity demand and holds discussions with all the stakeholders to bring out demand forecast for use in planning exercises of all key sectors of economy i.e. coal, rail, manufacturing, infrastructure, research, industries, etc.
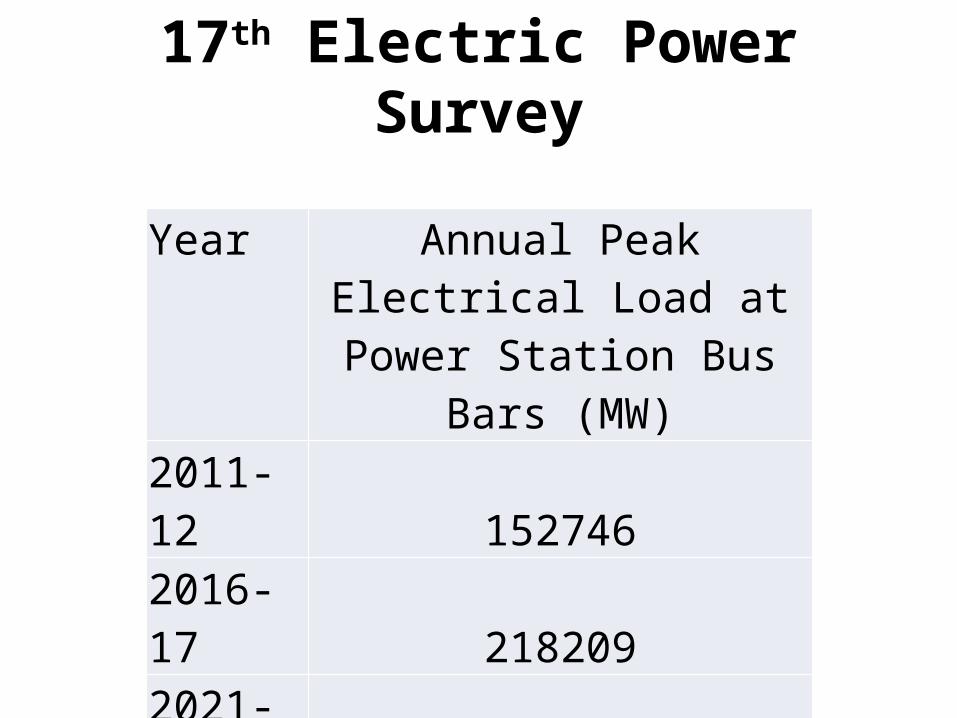
17th Electric Power Survey
Year Annual Peak Electrical Load at Power Station Bus Bars
(MW)
2011-12 1527462016-17 2182092021-22 298253
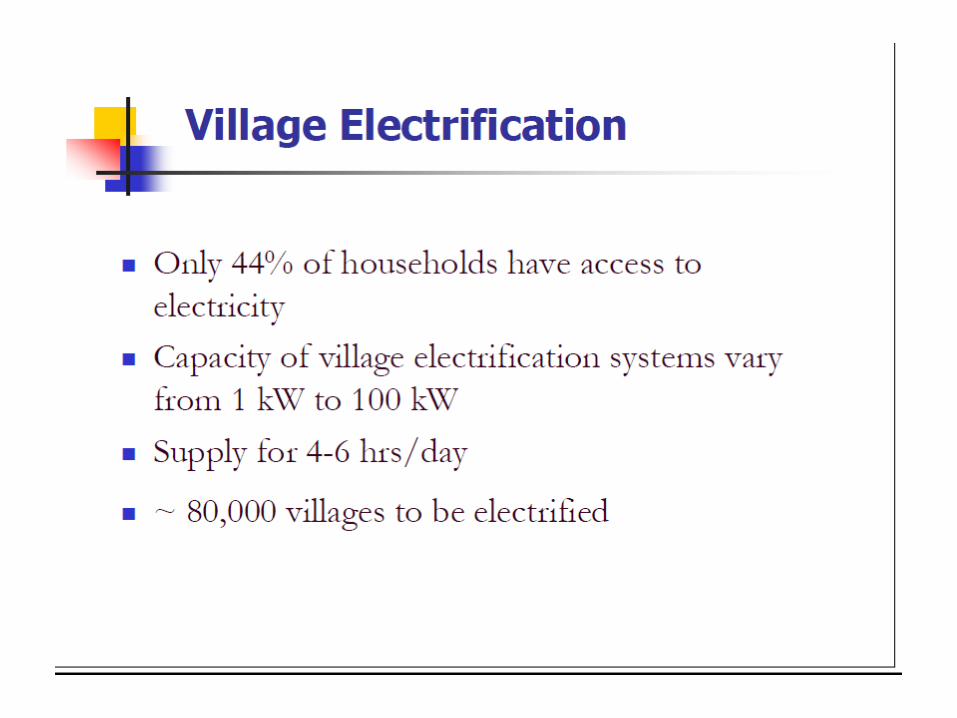
Power for All by 2012
• The Ministry of Power has set a goal - Mission 2012: Power for All.
• A comprehensive Blueprint for Power Sector development has been prepared encompassing an integrated strategy for the sector development with following objectives:-
- Sufficient power to achieve GDP growth rate of 8% - Reliability of power - Quality power - Optimum power cost - Commercial viability of power industry - Power for all
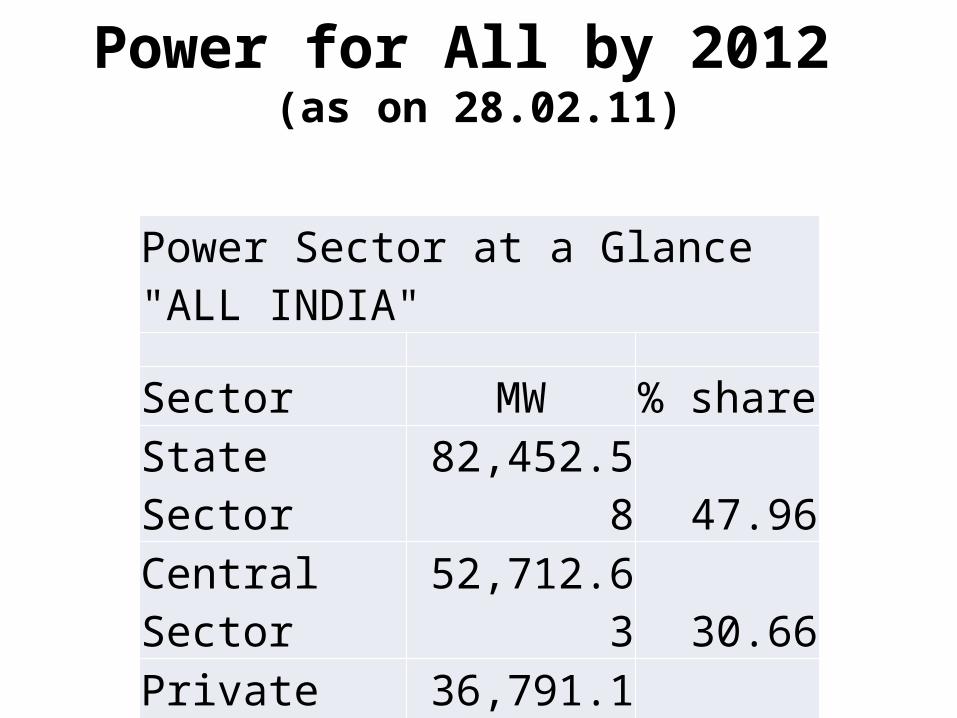
Power for All by 2012 (as on 28.02.11)
Power Sector at a Glance "ALL INDIA"
Sector MW % shareState Sector 82,452.58 47.96Central Sector 52,712.63 30.66Private Sector 36,791.19 21.38Total 1,71,926.40 100.00
RGGVY
• The Rajiv Gandhi Grameen Vidyuthikaran Yojana (RGGVY), aimed at rural electrification, is an initiative to provide focus and funds to rural distribution.
• As of 31st March 2011, a total of 587 projects were sanctioned, at a cost of Rs. 26,349 crores, electrifying 1,18,499 un/de-electrified villages.
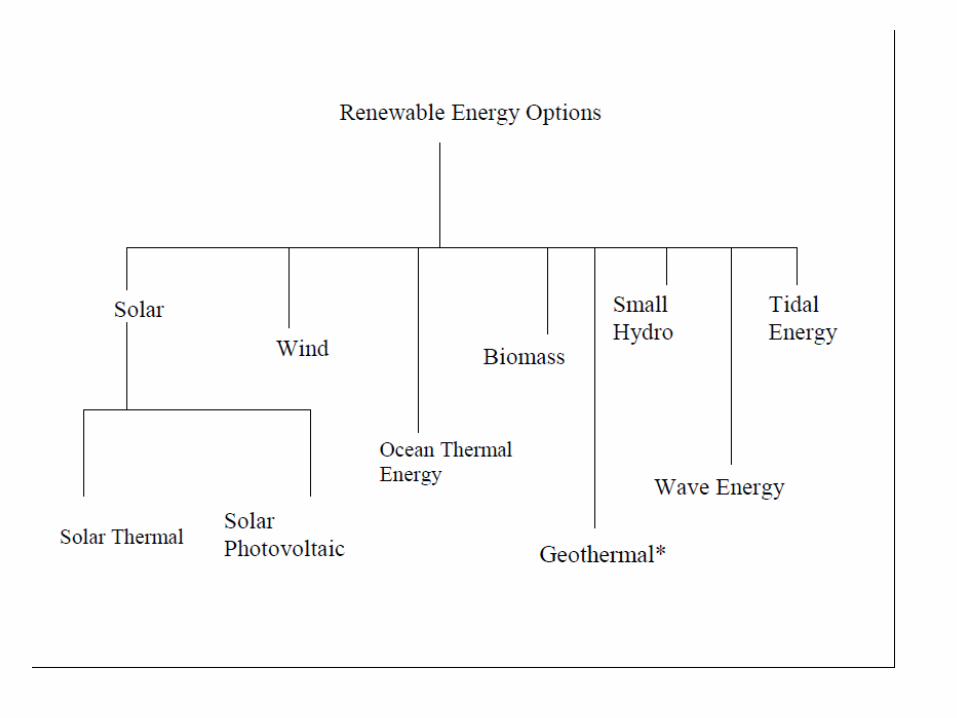
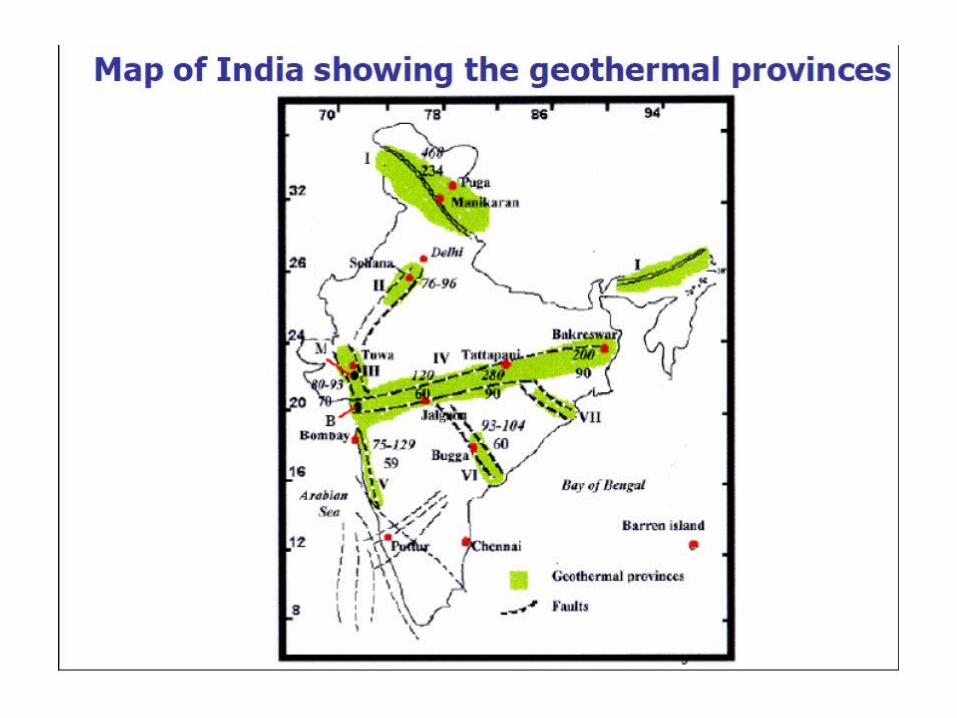
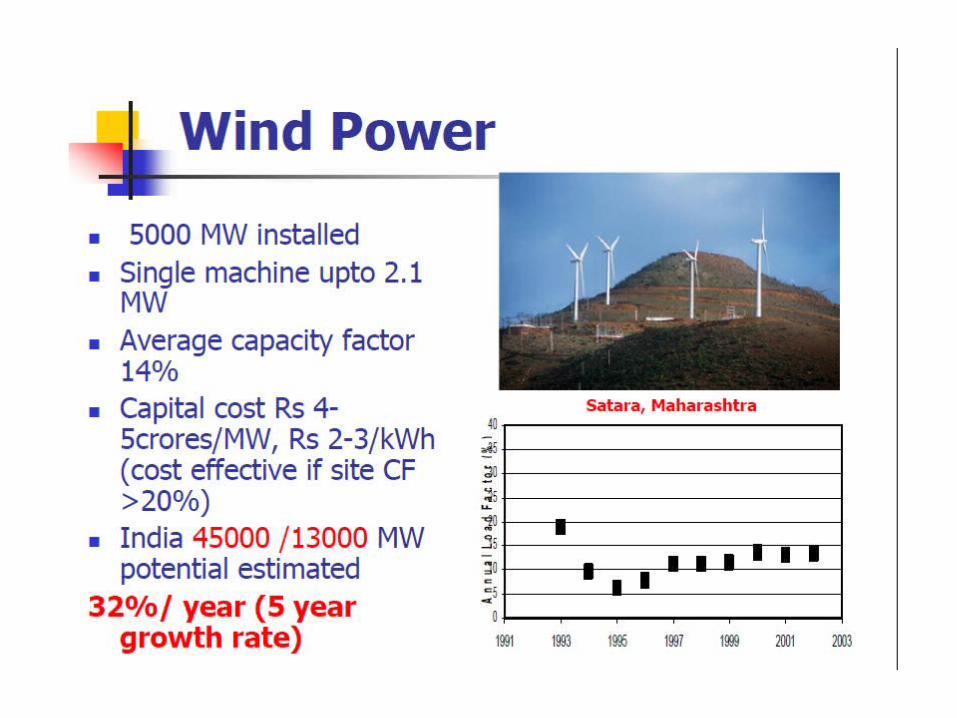
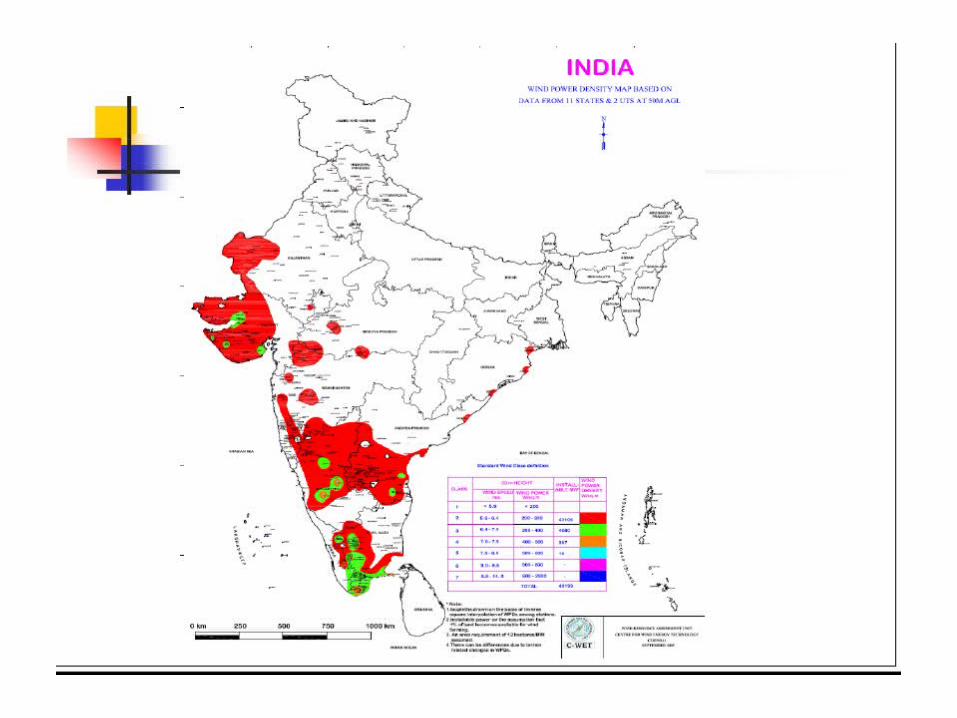
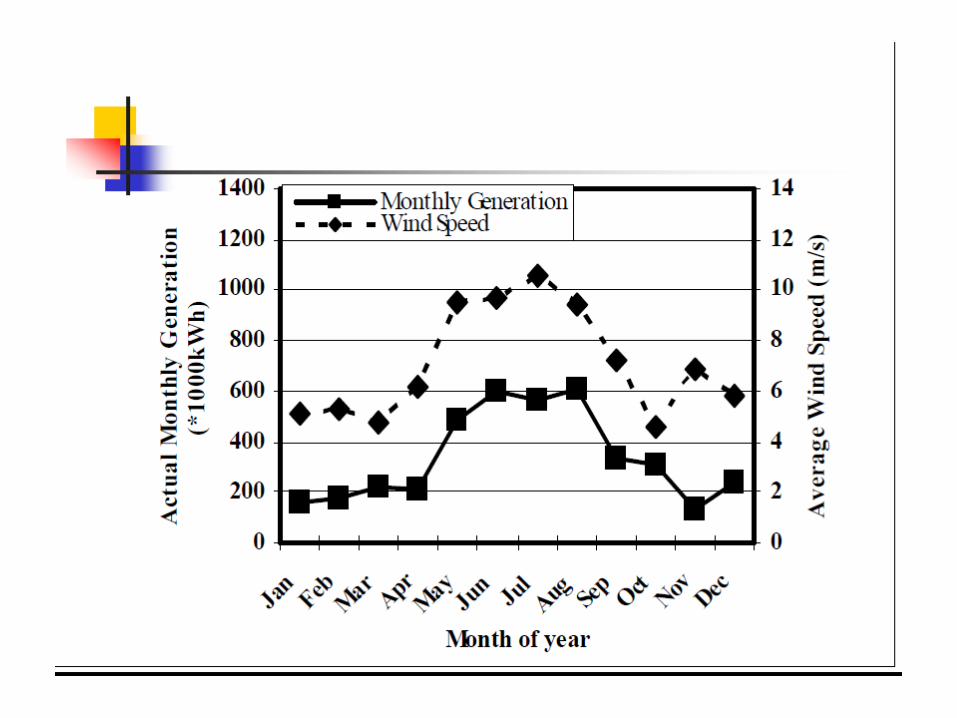
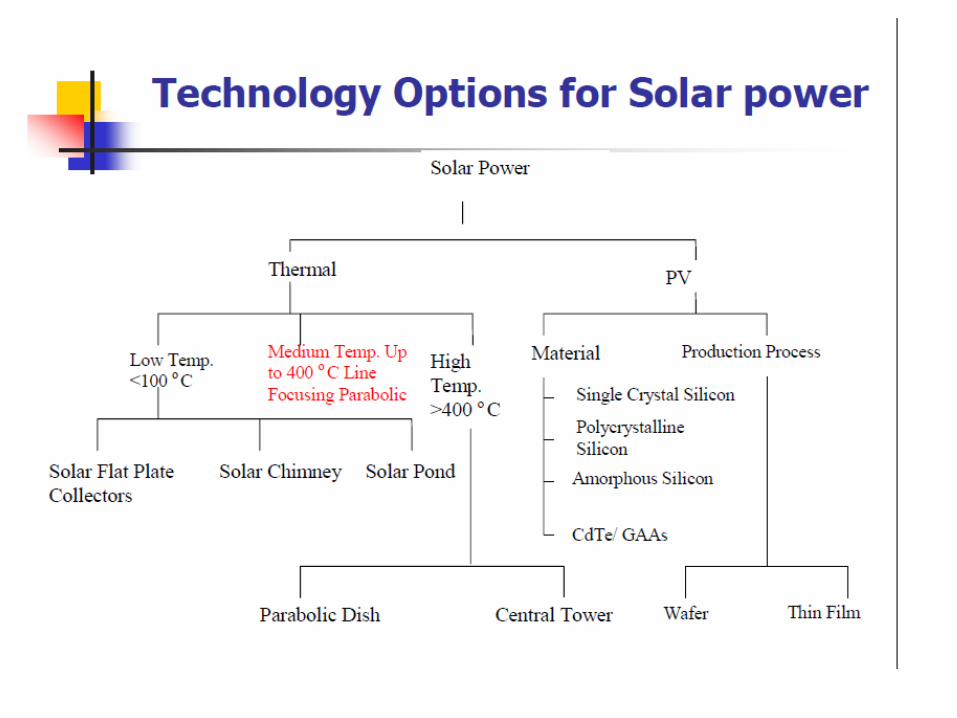
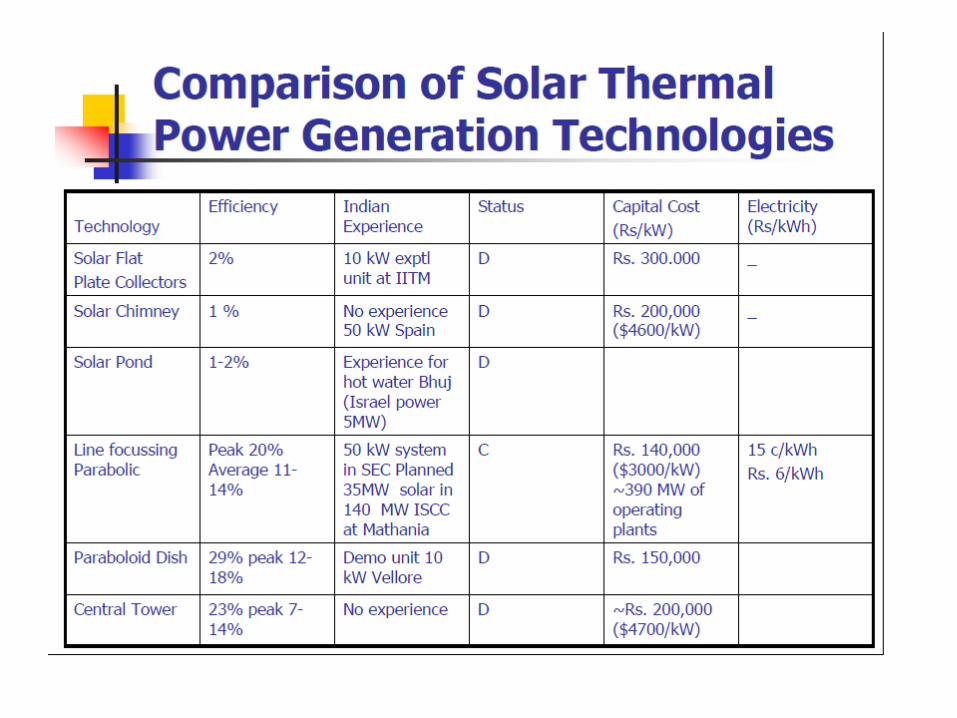
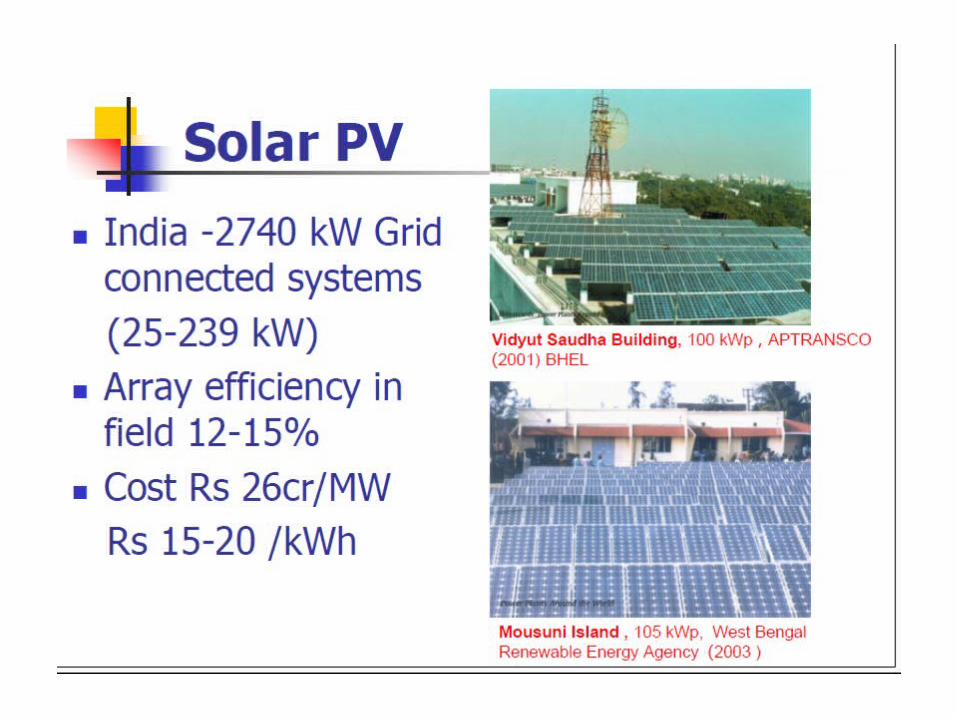
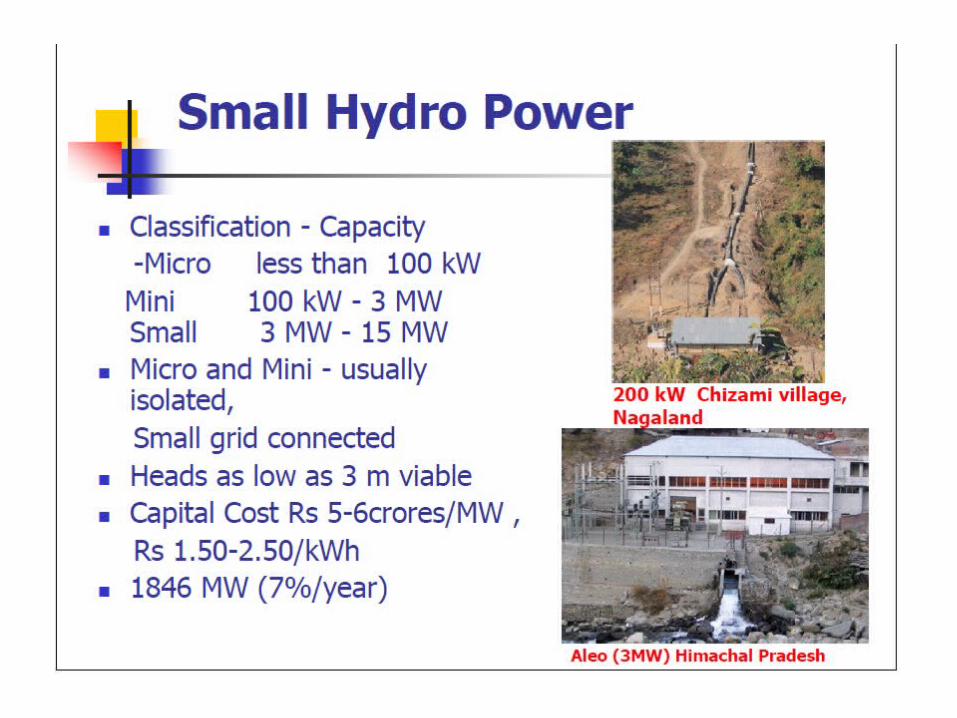
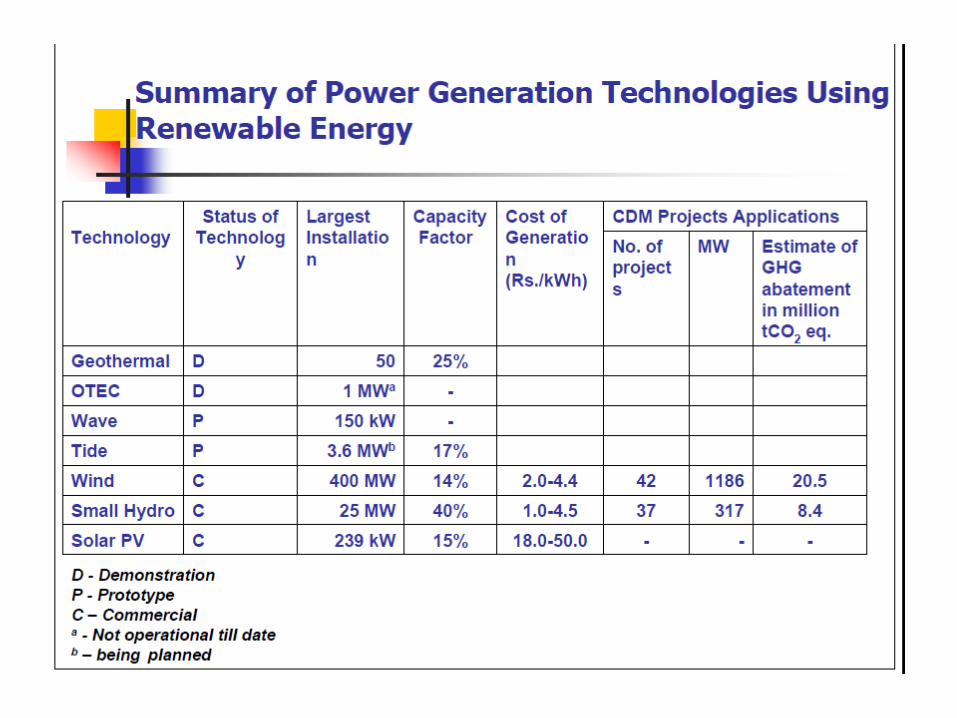
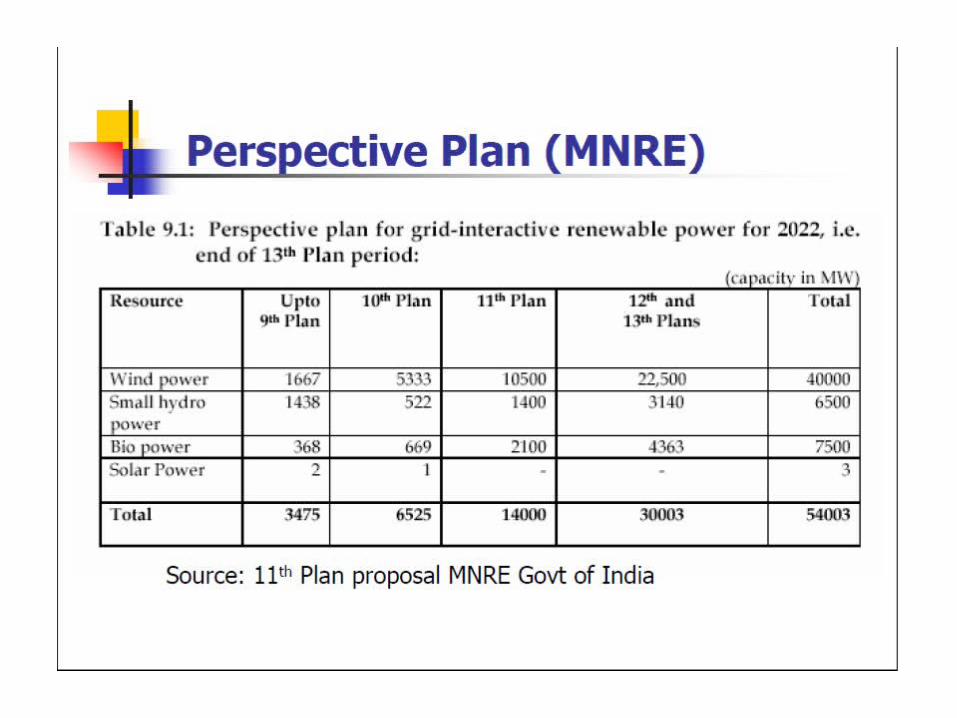
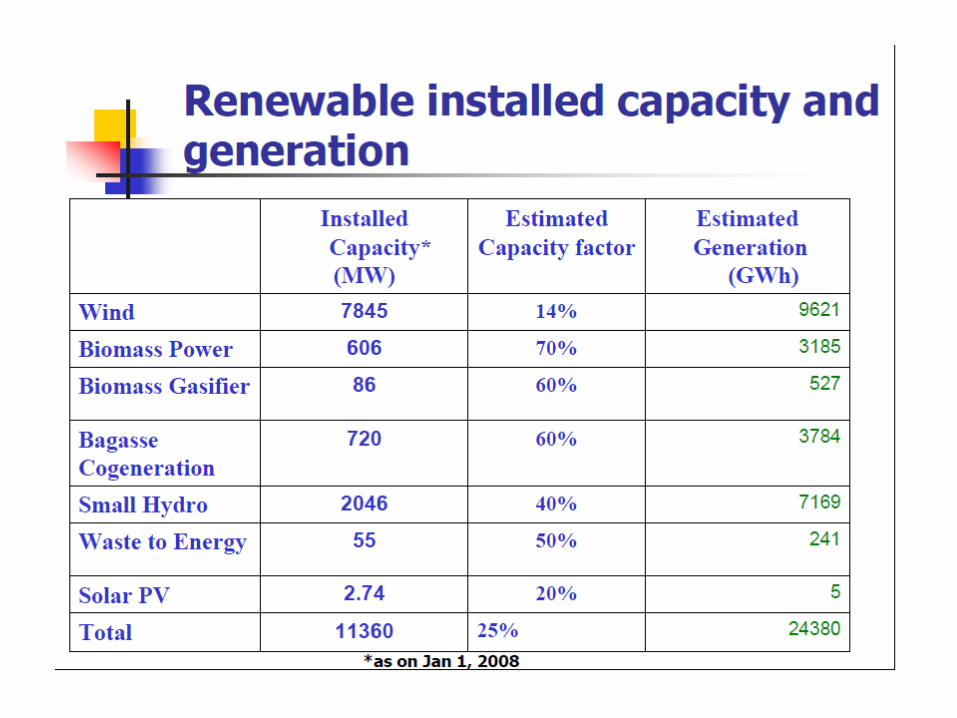
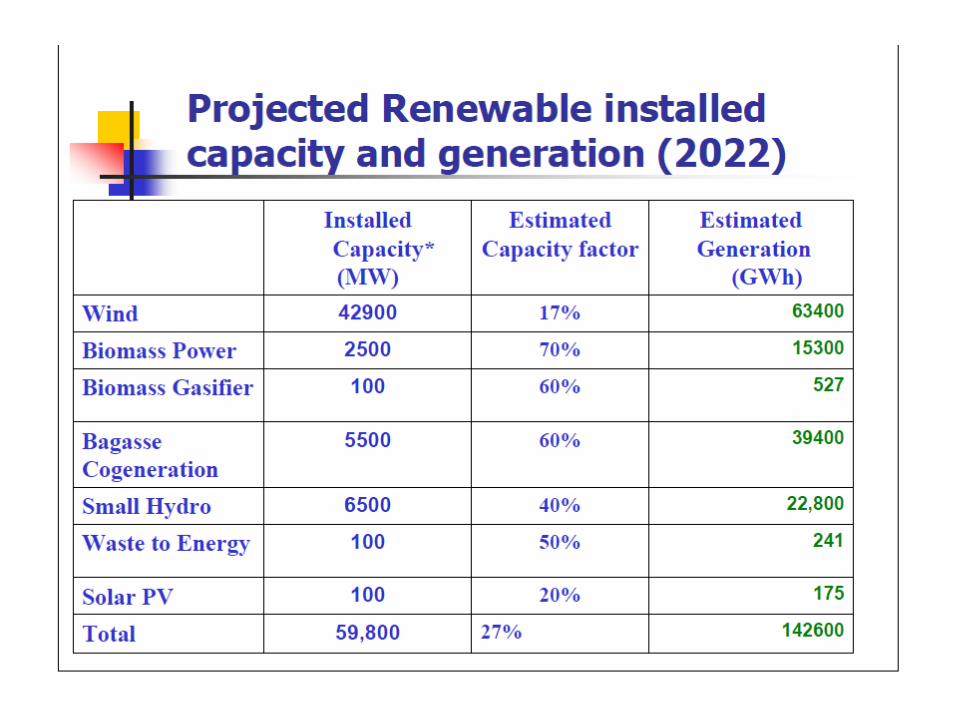
Renewable Power generation in India
• d
NR
WR
SR
ER
NER
Ennore
Kudankulam
Kayamkulam
Partabpur
Talcher/Ib Valley
Vindhyachal
Korba
LEGEND
Coal
Hydro
Lignite
Coastal
Nuclear
Vizag
Simhadri
Kaiga
Tarapur
Mangalore
Krishnapatnam
RAPP
SIKKIM
CHICKEN NECK
Cuddalore
SRI LANKACOLOMBO
NEPALBHUTAN
DESHBANGLA
South Madras
Pipavav
Generation Load-Centre
Kolkata
Bhubaneswar
Patna
Lucknow
Delhi
Mumbai
Chennai
Bangalore
Bhopal
Guwahati
Jammu
Ludhiana
Jaipur
Gandhinagar
Indore
Raipur
Thiruvananthapuram
Kozhikode
Hyderabad
Coal
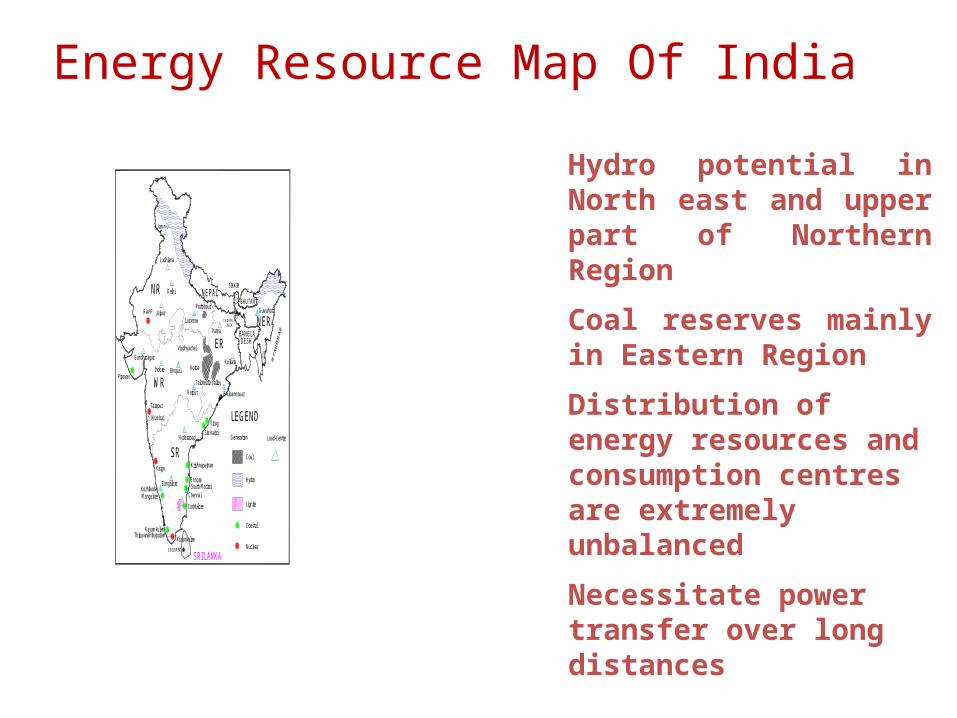
Hydro• Hydro potential in North
east and upper part of Northern Region
• Coal reserves mainly in Eastern Region
• Distribution of energy resources and consumption centres are extremely unbalanced
• Necessitate power transfer over long distances
Energy Resource Map Of India
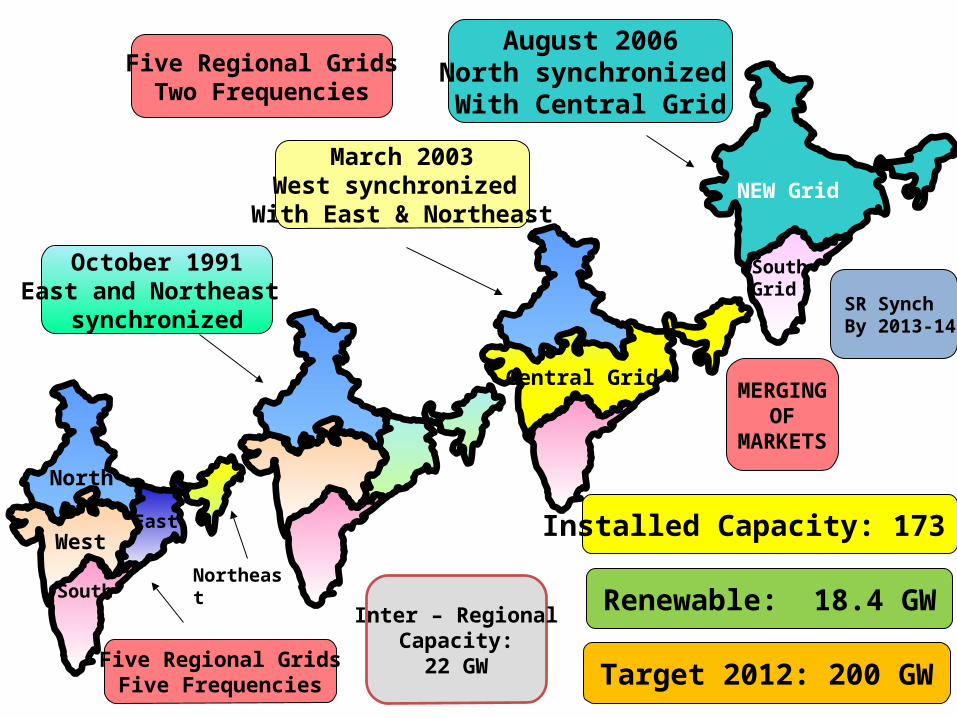
NEW Grid
SouthGrid
South
West
North
East
Northeast
Five Regional GridsFive Frequencies
October 1991East and Northeast
synchronized
March 2003West synchronized
With East & Northeast
August 2006North synchronized
With Central Grid
Central Grid
Five Regional GridsTwo Frequencies
Target 2012: 200 GW
MERGING OF
MARKETS
Renewable: 18.4 GW
Installed Capacity: 173 GW
SR Synch By 2013-14
Inter – RegionalCapacity:
22 GW
National Grid
• Focus of planning the generation and the transmission system shifted from the orientation of regional self-sufficiency to the concept of optimization of utilization of resources on All India basis
• A strong National Grid system would enable such an all-India generation planning and development
Objectives underlying the formation of National Grid
• To transfer power from surplus regions to deficit regions
• Utilise maximum resources from diversified regions
• Ensure reliable, economical and quality power
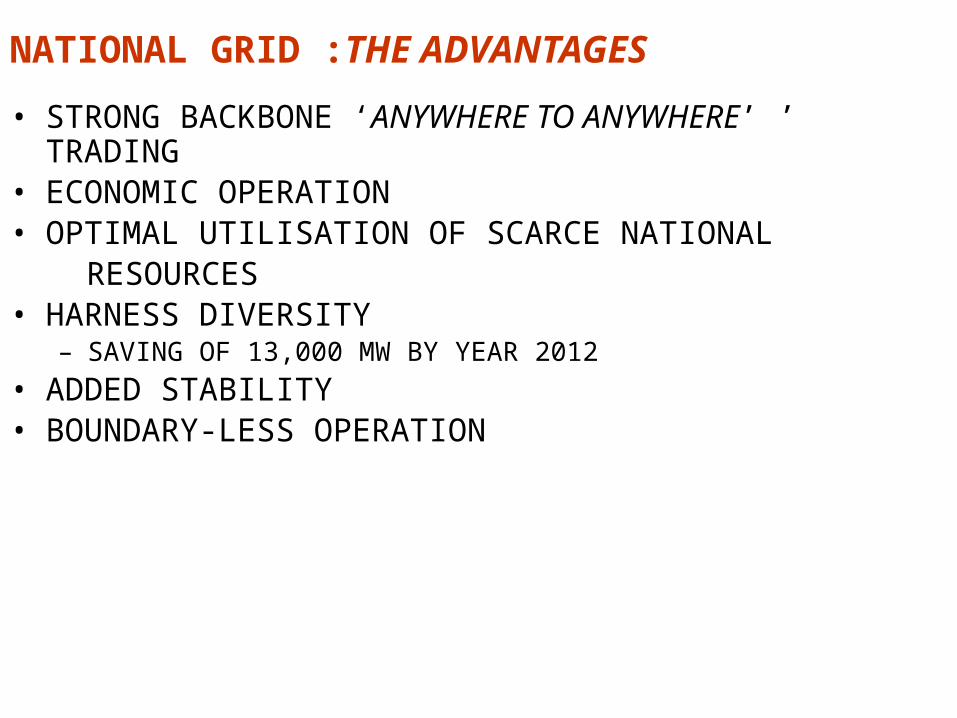
NATIONAL GRID :THE ADVANTAGES
• STRONG BACKBONE ‘ANYWHERE TO ANYWHERE’ ’ TRADING• ECONOMIC OPERATION• OPTIMAL UTILISATION OF SCARCE NATIONAL RESOURCES• HARNESS DIVERSITY
– SAVING OF 13,000 MW BY YEAR 2012• ADDED STABILITY• BOUNDARY-LESS OPERATION
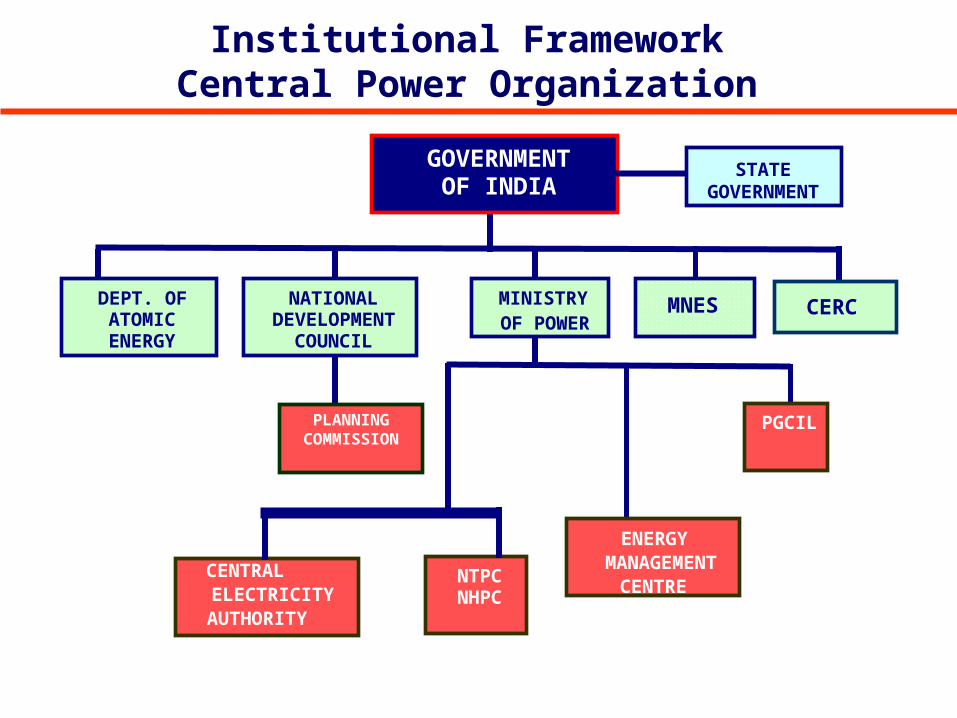
Institutional FrameworkCentral Power Organization
NJPC NTPCNHPC
PLANNING COMMISSION
MINISTRYOF POWER
STATE GOVERNMENT
DEPT. OFATOMICENERGY
NATIONALDEVELOPMENT
COUNCIL
MNES
ENERGYMANAGEMENT
CENTRENPTICRI
GOVERNMENTOF INDIA
PFCREC
PGCILTHDC
CENTRALELECTRICITY
AUTHORITY
DVCBBMB
CERC
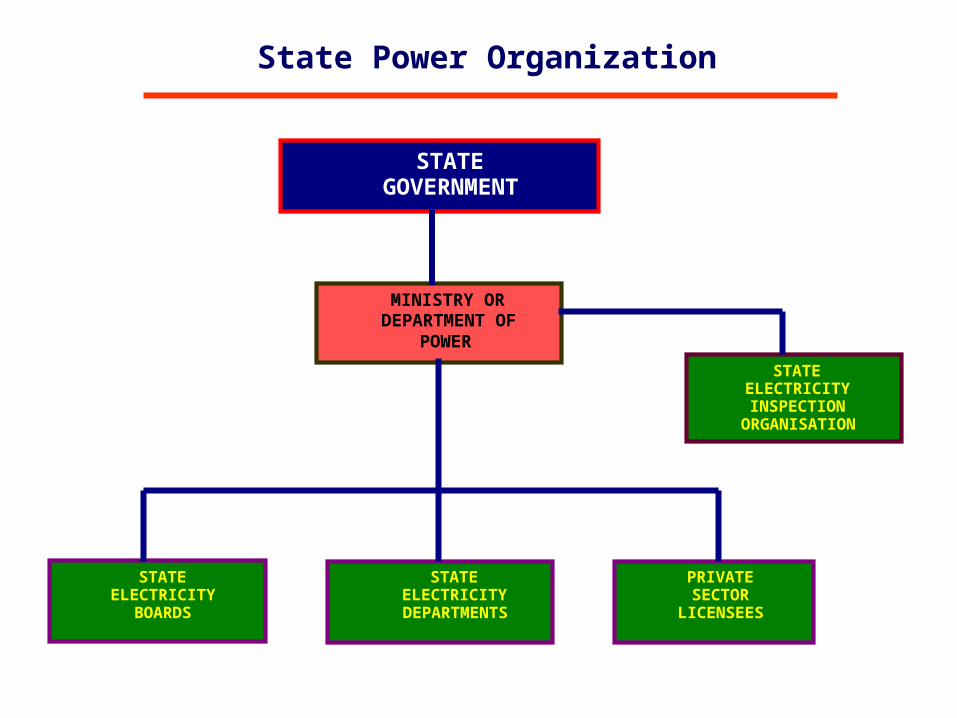
State Power Organization
PRIVATESECTOR
LICENSEES
STATEELECTRICITY
BOARDS
STATEELECTRICITYDEPARTMENTS
STATEELECTRICITYINSPECTION
ORGANISATION
MINISTRY ORDEPARTMENT OF
POWER
STATEGOVERNMENT
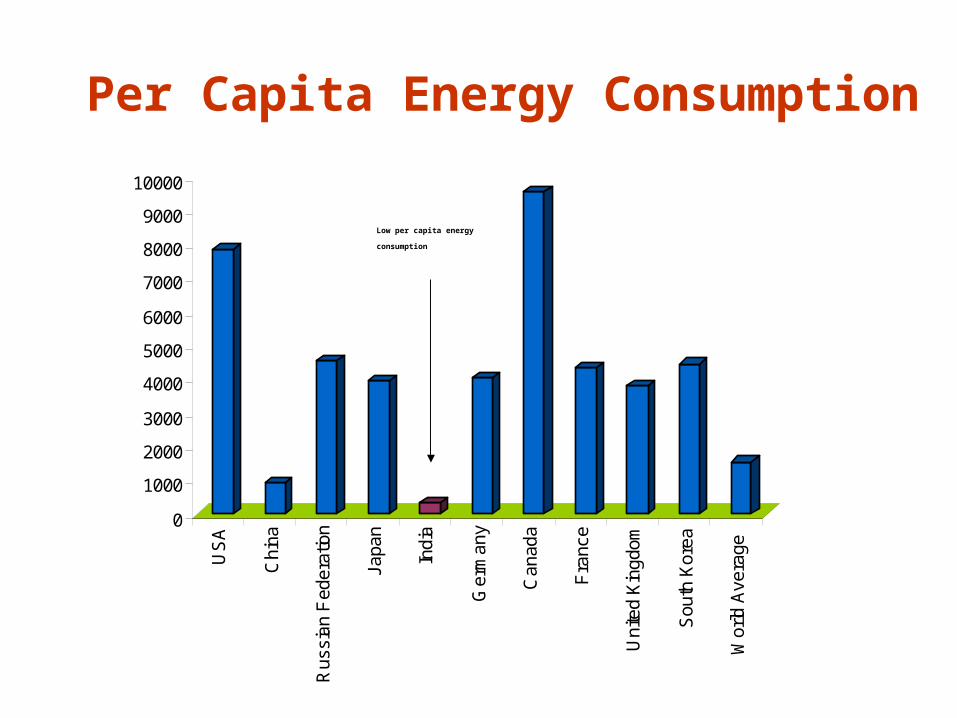
Per Capita Energy Consumption
0
1000
2000
3000
4000
5000
6000
7000
8000
9000
10000
US
A
Chi
na
Rus
sian
Fed
erat
ion
Japa
n
Indi
a
Ger
man
y
Can
ada
Fra
nce
Uni
ted
Kin
gdom
Sou
th K
orea
Wor
ld A
vera
ge
Low per capita energy
consumption
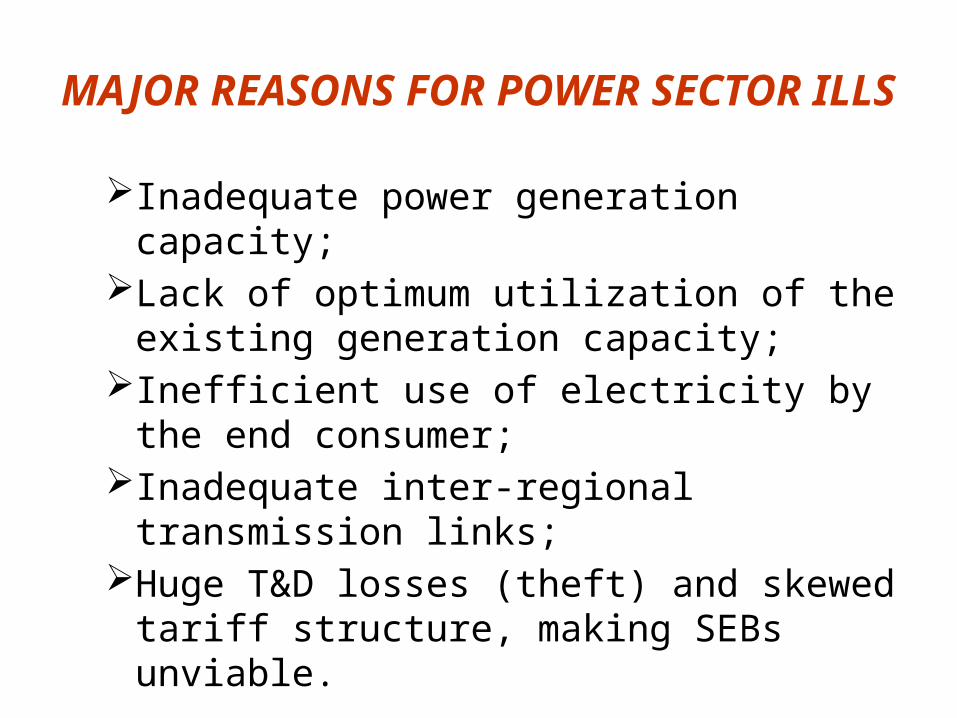
MAJOR REASONS FOR POWER SECTOR ILLS
Inadequate power generation capacity; Lack of optimum utilization of the existing
generation capacity; Inefficient use of electricity by the end consumer; Inadequate inter-regional transmission links; Huge T&D losses (theft) and skewed tariff
structure, making SEBs unviable.
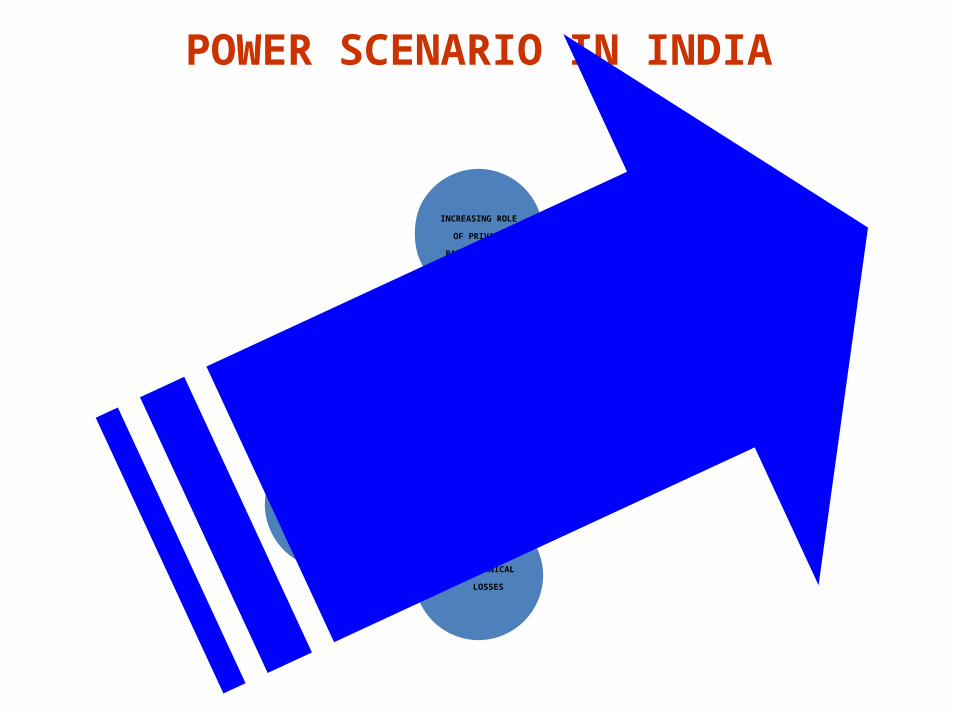
POWER SCENARIO IN INDIA
BOOMING
ENERGY
DEMAND
INCREASING ROLE
OF PRIVATE
PARTICIPATION
LIBERALISATION
FROM GOVERNMENT
HUGE TECHNICAL
LOSSES
HUGE NON
TECHNICAL
LOSSES
Thank you!