Embed Size (px)
Citation preview

Energy Services Coalition(ESC)
Energy Savings StrategiesEnergy Savings Strategies in Water and Wastewater
Lincoln Trail ADD, September 16, 2013Lincoln Trail ADD, September 16, 2013Kentucky Dam Village , September 17, 2013
Northern Kentucky ADD, September 23, 2013Cumberland Valley ADD, September 24, 2013
Gate a ADD September 25 2013Gateway ADD, September 25, 2013
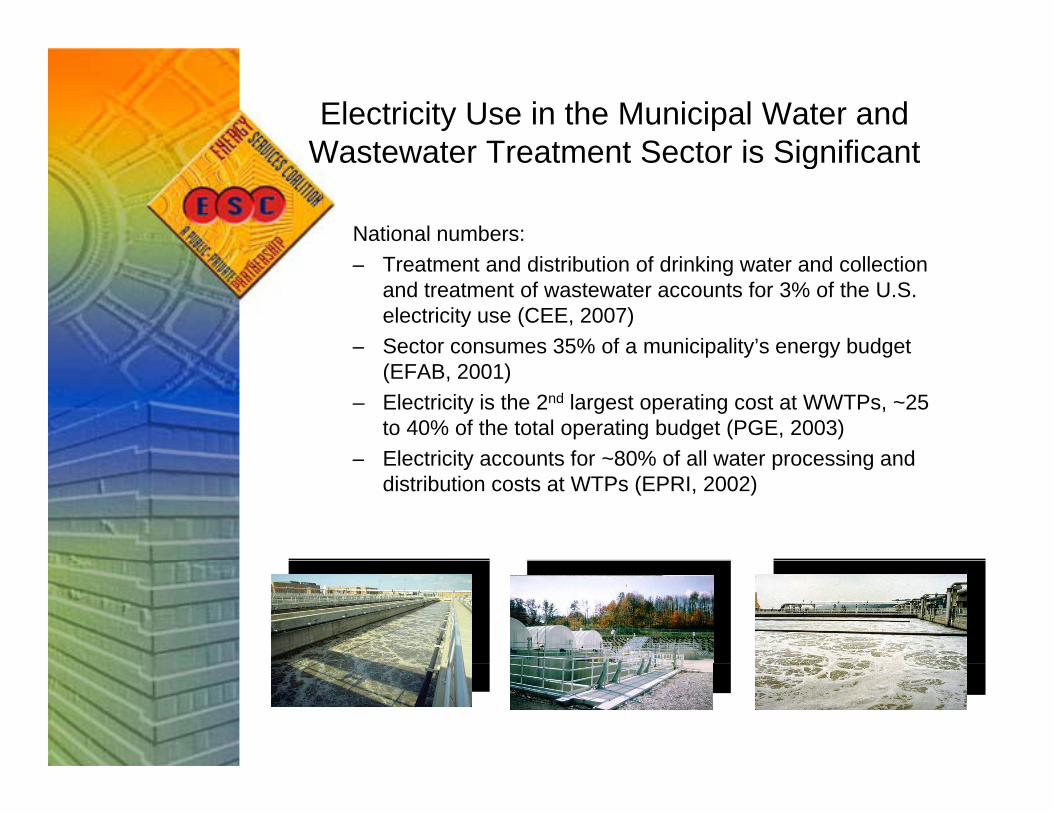
Electricity Use in the Municipal Water and Wastewater Treatment Sector is SignificantWastewater Treatment Sector is Significant
National numbers:– Treatment and distribution of drinking water and collection
and treatment of wastewater accounts for 3% of the U.S. electricity use (CEE, 2007)
– Sector consumes 35% of a municipality’s energy budget p y gy g(EFAB, 2001)
– Electricity is the 2nd largest operating cost at WWTPs, ~25 to 40% of the total operating budget (PGE, 2003)Electricity accounts for ~80% of all water processing and– Electricity accounts for ~80% of all water processing and distribution costs at WTPs (EPRI, 2002)

…But Provides a Great Opportunitypp y
– Preliminary estimates indicate an energy savings potential f 15 t 35% ti t 15 billi t 30 billiof 15 to 35% equating to 15 billion to over 30 billion
kWh/year ($1.1B to $2.3B per year)– Assuming an average simple payback of 10-years, that’s
$11B to $23B in capital projects that can be funded through electricity savings
– A typical 3 MGD activated sludge wastewater treatment plant can often reduce electricity costs by $30,000 per year or more with basic, proven upgrades , p pg
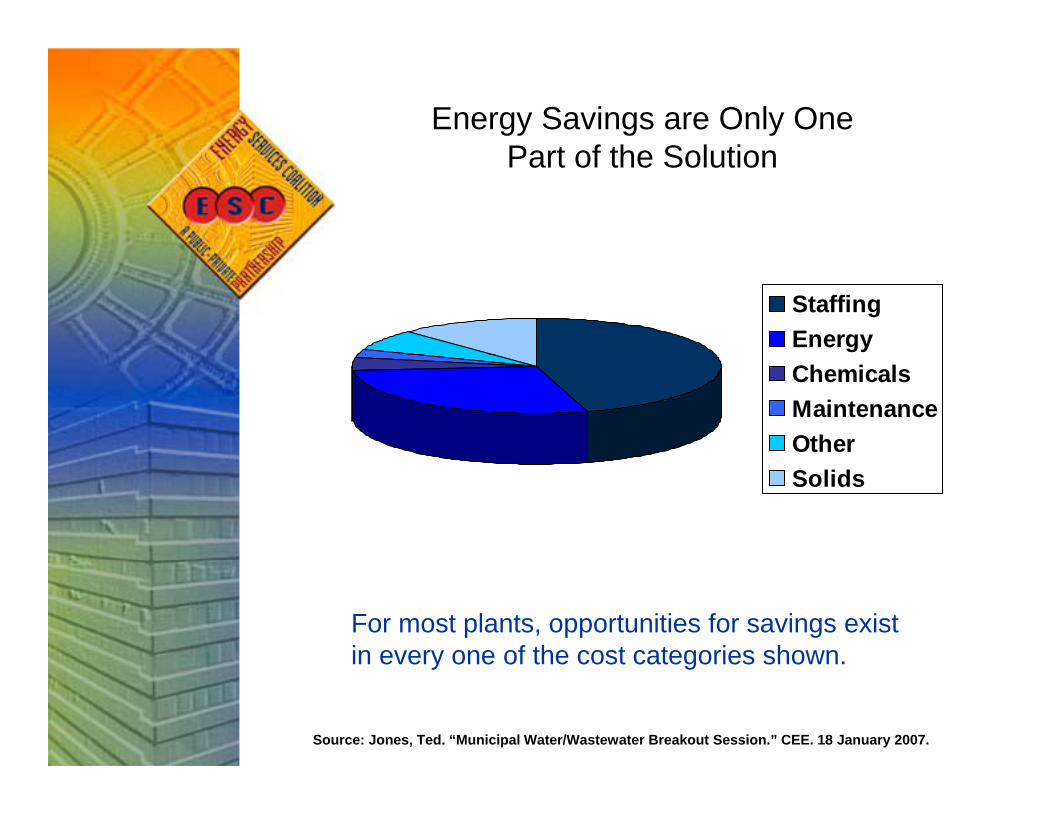
Energy Savings are Only One P t f th S l tiPart of the Solution
StaffingEnergyChemicalsMaintenanceOtherSolids
For most plants, opportunities for savings exist in every one of the cost categories shown.
Source: Jones, Ted. “Municipal Water/Wastewater Breakout Session.” CEE. 18 January 2007.
in every one of the cost categories shown.
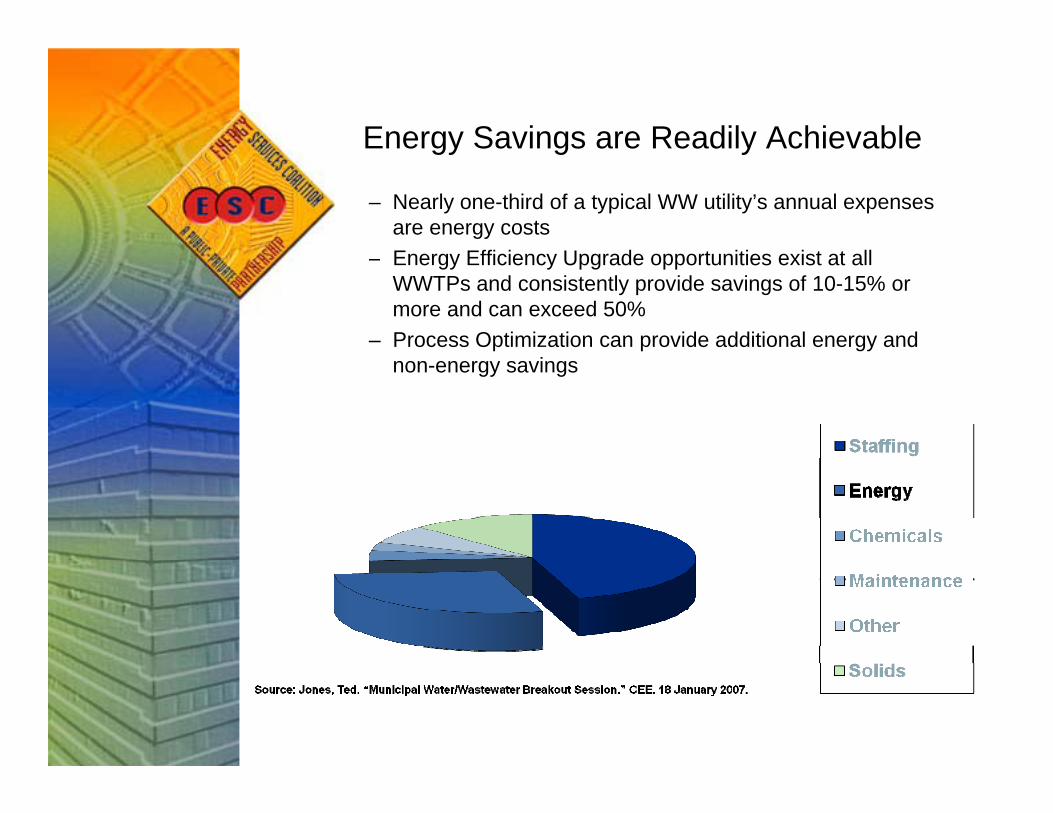
Energy Savings are Readily Achievablegy g y
– Nearly one-third of a typical WW utility’s annual expenses are energy costsE Effi i U d t iti i t t ll– Energy Efficiency Upgrade opportunities exist at all WWTPs and consistently provide savings of 10-15% or more and can exceed 50%
– Process Optimization can provide additional energy and non-energy savings

Driving Change – Today’s Issuesg g y
• Regulations– Disinfection– Nutrient Removal (Phosphorus and Nitrogen)– Biosolids Management– Stormwater Bypass
R A li ti– Reuse Applications• Aging Infrastructure
– Population growth – increase in capacity– Resident complaints – odor controlResident complaints odor control– Equipment aging – run to fail
• Energy and Operational Costs– Utility rates are on the rise– Hauling/Tipping fees going up– Safety Concerns

Energy & Operational Costsgy p
• ALL Energy and Operational Costs should be reviewed frequently for your plant, including:
El t i Bill– Electric Bills– Natural Gas Bills– Potable Water Bills
T t ti I i ( l d h li /h dli )– Transportation Invoices (sludge hauling/handling)– Permit Violation Fines– Equipment Maintenance Invoices

Your Utility BillYour Utility Bill
• Bill Paid by the City– Operator may never see the billsOperator may never see the bills
• Your Rate Structure– Base Charges (Minimum Monthly Bill)– Demand Charges (per kW)Demand Charges (per kW)– Consumption Charges (per kWh)– Time-of-Use Charges (On and Off-Peak)– Power Factor CorrectionPower Factor Correction – Taxes and Credits
• Your Utility Company– Schedule a consultation to make sure you are on theSchedule a consultation to make sure you are on the
correct rate structure– Rebates/Incentives may be available for plant
improvements and interruptible service
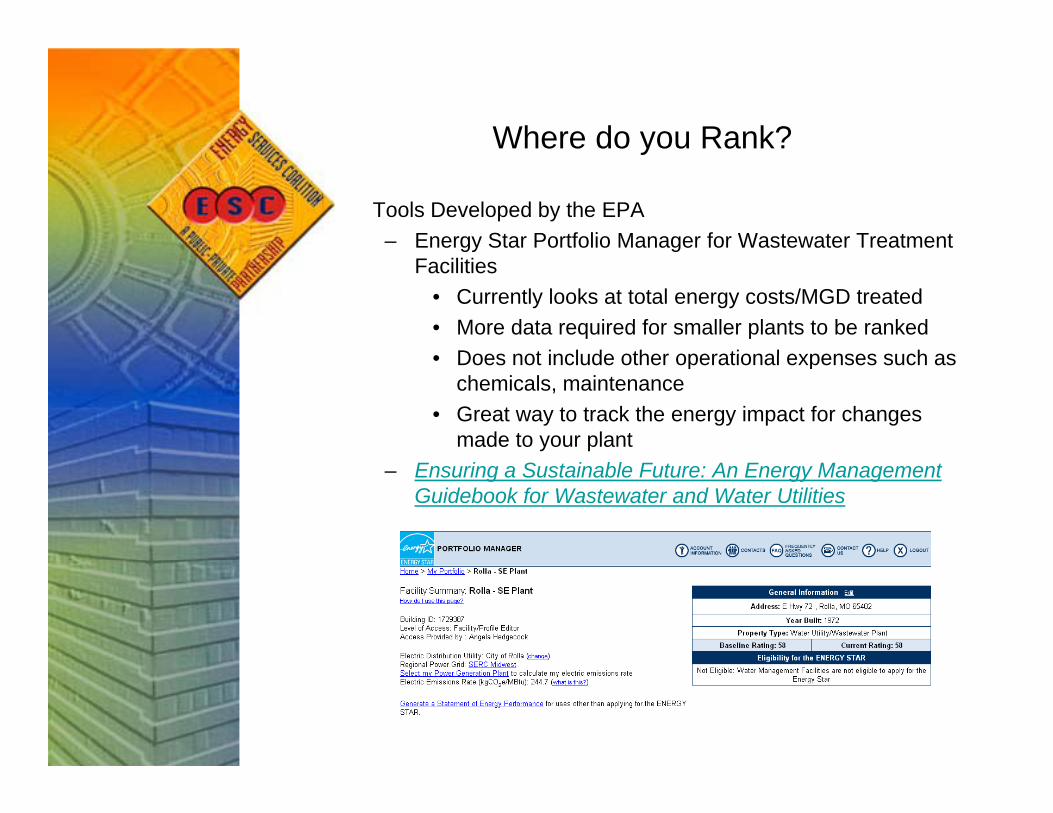
Where do you Rank?y
Tools Developed by the EPA– Energy Star Portfolio Manager for Wastewater Treatment
Facilities• Currently looks at total energy costs/MGD treated• More data required for smaller plants to be ranked• Does not include other operational expenses such as• Does not include other operational expenses such as
chemicals, maintenance• Great way to track the energy impact for changes
made to your plant– Ensuring a Sustainable Future: An Energy Management
Guidebook for Wastewater and Water Utilities
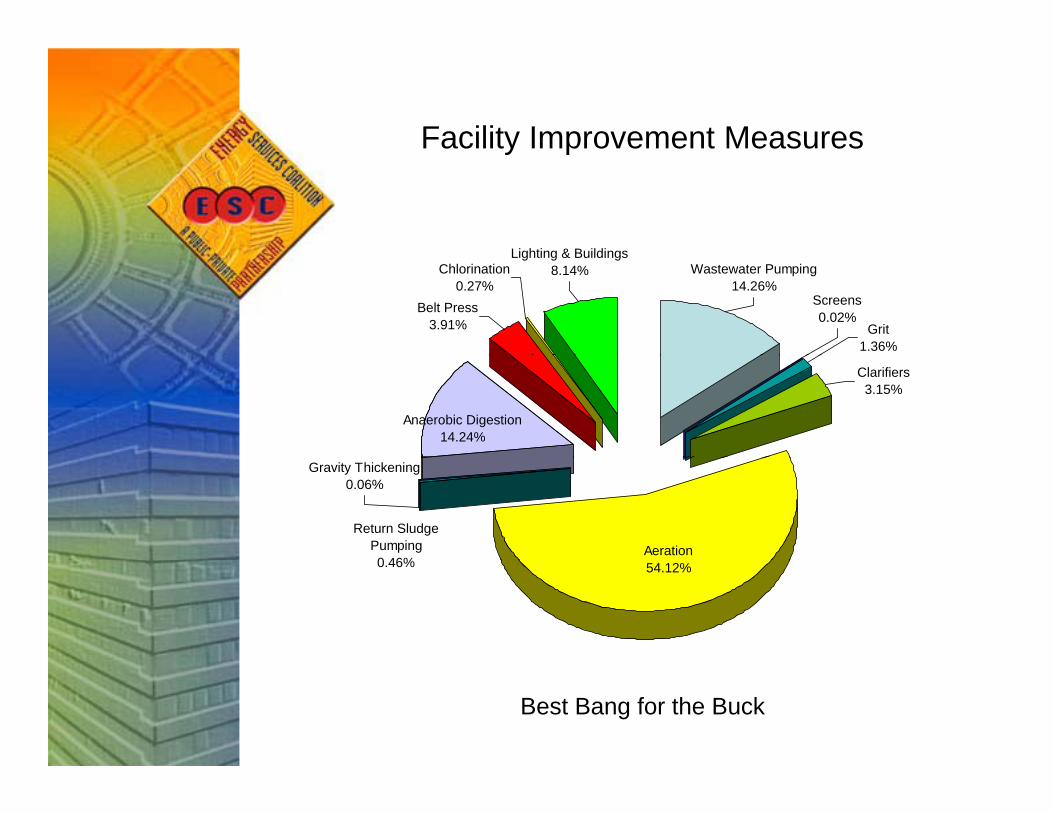
Facility Improvement Measures y p
Lighting & Buildings
Screens0.02%
Lighting & Buildings8.14%
Grit1.36%
Chlorination0.27%
Belt Press3.91%
Wastewater Pumping14.26%
Clarifiers3.15%
Anaerobic Digestion14.24%
Aeration
Gravity Thickening0.06%
Return Sludge Pumping0 46% 54.12%0.46%
Best Bang for the Buck
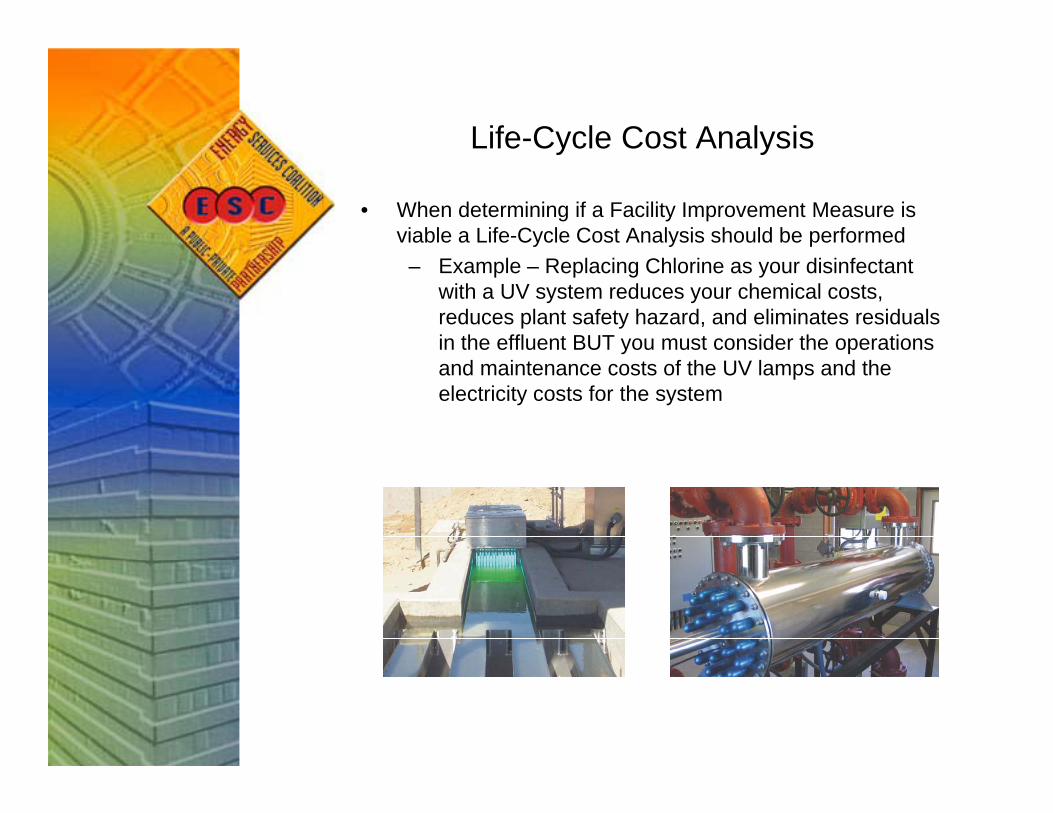
Life-Cycle Cost Analysisy y
• When determining if a Facility Improvement Measure is viable a Life-Cycle Cost Analysis should be performed
– Example – Replacing Chlorine as your disinfectant with a UV system reduces your chemical costs, reduces plant safety hazard, and eliminates residuals in the effluent BUT you must consider the operations and maintenance costs of the UV lamps and the electricity costs for the system
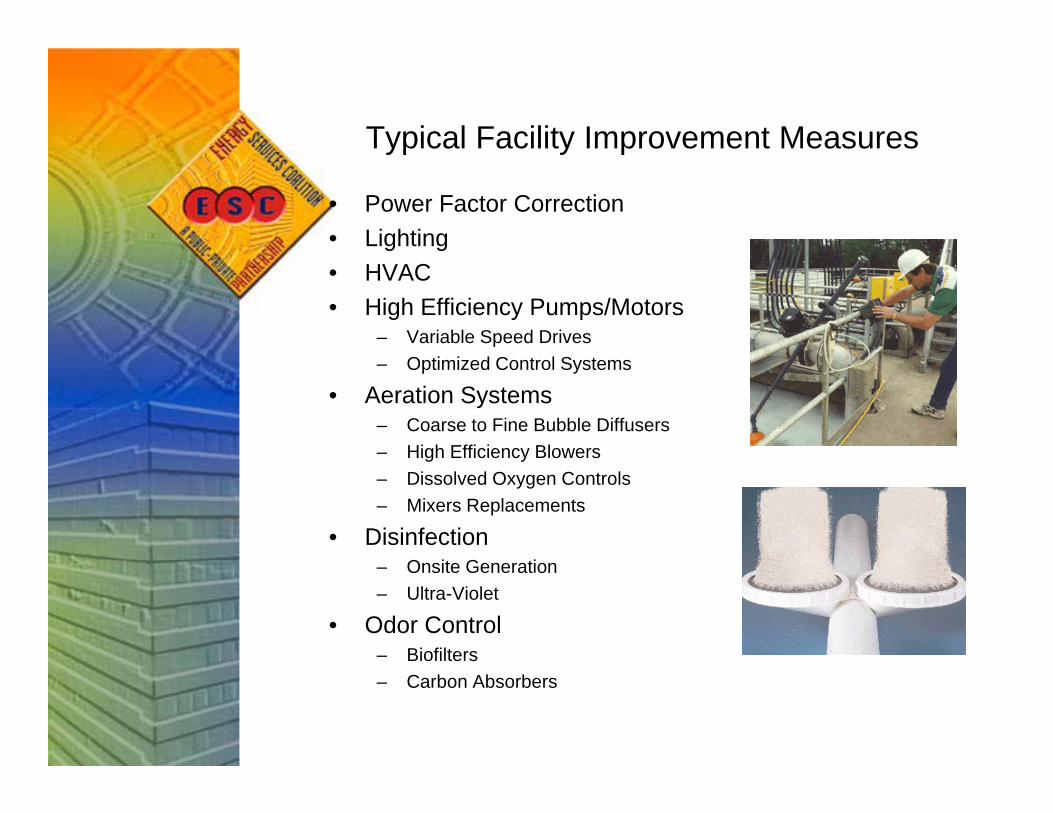
Typical Facility Improvement Measuresyp y p
• Power Factor Correction• Lighting• HVAC• High Efficiency Pumps/Motors
– Variable Speed Drives– Optimized Control Systems
• Aeration Systems– Coarse to Fine Bubble Diffusers– High Efficiency Blowersg c e cy o e s– Dissolved Oxygen Controls– Mixers Replacements
• Disinfection O it G ti– Onsite Generation
– Ultra-Violet
• Odor Control– Biofilters– Carbon Absorbers
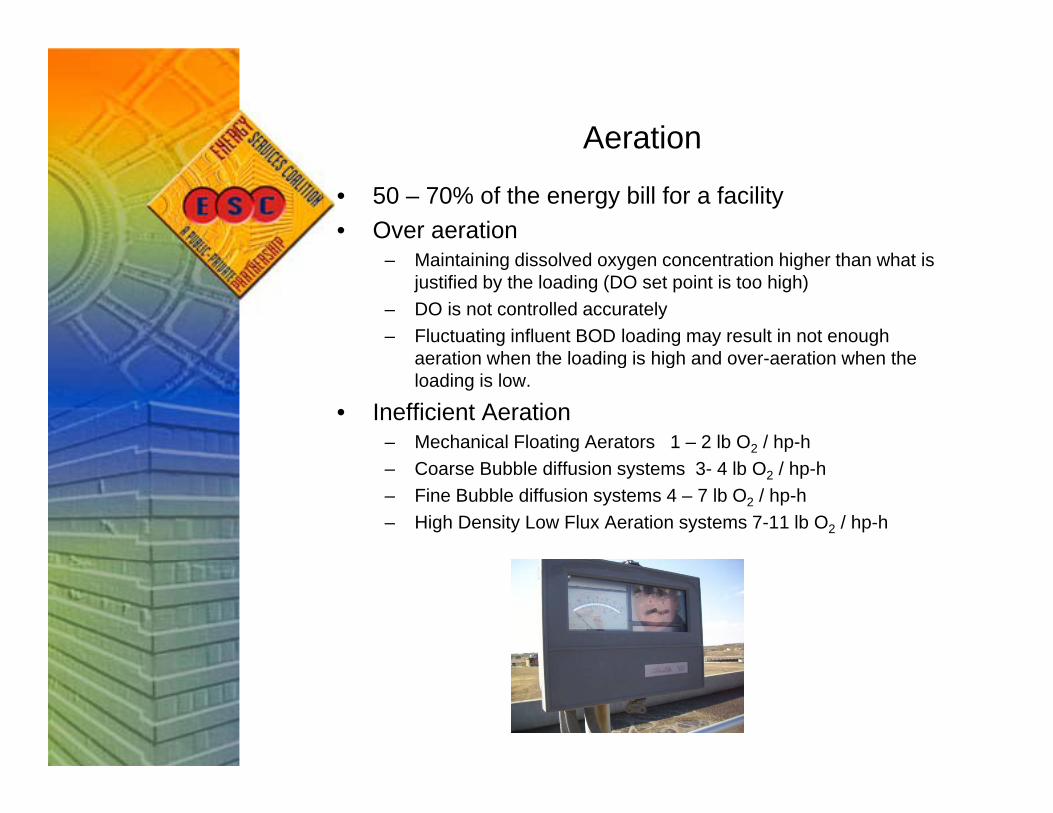
Aeration
• 50 – 70% of the energy bill for a facility• Over aeration
M i i i di l d i hi h h h i– Maintaining dissolved oxygen concentration higher than what is justified by the loading (DO set point is too high)
– DO is not controlled accurately– Fluctuating influent BOD loading may result in not enough
aeration when the loading is high and over aeration when theaeration when the loading is high and over-aeration when the loading is low.
• Inefficient Aeration– Mechanical Floating Aerators 1 – 2 lb O2 / hp-h– Coarse Bubble diffusion systems 3- 4 lb O2 / hp-h– Fine Bubble diffusion systems 4 – 7 lb O2 / hp-h– High Density Low Flux Aeration systems 7-11 lb O2 / hp-h

SolutionsSolutions• Over AerationOver Aeration
– Calculate how much oxygen you need.– No less than 0.9 and no more than 1.8 lb Oxygen per pound
of BOD removed– Dissolved Oxygen Controls
DO• DO sensors • Spatial arrangement of DO sensors to match the
mixing profiles within the reactor• Implementation of a rigorous maintenance and
calibration program for DO sensors
• Inefficient Aeration– Select an appropriate diffuser configuration– Determine mixing requirementsDetermine mixing requirements– Determine flow and pressure requirements for
delivering the calculated amount of oxygen– Select an appropriately sized blower
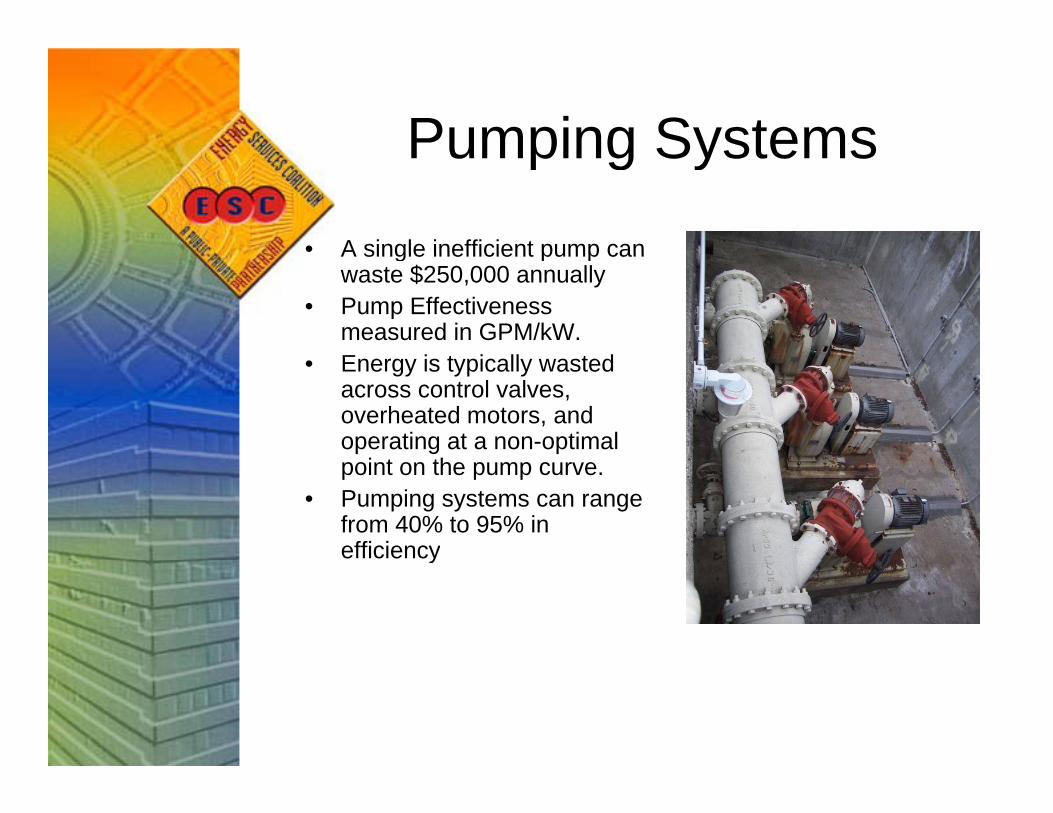
Pumping SystemsPumping Systems
• A single inefficient pump canA single inefficient pump can waste $250,000 annually
• Pump Effectiveness measured in GPM/kW. E i t i ll t d• Energy is typically wasted across control valves, overheated motors, and operating at a non-optimal
i hpoint on the pump curve.• Pumping systems can range
from 40% to 95% in efficiencyy

Pumping Systemsp g y
• Pumps operate most efficiently at a specific combination of head and flow rate.
• VFDs most appropriate for• VFDs most appropriate for varying flow and low head conditions.
• Correct pump sizing most p p gappropriate for constant flow and high head conditions – impeller trim may be appropriatemay be appropriate
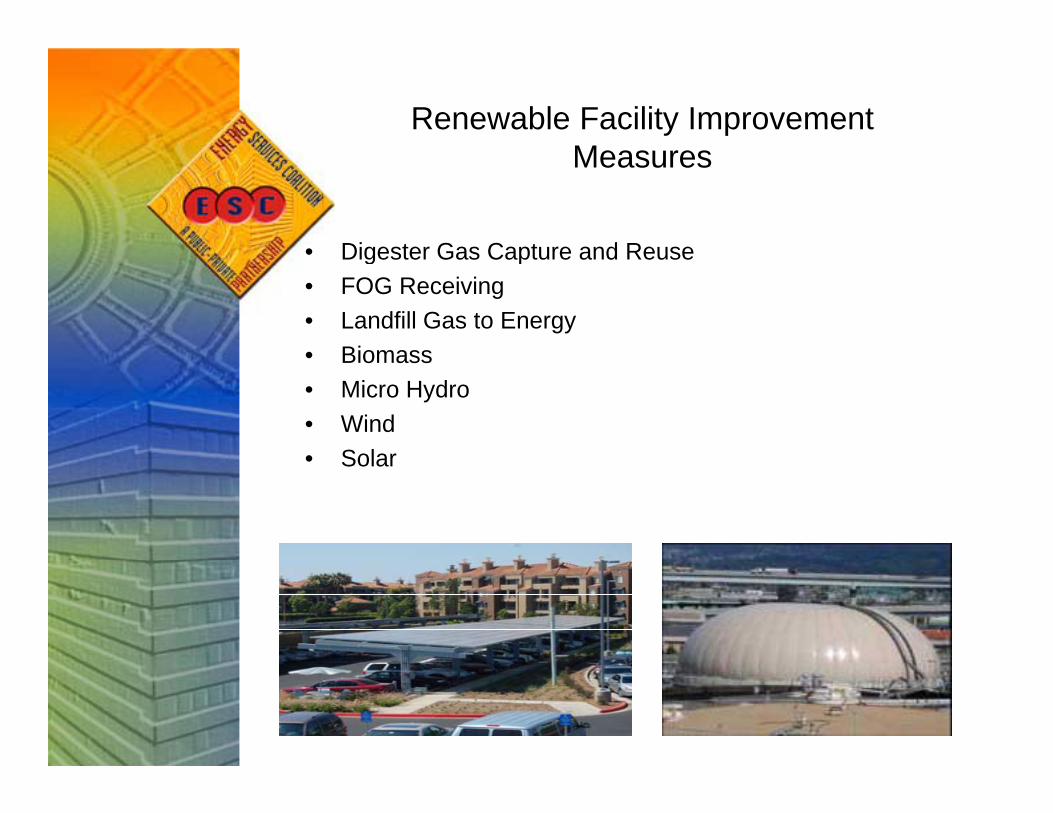
Renewable Facility Improvement MMeasures
• Digester Gas Capture and Reuse• Digester Gas Capture and Reuse• FOG Receiving• Landfill Gas to Energy• Biomass• Biomass• Micro Hydro• Wind• Solar• Solar
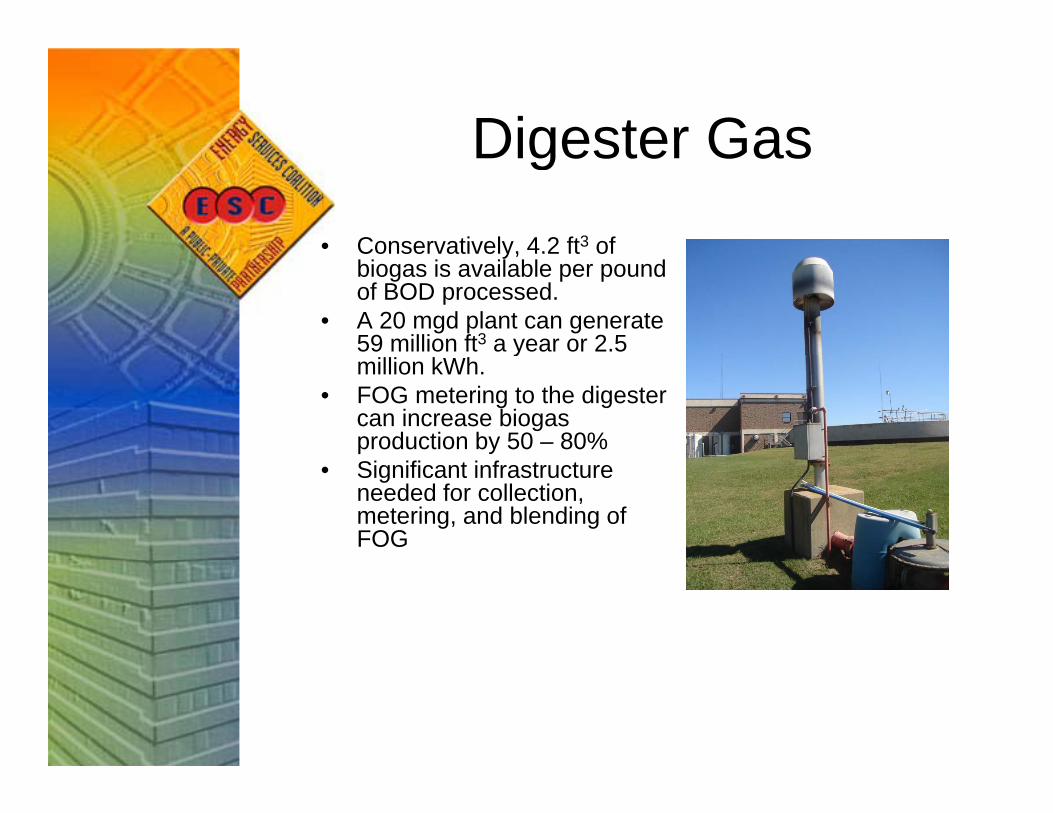
Digester GasDigester Gas • Conservatively, 4.2 ft3 ofConservatively, 4.2 ft of
biogas is available per pound of BOD processed.
• A 20 mgd plant can generate 59 million ft3 a year or 2.5 ymillion kWh.
• FOG metering to the digester can increase biogas production by 50 – 80%
• Significant infrastructure needed for collection, metering, and blending of FOG
Questions ?Questions ?
![Energy Savings Strategies in WWTP 07-11.ppt...Microsoft PowerPoint - Energy Savings Strategies in WWTP 07-11.ppt [Compatibility Mode] Author: AzzaraM Created Date: 9/10/2013 10:12:32](https://img.pdfslide.us/doc/110x75/6042b37418e85300bf5d5973/energy-savings-strategies-in-wwtp-07-11ppt-microsoft-powerpoint-energy-savings.jpg)