Embed Size (px)
Citation preview

PG&E’s Emerging Technologies Program ET13PGE1441
Energy Savings of Tier 2 Advanced Power Strips
in Residential AV Systems
Project Number ET13PGE1441
Prepared For: Oriana Tiell and Philip Broaddus Pacific Gas and Electric Company 77 Beale Street San Francisco, CA 94105 Prepared By: M M Valmiki and Antonio Corradini AESC, Inc. 5927 Balfour Court, Suite 213 Carlsbad, California 92008
Issued: February 2016
Copyright, 2016, Pacific Gas and Electric Company. All rights reserved.

1
PG&E’s Emerging Technologies Program ET13PGE1441
ACKNOWLEDGEMENTS
Pacific Gas and Electric Company’s Emerging Technologies Program is responsible for this
project. It was developed as part of Pacific Gas and Electric Company’s Emerging Technology
program under internal project number ET13PGE1441. AESC, Inc. conducted this technology
evaluation for Pacific Gas and Electric Company with overall guidance and management from
Oriana Tiell. Techniart managed the parallel scaled field placement effort and customer
feedback surveying. The study was conducted in SDG&E territory under the guidance and
management of Matt Smith. For more information on this project, contact Oriana Tiell at
PG&E and AESC would like to thank all the host customers for their assistance and
cooperation. Without their gracious volunteering, this study would not have been possible.
Additionally, thanks and acknowledgments are due to CalPlug, Techniart, Illume, RMS Energy
Consulting, and the manufacturers for their support, dedication to energy conservation, and
ongoing efforts to provide energy efficiency products to the marketplace.
LEGAL NOTICE
This report was prepared for Pacific Gas and Electric Company for use by its employees and
agents. Neither Pacific Gas and Electric Company nor any of its employees and agents:
(1) makes any written or oral warranty, expressed or implied, including, but not limited to
those concerning merchantability or fitness for a particular purpose;
(2) assumes any legal liability or responsibility for the accuracy, completeness, or usefulness
of any information, apparatus, product, process, method, or policy contained herein; or
(3) represent that its use would not infringe any privately owned rights, including, but not
limited to, patents, trademarks, or copyrights.

2
PG&E’s Emerging Technologies Program ET13PGE1441
Abbreviations and Acronyms
AESC Alternative Energy Systems Consulting
APS Advanced power strip
AV Audio/video – specifically refers to residential entertainment system
CalPlug California Plug Load Research Center
CPUC California Public Utilities Commission
DEER Database for Energy Efficient Resources
EE Energy efficiency
ET Emerging technologies
EUL Estimated useful life
IOU Investor owned utility
IPMVP International Performance Measurement and Verification Protocol
IR Infrared
MFR Multi-family residence
M&V Measurement and verification
OS Occupancy sensor
PG&E Pacific Gas and Electric
RF Radio frequency
SDG&E San Diego Gas and Electric
SFR Single-family residence
SVS Savings verification system
3
PG&E’s Emerging Technologies Program ET13PGE1441
Contents
EXECUTIVE SUMMARY _____________________________________________________ 6
INTRODUCTION __________________________________________________________ 8
Assessment Objectives ............................................................ 9
Background ............................................................................ 9
Current Technology ............................................................... 10
EMERGING TECHNOLOGY _________________________________________________ 12
Emerging Technology Description ............................................ 12
IR Model ......................................................................... 13 IR-OS Model .................................................................... 15
Tier 2 APS Literature Survey ................................................... 16
Target Markets and Barriers ................................................... 17
TECHNICAL APPROACH AND TEST METHODOLOGY ______________________________ 19
Host Sites ............................................................................ 20
Instrumentation .................................................................... 21
Test Plan: Baseline ................................................................ 24
Test Plan: Simulated Savings .................................................. 25
Test Plan: Pre-Post Savings .................................................... 26
Survey Plan .......................................................................... 27
RESULTS_______________________________________________________________ 28
Energy and Demand Savings .................................................. 28
Survey Results ...................................................................... 34
Market Potential .................................................................... 34
DISCUSSION AND CONCLUSIONS ___________________________________________ 36
Recommendations ................................................................. 37
APPENDICES ___________________________________________________________ 38
Appendix 1: Monitoring Period Length and Variability ................. 38
Appendix 2: Sensitivity to Active Shutdown Timer Setting .......... 42
Appendix 3: Survey of M&V Host Sites ..................................... 43
Appendix 4: Scaled Field Placement Survey Report .................... 45
Appendix 4-A: IR and IR-OS Model Surveys ........................ 70 Appendix 4-B: Weighted Household Characteristics .............. 87 Appendix 4-C: IR Model Findings ........................................ 90 Appendix 4-D: IR-OS Model Findings .................................. 96
REFERENCES __________________________________________________________ 102

4
PG&E’s Emerging Technologies Program ET13PGE1441
Figures Figure 1 – Residential plug load end-uses, excluding kitchen
appliances and most lighting (Peters, 2010) .................... 9
Figure 2 - Residential AV plug load consumption trend (Conti,
2014) ....................................................................... 10
Figure 3 - IR wall pack example arrangement and strip model ......... 14
Figure 4 - IR-OS model ............................................................... 15
Figure 5 - IR-OS model control logic ............................................. 16
Figure 6 - Phase 1 instrumentation ............................................... 22
Figure 7 - Verification of SVS unit accuracy ................................... 23
Figure 8 – Phase 2 instrumentation .............................................. 24
Figure 9 - Example of simulated savings calculation using
measured baseline power and IR-OS signals .................. 26
Figure 10 - Annual baseline usage as a function of AV system
power at full load ....................................................... 28
Figure 11 - Usage and savings for the IR model default setting
during Phase 1 (note 60 minute timer + 10 minute
warning delay for active shutdown) .............................. 29
Figure 12 - Usage and savings for each APS model default setting
during Phase 2 (note 75 IR-OS timer includes 3 minute
active shutdown delay and 60 minute IR timer includes
10 minute delay) ........................................................ 29
Figure 13 - Savings as function of AV system power ....................... 31
Figure 14 - Comparison of simulated and pre-post savings (red line
indicating perfect unity agreement) .............................. 32
Figure 15 - Baseline demand and demand reduction ....................... 33
Figure 16 - Weekday baseline demand profile and hourly demand
reduction (IR Model) ................................................... 33
Figure 17 - Weekday baseline demand profile and hourly demand
reduction (IR-OS model) ............................................. 34
Figure 18 - Baseline period duration for each site ........................... 38
Figure 19 - Post period duration for each site ................................. 38
Figure 20 - Baseline usage with 90% confidence intervals based on
daily variation, where possible ..................................... 39
Figure 21 - Post annual usage with 90% confidence intervals based
on daily variation, where possible ................................. 39
Figure 22 - Simulated savings with 90% confidence intervals based
on daily variation, where possible ................................. 40
5
PG&E’s Emerging Technologies Program ET13PGE1441
Figure 23 - Daily uses and use time for Phase 2 IR-OS Pre-Post
testing ...................................................................... 40
Figure 24 - Daily uses and use time for Phase 1 IR Pre-Post testing .. 41
Figure 25 - Savings for a range of timer settings ............................ 42
Tables Table 1 - AV and PC device frequency per US home (Kessler, 2011) . 10
Table 2 - Literature survey of Tier 1 APS Savings ........................... 11
Table 3 - IR and IR-OS model features ......................................... 13
Table 4 - Literature survey Tier 2 APS savings .............................. 17
Table 5 - Estimated market size ................................................... 17
Table 6 - Methods applied during each phase for each APS model .... 19
Table 7 – M&V host site population, demographics, and dataset
sizes for combined Phase 1 and 2 ................................. 20
Table 8 – Phase 1 instrumentation ............................................... 21
Table 9 - Phase 2 instrumentation ................................................ 23
Table 10 - Baseline usage and savings for each phase, each model,
and combined phases ................................................. 30
Table 11 – Baseline demand and demand reduction........................ 32
Table 12 - Estimated California and IOU market potential with
100% penetration, accounting for persistence rate ......... 35
Table 13 - Demographics of IR simulated site population and pre-
post testing sample population .................................... 41

6
PG&E’s Emerging Technologies Program ET13PGE1441
EXECUTIVE SUMMARY
PROJECT GOAL
This project was designed to assess the energy savings potential of Tier 2 advanced power
strips (APS) in residential audio/video (AV) applications and to support market adoption of
the technology. The project goals were to measure and quantify the energy savings and
demand reduction associated with Tier 2 APS devices, their usability, and customer
acceptance. The study was motivated by the large, unaddressed standby energy consumption
of consumer electronics and the potential to contribute towards California’s strategic energy
efficiency goals. The results could inform program development, consumers, product design,
and help increase APS adoption.
PROJECT DESCRIPTION
In this study, two Tier 2 APS models with similar control strategies were studied in 98
residential homes in SDG&E territory. However, the results are not intended as a product
comparison, but rather to provide information on Tier 2 APS products in general. One model
uses infrared (IR) remote control sensing and power monitoring of the total controlled AV load
as the input for user activity while the other uses IR signals and occupancy sensing (IR-OS)
along with monitoring of the TV receptacle power. Both models eliminate standby loads of
controlled AV devices and save additional energy by cutting power when no user activity is
detected for a default timer setting. The field study was conducted over two phases (phase 1
report published under ET14SDG8031) which determined energy savings and demand
reduction using two alternative methods: a simulated savings approach and a pre-post
installation approach.
During a baseline period AV load, remote control IR signals and OS signals are recorded on
an interval basis. The simulated approach uses the baseline energy usage data and user
activity signals to calculate what the savings would have been if the APS had been active.
This is done by simulating the control strategy on the baseline data. After the baseline period
is complete, the APS is installed or activated, initiating the post-installation period. During the
post period, AV load is recorded on the same interval basis in order to establish consumption
and load when with the APS is active. The pre-post method simply compares the load and
consumption before and after APS installation to determine savings.
Both methods complement each other in order to provide the best possible estimate of energy
savings in the typical residential home. The IR model was studied in phase 1 and phase 2 at
94 total sites using the simulated approach while pre-post monitoring was conducted during
phase 1 at 9 sites. The IR-OS model was studied in phase 2 using both the simulated and
pre-post methods at 52 and 56 sites, respectively. This report synthesizes the results from
both phases. In addition to the M&V field study, a scaled direct install field placement and
customer surveys were performed to gain insight into customer acceptance and direct
installation persistence.

7
PG&E’s Emerging Technologies Program ET13PGE1441
PROJECT RESULTS
The test results indicate that the technologies are successful at achieving energy savings and
demand reduction. Standby loads of controlled devices are greatly reduced and additional
savings are achieved by turning off AV systems when they have been left on but are not in
active use. The following table lists the annual baseline energy and savings of controlled AV
loads for each model using each savings estimate method.
Baseline usage
[kWh]
(N=98)
IR simulated
savings [kWh]
(N=94)
IR pre-post
savings [kWh]
(N=9)
IR-OS simulated
savings [kWh]
(N=52)
IR-OS pre-post
savings [kWh]
(N=56)
432 214 (50%) 125 (29%) 118 (27%) 110 (25%)
Demand savings were also calculated for the sites with on-peak demand reduction listed in
the following table.
Baseline on-peak
demand [W]
(N=98)
IR simulated on-
peak demand
reduction [W]
(N=94)
IR pre-post on-
peak demand
reduction [W]
(N=9)
IR-OS simulated
on-peak demand
reduction [W]
(N=52)
IR-OS pre-post
on-peak demand
reduction [W]
(N=56)
60 24 25 16 10
Installation and operation are simple and intuitive, contributing to a high rate of persistence
after installation. The customer surveys found that 84% of direct installed APS devices
remained in place 6-8 weeks after installation. Additionally, the majority of those surveyed
said they were satisfied or very satisfied with the product. Using these persistence rates and
the energy savings findings, the estimated California market potential with 100% market
penetration is about 2,700-5,010 GWh/year energy savings and 246-586 MW on-peak
demand reduction.
RECOMMENDATIONS
Based on the guaranteed energy savings with proper installation, high persistence rate, and
unaddressed wasteful energy use, Tier 2 APS devices should strongly be considered for
program implementation. Analysis of possible program design and delivery channels can
maximize the chances of a successful outcome. Based on interpretation of the methods and
results, program designers and evaluators will need to decide how to weight the results for
each method and model. The results are not intended as a product comparison and could
potentially be used in combination in order to have the largest sample size and best estimates.
Additionally, program evaluation and future M&V should consider using these findings and
standardized testing to mitigate the costs and complexities of field monitoring, should it be
required. The APS devices themselves will require continued development and modification
as consumer electronics evolve with new networking, control methods, and functions.

8
PG&E’s Emerging Technologies Program ET13PGE1441
INTRODUCTION The results presented in this report provide energy savings information on a class of
audio/video (AV) advanced power strips (APS). The study’s purpose is to help inform program
design, product development, public understanding, and future efforts. This work was
performed by Alternative Energy Systems Consulting (AESC) on behalf of Pacific Gas and
Electric’s (PG&E) Emerging Technologies (ET) program in cooperation with San Diego Gas and
Electric’s (SDG&E) ET program. AESC is an energy engineering practice specializing in energy
efficiency, utility programs, technology assessments, demand optimization, measurement
and verification, and other related subjects. The PG&E and SDG&E ET programs are dedicated
to increasing exposure, understanding, and the success of emerging or underutilized energy
efficiency and demand management technologies in support of California’s strategic energy
goals. Additionally, TechniArt, a longstanding utility program service and marketing provider,
performed and managed a direct install scaled field placement which resulted in customer
feedback which are integrated into this report.
The APS devices under study were designed to reduce wasted standby and excess energy
consumption of AV systems. Unnecessary standby loads, also sometimes called phantom or
vampire loads, are the small demands of plug-in electronic appliances and devices that exist
even though the devices are turned off. In most cases, these standby loads are not powering
any critical processes and therefore result in wasteful energy consumption, unnecessary
energy costs, and avoidable environmental impacts. Common devices with standby loads
include cell phone chargers, televisions, computer peripherals, cable boxes, coffee machines,
game consoles, printers, desktop computers, speakers, and other similar consumer products.
Although newer generations of products are slowly beginning to have embedded controls and
designs that improve energy efficiency, there remain few, well-known options to consumers
who wish to address this excess consumption in their homes. As such, there is definite market
potential for products that allow control and elimination of standby loads in common consumer
electronics. Two of the most common sets of consumer products with standby loads are
computer workstations and AV systems. This study explores the function, customer
acceptance, and benefits of two APS devices designed for simple integration into the AV
environment. These two APS devices are both categorized as Tier 2, a classification that
differentiates the product from Tier 1 which typically has a less complex control strategy.
9
PG&E’s Emerging Technologies Program ET13PGE1441
ASSESSMENT OBJECTIVES
The goals of this technology assessment were to identify the demand reduction, energy
savings, operational benefits, market potential, and qualitative characteristics of Tier 2 APS
devices used in residential AV applications. To this end, several objectives were established:
Measure and verify energy savings and demand reduction of Tier 2 APS devices using both
pre-post and simulated savings methods.
Perform statistical analysis of data to identify possible trends, correlations with various
demographic parameters, and statistical metrics.
Integrate survey results from parallel scaled field placement to determine market
potential.
Generate a technology assessment report and study that follows IPMVP standards.
In order to accomplish these objectives, an M&V plan was developed and implemented at host
customer sites in SDG&E territory during both project phases.
BACKGROUND
This report contains the findings from an ET effort that took place over two phases. Phase 1,
performed in 2014 for SDG&E, comprised a field trial of a Tier 2 APS with a control strategy
that uses infrared (IR) remote control signals and AV system power as the control algorithm
inputs. The Phase 1 report goes into great detail on the existing literature related to advanced
power strips and AV systems (Valmiki, 2015). In order to provide context, some of that
literature survey is reiterated here.
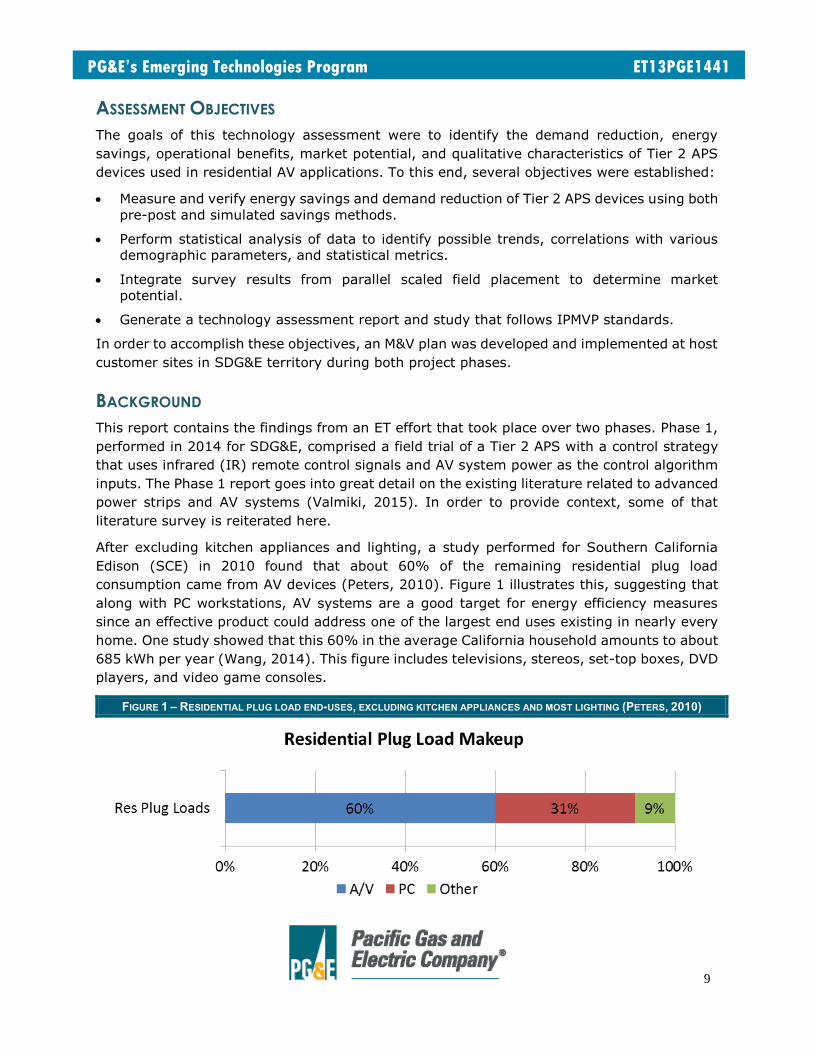
After excluding kitchen appliances and lighting, a study performed for Southern California
Edison (SCE) in 2010 found that about 60% of the remaining residential plug load
consumption came from AV devices (Peters, 2010). Figure 1 illustrates this, suggesting that
along with PC workstations, AV systems are a good target for energy efficiency measures
since an effective product could address one of the largest end uses existing in nearly every
home. One study showed that this 60% in the average California household amounts to about
685 kWh per year (Wang, 2014). This figure includes televisions, stereos, set-top boxes, DVD
players, and video game consoles.
FIGURE 1 – RESIDENTIAL PLUG LOAD END-USES, EXCLUDING KITCHEN APPLIANCES AND MOST LIGHTING (PETERS, 2010)
10
PG&E’s Emerging Technologies Program ET13PGE1441
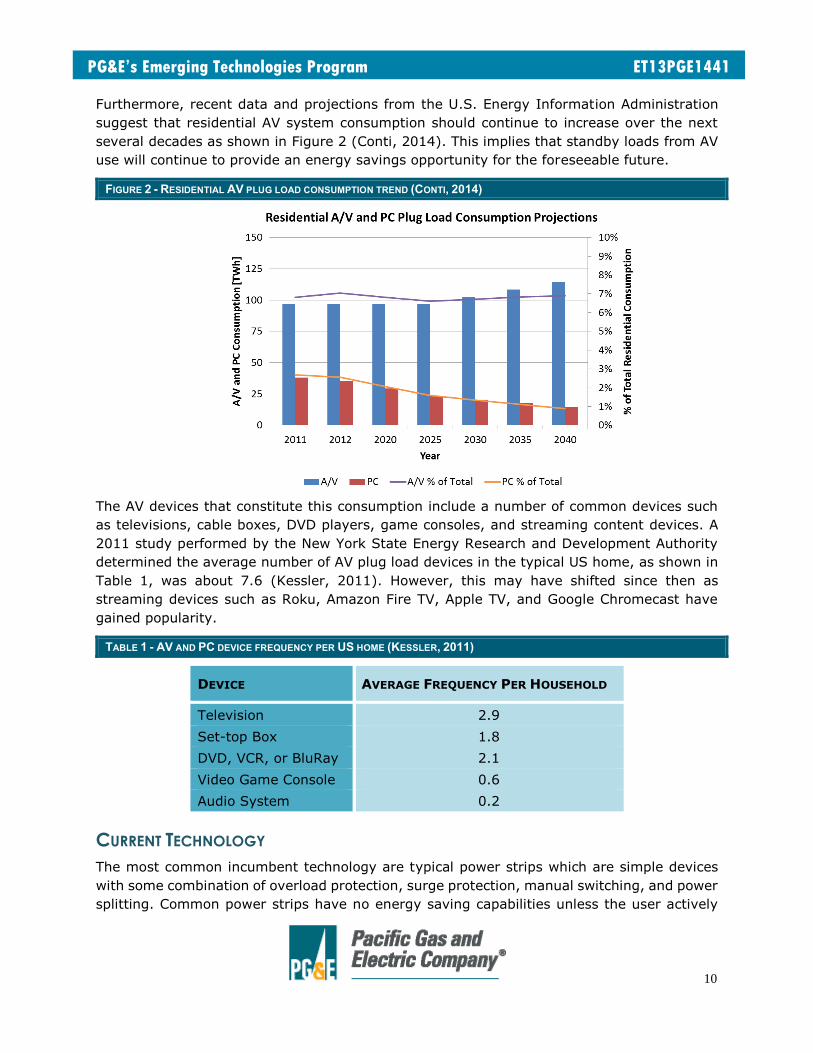
Furthermore, recent data and projections from the U.S. Energy Information Administration
suggest that residential AV system consumption should continue to increase over the next
several decades as shown in Figure 2 (Conti, 2014). This implies that standby loads from AV
use will continue to provide an energy savings opportunity for the foreseeable future.
FIGURE 2 - RESIDENTIAL AV PLUG LOAD CONSUMPTION TREND (CONTI, 2014)
The AV devices that constitute this consumption include a number of common devices such
as televisions, cable boxes, DVD players, game consoles, and streaming content devices. A
2011 study performed by the New York State Energy Research and Development Authority
determined the average number of AV plug load devices in the typical US home, as shown in
Table 1, was about 7.6 (Kessler, 2011). However, this may have shifted since then as
streaming devices such as Roku, Amazon Fire TV, Apple TV, and Google Chromecast have
gained popularity.
TABLE 1 - AV AND PC DEVICE FREQUENCY PER US HOME (KESSLER, 2011)
DEVICE AVERAGE FREQUENCY PER HOUSEHOLD
Television 2.9
Set-top Box 1.8
DVD, VCR, or BluRay 2.1
Video Game Console 0.6
Audio System 0.2
CURRENT TECHNOLOGY
The most common incumbent technology are typical power strips which are simple devices
with some combination of overload protection, surge protection, manual switching, and power
splitting. Common power strips have no energy saving capabilities unless the user actively
11
PG&E’s Emerging Technologies Program ET13PGE1441
turns the strip off when connected plug loads are not in use. This type of strip is present in
the vast majority of AV applications.
Tier 1 APS devices designed to reduce standby loads are available to consumers and have
been included in some utility program efforts. However, their market penetration remains low
and studies have shown that savings are not as high as their Tier 2 counterparts. Tier 1 APS
devices generally utilize one of the following energy savings strategies:
Timeclock programming
Occupancy sensor (OS)
Master/controlled
The timeclock programmed power strip uses manually-programmed schedules to determine
when controlled receptacles should be energized. This type of APS is best suited to an office
workstation or appliances that have regular schedules of use. The OS approach uses an
occupancy sensor to determine when a user is present. When a user is detected, the
equipment will remain energized for use. When no motion is detected for a certain amount of
time (30 minutes, for example), all controlled equipment will be de-energized. The last and
most common type of Tier 1 APS is the current sensing, master/controlled design. This type
of APS has a master receptacle which is monitored by current-sensing instrumentation. When
the master device current drops below a certain threshold, it is assumed to be in standby or
turned off. When this happens, the controlled receptacles are all de-energized. This strategy
typically uses the television or computer as the master device and assumes that all peripheral
devices are unused whenever the computer or television is off.
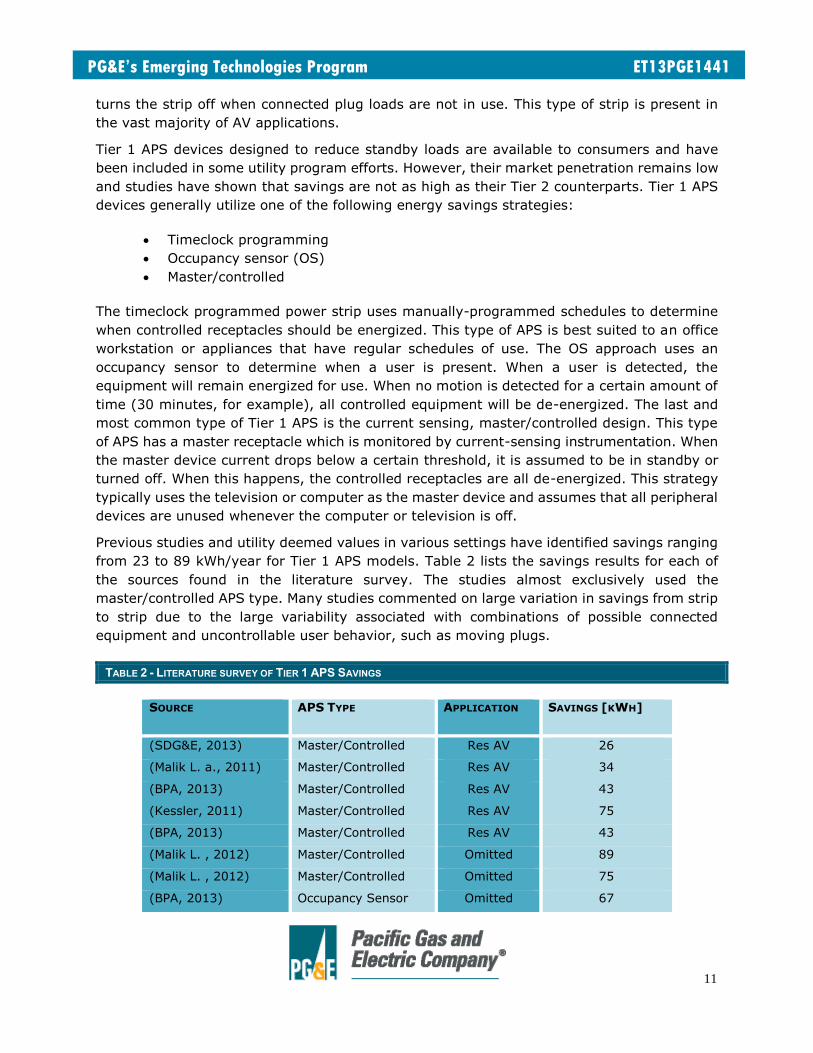
Previous studies and utility deemed values in various settings have identified savings ranging
from 23 to 89 kWh/year for Tier 1 APS models. Table 2 lists the savings results for each of
the sources found in the literature survey. The studies almost exclusively used the
master/controlled APS type. Many studies commented on large variation in savings from strip
to strip due to the large variability associated with combinations of possible connected
equipment and uncontrollable user behavior, such as moving plugs.
TABLE 2 - LITERATURE SURVEY OF TIER 1 APS SAVINGS
SOURCE APS TYPE APPLICATION SAVINGS [KWH]
(SDG&E, 2013) Master/Controlled Res AV 26
(Malik L. a., 2011) Master/Controlled Res AV 34
(BPA, 2013) Master/Controlled Res AV 43
(Kessler, 2011) Master/Controlled Res AV 75
(BPA, 2013) Master/Controlled Res AV 43
(Malik L. , 2012) Master/Controlled Omitted 89
(Malik L. , 2012) Master/Controlled Omitted 75
(BPA, 2013) Occupancy Sensor Omitted 67
12
PG&E’s Emerging Technologies Program ET13PGE1441
EMERGING TECHNOLOGY
EMERGING TECHNOLOGY DESCRIPTION
The emerging technology under study is the Tier 2 APS product class. Two models of APS
were selected for evaluation as representatives of this type of device, although the study’s
intent is not a product comparison. The two models are designated as either IR or IR-OS
models based on the user activity inputs of the designs. Although they could be applied in
various settings, they were only tested in residential environments as that is the vast majority
of the market potential and most typical application. Each model has both always on
receptacles and controlled receptacles that are de-energized based on the control strategy.
The controlled receptacles are all operated on the same circuit with a single relay that opens,
cutting power to all the controlled AV devices as one.
Both models are designed to eliminate standby loads when AV equipment has been turned
off and to reduce excess usage that results from leaving AV equipment on when not in use.
For example, the APS would turn off the controlled AV devices when the timer reaches zero if
a child left the room unattended or if the user fell asleep while watching TV. Both models use
inputs of AV power and user activity to determine when power should be cut to the controlled
plug loads. The IR model measures total controlled AV load while the IR-OS model measures
only the TV receptacle load. The user activity inputs are monitored with a sensor that is placed
next to the TV and plugs into the APS. This sensor provides feedback to the user by blinking
an LED whenever a user signal is seen. The IR signal can be from any IR remote control
button. Differences between various buttons (power, volume, channel, etc.) are not
recognized nor relevant. Most TV remote controls send IR signals, although some other
controllers use radio waves (RF), Bluetooth, Wi-Fi, or wired signaling instead. These will not
trigger the current generation of Tier 2 APS devices. The IR-OS model also looks for motion
as a user activity signal.
Both models eliminate standby loads on the controlled devices by cutting power to these
devices whenever the AV system has been turned off. The APS determines whether the AV
system is on by measuring the TV or total AV system power and comparing it to a threshold
(the IR-OS model looks at TV power while the IR model looks at total plug load of all controlled
devices). If the power is above the threshold, the AV system is designated as “on” and vice
versa. Savings are also accumulated during an “active savings” situation which occurs when
the power strip determines that the AV system has been left on but is not being used or
watched anymore. Both models use a countdown timer that is always counting down to zero
whenever the AV system is in use; the timer resets whenever it sees user activity and begins
counting down again. If the timer reaches zero, the power strip opens the relay and cuts
power to the controlled plug loads after warning the user with a blinking LED (in the IR model)
or a blinking LED and buzzer (in the IR-OS model).
In both models, when the power strip is dormant prior to using the AV system, the user must
simply press any IR button on the remote control to close the switch on the power strip before

13
PG&E’s Emerging Technologies Program ET13PGE1441
turning on AV devices as normal. At this point, the countdown timer control sequence is
initiated once again.
Although the control strategy is very similar for both models, there are some differences.
Table 3 identifies the shared and unique features of each APS model under study. Additionally,
unique features in each model are explained further in the next two sections.
TABLE 3 - IR AND IR-OS MODEL FEATURES
Feature IR model IR-OS model
Automatic AV power threshold X
Automatic TV power threshold X
IR algorithm input X X
OS algorithm input X
Overload protection X X
60 minute timer X
75 minute timer X
120 minute timer X
135 minute timer X
8 hour once-off manual/music mode X
8 hour once-off auto/music mode X
LED signal prior to active shutdown X X
Audio buzzer prior to active shutdown X
Always on receptacles X X
The estimated useful life (EUL) for an APS is about 5-10 years, based on a presentation by
Bonneville Power Administration (BPA, 2013), DEER estimates1, and estimates of lifespan and
persistence from industry experts. With expected unit price costs, payback well under the EUL
is assured with the published energy savings estimates.
IR MODEL
The IR model has several features that differentiate it from the IR-OS model:
The threshold is compared to the total combined power of the controlled AV devices
to determine whether the system is on or off. As a result, there is no master device
and controlled devices can be arranged in any order.
The APS uses only remote control IR signals as user input.
The model comes in two options. The first is a wall pack that sits flat against and is
screwed into the wall outlet with three always on receptacles and one controlled
1 DEER EUL ID: Plug-OccSens

14
PG&E’s Emerging Technologies Program ET13PGE1441
receptacle. A standard power strip or outlet splitter is then plugged into the controlled
receptacle for all the controlled devices. The second is a power strip that has both
always-on receptacles and controlled receptacles.
The countdown timer can be set to 60 minutes or 120 minutes with a 60 minute default
setting and a 10 minute visual LED blinking warning of impending active shutdown if
the timer reaches zero. There is also a once-off 8 hour music/extended viewing mode.
Figure 3 shows a drawing of the wall pack option and an example arrangement.
FIGURE 3 - IR WALL PACK EXAMPLE ARRANGEMENT AND STRIP MODEL

15
PG&E’s Emerging Technologies Program ET13PGE1441
IR-OS MODEL
The IR-OS model has several features that differentiate it from the IR model. These include:
The threshold is compared to only the TV power to determine whether the system is
on or off. As a result, the TV must be plugged into a specific controlled receptacle while
the remainder may be for any other device in any order.
The control algorithm uses remote control IR signals and occupancy motion sensing
(OS) for user activity input. The OS signals are triggered by movement if the TV is on
and the countdown timer has reached a certain limit.
The control logic is contained in this sensor, allowing for changes to control strategy,
if needed.
The countdown timer can be set to 75 minutes or 135 minutes with 75 minute as the
default. For each timer setting, the multisensor begins looking for OS motion sensing
after 45 minutes or 75 minutes of IR inactivity, respectively. A 3 minute visual LED
blinking and soft audible chirp signals the user of impending active shutdown if the
timer reaches zero. There is also an automatic, once-off 8 hour music mode that begins
if devices without the TV are turned on. The default timer begins if the TV is turned on
during music mode.
Figure 4 shows the IR-OS model with various labeled features.
FIGURE 4 - IR-OS MODEL

16
PG&E’s Emerging Technologies Program ET13PGE1441
Figure 5 shows the control logic for the IR-OS model. The IR model is similar but skips
the OS sensing portion and has a 10 minute active shutdown warning instead of the
IR-OS 3 minute warning.
FIGURE 5 - IR-OS MODEL CONTROL LOGIC
TIER 2 APS LITERATURE SURVEY
There have been limited studies on Tier 2 APS devices as of this publication date. Table 4 lists
the results of these tests which vary between about 258 to 348 kWh saved per year (48%-
54% of baseline). Note that they all used the simulated savings methodology to test only the
IR model described above. The methodology was replicated in this study and is described in
the following M&V plan section. This methodology was developed and proposed by CalPlug at
the University of California, Irvine as a solution for standardization of Tier 2 APS testing with
appropriate rigor and technical defensibility (Wang, 2014).

17
PG&E’s Emerging Technologies Program ET13PGE1441
TABLE 4 - LITERATURE SURVEY TIER 2 APS SAVINGS
SOURCE APS TYPE APPLICATION SAVINGS
[KWH]
(BPA, 2013) IR and RMS Power Sensing Res AV 321
(EnergyConsult, 2012) IR and RMS Power Sensing Res AV 258
(Wang, 2014) IR and Load Sensing Res AV 280
IR and RMS Power Sensing Res AV 348
(Valmiki, 2015) IR and RMS Power Sensing Res AV 234
TARGET MARKETS AND BARRIERS
Tier 2 APS devices are well suited to many environments wherever AV or PC systems are
installed. The most cost effective applications could be large scale installations at buildings
that have many AV systems, such as dormitories or hotels. However, since the market for
this technology is so large, single-family residences (SFR) and multi-family residences (MFR)
are the primary target for this technology in AV settings.
The California and IOU territory residential AV market sizes can be estimated with the
available literature. Assuming that each household has about 2.25 times the AV system
potential as those studied in this effort2, an AV penetration of 100% (KEMA, 2009), and using
the most recent U.S. Census statistics for California (United States Census Bureau, 2013),
the potential market size is listed in Table 5.
TABLE 5 - ESTIMATED MARKET SIZE
Territory # Households # AV Systems
PG&E 4,615,700 10,385,200
SCE 4,839,600 10,889,100
SDG&E 1,071,600 2,411,000
California 12,542,500 28,220,500
Barriers to the market penetration and effectiveness of APS devices primarily derive from
customer resistance, the rapid turnover rate of consumer electronics, and high cost relative
to standard power strips. Customer acceptance of APS devices will depend highly on the
usability and simplicity of the technology. For instance, users may resist spending money and
time learning how to use yet another device that has no obvious and immediate benefit to
2 2.25 = 1 full equivalent AV system to those found in this study plus a second and third AV
system with 0.75 and 0.5 the same potential. Three total AV systems drawn from the
literature (Kessler, 2011). The reduced potential savings for the second and third sets are
due to reduced usage and number of AV peripherals from primary AV system.

18
PG&E’s Emerging Technologies Program ET13PGE1441
them while complicating something as common as watching TV. Additionally, there are few
options available to consumers; competing manufacturers and vendors of Tier 2 APS devices
include Bits Limited, Embertec, and TrickleStar.
This customer resistance has led utilities to explore direct install and give away demand side
management (DSM) program options. However, this type of DSM approach has its own
questions and barriers. The rapidly changing electronics market, consumer behavior,
variability in user patterns and APS acceptance, and unpredictable user interaction with APS
devices all add uncertainty to the design and implementation of utility programs (N. O'Neill,
2010).

19
PG&E’s Emerging Technologies Program ET13PGE1441
TECHNICAL APPROACH AND TEST METHODOLOGY The test plan for both phases of the study was based on two complementary approaches for
determining energy savings values. One method was a standard pre-post test that measured
energy consumption at the AV system before and after the installation of the Tier 2 APS. The
other method simulated savings based on data collected during the baseline period and was
based on research and suggested test protocol from CalPlug at UC Irvine. The two methods
complement each other as each has strengths and weaknesses. Most host sites were subject
to both methods, although some sites only allowed one of the two methods. Note that phase
1 studied only the IR model while phase 2 studied both the IR and IR-OS models as shown in
Table 6.
TABLE 6 - METHODS APPLIED DURING EACH PHASE FOR EACH APS MODEL
Phase 1 Phase 2
IR simulated savings X X
IR pre-post savings X
IR-OS simulated savings X
IR-OS pre-post X
The distinguishing features of each method are as follows:
Simulated savings method
Developed by CalPlug to address uncertainty associated with behavior variation from
pre to post periods and to reduce overall time needed for monitoring.
Eliminates potential variation in usage patterns between pre and post timespans
because only one period is used.
May not fully account for user interaction with APS when system is turned off (since
shutdown is only simulated after baseline data collection). An LED warning light flashes
continually when countdown timer reaches zero in order to prompt user response as
in actual APS use.
Allows for comparison with previous studies.
Pre/post savings method
Includes all user interaction effects and feedback with APS controls and functions.
Cannot control variability in usage patterns between pre and post timespans (daily
host uses and total use time of AV system)
Simple approach that can easily be replicated for various models without equipment
and instrumentation modification for M&V purposes.

20
PG&E’s Emerging Technologies Program ET13PGE1441
Only controlled AV devices were included in all stages of the test. In other words, only the
demand and energy consumption of devices that were on switching outlets were measured.
This results in accurate percent energy savings. However, this also means that consumption
calculations do not include devices that would remain always energized. These could include
modems, computers, set top boxes, game consoles, or other devices that the host customer
did not want to be turned off. As a result, the AV baseline values are representative of only
the controlled devices; these figures may deviate from other studies or total AV consumption
that includes these other excluded devices. The selection of controlled devices at each site
was chosen cooperatively through recommendations by the installer and input from the host,
just as would occur during a direct install program.
HOST SITES
The host sites consisted of 42 and 56 SDG&E customers during phase 1 and phase 2,
respectively. Host sites were selected differently for each phase. For phase 1, participants
were SDG&E employees and their friends and family. For phase 2, participants were SDG&E
customers in three zip codes selected as a representative subset of SDG&E territory. In both
cases, the customers were solicited through a brief ET email explaining the purpose and
premise of the test and the host responsibilities. After the participants expressed interest,
some basic demographic information was gathered prior to scheduling site visits. Initial
customer information surveyed included number and ages of residents, home type, quantity
and type of AV devices at main TV, and whether the home is rented or owned. These answers
were not be used to screen host sites as random selection would be the most unbiased and
representative process. Rather, sites were taken on a first-come basis. The only host sites
that were rejected or excluded were those with intractable installations.
The number of sites used for each type of APS and their demographic breakdown for the
testing are listed in Table 7.
TABLE 7 – M&V HOST SITE POPULATION, DEMOGRAPHICS, AND DATASET SIZES FOR COMBINED PHASE 1 AND 2
IR IR-OS California
(US Census, 2013)
Number of baseline sites 98 56 n/a
Number of post-monitored sites 9 56 n/a
Number of simulated sites 94 52 n/a
Average number of controlled AV devices 3.6 3.4 n/a
Number of MFR sites 28 (29%) 16 (29%) 35%
Number of SFR sites 70 (71%) 40 (71%) 65%
Number of households with children 37 (38%) 24 (43%) 37%
Average number of residents 3.1 3.1 2.9
Average self-reported weekly TV hours 33 34 n/a

21
PG&E’s Emerging Technologies Program ET13PGE1441
INSTRUMENTATION
The instrumentation used for the study was different for each phase, although both sets of
instrumentation measured largely the same variables for use with equivalent analyses. All
power and energy measurements were for the combined controlled load and excluded any
devices that were not on switched receptacles. AESC tested and vetted all instrumentation by
comparing measurements with calibrated instrumentation and in-office testing. The
instrumentation for each phase is outlined in the following two sections.
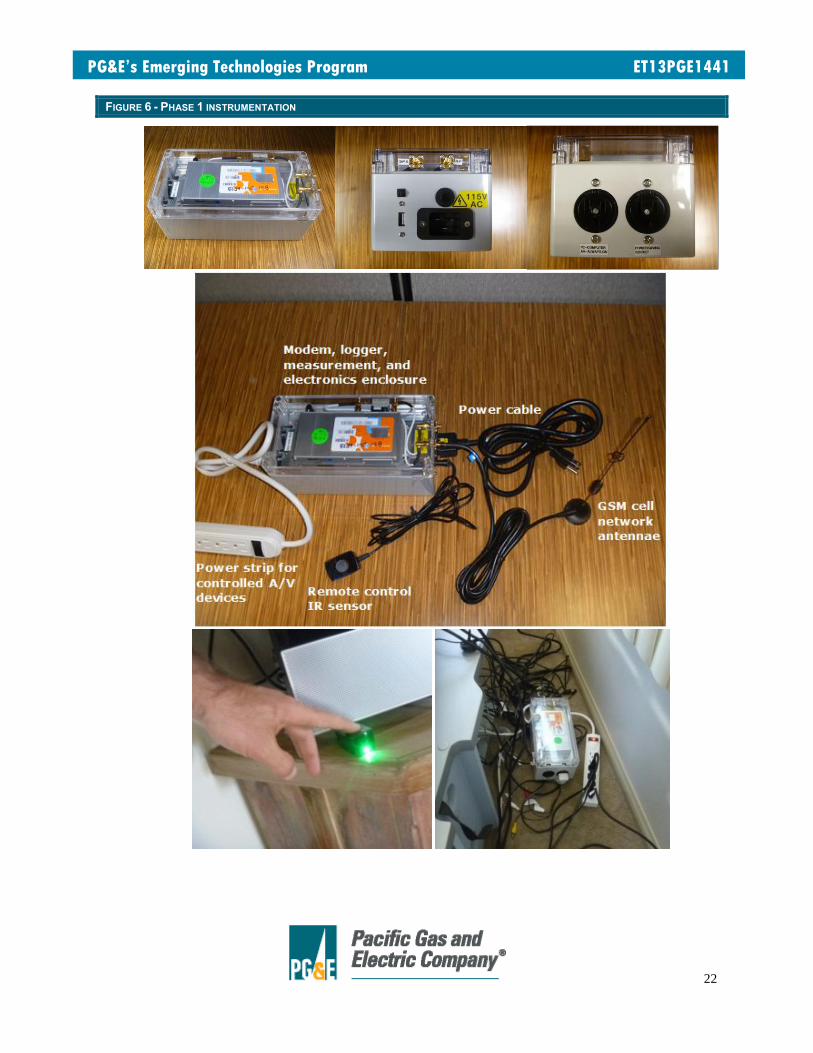
Phase 1 InstrumentationThe phase 1 study of the IR APS model used a proprietary savings
verification system (SVS) that was constructed by the vendor for the baseline and simulation
variable monitoring. A HOBO plug load logger was used for post-installation monitoring. Table
8 lists the instrumentation used for phase 1.
TABLE 8 – PHASE 1 INSTRUMENTATION
Pre-post method
measurements Equipment Units Accuracy Interval
Baseline energy and demand SVS unit V, A, kWh, Watts 2% 1 second
Post energy and demand HOBO UX120-018 V, A, pf, kWh, Watts 0.5% 1 minute
Baseline and simulated
method measurements Equipment Units Accuracy Interval
Baseline energy and demand SVS unit V, A, kWh, Watts 2% 1 second
Baseline user activity for use in
savings simulation SVS unit IR Pulses 1 pulse 1 second
The SVS unit monitors and records AV system voltage and current for true RMS power along
with remote control IR activity. The design was based on CalPlug metering suggestions
developed for the standardization of APS monitoring. The SVS unit does not turn off power to
any connected loads and only serves as a measurement device without affecting power
supply. The measurement system records the following values at 1 second intervals and
transmits data to external vendor servers every 8 hours via cell phone networks:
Timestamp
IR activity (stored as amplitude each second, anything greater than 0 indicates IR
signals)
Voltage
Current
RMS Power
Cumulative energy consumption and simulated energy savings
22
PG&E’s Emerging Technologies Program ET13PGE1441
FIGURE 6 - PHASE 1 INSTRUMENTATION
23
PG&E’s Emerging Technologies Program ET13PGE1441
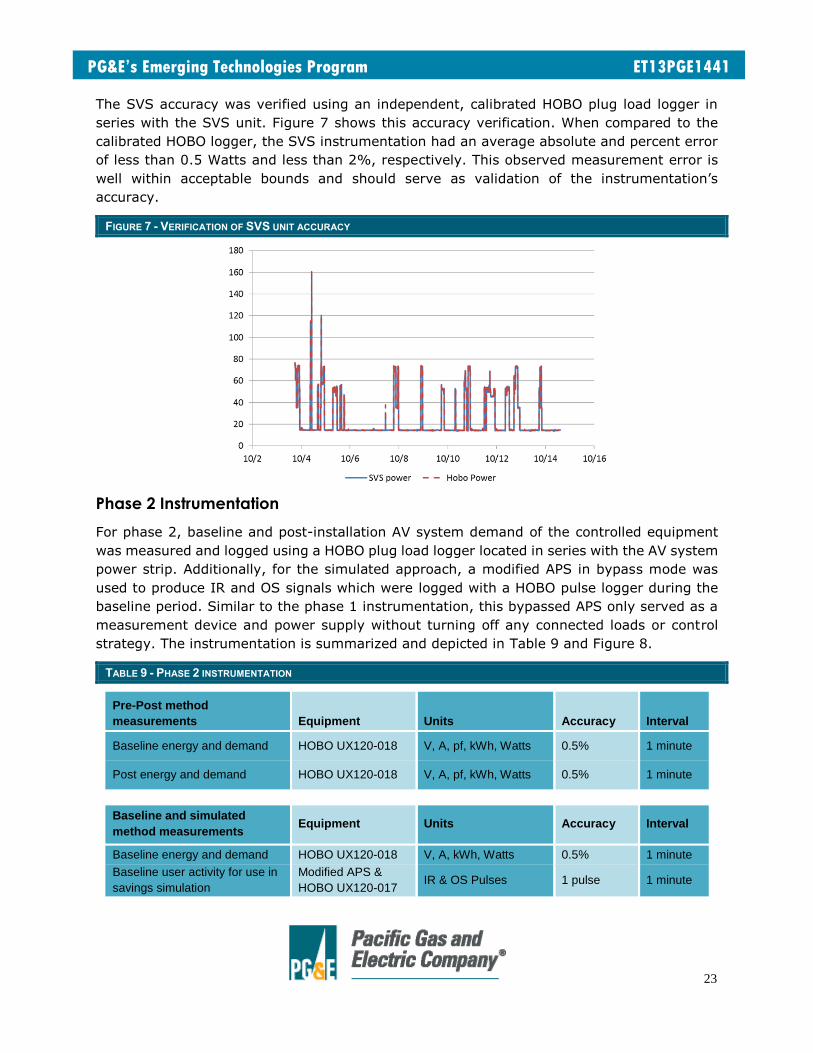
The SVS accuracy was verified using an independent, calibrated HOBO plug load logger in
series with the SVS unit. Figure 7 shows this accuracy verification. When compared to the
calibrated HOBO logger, the SVS instrumentation had an average absolute and percent error
of less than 0.5 Watts and less than 2%, respectively. This observed measurement error is
well within acceptable bounds and should serve as validation of the instrumentation’s
accuracy.
FIGURE 7 - VERIFICATION OF SVS UNIT ACCURACY
Phase 2 Instrumentation
For phase 2, baseline and post-installation AV system demand of the controlled equipment
was measured and logged using a HOBO plug load logger located in series with the AV system
power strip. Additionally, for the simulated approach, a modified APS in bypass mode was
used to produce IR and OS signals which were logged with a HOBO pulse logger during the
baseline period. Similar to the phase 1 instrumentation, this bypassed APS only served as a
measurement device and power supply without turning off any connected loads or control
strategy. The instrumentation is summarized and depicted in Table 9 and Figure 8.
TABLE 9 - PHASE 2 INSTRUMENTATION
Pre-Post method
measurements Equipment Units Accuracy Interval
Baseline energy and demand HOBO UX120-018 V, A, pf, kWh, Watts 0.5% 1 minute
Post energy and demand HOBO UX120-018 V, A, pf, kWh, Watts 0.5% 1 minute
Baseline and simulated
method measurements Equipment Units Accuracy Interval
Baseline energy and demand HOBO UX120-018 V, A, kWh, Watts 0.5% 1 minute
Baseline user activity for use in
savings simulation
Modified APS &
HOBO UX120-017 IR & OS Pulses 1 pulse 1 minute

24
PG&E’s Emerging Technologies Program ET13PGE1441
FIGURE 8 – PHASE 2 INSTRUMENTATION
TEST PLAN: BASELINE
The baseline consumption at each host site was measured in order to establish normal usage
and patterns. No attempt to control or alter behavior was made and the hosts were expressly
told to just behave normally. The flashing LED light for the simulation instrumentation was
described and users were told that they could stop the flashing by pressing any button to
reset the timer. The AV devices to be controlled were isolated and combined to a single power
strip for monitoring. This single power strip was either plugged into the SVS unit (phase 1)
for monitoring or used the bypassed APS (phase 2). In both cases, the controls were disabled
during baseline, AV devices were not switched off with the APS, and power supply to the AV
devices was continuous.
The selection of the controlled devices was based on installer recommendations and input
from the customer. Recent generation Xbox and PlayStation models were excluded due to
their updating during inactive times, sensitive hard drives, and recommended APS practices.
Additionally, cable and satellite service set top boxes were not included as a controlled device
at any site. The typical controlled devices included combinations of the following:
Television (required)
Stereo/CD player
Speakers/subwoofer/soundbar
VHS, DVD, or Blu-ray players
Wii
Streaming devices (Roku, etc.)
Game controller chargers
Wireless headphone chargers
1st and 2nd generation Xbox and Playstation (only if host requested)

25
PG&E’s Emerging Technologies Program ET13PGE1441
The total controlled AV system load was measured as one rather than disaggregating amongst
each AV device type. This was done for cost mitigation, installation simplicity, and is
reasonable since the APS treats the devices as one collection. The APS devices were installed
at the host site’s main TV unless otherwise requested by the host. Additionally, only one AV
system per home was monitored in order to gain a broader understanding across as many
homes and behavior patterns as possible.
The annual baseline consumption is simply calculated using the ratio of monitoring time to
annual time.
𝐴𝑛𝑛𝑢𝑎𝑙 𝐸𝑛𝑒𝑟𝑔𝑦 = 8760 ℎ𝑜𝑢𝑟𝑠
𝑀𝑜𝑛𝑖𝑡𝑜𝑟𝑒𝑑 𝐻𝑜𝑢𝑟𝑠∗ 𝑀𝑒𝑎𝑠𝑢𝑟𝑒𝑑 𝐸𝑛𝑒𝑟𝑔𝑦
Baseline monitoring spanned 1 to 4 weeks. During phase 1, sections of data were not properly
transmitted using the cell phone network, thus phase 1 sites had shorter periods. Monitoring
period length is discussed in the Appendix.
TEST PLAN: SIMULATED SAVINGS
In order to address the variability in user behavior and to propose a standard method of
testing APS devices, CalPlug devised a test approach that calculates simulated savings. This
method was applied to 42 host sites during phase 1 for the IR model after data collection with
the SVS test instrumentation. The simulation method was also applied to 52 sites during
phase 2 for both the IR and the IR-OS models. The method uses a single period of monitoring
to calculate both baseline and what the savings would have been over that same time if an
APS had been installed. In the case of the two Tier 2 APS models under study, this involves
measuring baseline AV power and consumption while simultaneously measuring signals from
remote controls and motion sensors. In the case of the IR model, the SVS unit measures AV
power and IR signals from its IR sensor. In the case of the IR-OS model, the modified APS
sends IR and OS pulse signals to a logger while another plug load logger measures power of
the combined AV load.
In the simulated approach, the savings and demand reduction were calculated by applying
the APS control strategy analytically to the baseline data. The user activity will dictate when
the APS timer reaches zero and simulated energy savings will begin to accumulate. Whenever
there is an IR or OS signal observed, a timer counter is reset in the simulation. Whenever the
timer reaches zero, the simulation logs a de-energized state, thus accumulating energy
savings.

26
PG&E’s Emerging Technologies Program ET13PGE1441
This simulation method applied to baseline data is illustrated in Figure 9.
FIGURE 9 - EXAMPLE OF SIMULATED SAVINGS CALCULATION USING MEASURED BASELINE POWER AND IR-OS SIGNALS
This simulation was performed for each site across the entire baseline measurement period
to estimate savings. All sites in phase 1 were used to simulate the IR model while all sites in
phase 2 were used to simulate both the IR and the IR-OS model. Although a range of timer
settings were simulated, the simulations primarily focused on using the default timer settings
(75 minutes + 3 minute warning for IR-OS and 60 + 10 minute warning for IR).
Energy savings are calculated as the difference between the annualized consumption during
baseline and the simulated savings modes.
𝐸𝑛𝑒𝑟𝑔𝑦 𝑆𝑎𝑣𝑖𝑛𝑔𝑠 (𝑘𝑊ℎ) = 𝐵𝑎𝑠𝑒𝑙𝑖𝑛𝑒 𝐸𝑛𝑒𝑟𝑔𝑦 𝑈𝑠𝑎𝑔𝑒 (𝑘𝑊ℎ) − 𝐶𝑜𝑛𝑡𝑟𝑜𝑙𝑙𝑒𝑑 𝐸𝑛𝑒𝑟𝑔𝑦 𝑈𝑠𝑎𝑔𝑒 (𝑘𝑊ℎ)
TEST PLAN: PRE-POST SAVINGS
The alternate and more common pre-post savings approach was performed at 9 IR model
sites during phase 1 and 56 IR-OS sites during phase 2. This method compared demand and
energy consumption between the baseline and post-installation periods. In the phase 1 IR
case, the SVS unit was replaced by the actual IR APS model while keeping the combination
of AV devices consistent. Similarly, in phase 2, the bypassed APS device was replaced with
an actual, functioning IR-OS APS model while keeping the AV devices consistent. In both
cases, the host customer was given a demonstration and instructions on the use of the APS
at installation.
Energy savings were calculated with a simple comparison between the annualized energy
consumption before and after installation. The baseline period was measured as described in
the Test Plan: Baseline section. Similar to the baseline monitoring, controlled AV load and
consumption was monitored with the Tier 2 APS installed for 2 to 4 weeks.

27
PG&E’s Emerging Technologies Program ET13PGE1441
SURVEY PLAN
In order to understand the persistence and customer reactions of the APS devices installed
through a direct install field placement, surveys were administered to the customers involved
in the parallel effort by TechniArt and Illume. Please refer to Appendix 4: Scaled Field
Placement Survey Report for details.

28
PG&E’s Emerging Technologies Program ET13PGE1441
RESULTS The study results are presented from both phases, with combined sample sizes, where
appropriate. As stated elsewhere, the purpose of this report is not to form a product
comparison, but rather to better understand Tier 2 APS devices in general. Since the IR-OS
model was only studied in phase 2, the respective results are limited to that phase and sample
size using both the simulated and pre-post methods. The IR model was studied using the
simulated approach during both phases, resulting in a larger sample size across both trials.
However, the IR model was only studied with the pre-post method at 9 sites during phase 1.
The baseline, simulated energy savings, pre-post energy savings, and average demand
reduction during on-peak hours are presented. Any error bars shown in figures correspond to
a 90% confidence interval assuming a Gaussian distribution. All energy consumption and
savings values are annualized and all demand reduction was calculated for DEER on-peak
hours only3. Note that although average demand will decrease, peak demand will not reduce
because the demand while the AV system is on does not change.
Survey results from the scaled field placement are summarized and combined with the energy
savings figures to present the overall market potential. Finally, recommendations for future
direction and conclusions are drawn. All results are presented with the goal of informing utility
programs, consumers, and future generations of APS and other plug load control devices.
ENERGY AND DEMAND SAVINGS
The average annual baseline usage across all host sites was 432 kWh for the controlled AV
devices only (other uncontrolled AV devices may increase total AV usage, but were not
included in the study). Figure 10 shows the relationship between annual baseline usage and
the full load AV demand during the monitoring period.
FIGURE 10 - ANNUAL BASELINE USAGE AS A FUNCTION OF AV SYSTEM POWER AT FULL LOAD
3 DEER on-peak time is defined as 2 PM to 5 PM (CPUC, 2013).

29
PG&E’s Emerging Technologies Program ET13PGE1441
This shows that each AV system watt under normal operating conditions corresponds to about
2.02 kWh of consumption per year, on average. This may be particularly useful in evaluating
programs if monitoring is prohibitive or infeasible. However, it is important to know that this
corresponds to controlled AV devices only; power and consumption from non-controlled
devices are not included in this factor.
Figure 11 and Figure 12 show the baseline consumption and savings for each type of APS as
tested during each phase. The savings depicted here are for the default timer settings of each
strip. Note that although there is a large difference between the simulated savings for the two
models, there is very little difference between the pre-post savings. Again, the pre-post
savings for the IR model come from a sample of 9 sites due to limitations of the field study.
FIGURE 11 - USAGE AND SAVINGS FOR THE IR MODEL DEFAULT SETTING DURING PHASE 1 (NOTE 60 MINUTE TIMER + 10
MINUTE WARNING DELAY FOR ACTIVE SHUTDOWN)
FIGURE 12 - USAGE AND SAVINGS FOR EACH APS MODEL DEFAULT SETTING DURING PHASE 2 (NOTE 75 IR-OS TIMER
INCLUDES 3 MINUTE ACTIVE SHUTDOWN DELAY AND 60 MINUTE IR TIMER INCLUDES 10 MINUTE DELAY)

30
PG&E’s Emerging Technologies Program ET13PGE1441
Table 10 lists the results across both phases and models, as well as normalized results
combining the two phases. Since the baseline usage varied slightly from phase 1 to 2, the
results were normalized to the average baseline. These normalized values should be the final
savings estimates for each model and method with consideration given to the sample sizes
and other experimental factors.
TABLE 10 - BASELINE USAGE AND SAVINGS FOR EACH PHASE, EACH MODEL, AND COMBINED PHASES
Phase Baseline usage [kWh]
IR simulated savings [kWh]
IR pre-post savings [kWh]
IR-OS simulated savings [kWh]
IR-OS pre-post savings [kWh]
Phase 1 463 234 (51%) 134 (29%) n/a n/a
Phase 2 409 199 (49%) n/a 112 (27%) 104 (25%)
Combined and normalized 432 214 (50%) 125 (29%) 118 (27%) 110 (25%)
Similar to Figure 10, it is useful to determine the average savings per watt of controlled AV
load. This could provide a basis for program evaluation and host potential using spot
measurements rather than extended, expensive monitoring. In Figure 13 the results show
that the IR model garners about 1.0 kWh of savings per watt of peak controlled AV load,
based on the simulated results. There were not enough pre-post results for the IR model to
establish a similar correlation (only 9 sites were post-monitored with the IR model). The
results show that the IR-OS model garners about 0.5 kWh of annual savings per watt of peak
controlled AV load and is consistent across the simulated and pre-post methods.

31
PG&E’s Emerging Technologies Program ET13PGE1441
FIGURE 13 - SAVINGS AS FUNCTION OF AV SYSTEM POWER
IR Model
Simulated
IR Model
Pre-Post Not enough data for correlation
IR-OS
Model
Simulated
IR-OS
Model
Pre-Post
32
PG&E’s Emerging Technologies Program ET13PGE1441
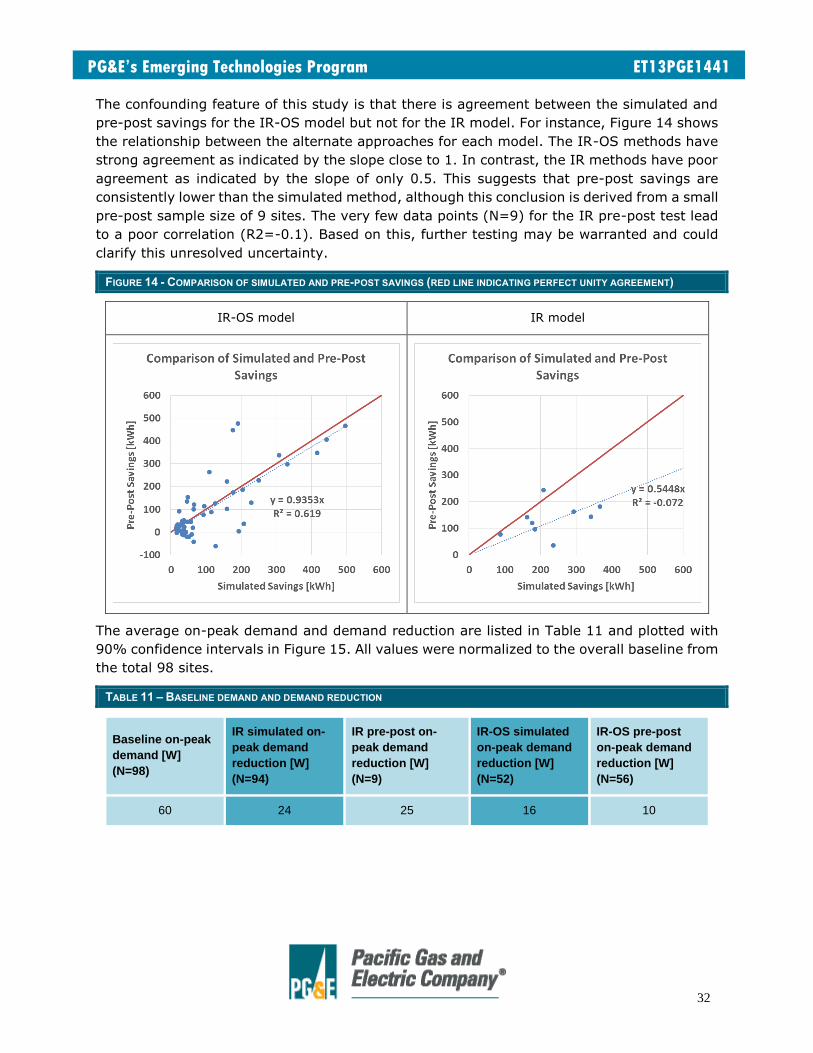
The confounding feature of this study is that there is agreement between the simulated and
pre-post savings for the IR-OS model but not for the IR model. For instance, Figure 14 shows
the relationship between the alternate approaches for each model. The IR-OS methods have
strong agreement as indicated by the slope close to 1. In contrast, the IR methods have poor
agreement as indicated by the slope of only 0.5. This suggests that pre-post savings are
consistently lower than the simulated method, although this conclusion is derived from a small
pre-post sample size of 9 sites. The very few data points (N=9) for the IR pre-post test lead
to a poor correlation (R2=-0.1). Based on this, further testing may be warranted and could
clarify this unresolved uncertainty.
FIGURE 14 - COMPARISON OF SIMULATED AND PRE-POST SAVINGS (RED LINE INDICATING PERFECT UNITY AGREEMENT)
IR-OS model IR model
The average on-peak demand and demand reduction are listed in Table 11 and plotted with
90% confidence intervals in Figure 15. All values were normalized to the overall baseline from
the total 98 sites.
TABLE 11 – BASELINE DEMAND AND DEMAND REDUCTION
Baseline on-peak
demand [W]
(N=98)
IR simulated on-
peak demand
reduction [W]
(N=94)
IR pre-post on-
peak demand
reduction [W]
(N=9)
IR-OS simulated
on-peak demand
reduction [W]
(N=52)
IR-OS pre-post
on-peak demand
reduction [W]
(N=56)
60 24 25 16 10

33
PG&E’s Emerging Technologies Program ET13PGE1441
FIGURE 15 - BASELINE DEMAND AND DEMAND REDUCTION
Figure 16 and Figure 17 show the average weekday demand and demand reduction for each
model. Note the high variability in the IR pre-post profile due to the small sample size.
Demand increases as the day progresses with a peak around 8 PM and demand reduction
stays relatively constant.
FIGURE 16 - WEEKDAY BASELINE DEMAND PROFILE AND HOURLY DEMAND REDUCTION (IR MODEL)

34
PG&E’s Emerging Technologies Program ET13PGE1441
FIGURE 17 - WEEKDAY BASELINE DEMAND PROFILE AND HOURLY DEMAND REDUCTION (IR-OS MODEL)
SURVEY RESULTS
The survey of customers who received either the IR or IR-OS APS resulted in information that
can aid in program design and market potential evaluation. These results include information
on measure persistence, product features, user impression, and demographic-specific
findings. For instance, the survey found that the overall average persistence rate for the APS
installations was about 84%. The entire qualitative survey report is replicated in Appendix 4:
Scaled Field Placement Survey Report.
MARKET POTENTIAL
Correlations between savings and household demographics were explored, but no significant
relationships were observed. The intention was to establish the best target residential
customer segments and a more detailed market potential study using California household
demographics. However, since there were no defensible correlations with any of the
demographic data points that were gathered, it is most appropriate to treat the California
population as a single group when developing a program and market potential. At best, the
survey results do show that older customers may be less likely to adopt the technology and
households with children are more eager to install additional strips.
Using the market size in Table 5 and savings values listed in Table 10 and Table 11, the total
energy and demand savings potential were estimated. Table 12 lists the estimated potential
for California and the IOUs using the simulated and pre-post approaches. The total energy
savings potential is for complete market penetration with 80-87% persistence rate
determined by the customer survey.

35
PG&E’s Emerging Technologies Program ET13PGE1441
The estimates provide a range in order to capture the different energy savings findings for
each model. However, it may be inappropriate to use these figures as a comparison. Rather,
using both models in a program could potentially improve the outcome by giving the
customers a choice and diversifying the offering.
TABLE 12 - ESTIMATED CALIFORNIA AND IOU MARKET POTENTIAL WITH 100% PENETRATION, ACCOUNTING FOR PERSISTENCE
RATE4
Territory # AV
systems
Energy savings potential
[GWh/yr]
On-peak demand
reduction potential [MW]
IR IR-OS IR IR-OS
PG&E 10,385,200 1,080-1,850 990-1,070 207-215 60-145
SCE 10,889,100 1,130-1,930 1,040-1,120 217-226 95-152
SDG&E 2,411,000 250-430 230-250 48-50 21-34
California 28,220,500 2,930-5,010 2,700-2,900 562-586 246-393
There was a slight difference in persistence between the two models as determined by the
scaled field placement customer surveying. Although every attempt was made to weight the
persistence rates by demographics for each model’s population, there were some
demographic differences between the two populations that could not be accounted for.
Additionally, the IR model was surveyed longer after installation, on average. Although the
overall average persistence rate for all installations was found to be 84%, adjustments in
weighting based on the persistence sensitivity to demographics suggested that there were
indeed inherent differences in persistence between the two products. Thus the market
potential uses 83% and 87% persistence for the IR and IR-OS models, respectively. However,
any program that opts to use a single deemed savings or persistence rate should use 84%
for the product class unless additional data becomes available.
The total energy savings potential amounts to about 4% of California residential energy
consumption, which is slightly less than previous estimates of standby load consumption in
the residential market. Note that these results are based on a range of savings results due to
the alternate simulation and pre-post methods.
Simple payback was not calculated since there was large variation in market prices and may
not represent unit cost for future programs. The annual cost savings based on an assumed
blended rate of $.015/kWh and the savings listed in Table 10 is about $17-$18 and $19-$32
for the IR-OS and IR models, respectively.
4 Range due to varying energy savings estimates from each method, simulated and pre-post.

36
PG&E’s Emerging Technologies Program ET13PGE1441
DISCUSSION AND CONCLUSIONS Tier 2 APS devices are proven to be effective at reducing consumption and demand in
residential AV settings with a high degree of success. However, despite this proven success
the market penetration, availability, and awareness of such devices remains low. This could
largely be due to few available models relative to standard power strips, resistance to
perceived complication of home electronic systems, concerns of AV device failure, relatively
low billing savings per installation, and high cost compared to standard strips. Given these
factors and the large market potential, it would be worth pursuing a larger pilot or full program
should the economic and societal benefits of a utility program be deemed positive.
Installing the APS is simple and straightforward in most cases and would be easy for the
typical homeowner or a direct install service provider. Some AV systems are too complex or
intractable for installation, but those are relatively rare cases. Once installed, use of the APS
is very intuitive and needs very little training. Host sites routinely became accustomed to its
use after only one or two times of turning on the AV system. This intuitive operation is
important when trying to encourage market transformation of an entrenched consumer
product segment like power strips.
Persistence of installed power strips in the scaled field placement was about 80% and 87%
for the IR and IR-OS models, respectively. However, normalizing these persistence rates
based on age demographics of the test populations may slightly alter these rates. Additionally,
continued monitoring of any future programs can provide improved understanding of measure
persistence over a long time and with a larger population. The primary reason for removal
after installation was active shutdowns of the AV system while the customer was still using it
or wanted it to remain on. Examples of this would be customers who leave their TVs on for
pets, don’t use IR remote controls, like to leave the TV on all day, and other such situations.
Energy and demand savings of the APS installations were determined using two
complementary methods. Each method has advantages and disadvantages and equally
compelling arguments can be made for both. Considering this, results were presented for both
methods. Program developers are encouraged to weight each method’s results equally unless
they see reason to favor one over the other. The primary concern with the simulated method
is that the approach may not fully account for user interaction with the APS since the loads
are never actually switched off. The primary concern with the pre-post method is that
behavioral patterns may have a significant degree of variation between pre and post periods
that is difficult to mitigate without larger sample sizes and longer monitoring periods.
Two models of Tier 2 AV APS devices with similar control strategies were tested; the purpose
of this was not to provide a product comparison but rather to have a better understanding of
the Tier 2 APS product class and its offerings, in general. Depending on the savings calculation
method and the APS model, the average annual savings are between 110 and 214 kWh (25%-
50%). Considering the widespread and almost ubiquitous consumer market, this technology
presents a large energy savings opportunity in California and elsewhere.

37
PG&E’s Emerging Technologies Program ET13PGE1441
RECOMMENDATIONS
Since the market potential for this device is so large and is not expected to change in the
coming years, a supporting program could save substantial energy in an unaddressed end-
use in California.
Future steps towards market adoption could include the following:
Standardized method of testing future APS products without extended M&V studies
such as this one.
Program evaluation protocols that do not involve extended, costly monitoring at
individual homes.
A more robust product sensor design that is less likely to be lost or removed from
remote control line of sight.
Incorporate RF or Bluetooth remote sensing to match new AV equipment such as
streaming content devices and game consoles. This could increase persistence
rates.
Consider using both APS models in a program in order to diversify offering and
improve overall persistence rate by giving customers options. The differing designs
could be offered with tiered rebates or as a single product class, depending on
future program design analysis.
Improve understanding of persistence rates with continued monitoring of any
future program and follow-up surveying.
Conduct additional pre-post testing of the IR model to improve sample size and
certainty, as needed.

38
PG&E’s Emerging Technologies Program ET13PGE1441
APPENDICES
APPENDIX 1: MONITORING PERIOD LENGTH AND VARIABILITY
One concern with monitoring energy use with a high dependence on behavior and irregular
patterns is the length of the monitoring periods. If the monitoring period is too short, results
could be inaccurate as they don’t fully incorporate the daily variation in use patterns. On the
other hand, lengthy monitoring periods are difficult due to host site patience, expense, and
project timelines. This study made every attempt to strike a balance between these two
competing motivations.
The monitoring period lengths for each site are plotted in Figure 18 and Figure 19.
FIGURE 18 - BASELINE PERIOD DURATION FOR EACH SITE
FIGURE 19 - POST PERIOD DURATION FOR EACH SITE

39
PG&E’s Emerging Technologies Program ET13PGE1441
Several analyses were performed in order to validate the accuracy of the results and the
monitoring period length. First and foremost, whenever possible confidence intervals for each
site were established based on daily variations in use and savings. These 90% confidence
intervals provide a statistical measure of user variability. Tighter confidence intervals imply
more consistent user behavior and sufficient monitoring length while larger confidence
intervals suggest the opposite. Some of the sites had high variability; however, removing
these sites from the dataset did not alter the overall average baseline usage and savings
findings. Figure 20, Figure 21, and Figure 22 show the baseline usage, post usage, and
simulated savings for each site with confidence intervals based on daily variation at each
individual site.
FIGURE 20 - BASELINE USAGE WITH 90% CONFIDENCE INTERVALS BASED ON DAILY VARIATION, WHERE POSSIBLE
FIGURE 21 - POST ANNUAL USAGE WITH 90% CONFIDENCE INTERVALS BASED ON DAILY VARIATION, WHERE POSSIBLE

40
PG&E’s Emerging Technologies Program ET13PGE1441
FIGURE 22 - SIMULATED SAVINGS WITH 90% CONFIDENCE INTERVALS BASED ON DAILY VARIATION, WHERE POSSIBLE
Another method of ensuring consistent behavior patterns between the pre and post periods
is by looking at the number of daily uses and use time. Figure 23 shows the average number
of uses and average use time across all sites in phase 2 for the baseline and post periods.
This is to assure that the pre-post savings calculated for the IR-OS model are derived from
periods with similar usage patterns for fair comparison. The nearly identical number of uses
suggests that overall use patterns in the total population remained consistent from pre to
post. The second plot comparing pre and post daily uses also reinforces this conclusion.
Additionally, the slight decrease in average use time implies successful active savings.
FIGURE 23 - DAILY USES AND USE TIME FOR PHASE 2 IR-OS PRE-POST TESTING
Only a small sample of sites were selected for pre-post monitoring during phase 1 with the
IR model. Thus, it is important to confirm that the usage patterns were consistent across pre
and post periods and that the sample was representative of the larger population. Figure 24
shows the average number of uses and average use time across the 9 sample sites that were

41
PG&E’s Emerging Technologies Program ET13PGE1441
selected for IR model pre-post testing in phase 1. This is to assure that the pre-post savings
calculated for the IR model are derived from periods with similar usage patterns for fair
comparison. Similar to the larger population that was used for the IR-OS pre-post testing, the
comparison in use patterns from pre to post periods suggests that overall user behavior and
AV system use frequency was consistent.
FIGURE 24 - DAILY USES AND USE TIME FOR PHASE 1 IR PRE-POST TESTING
Table 13 lists some of the demographic data collected for the total IR population and the
sample population used for pre-post testing. Although the number of controlled devices,
number of residents, and baseline energy were relatively consistent, the sample population
did have fewer residents who stay home and no households with children.
TABLE 13 - DEMOGRAPHICS OF IR SIMULATED SITE POPULATION AND PRE-POST TESTING SAMPLE POPULATION
IR total population
(N=98)
IR pre-post sampling
(N=9)
Average number of controlled AV devices 3.6 3.8
Number of MFR sites 28 (29%) 4 (44%)
Number of SFR sites 70 (71%) 5 (56%)
Number of households with children 37 (38%) 0 (0%)
Average number of residents 3.1 2.7
Average self-reported weekly TV hours 33 36
Stay at home (parent/retiree/work from home/etc.) 65% 44%
Baseline annual energy [kWh] 432 461
42
PG&E’s Emerging Technologies Program ET13PGE1441
APPENDIX 2: SENSITIVITY TO ACTIVE SHUTDOWN TIMER SETTING
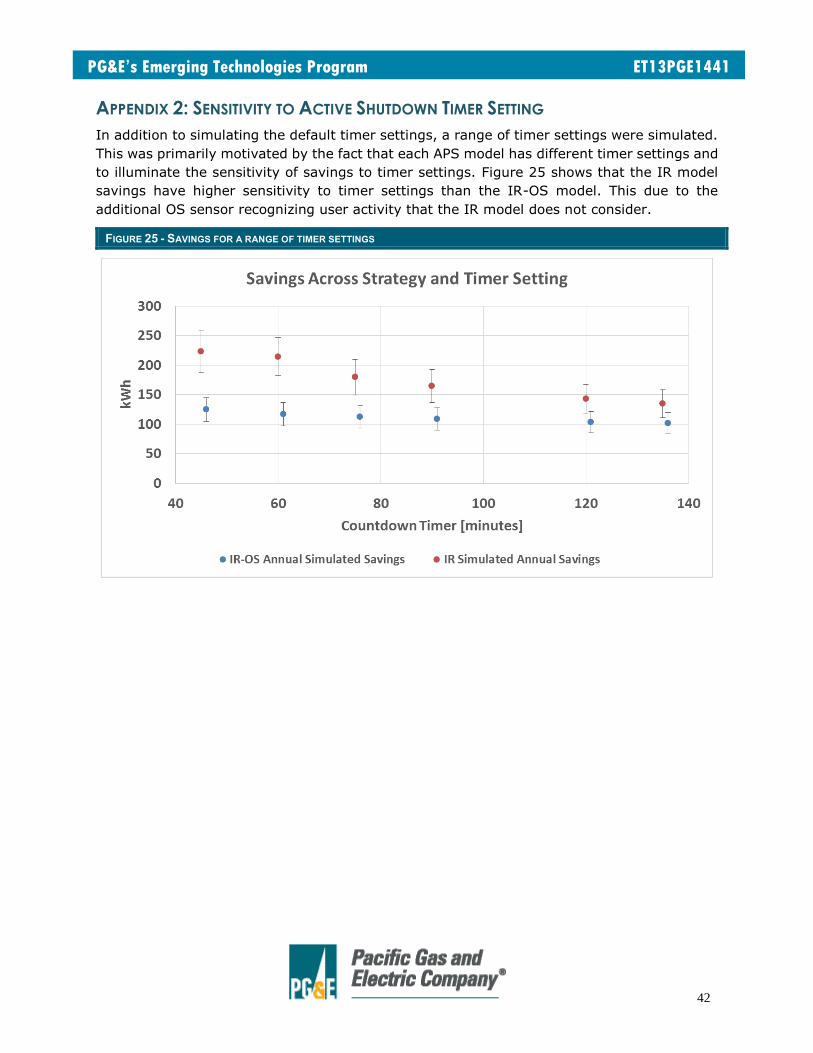
In addition to simulating the default timer settings, a range of timer settings were simulated.
This was primarily motivated by the fact that each APS model has different timer settings and
to illuminate the sensitivity of savings to timer settings. Figure 25 shows that the IR model
savings have higher sensitivity to timer settings than the IR-OS model. This due to the
additional OS sensor recognizing user activity that the IR model does not consider.
FIGURE 25 - SAVINGS FOR A RANGE OF TIMER SETTINGS

43
PG&E’s Emerging Technologies Program ET13PGE1441
APPENDIX 3: SURVEY OF M&V HOST SITES
Initial Screening:
1 Do you have vacation plans within the next 6 weeks?
2 Do you live in an apartment/multi-family building or a standalone house?
3 Do you rent or own?
4 Number of residents in household
5 Ages of residents (please list)
6 Please list the A/V equipment you have at your main TV (DVD, Xbox, PS,
Roku, AppleTV, Wii, Stereo, Powered Speakers, etc.)
7 What type of TV is your main TV? (Cathode Ray Tube, Rear/Digital
Projection, LCD, LED, Plasma)
8 Do you have cable TV or satellite TV service?
Baseline (pre-period) install visit survey:
Tier 2 APS M&V Host Customer Survey
Host Customer:
Topics to be answered at baseline installation:
Date:
Type of building:
Number of TVs in house. Where is the monitored one located?
List of A/V equipment and age of each. Controlled/uncontrolled as installed on strip.
Device Make/Model (Un)controlled Active Power Standby Power
Do you plan on replacing or adding any A/V equipment and when?
How many hours of TV use per week?
Do you unplug or turn off the power strip switch when not in use?
APS (post-period) install visit survey:
Tier 2 APS M&V Host Customer Survey
Host Customer:
Topics to be answered at APS installation:
Date:
List of A/V equipment and age of each. Controlled/uncontrolled as installed on strip.
Device Make/Model (Un)controlled Active Power Standby Power
Was the blinking LED light intrusive or disruptive?

44
PG&E’s Emerging Technologies Program ET13PGE1441
Did it ever start blinking on its own, that you noticed?
Final (data collection) visit survey:
Tier 2 APS M&V Host Customer Survey
Host Customer:
Topics to be answered at data collection:
Date:
List of A/V equipment and age of each. Controlled/uncontrolled as installed on strip.
Device Make/Model (Un)controlled Active Power Standby Power
Was the blinking LED light intrusive or disruptive?
Did it ever start blinking on its own, that you noticed?
Did the strip ever turn off equipment while you were actively using it?
Would you like to keep the strip installed where it is (move for customer if desired)?
45
PG&E’s Emerging Technologies Program ET13PGE1441
APPENDIX 4: SCALED FIELD PLACEMENT SURVEY REPORT
The following is a reformatted recreation of the final scaled field placement customer survey
report written by Illume and included with their permission.
Tier 2 Advanced Power Strips: Survey Results
Prepared for: TechniArt
Pacific Gas & Electric San Diego Gas & Electric
February 2016
Contact Name:
Laura Schauer Shannon Kahl
ILLUME Advising, LLC
608-561-1076 [email protected]

46
PG&E’s Emerging Technologies Program ET13PGE1441
Foreword
This report documents the key findings and detailed results of a study commissioned by
TechniArt on behalf of San Diego Gas & Electric and Pacific Gas and Electric (referred to as
the utilities). The primary objective of the study was to explore customers’ experiences with
and drivers of persistence of Tier 2 Advanced Power Strips.
Two manufacturers were included in the field trial. The Tier 2 Advanced Power Strips were
installed within three specified zip codes in three waves, from October 2014 through July
2015.
It is important to note that while the field trial included devices from different manufacturers,
neither the field trial nor the study were designed to test the differences in response and/or
persistence between those manufacturers. Rather, any differences by manufacturer identified
within the report are intended to highlight key findings related to potential drivers of
persistence in the category (e.g., age of population serviced and differences in time frame
between installation and survey).
There are numerous variables that can drive persistence, including delivery channel (e.g.,
direct installation, kits, rebates), demographics (age, children in household, income), time of
product installation, time of survey, targeting approach, and differences in technologies.
Testing the differences in persistence and other metrics by any of these design and delivery
variables requires a planned field trial and study design. Program implementers may wish to
consider a field trial that focuses on certain persistence drivers related to their population or
program design.

47
PG&E’s Emerging Technologies Program ET13PGE1441
1 Executive Summary
1.1 Introduction
In 2015, San Diego Gas & Electric (SDG&E) and Pacific Gas & Electric (PG&E) field trialed a
Tier 2 advanced power strip (Tier 2 APS) direct install program. The field trial targeted a total
of 1,100 homes in SDG&E’s service area. The field trial included Tier 2 APS devices through
two manufacturers: one that was an infrared model (IR model) and one that was an infrared
occupancy sensor model (IR-OS model). TechniArt implemented the field trial.
TechniArt, on behalf of SDG&E and PG&E, contracted with Illume Advising, LLC, (ILLUME) to
complete a study to explore customers’ experiences with the Tier 2 APS and their actions that
could affect measure persistence. Specifically, the following researchable areas were
explored:
Overall satisfaction with the Tier 2 APS;
Persistence rate;
Baseline conditions prior to the installation of the Tier 2 APS;
Modifications to the equipment after installation;
Customer likes and dislikes about the technology;
Number, frequency and customer reaction to shutdowns;
Customer knowledge and understanding of the product;
Household characteristics.
1.2 Approach
ILLUME administered a 10-minute email survey to a sample of IR model and census of IR-OS
model participants. To increase response, follow-up telephone surveys were completed with
IR-OS model participants. These surveys were completed approximately 14 to 29 weeks after
the IR model power strip was installed and 3 to 13 weeks5 after the IR-OS model power strip
was installed. One hundred twenty-five IR model and 77 IR-OS model customers were
surveyed. The data was weighted by manufacturer and retiree status to account for the
disproportionate sampling and response by manufacturer and the higher percentage of
households with a retired member among survey respondents than in the population of
installed households.
1.3 Key Findings
Findings Related to Persistence, Satisfaction, and Product Knowledge
The Tier 2 advanced power strips have an 84% persistence rate. There are a number
of factors that affect the persistence rate. Television shutdowns negatively affect the
persistence, with those having a shutdown being more likely to remove the device. Survey
respondents that experienced at least one shutdown had a 78% persistence rate compared
5 Respondents with fewer than 4 weeks between installation date and survey date were excluded from analysis.

48
PG&E’s Emerging Technologies Program ET13PGE1441
to a 91% persistence rate among respondents that did not. Furthermore, the occurrence of
television shutdowns was the most frequently cited reason for removing the Tier 2 APS.
Other drivers that that appear to affect persistence include: age or retiree status of
respondent (fewer retired respondents still had the Tier 2 APS installed at the time of the
survey) and time between installation and survey (persistence decreased as the length of
time between installation and survey increased). The differences in persistence among these
variables are not statistically significant and should be viewed as indicators only.
Seventy percent of respondents are satisfied with the Tier 2 advanced power strips; device
shutdowns and respondent age appear to affect satisfaction. On a scale of one to seven,
where seven is very satisfied, 70 percent of respondents indicated they were satisfied with
the Tier 2 APS (rated a five through seven on a seven-point scale) and another 12 percent
gave a neutral satisfaction rating of four, resulting in a mean satisfaction rating of 5.2. Having
the Tier 2 APS turn off devices when not in use and saving energy are the product features
respondents most frequently noted they like best. Furthermore, almost half (47%) reported
that there are no features or functionality of the Tier 2 APS that they dislike.
Respondents that experienced having the Tier 2 APS turn off their television during viewing
gave the Tier 2 APS significantly lower overall satisfaction ratings. These respondents were
also significantly less likely to recommend the Tier 2 APS or say they would purchase another
Tier 2 APS for use elsewhere in their home.
Respondents 65 and older rated their satisfaction with the Tier 2 APS lower than the younger
respondents. Consequently they are less likely to have recommended or plan to recommend
the product, are less likely to purchase another Tier 2 APS, and are more likely to state there
are features or functionality they dislike.
Seventy percent of households said they recommended or are likely to recommend
the Tier 2 advanced power strip to friends or family, 35% would purchase another
for use elsewhere in their home. Forty-one percent of respondents said they have
recommended the Tier 2 APS, and of those who have not yet recommended the Tier 2 APS,
48 percent said they are likely to recommend it. Thirty percent also remained undecided at
the time of the survey about whether or not they would purchase another Tier 2 APS.
Additional Findings
Respondents have a good understanding of how the Tier 2 advanced power strip
works. Sixty percent say they understand how to use the Tier 2 APS very well (rated a six or
seven on a seven-point scale) and 55 percent are very confident (rated a six or seven on a
seven-point scale) they could set up the Tier 2 APS somewhere else.
Households with children report higher product knowledge and are more likely to
purchase another Tier 2 advanced power strip. These households rated their
understanding of how the Tier 2 APS works and their confidence in their ability to set it up
elsewhere significantly higher than households that do not have children living in them. A
significantly higher percentage also said they would purchase another Tier 2 APS, 46 percent
compared to 28 percent among households that do not have children.

49
PG&E’s Emerging Technologies Program ET13PGE1441
Compared to respondents that have not experienced shutdowns, respondents that
have experienced shutdowns are significantly more likely to know they can make
adjustments to the shutdown settings. Seventy-eight percent of respondents that have
had a shutdown knew they could adjust the settings compared to half of those that have not
had a shutdown.
Respondents have difficulties turning on the devices plugged into the Tier 2
advanced power strip. This may indicate an opportunity for customer education during the
direct install process. These difficulties were commonly mentioned as both a reason for
unplugging the Tier 2 APS and as a feature respondents disliked. Specific difficulties
respondents mentioned included having to push an additional button to turn devices on, that
the television is slow to turn on and sometimes being uncertain if a device is on.
2 Introduction and Objectives
Under the direction and funded by San Diego Gas & Electric and Pacific Gas & Electric,
TechniArt recently field trialed a program that offered customers and direct installed a Tier 2
APS. The field trial targeted a total of 1,100 homes in three zip codes (91911, 92008, 92128).
TechniArt installed the devices in two waves. They first installed the IR model Tier 2 APS
devices from October 2014 to January 2015. They then installed the IR-OS model Tier 2 APS
devices from April to June 2015. The field trial program had a goal of installing a total of 1,100
power strips (750 IR model and 350 IR-OS model) to assess customer satisfaction and
persistence rate. At the time of survey sampling, a total of 870 (604 IR model and 266 IR-
OS model) Tier 2 APS devices were installed.
SDG&E provided lists of customers in three zip codes used for door-to-door recruitment for
participation in the field trial; customers who had opted out of utility communications were
omitted from the targeted homes. In order to qualify, the homes needed to have a television.
Respondents from the same zip codes were targeted for installation of both Tier 2 APS
manufacturers.
The sponsoring utilities had an objective in having follow up surveys completed with
participants in the field trial to gauge their satisfaction with the Tier 2 APS as well as to
understand issues related to persistence, plugged in equipment, and overall impression of the
device.
The following researchable areas were explored:
Overall satisfaction with the Tier 2 APS;
Persistence rate;
Baseline conditions prior to the installation of the Tier 2 APS;
Modifications to the equipment after installation;
Customer likes and dislikes about the technology;
Number, frequency and customer reaction to shutdowns;
Customer knowledge and understanding of the product;
Household characteristics.

50
PG&E’s Emerging Technologies Program ET13PGE1441
3 Approach
3.1 Survey Methodology
The study consisted of a 10-minute email and telephone survey of residential customers. The
surveys were completed approximately 14 to 29 weeks after the IR model power strip was
installed and 3 to 13 weeks after the IR-OS model power strip was installed. Six respondents
with fewer than 4 weeks between installation date and survey date were excluded from the
analysis to ensure sufficient time to experience the Tier 2 APS and to allow them time to
remove it if they were dissatisfied with it. ILLUME’s market research partner, Leede Research,
sent emails to elicit participation in a web-based survey with a goal of achieving 75 completed
surveys from each manufacturer.
The completion target for the IR model was exceeded, at 125 completed surveys, all through
the web-based survey platform. A $10 incentive was used to encourage participation in the
survey. These surveys were in field from April 28 through May 10, 2015
Seventy-seven surveys with IR-OS model participants were also completed. Because of the
later installation period for the IR-OS model Tier 2 APS, the survey was sent in two waves.
The first wave, surveying participants from March 12 and May 30, 2015, was fielded June 10
to June 28, 2015. The second wave, surveying participants from June 1 and June 18 2015,
was fielded August 4 through August 21, 2015. Table 1 displays the installation and survey
date ranges.
TABLE 1. INSTALLATION AND SURVEY DATE RANGES
IR model
IR-OS model
(Wave 1)
IR-OS model
(Wave 2)
Installation date range
October 2014 –
January 2015
March 2015 – May
2015 June 2015
Survey date range
April 28 2015 –
May 10 2015
June 10-June 28,
2015
August 4 –
August 19, 2015
Average number of weeks
from install to survey 23 8 9
There were considerably fewer participants in the IR-OS model participant population;
therefore, while most surveys were completed online with respondents recruited via email,
follow-up telephone surveys were also completed to meet the completion target. Also due to
the smaller sample size and a desire to achieve higher than the targeted 75 responses,
respondents were offered a higher incentive ($20) for completing the survey6.
The survey instrument was modified slightly after the IR model survey was fielded to further
investigate certain areas based on client feedback7. In order to maintain comparability
6 Literature suggests that differences in incentive levels such as this should not bias results; rather, the implication is better quality data due to higher response.
7 Additional questions asked: if when changes were made, the television was moved to the wall or an “always on” outlet; if respondents used the power saving feature on their television prior to installation; how important different factors are in satisfaction with the Tier 2

51
PG&E’s Emerging Technologies Program ET13PGE1441
between the two surveys, questions were only added and not modified or removed. The IR
model version of the survey is included as Appendix A and the IR-OS model survey is included
as Appendix B with additional questions highlighted.
Table 2 provides an overview of the samples and response rates achieved for each
manufacturer. As discussed in Section 2, respondents from the same zip codes were targeted
for installation of both Tier 2 APS devices and both waves contained similar percentages of
respondents in those zip codes.
TABLE 2. SURVEY RESPONSE RATES
IR model
IR-OS
model
(Wave 1)
IR-OS
model
(Wave 2)
Total installation records 604 222 44
Records with contact information 584 220 43
Records with email 564 198 42
Email survey response 125 56 14
Email survey response rate 22% 28% 33%
Number of non-responders and phone
only customers - 164 29
Phone call response - 7
Phone call response rate - 4%
Overall response rate 22% 29%
Removed from analysis: installed < 4
weeks 0 6
Removed from analysis: didn’t provide
retiree status in survey 9 4
Final data points included in analysis 116 67
APS; if respondents wouldn’t purchase another Tier 2 APS why not; and if they would purchase another Tier 2 APS, where it would be used.

52
PG&E’s Emerging Technologies Program ET13PGE1441
3.1 Demographic Analysis and Weighting
Initial comparative analysis of the survey demographics against the population demographics
(collected through TechniArt’s installation survey) showed potential over-representation of
households with a retired member in the IR model survey respondents. Further, survey data
analysis indicated lower persistence with older respondents and households with a retired
member. This analysis raised the question of whether the data should be weighted by retiree
status of the household.
It should be noted that demographic data was missing for about half of the IR model
participants, because demographic data was added to the intake survey midway through the
IR model installation period. However, assuming that IR model participants with demographic
data in the installation survey are not systematically different from those without that data,
it appears that there were considerably more retirees in the IR model survey dataset than the
IR model population (Table 3). If this is indeed the case, unless weighted, the survey results
would over-represent retiree perspectives for the IR model. Due to the sufficient difference in
the survey versus population and the disproportionate sampling and response by
manufacturer, the decision was made to weight the data by retiree status and manufacturer.
TABLE 3. COMPARISON OF POPULATION AND SURVEYED RETIREE STATUS
IR model Population
(N=352) IR model
Surveyed (n=116) IR-OS model
Population (N=266) IR-OS model
Surveyed (n=67)
Retired 30% 47% 23% 24%
Not retired 70% 53% 77% 76% Source: Installation and survey data. Note the IR model population excludes 252 cases where retiree status is unknown, and IR model and IR-OS model surveys exclude a handful of cases (n=13) where retiree status is not reported. Percentages of surveyed households with a retiree are not weighted.
Age was not considered for this analysis for two reasons. First, the age information captured
in the survey is the age of the respondent, not necessarily the age of household members.
Given this data point reflects the response of a single person – rather than a household
characteristic – it is not as “clean” of a variable as presence of a retiree in the home (a yes
or no response). Second, the population data collected during installation did not include the
age of respondent, whereas it did collect presence of a retiree. Review of results by retiree
and age showed the two variables are closely aligned; therefore, the ILLUME team was
comfortable using retiree as a proxy for older age.

53
PG&E’s Emerging Technologies Program ET13PGE1441
4 Overall Findings
This section of the report presents the key study findings for the Tier 2 APS and consists of
four subsections: (1) Persistence; (2) Satisfaction (3) Usage Habits; and (4) Features and
Functionality. Note that the analysis represents household experience with the Tier 2 APS
(combining IR model and IR-OS model responses).
4.1 Persistence
Persistence Rate
Eighty-four percent of the Tier 2 APS devices were still installed at the time respondents were
surveyed. Of those that were removed, 53% (15) were removed more than a month after
installation. The incidence of television shutdowns significantly impacted the persistence rate.
Respondents that experienced a shutdown had a persistence rate of 78% compared to 91%
among those that had not experienced one. Furthermore, television shutdowns were also the
most frequently cited reason for removing the Tier 2 APS. This was followed by a lack of
savings reflected on the electric bill or a higher electric bill since installation (Figure 1).
Customer comments (4) also indicated difficulty in following the instructions given for how to
turn on the television and other equipment plugged into the Tier 2 APS.
FIGURE 1. TIER 2 APS PERSISTENCE RATE
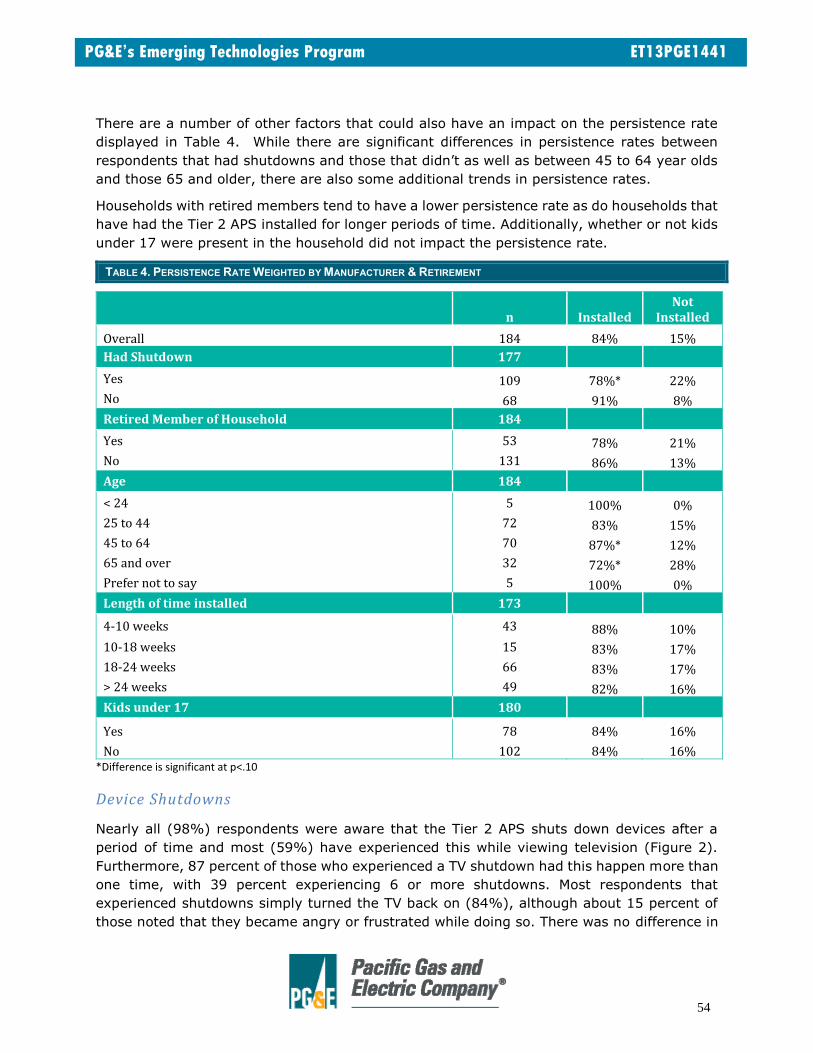
54
PG&E’s Emerging Technologies Program ET13PGE1441
There are a number of other factors that could also have an impact on the persistence rate
displayed in Table 4. While there are significant differences in persistence rates between
respondents that had shutdowns and those that didn’t as well as between 45 to 64 year olds
and those 65 and older, there are also some additional trends in persistence rates.
Households with retired members tend to have a lower persistence rate as do households that
have had the Tier 2 APS installed for longer periods of time. Additionally, whether or not kids
under 17 were present in the household did not impact the persistence rate.
TABLE 4. PERSISTENCE RATE WEIGHTED BY MANUFACTURER & RETIREMENT
n Installed Not
Installed
Overall 184 84% 15%
Had Shutdown 177
Yes 109 78%* 22%
No 68 91% 8%
Retired Member of Household 184
Yes 53 78% 21%
No 131 86% 13%
Age 184
< 24 5 100% 0%
25 to 44 72 83% 15%
45 to 64 70 87%* 12%
65 and over 32 72%* 28%
Prefer not to say 5 100% 0%
Length of time installed 173
4-10 weeks 43 88% 10%
10-18 weeks 15 83% 17%
18-24 weeks 66 83% 17%
> 24 weeks 49 82% 16%
Kids under 17 180
Yes 78 84% 16%
No 102 84% 16% *Difference is significant at p<.10
Device Shutdowns
Nearly all (98%) respondents were aware that the Tier 2 APS shuts down devices after a
period of time and most (59%) have experienced this while viewing television (Figure 2).
Furthermore, 87 percent of those who experienced a TV shutdown had this happen more than
one time, with 39 percent experiencing 6 or more shutdowns. Most respondents that
experienced shutdowns simply turned the TV back on (84%), although about 15 percent of
those noted that they became angry or frustrated while doing so. There was no difference in

55
PG&E’s Emerging Technologies Program ET13PGE1441
the incidence of shutdowns by the age, number of kids at home or retiree status of the
respondents.
FIGURE 2. TIER 2 ADVANCED POWER STRIP TELEVISION SHUTDOWNS
Two-thirds of respondents are aware that they can adjust the shutdown time settings on the
Tier 2 APS but fewer than half (40%) who were aware they could adjust the settings made
any changes to them. Adjustments to 3-4 hours (43%) and 8 hours (24%) were most
common.
Twelve respondents indicated that the Tier 2 APS interfered with their audiovisual activities
in some manner other than shutting down. They cited a variety of different problems, with
recording problems the only one mentioned by more than one respondent. Four (35%) of the
respondents removed the Tier 2 APS as a result of these issues.
4.2 Satisfaction
Overall Satisfaction
Customers were asked to rate their satisfaction with the device itself as well as the installation
visit on a seven-point scale where one is not at all satisfied and seven being very satisfied.
The mean satisfaction rating for the Tier 2 APS was 5.2 and the mean satisfaction rating for
the installation visit was 6.3. As illustrated in Figure 3, 70% of respondents indicated they
were satisfied (rated a five through seven) with the Tier 2 APS and 91% were satisfied with
the installation visit, with 95% of the respondents recalling that the installer showed them
how to use the Tier 2 APS.

56
PG&E’s Emerging Technologies Program ET13PGE1441
Eighteen percent of respondents indicated they were not satisfied with the Tier 2 APS (rating
it a one through three on the seven-point scale). As discussed later in the report, respondents
most commonly reported shutdowns as a feature they disliked about the Tier 2 APS, which
may have contributed, to the low satisfaction.
FIGURE 3. SATISFACTION WITH THE TIER 2 APS AND INSTALLATION VISIT (N=183)
As another measure of satisfaction with the product, customers were also asked if they have,
or would, recommend the Tier 2 APS to friends or family. Forty-one percent of the respondents
have already recommended the Tier 2 APS. Of those that haven’t already recommended the
product, 48% stated they are likely (rated a five through seven on a seven-point scale, with
seven being very likely) to recommend the product to friends or family. Figure 4 provides
more details on the likeliness of respondents to recommend the Tier 2 APS.
FIGURE 4. RECOMMENDATION OF THE TIER 2 ADVANCED POWER STRIP
70%91%
12%
7%18%2%
Tier 2 APS Installation Visit
Satisfied Neutral Not Satisfied

57
PG&E’s Emerging Technologies Program ET13PGE1441
Lastly, respondents were asked if they would purchase another Tier 2 APS for use elsewhere
in their home. About a third (35%) said that they would purchase another Tier 2 APS.
FIGURE 5. WOULD YOU PURCHASE ANOTHER ADVANCED POWER STRIP FOR ELSEWHERE IN YOUR HOME? (N=183)
A question was added to the IR-OS model survey in order to gain a better understanding of
why respondents would not purchase another power strip for use elsewhere in their home. As
shown in Figure 6, the most frequently cited reason was because another Tier 2 APS is not
needed (cited by 40%, or 11 respondents), followed by cost (27%, or 8 respondents). The
remaining respondents cited a variety of reasons such as uncertainty about the energy
savings, advantages or functionality, devices being too complicated or producing too much
light, lack of interest or the ability to turn off devices oneself.
FIGURE 6. WOULD YOU PURCHASE ANOTHER ADVANCED POWER STRIP FOR ELSEWHERE IN YOUR HOME? (N=28, IR-OS MODEL
SURVEY ONLY)
Respondents that said they would purchase another Tier 2 APS were asked in which room
they would use it. The most common locations respondents would use another Tier 2 APS are
the bedroom (53%) and secondary media room (38%).
Yes, 35%
No, 35%
Not Sure,
30%
18%
6%
9%
27%
40%
Other
Too complicated
Uncertainty
Cost
Not needed

58
PG&E’s Emerging Technologies Program ET13PGE1441
Impact of Device Shutdowns on Satisfaction
Device shutdowns have a significant negative effect on product satisfaction. As illustrated
below in Figure 7, respondents that experienced a device shutdown while viewing television
had significantly lower satisfaction than those that did not experience one. Respondents that
experienced shutdowns were also significantly less likely to recommend the advanced Tier 2
APS or say they would purchase another Tier 2 APS for use elsewhere in their home. They
were also significantly more likely to state there were product features or functionality they
disliked.
FIGURE 7. IMPACT OF DEVICE SHUTDOWNS (N=176)
*Difference is significant at p<.10
Satisfaction Among Demographic Groups
Satisfaction is significantly lower among retirees and respondents 65 and older (Figure 8).
Those 65 and older rated their satisfaction lower, and were less likely to have recommended
the Tier 2 APS already or to recommend it in the future if they haven’t already and are less
likely to purchase another Tier 2 APS than younger respondents. Similarly, households with
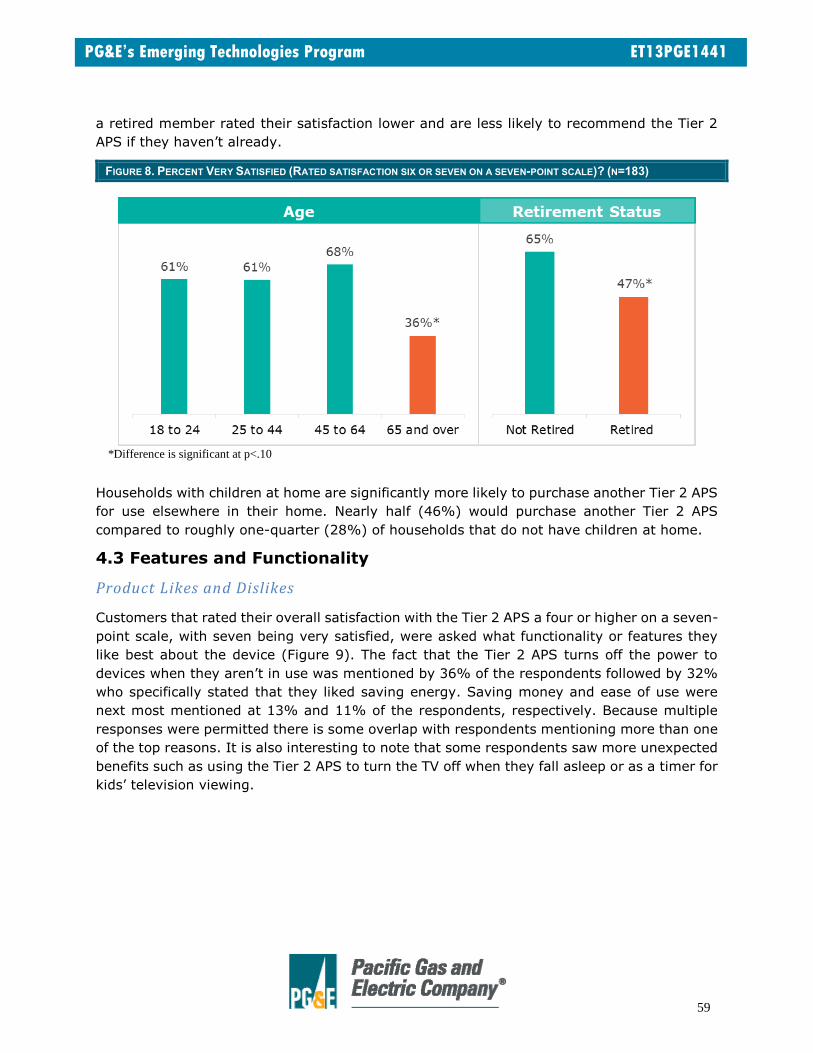
59
PG&E’s Emerging Technologies Program ET13PGE1441
a retired member rated their satisfaction lower and are less likely to recommend the Tier 2
APS if they haven’t already.
FIGURE 8. PERCENT VERY SATISFIED (RATED SATISFACTION SIX OR SEVEN ON A SEVEN-POINT SCALE)? (N=183)
*Difference is significant at p<.10
Households with children at home are significantly more likely to purchase another Tier 2 APS
for use elsewhere in their home. Nearly half (46%) would purchase another Tier 2 APS
compared to roughly one-quarter (28%) of households that do not have children at home.
4.3 Features and Functionality
Product Likes and Dislikes
Customers that rated their overall satisfaction with the Tier 2 APS a four or higher on a seven-
point scale, with seven being very satisfied, were asked what functionality or features they
like best about the device (Figure 9). The fact that the Tier 2 APS turns off the power to
devices when they aren’t in use was mentioned by 36% of the respondents followed by 32%
who specifically stated that they liked saving energy. Saving money and ease of use were
next most mentioned at 13% and 11% of the respondents, respectively. Because multiple
responses were permitted there is some overlap with respondents mentioning more than one
of the top reasons. It is also interesting to note that some respondents saw more unexpected
benefits such as using the Tier 2 APS to turn the TV off when they fall asleep or as a timer for
kids’ television viewing.

60
PG&E’s Emerging Technologies Program ET13PGE1441
FIGURE 9. MOST FREQUENTLY MENTIONED FEATURES RESPONDENTS LIKE ABOUT THE TIER 2 ADVANCED POWER STRIP
(N=146, MULTIPLE RESPONSES PERMITTED)
All respondents were asked if there were any features or functionality that they disliked.
Almost half (47%) responded that there are no features or functionality they dislike. Forty-
three percent said there were and the remaining 10% were undecided. As shown in Figure 10
below, the most frequently mentioned drawback was television shutdowns (43%). Among
those that cited shutdowns, just over one-quarter (27%) specifically mentioned shutdowns
during extended viewing such as when watching movies, recorded TV or sporting events. This
was followed by difficulties or slowness when turning on the television or having to use the
volume button to turn on TV which was mentioned by 25% of respondents. Specific difficulties
respondents mentioned included having to push an additional button to turn devices on, that
the television is slow to turn on and sometimes being uncertain if a device is on.
FIGURE 10. MOST FREQUENTLY MENTIONED FEATURES RESPONDENTS DISLIKE ABOUT THE TIER 2 ADVANCED POWER STRIP
(N=78, MULTIPLE RESPONSES PERMITTED)
3%
4%
11%
13%
32%
36%
Turns off TV when you fall asleep
Out of sight/mind
Easy to use
Saves money
Saves energy
Turns off power
3%
4%
4%
4%
5%
8%
10%
25%
43%
Difficult to use
Green light
Interferes with devices other than TV
Audio problems
Too short/plugs don't fit
Sensor
Shutdown settings/Hard to adjust…
Problems turning on/slow to turn on
TV shutdowns

61
PG&E’s Emerging Technologies Program ET13PGE1441
Product Knowledge
Respondents are fairly confident in their understanding of the Tier 2 APS and, to a lesser
extent, their ability to set up the device elsewhere. As shown in Figure 11, sixty percent of
respondents say they understand how to use the Tier 2 APS very well (rated a six or seven
on a seven-point scale, with seven being very well and one being not at all) and only three
percent say they do not understand how it works (rated a one or two). As further evidence of
the respondents’ understanding of the Tier 2 APS, 64 percent have shown others in their
household how to use the device. In comparison, 55 percent of respondents are very confident
they could set up the Tier 2 APS with another AV system and 15 percent are not confident
they could set up the Tier 2 APS with another AV system (rated a one or two).
FIGURE 11. PRODUCT KNOWLEDGE (N=183)
As illustrated in Figure 12, product knowledge does vary by demographic factors. Households
with kids and households that do not have a retired member rated their understanding of how
to use the Tier 2 APS and ability to set up the device elsewhere significantly higher.
Additionally, respondents 65 and older rated their understanding significantly lower than
respondents 25 to 44 years old and rated their ability to set up the Tier 2 APS elsewhere
significantly lower than respondents 25 to 64 years old.
60%
55%
37%
30%
3%
15%
How well do you understand how the
power strip works?
How confident are you that you could
set up the power strip elsewhere?
Very (6 or 7) Somewhat (3-5) Not (1-2)

62
PG&E’s Emerging Technologies Program ET13PGE1441
FIGURE 12. PERCENT RATING THEIR UNDERSTANDING OF AND ABILITY TO SET UP POWER STRIP A SIX OR SEVEN
*Difference significant at p<.10
4.4 Usage Habits
Modifications
The survey assessed whether respondents made any changes to the Tier 2 APS since
installation by asking if they have changed how devices are plugged in, added equipment or
made any other changes to the Tier 2 APS. Almost one-fifth (19%) have changed how devices
are plugged in, with 14 percent adding additional equipment and 6 percent making other
changes.
When respondents did make changes to how the devices were plugged into the Tier 2 APS,
they most frequently moved the TV (13 respondents, or 43%), Blue-ray or DVD (11
respondents, or 37%), or the DVR (10 respondents, or 32%). The most frequently cited
reasons for these changes were because of interference with device operations and because
a device or the Tier 2 APS was moved to a new location. IR-OS respondents that changed
how the TV was plugged into the Tier 2 APS were also asked if the TV was moved to an
“always on” outlet and all reported that it was not.
Game consoles (8 respondents, or 39%) were the most frequently added equipment and
moving the Tier 2 APS to a new home or location was the most frequently cited other change
people made to the device.
Conditions Prior to Tier 2 Advanced Power Strip
In order to understand baseline conditions prior to the installation of the Tier 2 APS,
respondents were asked whether or not their television has built in energy saving features or
if they unplugged their previous Tier 2 APS at night or when away from home for extended
periods of time. There is a large degree of uncertainty around built-in energy saving features.
Thirty-five percent were unsure if their television has built-in power saving features and 37
percent were aware that their television has built in power saving features. The remaining 28
percent said their television does not have built-in power saving features. Additionally, very
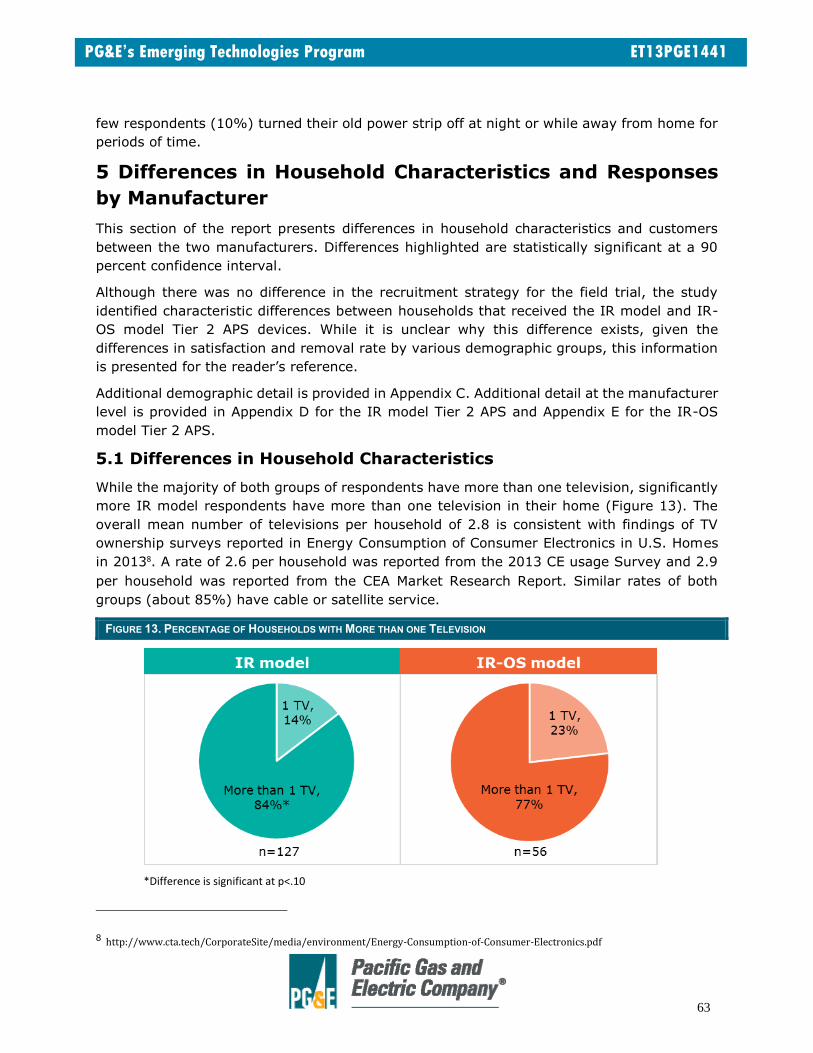
63
PG&E’s Emerging Technologies Program ET13PGE1441
few respondents (10%) turned their old power strip off at night or while away from home for
periods of time.
5 Differences in Household Characteristics and Responses
by Manufacturer
This section of the report presents differences in household characteristics and customers
between the two manufacturers. Differences highlighted are statistically significant at a 90
percent confidence interval.
Although there was no difference in the recruitment strategy for the field trial, the study
identified characteristic differences between households that received the IR model and IR-
OS model Tier 2 APS devices. While it is unclear why this difference exists, given the
differences in satisfaction and removal rate by various demographic groups, this information
is presented for the reader’s reference.
Additional demographic detail is provided in Appendix C. Additional detail at the manufacturer
level is provided in Appendix D for the IR model Tier 2 APS and Appendix E for the IR-OS
model Tier 2 APS.
5.1 Differences in Household Characteristics
While the majority of both groups of respondents have more than one television, significantly
more IR model respondents have more than one television in their home (Figure 13). The
overall mean number of televisions per household of 2.8 is consistent with findings of TV
ownership surveys reported in Energy Consumption of Consumer Electronics in U.S. Homes
in 20138. A rate of 2.6 per household was reported from the 2013 CE usage Survey and 2.9
per household was reported from the CEA Market Research Report. Similar rates of both
groups (about 85%) have cable or satellite service.
FIGURE 13. PERCENTAGE OF HOUSEHOLDS WITH MORE THAN ONE TELEVISION
*Difference is significant at p<.10
8 http://www.cta.tech/CorporateSite/media/environment/Energy-Consumption-of-Consumer-Electronics.pdf

64
PG&E’s Emerging Technologies Program ET13PGE1441
Both groups of customers report similar numbers of people in their households; the average
household size is 3.2 for IR model and 3.3 for IR-OS model. However, significantly more IR-
OS model households report having children under the age of 17 in the household.
There are also differences in the retiree status and ages of the two groups of respondents.
Forty-three percent of the IR model households have a retired member whereas only 21% of
IR-OS model households do9. Additionally, as illustrated below in Figure 14, significantly more
IR model respondents are 65 and over.
FIGURE 14. AGE OF RESPONDENTS
*Difference is significant at p<.10
Income is another area in which the two groups of respondents vary. It should be noted that
overall, 20 percent of respondents opted not to share their household income levels.
9 These are the weighted percentages, as a result, they are different than the unweighted percentages presented in Table 3.
2%
36%39%
20%*
3%3%
47%*
36%
12%
3%
Under 24 25 to 44 45 to 64 65 and over Prefer not to
say
IR model (n=127) IR-OS model (n=56)

65
PG&E’s Emerging Technologies Program ET13PGE1441
FIGURE 15. HOUSEHOLD INCOME
*Difference is significant at p<.10
5.2 Differences in Response to Tier 2 Advanced Power Strips by
Manufacturer
Persistence
Persistence rates were similar at 83 percent for IR model and 87 percent for IR-OS model.
Though the IR model persistence rate is slightly lower, the difference is not statistically
significant and could be a function of the IR model Tier 2 APS being in field longer at the time
of survey than the IR-OS model Tier 2 APS. Customers gave different reasons for removing
the Tier 2 APS. IR model respondents cited shutdowns (9 respondents or 43%) most
frequently whereas IR-OS model respondents cited interference with other equipment (2
respondents or 25%) most frequently.
There was also a slight difference in baseline conditions. The percentage of IR-OS model
respondents who turned off their previous power strip at night or when away from home is
significantly higher than the corresponding percentage of IR model respondents (19% and
6%, respectively). However, this still represents a very small percentage of respondents in
both groups.
There is no evidence to suggest that any differences reported above are attributed to device
type.
Device Shutdowns and Shutdown Timing
Three-quarters of IR model respondents had the Tier 2 APS turn off their TV while someone
was watching it (Figure 16). Significantly fewer IR-OS model respondents reported the same
(22%). There are a few possible explanations for this difference. One is that the IR model
shutdown timer defaults to one hour whereas the IR-OS model shutdown timer defaults to
one hour and fifteen minutes. The IR-OS model also allows for additional input to determine
if devices are still in use. Another possible explanation is that the IR model devices were in
39%
40%*
21%
57%*
25%
18%
< $80,000
> $80,000
Prefer not to say
IR model (n=127) IR-OS model (n=56)

66
PG&E’s Emerging Technologies Program ET13PGE1441
use longer than the IR-OS models at the time respondents were surveyed, giving more
opportunity for the respondent to experience a shutdown.
Among respondents that have experienced a shutdown, the largest percentage (41%) of IR
model respondents have experienced 6 or more shutdowns whereas 7 of the 13 (54%) IR-
OS model respondents experienced 3 or fewer. However, this may again be explained by the
fact that the IR model devices had been installed for a longer period of time before the
respondents were surveyed.
FIGURE 16. OCCURRENCE OF DEVICE SHUTDOWNS
*Difference significant at p<.10
Significantly more IR model customers were aware that they could make adjustments to the
shutdown timing, 84% compared to 29% of IR-OS model respondents. Almost half of the IR
model respondents who knew they could adjust the settings did so, compared to only 1 of the
IR-OS model respondents. These differences may be a result of the higher occurrences of
shutdowns for IR model devices.
Satisfaction
As reported above in Section 4, device shutdowns have a large negative impact on customer
satisfaction. As a result, with a much higher rate of shutdowns, the IR model Tier 2 APS
received lower ratings on all measures of satisfaction. Figure 17 illustrates this difference in
satisfaction.

67
PG&E’s Emerging Technologies Program ET13PGE1441
FIGURE 17. SATISFACTION MEASURES
*Difference significant at p<.10
Also likely a result of the high occurrence of device shutdowns, IR model respondents were
significantly more likely to indicate there were product features or functionality they disliked.
As shown in Figure 18, almost half (48%) of IR model respondents noted there were features
they disliked compared to 31% of IR-OS model respondents. Not surprisingly, the device
shutdowns were most frequently cited by IR model respondents. IR-OS model respondents
most frequently cited problems turning it on as an area for dissatisfaction.
FIGURE 18. ARE THERE FEATURES OR FUNCTIONALITY OF THE TIER 2 APS THAT YOU DISLIKE?
*Difference significant at p<.10

68
PG&E’s Emerging Technologies Program ET13PGE1441
6. Key Findings
Findings Related to Persistence, Satisfaction, and Product Knowledge
The Tier 2 advanced power strips have an 84% persistence rate. There are a number
of factors that affect the persistence rate. Television shutdowns negatively affect the
persistence, with those having a shutdown being more likely to remove the device. Survey
respondents that experienced at least one shutdown had a 78% persistence rate compared
to a 91% persistence rate among respondents that did not. Furthermore, the occurrence of
television shutdowns was the most frequently cited reason for removing the Tier 2 APS.
Other drivers that that appear to affect persistence include: age or retiree status of
respondent (fewer retired respondents still had the Tier 2 APS installed at the time of the
survey) and time between installation and survey (persistence decreased as the length of
time between installation and survey increased). The differences in persistence among these
variables are not statistically significant and should be viewed as indicators only.
Seventy percent of respondents are satisfied with the Tier 2 advanced power strips;
device shutdowns and respondent age appear to affect satisfaction. On a scale of one
to seven, where seven is very satisfied, 70 percent of respondents indicated they were
satisfied with the Tier 2 APS (rated a five through seven on a seven-point scale) and another
12 percent gave a neutral satisfaction rating of four, resulting in a mean satisfaction rating of 5.2.
Having the Tier 2 APS turn off devices when not in use and saving energy are the product
features respondents most frequently noted they like best. Furthermore, almost half (47%)
reported that there are no features or functionality of the Tier 2 APS that they dislike.
Respondents that experienced having the Tier 2 APS turn off their television during viewing gave
the Tier 2 APS significantly lower overall satisfaction ratings. These respondents were also
significantly less likely to recommend the Tier 2 APS or say they would purchase another Tier
2 APS for use elsewhere in their home.
Respondents 65 and older rated their satisfaction with the Tier 2 APS lower than the younger
respondents. Consequently they are less likely to have recommended or plan to recommend
the product, are less likely to purchase another Tier 2 APS, and are more likely to state there
are features or functionality they dislike.
Seventy percent of households said they recommended or are likely to recommend
the Tier 2 advanced power strip to friends or family, 35% would purchase another
for use elsewhere in their home. Forty-one percent of respondents said they have
recommended the Tier 2 APS, and of those who have not yet recommended the Tier 2 APS,
48 percent said they are likely to recommend it. Thirty percent also remained undecided at
the time of the survey about whether or not they would purchase another Tier 2 APS.
Additional Findings
Respondents have a good understanding of how the Tier 2 advanced power strip
works. Sixty percent say they understand how to use the Tier 2 APS very well (rated a six or
seven on a seven-point scale) and 55 percent are very confident (rated a six or seven on a
seven-point scale) they could set up the Tier 2 APS somewhere else.

69
PG&E’s Emerging Technologies Program ET13PGE1441
Households with children report higher product knowledge and are more likely to
purchase another Tier 2 advanced power strip. These households rated their
understanding of how the Tier 2 APS works and their confidence in their ability to set it up
elsewhere significantly higher than households that do not have children living in them. A
significantly higher percentage also said they would purchase another Tier 2 APS, 46 percent
compared to 28 percent among households that do not have children.
Compared to respondents that have not experienced shutdowns, respondents that
have experienced shutdowns are significantly more likely to know they can make
adjustments to the shutdown settings. Seventy-eight percent of respondents that have
had a shutdown knew they could adjust the settings compared to half of those that have not
had a shutdown.
Respondents have difficulties turning on the devices plugged into the Tier 2
advanced power strip. This may indicate an opportunity for customer education during the
direct install process. These difficulties were commonly mentioned as both a reason for
unplugging the Tier 2 APS and as a feature respondents disliked. Specific difficulties
respondents mentioned included having to push an additional button to turn devices on, that
the television is slow to turn on and sometimes being uncertain if a device is on.
70
PG&E’s Emerging Technologies Program ET13PGE1441
APPENDIX 4-A: IR AND IR-OS MODEL SURVEYS
IR APS survey
Goal: This survey evaluates customers’ understanding and usage of the Tier 2 APS
technology, as well as their satisfaction with the equipment. Its primary goal is to determine
savings persistence for the Tier 2 APS.
Targets: 75 respondents with the IR model power strip and 75 respondents with the IR-OS
model power strip. Phone surveys will be conducted for those who do not have email available
and as a follow-up to achieve desired response if necessary.
Introduction
E-mail Text:
Dear [NAME],
Leede Research Group is conducting a survey on behalf of San Diego Gas & Electric of
customers who have recently had an advanced power strip installed. We invite you to take a
brief survey to share your experience. Your participation will give us invaluable feedback on
the effectiveness of the program and the advanced power strip technology.
If you have any questions, please contact Leede at [email protected].
Please click here to access the survey. It will take about 10 minutes of your time and in
appreciation of your participation we’re offering a $10 payment for completed surveys. You'll
receive a check in the mail 2-3 weeks after completing the survey.
Thank you,
Leede Research Group
[Screen break]
Phone Introduction:
Hello, my name is [INTERVIEWER NAME] with Leede Research Group calling on behalf of San
Diego Gas & Electric. We are conducting a survey of customers who have recently had an
advanced power strip installed. This is not a sales call, and responses will be used to inform
San Diego Gas & Electric about your experience and to understand how advanced power strips
are used. This interview will only take about 10 minutes of your time and in appreciation of
your participation we’re offering a $10 payment for completed surveys. You'll receive a check
in the mail 2-3 weeks after completing the survey. The interview will be recorded for quality
assurance purposes.
71
PG&E’s Emerging Technologies Program ET13PGE1441
F1. Are you the person who is most familiar with the installation of the advanced power strip?
Yes
No
98. Not Sure [PHONE ONLY; Ask if the person most familiar is available]
[CONTINUE WITH THE APPROPRIATE CONTACT PERSON]
PHONE SCREENING QUESTIONS
I1. Are you currently talking to me on a regular landline phone or a cell phone?
1. (Landline phone)
2. (Cell Phone)
98. (Don’t know)
99. (Refused)
[ASK IF I1 = 2, 98, 99]
I2. Are you currently driving a motorized vehicle?
1. (Yes) [Schedule call back]
2. (No)
98. (Don’t know) [Schedule call back]
99. (Refused) [Schedule call back]
VERIFICATION
V1. Do you recall having an advanced power strip installed in your home one to three
months ago?
1. Yes
2. No [TERMINATE]
98. Not Sure [PHONE ONLY; Loop back to F1]
V2. Is this power strip still plugged in?
1. Yes
2. No
98. Not Sure
[ASK IF V2 = 2]
V3. How long after the power strip was installed did you unplug it?
1. Less than 2 weeks
2. 2-4 weeks
3. More than a month
98. Not sure
[ASK IF V2 = 2]
V4. What are the main reasons you decided to stop using the device? [OPEN END]

72
PG&E’s Emerging Technologies Program ET13PGE1441
Modifications
[ASK SECTION IF V2=1, else skip to next section]
These next questions are about how you have been using the power strip and any
modifications you have needed to make.
M1. Have you made any changes to how your AV devices are plugged into the power strip
since it was installed?
1. Yes
2. No
98. Not Sure
[ASK IF M1 = 1]
M2. Which plugs did you move? (check all that apply) [MULTIPLE RESPONSE]
1. TV
2. DVR
3. Set top box
4. Cable console
5. Blu-ray or DVD Player
6. Game console
7. Speakers
8. Amplifier
9. Receiver
10. Other. [Specify____________________________]
M3. Why did you move the plugs? [OPEN END]
M4. Have you added any new equipment to the power strip?
1. Yes
2. No
98. Not Sure
[ASK IF M4 = 1]
M5. Which equipment did you add to the power strip?
1. TV
2. DVR
3. Set top box
4. Cable console
5. Blu-ray or DVD Player
6. Game console
7. Speakers
8. Amplifier
9. Receiver
10. Other. [Specify____________________________]
M6. Have you made any other changes to the power strip since it was installed? (for
example, changing location)
1. Yes
2. No
98. Not Sure
73
PG&E’s Emerging Technologies Program ET13PGE1441
[ASK IF M6=1]
M7. What changes did you make? [OPEN END]
M8. Think back to before you received the advanced power strip. Did you turn off the power
strip that your AV equipment used to be plugged into at night or when away from home
for periods of time?
1. Yes
2. No
98. Not Sure
M9. Does your television have built-in power saving features?
1. Yes
2. No
98. Not Sure
FEATURES AND FUNCTIONALITY
S1. On a scale of 1 to 7, where 1 is not at all satisfied and 7 is very satisfied: How satisfied
are you with the advanced power strip?
Not at all
satisfied
Very
satisfied
1 2 3 4 5 6 7
[ASK IF S1>3]
S2. What do you like most about the device? [OPEN END]
S3. Are there any features or functionality that you dislike?
1. Yes
2. No
98. Not Sure
[ASK IF S3=1]
S4. What functionality or features do you dislike? [OPEN END]
U1. Are you aware that the power strip shuts down your devices after a period of time?
1. Yes
2. No
98. Not Sure
U2. Has the power strip ever turned off your TV while you or someone else was watching
TV or playing video games?
1. Yes
2. No
98. Not Sure

74
PG&E’s Emerging Technologies Program ET13PGE1441
[ASK IF U2 = 1]
U2a. How many times has the power strip turned off your TV or game console while you
or someone else was watching TV or playing video games?
1. Once
2. 2-3 times
3. 4-5 times
4. 6 or more times
98. Not Sure
[ASK IF U2 = 1]
U3. What did you (or the person present) do after the power strip turned the TV or game
console off? [OPEN END]
U4. Were you aware you could adjust the shutdown time settings?
1. Yes
2. No
98. Not Sure
[ASK IF U4 = 1]
U5. Have you made adjustments to the shutdown time setting?
1. Yes
2. No
98. Not Sure
[ASK IF U5 = 1]
U6. What did you adjust the shutdown time to? [READ RESPONSE CATEGORIES]
1. 1-2 hours
2. 3-4 hours
3. 5-7 hours
4. 8 hours
98. Not Sure
U7. Has any aspect of the power strip interfered with watching TV, playing video games,
or other audiovisual activities in any other way?
1. Yes
2. No
98. Not Sure
[ASK IF U7 = 1]
U5a. How did the power strip interfere with watching TV, playing video games, or other
audiovisual activities? [OPEN END]
[ASK IF U7 = 1]
U6. What did you do as a result of this interference? [OPEN END]
U7. On a scale of 1 to 7, where 1 is not at all and 7 is very well: How well would you say
you understand how to use the power strip?
Not at all Very well
1 2 3 4 5 6 7
75
PG&E’s Emerging Technologies Program ET13PGE1441
U8. On a scale of 1 to 7, where 1 is not at all confident and 7 is very confident: How
confident are you that you could set up the power strip with another audiovisual
system (for example, in another room or at a friend’s house)?
Not at all Very
confident
1 2 3 4 5 6 7
Customer Service
C1. Did the installer who came to your home show you how the power strip works?
1. Yes
2. No
98. Not Sure
C2. Have you shown anyone else in your house how to use the power strip?
1. Yes
2. No
98. Not Applicable (no other household members)
C3. On a scale of 1 to 7, where 1 is not at all satisfied and 7 is very satisfied, how
satisfied are you with the installation visit to your home?
Not at all
satisfied
Very
satisfied
1 2 3 4 5 6 7
RECOMMENDATIONS AND REPURCHASE
R1. Have you recommended the advanced power strip to friends or family?
1. Yes
2. No
98. Not Sure
[ASK IF R1 = 2, 98]
R2. On a scale of 1 to 7, where 1 is not at all likely and 7 is very likely, please indicate
how likely you are to recommend this product to your friends and family?
Not at all likely Very likely
1 2 3 4 5 6 7
R3. Would you purchase another advanced power strip device for use elsewhere in your
home?
1. Yes
2. No
98. Not Sure

76
PG&E’s Emerging Technologies Program ET13PGE1441
Household Demographics
D1. How many TVs are there in your home?
1. 1
2. 2
3. 3
4. 4
5. 5
6. 6
7. 7
8. 8 or more
D2. Do you have cable or satellite television?
1. Yes
2. No
D3. Including yourself, how many people live in your household full time?
1. 1
2. 2
3. 3
4. 4
5. 5
6. 6
7. 7
8. 8
9. 9
10. 10 or more
98. Prefer not to say
D4. How many children under the age of 17 live in your household?
1. 0
2. 1
3. 2
4. 3
5. 4
6. 5 or more
98. Prefer not to say
D6. Does any household member work from home?
1. Yes, full-time
2. Yes, part-time/occasionally
3. No
98. Prefer not to say
[ASK IF D6=1,2]
D7. Do you have a home office?
1. Yes
2. No
98. Not Sure

77
PG&E’s Emerging Technologies Program ET13PGE1441
D7a. Is any member of your household retired?
1. Yes
2. No
98. Prefer not to say
D8. Which of the following best describes your educational background? 1. Less than high school 2. High school or GED
3. Some college 4. Technical College (2 year degree) 5. 4 Year college
6. Graduate degree 98. Prefer not to say
D9. What is your age?
1. 24 years or younger
2. 25 to 44 years
3. 45 to 64 years
4. 65 years or over
98. Prefer not to say
D10. Which of the following categories best represents your approximate annual
household income from all sources in 2014, before taxes? 1. < $40,000
2. Between $40,000 and $60,000
3. Between $60,000 and $80,000
4. Between $80,000 and $120,000
5. Over $120,000
98. Prefer not to say
Thank You and Closing
The survey has been completed. Thank you for your feedback. Have a great day!

78
PG&E’s Emerging Technologies Program ET13PGE1441
IR-OS APS survey
Goal: This survey evaluates customers’ understanding and usage of the Tier 2 APS
technology, as well as their satisfaction with the equipment. Its primary goal is to determine
savings persistence for the Tier 2 APS.
Targets: 75 respondents with the IR model power strip and 75 respondents with the IR-OS
model power strip. Phone surveys will be conducted for those who do not have email
available and as a follow-up to achieve desired response if necessary.
New Questions: Questions M2a, M10, S2a, R4 and R5 were added to this version of the
survey at the request of the client in order to further investigate certain areas.
Introduction
E-mail Text:
Dear [NAME],
Leede Research Group is conducting a survey on behalf of San Diego Gas & Electric of
customers who have recently had an advanced power strip installed. We invite you to take a
brief survey to share your experience. Your participation will give us invaluable feedback on
the effectiveness of the program and the advanced power strip technology.
If you have any questions, please contact Leede at [email protected].
Please click here to access the survey. It will take about 10 minutes of your time and in
appreciation of your participation we’re offering a $20 payment for completed surveys. You'll
receive a check in the mail 2-3 weeks after the study has been completed.
Thank you,
Leede Research Group
[Screen break]
Phone Introduction:
Hello, my name is [INTERVIEWER NAME] with Leede Research Group calling on behalf of San
Diego Gas & Electric. We are conducting a survey of customers who have recently had an
advanced power strip installed. This is not a sales call, and responses will be used to inform
San Diego Gas & Electric about your experience and to understand how advanced power strips
are used. This interview will only take about 10 minutes of your time and in appreciation of
your participation we’re offering a $20 payment for completed surveys. You'll receive a check
in the mail 2-3 weeks after completing the survey. The interview will be recorded for quality
assurance purposes.
F1. Are you the person who is most familiar with the installation of the advanced power strip?
1. Yes
2. No
98. Not Sure [PHONE ONLY; Ask if the person most familiar is available]
[CONTINUE WITH THE APPROPRIATE CONTACT PERSON]

79
PG&E’s Emerging Technologies Program ET13PGE1441
PHONE SCREENING QUESTIONS
I1. Are you currently talking to me on a regular landline phone or a cell phone?
1. (Landline phone)
2. (Cell Phone)
98. (Don’t know)
99. (Refused)
[ASK IF I1 = 2, 98, 99]
I2. Are you currently driving a motorized vehicle?
1. (Yes) [Schedule call back]
2. (No)
98. (Don’t know) [Schedule call back]
99. (Refused) [Schedule call back]
VERIFICATION
V1. Do you recall having an advanced power strip installed in your home one to three
months ago?
3. Yes
4. No [TERMINATE]
98. Not Sure [PHONE ONLY; Loop back to F1]
V2. Is this power strip still plugged in?
3. Yes
4. No
98. Not Sure
[ASK IF V2 = 2]
V3. How long after the power strip was installed did you unplug it?
4. Less than 2 weeks
5. 2-4 weeks
6. More than a month
99. Not sure
[ASK IF V2 = 2]
V4. What are the main reasons you decided to stop using the device? [OPEN END]
Modifications
[ASK SECTION IF V2=1, else skip to next section] These next questions are about how you have been using the power strip and any
modifications you have needed to make.

80
PG&E’s Emerging Technologies Program ET13PGE1441
M1. Have you made any changes to how your AV devices are plugged into the power strip
since it was installed?
3. Yes
4. No
98. Not Sure
[ASK IF M1 = 1]
M2. Which plugs did you move? (check all that apply) [MULTIPLE RESPONSE]
11. TV
12. DVR
13. Set top box
14. Cable console
15. Blu-ray or DVD Player
16. Game console
17. Speakers
18. Amplifier
19. Receiver
20. Other. [Specify____________________________]
[ASK IF M2=1]
M2a. Did you move the television to the wall or an “Always On” outlet?
3. Yes
4. No
99. Not Sure
[ASK IF M1 = 1]
M3. Why did you move the plugs? [OPEN END]
M4. Have you added any new equipment to the power strip?
1. Yes
2. No
98. Not Sure
[ASK IF M4 = 1]
M5. Which equipment did you add to the power strip?
11. TV
12. DVR
13. Set top box
14. Cable console
15. Blu-ray or DVD Player
16. Game console
17. Speakers
18. Amplifier
19. Receiver
20. Other. [Specify____________________________]
M6. Have you made any other changes to the power strip since it was installed? (for
example, changing location)
3. Yes
4. No
98. Not Sure

81
PG&E’s Emerging Technologies Program ET13PGE1441
[ASK IF M6=1]
M7. What changes did you make? [OPEN END]
M8. Think back to before you received the advanced power strip. Did you turn off the power
strip that your AV equipment used to be plugged into at night or when away from home
for periods of time?
3. Yes
4. No
98. Not Sure
M9. Does your television have built-in power saving features?
3. Yes
4. No
98. Not Sure
[ASK IF M9=1]
M10. Did you use the power saving feature on your television prior to receiving the advanced
power strip?
FEATURES AND FUNCTIONALITY
S1. On a scale of 1 to 7, where 1 is not at all satisfied and 7 is very satisfied: How satisfied
are you with the advanced power strip?
Not at all
satisfied
Very
satisfied
1 2 3 4 5 6 7
[ASK IF S1>3]
S2. What do you like most about the device? [Open End]
[ASK IF S1>3]
S2a. On a scale of 1 to 7, where 1 is not at all important and 7 is very important, How
important are each of the following in your satisfaction with the advanced power strip?
1. Surge protection
2. Protecting my electronic equipment
3. Safety
4. Power is turned off when devices are not in use
5. Saving energy
6. Saving money
7. Easy to use
S3. Are there any features or functionality that you dislike?
3. Yes
4. No
98. Not Sure
[ASK IF S3=1]
S4. What functionality or features do you dislike? [OPEN END]

82
PG&E’s Emerging Technologies Program ET13PGE1441
U1. Are you aware that the power strip shuts down your devices after a period of time?
3. Yes
4. No
99. Not Sure
U2. Has the power strip ever turned off your TV while you or someone else was watching
TV or playing video games?
3. Yes
4. No
99. Not Sure
[ASK IF U2 = 1]
U2a. How many times has the power strip turned off your TV or game console while you
or someone else was watching TV or playing video games?
5. Once
6. 2-3 times
7. 4-5 times
8. 6 or more times
99. Not Sure
[ASK IF U2 = 1]
U3. What did you (or the person present) do after the power strip turned the TV or game
console off? [OPEN END]
U4. Were you aware you could adjust the shutdown time settings?
3. Yes
4. No
99. Not Sure
[ASK IF U4 = 1]
U5. Have you made adjustments to the shutdown time setting?
3. Yes
4. No
99. Not Sure
[ASK IF U5 = 1]
U6. What did you adjust the shutdown time to? [READ RESPONSE CATEGORIES]
5. 1-2 hours
6. 3-4 hours
7. 5-7 hours
8. 8 hours
99. Not Sure
U7. Besides shutting down the TV or game console, has any other aspect of the power
strip interfered with watching TV, playing video games, or other audiovisual activities
in any other way?
3. Yes
4. No
99. Not Sure

83
PG&E’s Emerging Technologies Program ET13PGE1441
[ASK IF U7 = 1]
U5a. Besides shutting down the TV, how did the power strip interfere with watching TV,
playing video games, or other audiovisual activities? [OPEN END]
[ASK IF U7 = 1]
U6a. What did you do as a result of this interference? [OPEN END]
U7a. On a scale of 1 to 7, where 1 is not at all and 7 is very well: How well would you say
you understand how to use the power strip?
Not at all Very well
1 2 3 4 5 6 7
U8. On a scale of 1 to 7, where 1 is not at all confident and 7 is very confident: How
confident are you that you could set up the power strip with another audiovisual
system (for example, in another room or at a friend’s house)?
Not at all Very
confident
1 2 3 4 5 6 7
Customer Service
C1. Did the installer who came to your home show you how the power strip works?
3. Yes
4. No
99. Not Sure
C2. Have you shown anyone else in your house how to use the power strip?
3. Yes
4. No
98. Not Applicable (no other household members)
C3. On a scale of 1 to 7, where 1 is not at all satisfied and 7 is very satisfied, how
satisfied are you with the installation visit to your home?
Not at all
satisfied
Very
satisfied
1 2 3 4 5 6 7
RECOMMENDATIONS AND REPURCHASE
R1. Have you recommended the advanced power strip to friends or family?
1. Yes
2. No
98. Not Sure

84
PG&E’s Emerging Technologies Program ET13PGE1441
[ASK IF R1 = 2, 98]
R2. On a scale of 1 to 7, where 1 is not at all likely and 7 is very likely, please indicate
how likely you are to recommend this product to your friends and family?
Not at all likely Very likely
1 2 3 4 5 6 7
R3. Would you purchase another advanced power strip device for use elsewhere in your
home?
1. Yes
2. No
98. Not Sure
[ASK IF R3 = 2, 98]
R4. Why wouldn’t you purchase another advanced power strip for your home? [OPEN
END]
[ASK IF R3 = 1]
R5. Where in your home would you use the additional advanced power strip?
1. Bedroom
2. Children’s room
3. Secondary media room (Den, recreation room)
4. Other [SPECIFY_____________]
98. Not Sure
Household Demographics
D1. How many TVs are there in your home?
9. 1
10. 2
11. 3
12. 4
13. 5
14. 6
15. 7
16. 8 or more
D2. Do you have cable or satellite television?
3. Yes
4. No

85
PG&E’s Emerging Technologies Program ET13PGE1441
D3. Including yourself, how many people live in your household full time?
1. 1
2. 2
3. 3
4. 4
5. 5
6. 6
7. 7
8. 8
9. 9
10. 10 or more
98. Prefer not to say
D4. How many children under the age of 17 live in your household?
1. 0
2. 1
3. 2
4. 3
5. 4
6. 5 or more
98. Prefer not to say
D6. Does any household member work from home?
4. Yes, full-time
5. Yes, part-time/occasionally
6. No
98. Prefer not to say
[ASK IF D6=1,2]
D7. Do you have a home office?
1. Yes
2. No
98. Not Sure
D7a. Is any member of your household retired?
1. Yes
2. No
98. Prefer not to say
D8. Which of the following best describes your educational background? 7. Less than high school 8. High school or GED
9. Some college 10. Technical College (2 year degree) 11. 4 Year college
12. Graduate degree 98. Prefer not to say

86
PG&E’s Emerging Technologies Program ET13PGE1441
D9. What is your age?
1. 24 years or younger
2. 25 to 44 years
3. 45 to 64 years
4. 65 years or over
98. Prefer not to say
D10. Which of the following categories best represents your approximate annual
household income from all sources in 2014, before taxes? 6. < $40,000
7. Between $40,000 and $60,000
8. Between $60,000 and $80,000
9. Between $80,000 and $120,000
10. Over $120,000
98. Prefer not to say
Thank You and Closing
The survey has been completed. Thank you for your feedback. Have a great day!

87
PG&E’s Emerging Technologies Program ET13PGE1441
APPENDIX 4-B: WEIGHTED HOUSEHOLD CHARACTERISTICS
TABLE 5. NUMBER OF TELEVISIONS IN THE HOME
Overall IR model IR-OS model
Frequency Percent Frequency Percent Frequency Percent
1 33 18% 20 16% 13 23%
2 46 25% 36 29% 9 16%
3 47 25% 30 24% 17 30%
4 39 21% 26 21% 13 22%
5 16 9% 11 9% 5 9%
6 3 2% 3 2% 0 0%
TABLE 6. NUMBER OF HOMES WITH CABLE OR SATELLITE TELEVISION
Overall IR model IR-OS model
Frequency Percent Frequency Percent Frequency Percent
Yes 153 84% 104 82% 49 88%
No 30 16% 23 18% 7 12%
TABLE 7. NUMBER OF PEOPLE IN THE HOUSEHOLD
Overall IR model IR-OS model
Frequency Percent Frequency Percent Frequency Percent
1 18 10% 12 10% 6 10%
2 63 35% 46 36% 17 31%
3 27 15% 20 16% 7 13%
4 35 19% 24 19% 11 20%
5 27 15% 17 13% 10 18%
6 9 5% 5 4% 4 8%
7 2 1% 2 2% 0 0%
Prefer not to
say 1 0% 1 1% 0 0%

88
PG&E’s Emerging Technologies Program ET13PGE1441
TABLE 8. NUMBER OF CHILDREN UNDER 17 IN THE HOUSEHOLD
Overall IR model IR-OS model
Frequency Percent Frequency Percent Frequency Percent
0 102 56% 78 61% 24 43%
1 24 13% 14 11% 9 17%
2 37 20% 21 16% 16 28%
3 14 8% 10 8% 4 8%
4 3 2% 1 1% 3 5%
Prefer not to
say 4 2% 4 3% 0 0%
TABLE 9. DOES ANYONE WORK FROM HOME?
Overall IR model IR-OS model
Frequency Percent Frequency Percent Frequency Percent
Yes, full-time 35 19% 24 19% 11 19%
Yes, part-
time/occasionally 38 21% 30 24% 8 15%
No 102 56% 66 52% 36 64%
Prefer not to say 7 4% 6 5% 1 2%
TABLE10. NUMBER OF HOMES WITH A HOME OFFICE
Overall IR model IR-OS model
Frequency Percent Frequency Percent Frequency Percent
Yes 51 70% 39 71% 13 65%
No 22 30% 16 29% 7 35%
TABLE 11. IS A MEMBER OF THE HOUSEHOLD RETIRED?
Overall IR model IR-OS model
Frequency Percent Frequency Percent Frequency Percent
Yes 52 28% 39 30% 13 23%
No 131 72% 88 70% 43 77%

89
PG&E’s Emerging Technologies Program ET13PGE1441
TABLE 12. EDUCATION LEVEL
Overall IR model IR-OS model
Frequency Percent Frequency Percent Frequency Percent
High school or
GED 17 9% 11 9% 6 11%
Some college 46 25% 26 21% 19 34%
Technical College 11 6% 7 6% 4 7%
4 Year college 56 31% 39 31% 17 30%
Graduate degree 48 26% 39 30% 9 16%
Prefer not to say 5 3% 4 3% 1 2%
TABLE 13. AGE OF SURVEY RESPONDENTS
Overall IR model IR-OS model
Frequency Percent Frequency Percent Frequency Percent
Under 18 1 0% 0 0% 1 2%
18 to 24 4 2% 3 2% 1 2%
25 to 44 72 40% 46 36% 26 47%
45 to 64 69 38% 49 39% 20 36%
65 and over 32 17% 25 20% 7 12%
Prefer not to say 5 3% 4 3% 2 3%
TABLE 14. HOUSEHOLD INCOME
Overall IR model IR-OS model
Frequency Percent Frequency Percent Frequency Percent
< 40,000 20 11% 13 10% 7 12%
Between 40 and
60,000 37 20% 22 17% 15 27%
Between 60 and
80,000 24 13% 14 11% 10 18%
Between 80 and
120,000 38 21% 29 22% 9 16%
Over 120,000 27 15% 22 17% 5 9%
Prefer not to say 37 20% 27 21% 10 18%

90
PG&E’s Emerging Technologies Program ET13PGE1441
APPENDIX 4-C: IR MODEL FINDINGS
This section of the report presents the key study findings for the IR model Tier 2 APS and
consists of four subsections: (1) Persistence; (2) Satisfaction; (3) Features and Functionality;
(4) Usage Habits.
C.1 Persistence
Persistence Rate
At the time of the survey, 83% of the IR model Tier 2 APS devices were still installed. Of
those that were removed, the largest number, 11 (53%), were removed after more than a
month after installation. The most frequently cited reason for removing the Tier 2 APS among
IR model respondents was the incidence of television shutdowns.
FIGURE 19. IR MODEL PERSISTENCE RATE
Device Shutdowns
The IR model Tier 2 APS appears to shut down while respondents are watching TV frequently.
As shown in Figure 20, nearly all (99%) respondents were aware that the IR model Tier 2 APS
shuts down after a period time and most, 75%, have experienced this while viewing television.
Furthermore, 90% of those who have experienced a shutdown have had more than one, with
41% experiencing 6 or more shutdowns. Eighty-eight percent of the respondents that
experienced shutdowns simply turned the TV back on, although 20% of those noted that they
became angry or frustrated while doing so. Further investigation revealed that shutdowns are

91
PG&E’s Emerging Technologies Program ET13PGE1441
not occurring at higher rates for a particular customer group. There was no difference in the
incidence of shutdowns by the age, number of kids at home or retiree status of the
respondents.
FIGURE 20. IR MODEL SHUTDOWNS
Most respondents (84%) are aware that they can adjust the shutdown time settings on the
Tier 2 APS and almost half (44%) who were aware they could adjust the settings did.
Adjustments to 3-4 hours (44%) and 8 hours (24%) were most common.
Twelve respondents indicated that the Tier 2 APS interfered with their audiovisual activities
in some manner other than shutting down. They cited a variety of different problems, but
problems recording (2) was the only one mentioned by more than one respondent. Four of
the respondents removed the Tier 2 APS as a result of these issues.
C.2 Satisfaction
Customers were asked to rate their satisfaction with the Tier 2 APS itself as well as the
installation visit on a seven-point scale where one was not at all satisfied and seven was very
satisfied. The mean satisfaction rating for the Tier 2 APS was 5.1 and the mean satisfaction
rating for the installation visit was 6.5. As illustrated in Figure 21, 68% of respondents
indicated they were satisfied (rated a five through seven) with the Tier 2 APS and 92% were
satisfied with the installation visit, with 93% of the respondents recalling that the installer
showed them how to use the Tier 2 APS. While only one respondent was not satisfied with
the installation visit, 21% of respondents indicated they were not satisfied (rated a one
through three) with the IR model Tier 2 APS.
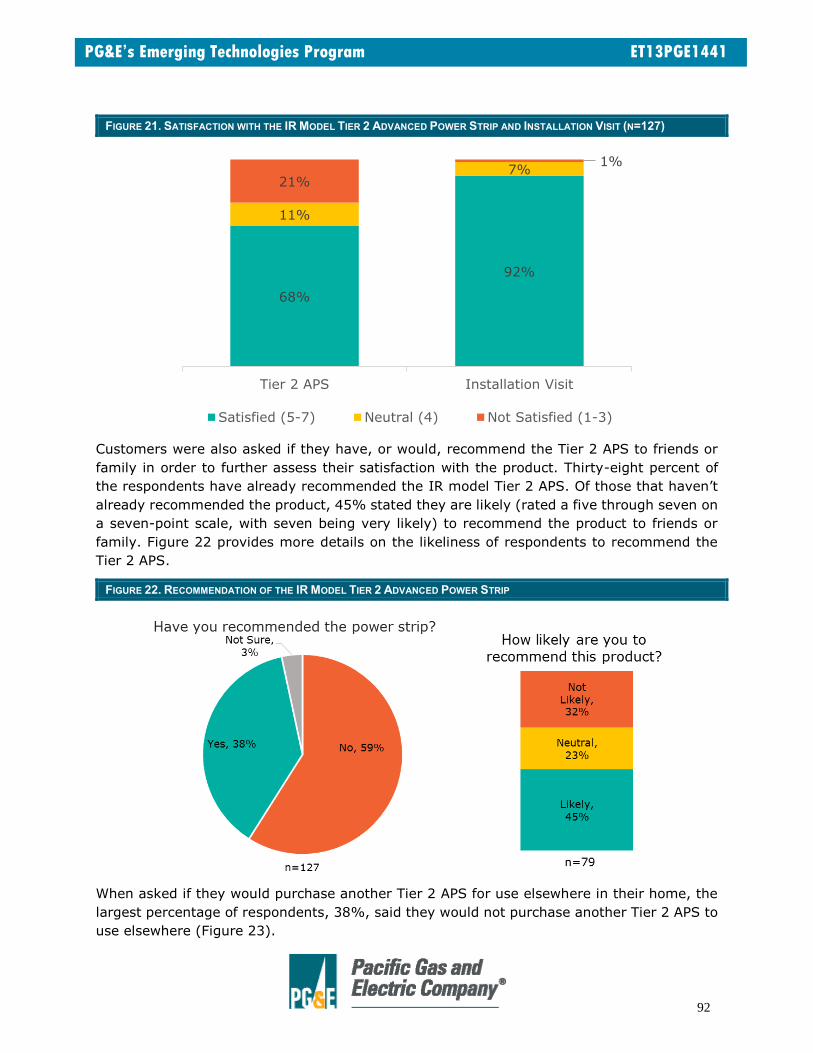
92
PG&E’s Emerging Technologies Program ET13PGE1441
FIGURE 21. SATISFACTION WITH THE IR MODEL TIER 2 ADVANCED POWER STRIP AND INSTALLATION VISIT (N=127)
Customers were also asked if they have, or would, recommend the Tier 2 APS to friends or
family in order to further assess their satisfaction with the product. Thirty-eight percent of
the respondents have already recommended the IR model Tier 2 APS. Of those that haven’t
already recommended the product, 45% stated they are likely (rated a five through seven on
a seven-point scale, with seven being very likely) to recommend the product to friends or
family. Figure 22 provides more details on the likeliness of respondents to recommend the
Tier 2 APS.
FIGURE 22. RECOMMENDATION OF THE IR MODEL TIER 2 ADVANCED POWER STRIP
When asked if they would purchase another Tier 2 APS for use elsewhere in their home, the
largest percentage of respondents, 38%, said they would not purchase another Tier 2 APS to
use elsewhere (Figure 23).
68%
92%
11%
7%21%
1%
Tier 2 APS Installation Visit
Satisfied (5-7) Neutral (4) Not Satisfied (1-3)

93
PG&E’s Emerging Technologies Program ET13PGE1441
FIGURE 23. WOULD YOU PURCHASE ANOTHER POWER STRIP FOR ELSEWHERE IN YOUR HOME? (N=127)
C.3 Features and Functionality
Product Likes and Dislikes
Customers that rated their overall satisfaction with the Tier 2 APS a four or higher on a seven-
point scale, with seven being very satisfied, were asked what functionality or features they
like best about the device (Figure 24). The fact that the Tier 2 APS turns off the power to
devices was mentioned by 39% of the respondents followed by 32% who specifically stated
that they liked saving energy and 13% who specifically stated that they liked saving money.
Because multiple responses were permitted there is some overlap with respondents
mentioning more than one of the top reasons. It is also interesting to note that some
respondents saw more unexpected benefits such as using the Tier 2 APS to turn the TV off
when you fall asleep or as a timer for kids’ television viewing.
FIGURE 24. MOST FREQUENTLY MENTIONED FEATURES RESPONDENTS LIKE ABOUT THE IR MODEL TIER 2 ADVANCED POWER
STRIP (N=96, MULTIPLE RESPONSES PERMITTED)
All respondents, including those that removed the Tier 2 APS, were asked if there were any
features or functionality that they didn’t like (Figure 25). Just under half (48%), stated that
there were features of the product they disliked. Television shutdowns were by far the biggest
Yes, 28%
No, 38%
Not Sure,
34%
3%
3%
3%
5%
9%
13%
32%
39%
Can use as timer for kids TV viewing
The idea/concept behind it
Out of sight/mind
Turns off TV when you fall asleep
Easy to use
Saving Money
Saving Energy
Turns off power source/devices

94
PG&E’s Emerging Technologies Program ET13PGE1441
drawback with 38% of respondents stating they disliked the shutdowns and another 15%
specifically stating the shutdowns with extended viewing such as when watching movies,
recorded TV or sporting events. This was followed by difficulties (dislike of having to use the
volume button to turn on TV) or slowness when turning on the television.
FIGURE 25. MOST FREQUENTLY MENTIONED FEATURES RESPONDENTS DISLIKE ABOUT THE IR MODEL TIER 2 ADVANCED
POWER STRIP (N=61, MULTIPLE RESPONSES PERMITTED)
Product Knowledge
Respondents are fairly confident in their understanding of the Tier 2 APS and to a lesser
extent, their ability to set up the Tier 2 APS elsewhere. Eighty-one percent of respondents
say they understand how to use the Tier 2 APS well (rated a five through seven on a seven-
point scale, with seven being very well and one being not at all) and only seven percent say
they do not understand how to use it (rated a one through three). In comparison, 71 percent
of respondents are confident (rated a five through seven on a seven-point scale, with seven
being very confident and one being not at all confident) they could set up the Tier 2 APS with
another AV system and 17% are not confident (rated a one through three) they could set up
the Tier 2 APS with another AV system. As further evidence of the respondents’ understanding
of the Tier 2 APS, 65% have shown others in their household how to use the devices.
C.4 Usage Habits
Modifications
Few respondents who still have the Tier 2 APS installed have made any changes to it since
installation. About 20% have changed how devices are plugged into the Tier 2 APS, 13% have
added additional equipment and 6% have made other changes.
When respondents did make changes to how the devices were plugged into the Tier 2 APS,
they most frequently changed the TV or Blue-ray or DVD, each mentioned by nine respondents
(42%), or the DVR which was mentioned by eight respondents (37%). The most frequently
cited reason for these changes was because of interference with device operations.
4%
4%
5%
5%
5%
13%
15%
15%
38%
Problems with music or audio
Doesn't work with DIRECTV
The sensor
Interference with other devices
Flashing green light
Shutdown settings/adjusting settings
Problems/slowness turning on
Shut downs with extended viewing
Shut downs in general

95
PG&E’s Emerging Technologies Program ET13PGE1441
Game consoles were the most frequently added equipment and moving the Tier 2 APS to a
new home or location was the most frequently cited other change people made to the Tier 2
APS.
Conditions Prior to Tier 2 Advanced Power Strip
With respect to energy-saving behaviors prior to the installation of the Tier 2 APS, very few
respondents (6%) turned their old power strip off at night or while away from home for periods
of time. Additionally, only 39% were aware that their television has built in power saving
features. Another 33% were not sure if their television has built-in power saving features.

96
PG&E’s Emerging Technologies Program ET13PGE1441
APPENDIX 4-D: IR-OS MODEL FINDINGS
This section of the report presents the key study findings for the IR-OS model Tier 2 APS and
consists of four subsections: (1) Persistence; (2) Satisfaction; (3) Features and Functionality;
(4) Usage Habits.
D.1 Persistence
Persistence Rate
As depicted in Figure 26, 87% of the IR-OS model Tier 2 APS devices were still installed at
the time of the survey. Of the seven devices that were no longer installed, three were removed
in less than two weeks and three were removed after more than one month. Interference with
the operation of other equipment, that the device was no longer needed or that it was too
complicated were each noted by two of the respondents that removed the device.
FIGURE 26. IR-OS MODEL PERSISTENCE RATE
Device Shutdowns
Device shutdowns have not been a major complaint of IR-OS model respondents. Almost all
(97%) respondents are aware the device will shut down after a period of time but only 22%
have had this happen while watching TV. For those who have experienced TV shutdowns,
about half (7 respondents) have experienced three or fewer shutdowns. Additional detail
regarding TV shutdowns is provided below in Figure 27. Most respondents (eight of the
thirteen) who have experienced shutdowns simply turned the TV back on when this happened

97
PG&E’s Emerging Technologies Program ET13PGE1441
and none noted that they were angry while doing so. Shutdowns with the IR-OS model Tier
2 APS occurred at higher rates in households with children under 17 (29%) than in those
without children (14%).
FIGURE 27. IR-OS MODEL TIER 2 ADVANCED POWER STRIP SHUTDOWNS
Few IR-OS model respondents (25%) were aware that they can adjust the shutdown time
settings on the Tier 2 APS and only one person has actually made adjustments to the
shutdown time.
Two respondents indicated that the Tier 2 APS interfered with their audiovisual activities in
some manner other than shutting down. The interference cited included shutting down a
receiver and the amount of time it takes for the TV to turn on.
D.2 Satisfaction
Respondents had a high rate of satisfaction with both the IR-OS model Tier 2 APS and the
installation visit. The Tier 2 APS had a mean satisfaction rating of 5.6 on a seven-point scale
with seven being very satisfied and the installation visit had a mean rating of 6.2.
Furthermore, 76% indicated they were satisfied (rated a five through seven) with the Tier 2
APS and 90% indicated they were satisfied (rated a five through seven) with the installation
visit. Very few respondents indicated they were not satisfied with the Tier 2 APS or the
installation visit. Further detail is shown below in Figure 28.

98
PG&E’s Emerging Technologies Program ET13PGE1441
FIGURE 28. OVERALL SATISFACTION WITH THE IR-OS MODEL TIER 2 ADVANCED POWER STRIP AND INSTALLATION VISIT
(N=56)
In order to further assess satisfaction with the Tier 2 APS, respondents were also asked if
they have, or would, recommend the Tier 2 APS to friends or family. As illustrated in Figure
29, nearly half (49%), of the respondents have already recommended the Tier 2 APS to
friends or family. Of those who have not yet recommended, 56% of respondents are likely
(rated a five through seven on a seven-point scale with seven being very likely) to recommend
the product.
FIGURE 29. RECOMMENDATION OF THE IR-OS MODEL TIER 2 ADVANCED POWER STRIP
Just over half (51%) of the IR-OS model respondents stated they would purchase another
Tier 2 APS for use elsewhere in their home (Figure 30). The most common locations
76%90%
13%
6%10% 4%
Tier 2 APS Installation Visit
Satisfied (5-7) Neutral (4) Not Satisfied (1-3)

99
PG&E’s Emerging Technologies Program ET13PGE1441
respondents would use another Tier 2 APS are the bedroom (53%) and secondary media room
(38%).
FIGURE 30. WOULD YOU PURCHASE ANOTHER TIER 2 ADVANCED POWER STRIP FOR ELSEWHERE IN YOUR HOME? (N=56)
In order to gain a better understanding of why respondents would not purchase another Tier
2 APS for their home, IR-OS model respondents who stated they would not purchase another
Tier 2 APS were also asked why not. The most frequently cited reason was because another
Tier 2 APS is not needed (40%), followed by cost (27%). The remaining respondents cited a
variety of reasons such as uncertainty about the advantages, functionality or energy bill
savings, devices being too complicated or producing too much light, lack of interest or the
ability to turn off devices oneself.
D.3 Features and Functionality
Product Likes and Dislikes
Respondents who rated their overall satisfaction with the IR-OS model device higher than a
three on a seven-point scale were asked what they like most about the device. The most
frequently cited responses are shown below in Figure 31. As shown, saving energy and having
power turned off are the features IR-OS model respondents like most.
FIGURE 31. MOST FREQUENTLY MENTIONED FEATURES RESPONDENTS LIKE ABOUT THE IR-OS MODEL TIER 2 ADVANCED
POWER STRIP (N=50)
These respondents were also asked to rate the importance of several product features (listed
in Figure 32) on a seven-point scale, with seven being very important, in their satisfaction
Yes, 51%
No, 28%
Not Sure,
21%
7%
13%
15%
30%
33%
Out of sight/mind
Saving Money
Easy to use
Turns off power source/devices
Saving Energy

100
PG&E’s Emerging Technologies Program ET13PGE1441
with the Tier 2 APS. When the percentage of respondents that rated each factor a six or seven
is combined, there is very little difference in the rankings with saving energy rated as being
very important by 93% and saving money rated as being very important by 92% of
respondents.
FIGURE 32. IMPORTANCE OF FEATURES IN SATISFACTION WITH THE IR-OS MODEL POWER STRIP (N=50)
All respondents were asked if there are any features or functionality of the Tier 2 APS they
dislike. Thirty-one percent of the IR-OS model reported that there was something they disliked
about the product. As shown below in Figure 33, this was most often difficulties turning the
device or television on which was cited by nine respondents (55%).
FIGURE 33. MOST FREQUENTLY MENTIONED FEATURES RESPONDENTS DISLIKE ABOUT THE IR-OS MODEL TIER 2 ADVANCED
POWER STRIP (N=16)
Product Knowledge
Overall, respondents appear to understand the Tier 2 APS fairly well. Even though all but one
respondent reported that the installer showed them how the Tier 2 APS works, 76 percent of
2
3
9
Too short/plugs don't fit
Sensor
Problems turning it on/using volume
button to turn on
# of Respondents
101
PG&E’s Emerging Technologies Program ET13PGE1441
respondents say they understand how to use the IR-OS model Tier 2 APS (rated a five through
seven on a seven-point scale, with seven being very well and one being not at all). Ten percent
do not understand (rated a one through three) how to use the Tier 2 APS. Similarly, 73% of
respondents are confident (rated a five through seven on a seven-point scale, with seven
being very confident and one being not at all confident) they could set up the Tier 2 APS with
another AV system while 13% were not confident (rated a one through three) they could set
up the Tier 2 APS with another AV system. As further evidence of the respondents’
understanding of the Tier 2 APS, 60% have shown others in their household how to use the
devices.
D.4 Usage Habits
Modifications
Very few respondents who still have the Tier 2 APS installed have made any changes to it
since installation. About 17% have changed how devices are plugged into the Tier 2 APS,
17% have added additional equipment and 7% have made other changes.
When respondents did make changes to how the devices were plugged into the Tier 2 APS,
they most frequently changed the TV (3 respondents) or Blue-ray or DVD (2 respondents).
None of the respondents that moved the TV moved it to an “Always on” outlet.
Game consoles were the most frequently added equipment, mentioned by four respondents,
and moving the Tier 2 APS to a new home or location was the most frequently cited (3
respondents) other change people made to the Tier 2 APS.
Conditions Prior to Tier 2 Advanced Power Strip
Respondents were also asked about their energy-saving habits related to audiovisual
equipment prior to the installation of the Tier 2 APS. Nineteen percent of respondents were
turning off their Tier 2 APS at night or when away from home for extended periods of time.
Respondents were largely unsure about their television’s built-in power saving features, with
38% stating they weren’t sure if their TV has built-in power saving features. Thirty-five
percent of respondents stated their TV does have power saving features, however, only 5 of
those respondents (30%) used the features.

102
PG&E’s Emerging Technologies Program ET13PGE1441
REFERENCES B. Urban, V. T. (2011). Energy Consumption of Consumer Electronics in U.S. Homes in 2010. Fraunhofer USA. BPA. (2013). Advanced Power Strips (APS) Planning UES Measure Proposal. Regional Technical Forum.
Bonneville Power Administration.
Conti, J. J. (2014). Annual Energy Outlook 2014. U.S. Energy Information Administration.
CPUC. (2013). Energy Efficiency Policy Manual. California Public Utilities Commission.
EnergyConsult. (2012). Advanced Power Strip (APS) Audio Visual (AV) Field Trial: California.
I. Metzger, e. a. (2014). Reducing Office Plug Loads through Simple and Inexpensive Advanced Power Strips.
ASHRAE Annual Conference. New York: National Renewable Energy Laboratory.
KEMA. (2009). California Residential Appliance Saturation Study. California Energy Commission.
Kessler, S. e. (2011). Advanced Power Strip Research Report. Lockheed Martin for the New York State Energy
Research Development Authority (NYSERDA).
Malik, L. (2012). Advanced Power Strips: Overview of NE Programs Promoting APS. Northeast Energy Efficiency
Partnerships (NEEP) AESP Brownbag Webinar. Efficiency Vermont, Mass Save, and NYSERDA.
Malik, L. a. (2011). Advanced Power Strips: Energy Efficiency through Plug Loads. ACEE's Energy Efficiency as a
Resource Conference. Denver: 2011.
N. O'Neill, M. B. (2010). Out of Control: Barriers to Smart Power Strip Implementation. ACEEE Summer Study on
Energy Efficiency in Buildings.
Peters, J. S. (2010). Electronics and energy Efficiency: A Plug Load Characterization Study. Research Into Action
Inc. for Southern California Edison.
SDG&E. (2013). Smart Power Strips Work Paper WPSSDGEREHE0003. San Diego Gas & Electric.
Spam, L. E. (2012). Results of Laboratory Testing of Advanced Power Strips. ACEEE Summer Study on Energy
Efficiency in Buildings. Pacific Grove: National Renewable Energy Laboratory.
United States Census Bureau. (2013). State & County QuickFacts.
Valmiki, M. M. (2015). Tier 2 Advanced Power Strips in Residential and Commercial Applications, ET14SDG8031.
San Diego: SDG&E ETCC.
Wang, M. e. (2014). Tier 2 Advanced Power Strip Evaluation for Energy Saving Incentive. California Plug Load
Research Center (CalPlug), UC Irvine.