Embed Size (px)
Citation preview

ENERGY-SAVING SUPPORTING DEVICES
Global Partner. Local Friend.
AdvancedEnergy-saving Solution
FACTORY AUTOMATION
Y-0766B All trademarks acknowledged.Printed Mar. 2020
HEAD OFFICE: TOKYO BLDG., 2-7-3 MARUNOUCHI,CHIYODA-KU, TOKYO 100-8310, JAPAN
For Safety : Please read the instruction manual carefully before using the products in this catalog. Wiring and connection must be done by the person who has specialized knowledge of electric construction and wirings.
●Trademarks• Of this product, export (or service trade) permission under this law is required for exports that fall under the safety and trade
control related cargo (or service) specified in the Foreign Exchange and Foreign Trade Control Law. • Windows® is registered trademark in the U.S. of U.S. Microsoft Corporation, and other countries.• MODBUS is a registered trademark of Schneider USA Inc.• Other company names and product names in this document are trademarks or registered trademarks of their respective owners.
• Please consult with a Mitsubishi Electric representative when considering the application of products presented in this catalogue with machinery or systems designed for specialized use such as nuclear power, electrical power, aerospace/outer space, medical, or passenger transportation vehicles.
• Mitsubishi Electric Corporation shall not be liable, to the customer or equipment user, for:1) Any damege found not to be attributable to a Mitsubishi Electric product.2) The loss of opportunity or profits for the customer or user caused by any fault in a Mitsubishi Electric product.3) Damege, secondary damege or accident compensation resulting from special factors regardless of whether or not such
factors could be predicted by Mitsubishi Electric.4) Damege to products of other companies and/or guarantees relating to other services.
Precautions Before Use

Global Player Contents
OVERVIEW
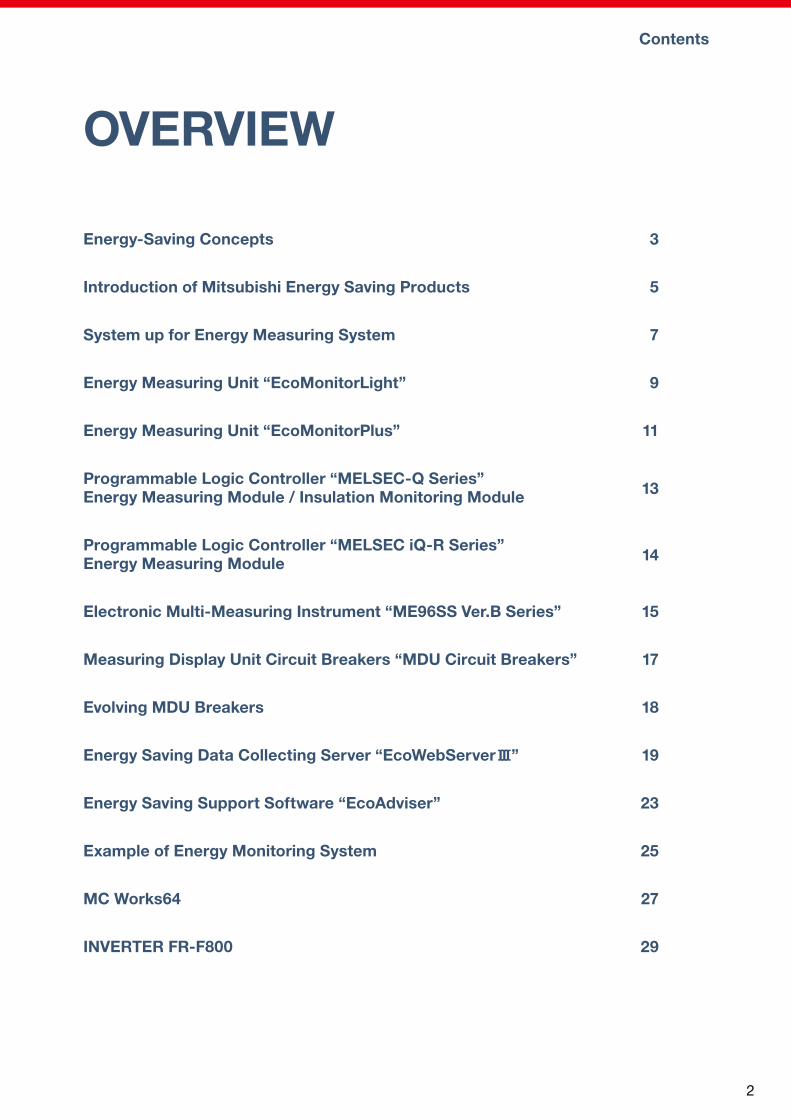
Energy-Saving Concepts
Introduction of Mitsubishi Energy Saving Products
System up for Energy Measuring System
Energy Measuring Unit “EcoMonitorLight”
Energy Measuring Unit “EcoMonitorPlus”
Programmable Logic Controller “MELSEC-Q Series”Energy Measuring Module / Insulation Monitoring Module
Programmable Logic Controller “MELSEC iQ-R Series” Energy Measuring Module
Electronic Multi-Measuring Instrument “ME96SS Ver.B Series”
Measuring Display Unit Circuit Breakers “MDU Circuit Breakers”
Evolving MDU Breakers
Energy Saving Data Collecting Server “EcoWebServer III”
Energy Saving Support Software “EcoAdviser”
Example of Energy Monitoring System
MC Works64
INVERTER FR-F800
3
5
7
9
11
13
14
15
17
18
19
23
25
27
29
21
Global Player
GLOBAL IMPACT OFMITSUBISHI ELECTRIC
We bring together the best minds to create the best technologies. At Mitsubishi Electric, we understand that technology is the driving force of change in our lives. By bringing great-er comfort to daily life, maximizing the efficiency of businesses and keeping things running across society, we integrate technology and innovation to bring changes for the better.
Mitsubishi Electric is involved in many areas including the following
Energy and Electric SystemsA wide range of power and electrical products from generators to large-scale displays.
Electronic DevicesA wide portfolio of cutting-edge semiconductor devices for systems and products.
Home ApplianceDependable consumer products like air conditioners and home entertain-ment systems.
Information and Communication SystemsCommercial and consumer-centric equipment, products and systems.
Industrial Automation SystemsMaximizing productivity and efficiency with cutting-edge automation technology.
Through Mitsubishi Electric’s vision, “Changes for the Better“ are possible for a brighter future.
1
Global Player Contents
OVERVIEW
Energy-Saving Concepts
Introduction of Mitsubishi Energy Saving Products
System up for Energy Measuring System
Energy Measuring Unit “EcoMonitorLight”
Energy Measuring Unit “EcoMonitorPlus”
Programmable Logic Controller “MELSEC-Q Series”Energy Measuring Module / Insulation Monitoring Module
Programmable Logic Controller “MELSEC iQ-R Series” Energy Measuring Module
Electronic Multi-Measuring Instrument “ME96SS Ver.B Series”
Measuring Display Unit Circuit Breakers “MDU Circuit Breakers”
Evolving MDU Breakers
Energy Saving Data Collecting Server “EcoWebServer III”
Energy Saving Support Software “EcoAdviser”
Example of Energy Monitoring System
MC Works64
INVERTER FR-F800
3
5
7
9
11
13
14
15
17
18
19
23
25
27
29
21
Global Player
GLOBAL IMPACT OFMITSUBISHI ELECTRIC
We bring together the best minds to create the best technologies. At Mitsubishi Electric, we understand that technology is the driving force of change in our lives. By bringing great-er comfort to daily life, maximizing the efficiency of businesses and keeping things running across society, we integrate technology and innovation to bring changes for the better.
Mitsubishi Electric is involved in many areas including the following
Energy and Electric SystemsA wide range of power and electrical products from generators to large-scale displays.
Electronic DevicesA wide portfolio of cutting-edge semiconductor devices for systems and products.
Home ApplianceDependable consumer products like air conditioners and home entertain-ment systems.
Information and Communication SystemsCommercial and consumer-centric equipment, products and systems.
Industrial Automation SystemsMaximizing productivity and efficiency with cutting-edge automation technology.
Through Mitsubishi Electric’s vision, “Changes for the Better“ are possible for a brighter future.
2
43
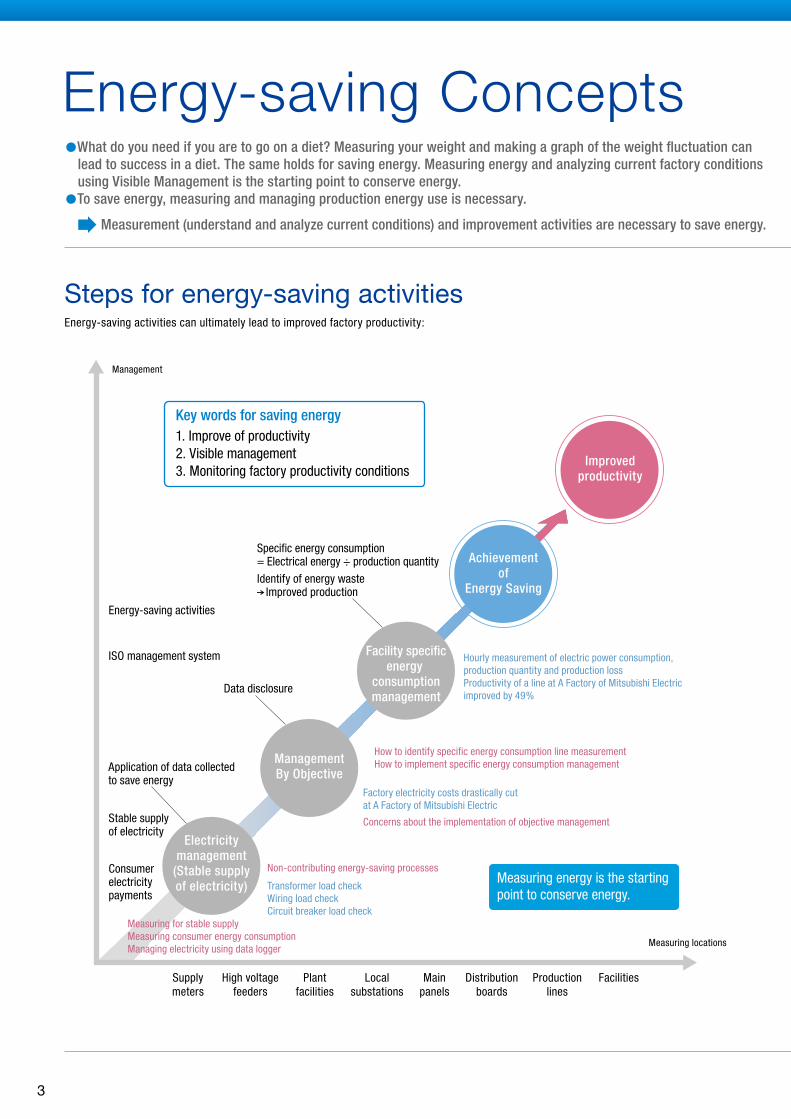
Energy-saving Concepts �What do you need if you are to go on a diet? Measuring your weight and making a graph of the weight �uctuation can
lead to success in a diet. The same holds for saving energy. Measuring energy and analyzing current factory conditions using Visible Management is the starting point to conserve energy.
�To save energy, measuring and managing production energy use is necessary.
Measurement (understand and analyze current conditions) and improvement activities are necessary to save energy.
Steps for energy-saving activities Benefit of Energy Saving
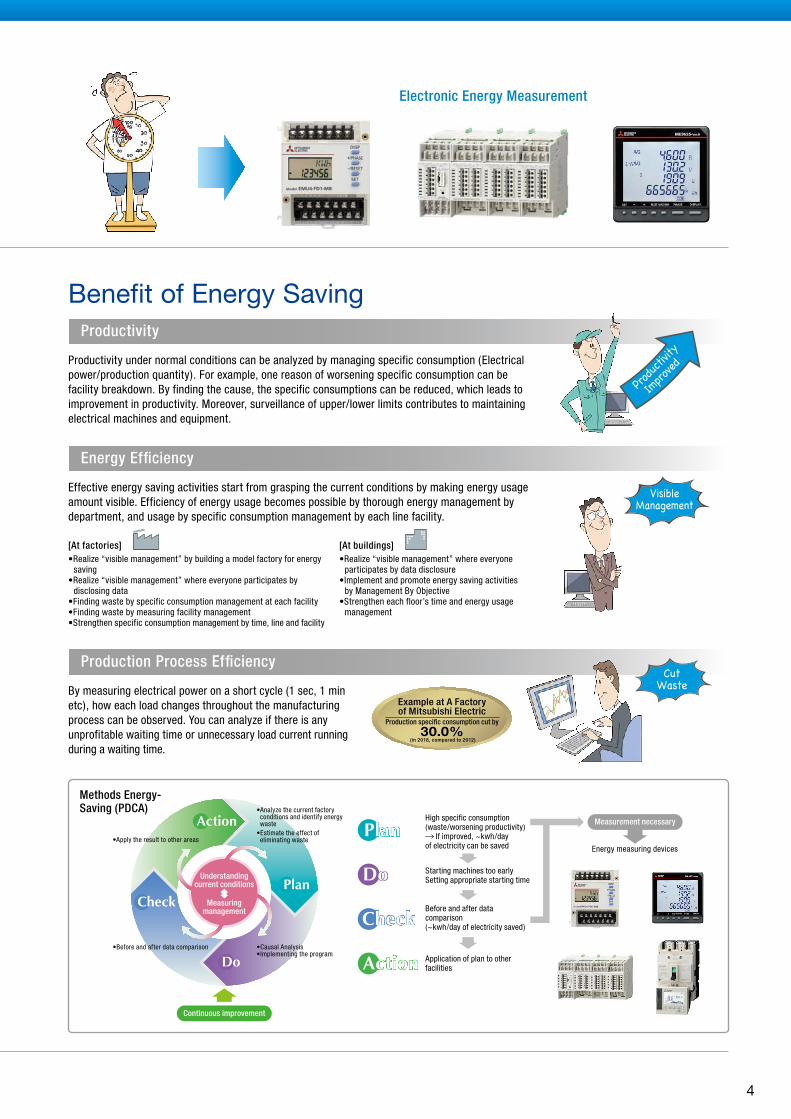
Electronic Energy Measurement
Productivity
Productivity under normal conditions can be analyzed by managing specific consumption (Electrical power/production quantity). For example, one reason of worsening specific consumption can be facility breakdown. By finding the cause, the specific consumptions can be reduced, which leads to improvement in productivity. Moreover, surveillance of upper/lower limits contributes to maintaining electrical machines and equipment.
Energy-saving activities can ultimately lead to improved factory productivity:
Energy Ef�ciency
Effective energy saving activities start from grasping the current conditions by making energy usage amount visible. Efficiency of energy usage becomes possible by thorough energy management by department, and usage by specific consumption management by each line facility.
Production Process Ef�ciency
By measuring electrical power on a short cycle (1 sec, 1 min etc), how each load changes throughout the manufacturing process can be observed. You can analyze if there is any unprofitable waiting time or unnecessary load current running during a waiting time.
•Realize “visible management” by building a model factory for energy saving
•Realize “visible management” where everyone participates by disclosing data
•Finding waste by specific consumption management at each facility•Finding waste by measuring facility management•Strengthen specific consumption management by time, line and facility
•Realize “visible management” where everyone participates by data disclosure
•Implement and promote energy saving activities by Management By Objective
•Strengthen each floor’s time and energy usage management
[At factories] [At buildings]
Improvedproductivity
Achievementof
Energy Saving
Facility speci�cenergy
consumptionmanagement
ManagementBy Objective
Electricitymanagement
(Stable supplyof electricity) Transformer load check
Wiring load checkCircuit breaker load check
Hourly measurement of electric power consumption,production quantity and production lossProductivity of a line at A Factory of Mitsubishi Electricimproved by 49%
Non-contributing energy-saving processes
Factory electricity costs drastically cut at A Factory of Mitsubishi Electric
How to identify specific energy consumption line measurementHow to implement specific energy consumption management
Concerns about the implementation of objective management
Measuring for stable supplyMeasuring consumer energy consumptionManaging electricity using data logger
Management
Measuring locations
Energy-saving activities
ISO management system
Data disclosure
Application of data collected to save energy
Supplymeters
High voltagefeeders
Plantfacilities
Localsubstations
Mainpanels
Distributionboards
Productionlines
Facilities
Stable supply of electricity
Consumer electricity payments
Specific energy consumption= Electrical energy ÷ production quantity
Identify of energy waste– Improved production
Measuring energy is the starting point to conserve energy.
Key words for saving energy1. Improve of productivity2. Visible management3. Monitoring factory productivity conditions
Example at A Factoryof Mitsubishi Electric
Production speci�c consumption cut by
(in 2018, compared to 2012)30.0%
Methods Energy-Saving (PDCA)
Measuringmanagement
Understandingcurrent conditions
•Analyze the current factory conditions and identify energy waste•Estimate the effect of eliminating waste•Apply the result to other areas
•Before and after data comparison •Causal Analysis•Implementing the program
Continuous improvement
Action
PlanCheck
Do ActionAction
PlanPlan
CheckCheck
DoDo Starting machines too earlySetting appropriate starting time
Before and after data comparison (~kwh/day of electricity saved)
Application of plan to other facilities
Measurement necessary
Energy measuring devices
High specific consumption (waste/worsening productivity)— If improved, ~kwh/day of electricity can be saved
3
43
Energy-saving Concepts �What do you need if you are to go on a diet? Measuring your weight and making a graph of the weight �uctuation can
lead to success in a diet. The same holds for saving energy. Measuring energy and analyzing current factory conditions using Visible Management is the starting point to conserve energy.
�To save energy, measuring and managing production energy use is necessary.
Measurement (understand and analyze current conditions) and improvement activities are necessary to save energy.
Steps for energy-saving activities Benefit of Energy Saving
Electronic Energy Measurement
Productivity
Productivity under normal conditions can be analyzed by managing specific consumption (Electrical power/production quantity). For example, one reason of worsening specific consumption can be facility breakdown. By finding the cause, the specific consumptions can be reduced, which leads to improvement in productivity. Moreover, surveillance of upper/lower limits contributes to maintaining electrical machines and equipment.
Energy-saving activities can ultimately lead to improved factory productivity:
Energy Ef�ciency
Effective energy saving activities start from grasping the current conditions by making energy usage amount visible. Efficiency of energy usage becomes possible by thorough energy management by department, and usage by specific consumption management by each line facility.
Production Process Ef�ciency
By measuring electrical power on a short cycle (1 sec, 1 min etc), how each load changes throughout the manufacturing process can be observed. You can analyze if there is any unprofitable waiting time or unnecessary load current running during a waiting time.
•Realize “visible management” by building a model factory for energy saving
•Realize “visible management” where everyone participates by disclosing data
•Finding waste by specific consumption management at each facility•Finding waste by measuring facility management•Strengthen specific consumption management by time, line and facility
•Realize “visible management” where everyone participates by data disclosure
•Implement and promote energy saving activities by Management By Objective
•Strengthen each floor’s time and energy usage management
[At factories] [At buildings]
Improvedproductivity
Achievementof
Energy Saving
Facility speci�cenergy
consumptionmanagement
ManagementBy Objective
Electricitymanagement
(Stable supplyof electricity) Transformer load check
Wiring load checkCircuit breaker load check
Hourly measurement of electric power consumption,production quantity and production lossProductivity of a line at A Factory of Mitsubishi Electricimproved by 49%
Non-contributing energy-saving processes
Factory electricity costs drastically cut at A Factory of Mitsubishi Electric
How to identify specific energy consumption line measurementHow to implement specific energy consumption management
Concerns about the implementation of objective management
Measuring for stable supplyMeasuring consumer energy consumptionManaging electricity using data logger
Management
Measuring locations
Energy-saving activities
ISO management system
Data disclosure
Application of data collected to save energy
Supplymeters
High voltagefeeders
Plantfacilities
Localsubstations
Mainpanels
Distributionboards
Productionlines
Facilities
Stable supply of electricity
Consumer electricity payments
Specific energy consumption= Electrical energy ÷ production quantity
Identify of energy waste– Improved production
Measuring energy is the starting point to conserve energy.
Key words for saving energy1. Improve of productivity2. Visible management3. Monitoring factory productivity conditions
Example at A Factoryof Mitsubishi Electric
Production speci�c consumption cut by
(in 2018, compared to 2012)30.0%
Methods Energy-Saving (PDCA)
Measuringmanagement
Understandingcurrent conditions
•Analyze the current factory conditions and identify energy waste•Estimate the effect of eliminating waste•Apply the result to other areas
•Before and after data comparison •Causal Analysis•Implementing the program
Continuous improvement
Action
PlanCheck
Do ActionAction
PlanPlan
CheckCheck
DoDo Starting machines too earlySetting appropriate starting time
Before and after data comparison (~kwh/day of electricity saved)
Application of plan to other facilities
Measurement necessary
Energy measuring devices
High specific consumption (waste/worsening productivity)— If improved, ~kwh/day of electricity can be saved
4
Intr
oduc
tion
of M
itsub
ishi
Ene
rgy
Sav
ing
Pro
duc
ts
VCT
LA
DS
VCB
VT
Wh EcoWebServer#
I>CT
LBS LBSEthernet
CT CT
ClientPC
ACB
MDU CircuitBreakers
Energy Measuring ModuleInsulation Monitoring Module
Products range
EcoMonitorPlusEcoMonitorPlus
EcoMonitorLightEcoMonitorLight
Using the built-in LCD screen, the energy consumption measured per unit can be displayed and the measurement value indicated. Since the RS-485 (MUDBUS RTU) communication function is incorporated, when using the free data collection software, the present value of data being measured can be displayed on a PC and the CSV �le acquired.
P 9.10
Energy Measuring Unit EcoMonitorLight
The building block system makes it possible to add circuits if necessary. Insulation-level monitoring products can be used to measure the resistance fraction of leakage current (Ior) as well as for preventive maintenance of facility equipment.
P 11.12
Equipped with a full lineup of features, such as multiple measuring elements, and output and transmission functions, this indicator supports the realization of measuring and monitoring systems and energy-saving monitoring that are user-friendly and have easy-to-see displays.
P 15.16The MDU Breaker is the result of integrating a circuit breaker and measurement indicator. It realizes energy-saving management support, and save both space and labor.
Realize a high-speed (10ms) measurement data update cycle. This module contributes to higher productivity in production lines and machine systems.
SCADA Software MC Works64 is a one-stop solution for con�gurating highly functional monitoring control systems capable of incorporating various Programmable logic controllers, PCs and FA equipments.
P 27.28
Directly slotted into the programmable controller, the measurement of various energy information has never been easier. Combined with an indicator (GOT), basic-unit graphs are easily displayed.
Programmable Logic Controller MELSEC-Q SeriesEnergy Measuring Module/Insulation Monitoring Module
Energy Saving Data Collecting Server EcoWebServer#
Programmable Controller MELSEC iQ-R SeriesEnergy Measuring Module
Energy-Saving Data Collection ServerWith a simple setting, EcoWebServer# collects data from measurement devices connected via �eld networks (CC-Link or MODBUS), produces a graph and shows the present value created from the corrected data on a web browser. It easily enables the data analysis required for saving energy.
P 19.20.21.22 P 23.24
Energy Measuring unit EcoMonitorPlus
In response to demands for further energy savings, FREQROL-F800 Series fan pump inverters can control general-purpose motors (three-phase induction motors).
INVERTER FR-F800
Electronic Multi-Measuring Instrument MDU Circuit Breakers
MC Works64EcoAdviser
P 29
Energy Saving-Supporting Device
Energy Saving-Supporting Device
Energy Saving Device Expecting energy saving-effect by just installing.
ME96SSVer.B series
P 17.18
EcoAdviser is a support tool for energy-saving activity. It assists monitoring and analysis of measurement data by converting data to suitable types of graphs/charts.
P 13 P 14
MediumVoltageMediumVoltage
LowVoltage
LowVoltage
ME96SSVer.B series
EcoMonitorPlus
EcoMonitorLight
MDUCircuit
Breakers
Programmable ControllerMELSEC-Q seriesEnergy Measuring Module/Insulation Monitoring Module
Measure
Measure
Analyze/Evaluate
Improveoperation
To maintain more efficient energy/electricity savings, it is important to repeatedly
Measure ⇒ Analyze/Evaluate ⇒ Improve operation.
Analyze/Evaluate
Improve operationProgrammable ControllerMELSEC iQ-R SeriesEnergy Measuring Module
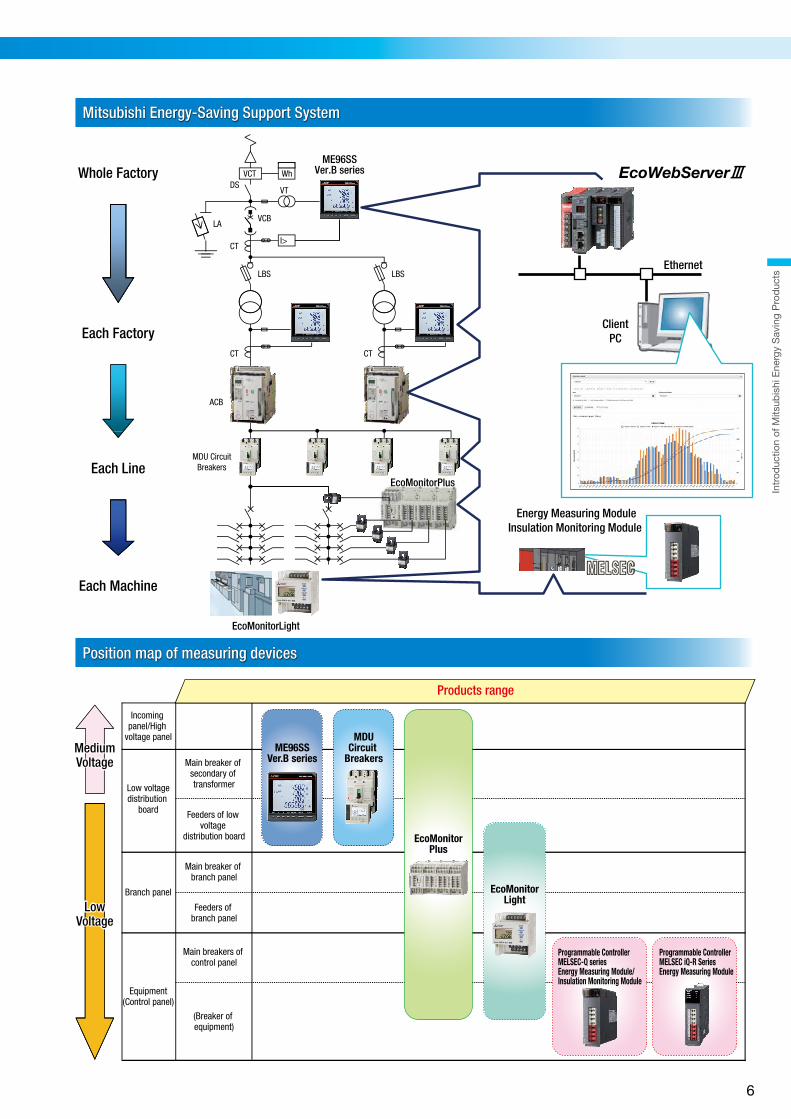
Process of Energy Saving Mitsubishi Energy-Saving Support System
Position map of measuring devices
Whole Factory
Each Factory
Each Line
Each Machine
Incoming panel/High
voltage panel
Low voltagedistribution
board
Branch panel
Equipment(Control panel)
Main breaker of secondary of transformer
Feeders of low voltage
distribution board
Main breaker of branch panel
Feeders of branch panel
Main breakers of control panel
(Breaker of equipment)
Introduction of Mitsubishi Energy Saving Products
5
Intr
oduc
tion
of M
itsub
ishi
Ene
rgy
Sav
ing
Pro
duc
ts
VCT
LA
DS
VCB
VT
Wh EcoWebServer#
I>CT
LBS LBSEthernet
CT CT
ClientPC
ACB
MDU CircuitBreakers
Energy Measuring ModuleInsulation Monitoring Module
Products range
EcoMonitorPlusEcoMonitorPlus
EcoMonitorLightEcoMonitorLight
Using the built-in LCD screen, the energy consumption measured per unit can be displayed and the measurement value indicated. Since the RS-485 (MUDBUS RTU) communication function is incorporated, when using the free data collection software, the present value of data being measured can be displayed on a PC and the CSV �le acquired.
P 9.10
Energy Measuring Unit EcoMonitorLight
The building block system makes it possible to add circuits if necessary. Insulation-level monitoring products can be used to measure the resistance fraction of leakage current (Ior) as well as for preventive maintenance of facility equipment.
P 11.12
Equipped with a full lineup of features, such as multiple measuring elements, and output and transmission functions, this indicator supports the realization of measuring and monitoring systems and energy-saving monitoring that are user-friendly and have easy-to-see displays.
P 15.16The MDU Breaker is the result of integrating a circuit breaker and measurement indicator. It realizes energy-saving management support, and save both space and labor.
Realize a high-speed (10ms) measurement data update cycle. This module contributes to higher productivity in production lines and machine systems.
SCADA Software MC Works64 is a one-stop solution for con�gurating highly functional monitoring control systems capable of incorporating various Programmable logic controllers, PCs and FA equipments.
P 27.28
Directly slotted into the programmable controller, the measurement of various energy information has never been easier. Combined with an indicator (GOT), basic-unit graphs are easily displayed.
Programmable Logic Controller MELSEC-Q SeriesEnergy Measuring Module/Insulation Monitoring Module
Energy Saving Data Collecting Server EcoWebServer#
Programmable Controller MELSEC iQ-R SeriesEnergy Measuring Module
Energy-Saving Data Collection ServerWith a simple setting, EcoWebServer# collects data from measurement devices connected via �eld networks (CC-Link or MODBUS), produces a graph and shows the present value created from the corrected data on a web browser. It easily enables the data analysis required for saving energy.
P 19.20.21.22 P 23.24
Energy Measuring unit EcoMonitorPlus
In response to demands for further energy savings, FREQROL-F800 Series fan pump inverters can control general-purpose motors (three-phase induction motors).
INVERTER FR-F800
Electronic Multi-Measuring Instrument MDU Circuit Breakers
MC Works64EcoAdviser
P 29
Energy Saving-Supporting Device
Energy Saving-Supporting Device
Energy Saving Device Expecting energy saving-effect by just installing.
ME96SSVer.B series
P 17.18
EcoAdviser is a support tool for energy-saving activity. It assists monitoring and analysis of measurement data by converting data to suitable types of graphs/charts.
P 13 P 14
MediumVoltageMediumVoltage
LowVoltage
LowVoltage
ME96SSVer.B series
EcoMonitorPlus
EcoMonitorLight
MDUCircuit
Breakers
Programmable ControllerMELSEC-Q seriesEnergy Measuring Module/Insulation Monitoring Module
Measure
Measure
Analyze/Evaluate
Improveoperation
To maintain more efficient energy/electricity savings, it is important to repeatedly
Measure ⇒ Analyze/Evaluate ⇒ Improve operation.
Analyze/Evaluate
Improve operationProgrammable ControllerMELSEC iQ-R SeriesEnergy Measuring Module
Process of Energy Saving Mitsubishi Energy-Saving Support System
Position map of measuring devices
Whole Factory
Each Factory
Each Line
Each Machine
Incoming panel/High
voltage panel
Low voltagedistribution
board
Branch panel
Equipment(Control panel)
Main breaker of secondary of transformer
Feeders of low voltage
distribution board
Main breaker of branch panel
Feeders of branch panel
Main breakers of control panel
(Breaker of equipment)
Introduction of Mitsubishi Energy Saving Products
6
Sys
tem
up
for
Ene
rgy
Mea
surin
g S
yste
m
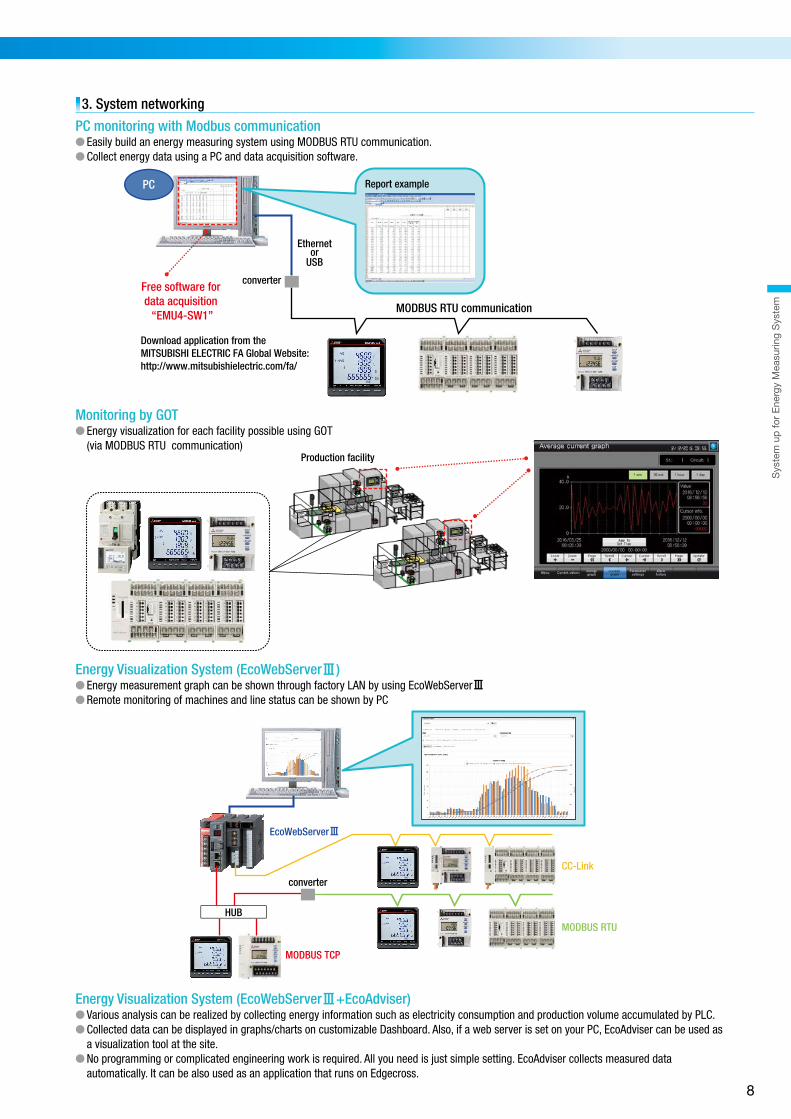
3. System networking
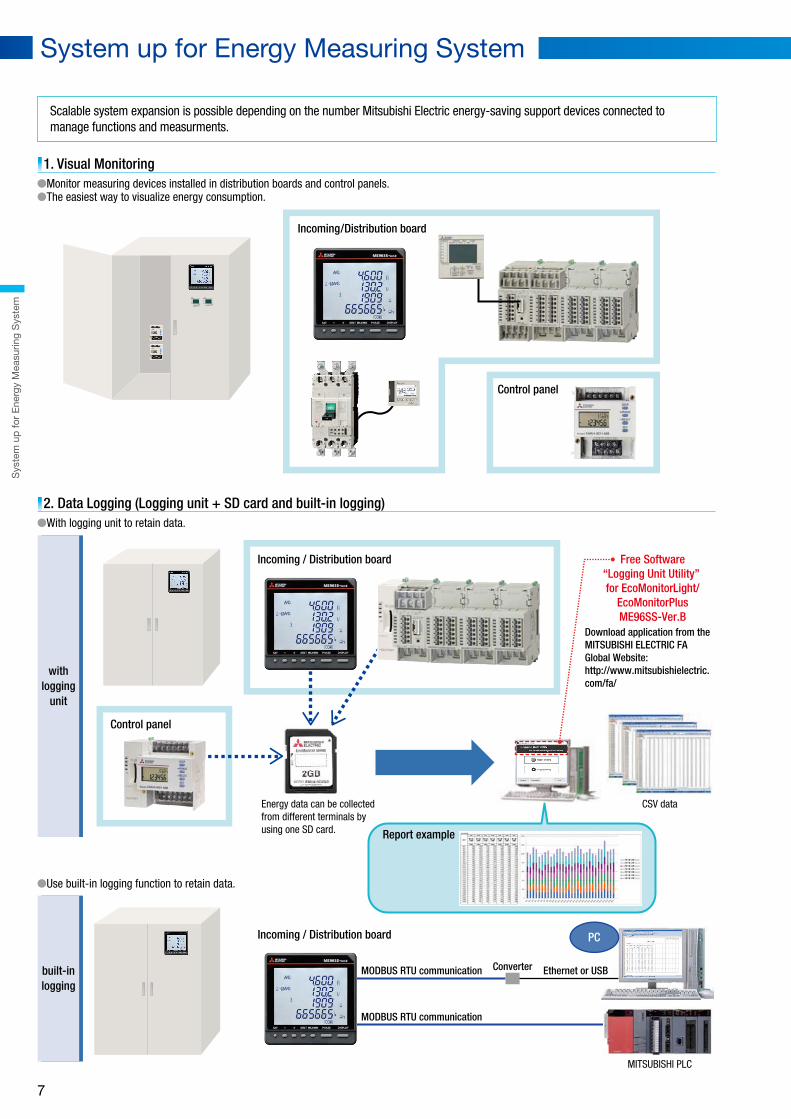
� Easily build an energy measuring system using MODBUS RTU communication.� Collect energy data using a PC and data acquisition software.1. Visual Monitoring
�Monitor measuring devices installed in distribution boards and control panels.�The easiest way to visualize energy consumption.
2. Data Logging (Logging unit + SD card and built-in logging)�With logging unit to retain data.
�Use built-in logging function to retain data.
Monitoring by GOT� Energy visualization for each facility possible using GOT
(via MODBUS RTU communication)
Energy Visualization System (EcoWebServer#) � Energy measurement graph can be shown through factory LAN by using EcoWebServer#� Remote monitoring of machines and line status can be shown by PC
Energy Visualization System (EcoWebServer#+EcoAdviser) � Various analysis can be realized by collecting energy information such as electricity consumption and production volume accumulated by PLC.� Collected data can be displayed in graphs/charts on customizable Dashboard. Also, if a web server is set on your PC, EcoAdviser can be used as
a visualization tool at the site.� No programming or complicated engineering work is required. All you need is just simple setting. EcoAdviser collects measured data
automatically. It can be also used as an application that runs on Edgecross.
Scalable system expansion is possible depending on the number Mitsubishi Electric energy-saving support devices connected to manage functions and measurments.
Incoming/Distribution board
Incoming / Distribution board
Incoming / Distribution board
Energy data can be collected from different terminals by using one SD card.
CSV data
MITSUBISHI PLC
PC
Ethernetor
USB
MODBUS RTU communication
Download application from theMITSUBISHI ELECTRIC FA Global Website: http://www.mitsubishielectric.com/fa/
Production facility
Control panel
Free software for data acquisition
“EMU4-SW1”
converter
MODBUS RTU communication
MODBUS RTU communication
Converter
Report example
EcoWebServer#
MODBUS TCP
MODBUS RTU
CC-Link
Report example
Control panel
PC
HUB
Free Software“Logging Unit Utility” for EcoMonitorLight/
EcoMonitorPlusME96SS-Ver.B
Download application from the MITSUBISHI ELECTRIC FA Global Website: http://www.mitsubishielectric.com/fa/
withlogging
unit
built-inlogging
Ethernet or USB
converter
PC monitoring with Modbus communication
System up for Energy Measuring System
7
Sys
tem
up
for
Ene
rgy
Mea
surin
g S
yste
m
3. System networking
� Easily build an energy measuring system using MODBUS RTU communication.� Collect energy data using a PC and data acquisition software.1. Visual Monitoring
�Monitor measuring devices installed in distribution boards and control panels.�The easiest way to visualize energy consumption.
2. Data Logging (Logging unit + SD card and built-in logging)�With logging unit to retain data.
�Use built-in logging function to retain data.
Monitoring by GOT� Energy visualization for each facility possible using GOT
(via MODBUS RTU communication)
Energy Visualization System (EcoWebServer#) � Energy measurement graph can be shown through factory LAN by using EcoWebServer#� Remote monitoring of machines and line status can be shown by PC
Energy Visualization System (EcoWebServer#+EcoAdviser) � Various analysis can be realized by collecting energy information such as electricity consumption and production volume accumulated by PLC.� Collected data can be displayed in graphs/charts on customizable Dashboard. Also, if a web server is set on your PC, EcoAdviser can be used as
a visualization tool at the site.� No programming or complicated engineering work is required. All you need is just simple setting. EcoAdviser collects measured data
automatically. It can be also used as an application that runs on Edgecross.
Scalable system expansion is possible depending on the number Mitsubishi Electric energy-saving support devices connected to manage functions and measurments.
Incoming/Distribution board
Incoming / Distribution board
Incoming / Distribution board
Energy data can be collected from different terminals by using one SD card.
CSV data
MITSUBISHI PLC
PC
Ethernetor
USB
MODBUS RTU communication
Download application from theMITSUBISHI ELECTRIC FA Global Website: http://www.mitsubishielectric.com/fa/
Production facility
Control panel
Free software for data acquisition
“EMU4-SW1”
converter
MODBUS RTU communication
MODBUS RTU communication
Converter
Report example
EcoWebServer#
MODBUS TCP
MODBUS RTU
CC-Link
Report example
Control panel
PC
HUB
Free Software“Logging Unit Utility” for EcoMonitorLight/
EcoMonitorPlusME96SS-Ver.B
Download application from the MITSUBISHI ELECTRIC FA Global Website: http://www.mitsubishielectric.com/fa/
withlogging
unit
built-inlogging
Ethernet or USB
converter
PC monitoring with Modbus communication
System up for Energy Measuring System
8

Ene
rgy
Mea
surin
g U
nit “E
coM
onito
rLig
ht”
Energy Measuring Unit “EcoMonitorLight”
With a single circuit and an integrated display, EcoMonitorLight is ideal for simple and easy measuring. This product is effective for eliminating energy waste and confirming the benefits of energy-saving countermeasures by visualizing the energy consumed by air conditioning and lighting systems, and production equipment.
1. EcoMonitorLight Features
Other Features
MELSEC-FSeries
MELSEC-QSeries
Display device(GOT)
Free downloadablesoftware (EMU4-SW1)
Connect upto 31 devices
Add communication unit (MODBUS TCP communication, CC-Link communication) to expand EcoWebServer system
1. Measures and displays energy data on a single unit
2. MODBUS RTU communication built-in
3. Expand after adding optional unit
Data stored in the logging unit (SD memory card)
CC-Link IEF Basic supports customers networking through Ethernet communication.
� Easy setting/Easy managementEquipped with a setting switch and built-in LCD display, setting, measuring and displaying energy measurements are all possible using one unit.
� Logging unitConnect a logging unit to store various logging data (such as power, current and voltage) on a SD memory card in CSV �le format.
� Communication unit Add a MODBUS TCP communication unit*2 or CC-Link communication unit to easily expand to an EcoWebServer# visualized system or other host system.*2 Only EMU4-FD1-MB can be connected to the MODBUS TCP communication unit (EMU4-CM-MT).
� CC-Link IEF Basic communication unitSupports networking through Ethernet communication.
� MODBUS TCP Communication UnitConnect to MODBUS TCP communication
� EMU4-SW1 data acquisition softwareMODBUS RTU communication enables current value, output form, measurement device settings and other information to be displayed and set with ease on a computer. Data acquisition software can be downloaded for free from the MITSUBISHI ELECTRIC FA Global Website: http://www.mitsubishielectric.com/fa/
� Host system connectivityWith the built-in MODBUS RTU communication function, EcoMonitorLight can be easily connected with EcoWebServer#*1 or other host system. *1 MODBUS TCP ⇔ MODBUS RTU converter is necessary.
� Direct connection to display device (GOT)MODBUS RTU communication enables direct connection with display device (GOT).
�Basic Installation � (EMU4-FD1-MB) �Basic Installation � (EMU4-BD1-MB/EMU4-HD1-MB)
Voltage Input Voltage Input
Current Input
Spirit-type current sensor
Auxiliary Power SupplyAC100V~240V(50/60Hz)
MODBUS RTUCommunication
MODBUS RTUCommunicationGeneral CT
(Secondary output: 5A or 1A)
Breaker
To loadTo load
Breaker
Since current input by general CT (secondary output : 1A or 5A) is possible, Mitsubishi spirit-type current sensor is not needed.*1: Do not connect together more than one EMU4-FD1-MB on the secondary side of a current transformer.
*2: Do not connect together other units and EMU4-FD1-MB on the secondary side of a current transformer.
Easy installation to existing circuit by Mitsubishi spirit-type current sensors.
Auxiliary Power SupplyAC100V~240V(50/60Hz)
MODBUS RTU
2. Installation Steps/Application Examples
Easy Energy Logging (Logging unit + SD card)
EcoMonitorLight+Logging unit
Customer can collect energy data fromdifferent terminals by using one SD card.
SD memory card CSV File
Use of GX LogViewer Use of free Report software(Logging Unit Utility)
Example of GX LogViewer Screen
�Add a logging unit in measuring device, and collect the data through SD card.�To save working time on visual monitoring.
The GX LogViewer can display graphs easily!You can drag and drop CSV �les to display graphs easily.
*1: You can download the GX LogViewer free of charge from the Mitsubishi Electric website. “GX LogViewer” corresponds also after version 1.30 G.
*Optional unit is required.
*2: You can download Logging Unit Utility from the MITSUBISHI ELECTRIC FA Global Website: http://www.mitsubishielectric.com/fa/
Output ExampleCollect energy data into a SD card from EcoMonitorPlus or EcoMonitorLight, Logging unit utility can make a report rom collected data in SD card.
By building a system with MODBUS RTU (via a converter) and MODBUS TCP communication, measurement data can be automatically collected and remotely monitored!
Construct a visualization system with EcoWebServer #
EMU4-BD1-MBStandard Model
EMU4-HD1-MBHigh-Performance Model
EMU4-FD1-MBGeneral current transformer Model
Item SpecificationsModel Phase-wire systemRated voltage
Items m
easuredCommunication
Energy, reactive energyCurrent, voltagePower, reactive powerPower factor, frequencyApparent powerHarmonic current, harmonic voltagePeriodic energyOperating timePulse count valueCO2 conversion value
External inputExternal output
MODBUS RTUMODBUS TCP*CC-Link*CC-Link IE Field Basic*
250msCE Marking, UL, KC MarkW75 × H90 × D75 (mm)
EMU4-HD1-MB EMU4-BD1-MB1P2W/1P3W/3P3W common
Direct 110VAC, 220VAC available
−−−
−−−−
−
1P2W/1P3W/3P3W/3P4W commonDirect 110VAC, 220VAC, 440VAC available
Pulse input/contact input × 1Pulse output/alarm output × 1
−
EMU4-FD1-MB1P2W/1P3W/3P3W/3P4W common
Direct 110VAC, 220VAC, 440VAC available
Pulse input/contact input × 1Pulse output/alarm output × 1
SD memory card
EcoWebServer#
EcoWeb Server#
Data update cycleStandards and certi�cationsExternal dimensions
Bottom of the unit EcoMonitorLight
LAN cable inserted to the bottom
EcoWebServer#MES3-255C-EN/-CNMES3-255C-DM-EN/CN
EcoAdviserinstallation CD
Hardware key(USB type)
∙∙∙ MODBUS TCP
HUB
Converter*1
*1 MODBUS TCP ⇔ MODBUS RTU convertor is necessary*2 Only EMU4-FD1-MB can be connected to the MODBUS TCP communication unit (EMU4-CM-MT).
∙∙∙ MODBUS RTU
∙∙∙ CC-Link
EcoMonitorLightMODBUS RTU communicationStandard equipment on measurement device main unit
EcoMonitorLight
Optional Unit
EcoMonitorLight + MODBUS TCP communication unit(EMU4-FD1-MB) + (EMU4-CM-MT)*2
9

Ene
rgy
Mea
surin
g U
nit “E
coM
onito
rLig
ht”
Energy Measuring Unit “EcoMonitorLight”
With a single circuit and an integrated display, EcoMonitorLight is ideal for simple and easy measuring. This product is effective for eliminating energy waste and confirming the benefits of energy-saving countermeasures by visualizing the energy consumed by air conditioning and lighting systems, and production equipment.
1. EcoMonitorLight Features
Other Features
MELSEC-FSeries
MELSEC-QSeries
Display device(GOT)
Free downloadablesoftware (EMU4-SW1)
Connect upto 31 devices
Add communication unit (MODBUS TCP communication, CC-Link communication) to expand EcoWebServer system
1. Measures and displays energy data on a single unit
2. MODBUS RTU communication built-in
3. Expand after adding optional unit
Data stored in the logging unit (SD memory card)
CC-Link IEF Basic supports customers networking through Ethernet communication.
� Easy setting/Easy managementEquipped with a setting switch and built-in LCD display, setting, measuring and displaying energy measurements are all possible using one unit.
� Logging unitConnect a logging unit to store various logging data (such as power, current and voltage) on a SD memory card in CSV �le format.
� Communication unit Add a MODBUS TCP communication unit*2 or CC-Link communication unit to easily expand to an EcoWebServer# visualized system or other host system.*2 Only EMU4-FD1-MB can be connected to the MODBUS TCP communication unit (EMU4-CM-MT).
� CC-Link IEF Basic communication unitSupports networking through Ethernet communication.
� MODBUS TCP Communication UnitConnect to MODBUS TCP communication
� EMU4-SW1 data acquisition softwareMODBUS RTU communication enables current value, output form, measurement device settings and other information to be displayed and set with ease on a computer. Data acquisition software can be downloaded for free from the MITSUBISHI ELECTRIC FA Global Website: http://www.mitsubishielectric.com/fa/
� Host system connectivityWith the built-in MODBUS RTU communication function, EcoMonitorLight can be easily connected with EcoWebServer#*1 or other host system. *1 MODBUS TCP ⇔ MODBUS RTU converter is necessary.
� Direct connection to display device (GOT)MODBUS RTU communication enables direct connection with display device (GOT).
�Basic Installation � (EMU4-FD1-MB) �Basic Installation � (EMU4-BD1-MB/EMU4-HD1-MB)
Voltage Input Voltage Input
Current Input
Spirit-type current sensor
Auxiliary Power SupplyAC100V~240V(50/60Hz)
MODBUS RTUCommunication
MODBUS RTUCommunicationGeneral CT
(Secondary output: 5A or 1A)
Breaker
To loadTo load
Breaker
Since current input by general CT (secondary output : 1A or 5A) is possible, Mitsubishi spirit-type current sensor is not needed.*1: Do not connect together more than one EMU4-FD1-MB on the secondary side of a current transformer.
*2: Do not connect together other units and EMU4-FD1-MB on the secondary side of a current transformer.
Easy installation to existing circuit by Mitsubishi spirit-type current sensors.
Auxiliary Power SupplyAC100V~240V(50/60Hz)
MODBUS RTU
2. Installation Steps/Application Examples
Easy Energy Logging (Logging unit + SD card)
EcoMonitorLight+Logging unit
Customer can collect energy data fromdifferent terminals by using one SD card.
SD memory card CSV File
Use of GX LogViewer Use of free Report software(Logging Unit Utility)
Example of GX LogViewer Screen
�Add a logging unit in measuring device, and collect the data through SD card.�To save working time on visual monitoring.
The GX LogViewer can display graphs easily!You can drag and drop CSV �les to display graphs easily.
*1: You can download the GX LogViewer free of charge from the Mitsubishi Electric website. “GX LogViewer” corresponds also after version 1.30 G.
*Optional unit is required.
*2: You can download Logging Unit Utility from the MITSUBISHI ELECTRIC FA Global Website: http://www.mitsubishielectric.com/fa/
Output ExampleCollect energy data into a SD card from EcoMonitorPlus or EcoMonitorLight, Logging unit utility can make a report rom collected data in SD card.
By building a system with MODBUS RTU (via a converter) and MODBUS TCP communication, measurement data can be automatically collected and remotely monitored!
Construct a visualization system with EcoWebServer #
EMU4-BD1-MBStandard Model
EMU4-HD1-MBHigh-Performance Model
EMU4-FD1-MBGeneral current transformer Model
Item SpecificationsModel Phase-wire systemRated voltage
Items m
easuredCommunication
Energy, reactive energyCurrent, voltagePower, reactive powerPower factor, frequencyApparent powerHarmonic current, harmonic voltagePeriodic energyOperating timePulse count valueCO2 conversion value
External inputExternal output
MODBUS RTUMODBUS TCP*CC-Link*CC-Link IE Field Basic*
250msCE Marking, UL, KC MarkW75 × H90 × D75 (mm)
EMU4-HD1-MB EMU4-BD1-MB1P2W/1P3W/3P3W common
Direct 110VAC, 220VAC available
−−−
−−−−
−
1P2W/1P3W/3P3W/3P4W commonDirect 110VAC, 220VAC, 440VAC available
Pulse input/contact input × 1Pulse output/alarm output × 1
−
EMU4-FD1-MB1P2W/1P3W/3P3W/3P4W common
Direct 110VAC, 220VAC, 440VAC available
Pulse input/contact input × 1Pulse output/alarm output × 1
SD memory card
EcoWebServer#
EcoWeb Server#
Data update cycleStandards and certi�cationsExternal dimensions
Bottom of the unit EcoMonitorLight
LAN cable inserted to the bottom
EcoWebServer#MES3-255C-EN/-CNMES3-255C-DM-EN/CN
EcoAdviserinstallation CD
Hardware key(USB type)
∙∙∙ MODBUS TCP
HUB
Converter*1
*1 MODBUS TCP ⇔ MODBUS RTU convertor is necessary*2 Only EMU4-FD1-MB can be connected to the MODBUS TCP communication unit (EMU4-CM-MT).
∙∙∙ MODBUS RTU
∙∙∙ CC-Link
EcoMonitorLightMODBUS RTU communicationStandard equipment on measurement device main unit
EcoMonitorLight
Optional Unit
EcoMonitorLight + MODBUS TCP communication unit(EMU4-FD1-MB) + (EMU4-CM-MT)*2
10
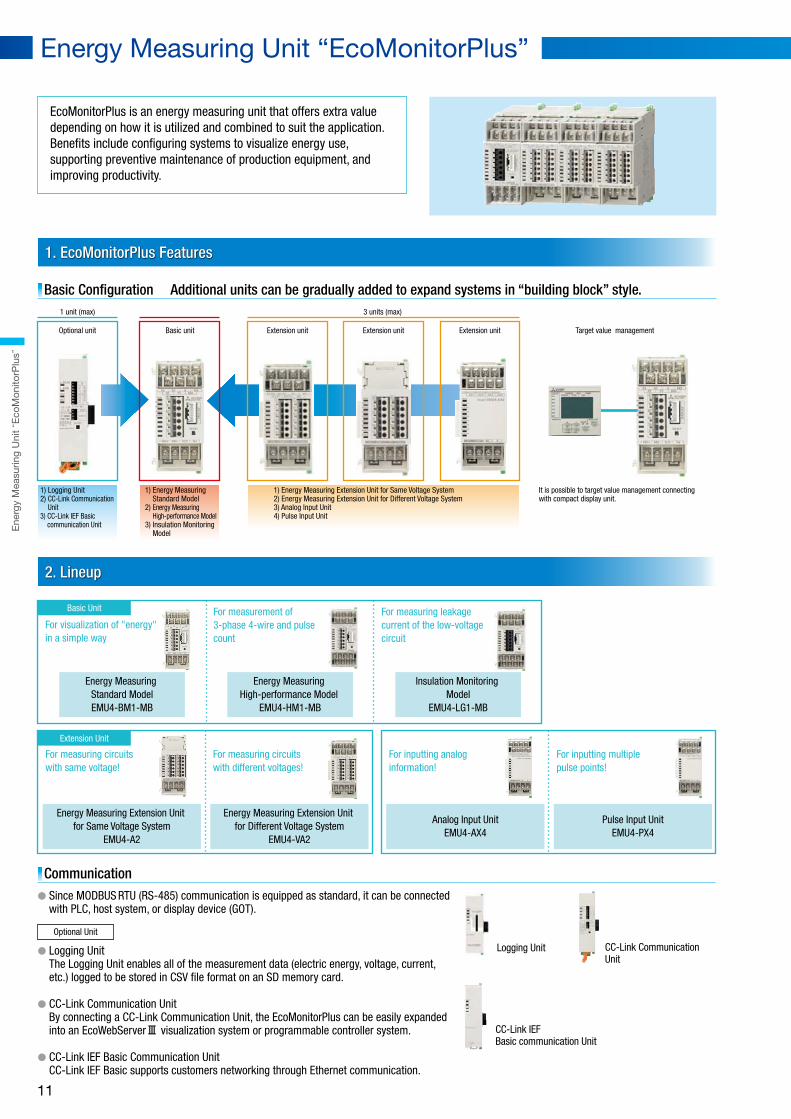
EcoMonitorPlus is an energy measuring unit that offers extra value depending on how it is utilized and combined to suit the application. Benefits include configuring systems to visualize energy use, supporting preventive maintenance of production equipment, and improving productivity.
Energy Measuring Unit “EcoMonitorPlus”
1 unit (max)
Optional unit Extension unit
3 units (max)
Extension unit Extension unit Target value managementBasic unit
1. EcoMonitorPlus Features
2. Lineup
3. Application Examples
Basic Configuration Additional units can be gradually added to expand systems in “building block” style.
Communication
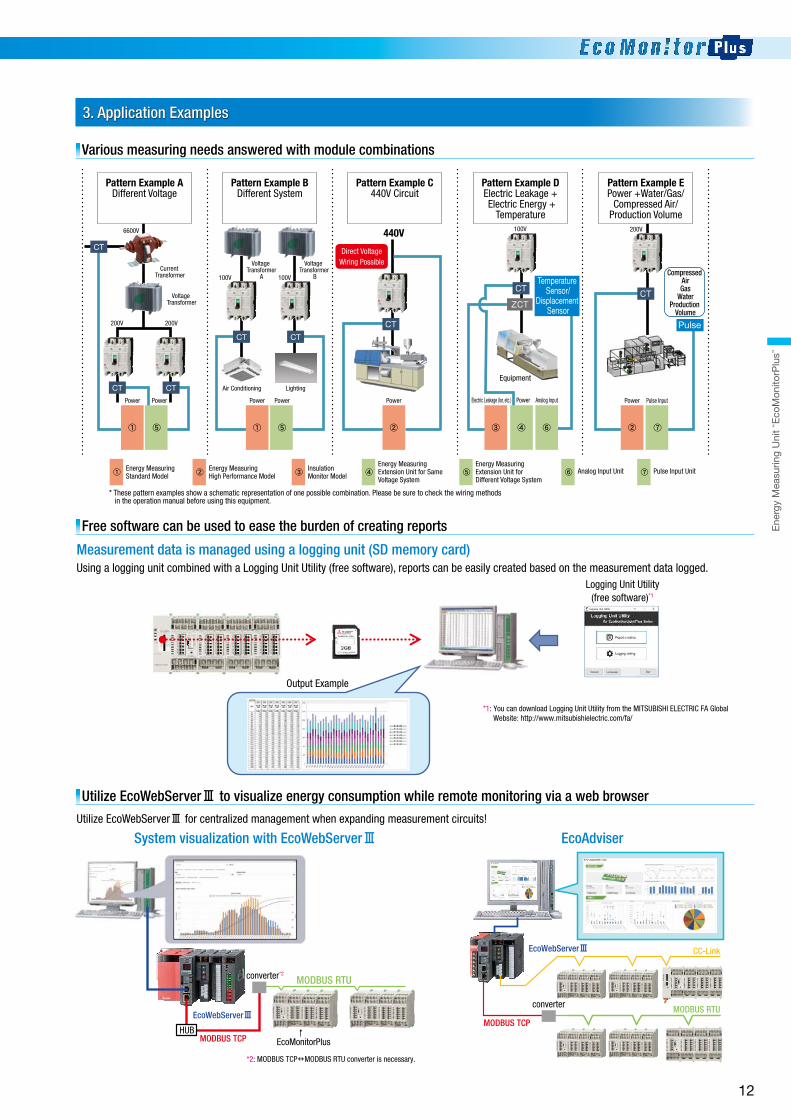
Various measuring needs answered with module combinations
Free software can be used to ease the burden of creating reports
� Logging UnitThe Logging Unit enables all of the measurement data (electric energy, voltage, current, etc.) logged to be stored in CSV �le format on an SD memory card.
� CC-Link Communication UnitBy connecting a CC-Link Communication Unit, the EcoMonitorPlus can be easily expanded into an EcoWebServer# visualization system or programmable controller system.
� CC-Link IEF Basic Communication UnitCC-Link IEF Basic supports customers networking through Ethernet communication.
� Since MODBUS RTU (RS-485) communication is equipped as standard, it can be connected with PLC, host system, or display device (GOT).
Measurement data is managed using a logging unit (SD memory card)Using a logging unit combined with a Logging Unit Utility (free software), reports can be easily created based on the measurement data logged.
Utilize EcoWebServer# to visualize energy consumption while remote monitoring via a web browser
Utilize EcoWebServer# for centralized management when expanding measurement circuits!
Optional Unit
Energy Measuring Standard ModelEMU4-BM1-MB
Energy Measuring High-performance Model
EMU4-HM1-MB
Insulation Monitoring Model
EMU4-LG1-MB
Extension Unit
Basic Unit
For measuring circuits with same voltage!
Energy Measuring Extension Unit for Same Voltage System
EMU4-A2
For measuring circuits with different voltages!
Energy Measuring Extension Unit for Different Voltage System
EMU4-VA2
For inputting analog information!
Analog Input UnitEMU4-AX4
Logging Unit
For inputting multiple pulse points!
Pulse Input UnitEMU4-PX4
1) Logging Unit2) CC-Link Communication Unit3) CC-Link IEF Basic communication Unit
1) Energy Measuring Extension Unit for Same Voltage System2) Energy Measuring Extension Unit for Different Voltage System3) Analog Input Unit4) Pulse Input Unit
It is possible to target value management connectingwith compact display unit.
1) Energy Measuring Standard Model2) Energy Measuring High-performance Model3) Insulation Monitoring Model
CC-Link Communication Unit
CC-Link IEF Basic communication Unit
Logging Unit Utility(free software)*1
Output Example
System visualization with EcoWebServer# EcoAdviser
converter*2
EcoMonitorPlus
MODBUS RTU
*2: MODBUS TCPMODBUS RTU converter is necessary.
*1: You can download Logging Unit Utility from the MITSUBISHI ELECTRIC FA Global Website: http://www.mitsubishielectric.com/fa/
HUB
EcoWebServer#
MODBUS RTU
MODBUS TCP
MODBUS TCP
CC-Link
converter
For measurement of 3-phase 4-wire and pulse count
For visualization of "energy" in a simple way
For measuring leakage current of the low-voltage circuit
EcoWebServer#
Pattern Example ADifferent Voltage
Pattern Example BDifferent System
Pattern Example DElectric Leakage + Electric Energy +
Temperature
Pattern Example EPower +Water/Gas/
Compressed Air/Production Volume
Pattern Example C440V Circuit
Pulse InputPowerPower
CT
CT CT
CT CT
⑤① ⑤①
Voltage Transformer
Voltage Transformer
ACurrent
Transformer
6600V
200V
100V 100V
100V 200V
200V
Voltage Transformer
B
Air Conditioning Lighting
CT
②
440V
Direct VoltageWiring Possible
* These pattern examples show a schematic representation of one possible combination. Please be sure to check the wiring methods in the operation manual before using this equipment.
CTCT
ZCT
Pulse
⑥④ ② ⑦
Equipment
Compressed AirGas
WaterProduction
Volume
Temperature Sensor/
Displacement Sensor
Analog InputPower
③
Electric Leakage (Ior, etc.)PowerPowerPowerPower
① Energy Measuring Standard Model ② Energy Measuring
High Performance Model ③ Insulation Monitor Model ④
Energy Measuring Extension Unit for Same Voltage System
⑤Energy Measuring Extension Unit for Different Voltage System
⑥ Analog Input Unit ⑦ Pulse Input Unit
Ene
rgy
Mea
surin
g U
nit “E
coM
onito
rPlu
s ”
11
EcoMonitorPlus is an energy measuring unit that offers extra value depending on how it is utilized and combined to suit the application. Benefits include configuring systems to visualize energy use, supporting preventive maintenance of production equipment, and improving productivity.
Energy Measuring Unit “EcoMonitorPlus”
1 unit (max)
Optional unit Extension unit
3 units (max)
Extension unit Extension unit Target value managementBasic unit
1. EcoMonitorPlus Features
2. Lineup
3. Application Examples
Basic Configuration Additional units can be gradually added to expand systems in “building block” style.
Communication
Various measuring needs answered with module combinations
Free software can be used to ease the burden of creating reports
� Logging UnitThe Logging Unit enables all of the measurement data (electric energy, voltage, current, etc.) logged to be stored in CSV �le format on an SD memory card.
� CC-Link Communication UnitBy connecting a CC-Link Communication Unit, the EcoMonitorPlus can be easily expanded into an EcoWebServer# visualization system or programmable controller system.
� CC-Link IEF Basic Communication UnitCC-Link IEF Basic supports customers networking through Ethernet communication.
� Since MODBUS RTU (RS-485) communication is equipped as standard, it can be connected with PLC, host system, or display device (GOT).
Measurement data is managed using a logging unit (SD memory card)Using a logging unit combined with a Logging Unit Utility (free software), reports can be easily created based on the measurement data logged.
Utilize EcoWebServer# to visualize energy consumption while remote monitoring via a web browser
Utilize EcoWebServer# for centralized management when expanding measurement circuits!
Optional Unit
Energy Measuring Standard ModelEMU4-BM1-MB
Energy Measuring High-performance Model
EMU4-HM1-MB
Insulation Monitoring Model
EMU4-LG1-MB
Extension Unit
Basic Unit
For measuring circuits with same voltage!
Energy Measuring Extension Unit for Same Voltage System
EMU4-A2
For measuring circuits with different voltages!
Energy Measuring Extension Unit for Different Voltage System
EMU4-VA2
For inputting analog information!
Analog Input UnitEMU4-AX4
Logging Unit
For inputting multiple pulse points!
Pulse Input UnitEMU4-PX4
1) Logging Unit2) CC-Link Communication Unit3) CC-Link IEF Basic communication Unit
1) Energy Measuring Extension Unit for Same Voltage System2) Energy Measuring Extension Unit for Different Voltage System3) Analog Input Unit4) Pulse Input Unit
It is possible to target value management connectingwith compact display unit.
1) Energy Measuring Standard Model2) Energy Measuring High-performance Model3) Insulation Monitoring Model
CC-Link Communication Unit
CC-Link IEF Basic communication Unit
Logging Unit Utility(free software)*1
Output Example
System visualization with EcoWebServer# EcoAdviser
converter*2
EcoMonitorPlus
MODBUS RTU
*2: MODBUS TCPMODBUS RTU converter is necessary.
*1: You can download Logging Unit Utility from the MITSUBISHI ELECTRIC FA Global Website: http://www.mitsubishielectric.com/fa/
HUB
EcoWebServer#
MODBUS RTU
MODBUS TCP
MODBUS TCP
CC-Link
converter
For measurement of 3-phase 4-wire and pulse count
For visualization of "energy" in a simple way
For measuring leakage current of the low-voltage circuit
EcoWebServer#
Pattern Example ADifferent Voltage
Pattern Example BDifferent System
Pattern Example DElectric Leakage + Electric Energy +
Temperature
Pattern Example EPower +Water/Gas/
Compressed Air/Production Volume
Pattern Example C440V Circuit
Pulse InputPowerPower
CT
CT CT
CT CT
⑤① ⑤①
Voltage Transformer
Voltage Transformer
ACurrent
Transformer
6600V
200V
100V 100V
100V 200V
200V
Voltage Transformer
B
Air Conditioning Lighting
CT
②
440V
Direct VoltageWiring Possible
* These pattern examples show a schematic representation of one possible combination. Please be sure to check the wiring methods in the operation manual before using this equipment.
CTCT
ZCT
Pulse
⑥④ ② ⑦
Equipment
Compressed AirGas
WaterProduction
Volume
Temperature Sensor/
Displacement Sensor
Analog InputPower
③
Electric Leakage (Ior, etc.)PowerPowerPowerPower
① Energy Measuring Standard Model ② Energy Measuring
High Performance Model ③ Insulation Monitor Model ④
Energy Measuring Extension Unit for Same Voltage System
⑤Energy Measuring Extension Unit for Different Voltage System
⑥ Analog Input Unit ⑦ Pulse Input Unit
Ene
rgy
Mea
surin
g U
nit “E
coM
onito
rPlu
s ”
12
A PLC-installable measurement device that enhances productivity by reducing production equipment energy consumption and realizing preventive maintenance.
1. Energy Measuring Module Features
� Visualization of speci�c energy consumption in the form of a graph is easily achieved by installing a graphic operation terminal (GOT) on the control panel onsite at the factory. Analysis is also possible using a computer combined with a high-speed data logger unit (RD81DL96).
Since leakage current (Io) is affected by the Ioc of the entire facility, Ior measurement is effective for insulation deterioration diagnosis!
� The module can measure resistive-component leakage current (Ior). Even in circuits that cannot be monitored for insulation using the conventional Io method, such as inverter circuits where capacitor component leakage current (Ioc) is large, the module removes the Ioc component to accurately monitor the leakage current caused by insulation deterioration.
� The module constantly measures the resistive-component leakage current (Ior) even while equipment is running. It detects any sign of insulation deterioration without interrupting power.
Amount of change in Io ≈ Amount of change in Ior Amount of change in Io < Amount of change in Ior
Ior: Leakage current caused by insulation deterioration (leakage current from resistive component)
Ioc: Leakage current �owing even when insulation is sound (leakage current from electrostatic capacity)
Io: Leakage current obtained by synthesizing Ior and Ioc (vector synthesis)
� Method of leakage current measurement (Io and Ior measurements)
When Ioc is low When Ioc is high
Computer(Excel)
Displaydevice(GOT)
[Example of graphic display of speci�c energy consumption with GOT]
Speci�c energyconsumption graph
Power consumptiongraph
Production volumegraph
High-speed datalogger unit
Energy Measuring Module
LAN
*3 Speci�c energy consumption is equal to energy consumption divided by production volume.
It is a measure of energy productivity. Improving speci�c energy consumption leads to improvements in productivity.
*4: QE84WH and QE83WH collect data in 500ms cycles
Energy informationProduction informationSpeci�c energyconsumption
Capacitor Resistance
4. System construction enables simple visualization of energy consumption
1. Faster data measurement refresh cycle (10 ms)
2. Waveform data output function
3. Management based on specific energy consumption possible by measuring energy of each piece of equipment
2. Constant monitoring for insulation deterioration in equipment using the Ior method!
1. Multi-Circuit Model Current Measuring Mode (QE84WH, QE83WH4W)
�Simple Speci�cations Table
Insulation MonitoringModule
Phase wire system 3-phase, 3-wire
Energy Measuring Module
3-phase, 4-wire 3-phase, 3-wireModel name QE81WH QE84WH QE81WH4W*1 QE83WH4W*1 QE82LG
Itemsmeasured
Electric energy (consumption, regenerative), reactive energy, current, voltage,
power factor, frequency, etc.
Leakage currentResistive-component
leakage current
No. of measured circuits 1-circuit 4-circuit 1-circuit 3-circuit 2-circuit
*1: A special-purpose voltage convertor is required for QE81WH4W and QE83WH4W
�Simple Speci�cations Table
Phase wire system
Energy Measuring Module
1-phase, 2-wire/ 1-phase, 3-wire/ 3-phase, 3-wire Model name RE81WH
Items measuredElectric energy (consumption, regenerative),
reactive energy, current, voltage, power factor, frequency, etc.
No. of measured circuits 1-circuit
Energy Measuring ModuleQE81WH
Energy Measuring Module3-phase, 4-wire
QE81WH4W
Energy Measuring ModuleMulti-circuit model
QE84WH/QE83WH4W
Energy Measuring ModuleRE81WH
Insulation Monitoring ModuleQE82LG
2. Features
2. Features� In the current measuring mode, up to eight circuits can be measured for current alone.*2
If only current is measured, a maximum of eight currents can be measured in a 100ms cycle. Modules with this mode are space-saving and provide the ideal solution for managing current values linked to production equipment.
Energy measuring modules are capable of detailed energy measurement for individual production equipment. Using only one module, highly detailed information such as electric energy (consumption and regeneration), reactive energy, current*5, voltage*5, electric power, power factor, frequency, harmonic current, and harmonic voltage can be measured. With constant current monitoring of motors and other devices, it is possible to avoid line stoppages and downtime; thereby reducing delivery time issues due to production stoppages as well as maintenance related labor and costs. Moreover, by detecting abnormal voltage or current in manufacturing equipment and removing products manufactured during the time of abnormality, shipping defective products can be prevented.*5: Waveform data for current and voltage can also be obtained. For further details, please refer to the
product user’s manual (detailed edition).
Waveform data of measured voltage/current is available.* Waveform data is sampled data of voltage/current wave (sampling terms:254μs).
Visualizing voltage/current waveform changing.
� Upper-/Lower-limit monitoring possible
� Measures up to eight circuits � Data refreshed in 100ms
cycles
1. Electrical current abnormalities can be detected in a short measurement cycle, making it possible to determine product defects.
(e.g., manufacturing lines of semiconductors, precision devices, LCD panels, etc.)
2. Abnormal electrical current values can be detected and equipment status monitored. Equipment problems can be determined in advance.
Handy ways to use current measuring mode
*2: Items other than the current cannot be measured in the current measuring mode. QE84WH, QE83WH4W
Installation diagram
Programmable Logic Controller “MELSEC-Q Series”Energy Measuring Module/Insulation Monitoring Module
Programmable Logic Controller “MELSEC iQ-R Series”Energy Measuring Module
Slots directly into MELSEC-Q PLC and enables easy measurement of a variety of energy-related information!
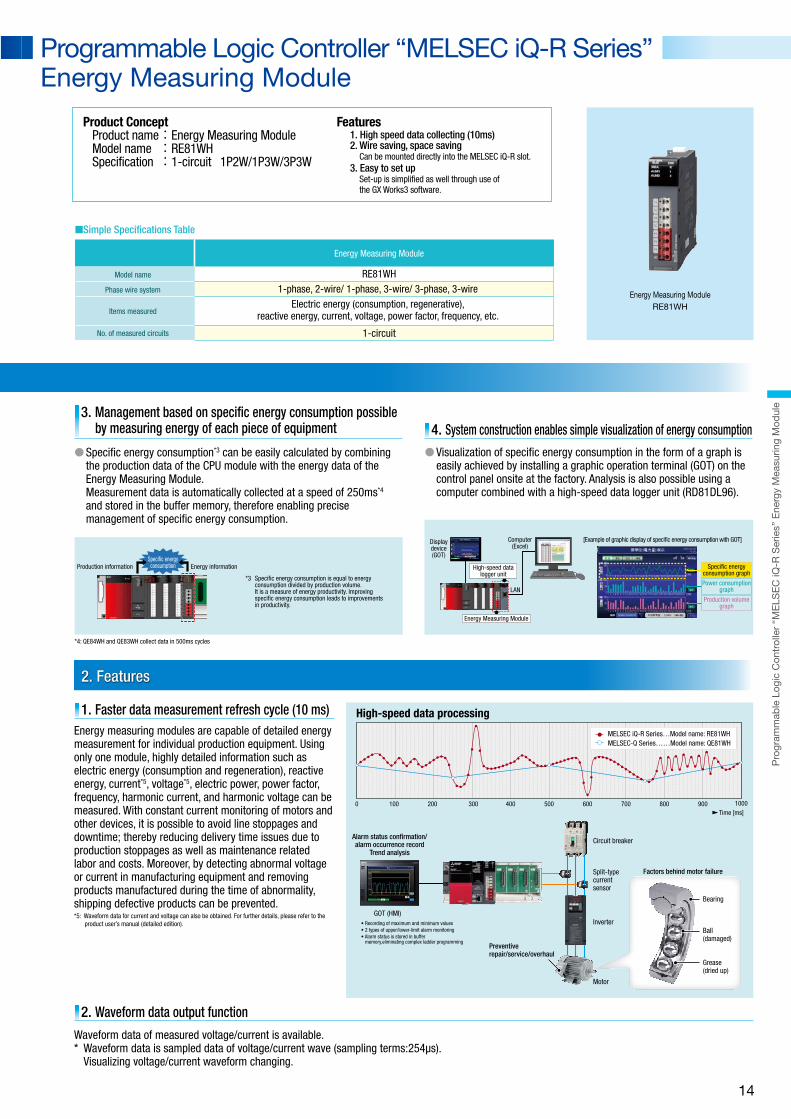
Product Concept Product name : Energy Measuring Module Model name : RE81WH Specification : 1-circuit 1P2W/1P3W/3P3W
Features1. High speed data collecting (10ms)2. Wire saving, space saving
Can be mounted directly into the MELSEC iQ-R slot.3. Easy to set up
Set-up is simplified as well through use of the GX Works3 software.
� An energy measuring device can be added to an empty slot in the base unit without affecting the layout of devices in the control panel.
� Less wiring and engineering set-up work is required since the communication unit, cable and program are no longer required. As a result of the reduced workload, cost is also reduced.
Control panel Control panel
Energy Measuring ModuleCommunication module
Communication lineCC-Link, etc.
Measuring device(with communication function)
Controlpowersource
1. Space-saving measuring device 2. Reduced wiring and engineering set-up work
VoltageCurrent
Current sensor
� Speci�c energy consumption*3 can be easily calculated by combining the production data of the CPU module with the energy data of the Energy Measuring Module.
Measurement data is automatically collected at a speed of 250ms*4 and stored in the buffer memory, therefore enabling precise management of speci�c energy consumption.
The Ioc �uctuates in equipment with long cable length or inverter devices and �lters.
Amount of change due to insulation deterioration
The Ioc component interferes and it’s not possible to accurately determine leakage current from the insulation resistant component.
High-speed data processing
100 200 300 400 500 600 7000 800 900 1000Time [ms]
MELSEC iQ-R Series…Model name: RE81WHMELSEC-Q Series……Model name: QE81WH
Alarm status con�rmation/alarm occurrence record
Trend analysis
GOT (HMI)• Recording of maximum and minimum values• 2 types of upper/lower-limit alarm monitoring• Alarm status is stored in buffer
memory,eliminating complex ladder programmingPreventiverepair/service/overhaul
Circuit breaker
Split-typecurrent sensor
Inverter
Motor
Factors behind motor failure
Bearing
Ball (damaged)
Grease (dried up)
Pro
gram
mab
le L
ogic
Con
trol
ler “M
ELS
EC
-Q S
erie
s ” E
nerg
y M
easu
ring
Mod
ule/
Insu
latio
n M
onito
ring
Mod
ule
13
A PLC-installable measurement device that enhances productivity by reducing production equipment energy consumption and realizing preventive maintenance.
1. Energy Measuring Module Features
� Visualization of speci�c energy consumption in the form of a graph is easily achieved by installing a graphic operation terminal (GOT) on the control panel onsite at the factory. Analysis is also possible using a computer combined with a high-speed data logger unit (RD81DL96).
Since leakage current (Io) is affected by the Ioc of the entire facility, Ior measurement is effective for insulation deterioration diagnosis!
� The module can measure resistive-component leakage current (Ior). Even in circuits that cannot be monitored for insulation using the conventional Io method, such as inverter circuits where capacitor component leakage current (Ioc) is large, the module removes the Ioc component to accurately monitor the leakage current caused by insulation deterioration.
� The module constantly measures the resistive-component leakage current (Ior) even while equipment is running. It detects any sign of insulation deterioration without interrupting power.
Amount of change in Io ≈ Amount of change in Ior Amount of change in Io < Amount of change in Ior
Ior: Leakage current caused by insulation deterioration (leakage current from resistive component)
Ioc: Leakage current �owing even when insulation is sound (leakage current from electrostatic capacity)
Io: Leakage current obtained by synthesizing Ior and Ioc (vector synthesis)
� Method of leakage current measurement (Io and Ior measurements)
When Ioc is low When Ioc is high
Computer(Excel)
Displaydevice(GOT)
[Example of graphic display of speci�c energy consumption with GOT]
Speci�c energyconsumption graph
Power consumptiongraph
Production volumegraph
High-speed datalogger unit
Energy Measuring Module
LAN
*3 Speci�c energy consumption is equal to energy consumption divided by production volume.
It is a measure of energy productivity. Improving speci�c energy consumption leads to improvements in productivity.
*4: QE84WH and QE83WH collect data in 500ms cycles
Energy informationProduction informationSpeci�c energyconsumption
Capacitor Resistance
4. System construction enables simple visualization of energy consumption
1. Faster data measurement refresh cycle (10 ms)
2. Waveform data output function
3. Management based on specific energy consumption possible by measuring energy of each piece of equipment
2. Constant monitoring for insulation deterioration in equipment using the Ior method!
1. Multi-Circuit Model Current Measuring Mode (QE84WH, QE83WH4W)
�Simple Speci�cations Table
Insulation MonitoringModule
Phase wire system 3-phase, 3-wire
Energy Measuring Module
3-phase, 4-wire 3-phase, 3-wireModel name QE81WH QE84WH QE81WH4W*1 QE83WH4W*1 QE82LG
Itemsmeasured
Electric energy (consumption, regenerative), reactive energy, current, voltage,
power factor, frequency, etc.
Leakage currentResistive-component
leakage current
No. of measured circuits 1-circuit 4-circuit 1-circuit 3-circuit 2-circuit
*1: A special-purpose voltage convertor is required for QE81WH4W and QE83WH4W
�Simple Speci�cations Table
Phase wire system
Energy Measuring Module
1-phase, 2-wire/ 1-phase, 3-wire/ 3-phase, 3-wire Model name RE81WH
Items measuredElectric energy (consumption, regenerative),
reactive energy, current, voltage, power factor, frequency, etc.
No. of measured circuits 1-circuit
Energy Measuring ModuleQE81WH
Energy Measuring Module3-phase, 4-wire
QE81WH4W
Energy Measuring ModuleMulti-circuit model
QE84WH/QE83WH4W
Energy Measuring ModuleRE81WH
Insulation Monitoring ModuleQE82LG
2. Features
2. Features� In the current measuring mode, up to eight circuits can be measured for current alone.*2
If only current is measured, a maximum of eight currents can be measured in a 100ms cycle. Modules with this mode are space-saving and provide the ideal solution for managing current values linked to production equipment.
Energy measuring modules are capable of detailed energy measurement for individual production equipment. Using only one module, highly detailed information such as electric energy (consumption and regeneration), reactive energy, current*5, voltage*5, electric power, power factor, frequency, harmonic current, and harmonic voltage can be measured. With constant current monitoring of motors and other devices, it is possible to avoid line stoppages and downtime; thereby reducing delivery time issues due to production stoppages as well as maintenance related labor and costs. Moreover, by detecting abnormal voltage or current in manufacturing equipment and removing products manufactured during the time of abnormality, shipping defective products can be prevented.*5: Waveform data for current and voltage can also be obtained. For further details, please refer to the
product user’s manual (detailed edition).
Waveform data of measured voltage/current is available.* Waveform data is sampled data of voltage/current wave (sampling terms:254μs).
Visualizing voltage/current waveform changing.
� Upper-/Lower-limit monitoring possible
� Measures up to eight circuits � Data refreshed in 100ms
cycles
1. Electrical current abnormalities can be detected in a short measurement cycle, making it possible to determine product defects.
(e.g., manufacturing lines of semiconductors, precision devices, LCD panels, etc.)
2. Abnormal electrical current values can be detected and equipment status monitored. Equipment problems can be determined in advance.
Handy ways to use current measuring mode
*2: Items other than the current cannot be measured in the current measuring mode. QE84WH, QE83WH4W
Installation diagram
Programmable Logic Controller “MELSEC-Q Series”Energy Measuring Module/Insulation Monitoring Module
Programmable Logic Controller “MELSEC iQ-R Series”Energy Measuring Module
Slots directly into MELSEC-Q PLC and enables easy measurement of a variety of energy-related information!
Product Concept Product name : Energy Measuring Module Model name : RE81WH Specification : 1-circuit 1P2W/1P3W/3P3W
Features1. High speed data collecting (10ms)2. Wire saving, space saving
Can be mounted directly into the MELSEC iQ-R slot.3. Easy to set up
Set-up is simplified as well through use of the GX Works3 software.
� An energy measuring device can be added to an empty slot in the base unit without affecting the layout of devices in the control panel.
� Less wiring and engineering set-up work is required since the communication unit, cable and program are no longer required. As a result of the reduced workload, cost is also reduced.
Control panel Control panel
Energy Measuring ModuleCommunication module
Communication lineCC-Link, etc.
Measuring device(with communication function)
Controlpowersource
1. Space-saving measuring device 2. Reduced wiring and engineering set-up work
VoltageCurrent
Current sensor
� Speci�c energy consumption*3 can be easily calculated by combining the production data of the CPU module with the energy data of the Energy Measuring Module.
Measurement data is automatically collected at a speed of 250ms*4 and stored in the buffer memory, therefore enabling precise management of speci�c energy consumption.
The Ioc �uctuates in equipment with long cable length or inverter devices and �lters.
Amount of change due to insulation deterioration
The Ioc component interferes and it’s not possible to accurately determine leakage current from the insulation resistant component.
High-speed data processing
100 200 300 400 500 600 7000 800 900 1000Time [ms]
MELSEC iQ-R Series…Model name: RE81WHMELSEC-Q Series……Model name: QE81WH
Alarm status con�rmation/alarm occurrence record
Trend analysis
GOT (HMI)• Recording of maximum and minimum values• 2 types of upper/lower-limit alarm monitoring• Alarm status is stored in buffer
memory,eliminating complex ladder programmingPreventiverepair/service/overhaul
Circuit breaker
Split-typecurrent sensor
Inverter
Motor
Factors behind motor failure
Bearing
Ball (damaged)
Grease (dried up)
Pro
gram
mab
le L
ogic
Con
trol
ler
“ME
LSE
C iQ
-R S
erie
s” E
nerg
y M
easu
ring
Mod
ule
14
Ele
ctro
nic
Mul
ti-M
easu
ring
Inst
rum
ent
“ME
96S
S V
er.B
Ser
ies”
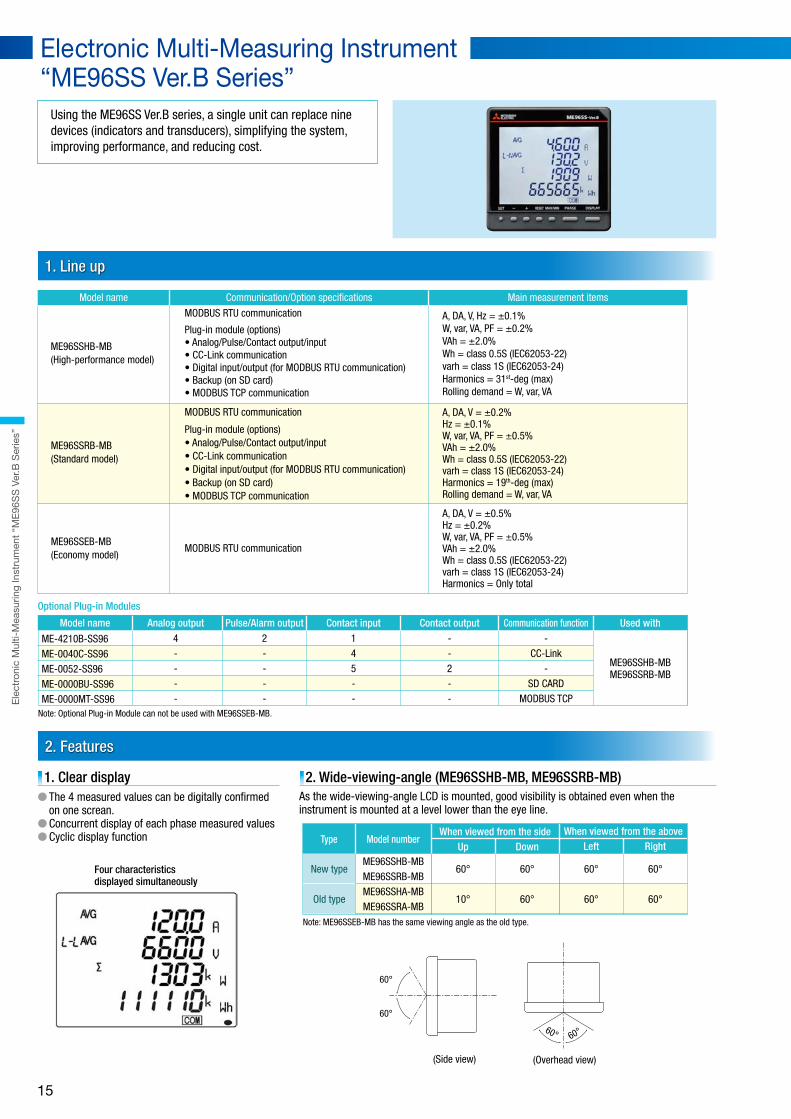
Model name Communication/Option speci�cations Main measurement items
ME96SSHB-MB(High-performance model)
ME96SSRB-MB(Standard model)
ME96SSEB-MB(Economy model)
MODBUS RTU communication
Plug-in module (options)• Analog/Pulse/Contact output/input• CC-Link communication • Digital input/output (for MODBUS RTU communication)• Backup (on SD card)• MODBUS TCP communication
MODBUS RTU communication
Plug-in module (options)• Analog/Pulse/Contact output/input• CC-Link communication • Digital input/output (for MODBUS RTU communication)• Backup (on SD card)• MODBUS TCP communication
MODBUS RTU communication
A, DA, V, Hz = ±0.1%W, var, VA, PF = ±0.2%VAh = ±2.0%Wh = class 0.5S (IEC62053-22)varh = class 1S (IEC62053-24)Harmonics = 31st-deg (max)Rolling demand = W, var, VA
A, DA, V = ±0.2%Hz = ±0.1%W, var, VA, PF = ±0.5%VAh = ±2.0%Wh = class 0.5S (IEC62053-22)varh = class 1S (IEC62053-24)Harmonics = 19th-deg (max)Rolling demand = W, var, VA
Optional Plug-in Modules
1. Line up
2. Features
1. Clear display� The 4 measured values can be digitally confirmed
on one screan.� Concurrent display of each phase measured values� Cyclic display function
2. Wide-viewing-angle (ME96SSHB-MB, ME96SSRB-MB)
3. Additional functions
4. Checking Input Wiring Support Function
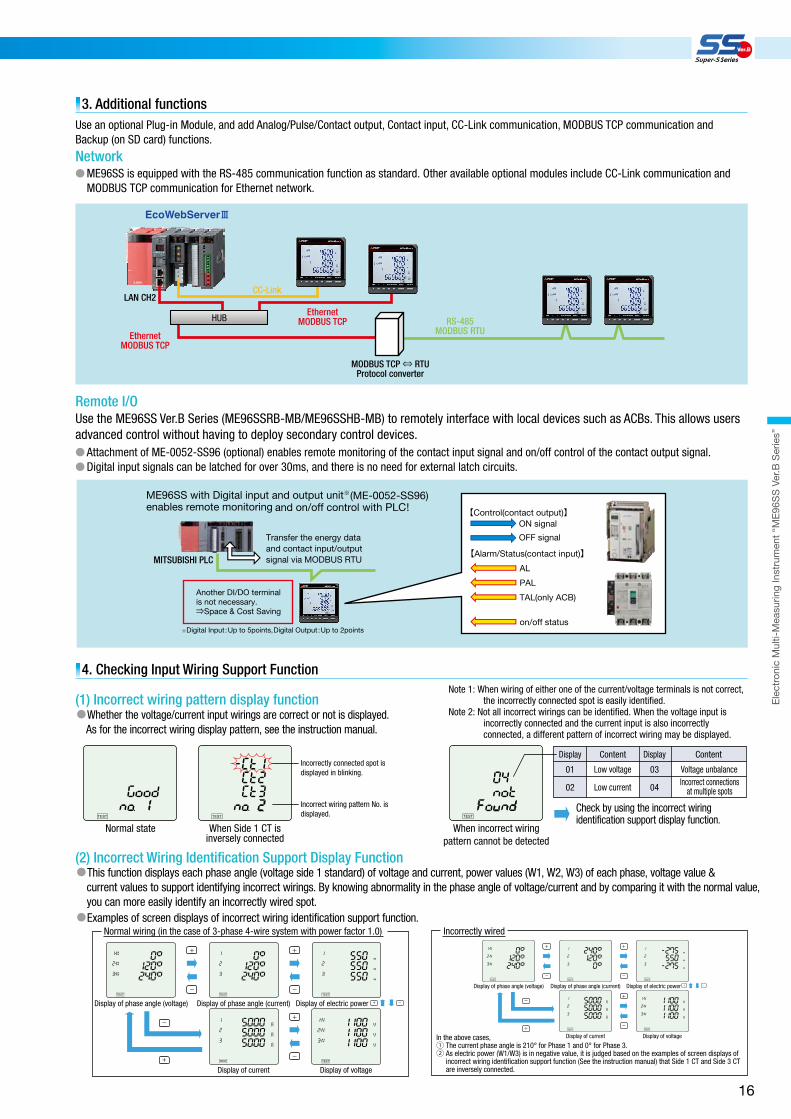
Use an optional Plug-in Module, and add Analog/Pulse/Contact output, Contact input, CC-Link communication, MODBUS TCP communication and Backup (on SD card) functions.
� ME96SS is equipped with the RS-485 communication function as standard. Other available optional modules include CC-Link communication and MODBUS TCP communication for Ethernet network.
Four characteristics displayed simultaneously
Use the ME96SS Ver.B Series (ME96SSRB-MB/ME96SSHB-MB) to remotely interface with local devices such as ACBs. This allows users advanced control without having to deploy secondary control devices.� Attachment of ME-0052-SS96 (optional) enables remote monitoring of the contact input signal and on/off control of the contact output signal.� Digital input signals can be latched for over 30ms, and there is no need for external latch circuits.
Using the ME96SS Ver.B series, a single unit can replace nine devices (indicators and transducers), simplifying the system, improving performance, and reducing cost.
with PLC
EcoWebServer#
EthernetMODBUS TCP
LAN CH2CC-Link
HUB RS-485MODBUS RTU
MODBUS TCP ⇔ RTUProtocol converter
EthernetMODBUS TCP
As the wide-viewing-angle LCD is mounted, good visibility is obtained even when the instrument is mounted at a level lower than the eye line.
MITSUBISHI PLC
(1) Incorrect wiring pattern display function
(2) Incorrect Wiring Identi�cation Support Display Function
Low voltage
Low current
Display
01
02
Content
Voltage unbalanceIncorrect connections
at multiple spots
Display
03
04
Content
Normal state When incorrect wiringpattern cannot be detected
When Side 1 CT isinversely connected
Incorrectly connected spot isdisplayed in blinking.
Incorrect wiring pattern No. is displayed.
Note 1: When wiring of either one of the current/voltage terminals is not correct, the incorrectly connected spot is easily identified.
Note 2: Not all incorrect wirings can be identified. When the voltage input is incorrectly connected and the current input is also incorrectly connected, a different pattern of incorrect wiring may be displayed.
Check by using the incorrect wiringidentification support display function.
»This function displays each phase angle (voltage side 1 standard) of voltage and current, power values (W1, W2, W3) of each phase, voltage value & current values to support identifying incorrect wirings. By knowing abnormality in the phase angle of voltage/current and by comparing it with the normal value, you can more easily identify an incorrectly wired spot.
»Examples of screen displays of incorrect wiring identification support function.
»Whether the voltage/current input wirings are correct or not is displayed.As for the incorrect wiring display pattern, see the instruction manual.
Incorrectly wired
Display of phase angle (voltage) Display of phase angle (current) Display of electric power
Display of current Display of voltage
Normal wiring (in the case of 3-phase 4-wire system with power factor 1.0)
Display of phase angle (voltage) Display of phase angle (current) Display of electric power
Display of current Display of voltage
In the above cases,① The current phase angle is 210° for Phase 1 and 0° for Phase 3.② As electric power (W1/W3) is in negative value, it is judged based on the examples of screen displays of
incorrect wiring identification support function (See the instruction manual) that Side 1 CT and Side 3 CT are inversely connected.
Model name Analog output Pulse/Alarm output Contact input Contact output Communication function Used with4----
145--
--2--
-CC-Link
-SD CARD
MODBUS TCP
ME96SSHB-MBME96SSRB-MB
ME-4210B-SS96ME-0040C-SS96ME-0052-SS96ME-0000BU-SS96ME-0000MT-SS96
2----
Note: Optional Plug-in Module can not be used with ME96SSEB-MB.
Type Model numberWhen viewed from the side When viewed from the above
Up LeftDown Right
New type
Old type
ME96SSHB-MBME96SSRB-MBME96SSHA-MBME96SSRA-MB
60°
10°
60°
60°
60°
60°
60°
60°
Note: ME96SSEB-MB has the same viewing angle as the old type.
Network
Remote I/O
Electronic Multi-Measuring Instrument “ME96SS Ver.B Series”
A, DA, V = ±0.5%Hz = ±0.2%W, var, VA, PF = ±0.5%VAh = ±2.0%Wh = class 0.5S (IEC62053-22)varh = class 1S (IEC62053-24)Harmonics = Only total
(Overhead view)(Side view)
60°
60°
60°
60°
15
Ele
ctro
nic
Mul
ti-M
easu
ring
Inst
rum
ent
“ME
96S
S V
er.B
Ser
ies”
Model name Communication/Option speci�cations Main measurement items
ME96SSHB-MB(High-performance model)
ME96SSRB-MB(Standard model)
ME96SSEB-MB(Economy model)
MODBUS RTU communication
Plug-in module (options)• Analog/Pulse/Contact output/input• CC-Link communication • Digital input/output (for MODBUS RTU communication)• Backup (on SD card)• MODBUS TCP communication
MODBUS RTU communication
Plug-in module (options)• Analog/Pulse/Contact output/input• CC-Link communication • Digital input/output (for MODBUS RTU communication)• Backup (on SD card)• MODBUS TCP communication
MODBUS RTU communication
A, DA, V, Hz = ±0.1%W, var, VA, PF = ±0.2%VAh = ±2.0%Wh = class 0.5S (IEC62053-22)varh = class 1S (IEC62053-24)Harmonics = 31st-deg (max)Rolling demand = W, var, VA
A, DA, V = ±0.2%Hz = ±0.1%W, var, VA, PF = ±0.5%VAh = ±2.0%Wh = class 0.5S (IEC62053-22)varh = class 1S (IEC62053-24)Harmonics = 19th-deg (max)Rolling demand = W, var, VA
Optional Plug-in Modules
1. Line up
2. Features
1. Clear display� The 4 measured values can be digitally confirmed
on one screan.� Concurrent display of each phase measured values� Cyclic display function
2. Wide-viewing-angle (ME96SSHB-MB, ME96SSRB-MB)
3. Additional functions
4. Checking Input Wiring Support Function
Use an optional Plug-in Module, and add Analog/Pulse/Contact output, Contact input, CC-Link communication, MODBUS TCP communication and Backup (on SD card) functions.
� ME96SS is equipped with the RS-485 communication function as standard. Other available optional modules include CC-Link communication and MODBUS TCP communication for Ethernet network.
Four characteristics displayed simultaneously
Use the ME96SS Ver.B Series (ME96SSRB-MB/ME96SSHB-MB) to remotely interface with local devices such as ACBs. This allows users advanced control without having to deploy secondary control devices.� Attachment of ME-0052-SS96 (optional) enables remote monitoring of the contact input signal and on/off control of the contact output signal.� Digital input signals can be latched for over 30ms, and there is no need for external latch circuits.
Using the ME96SS Ver.B series, a single unit can replace nine devices (indicators and transducers), simplifying the system, improving performance, and reducing cost.
with PLC
EcoWebServer#
EthernetMODBUS TCP
LAN CH2CC-Link
HUB RS-485MODBUS RTU
MODBUS TCP ⇔ RTUProtocol converter
EthernetMODBUS TCP
As the wide-viewing-angle LCD is mounted, good visibility is obtained even when the instrument is mounted at a level lower than the eye line.
MITSUBISHI PLC
(1) Incorrect wiring pattern display function
(2) Incorrect Wiring Identi�cation Support Display Function
Low voltage
Low current
Display
01
02
Content
Voltage unbalanceIncorrect connections
at multiple spots
Display
03
04
Content
Normal state When incorrect wiringpattern cannot be detected
When Side 1 CT isinversely connected
Incorrectly connected spot isdisplayed in blinking.
Incorrect wiring pattern No. is displayed.
Note 1: When wiring of either one of the current/voltage terminals is not correct, the incorrectly connected spot is easily identified.
Note 2: Not all incorrect wirings can be identified. When the voltage input is incorrectly connected and the current input is also incorrectly connected, a different pattern of incorrect wiring may be displayed.
Check by using the incorrect wiringidentification support display function.
»This function displays each phase angle (voltage side 1 standard) of voltage and current, power values (W1, W2, W3) of each phase, voltage value & current values to support identifying incorrect wirings. By knowing abnormality in the phase angle of voltage/current and by comparing it with the normal value, you can more easily identify an incorrectly wired spot.
»Examples of screen displays of incorrect wiring identification support function.
»Whether the voltage/current input wirings are correct or not is displayed.As for the incorrect wiring display pattern, see the instruction manual.
Incorrectly wired
Display of phase angle (voltage) Display of phase angle (current) Display of electric power
Display of current Display of voltage
Normal wiring (in the case of 3-phase 4-wire system with power factor 1.0)
Display of phase angle (voltage) Display of phase angle (current) Display of electric power
Display of current Display of voltage
In the above cases,① The current phase angle is 210° for Phase 1 and 0° for Phase 3.② As electric power (W1/W3) is in negative value, it is judged based on the examples of screen displays of
incorrect wiring identification support function (See the instruction manual) that Side 1 CT and Side 3 CT are inversely connected.
Model name Analog output Pulse/Alarm output Contact input Contact output Communication function Used with4----
145--
--2--
-CC-Link
-SD CARD
MODBUS TCP
ME96SSHB-MBME96SSRB-MB
ME-4210B-SS96ME-0040C-SS96ME-0052-SS96ME-0000BU-SS96ME-0000MT-SS96
2----
Note: Optional Plug-in Module can not be used with ME96SSEB-MB.
Type Model numberWhen viewed from the side When viewed from the above
Up LeftDown Right
New type
Old type
ME96SSHB-MBME96SSRB-MBME96SSHA-MBME96SSRA-MB
60°
10°
60°
60°
60°
60°
60°
60°
Note: ME96SSEB-MB has the same viewing angle as the old type.
Network
Remote I/O
Electronic Multi-Measuring Instrument “ME96SS Ver.B Series”
A, DA, V = ±0.5%Hz = ±0.2%W, var, VA, PF = ±0.5%VAh = ±2.0%Wh = class 0.5S (IEC62053-22)varh = class 1S (IEC62053-24)Harmonics = Only total
(Overhead view)(Side view)
60°
60°
60°
60°
16
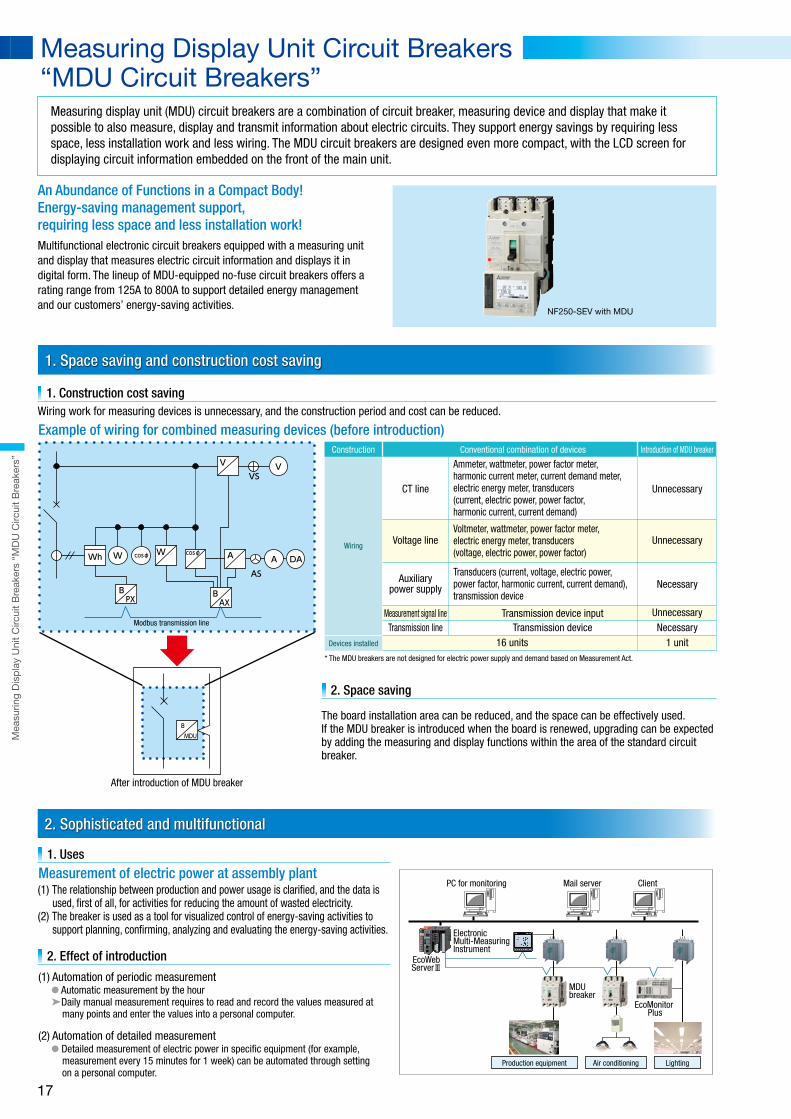
An Abundance of Functions in a Compact Body!Energy-saving management support, requiring less space and less installation work!Multifunctional electronic circuit breakers equipped with a measuring unit and display that measures electric circuit information and displays it in digital form. The lineup of MDU-equipped no-fuse circuit breakers offers a rating range from 125A to 800A to support detailed energy management and our customers’ energy-saving activities.
1. Construction cost saving
NF250-SEV with MDU
Construction Conventional combination of devices Introduction of MDU breaker
Wiring
Devices installed
CT line
Voltage line
Auxiliarypower supply
Measurement signal lineTransmission line
16 units
Ammeter, wattmeter, power factor meter, harmonic current meter, current demand meter, electric energy meter, transducers (current, electric power, power factor, harmonic current, current demand)
Voltmeter, wattmeter, power factor meter, electric energy meter, transducers (voltage, electric power, power factor)
Transducers (current, voltage, electric power, power factor, harmonic current, current demand), transmission device
1 unit
Transmission device inputTransmission device
Unnecessary
Unnecessary
Unnecessary
Necessary
Necessary
1. Space saving and construction cost saving
2. Sophisticated and multifunctional
Wiring work for measuring devices is unnecessary, and the construction period and cost can be reduced.
1. Downsizing
Breakers with the same outside dimensions as the standard circuit breakers are realized by using the front LCD for displaying circuit information.
2. Improved visibility
When an alarm or fault occurs, the LCD backlight changes from white to red.
3. Improved operability
4. Increased breaking capacity
5. Various types of mounting
The multi-function display screen reduces the number of operations.
The display direction can be switched.
Measuring display unit (MDU) circuit breakers are a combination of circuit breaker, measuring device and display that make it possible to also measure, display and transmit information about electric circuits. They support energy savings by requiring less space, less installation work and less wiring. The MDU circuit breakers are designed even more compact, with the LCD screen for displaying circuit information embedded on the front of the main unit.
Example of wiring for combined measuring devices (before introduction)
2. Space saving
1. Uses
2. Effect of introduction
Measuring Display Unit Circuit Breakers“MDU Circuit Breakers”
Evolving MDU Breakers
After introduction of MDU breaker
* The MDU breakers are not designed for electric power supply and demand based on Measurement Act.
The board installation area can be reduced, and the space can be effectively used.If the MDU breaker is introduced when the board is renewed, upgrading can be expected by adding the measuring and display functions within the area of the standard circuit breaker.
VV
A A
AS
AXB
PXB
Modbus transmission line
WWWh DA
VS
cosφcosφ
B
MDU
MDU breaker
PC for monitoring
Electronic Multi-MeasuringInstrument
Mail server Client
EcoMonitor Plus
EcoWebServerⅢ
● Automatic measurement by the hour➤Daily manual measurement requires to read and record the values measured at
many points and enter the values into a personal computer.
Measurement of electric power at assembly plant (1) The relationship between production and power usage is clari�ed, and the data is
used, �rst of all, for activities for reducing the amount of wasted electricity.(2) The breaker is used as a tool for visualized control of energy-saving activities to
support planning, con�rming, analyzing and evaluating the energy-saving activities.
(1) Automation of periodic measurement
● Detailed measurement of electric power in speci�c equipment (for example, measurement every 15 minutes for 1 week) can be automated through setting on a personal computer.
(2) Automation of detailed measurement
When an alarm occurs (selectable from On and blinking)
PAL (load current pre-alarm), OVER (overcurrent alarm), etc.
105 mm
165 mm
MDU unit
68 mm
(Dimensions in the case where Breaker mounting unit of the 250 A frame is separately mounted)
105 mm
165 mm
68 mm
VerticalHorizontal(Breaker mounting unit)
The measurement item to be checked can be quickly displayed from the measurement item list.
The conditions of three phases are displayed in one window and can be seen at a glance.
10/1030/3042/4250/5050/5050/5085/8585/85
10/1030/3042/4245/4545/4545/4585/8585/85
690500440415400380230200
NF400-SEW with MDUNF800-SEW with MDU
NF400-SEP with MDUNF600-SEP with MDUNF800-SEP with MDU
The standard MDU connecting cable for panel mounting and breaker mounting separate unit is 2 m long. (The cable length, 0.5 m, 3 m, 5 m or 10 m, can be speci�ed.)
Rated breaking capacity[kA]Icu/Ics
AC[V]
Type
8/818/1836/3636/3636/3636/3685/8585/85
-15/825/1330/1530/1530/1550/2550/25
690500440415400380230200
NF250-SEV with MDUNF250-SW with MDU
Rated breaking capacity[kA]Icu/Ics
AC[V]
Type
[Applicable standards] JIS C 8201-2-1 Ann.1, JIS C 8201-2-1 Ann.2, IEC 60947-2
Since any two elements can be constantly set in one window, the number of repeated operations can be reduced.(Up to 8 elements in four windows can be set.)
(Example) Current value of phase 1
(Example) Line voltage between phases 1 and 2
Production equipment Air conditioning Lighting
○○○
○○○
○○×
○○×
Pulse outputCC-LinkMODBUS
External mounting Panel mounting Breaker mounting Breaker mounting unit separate installation
External mounting Panel mounting Breaker mounting Breaker mounting unit separate installation
Mea
surin
g D
isp
lay
Uni
t C
ircui
t B
reak
ers
“MD
U C
ircui
t B
reak
ers”
17
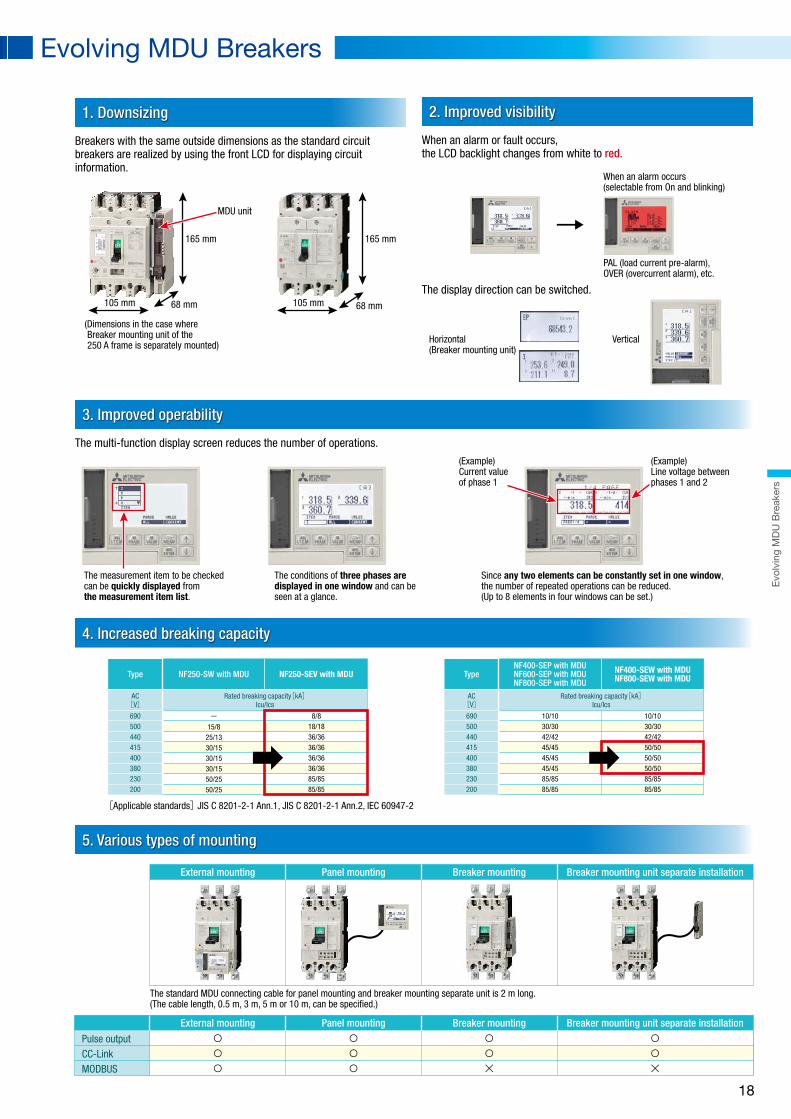
An Abundance of Functions in a Compact Body!Energy-saving management support, requiring less space and less installation work!Multifunctional electronic circuit breakers equipped with a measuring unit and display that measures electric circuit information and displays it in digital form. The lineup of MDU-equipped no-fuse circuit breakers offers a rating range from 125A to 800A to support detailed energy management and our customers’ energy-saving activities.
1. Construction cost saving
NF250-SEV with MDU
Construction Conventional combination of devices Introduction of MDU breaker
Wiring
Devices installed
CT line
Voltage line
Auxiliarypower supply
Measurement signal lineTransmission line
16 units
Ammeter, wattmeter, power factor meter, harmonic current meter, current demand meter, electric energy meter, transducers (current, electric power, power factor, harmonic current, current demand)
Voltmeter, wattmeter, power factor meter, electric energy meter, transducers (voltage, electric power, power factor)
Transducers (current, voltage, electric power, power factor, harmonic current, current demand), transmission device
1 unit
Transmission device inputTransmission device
Unnecessary
Unnecessary
Unnecessary
Necessary
Necessary
1. Space saving and construction cost saving
2. Sophisticated and multifunctional
Wiring work for measuring devices is unnecessary, and the construction period and cost can be reduced.
1. Downsizing
Breakers with the same outside dimensions as the standard circuit breakers are realized by using the front LCD for displaying circuit information.
2. Improved visibility
When an alarm or fault occurs, the LCD backlight changes from white to red.
3. Improved operability
4. Increased breaking capacity
5. Various types of mounting
The multi-function display screen reduces the number of operations.
The display direction can be switched.
Measuring display unit (MDU) circuit breakers are a combination of circuit breaker, measuring device and display that make it possible to also measure, display and transmit information about electric circuits. They support energy savings by requiring less space, less installation work and less wiring. The MDU circuit breakers are designed even more compact, with the LCD screen for displaying circuit information embedded on the front of the main unit.
Example of wiring for combined measuring devices (before introduction)
2. Space saving
1. Uses
2. Effect of introduction
Measuring Display Unit Circuit Breakers“MDU Circuit Breakers”
Evolving MDU Breakers
After introduction of MDU breaker
* The MDU breakers are not designed for electric power supply and demand based on Measurement Act.
The board installation area can be reduced, and the space can be effectively used.If the MDU breaker is introduced when the board is renewed, upgrading can be expected by adding the measuring and display functions within the area of the standard circuit breaker.
VV
A A
AS
AXB
PXB
Modbus transmission line
WWWh DA
VS
cosφcosφ
B
MDU
MDU breaker
PC for monitoring
Electronic Multi-MeasuringInstrument
Mail server Client
EcoMonitor Plus
EcoWebServerⅢ
● Automatic measurement by the hour➤Daily manual measurement requires to read and record the values measured at
many points and enter the values into a personal computer.
Measurement of electric power at assembly plant (1) The relationship between production and power usage is clari�ed, and the data is
used, �rst of all, for activities for reducing the amount of wasted electricity.(2) The breaker is used as a tool for visualized control of energy-saving activities to
support planning, con�rming, analyzing and evaluating the energy-saving activities.
(1) Automation of periodic measurement
● Detailed measurement of electric power in speci�c equipment (for example, measurement every 15 minutes for 1 week) can be automated through setting on a personal computer.
(2) Automation of detailed measurement
When an alarm occurs (selectable from On and blinking)
PAL (load current pre-alarm), OVER (overcurrent alarm), etc.
105 mm
165 mm
MDU unit
68 mm
(Dimensions in the case where Breaker mounting unit of the 250 A frame is separately mounted)
105 mm
165 mm
68 mm
VerticalHorizontal(Breaker mounting unit)
The measurement item to be checked can be quickly displayed from the measurement item list.
The conditions of three phases are displayed in one window and can be seen at a glance.
10/1030/3042/4250/5050/5050/5085/8585/85
10/1030/3042/4245/4545/4545/4585/8585/85
690500440415400380230200
NF400-SEW with MDUNF800-SEW with MDU
NF400-SEP with MDUNF600-SEP with MDUNF800-SEP with MDU
The standard MDU connecting cable for panel mounting and breaker mounting separate unit is 2 m long. (The cable length, 0.5 m, 3 m, 5 m or 10 m, can be speci�ed.)
Rated breaking capacity[kA]Icu/Ics
AC[V]
Type
8/818/1836/3636/3636/3636/3685/8585/85
-15/8
25/1330/1530/1530/1550/2550/25
690500440415400380230200
NF250-SEV with MDUNF250-SW with MDU
Rated breaking capacity[kA]Icu/Ics
AC[V]
Type
[Applicable standards] JIS C 8201-2-1 Ann.1, JIS C 8201-2-1 Ann.2, IEC 60947-2
Since any two elements can be constantly set in one window, the number of repeated operations can be reduced.(Up to 8 elements in four windows can be set.)
(Example) Current value of phase 1
(Example) Line voltage between phases 1 and 2
Production equipment Air conditioning Lighting
○○○
○○○
○○×
○○×
Pulse outputCC-LinkMODBUS
External mounting Panel mounting Breaker mounting Breaker mounting unit separate installation
External mounting Panel mounting Breaker mounting Breaker mounting unit separate installation
Evo
lvin
g M
DU
Bre
aker
s
18

Overview of EcoWebServer#
� Energy information � Production information� Operating information, etc.
Collect
Visualize
Analyze
Online publicationStore
Monitor
NetworkNetwork
LAN(Ethernet)LAN(Ethernet)
Contact output email notificationContact output email notification
Model MES3-255C-ENMES3-255C-CN
Model MES3-255C-DM-ENMES3-255C-DM-CN
1. No need to add programs or software
� Measurement data can be displayed as graphs on the web browser.� Possible to con�rm energy consumption status in detail, using consumption by the minute (measurement value).
Simple settings
� Basic setting are (1) Measuring terminal registration → (2) Measuring point registration → (3) Project writing.
2. Measured Data in Graphs on a Web Browser
� With built-in applications focused on energy saving (including graph functions), it is possible to contribute to energy-saving measures in plants.� By HTTP server functions, the collected data is transmitted via Ethernet across the Intranet so that anyone in the network can check and grasp the
energy usage in real-time.
Mobile terminals (using a Web browser)
LAN(Ethernet)
Wireless router
EcoWebServer#
Wide monitor Laptop PC Tablet
� In addition, the size and position of graphs are automatically adjusted to the window width of a Web browser and the screen size of a terminal, so now, you can see the screen adjusted to the terminal to use.
� Get on-site information from smartphones and tablets instantaneously
� Improve the awareness of energy saving on the site by making the monitor seen
� Possible to see graphs from PCs in the same network
3. Smartphone and Tablet Supported
� It is possible to display graphs directly on a Web browser, so you can see the graphs from mobile terminals including smartphones and tablets as well as PCs.
(1) Register device information
(2) Select data from list
Energy Saving Data Collecting Server “EcoWebServer#”
EcoWebServer# simplifies the data analysis tasks necessary for saving energy. With simple settings, the EcoWebServer# can collect measurement data from measurement devices connected to the field network (MODBUS or CC-Link), convert the data into graphs using a web browser and display it as current values.
Alarm
Alarmgenerated
Equipment
Ah, it’s an e-mail for of an alarm generated on Line A.
(1)
(3)
(2)
Ene
rgy
Sav
ing
Dat
a C
olle
ctin
g S
erve
r “E
coW
ebS
erve
r #”
19
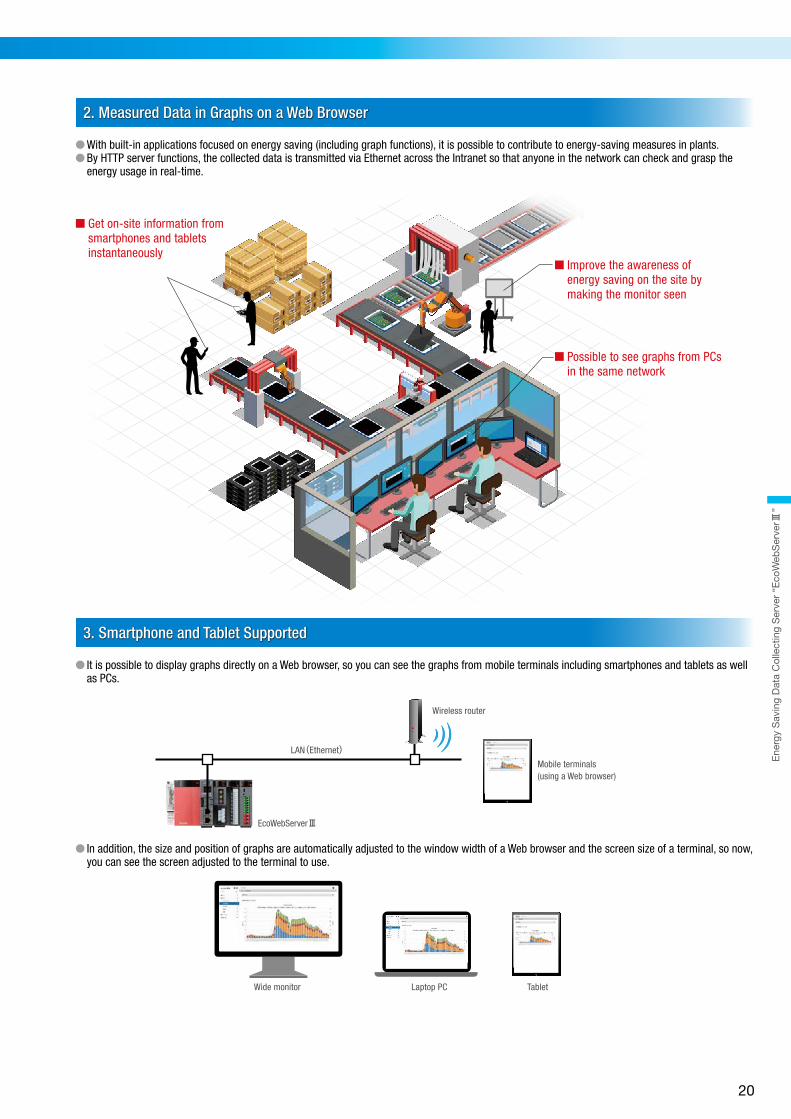
Overview of EcoWebServer#
� Energy information � Production information� Operating information, etc.
Collect
Visualize
Analyze
Online publicationStore
Monitor
NetworkNetwork
LAN(Ethernet)LAN(Ethernet)
Contact output email notificationContact output email notification
Model MES3-255C-ENMES3-255C-CN
Model MES3-255C-DM-ENMES3-255C-DM-CN
1. No need to add programs or software
� Measurement data can be displayed as graphs on the web browser.� Possible to con�rm energy consumption status in detail, using consumption by the minute (measurement value).
Simple settings
� Basic setting are (1) Measuring terminal registration → (2) Measuring point registration → (3) Project writing.
2. Measured Data in Graphs on a Web Browser
� With built-in applications focused on energy saving (including graph functions), it is possible to contribute to energy-saving measures in plants.� By HTTP server functions, the collected data is transmitted via Ethernet across the Intranet so that anyone in the network can check and grasp the
energy usage in real-time.
Mobile terminals (using a Web browser)
LAN(Ethernet)
Wireless router
EcoWebServer#
Wide monitor Laptop PC Tablet
� In addition, the size and position of graphs are automatically adjusted to the window width of a Web browser and the screen size of a terminal, so now, you can see the screen adjusted to the terminal to use.
� Get on-site information from smartphones and tablets instantaneously
� Improve the awareness of energy saving on the site by making the monitor seen
� Possible to see graphs from PCs in the same network
3. Smartphone and Tablet Supported
� It is possible to display graphs directly on a Web browser, so you can see the graphs from mobile terminals including smartphones and tablets as well as PCs.
(1) Register device information
(2) Select data from list
Energy Saving Data Collecting Server “EcoWebServer#”
EcoWebServer# simplifies the data analysis tasks necessary for saving energy. With simple settings, the EcoWebServer# can collect measurement data from measurement devices connected to the field network (MODBUS or CC-Link), convert the data into graphs using a web browser and display it as current values.
Alarm
Alarmgenerated
Equipment
Ah, it’s an e-mail for of an alarm generated on Line A.
(1)
(3)
(2)
Ene
rgy
Sav
ing
Dat
a C
olle
ctin
g S
erve
r “E
coW
ebS
erve
r #”
20

MES3-255C-DM-EN exampleMES3-255C-DM-CN example
MES3-255C-EN exampleMES3-255C-CN example
MODBUS TCPMODBUS RTU
Protocol converter
RS-485 (MODBUS RTU)
CC-Link
Electronic Multi-MeasuringInstrument
MDU BreakerEthernet (MODBUS TCP)
MITSUBISHI GOT
Electronic Multi-Measuring Instrument
EcoWebServer#
Energy Measuring UnitEcoMonitorLight (EMU4-FD1-MB) Energy Measuring Unit
EcoMonitorLight
Energy Measuring UnitEcoMonitorLight
Energy Measuring Unit EcoMonitorPlus
Ethernet (SLMP)
RS-485 (MODBUS RTU)
CC-Link
Ethernet (SLMP)
Energy-Saving Data Collecting ServerControl Air
conditioning
Electronic Multi-Measuring Instrument
Energy Measuring UnitEcoMonitorLight(EMU4-FD1-MB)
Energy Measuring UnitEcoMonitorLight
Electronic Multi-MeasuringInstrument
MDU Breaker Energy Measuring UnitEcoMonitorLight
Energy Measuring UnitEcoMonitorPlus
Sends an email(email noti�cation regarding upper/ lower-limit faults)
Sends an email(email noti�cation regarding upper-/ lower-limit faults)
Measurement information(energy, current, voltage, etc.)
Production information(production volume, etc.)
View on web browser(daily, monthly, yearly, current value, speci�c
consumption graph display)
Demand information
Mitsubishi Electric web-supported A/C central controller
EcoWebServer#(with demand monitoring function)
MODBUS TCPMODBUS RTU
Protocol converter
Ethernet (MODBUS TCP)
Receives power
FTP server(File server)
E-mail noti�cationabnormal upper/lower limits,
operating status.Target value over speci�c
consumption,over planned energy value,
error information
Transfers �les in CSV formatzoom (1 or 5 min), daily, monthly,
annual, factilly (daily),speci�c consumption
demand (daily, monthly, annual),demand alarm, control,
operation history, system log �le
SMTP server(Mail server)
SNTP server(Time server)
FTP server(File server)
Acquire time informationAdjust
EcoWebServer # clock
Ethernet
Ethernet
SMTP server(Mail server)
SNTP server(Time server)
Acquire time informationAdjust
EcoWebServer # clock
E-mail noti�cationabnormal upper/lower limits,
operating status.Target value over speci�c
consumption,over planned energy value,
error information
Transfers �les in CSV formatzoom (1 or 5 min), daily, monthly,
annual, factilly (daily),speci�c consumption
demand (daily, monthly, annual),demand alarm, control,
operation history, system log �le
Energy-Saving Data Collecting Server
MITSUBISHI PLC
Pulse input
MITSUBISHI GOTMITSUBISHI PLC
4. Easily understand productivity by con�rming the speci�c consumption graph
� By integrating the production volumes from the measuring terminal and PLC, the speci�c consumption graph can be easily displayed and points related to the drop in speci�c consumption can be easily understood.
� Additionally, by comparing two speci�c consumption graphs at the same line, it is possible to con�rm the bene�ts at the time the countermeasure was implemented.
5. Connection with Mitsubishi Electric GOT display device
� Information collected on the EcoWebServer# can be displayed on the GOT. � By displaying the alarm state/measuring value for energy information/demand, real-time monitoring at the site and urgent countermeasures are
possible.
6. Alarm output/email noti�cation through a variety of monitoring functions
� Objective values (upper/lower) and error information can be transmitted through email noti�cations/alarm output, and changes in status can be recognized immediately. The result of the careful target value management and monitoring the status monitoring ensure that problems occurring at the site are not overlooked.
Enables energy-saving A/C control linked
Energy Saving Data Collecting Server “EcoWebServer#”
Display date selection menu� Select the date of the data from the
pulldown menu.
Speci�c consumption measuring point selection menu� Select the speci�c consumption
measuring point from the pulldown menu.
Automatic update �xed display box�
�
Yearly/monthly graph: 1hr cycleDaily/zoom data: 1min cycle
Objective value scale �xed display box� Use the checkbox to select
whether or not to display the vertical scale of the graph with the speci�c consumption objective value in the center.
Speci�c consumption amount (=a÷b)
Cumulative amount of energy used
Production amount (b)
Energy used (a)
Objective value setting window button� Objective values can be set for each
measuring point from the speci�c consumption screen.A password is required to change objective value settings.
�
* The password is set so that it can only be changed by the administrator.
Speci�c consumption planned value
・Energy plan value・Speci�c consumption objective value・Upper/lower irregularity・Change in operating state・Error information・Demand alarm Alarm
lamps
Alarm output Email noti�cationSMTP Server<Items monitored>
Network monitor display lights
(PATLITE) MITSUBISHI GOT MITSUBISHI PLC
LAN(Ethernet)
Ethernet(Melsec comunication protocol)
EcoWebServer #(equipped with demand monitoring function)
Alarms displayed via the LAN
Displays demand information and alarm information
over the set target value
Wireless router
Mobile terminalsTablet
Wireless router
Mobile terminalsTablet
Ene
rgy
Sav
ing
Dat
a C
olle
ctin
g S
erve
r “E
coW
ebS
erve
r #”
21
MES3-255C-DM-EN exampleMES3-255C-DM-CN example
MES3-255C-EN exampleMES3-255C-CN example
MODBUS TCPMODBUS RTU
Protocol converter
RS-485 (MODBUS RTU)
CC-Link
Electronic Multi-MeasuringInstrument
MDU BreakerEthernet (MODBUS TCP)
MITSUBISHI GOT
Electronic Multi-Measuring Instrument
EcoWebServer#
Energy Measuring UnitEcoMonitorLight (EMU4-FD1-MB) Energy Measuring Unit
EcoMonitorLight
Energy Measuring UnitEcoMonitorLight
Energy Measuring Unit EcoMonitorPlus
Ethernet (SLMP)
RS-485 (MODBUS RTU)
CC-Link
Ethernet (SLMP)
Energy-Saving Data Collecting ServerControl Air
conditioning
Electronic Multi-Measuring Instrument
Energy Measuring UnitEcoMonitorLight(EMU4-FD1-MB)
Energy Measuring UnitEcoMonitorLight
Electronic Multi-MeasuringInstrument
MDU Breaker Energy Measuring UnitEcoMonitorLight
Energy Measuring UnitEcoMonitorPlus
Sends an email(email noti�cation regarding upper/ lower-limit faults)
Sends an email(email noti�cation regarding upper-/ lower-limit faults)
Measurement information(energy, current, voltage, etc.)
Production information(production volume, etc.)
View on web browser(daily, monthly, yearly, current value, speci�c
consumption graph display)
Demand information
Mitsubishi Electric web-supported A/C central controller
EcoWebServer#(with demand monitoring function)
MODBUS TCPMODBUS RTU
Protocol converter
Ethernet (MODBUS TCP)
Receives power
FTP server(File server)
E-mail noti�cationabnormal upper/lower limits,
operating status.Target value over speci�c
consumption,over planned energy value,
error information
Transfers �les in CSV formatzoom (1 or 5 min), daily, monthly,
annual, factilly (daily),speci�c consumption
demand (daily, monthly, annual),demand alarm, control,
operation history, system log �le
SMTP server(Mail server)
SNTP server(Time server)
FTP server(File server)
Acquire time informationAdjust
EcoWebServer # clock
Ethernet
Ethernet
SMTP server(Mail server)
SNTP server(Time server)
Acquire time informationAdjust
EcoWebServer # clock
E-mail noti�cationabnormal upper/lower limits,
operating status.Target value over speci�c
consumption,over planned energy value,
error information
Transfers �les in CSV formatzoom (1 or 5 min), daily, monthly,
annual, factilly (daily),speci�c consumption
demand (daily, monthly, annual),demand alarm, control,
operation history, system log �le
Energy-Saving Data Collecting Server
MITSUBISHI PLC
Pulse input
MITSUBISHI GOTMITSUBISHI PLC
4. Easily understand productivity by con�rming the speci�c consumption graph
� By integrating the production volumes from the measuring terminal and PLC, the speci�c consumption graph can be easily displayed and points related to the drop in speci�c consumption can be easily understood.
� Additionally, by comparing two speci�c consumption graphs at the same line, it is possible to con�rm the bene�ts at the time the countermeasure was implemented.
5. Connection with Mitsubishi Electric GOT display device
� Information collected on the EcoWebServer# can be displayed on the GOT. � By displaying the alarm state/measuring value for energy information/demand, real-time monitoring at the site and urgent countermeasures are
possible.
6. Alarm output/email noti�cation through a variety of monitoring functions
� Objective values (upper/lower) and error information can be transmitted through email noti�cations/alarm output, and changes in status can be recognized immediately. The result of the careful target value management and monitoring the status monitoring ensure that problems occurring at the site are not overlooked.
Enables energy-saving A/C control linked
Energy Saving Data Collecting Server “EcoWebServer#”
Display date selection menu� Select the date of the data from the
pulldown menu.
Speci�c consumption measuring point selection menu� Select the speci�c consumption
measuring point from the pulldown menu.
Automatic update �xed display box�
�
Yearly/monthly graph: 1hr cycleDaily/zoom data: 1min cycle
Objective value scale �xed display box� Use the checkbox to select
whether or not to display the vertical scale of the graph with the speci�c consumption objective value in the center.
Speci�c consumption amount (=a÷b)
Cumulative amount of energy used
Production amount (b)
Energy used (a)
Objective value setting window button� Objective values can be set for each
measuring point from the speci�c consumption screen.A password is required to change objective value settings.
�
* The password is set so that it can only be changed by the administrator.
Speci�c consumption planned value
・Energy plan value・Speci�c consumption objective value・Upper/lower irregularity・Change in operating state・Error information・Demand alarm Alarm
lamps
Alarm output Email noti�cationSMTP Server<Items monitored>
Network monitor display lights
(PATLITE) MITSUBISHI GOT MITSUBISHI PLC
LAN(Ethernet)
Ethernet(Melsec comunication protocol)
EcoWebServer #(equipped with demand monitoring function)
Alarms displayed via the LAN
Displays demand information and alarm information
over the set target value
Wireless router
Mobile terminalsTablet
Wireless router
Mobile terminalsTablet
Ene
rgy
Sav
ing
Dat
a C
olle
ctin
g S
erve
r “E
coW
ebS
erve
r #”
22
Analyze collected dataVarious analysis can be realized by collecting energy information such as electricity consumption and production volume accumulated by PLC.
Feature 1
Only 3 steps to display graphs
Step Select ‘Method’ Step Select ‘View’ Step Select ‘Measuring Points’
Selectable from 7 types of graphs depending on analysis purpose
Understanding the present situation: Visualizing the energy comsumption of each production process
Ranking chart helps users to identify the bottleneck process.
Rate (Pie chart) Rank (Bar chart)
Specific consumption management: Monitoring energy consumption in relation to production volume
EcoAdviser helps users to identify the deterioration point of production efficiency.It assists users to find equipments or operation where KAIZEN is required.
Time series (Line, Bar, Stacked, and Other graphs)
Variation (Box plot)
Specific consumption*1
Production volume
Deterioration point
analysis level
Find out correlation
Correlation (Scatter diagram)
Check error records
Understanding the error contentto be dealt with.
Factor (Pareto chart)
Setting threshold and target
Determine the threshold or target value by understanding the distribution of collected data.
Distribution (Histogram)
Understanding the present production efficiency by checking the correlation between production volume and energy consumption.
*1: Specific consumption = Amount of energy consumption
Production quantity
Ene
rgy
Sav
ing
Sup
por
t S
oftw
are
“Eco
Ad
vise
r”
23
Energy Saving Support Software “EcoAdviser”
EcoAdviser is a support tool for energy-saving activity. It is user-friendly, easy-setup, and helps to analyze energy usage data.

Customizable Dashboard
User-friendly setting and scalability
Collected data can be displayed in graphs/charts on customizable Dashboard. Also, if a web server is set on your PC, EcoAdviser can be used as a visualization tool at the site.
Try demo software! Demo software can be downloaded from website.(https://www.mitsubishielectric.com/fa/products/pmng/ems/index.html)
Easy setup
The application can be launched and extended only with PC mouse operation.
*EdgecrossOpen software platform for edge computing domain that enables collaboration between FA and IT.
Easy operation with Edgecross
Feature 2
Feature 3
Dashboard
System Configuration
Collecting data from EcoWebServerⅢ Collecting data from Edgecross application
Industrial computer: MELIPC
*1: The software collects measuring data from Zoom (1 min.) data file and Demand (daily) data file basis in EcoWebServerⅢ.*2: To browse a dashboard in HTML file on a PC in the network, it is necessary to enable Web server functionality such as IIS on the PC.*3: The software collects measuring data in collection source from historical data file created by Edgecross.*4: If a PC, MELIPC, is able to communicate with EcoWebServerⅢ through Ethernet, both Edgecross and EcoWebServerⅢ can be registered as collection source.
* Monitor screen update cycle is 1 hour.
+
Access a server PC for webpage and browse a dashboard in HTML file format. *2
Ethernet
The product
Measuring data *1
Measuring instrumentCollection source (Up to 20 units)
PC *2PC on thenetwork
Hardware key
EcoWebServerⅢ EcoWebServerⅢ
EcoAdviser
Dashboard(HTML file)
Ethernet
EcoAdviser
Collection source
+
+
Peripherals
Measuring instrument
PLCPLC
PC (MELIPC) *4
The product
Hardware key
PC on thenetwork
Measuring data *3
Dashboard(HTML file)
Access a server PC for webpage and browse a dashboard in HTML file format. *2
No programming or complicated engineering work is required. All you need is just simple setting.EcoAdviser collects measured data automatically. It can be also used as an application that runs on Edgecross*.
Ene
rgy
Sav
ing
Sup
por
t S
oftw
are
“Eco
Ad
vise
r”
24
Energy Saving Support Software “EcoAdviser”
EcoAdviser is a support tool for energy-saving activity. It is user-friendly, easy-setup, and helps to analyze energy usage data.
Energy management of whole factory Simple energy monitoring
Preventive maintenance
1. Example of office building
2. Example of specific consumption management
Non-ferrous metal manufacturer
� Application : Monitoring Insulation of brazing furnaces with inverter (heater)
Car/ Car parts manufacturer
It is possible to monitor and understand energy consumption in each factory, including water, gas and air. Also, they have installed GOT in the electric room and monitored alarm status.
Formula for Specific Energy Consumption
Distribution panel
Ethernet (Factory LAN)
Each Machines
Air conditioner Machines
Compressor
Chiller
Of�ce building Factory B
Distribution panel Lighting
Water, Air, Gas
Warehouse
Alarm
Factory A
Air conditionerMODBUS TCPMODBUS TCP CC-LinkCC-Link
MODBUSRTUMODBUSRTU
MODBUS TCPMODBUS RTUProtocol converter
MODBUS TCPMODBUS RTUProtocol converter
Facility : Brazing furnaces with Inverter
GOT (Display unit)
Control Board
HeaterInverter Control
Inverter Insulation Monitoring
Leakage current obtained by synthesizing Ior and Ioc (vector synthesis)
Resistive-component leakage current
Startup time
Insulation Monitoring is Ior !
Extruder with Inverter is also enabled
[Industry applications]Plastic products manufacturingRubber products manufacturingFilm products manufacturing
Graph and Aggravating Factor of Specific Consumption
� I do not understand how much electricity each facility uses in factory. � I do not understand energy-saving ef�ciency when replacing equipment. � However, I cannot invest much for energy-saving initiatives.
� Electric energy of each device can be measured by installing one EcoMonitorLight.
1. Enable to data collected off-line to be saved to SD card using Logging Unit. 2. Enable con�rm energy-saving effect by comparing old and new performance when each device at factory is renewed. (Easy construction by segmented CT.) 3. System can be built gradually.
CompressorCompressor
Pressing machinePressing machine
Cutting machineCutting machine
Measuring devices using one EcoMonitorLightMeasure each facility for a certain period of time to check
power consumption
Introduce EcoMonitorLight for each facilityMeasure at all time to implement energy-saving
countermeasures for measured value
Step up to visualization of entire factory
StatusIntroduction schedule
1.
2.
3.
Problem Solution!
� What is the best way to monitor equipment insulation using Inverter or servo motors...
� Insulation deterioration is constantly monitored with the Insulation Monitoring Module.
Problem Solution!
Introduction point
Leakage current (Ioc) �ows continuously in aluminum electrolytic capacitor used in Inverter or servo when machine is being turned on. Only with leakage current (Io) is not enough to monitor Insulation correctly.
Points of introducing of QE82LG
EcoMonitorLightEcoMonitorLight
� Measuring point : Facility in factory� Customer’s requests:
I want to do simple measurement to watch the actual condition closely.I want to manage data by using SD card.
Measurement of Insulation deterioration can prevent sudden trouble and reduce production loss due to equipment stoppage by monitoring resistive-component leakage current (lor).
Off during lunch↓
Automatically off
Example of Energy Monitoring System
Exa
mp
le o
f Ene
rgy
Mon
itorin
g S
yste
m
25
Energy management of whole factory Simple energy monitoring
Preventive maintenance
1. Example of office building
2. Example of specific consumption management
Non-ferrous metal manufacturer
� Application : Monitoring Insulation of brazing furnaces with inverter (heater)
Car/ Car parts manufacturer
It is possible to monitor and understand energy consumption in each factory, including water, gas and air. Also, they have installed GOT in the electric room and monitored alarm status.
Formula for Specific Energy Consumption
Distribution panel
Ethernet (Factory LAN)
Each Machines
Air conditioner Machines
Compressor
Chiller
Of�ce building Factory B
Distribution panel Lighting
Water, Air, Gas
Warehouse
Alarm
Factory A
Air conditionerMODBUS TCPMODBUS TCP CC-LinkCC-Link
MODBUSRTUMODBUSRTU
MODBUS TCPMODBUS RTUProtocol converter
MODBUS TCPMODBUS RTUProtocol converter
Facility : Brazing furnaces with Inverter
GOT (Display unit)
Control Board
HeaterInverter Control
Inverter Insulation Monitoring
Leakage current obtained by synthesizing Ior and Ioc (vector synthesis)
Resistive-component leakage current
Startup time
Insulation Monitoring is Ior !
Extruder with Inverter is also enabled
[Industry applications]Plastic products manufacturingRubber products manufacturingFilm products manufacturing
Graph and Aggravating Factor of Specific Consumption
� I do not understand how much electricity each facility uses in factory. � I do not understand energy-saving ef�ciency when replacing equipment. � However, I cannot invest much for energy-saving initiatives.
� Electric energy of each device can be measured by installing one EcoMonitorLight.
1. Enable to data collected off-line to be saved to SD card using Logging Unit. 2. Enable con�rm energy-saving effect by comparing old and new performance when each device at factory is renewed. (Easy construction by segmented CT.) 3. System can be built gradually.
CompressorCompressor
Pressing machinePressing machine
Cutting machineCutting machine
Measuring devices using one EcoMonitorLightMeasure each facility for a certain period of time to check
power consumption
Introduce EcoMonitorLight for each facilityMeasure at all time to implement energy-saving
countermeasures for measured value
Step up to visualization of entire factory
StatusIntroduction schedule
1.
2.
3.
Problem Solution!
� What is the best way to monitor equipment insulation using Inverter or servo motors...
� Insulation deterioration is constantly monitored with the Insulation Monitoring Module.
Problem Solution!
Introduction point
Leakage current (Ioc) �ows continuously in aluminum electrolytic capacitor used in Inverter or servo when machine is being turned on. Only with leakage current (Io) is not enough to monitor Insulation correctly.
Points of introducing of QE82LG
EcoMonitorLightEcoMonitorLight
� Measuring point : Facility in factory� Customer’s requests:
I want to do simple measurement to watch the actual condition closely.I want to manage data by using SD card.
Measurement of Insulation deterioration can prevent sudden trouble and reduce production loss due to equipment stoppage by monitoring resistive-component leakage current (lor).
Off during lunch↓
Automatically off
Example of Energy Monitoring System
Exa
mp
le o
f Ene
rgy
Mon
itorin
g S
yste
m
26
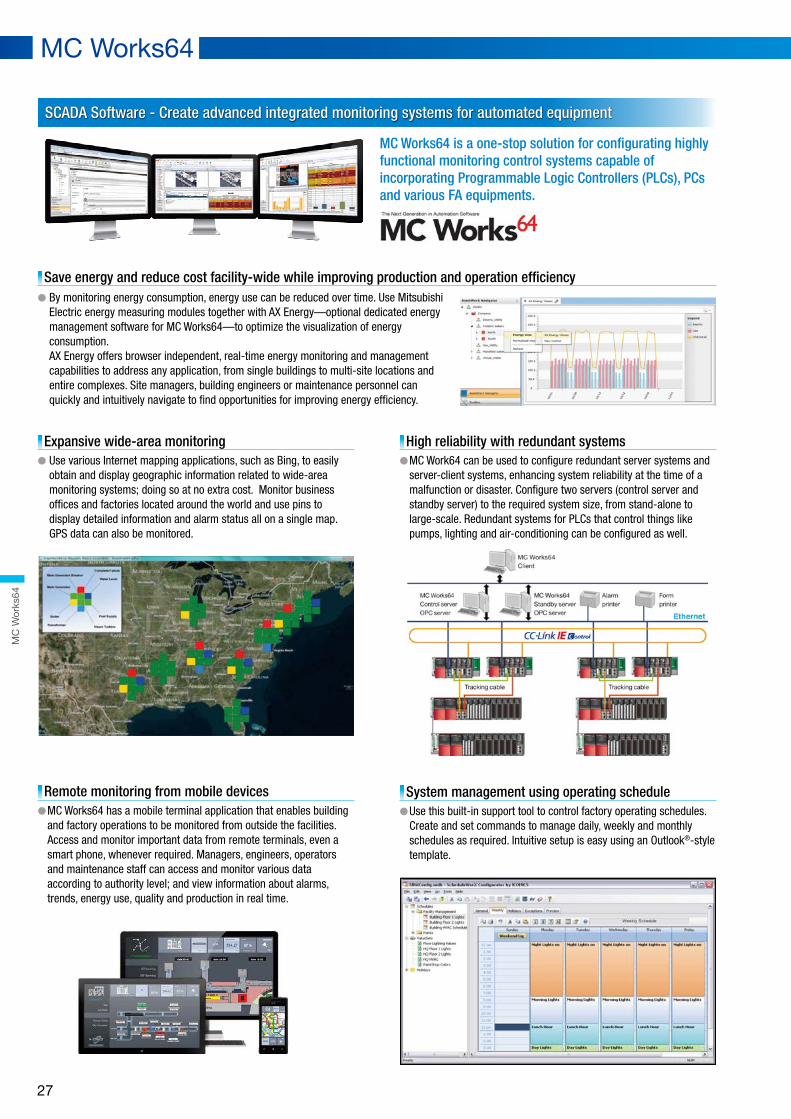
SCADA Software - Create advanced integrated monitoring systems for automated equipment
Building Energy Management
Factory Energy Management
Reducing engineering cost by Customizable symbol library.� A library with pre-made symbols comes as a standard feature, reducing the time required to create graphics. Custom symbols can also be created and
imported into the library. The library comes stocked with more than 1,000 high-de�nition 2D and 3D symbols covering a variety of industries including water treatment, building management, food, chemicals, and more. There is also an animation function and symbols can be tagged to change colors and display numbers, thereby reducing the labor for creating script.
Save energy and reduce cost facility-wide while improving production and operation efficiency� By monitoring energy consumption, energy use can be reduced over time. Use Mitsubishi
Electric energy measuring modules together with AX Energy—optional dedicated energy management software for MC Works64—to optimize the visualization of energy consumption.
AX Energy offers browser independent, real-time energy monitoring and management capabilities to address any application, from single buildings to multi-site locations and entire complexes. Site managers, building engineers or maintenance personnel can quickly and intuitively navigate to �nd opportunities for improving energy ef�ciency.
Used with EcoWebServer# and energy measuring modules, MC Works64 visualizes the energy used by systems throughout a building such as air-conditioning, lighting and gas and water supply. Combined with the optional visualization and diagnostics software AX Energy, energy consumption can be analyzed, points of waste documented and additional energy-saving measures introduced. MC Works64 also contributes to maintaining a comfortable indoor space by automatically switching between cooling and heating according to preset temperature and air-volume settings. Since air-conditioning systems consume a lot of energy—often more than 50% of the total energy used by a building—comfort can be sacrificed when pursuing energy savings. However, MC Works64 delivers energy savings while maintaining comfort through centrally managed air-conditioning control. Lighting system control is possible as well, such as scheduling ON/OFF times and using sensors to detect when people are present.
In addition to increasing factory production line efficiency, MC Works64 and FA equipments can control the temperature and airflow via centralized air-conditioning systems, and display the temperature and humidity, which are measured by sensors in each room. It can also monitor and analyze the operations of production machinery that consume large amounts of energy, and thus optimize production cost. Simply add the AX Energy software and Mitsubishi Electric energy measuring modules to create an energy-saving solution capable of advanced energy visualization, analysis and savings. A full lineup of energy-saving devices, such as Mitsubishi Electric inverters with superior motor-drive efficiency, are available to help realize greater energy savings from factory equipment.
Expansive wide-area monitoring� Use various Internet mapping applications, such as Bing, to easily
obtain and display geographic information related to wide-area monitoring systems; doing so at no extra cost. Monitor business of�ces and factories located around the world and use pins to display detailed information and alarm status all on a single map. GPS data can also be monitored.
High reliability with redundant systems� MC Work64 can be used to con�gure redundant server systems and
server-client systems, enhancing system reliability at the time of a malfunction or disaster. Con�gure two servers (control server and standby server) to the required system size, from stand-alone to large-scale. Redundant systems for PLCs that control things like pumps, lighting and air-conditioning can be con�gured as well.
Remote monitoring from mobile devices� MC Works64 has a mobile terminal application that enables building
and factory operations to be monitored from outside the facilities. Access and monitor important data from remote terminals, even a smart phone, whenever required. Managers, engineers, operators and maintenance staff can access and monitor various data according to authority level; and view information about alarms, trends, energy use, quality and production in real time.
System management using operating schedule� Use this built-in support tool to control factory operating schedules.
Create and set commands to manage daily, weekly and monthly schedules as required. Intuitive setup is easy using an Outlook®-style template.
MC Works64 is a one-stop solution for con�gurating highly functional monitoring control systems capable of incorporating Programmable Logic Controllers (PLCs), PCs and various FA equipments.
Light Controller Air Cond.Controller
Light Controller_symbol LightController_Faceplate
AirConditioningController_Symbol
AirConditioningController_Faceplate
CC-Link CC-Link
CC-Link
MC Works64
MC
Wor
ks64
27

SCADA Software - Create advanced integrated monitoring systems for automated equipment
Building Energy Management
Factory Energy Management
Reducing engineering cost by Customizable symbol library.� A library with pre-made symbols comes as a standard feature, reducing the time required to create graphics. Custom symbols can also be created and
imported into the library. The library comes stocked with more than 1,000 high-de�nition 2D and 3D symbols covering a variety of industries including water treatment, building management, food, chemicals, and more. There is also an animation function and symbols can be tagged to change colors and display numbers, thereby reducing the labor for creating script.
Save energy and reduce cost facility-wide while improving production and operation efficiency� By monitoring energy consumption, energy use can be reduced over time. Use Mitsubishi
Electric energy measuring modules together with AX Energy—optional dedicated energy management software for MC Works64—to optimize the visualization of energy consumption.
AX Energy offers browser independent, real-time energy monitoring and management capabilities to address any application, from single buildings to multi-site locations and entire complexes. Site managers, building engineers or maintenance personnel can quickly and intuitively navigate to �nd opportunities for improving energy ef�ciency.
Used with EcoWebServer# and energy measuring modules, MC Works64 visualizes the energy used by systems throughout a building such as air-conditioning, lighting and gas and water supply. Combined with the optional visualization and diagnostics software AX Energy, energy consumption can be analyzed, points of waste documented and additional energy-saving measures introduced. MC Works64 also contributes to maintaining a comfortable indoor space by automatically switching between cooling and heating according to preset temperature and air-volume settings. Since air-conditioning systems consume a lot of energy—often more than 50% of the total energy used by a building—comfort can be sacrificed when pursuing energy savings. However, MC Works64 delivers energy savings while maintaining comfort through centrally managed air-conditioning control. Lighting system control is possible as well, such as scheduling ON/OFF times and using sensors to detect when people are present.
In addition to increasing factory production line efficiency, MC Works64 and FA equipments can control the temperature and airflow via centralized air-conditioning systems, and display the temperature and humidity, which are measured by sensors in each room. It can also monitor and analyze the operations of production machinery that consume large amounts of energy, and thus optimize production cost. Simply add the AX Energy software and Mitsubishi Electric energy measuring modules to create an energy-saving solution capable of advanced energy visualization, analysis and savings. A full lineup of energy-saving devices, such as Mitsubishi Electric inverters with superior motor-drive efficiency, are available to help realize greater energy savings from factory equipment.
Expansive wide-area monitoring� Use various Internet mapping applications, such as Bing, to easily
obtain and display geographic information related to wide-area monitoring systems; doing so at no extra cost. Monitor business of�ces and factories located around the world and use pins to display detailed information and alarm status all on a single map. GPS data can also be monitored.
High reliability with redundant systems� MC Work64 can be used to con�gure redundant server systems and
server-client systems, enhancing system reliability at the time of a malfunction or disaster. Con�gure two servers (control server and standby server) to the required system size, from stand-alone to large-scale. Redundant systems for PLCs that control things like pumps, lighting and air-conditioning can be con�gured as well.
Remote monitoring from mobile devices� MC Works64 has a mobile terminal application that enables building
and factory operations to be monitored from outside the facilities. Access and monitor important data from remote terminals, even a smart phone, whenever required. Managers, engineers, operators and maintenance staff can access and monitor various data according to authority level; and view information about alarms, trends, energy use, quality and production in real time.
System management using operating schedule� Use this built-in support tool to control factory operating schedules.
Create and set commands to manage daily, weekly and monthly schedules as required. Intuitive setup is easy using an Outlook®-style template.
MC Works64 is a one-stop solution for con�gurating highly functional monitoring control systems capable of incorporating Programmable Logic Controllers (PLCs), PCs and various FA equipments.
Light Controller Air Cond.Controller
Light Controller_symbol LightController_Faceplate
AirConditioningController_Symbol
AirConditioningController_Faceplate
CC-Link CC-Link
CC-Link
MC Works64
MC
Wor
ks64
28

Enhanced Next-Generation Energy-Saving Inverter
∙ Energy saving∙ Functions ideal for fans and pumps∙ Security & safety∙ Compatibility with the environment∙ Easy setup & operation
�Model
1. Energy Saving with Inverters
2. FUNCTIONS IDEAL FOR FANS AND PUMPS
System cost reduction PID multiple loops (two loops)Two PID operation units are available in the inverter. The inverter can perform PID control of the motor operation and control the external equipment at the same time. The system cost can be reduced because no external PID controller is required for controlling the external equipment.
Cleaning of fans and pumpsCleaning functionForeign matter on the impellers or fans of pumps can be removed by repeating forward/reverse rotation and stopping of the motor. (Use this function when a back flush does not pose a problem.)This function can be also automatically started when the result of load characteristics measurement is out of range (overload).
Utilizing the motor capability to the fullOptimum excitation control� Optimum excitation control continuously adjusts the excitation current
to an optimum level to provide the highest motor efficiency. With a small load torque, a substantial energy saving can be achieved.
For example, at 4% motor load torque for a general-purpose motor, the motor efficiency under Optimum excitation control is about 30% higher than the motor efficiency under V/F control.
The consumed power of a variable-torque load, such as fans, pumps, and blowers, is proportional to the cube of its rotation speed.Adjusting the air volume by the inverter rotation speed control can lead to energy savings.
Measured value 2
Measured value 1
Manipulated amount 1
Manipulated amount 2
Motor
M
Pump
P
Detector
Detector Valve
PIDoperation
unit1
PIDoperation
unit 2
INVERTER FR-F800
Optimum excitation control
V/F control
[Compared to our conventional product]
20
40
60
120
Air volume (%)40 60 80 100
0
80
100Damper control
General-purposemotor (SF-PR)
driven by inverter
[Example of blower operation characteristic]
Cons
umed
pow
er (%
)*1
[Compared to our conventional product]
*1: Rated motor output is 100%.
20
40
60
80
100
0 20 40 60 80 100
Motor load factor [%](When the inverter running frequency is 60 Hz and the SF-PR 4P motor (15 kW) is used)
Mot
or e
ffici
ency
[%]
More energy saving
F R - F 8 2 0 - 0.75K - 1 -
*1: IP55 compatible models have LD and ND rating types only. However, the SLD rated current of standard models is used to represent the model.*2: For the CA-type, the monitor output terminal FM/CA operates as terminal CA (analog current output 0 to 20 mADC), not as terminal FM (pulse train output).*3: For the 75K or higher inverter, always connect a DC reactor (FR-HEL), which is available as an option. Select a DC reactor according to the applied motor capacity.*4: Always install the converter unit (FR-CC2). (Not required when a high power factor converter (FR-HC2) is used)*5: Available for the 7.5K or higher.*6: Applicable to the standard structure model or the separated converter type.
None60
06*4
Symbol Circuit board coating(IEC60721-3-3 3C2/3S2 compatible)
Platedconductor
WithoutWithWith
WithoutWithout
With
24
Symbol Voltage class
200 V class400 V class
026
Symbol Structure, functionality
Standard model*2
Separated converter type*3
IP55 compatible model 00023to 06830
Inverter SLD ratedcurrent (A)
Description
0.75Kto 560K
Inverter LD ratedcapacity (kW)
12E1E2
Symbol Type Communicationtype
FMCA*1
FMCA*1
RS-485
Ethernet
Symbol
FR-F820(-E)FR-F840(-E)FR-F842(-E)FR-F846(-E)
Inverter model Inverter capacity0.75kW to 110kW0.75kW to 315kW355kW to 560kW0.75kW to 160kW
YOUR SOLUTION PARTNER
Automation solutions
Mitsubishi Electric offers a wide range of automation equipment from PLCs and HMIs to CNC and EDM machines.
A NAME TO TRUSTSince its beginnings in 1870, some 45 companies use the Mitsubishi name, covering a spectrum of finance, commerce and industry.
The Mitsubishi brand name is recognized around the world as a symbol of premium quality.
Mitsubishi Electric Corporation is active in space development, transportation, semi-conductors, energy systems, communications and information processing, audio visual equipment and home electronics, building and energy management and automation systems, and has 237 factories and laboratories worldwide in over 121 countries.
This is why you can rely on Mitsubishi Electric automation solution - because we know first hand about the need for reliable, efficient, easy-to-use automation and control in our own factories.
As one of the world’s leading companies with a global turnover of over 4 trillion Yen (over $40 billion), employing over 100,000 people, Mitsubishi Electric has the resource and the commitment to deliver the ultimate in service and support as well as the best products.
Medium voltage: VCB, VCC
Power monitoring, energy management
Compact and Modular Controllers
Inverters, Servos and Motors
Visualisation: HMIs
Numerical Control (NC)
Robots: SCARA, Articulated arm
Processing machines: EDM, Lasers, IDS
Transformers, Air conditioning, Photovoltaic systems
Low voltage: MCCB, MCB, ACB
* Not all products are available in all countries.
INV
ER
TER
FR
-F80
0
29

Enhanced Next-Generation Energy-Saving Inverter
∙ Energy saving∙ Functions ideal for fans and pumps∙ Security & safety∙ Compatibility with the environment∙ Easy setup & operation
�Model
1. Energy Saving with Inverters
2. FUNCTIONS IDEAL FOR FANS AND PUMPS
System cost reduction PID multiple loops (two loops)Two PID operation units are available in the inverter. The inverter can perform PID control of the motor operation and control the external equipment at the same time. The system cost can be reduced because no external PID controller is required for controlling the external equipment.
Cleaning of fans and pumpsCleaning functionForeign matter on the impellers or fans of pumps can be removed by repeating forward/reverse rotation and stopping of the motor. (Use this function when a back flush does not pose a problem.)This function can be also automatically started when the result of load characteristics measurement is out of range (overload).
Utilizing the motor capability to the fullOptimum excitation control� Optimum excitation control continuously adjusts the excitation current
to an optimum level to provide the highest motor efficiency. With a small load torque, a substantial energy saving can be achieved.
For example, at 4% motor load torque for a general-purpose motor, the motor efficiency under Optimum excitation control is about 30% higher than the motor efficiency under V/F control.
The consumed power of a variable-torque load, such as fans, pumps, and blowers, is proportional to the cube of its rotation speed.Adjusting the air volume by the inverter rotation speed control can lead to energy savings.
Measured value 2
Measured value 1
Manipulated amount 1
Manipulated amount 2
Motor
M
Pump
P
Detector
Detector Valve
PIDoperation
unit1
PIDoperation
unit 2
INVERTER FR-F800
Optimum excitation control
V/F control
[Compared to our conventional product]
20
40
60
120
Air volume (%)40 60 80 100
0
80
100Damper control
General-purposemotor (SF-PR)
driven by inverter
[Example of blower operation characteristic]
Cons
umed
pow
er (%
)*1
[Compared to our conventional product]
*1: Rated motor output is 100%.
20
40
60
80
100
0 20 40 60 80 100
Motor load factor [%](When the inverter running frequency is 60 Hz and the SF-PR 4P motor (15 kW) is used)
Mot
or e
ffici
ency
[%]
More energy saving
F R - F 8 2 0 - 0.75K - 1 -
*1: IP55 compatible models have LD and ND rating types only. However, the SLD rated current of standard models is used to represent the model.*2: For the CA-type, the monitor output terminal FM/CA operates as terminal CA (analog current output 0 to 20 mADC), not as terminal FM (pulse train output).*3: For the 75K or higher inverter, always connect a DC reactor (FR-HEL), which is available as an option. Select a DC reactor according to the applied motor capacity.*4: Always install the converter unit (FR-CC2). (Not required when a high power factor converter (FR-HC2) is used)*5: Available for the 7.5K or higher.*6: Applicable to the standard structure model or the separated converter type.
None60
06*4
Symbol Circuit board coating(IEC60721-3-3 3C2/3S2 compatible)
Platedconductor
WithoutWithWith
WithoutWithout
With
24
Symbol Voltage class
200 V class400 V class
026
Symbol Structure, functionality
Standard model*2
Separated converter type*3
IP55 compatible model 00023to 06830
Inverter SLD ratedcurrent (A)
Description
0.75Kto 560K
Inverter LD ratedcapacity (kW)
12E1E2
Symbol Type Communicationtype
FMCA*1
FMCA*1
RS-485
Ethernet
Symbol
FR-F820(-E)FR-F840(-E)FR-F842(-E)FR-F846(-E)
Inverter model Inverter capacity0.75kW to 110kW0.75kW to 315kW355kW to 560kW0.75kW to 160kW
YOUR SOLUTION PARTNER
Automation solutions
Mitsubishi Electric offers a wide range of automation equipment from PLCs and HMIs to CNC and EDM machines.
A NAME TO TRUSTSince its beginnings in 1870, some 45 companies use the Mitsubishi name, covering a spectrum of finance, commerce and industry.
The Mitsubishi brand name is recognized around the world as a symbol of premium quality.
Mitsubishi Electric Corporation is active in space development, transportation, semi-conductors, energy systems, communications and information processing, audio visual equipment and home electronics, building and energy management and automation systems, and has 237 factories and laboratories worldwide in over 121 countries.
This is why you can rely on Mitsubishi Electric automation solution - because we know first hand about the need for reliable, efficient, easy-to-use automation and control in our own factories.
As one of the world’s leading companies with a global turnover of over 4 trillion Yen (over $40 billion), employing over 100,000 people, Mitsubishi Electric has the resource and the commitment to deliver the ultimate in service and support as well as the best products.
Medium voltage: VCB, VCC
Power monitoring, energy management
Compact and Modular Controllers
Inverters, Servos and Motors
Visualisation: HMIs
Numerical Control (NC)
Robots: SCARA, Articulated arm
Processing machines: EDM, Lasers, IDS
Transformers, Air conditioning, Photovoltaic systems
Low voltage: MCCB, MCB, ACB
* Not all products are available in all countries.
30

ENERGY-SAVING SUPPORTING DEVICES
Global Partner. Local Friend.
AdvancedEnergy-saving Solution
FACTORY AUTOMATION
Y-0766B All trademarks acknowledged.Printed Mar. 2020
HEAD OFFICE: TOKYO BLDG., 2-7-3 MARUNOUCHI,CHIYODA-KU, TOKYO 100-8310, JAPAN
For Safety : Please read the instruction manual carefully before using the products in this catalog. Wiring and connection must be done by the person who has specialized knowledge of electric construction and wirings.
●Trademarks• Of this product, export (or service trade) permission under this law is required for exports that fall under the safety and trade control related cargo (or service) specified in the Foreign Exchange and Foreign Trade Control Law. • Windows® is registered trademark in the U.S. of U.S. Microsoft Corporation, and other countries.• MODBUS is a registered trademark of Schneider USA Inc.• Other company names and product names in this document are trademarks or registered trademarks of their respective owners.
• Please consult with a Mitsubishi Electric representative when considering the application of products presented in this catalogue with machinery or systems designed for specialized use such as nuclear power, electrical power, aerospace/outer space, medical, or passenger transportation vehicles.• Mitsubishi Electric Corporation shall not be liable, to the customer or equipment user, for: 1) Any damege found not to be attributable to a Mitsubishi Electric product. 2) The loss of opportunity or profits for the customer or user caused by any fault in a Mitsubishi Electric product. 3) Damege, secondary damege or accident compensation resulting from special factors regardless of whether or not such factors could be predicted by Mitsubishi Electric. 4) Damege to products of other companies and/or guarantees relating to other services.
Precautions Before Use