Embed Size (px)
Citation preview
62
Energy,PoweringYour World
64
PREFACE
This booklet is part of the ‘Couldn’t be withoutit!’ educational project from EIROFORUM, a Eu-ropean initiative to bring information from Eu-rope’s top research institutes to schools and uni-versities. ‘Couldn’t be without it!’ aims at explain-ing the relationship between research and technol-ogies which school students consider they can’t dowithout, like computers, mobile phones, stereoinstallations, etc.
‘Energy: powering your world’ focuses on energy. En-ergy in our daily lives, the ways we use it, where itcomes from, and how we will deal with our ener-gy needs in the future. The future of energy startstoday: important decisions need to be taken, andmuch research has to be done to guarantee ourenergy supply in the years to come, and to limitthe damage done to the environment and ourhealth. This booklet presents several aspects relat-ed to energy. The aim has been to supply teachersof 15-18 old students with material useful to themin their teaching.
All chapters include boxes which highlight detailedinformation, conclusions at the end of each chap-ter, exercises for the students and lists of web siteswhere more information about a particular sub-ject is available. All web links are selected for theireducational qualities and contain either informa-tion useful for school students or provide furtherinformation for teachers.
The complete booklet can be downloaded from:info.web.cern.ch/info/scitech/Schools/tools.htmlincluding translations in French, German, and Ital-ian from September 25, 2002, onwards. Almostall web sites used in this booklet are in the Englishlanguage. The material in this booklet may be cop-ied for non-commercial educational use in schools,as long as text, illustrations and photographs arefully credited.
We would like to thank Chris Warrick, Jennifer Hayand Niek Lopes Cardozo for helpful comments.We hope that this booklet provides the reader withuseful educational information about the dynamicworld of energy. The authors and the contribu-tors warmly welcome any suggestions or com-ments leading to the improvement of this book-let.
The authors:Mark-Tiele Westra (FOM), [email protected] Kuyvenhoven (FOM), [email protected]
And with the contribution of:F. Casci (EFDA), [email protected]. Tosato (EFDA), [email protected]
Energy, Powering Your WorldProduced for: EFDAProduced by: FOM - institute for Plasma physics
Rijnhuizen, the Netherlands.Copyright © 2002, FOM - RijnhuizenAuthors: M.T. Westra, S. KuyvenhovenIllustrations: M.T. WestraLay-out: M.T. WestraPrinting: Drukkerij Anraad Nieuwegein BV
Cover picture: Earth’s city lights at night. The pic-ture was composed from photos made by satallites.Courtesy NASA
1
1) An introduction to energy ......................................................................................................2What is energy and why do we need it? .....................................................................................................3Where does it come from? ...........................................................................................................................3
2) A short history of energy .......................................................................................................4Ancient times ..................................................................................................................................................4Energy in the 1600’s.......................................................................................................................................5Energy in the 1700’s.......................................................................................................................................5Energy in the 1800’s: the age of the steam engine ...................................................................................6Energy in the 1900’s: the age of the combustion engine ........................................................................7Modern times ..................................................................................................................................................8
3) The energy we use ............................................................................................................... 12How to measure energy ............................................................................................................................. 14Power ............................................................................................................................................................. 15Energy in your home .................................................................................................................................. 16How much energy do you use? ................................................................................................................. 17Primary energy use ...................................................................................................................................... 19Using energy efficiently.............................................................................................................................. 21
4) The sources of energy ......................................................................................................... 24Energy from fossil fuels ............................................................................................................................. 24How we use fossil fuels .............................................................................................................................. 25Nuclear fission ............................................................................................................................................. 29Fusion energy............................................................................................................................................... 31Hydro Power ................................................................................................................................................ 33Energy from the ocean: wave energy and tidal energy ......................................................................... 34Energy from the sun ................................................................................................................................... 35Energy from the wind ................................................................................................................................ 37Energy from biomass ................................................................................................................................. 38Geothermal energy ..................................................................................................................................... 39
5) Energy, the environment, and health .................................................................................. 42The household level .................................................................................................................................... 42The community level .................................................................................................................................. 44The regional level ........................................................................................................................................ 44The global level ............................................................................................................................................ 45Energy options and the greenhouse effect ............................................................................................. 48
6) Thinking ahead: the energy of tomorrow .......................................................................... 50How to choose an energy source ............................................................................................................. 51Sustainable energy ....................................................................................................................................... 53Let’s go renewable? ..................................................................................................................................... 54Present research for future energy options ............................................................................................ 54The future energy mix ................................................................................................................................ 57The energy carrier of the future: hydrogen? .......................................................................................... 58Conclusion .................................................................................................................................................... 59
TABLE OF CONTENTS
2
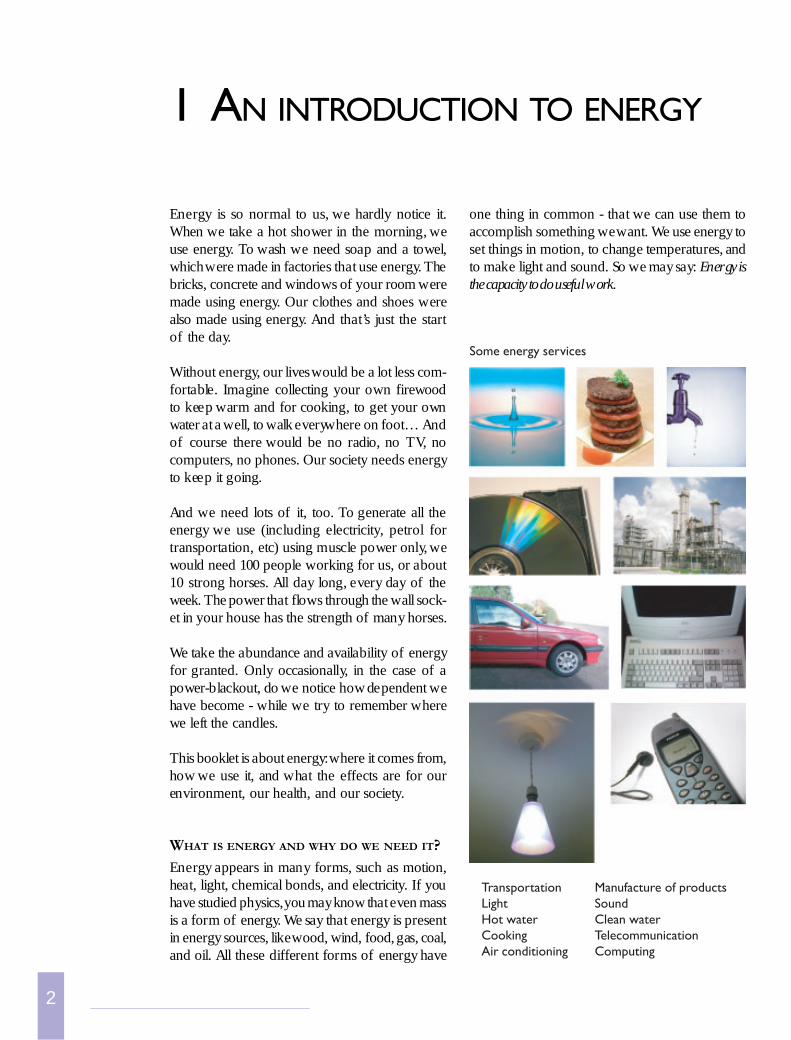
one thing in common - that we can use them toaccomplish something we want. We use energy toset things in motion, to change temperatures, andto make light and sound. So we may say: Energy isthe capacity to do useful work.
Energy is so normal to us, we hardly notice it.When we take a hot shower in the morning, weuse energy. To wash we need soap and a towel,which were made in factories that use energy. Thebricks, concrete and windows of your room weremade using energy. Our clothes and shoes werealso made using energy. And that’s just the startof the day.
Without energy, our lives would be a lot less com-fortable. Imagine collecting your own firewoodto keep warm and for cooking, to get your ownwater at a well, to walk everywhere on foot… Andof course there would be no radio, no TV, nocomputers, no phones. Our society needs energyto keep it going.
And we need lots of it, too. To generate all theenergy we use (including electricity, petrol fortransportation, etc) using muscle power only, wewould need 100 people working for us, or about10 strong horses. All day long, every day of theweek. The power that flows through the wall sock-et in your house has the strength of many horses.
We take the abundance and availability of energyfor granted. Only occasionally, in the case of apower-blackout, do we notice how dependent wehave become - while we try to remember wherewe left the candles.
This booklet is about energy: where it comes from,how we use it, and what the effects are for ourenvironment, our health, and our society.
WHAT IS ENERGY AND WHY DO WE NEED IT?
Energy appears in many forms, such as motion,heat, light, chemical bonds, and electricity. If youhave studied physics, you may know that even massis a form of energy. We say that energy is presentin energy sources, like wood, wind, food, gas, coal,and oil. All these different forms of energy have
1 AN INTRODUCTION TO ENERGY
Transportation Manufacture of productsLight SoundHot water Clean waterCooking TelecommunicationAir conditioning Computing
Some energy services
3
coalmine
transportation powerplant
distribution
News
Today!
energy service: the tv
Trans-formation
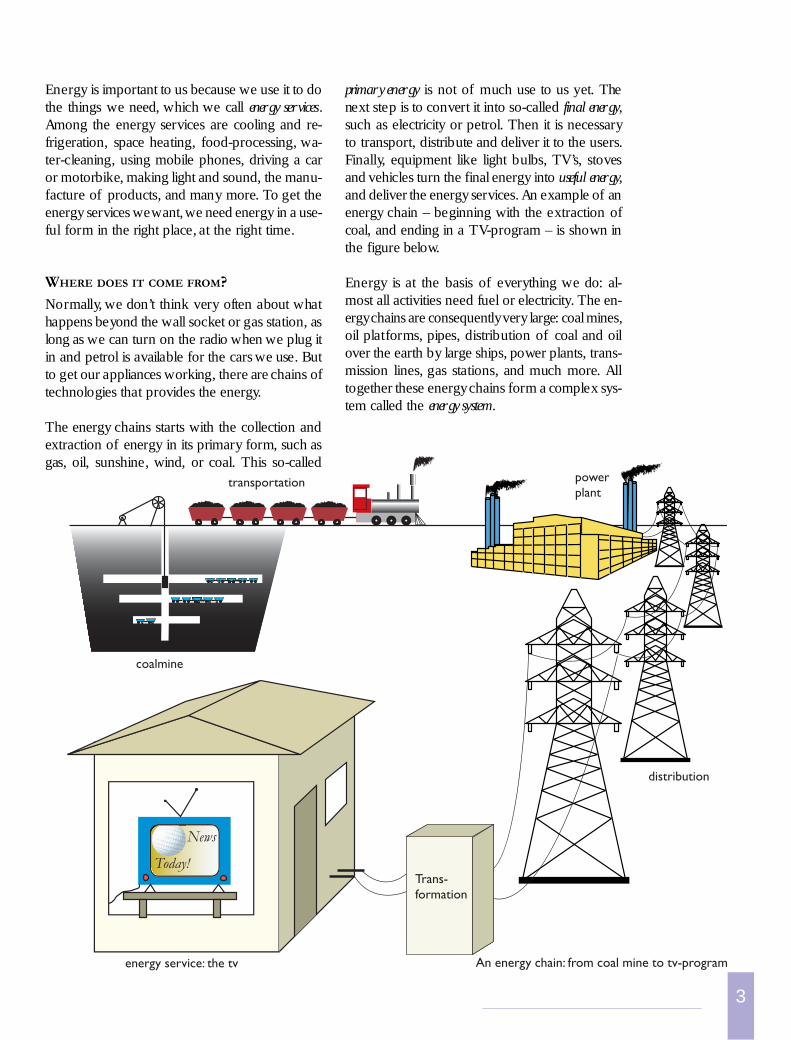
Energy is important to us because we use it to dothe things we need, which we call energy services.Among the energy services are cooling and re-frigeration, space heating, food-processing, wa-ter-cleaning, using mobile phones, driving a caror motorbike, making light and sound, the manu-facture of products, and many more. To get theenergy services we want, we need energy in a use-ful form in the right place, at the right time.
WHERE DOES IT COME FROM?
Normally, we don’t think very often about whathappens beyond the wall socket or gas station, aslong as we can turn on the radio when we plug itin and petrol is available for the cars we use. Butto get our appliances working, there are chains oftechnologies that provides the energy.
The energy chains starts with the collection andextraction of energy in its primary form, such asgas, oil, sunshine, wind, or coal. This so-called
primary energy is not of much use to us yet. Thenext step is to convert it into so-called final energy,such as electricity or petrol. Then it is necessaryto transport, distribute and deliver it to the users.Finally, equipment like light bulbs, TV’s, stovesand vehicles turn the final energy into useful energy,and deliver the energy services. An example of anenergy chain – beginning with the extraction ofcoal, and ending in a TV-program – is shown inthe figure below.
Energy is at the basis of everything we do: al-most all activities need fuel or electricity. The en-ergy chains are consequently very large: coal mines,oil platforms, pipes, distribution of coal and oilover the earth by large ships, power plants, trans-mission lines, gas stations, and much more. Alltogether these energy chains form a complex sys-tem called the energy system.
An energy chain: from coal mine to tv-program
4
settle down. They learned about agriculture, whichis a way of turning the energy from the sun di-rectly into food.
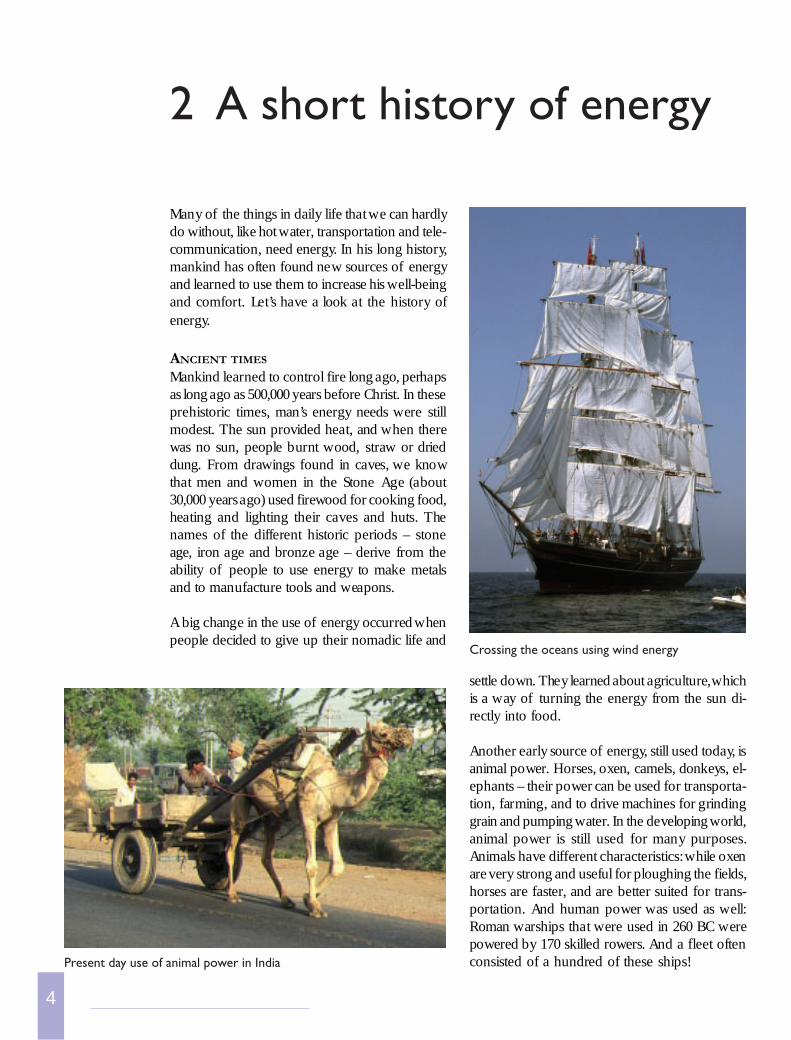
Another early source of energy, still used today, isanimal power. Horses, oxen, camels, donkeys, el-ephants – their power can be used for transporta-tion, farming, and to drive machines for grindinggrain and pumping water. In the developing world,animal power is still used for many purposes.Animals have different characteristics: while oxenare very strong and useful for ploughing the fields,horses are faster, and are better suited for trans-portation. And human power was used as well:Roman warships that were used in 260 BC werepowered by 170 skilled rowers. And a fleet oftenconsisted of a hundred of these ships!
Many of the things in daily life that we can hardlydo without, like hot water, transportation and tele-communication, need energy. In his long history,mankind has often found new sources of energyand learned to use them to increase his well-beingand comfort. Let’s have a look at the history ofenergy.
ANCIENT TIMES
Mankind learned to control fire long ago, perhapsas long ago as 500,000 years before Christ. In theseprehistoric times, man’s energy needs were stillmodest. The sun provided heat, and when therewas no sun, people burnt wood, straw or drieddung. From drawings found in caves, we knowthat men and women in the Stone Age (about30,000 years ago) used firewood for cooking food,heating and lighting their caves and huts. Thenames of the different historic periods – stoneage, iron age and bronze age – derive from theability of people to use energy to make metalsand to manufacture tools and weapons.
A big change in the use of energy occurred whenpeople decided to give up their nomadic life and
2 A short history of energy
Present day use of animal power in India
Crossing the oceans using wind energy
5
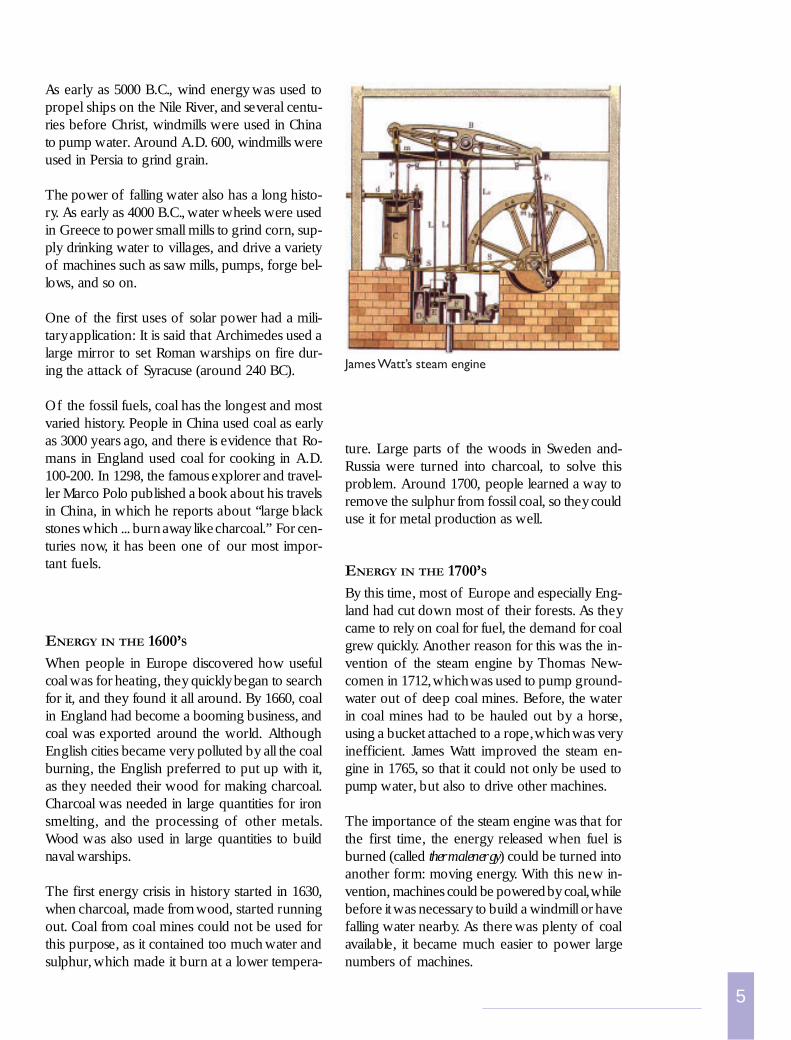
As early as 5000 B.C., wind energy was used topropel ships on the Nile River, and several centu-ries before Christ, windmills were used in Chinato pump water. Around A.D. 600, windmills wereused in Persia to grind grain.
The power of falling water also has a long histo-ry. As early as 4000 B.C., water wheels were usedin Greece to power small mills to grind corn, sup-ply drinking water to villages, and drive a varietyof machines such as saw mills, pumps, forge bel-lows, and so on.
One of the first uses of solar power had a mili-tary application: It is said that Archimedes used alarge mirror to set Roman warships on fire dur-ing the attack of Syracuse (around 240 BC).
Of the fossil fuels, coal has the longest and mostvaried history. People in China used coal as earlyas 3000 years ago, and there is evidence that Ro-mans in England used coal for cooking in A.D.100-200. In 1298, the famous explorer and travel-ler Marco Polo published a book about his travelsin China, in which he reports about “large blackstones which ... burn away like charcoal.” For cen-turies now, it has been one of our most impor-tant fuels.
ture. Large parts of the woods in Sweden and-Russia were turned into charcoal, to solve thisproblem. Around 1700, people learned a way toremove the sulphur from fossil coal, so they coulduse it for metal production as well.
ENERGY IN THE 1700’S
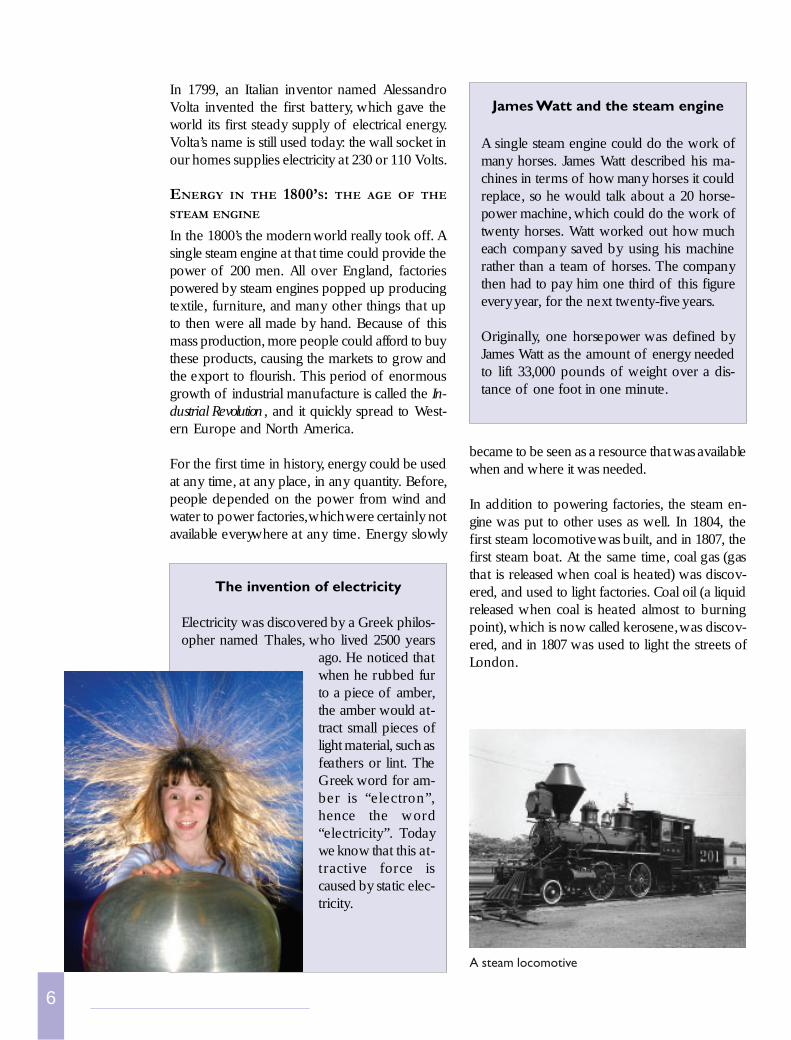
By this time, most of Europe and especially Eng-land had cut down most of their forests. As theycame to rely on coal for fuel, the demand for coalgrew quickly. Another reason for this was the in-vention of the steam engine by Thomas New-comen in 1712, which was used to pump ground-water out of deep coal mines. Before, the waterin coal mines had to be hauled out by a horse,using a bucket attached to a rope, which was veryinefficient. James Watt improved the steam en-gine in 1765, so that it could not only be used topump water, but also to drive other machines.
The importance of the steam engine was that forthe first time, the energy released when fuel isburned (called thermal energy) could be turned intoanother form: moving energy. With this new in-vention, machines could be powered by coal, whilebefore it was necessary to build a windmill or havefalling water nearby. As there was plenty of coalavailable, it became much easier to power largenumbers of machines.
James Watt’s steam engine
ENERGY IN THE 1600’S
When people in Europe discovered how usefulcoal was for heating, they quickly began to searchfor it, and they found it all around. By 1660, coalin England had become a booming business, andcoal was exported around the world. AlthoughEnglish cities became very polluted by all the coalburning, the English preferred to put up with it,as they needed their wood for making charcoal.Charcoal was needed in large quantities for ironsmelting, and the processing of other metals.Wood was also used in large quantities to buildnaval warships.
The first energy crisis in history started in 1630,when charcoal, made from wood, started runningout. Coal from coal mines could not be used forthis purpose, as it contained too much water andsulphur, which made it burn at a lower tempera-
6
became to be seen as a resource that was availablewhen and where it was needed.
In addition to powering factories, the steam en-gine was put to other uses as well. In 1804, thefirst steam locomotive was built, and in 1807, thefirst steam boat. At the same time, coal gas (gasthat is released when coal is heated) was discov-ered, and used to light factories. Coal oil (a liquidreleased when coal is heated almost to burningpoint), which is now called kerosene, was discov-ered, and in 1807 was used to light the streets ofLondon.
In 1799, an Italian inventor named AlessandroVolta invented the first battery, which gave theworld its first steady supply of electrical energy.Volta’s name is still used today: the wall socket inour homes supplies electricity at 230 or 110 Volts.
ENERGY IN THE 1800’S: THE AGE OF THE
STEAM ENGINE
In the 1800’s the modern world really took off. Asingle steam engine at that time could provide thepower of 200 men. All over England, factoriespowered by steam engines popped up producingtextile, furniture, and many other things that upto then were all made by hand. Because of thismass production, more people could afford to buythese products, causing the markets to grow andthe export to flourish. This period of enormousgrowth of industrial manufacture is called the In-dustrial Revolution, and it quickly spread to West-ern Europe and North America.
For the first time in history, energy could be usedat any time, at any place, in any quantity. Before,people depended on the power from wind andwater to power factories, which were certainly notavailable everywhere at any time. Energy slowly
A steam locomotive
James Watt and the steam engine
A single steam engine could do the work ofmany horses. James Watt described his ma-chines in terms of how many horses it couldreplace, so he would talk about a 20 horse-power machine, which could do the work oftwenty horses. Watt worked out how mucheach company saved by using his machinerather than a team of horses. The companythen had to pay him one third of this figureevery year, for the next twenty-five years.
Originally, one horsepower was defined byJames Watt as the amount of energy neededto lift 33,000 pounds of weight over a dis-tance of one foot in one minute.
The invention of electricity
Electricity was discovered by a Greek philos-opher named Thales, who lived 2500 years
ago. He noticed thatwhen he rubbed furto a piece of amber,the amber would at-tract small pieces oflight material, such asfeathers or lint. TheGreek word for am-ber is “electron”,hence the word“electricity”. Todaywe know that this at-tractive force iscaused by static elec-tricity.
7
usefulness for heating and lighting. Before long,people learnt how to refine oil to make petrol anddiesel oil, which were used to power a new inven-tion: the combustion engine.
ENERGY IN THE 1900’S: THE AGE OF THE COM-BUSTION ENGINE
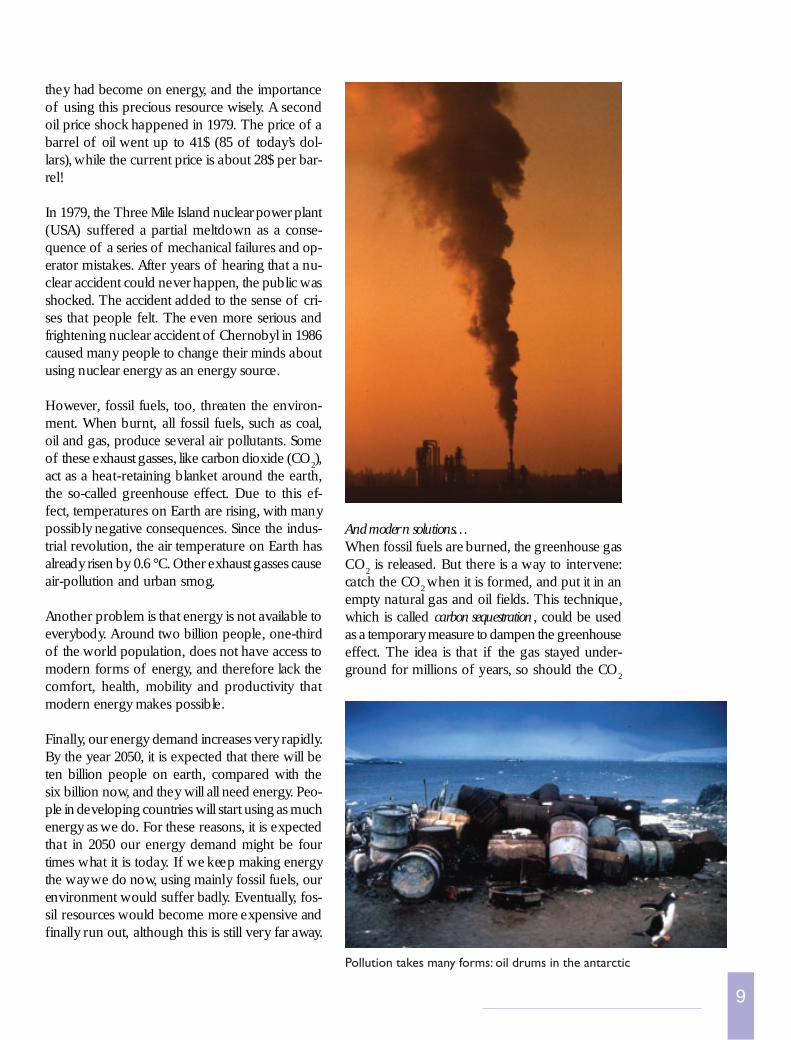
With the new fuel petrol available, the French in-ventor Etienne Lenoir invented the first practical“internal combustion engine” which uses burn-ing petrol to drive a piston in the engine. The Ger-man inventor Nikolaus August Otto made a bet-ter one 16 years later. In 1885, the German engi-neer Benz took Otto’s engine, attached wheels toit, and created the first automobile (although itonly had three wheels). The next year, The Ger-man engineer Daimler built a four-wheel automo-
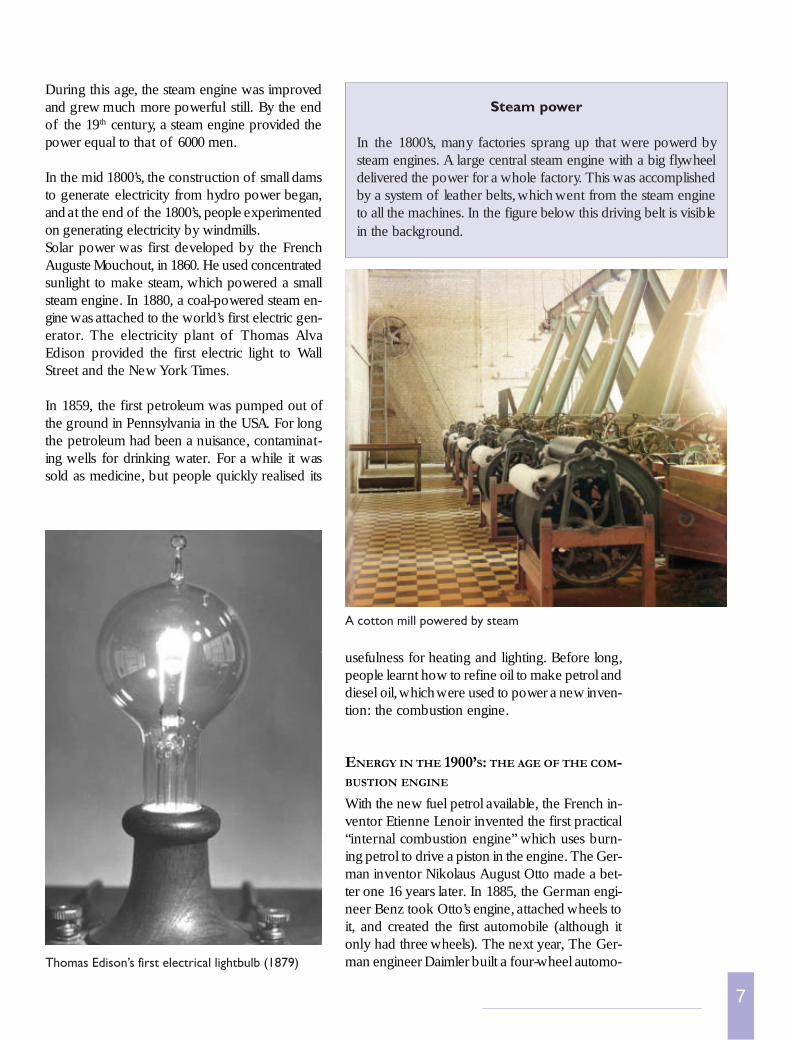
A cotton mill powered by steam
Steam power
In the 1800’s, many factories sprang up that were powerd bysteam engines. A large central steam engine with a big flywheeldelivered the power for a whole factory. This was accomplishedby a system of leather belts, which went from the steam engineto all the machines. In the figure below this driving belt is visiblein the background.
During this age, the steam engine was improvedand grew much more powerful still. By the endof the 19th century, a steam engine provided thepower equal to that of 6000 men.
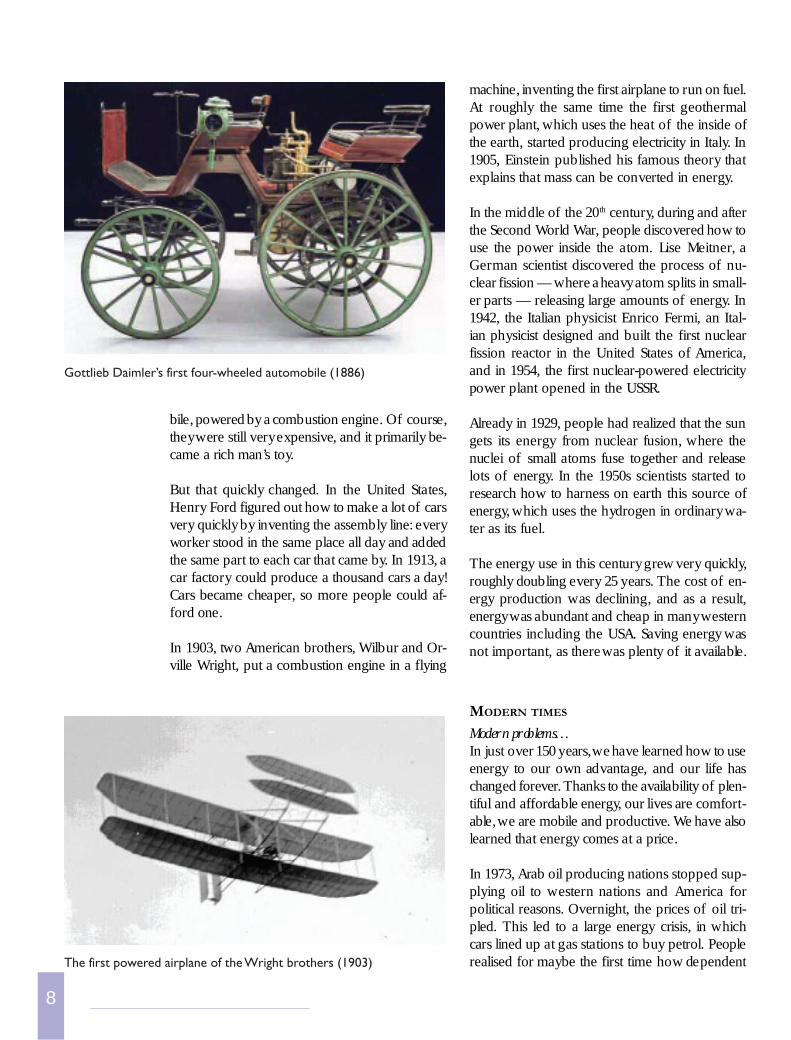
In the mid 1800’s, the construction of small damsto generate electricity from hydro power began,and at the end of the 1800’s, people experimentedon generating electricity by windmills.Solar power was first developed by the FrenchAuguste Mouchout, in 1860. He used concentratedsunlight to make steam, which powered a smallsteam engine. In 1880, a coal-powered steam en-gine was attached to the world’s first electric gen-erator. The electricity plant of Thomas AlvaEdison provided the first electric light to WallStreet and the New York Times.
In 1859, the first petroleum was pumped out ofthe ground in Pennsylvania in the USA. For longthe petroleum had been a nuisance, contaminat-ing wells for drinking water. For a while it wassold as medicine, but people quickly realised its
Thomas Edison’s first electrical lightbulb (1879)
8
machine, inventing the first airplane to run on fuel.At roughly the same time the first geothermalpower plant, which uses the heat of the inside ofthe earth, started producing electricity in Italy. In1905, Einstein published his famous theory thatexplains that mass can be converted in energy.
In the middle of the 20th century, during and afterthe Second World War, people discovered how touse the power inside the atom. Lise Meitner, aGerman scientist discovered the process of nu-clear fission — where a heavy atom splits in small-er parts — releasing large amounts of energy. In1942, the Italian physicist Enrico Fermi, an Ital-ian physicist designed and built the first nuclearfission reactor in the United States of America,and in 1954, the first nuclear-powered electricitypower plant opened in the USSR.
Already in 1929, people had realized that the sungets its energy from nuclear fusion, where thenuclei of small atoms fuse together and releaselots of energy. In the 1950s scientists started toresearch how to harness on earth this source ofenergy, which uses the hydrogen in ordinary wa-ter as its fuel.
The energy use in this century grew very quickly,roughly doubling every 25 years. The cost of en-ergy production was declining, and as a result,energy was abundant and cheap in many westerncountries including the USA. Saving energy wasnot important, as there was plenty of it available.
bile, powered by a combustion engine. Of course,they were still very expensive, and it primarily be-came a rich man’s toy.
But that quickly changed. In the United States,Henry Ford figured out how to make a lot of carsvery quickly by inventing the assembly line: everyworker stood in the same place all day and addedthe same part to each car that came by. In 1913, acar factory could produce a thousand cars a day!Cars became cheaper, so more people could af-ford one.
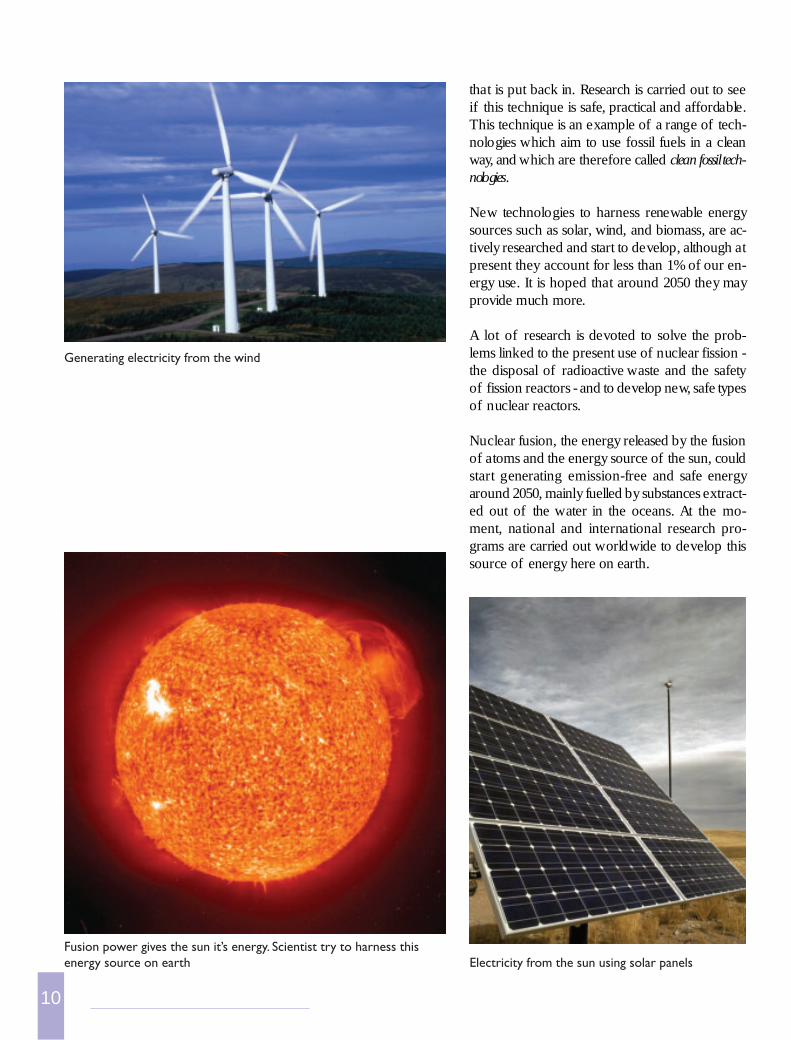
In 1903, two American brothers, Wilbur and Or-ville Wright, put a combustion engine in a flying
The first powered airplane of the Wright brothers (1903)
Gottlieb Daimler’s first four-wheeled automobile (1886)
MODERN TIMES
Modern problems…In just over 150 years, we have learned how to useenergy to our own advantage, and our life haschanged forever. Thanks to the availability of plen-tiful and affordable energy, our lives are comfort-able, we are mobile and productive. We have alsolearned that energy comes at a price.
In 1973, Arab oil producing nations stopped sup-plying oil to western nations and America forpolitical reasons. Overnight, the prices of oil tri-pled. This led to a large energy crisis, in whichcars lined up at gas stations to buy petrol. Peoplerealised for maybe the first time how dependent
9
they had become on energy, and the importanceof using this precious resource wisely. A secondoil price shock happened in 1979. The price of abarrel of oil went up to 41$ (85 of today’s dol-lars), while the current price is about 28$ per bar-rel!
In 1979, the Three Mile Island nuclear power plant(USA) suffered a partial meltdown as a conse-quence of a series of mechanical failures and op-erator mistakes. After years of hearing that a nu-clear accident could never happen, the public wasshocked. The accident added to the sense of cri-ses that people felt. The even more serious andfrightening nuclear accident of Chernobyl in 1986caused many people to change their minds aboutusing nuclear energy as an energy source.
However, fossil fuels, too, threaten the environ-ment. When burnt, all fossil fuels, such as coal,oil and gas, produce several air pollutants. Someof these exhaust gasses, like carbon dioxide (CO
2),
act as a heat-retaining blanket around the earth,the so-called greenhouse effect. Due to this ef-fect, temperatures on Earth are rising, with manypossibly negative consequences. Since the indus-trial revolution, the air temperature on Earth hasalready risen by 0.6 °C. Other exhaust gasses causeair-pollution and urban smog.
Another problem is that energy is not available toeverybody. Around two billion people, one-thirdof the world population, does not have access tomodern forms of energy, and therefore lack thecomfort, health, mobility and productivity thatmodern energy makes possible.
Finally, our energy demand increases very rapidly.By the year 2050, it is expected that there will beten billion people on earth, compared with thesix billion now, and they will all need energy. Peo-ple in developing countries will start using as muchenergy as we do. For these reasons, it is expectedthat in 2050 our energy demand might be fourtimes what it is today. If we keep making energythe way we do now, using mainly fossil fuels, ourenvironment would suffer badly. Eventually, fos-sil resources would become more expensive andfinally run out, although this is still very far away.
Pollution takes many forms: oil drums in the antarctic
And modern solutions…When fossil fuels are burned, the greenhouse gasCO
2 is released. But there is a way to intervene:
catch the CO2 when it is formed, and put it in an
empty natural gas and oil fields. This technique,which is called carbon sequestration, could be usedas a temporary measure to dampen the greenhouseeffect. The idea is that if the gas stayed under-ground for millions of years, so should the CO
2
10
Generating electricity from the wind
that is put back in. Research is carried out to seeif this technique is safe, practical and affordable.This technique is an example of a range of tech-nologies which aim to use fossil fuels in a cleanway, and which are therefore called clean fossil tech-nologies.
New technologies to harness renewable energysources such as solar, wind, and biomass, are ac-tively researched and start to develop, although atpresent they account for less than 1% of our en-ergy use. It is hoped that around 2050 they mayprovide much more.
A lot of research is devoted to solve the prob-lems linked to the present use of nuclear fission -the disposal of radioactive waste and the safetyof fission reactors - and to develop new, safe typesof nuclear reactors.
Nuclear fusion, the energy released by the fusionof atoms and the energy source of the sun, couldstart generating emission-free and safe energyaround 2050, mainly fuelled by substances extract-ed out of the water in the oceans. At the mo-ment, national and international research pro-grams are carried out worldwide to develop thissource of energy here on earth.
Electricity from the sun using solar panelsFusion power gives the sun it’s energy. Scientist try to harness thisenergy source on earth
11
Summary
• Energy has been used since the earliest history: from 500,000 BC until today.
• Large-scale use of charcoal and coal started already in the 1600’s.
• The invention of the steam engine in the 1700’s introduced a revolution: for the first timethermal energy could be converted into motion.
• In the 1800’s, the steam engine started the Industrial Revolution. It was also the century inwhich electricity was discovered.
• The 1900’s introduced the era of the combustion engine, mass production, airplanes andnuclear energy.
• Since the 1970’s people have become aware of how much the modern world depends onenergy, and that using energy has environmental consequences. As a consequence, renewa-ble sources are now being developed.
On the Web
>>>
www.energy.ca.gov/m+pco/history.html
Gives a timeline of mayor energyinventions.
www.eia.doe.gov/kids/milestones/
Milestones in the history of energy.
library.thinkquest.org/20331/his-tory/
History of energy and much more.Pages developed by students.
www.energyquest.ca.gov/story/
General site on energy made bystudents.
<<<
12
shower. We use cold fridges and freezers to pre-vent our food from decaying, and to make colddrinks. In industry, heating and cooling are usedfor many processes as well.
What type of energy do we use for heating andcooling? For heating spaces, water and food, wenormally burn gas, oil or coal in some type ofburner. Burners take many shapes: from the ovenin the kitchen to huge gas-fired kettles that pro-vide heat for large buildings.
Heating can also be carried out with electricity.Think for example of a water heater and an elec-trical oven. However, this is normally much moreexpensive than using fossil fuels, and it is onlyused for relatively small amounts of heat.
Most cooling appliances such as freezers, fridgesand air conditioners run on electricity, althoughthere are also fridges that run on gas. The freezerand fridge at your home probably are the largestconsumers of electricity.
Transport powerTransport power is needed to move somethingfrom one place to another. If you carry a bag,your body is the machine that transports it. Thefood you eat provides the energy for the trans-port. Every day, tens of millions of tons of goodsare transported over roads, water, or through theair, by trucks, trains, ships and planes. Almost allof these transport machines are powered by pet-rol, gas, oil or kerosene. Only one major trans-port service is powered by electricity: a big por-tion of the railway system (and similar systemssuch as trams and metro).
Electricity is also used to drive electrical motors,which are used in factories, pumps, fans and manyother applications. In your home, you’ll probablyfind twenty to forty electric motors driving allkinds of things. For instance, each fridge has one
We use different forms of energy, like gas, elec-tricity and petrol. Can’t we perform every energyservice we need with just one form of energy, sayelectricity? Well, yes and no. As we will see later,electricity has disadvantages for some purposes.Depending on what we want to do, we need ener-gy in different forms. We will make the followingdistinction in the things we want to do with ener-gy: heat things up (houses, food, water), coolthings down (food, rooms), produce and manu-facture things and materials (industrial use), trans-port things (cars, trucks, ships, trains, planes), andeverything else (make music, light, etc.).
Heating and coolingHeating and cooling are mainly used to keep therooms we live in at a comfortable temperature: inthe winter we heat them up, and in the summerwe cool them down. This depends very much onwhere you live: people in colder regions will usespace heating fuelled by gas, oil or coal more of-ten then people in warmer regions. People inwarmer regions prefer to use air conditioners tokeep the temperature down.
Apart from regulating the temperature of rooms,we use heat also for cooking, taking a hot bath or
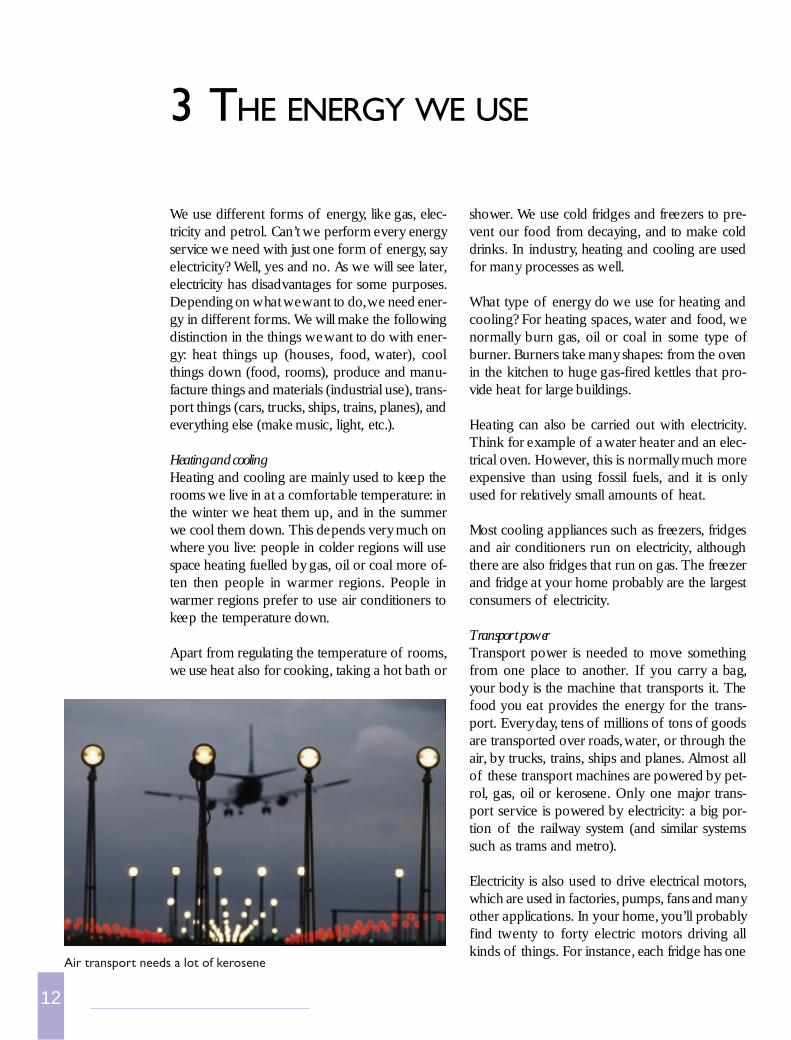
Air transport needs a lot of kerosene
3 THE ENERGY WE USE
13
pump, a microwave oven uses two motors (onefor the fan, the other for the rotation plate), yourstereo set probably contains seven little electricmotors, your computer might have eight of these,and a video recorder has at least two of them.
Industrial Use of EnergyThe manufacture of the products we use every-day, and the materials that were used e.g. to buildour houses, cost a large amount of energy. Facto-ries burn fuels to produce heat and power. Apartfrom the usual fuels and electricity, industry usesa large variety of less commonly used fuels, likewood chips, bark, and wood waste material fromthe production of paper, coal briquettes, cokeoven gas, and others. Manufacturing processesrequire large quantities of steam, which is pro-duced in boilers using the combustion of fuels.
Other applicationsMany more services at home require some use ofenergy and the devices designed to provide themrely only on electricity. When you surf over theinternet or type your homework, your desktopneeds electricity. If you want to enjoy some mu-sic or to see your preferred TV program, you needelectricity. Cleaning rooms, wash and dry laundry,ironing: all require electricity. Sometimes electric-ity is even used to cut bread, to squash orangesand to clean one’s teeth. Also personal security islinked to electricity, to open the main entrance, tospeak over the intercom, to run an alarm device.
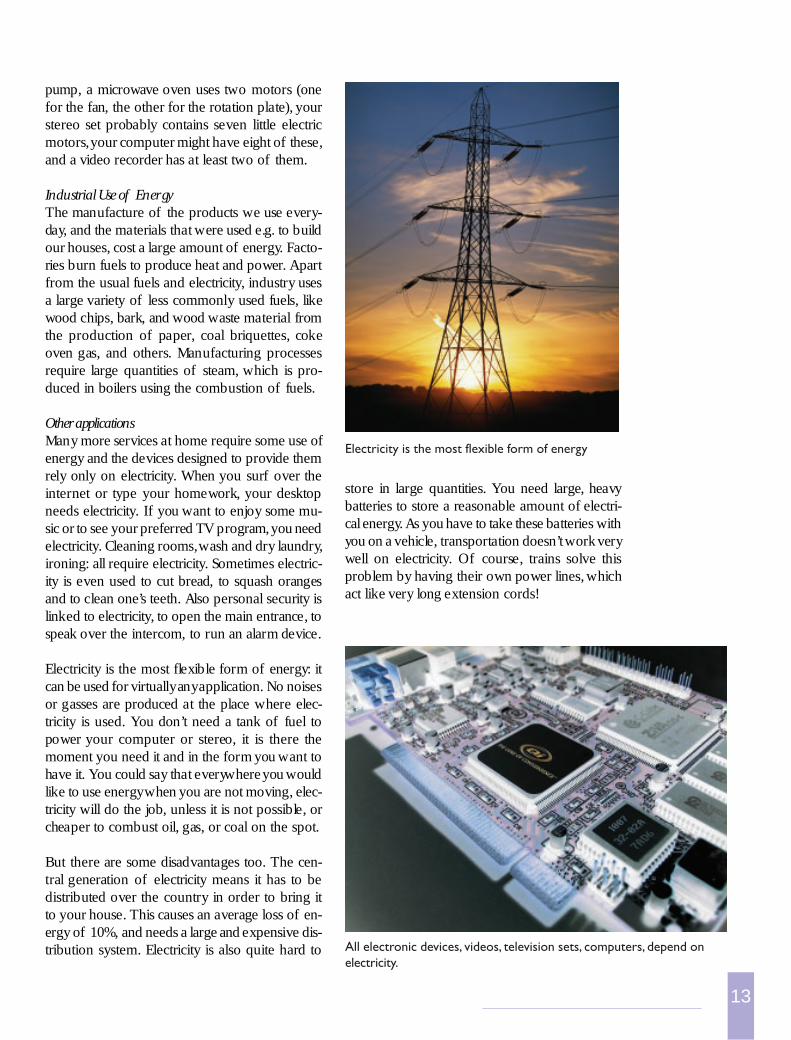
Electricity is the most flexible form of energy: itcan be used for virtually any application. No noisesor gasses are produced at the place where elec-tricity is used. You don’t need a tank of fuel topower your computer or stereo, it is there themoment you need it and in the form you want tohave it. You could say that everywhere you wouldlike to use energy when you are not moving, elec-tricity will do the job, unless it is not possible, orcheaper to combust oil, gas, or coal on the spot.
But there are some disadvantages too. The cen-tral generation of electricity means it has to bedistributed over the country in order to bring itto your house. This causes an average loss of en-ergy of 10%, and needs a large and expensive dis-tribution system. Electricity is also quite hard to
store in large quantities. You need large, heavybatteries to store a reasonable amount of electri-cal energy. As you have to take these batteries withyou on a vehicle, transportation doesn’t work verywell on electricity. Of course, trains solve thisproblem by having their own power lines, whichact like very long extension cords!
All electronic devices, videos, television sets, computers, depend onelectricity.
Electricity is the most flexible form of energy
14
all these forms of energy. In which units do wemeasure energy?
We say that energy is the capacity to do work. Ener-gy is measured in joules (J), and 1 joule is theamount of energy needed to lift a mass of a hun-dred grams over one meter. So, if you lift an ap-ple one meter, you need one joule of energy to
HOW TO MEASURE ENERGY
Energy comes in many forms: we use electricityfor light, cook on gas, and sometimes make a firewith firewood. If we want to know how muchenergy we use, we have to find a way to compare
To be precise
The formula for calculating how much ener-gy you need to lift a mass is Energy = Mass xAcceleration of gravity x Height, or E = m·g·h.On earth, g equals 9.81 m/s2, so to lift 100grams of mass (which is 0.1 kg) to a heightof 1 meter, you need E = 0.1 · 9.81 · 1 =0.981 joule, which is almost equal to 1 joule.
The calorie
The energy in food is often expressed in adifferent unit, called the calorie. One calorie isthe energy you need to heat up one gram ofwater with one degree centigrade. One calo-rie equals 4.19 joule. Often a larger unit, thekilocalorie or kcal is used: 1 kcal = 1000 cal =4190 joule.
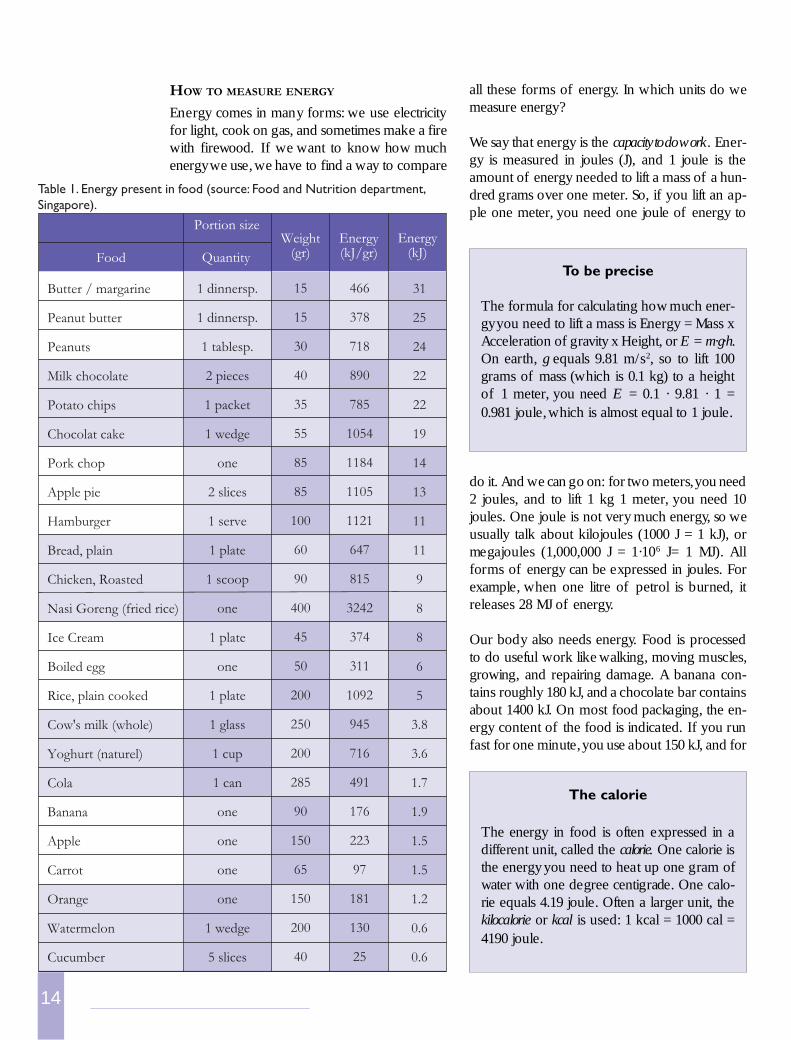
Table 1. Energy present in food (source: Food and Nutrition department,Singapore).
do it. And we can go on: for two meters, you need2 joules, and to lift 1 kg 1 meter, you need 10joules. One joule is not very much energy, so weusually talk about kilojoules (1000 J = 1 kJ), ormegajoules (1,000,000 J = 1·106 J= 1 MJ). Allforms of energy can be expressed in joules. Forexample, when one litre of petrol is burned, itreleases 28 MJ of energy.
Our body also needs energy. Food is processedto do useful work like walking, moving muscles,growing, and repairing damage. A banana con-tains roughly 180 kJ, and a chocolate bar containsabout 1400 kJ. On most food packaging, the en-ergy content of the food is indicated. If you runfast for one minute, you use about 150 kJ, and for
Butter / margarine
Peanut butter
Peanuts
Milk chocolate
Potato chips
Chocolat cake
Pork chop
Apple pie
Hamburger
Bread, plain
Chicken, Roasted
Nasi Goreng (fried rice)
Ice Cream
Boiled egg
Rice, plain cooked
Cow's milk (whole)
Yoghurt (naturel)
Cola
Banana
Apple
Carrot
Orange
Watermelon
Cucumber
1 dinnersp.
1 dinnersp.
1 tablesp.
2 pieces
1 packet
1 wedge
one
2 slices
1 serve
1 plate
1 scoop
one
1 plate
one
1 plate
1 glass
1 cup
1 can
one
one
one
one
1 wedge
5 slices
15
15
30
40
35
55
85
85
100
60
90
400
45
50
200
250
200
285
90
150
65
150
200
40
466
378
718
890
785
1054
1184
1105
1121
647
815
3242
374
311
1092
945
716
491
176
223
97
181
130
25
31
25
24
22
22
19
14
13
11
11
9
8
8
6
5
3.8
3.6
1.7
1.9
1.5
1.5
1.2
0.6
0.6
Portion size
Quantity
Weight(gr)
Energy(kJ)
Energy(kJ/gr)Food
15
cycling one minute, you need 50 kJ. Even for sleep-ing, you still need 4 kJ per minute. So on just onechocolate bar, you can run for 40 minutes, or sleepfor 6 hours. Table 1 shows the food content ofmany foodstuffs.
POWER
Apart from energy, we also encounter power. Pow-er is the amount of energy used per unit of time,and it is therefore measured in joules per second(J/s), which is also called Watt (W). For example,if you have a 100 watt lamp, it uses 100 joulesevery second. So every minute, a lamp of a 100watt uses 6000 joules. Most appliances such asTV’s or microwave ovens indicate how much pow-er they use. A microwave oven, for example, uses1000 Watts, and a clock radio about 10 watts.
How much is a thousand watts, or ten watts? Let’stake our own body as an example. If you walk upthe stairs, you need a certain amount of power todo it. Say Linda, weighing 50 kg, runs up threeflights of stairs, which is a height difference ofroughly 10 meters in total. For this, she needs 5000joules (50 kg x 10 meter x 10 joules per kg permeter). If she does this in 20 seconds, she hasused 5000/20 = 250 watts during those 20 sec-onds. Linda will probably be quite tired.
Writing large numbers
In this text we use exponential notation for writing large numbers.The idea is to count the number of zeros instead of writingthem all down. So 5000 can be written as 5.0·103. In this way1,000,000 becomes 1.0·106, and 5,124,000,000 becomes 5.124·109.
Table 2. Commonly used units of energy
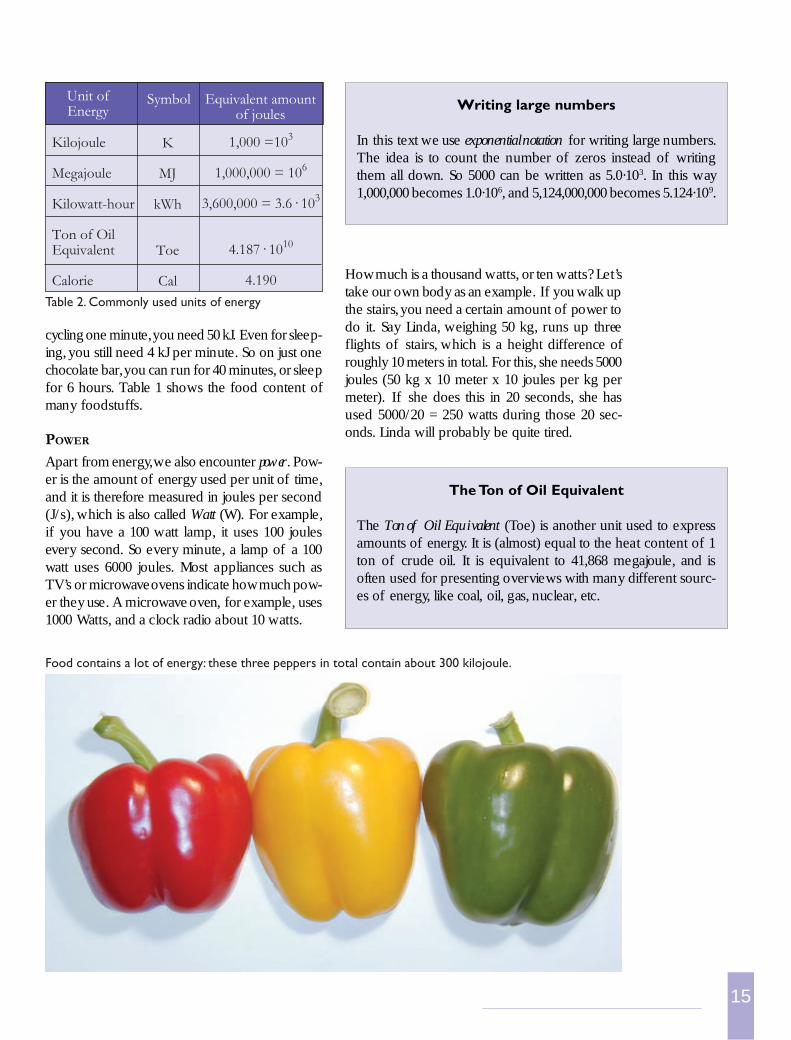
Food contains a lot of energy: these three peppers in total contain about 300 kilojoule.
The Ton of Oil Equivalent
The Ton of Oil Equivalent (Toe) is another unit used to expressamounts of energy. It is (almost) equal to the heat content of 1ton of crude oil. It is equivalent to 41,868 megajoule, and isoften used for presenting overviews with many different sourc-es of energy, like coal, oil, gas, nuclear, etc.
Kilojoule
Megajoule
Kilowatt-hour
Ton of OilEquivalent
Calorie
K
MJ
kWh
Toe
Cal
1,000 =103
1,000,000 = 106
3,600,000 = 3.6· 103
4.187· 1010
4.190
Symbol Equivalent amountof joules
Unit ofEnergy
16
erators. The energy produced by the generatorstravels to individual homes through power lines.The unit of energy sold to households is 1000watts during one hour, which is called the kilo-watt-hour, or kWh for short.
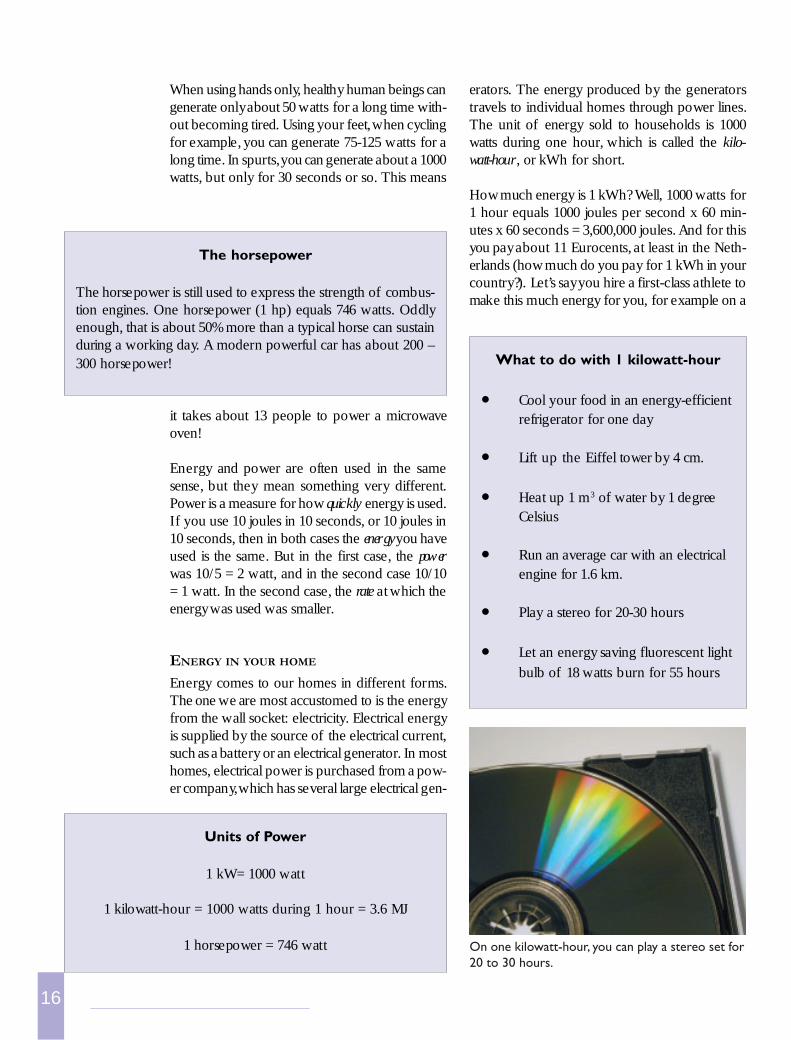
How much energy is 1 kWh? Well, 1000 watts for1 hour equals 1000 joules per second x 60 min-utes x 60 seconds = 3,600,000 joules. And for thisyou pay about 11 Eurocents, at least in the Neth-erlands (how much do you pay for 1 kWh in yourcountry?). Let’s say you hire a first-class athlete tomake this much energy for you, for example on a
When using hands only, healthy human beings cangenerate only about 50 watts for a long time with-out becoming tired. Using your feet, when cyclingfor example, you can generate 75-125 watts for along time. In spurts, you can generate about a 1000watts, but only for 30 seconds or so. This means
Units of Power
1 kW= 1000 watt
1 kilowatt-hour = 1000 watts during 1 hour = 3.6 MJ
1 horsepower = 746 watt
What to do with 1 kilowatt-hour
• Cool your food in an energy-efficientrefrigerator for one day
• Lift up the Eiffel tower by 4 cm.
• Heat up 1 m3 of water by 1 degreeCelsius
• Run an average car with an electricalengine for 1.6 km.
• Play a stereo for 20-30 hours
• Let an energy saving fluorescent light
bulb of 18 watts burn for 55 hours
The horsepower
The horsepower is still used to express the strength of combus-tion engines. One horsepower (1 hp) equals 746 watts. Oddlyenough, that is about 50% more than a typical horse can sustainduring a working day. A modern powerful car has about 200 –300 horsepower!
it takes about 13 people to power a microwaveoven!
Energy and power are often used in the samesense, but they mean something very different.Power is a measure for how quickly energy is used.If you use 10 joules in 10 seconds, or 10 joules in10 seconds, then in both cases the energy you haveused is the same. But in the first case, the powerwas 10/5 = 2 watt, and in the second case 10/10= 1 watt. In the second case, the rate at which theenergy was used was smaller.
ENERGY IN YOUR HOME
Energy comes to our homes in different forms.The one we are most accustomed to is the energyfrom the wall socket: electricity. Electrical energyis supplied by the source of the electrical current,such as a battery or an electrical generator. In mosthomes, electrical power is purchased from a pow-er company, which has several large electrical gen-
On one kilowatt-hour, you can play a stereo set for20 to 30 hours.
17
bicycle driving a generator. An athlete can gener-ate 300 watts for several hours, so it will take himabout three hours of hard work! And you will haveto pay him a lot more than 11 Eurocents, proba-bly.
Apart from electricity, energy also comes to ourhouses in the shape of fossil fuels such as gas, oil,petrol and coal. Gas and oil are used for cookingand to heat homes in winter. Petrol is used to pow-er motors and cars. Many countries have an un-derground pipe grid that distributes gas, and gascan also be bought in containers of many sizes,for use on camping sites for example. Petrol canbe bought at tank stations. From table 3, we seethat gas gives you a lot of energy for very littlemoney. That is why it is almost always preferableto cook and heat your home with gas, if it is avail-able.
Finally, we might buy small quantities of portablepower in the shape of batteries. These are the mostexpensive: while a small battery for a watch mightbe cheap, the price per kWh is about 900 Euro!
HOW MUCH ENERGY DO YOU USE?
Every day we use energy, but how much exactly?It depends on where you live, on how you liveand on what you do. As we talked about kilowatt-hours as a unit to measure energy, let’s see howmany kilowatt-hours we use in a month. Most ap-pliances have a label that says how much powerthey need. A television, for example, takes about180 watt, and an electric toaster takes about 1000watt.
Of course, if you want to know how much ener-gy you use, you also have to know how long youuse an electrical device. For example, an electricalclock of 5 watts that is on for a whole monthtakes about 4 kWh per month, while a toaster ofa 1000 watts, which is only on for two hours eve-ry month, takes only 2 kWh per month! So smalldevices, which seem harmless in their energy de-mand, can sneakily take up quite a lot of electric-ity. Table 4 lists the energy need of many house-hold devices, how long they are used on average,and how much energy they use per month.
Table 3. Energy content and approximate costs (in the Netherlands, 2002)of different forms of energy.
Table 4. Energy needs of household appliances (continued next page).
Electricity
Natural Gas
Gasoline
Battery
1 kWh ~0.11 Euro
1 m3 ~0.11 Euro
1 litre ~1.1 Euro
1 AA penlight~ 1 Euro
1
10
8
0.001
0.11
0.01
0.13
900
Cost perUnit
Energy contentper unitin kWh
Cost per kWhin Euro
Form of Energy
Air conditioner (room)
Water heater (family of 4)
Dehumidifier
Clothes washer
Fridge-freezer (600 l)
Clothes dryer
Water bed heater
Dishwasher
Refrigerator (450 l)
Electric Heater (portable)
Humidifier (portable)
Computer
Television
Microwave oven
Coffee maker
Ceiling fan
Lighting (single lamp)
TL tube (120 cm)
Hair Dryer
750
3800
350
500
500
5000
400
1300
300
1200
100
200
180
1300
900
60
60
50
1000
120 - 720
98 - 138
120 - 720
7 - 40
150 - 300
6 - 28
150 - 300
8 - 40
190 - 300
30 - 90
80 - 540
25 - 160
60 - 440
5 - 30
4 - 30
15 - 330
17 - 200
10 - 200
1 - 10
90 - 540
375 - 525
42 - 252
33 - 196
75 - 150
30 - 140
60 - 120
20 - 102
56 - 90
30 - 90
8 - 54
5 - 32
5 - 35
5 - 30
4 - 27
1 - 20
1 - 12
0.5 - 10
1 - 10
WattsHours
per monthkWh per
monthAppliance
18
How to read energy bills and theelectricity meter
The energy bill states how much kilowatt-hours of electricity and how much gas wereused over a certain period. To see how muchelectrical power you use at a certain moment,you can look at the electricity meter. Often,an electricity meter has a disk that you cansee spinning around. The more power you use,the faster the disk spins. You can see howmuch kilowatt-hours you have used on a nu-merical display. In the same way, you can seehow much gas you use from the gas meter. Inthis way, you can measure your energy con-sumption per hour, per day, per week, etc.
Table 4. Continued from the previous page (Source NB power, France)
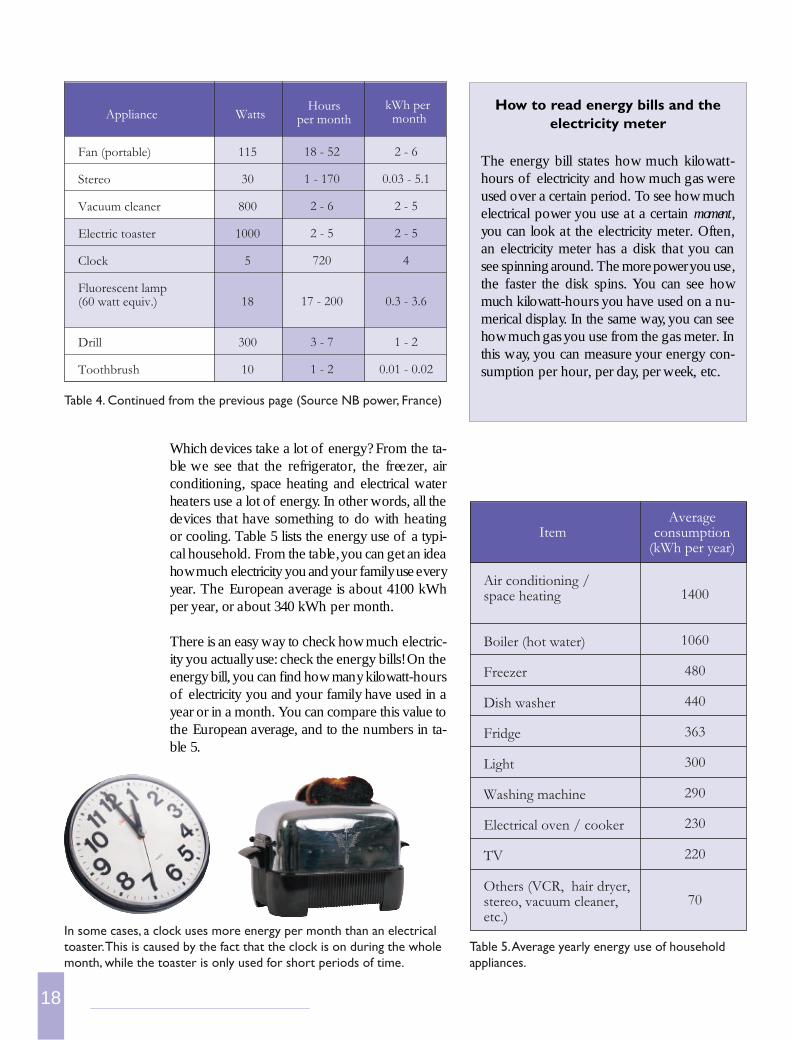
In some cases, a clock uses more energy per month than an electricaltoaster. This is caused by the fact that the clock is on during the wholemonth, while the toaster is only used for short periods of time.
Which devices take a lot of energy? From the ta-ble we see that the refrigerator, the freezer, airconditioning, space heating and electrical waterheaters use a lot of energy. In other words, all thedevices that have something to do with heatingor cooling. Table 5 lists the energy use of a typi-cal household. From the table, you can get an ideahow much electricity you and your family use everyyear. The European average is about 4100 kWhper year, or about 340 kWh per month.
There is an easy way to check how much electric-ity you actually use: check the energy bills! On theenergy bill, you can find how many kilowatt-hoursof electricity you and your family have used in ayear or in a month. You can compare this value tothe European average, and to the numbers in ta-ble 5.
Table 5. Average yearly energy use of householdappliances.
Fan (portable)
Stereo
Vacuum cleaner
Electric toaster
Clock
Fluorescent lamp(60 watt equiv.)
Drill
Toothbrush
115
30
800
1000
5
18
300
10
18 - 52
1 - 170
2 - 6
2 - 5
720
17 - 200
3 - 7
1 - 2
2 - 6
0.03 - 5.1
2 - 5
2 - 5
4
0.3 - 3.6
1 - 2
0.01 - 0.02
WattsHours
per monthkWh per
monthAppliance
Air conditioning /space heating
Boiler (hot water)
Freezer
Dish washer
Fridge
Light
Washing machine
Electrical oven / cooker
TV
Others (VCR, hair dryer,stereo, vacuum cleaner,etc.)
1400
1060
480
440
363
300
290
230
220
70
Averageconsumption
(kWh per year)Item
19
Stand-by power
Many electrical devices are never completelyoff, but are in stand-by. This stand-by modetakes energy: An average house uses about100 watt of power for electrical devices onstand-by. Try it in your own house!
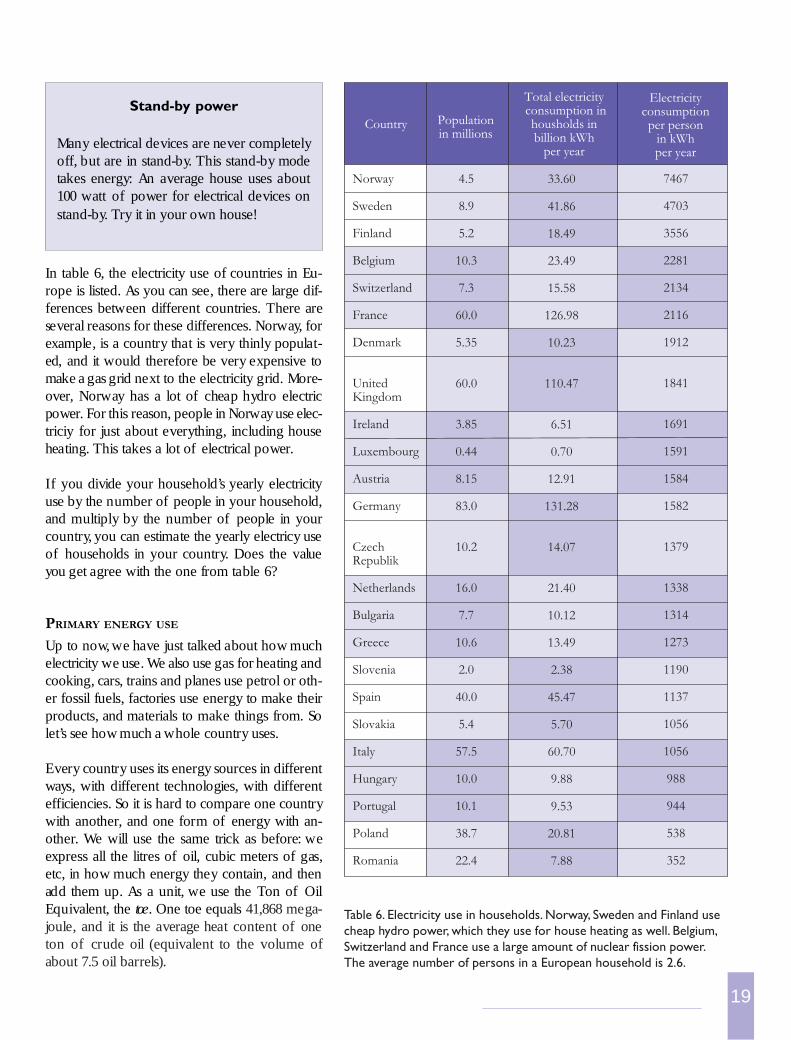
Table 6. Electricity use in households. Norway, Sweden and Finland usecheap hydro power, which they use for house heating as well. Belgium,Switzerland and France use a large amount of nuclear fission power.The average number of persons in a European household is 2.6.
In table 6, the electricity use of countries in Eu-rope is listed. As you can see, there are large dif-ferences between different countries. There areseveral reasons for these differences. Norway, forexample, is a country that is very thinly populat-ed, and it would therefore be very expensive tomake a gas grid next to the electricity grid. More-over, Norway has a lot of cheap hydro electricpower. For this reason, people in Norway use elec-triciy for just about everything, including househeating. This takes a lot of electrical power.
If you divide your household’s yearly electricityuse by the number of people in your household,and multiply by the number of people in yourcountry, you can estimate the yearly electricy useof households in your country. Does the valueyou get agree with the one from table 6?
PRIMARY ENERGY USE
Up to now, we have just talked about how muchelectricity we use. We also use gas for heating andcooking, cars, trains and planes use petrol or oth-er fossil fuels, factories use energy to make theirproducts, and materials to make things from. Solet’s see how much a whole country uses.
Every country uses its energy sources in differentways, with different technologies, with differentefficiencies. So it is hard to compare one countrywith another, and one form of energy with an-other. We will use the same trick as before: weexpress all the litres of oil, cubic meters of gas,etc, in how much energy they contain, and thenadd them up. As a unit, we use the Ton of OilEquivalent, the toe. One toe equals 41,868 mega-joule, and it is the average heat content of oneton of crude oil (equivalent to the volume ofabout 7.5 oil barrels).
Norway
Sweden
Finland
Belgium
Switzerland
France
Denmark
UnitedKingdom
Ireland
Luxembourg
Austria
Germany
CzechRepublik
Netherlands
Bulgaria
Greece
Slovenia
Spain
Slovakia
Italy
Hungary
Portugal
Poland
Romania
4.5
8.9
5.2
10.3
7.3
60.0
5.35
60.0
3.85
0.44
8.15
83.0
10.2
16.0
7.7
10.6
2.0
40.0
5.4
57.5
10.0
10.1
38.7
22.4
33.60
41.86
18.49
23.49
15.58
126.98
10.23
110.47
6.51
0.70
12.91
131.28
14.07
21.40
10.12
13.49
2.38
45.47
5.70
60.70
9.88
9.53
20.81
7.88
7467
4703
3556
2281
2134
2116
1912
1841
1691
1591
1584
1582
1379
1338
1314
1273
1190
1137
1056
1056
988
944
538
352
Populationin millions
Total electricity consumption in
housholds inbillion kWh
per year
Electricityconsumptionper person
in kWhper year
Country
20
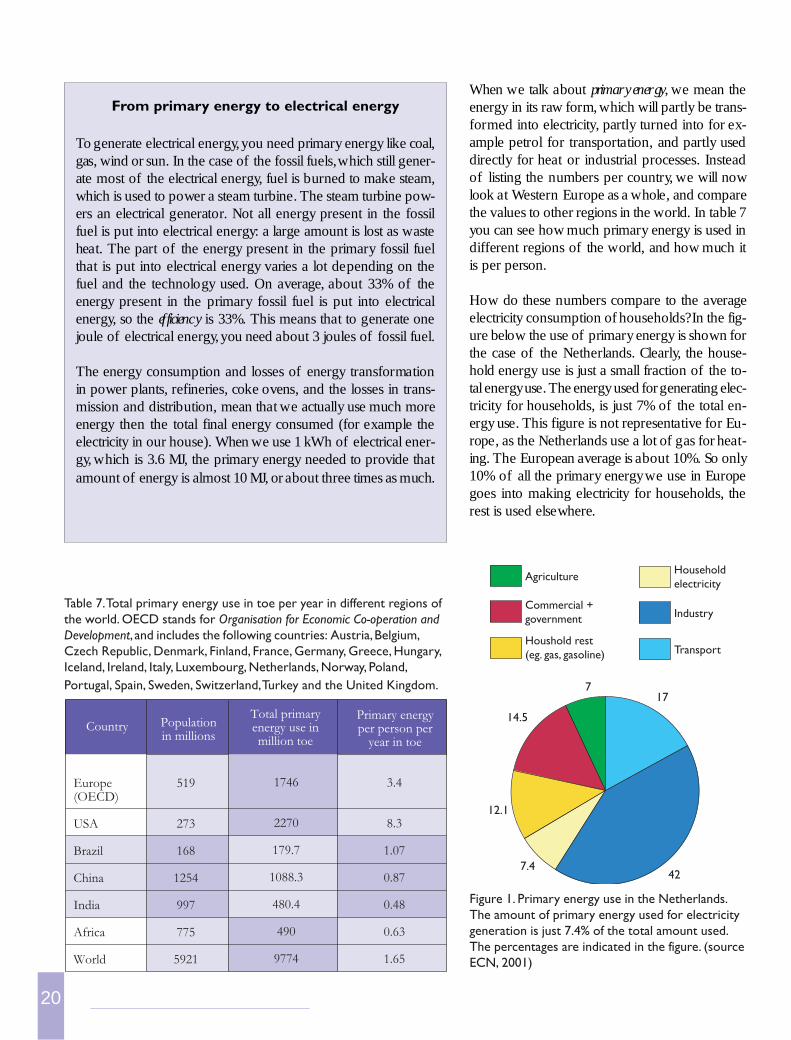
When we talk about primary energy, we mean theenergy in its raw form, which will partly be trans-formed into electricity, partly turned into for ex-ample petrol for transportation, and partly useddirectly for heat or industrial processes. Insteadof listing the numbers per country, we will nowlook at Western Europe as a whole, and comparethe values to other regions in the world. In table 7you can see how much primary energy is used indifferent regions of the world, and how much itis per person.
How do these numbers compare to the averageelectricity consumption of households? In the fig-ure below the use of primary energy is shown forthe case of the Netherlands. Clearly, the house-hold energy use is just a small fraction of the to-tal energy use. The energy used for generating elec-tricity for households, is just 7% of the total en-ergy use. This figure is not representative for Eu-rope, as the Netherlands use a lot of gas for heat-ing. The European average is about 10%. So only10% of all the primary energy we use in Europegoes into making electricity for households, therest is used elsewhere.
From primary energy to electrical energy
To generate electrical energy, you need primary energy like coal,gas, wind or sun. In the case of the fossil fuels, which still gener-ate most of the electrical energy, fuel is burned to make steam,which is used to power a steam turbine. The steam turbine pow-ers an electrical generator. Not all energy present in the fossilfuel is put into electrical energy: a large amount is lost as wasteheat. The part of the energy present in the primary fossil fuelthat is put into electrical energy varies a lot depending on thefuel and the technology used. On average, about 33% of theenergy present in the primary fossil fuel is put into electricalenergy, so the efficiency is 33%. This means that to generate onejoule of electrical energy, you need about 3 joules of fossil fuel.
The energy consumption and losses of energy transformationin power plants, refineries, coke ovens, and the losses in trans-mission and distribution, mean that we actually use much moreenergy then the total final energy consumed (for example theelectricity in our house). When we use 1 kWh of electrical ener-gy, which is 3.6 MJ, the primary energy needed to provide thatamount of energy is almost 10 MJ, or about three times as much.
Table 7. Total primary energy use in toe per year in different regions ofthe world. OECD stands for Organisation for Economic Co-operation andDevelopment, and includes the following countries: Austria, Belgium,Czech Republic, Denmark, Finland, France, Germany, Greece, Hungary,Iceland, Ireland, Italy, Luxembourg, Netherlands, Norway, Poland,Portugal, Spain, Sweden, Switzerland, Turkey and the United Kingdom.
Figure 1. Primary energy use in the Netherlands.The amount of primary energy used for electricitygeneration is just 7.4% of the total amount used.The percentages are indicated in the figure. (sourceECN, 2001)
Agriculture
Commercial + government
Houshold rest (eg. gas, gasoline)
Householdelectricity
Industry
Transport
717
14.5
12.1
7.442
Europe(OECD)
USA
Brazil
China
India
Africa
World
1746
2270
179.7
1088.3
480.4
490
9774
3.4
8.3
1.07
0.87
0.48
0.63
1.65
Populationin millions
Total primaryenergy use inmillion toe
Primary energyper person per
year in toeCountry
519
273
168
1254
997
775
5921
21
Where does all this energy go? Mainly to indus-try, public services and transportation. The fac-tories that make the products we use need a lotof energy. And the transportation of people, prod-ucts, raw materials, etc., takes a lot of energy too.
From the table you see that in Western Europe,one person uses 4.2 tons of oil equivalent per year.How much is that? The energy content of 4.2tons of oil is about 1.7·1011 joule. If you were touse muscle power only, how many people wouldyou need to generate this much energy? An aver-age person can generate about 50 watt continu-ously, which is 1.57·109 joules in a year (workingall day and night, all days of the week, all weeksof the year). So you need more than 100 peopleto generate the energy each of us uses. Each onof us would need a 100 ‘energy slaves’ to gener-ate his or her energy.
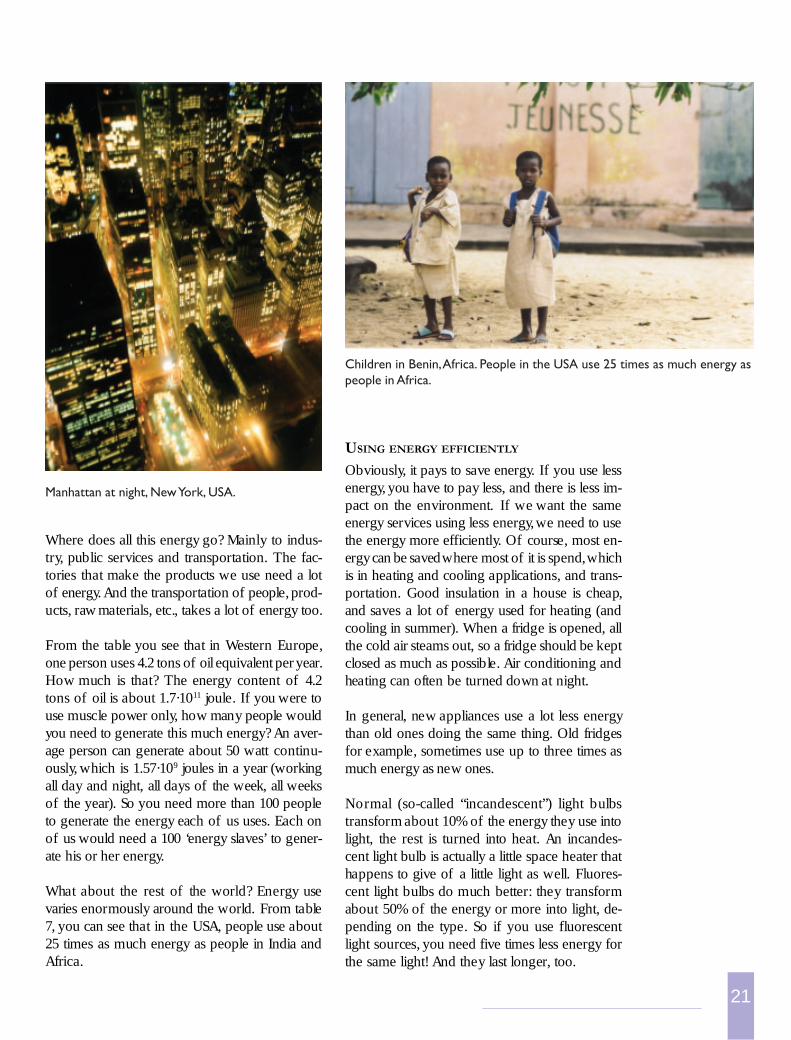
What about the rest of the world? Energy usevaries enormously around the world. From table7, you can see that in the USA, people use about25 times as much energy as people in India andAfrica.
USING ENERGY EFFICIENTLY
Obviously, it pays to save energy. If you use lessenergy, you have to pay less, and there is less im-pact on the environment. If we want the sameenergy services using less energy, we need to usethe energy more efficiently. Of course, most en-ergy can be saved where most of it is spend, whichis in heating and cooling applications, and trans-portation. Good insulation in a house is cheap,and saves a lot of energy used for heating (andcooling in summer). When a fridge is opened, allthe cold air steams out, so a fridge should be keptclosed as much as possible. Air conditioning andheating can often be turned down at night.
In general, new appliances use a lot less energythan old ones doing the same thing. Old fridgesfor example, sometimes use up to three times asmuch energy as new ones.
Normal (so-called “incandescent”) light bulbstransform about 10% of the energy they use intolight, the rest is turned into heat. An incandes-cent light bulb is actually a little space heater thathappens to give of a little light as well. Fluores-cent light bulbs do much better: they transformabout 50% of the energy or more into light, de-pending on the type. So if you use fluorescentlight sources, you need five times less energy forthe same light! And they last longer, too.
Children in Benin, Africa. People in the USA use 25 times as much energy aspeople in Africa.
Manhattan at night, New York, USA.
22
you make an estimate of how much energy yourhouse embodies?
Some industries use more energy than others.There are six industrial sectors that are the big-gest consumers:
• Power plants, oil refinery and coal tranfor-mation processes require large amounts of ener-gy to transform energy in the form that is need-ed.
• Iron and Steel: the reduction of iron oresinto metal is energy intensive, as well as the pro-duction of steel.
• Chemicals: basic chemicals used elsewherein industry, plastics and synthetic fibres, and finalproducts like drugs, cosmetics, fertilizers, et.
• Paper and allied products: for the manu-facturing of pulps from woods or other cellulosefibres, and for the manufacturing of paper andfinal products (i.e. napkins, etc.).
• Non ferrous metal industries: for the melt-ing and refining of metallic materials (copper,steel, aluminium) from ore or scrap. It includesalso the manufacturing of the final metal prod-ucts, such as sheets, bars, rods, plates, etc.
• Non metallic materials, such as cement,glass, and all forms of bricks require a lot of en-ergy in special ovens.
In general, the industry of a country uses a largeshare of all the primary energy that is used. In theNetherlands, for example, the industry uses 42%of the primary energy.
Flying takes a lot of energy. The amount of ener-gy it takes for one person to fly from Europe toNew York and back, is the same as the electricityused in a household during a whole year. On top,the exhaust of the plane is very bad for the envi-ronment.
At the moment, many industries try to use pro-duction methods that use less energy. Smart pro-duction processes re-use heat that was lost throughthe chimney in earlier times. Biological waste ma-terial can be used to make biogas, which in turncan be used as fuel. Thinking carefully about pro-duction processes in this way can sometimes saveup to 30% of the energy used.
ENERGY USE OF THE INDUSTRY
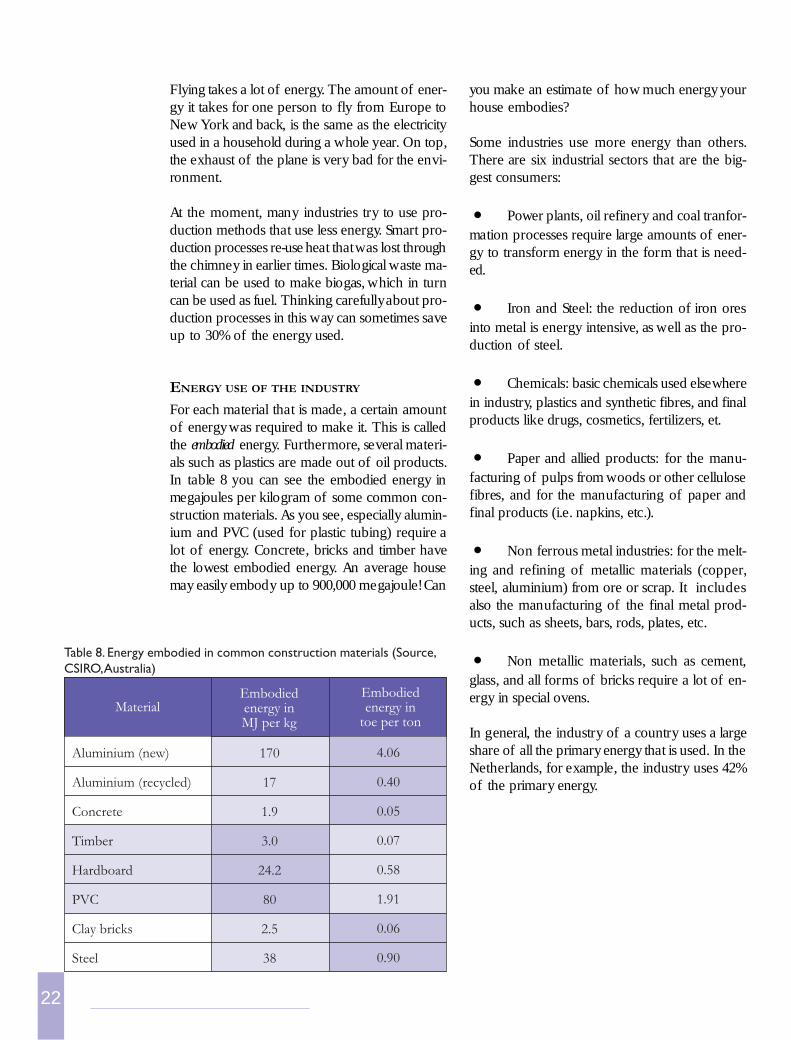
For each material that is made, a certain amountof energy was required to make it. This is calledthe embodied energy. Furthermore, several materi-als such as plastics are made out of oil products.In table 8 you can see the embodied energy inmegajoules per kilogram of some common con-struction materials. As you see, especially alumin-ium and PVC (used for plastic tubing) require alot of energy. Concrete, bricks and timber havethe lowest embodied energy. An average housemay easily embody up to 900,000 megajoule! Can
Table 8. Energy embodied in common construction materials (Source,CSIRO, Australia)
Aluminium (new)
Aluminium (recycled)
Concrete
Timber
Hardboard
PVC
Clay bricks
Steel
4.06
0.40
0.05
0.07
0.58
1.91
0.06
0.90
Embodiedenergy inMJ per kg
Embodiedenergy in
toe per tonMaterial
170
17
1.9
3.0
24.2
80
2.5
38
23
Summary
• Energy services can be divided in heating and cooling, transport, and everything else.
• All energy forms are expressed in Joules (J).
• Power is the rate at which energy is produced or consumed, expressed in watt (W), which isequal to joules per second (J/s).
• Electrical energy is usually expressed in kilowatt-hours (kWh).
• Heating and cooling use most of the energy at home.
• Different regions of the world use very different amounts of energy.
• If energy had to be generated by human power, you would need 100 people to generate theenergy for one person.
• The primary energy used for the generation of electricity is just a small part of the totalprimary energy used.
Things to do• What would one day without electricity look like?
• Identify the energy content of five food products at home. How long would you be able torun, ride your bike or sleep with these amounts of energy?
• Look up how the oil crisis in the 1970s developed. Which measures were taken by the gov-ernment of your country from that time onwards?
• Write down today’s meter readings for gas and electricity use at home and the ones 1 weeklater. Calculate the weekly gas and electricity usage and compare this with your friends (takeinto account the number of people living in each family).
• What other energy saving techniques or habits then already discussed can you think of ?How much energy per month would you save with these measures?
• Write a brochure which stimulates people to save more energy. What would be your slogan?
On the Web
>>>
www.iea.org
The site of the International EnergyAgency, where information and sta-tistics on energy are available.
www.iiasa.ac.at
Non governmental organization thatperforms studies on environmental,
economic, technological and social is-sues.
www.eia.doe.gov
Official energy statistics from the USGovernment.
www.ase.org/educators/
Energy efficiency in schools.
<<<
24
ENERGY FROM FOSSIL FUELS
Coal, oil and gas power most of the energy serv-ices around the world, in fact, they provide 80%of all the energy in the world. They are called fos-sil fuels because they have been formed millionsof years ago. Fossil fuels have to be harvested bymining, which is a heavy and large-scale industry.They have been formed from prehistoric plantsand animals that lived 300 million years ago. Whenthese ancient living organisms died, they decom-posed and became buried under layers of rock,mud and sand. Eventually, hundreds of metresof earth covered them. During millions of yearsthe dead plants and animals slowly decomposedand formed the fossil fuels that we use today.
Different types of fossil fuel were formed depend-ing on what animal and plant debris were present,what conditions of temperature and pressure ex-isted when they were decomposing and how longthe material was buried.
OilOil keeps your country moving. Almost the en-tire transportation fleet – cars, trucks, trains andairplanes – is powered with fuels made from oil.Lubricants made from oil keep the machinery inthe factories running. Also fertilizer, used to growfood, is made from oil. It is quite likely that thetoothbrush you used this morning, the plasticbottle that holds your milk, and the plastic inkpen that you write with are all made from oil. Manymedical substances are also made from oil.
Oil (and natural gas) was created from organismsthat lived in the water and were buried under oceansediments. Oil exists underground as tiny drop-lets trapped inside the open spaces, called “pores,”inside rocks. The pores and the oil droplets canbe seen only through a microscope. Oil is com-posed of hydrocarbons, which are long chains ofcarbon atoms with hydrogen atoms attached tothem.
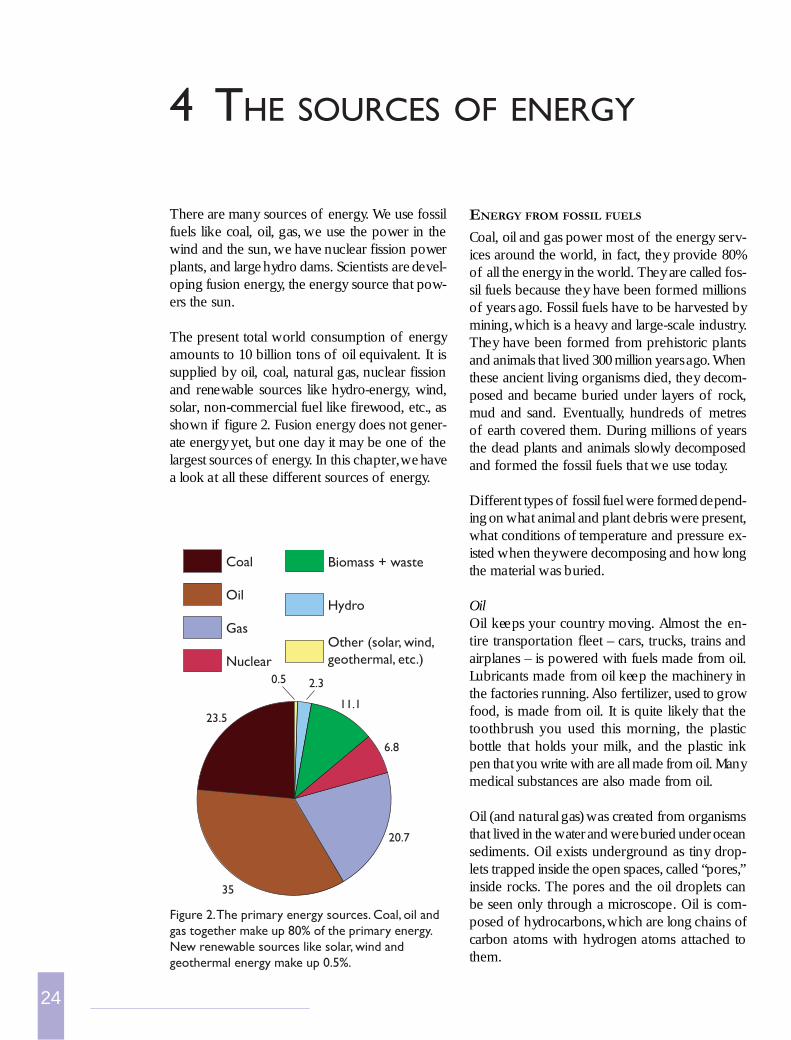
There are many sources of energy. We use fossilfuels like coal, oil, gas, we use the power in thewind and the sun, we have nuclear fission powerplants, and large hydro dams. Scientists are devel-oping fusion energy, the energy source that pow-ers the sun.
The present total world consumption of energyamounts to 10 billion tons of oil equivalent. It issupplied by oil, coal, natural gas, nuclear fissionand renewable sources like hydro-energy, wind,solar, non-commercial fuel like firewood, etc., asshown if figure 2. Fusion energy does not gener-ate energy yet, but one day it may be one of thelargest sources of energy. In this chapter, we havea look at all these different sources of energy.
4 THE SOURCES OF ENERGY
Figure 2. The primary energy sources. Coal, oil andgas together make up 80% of the primary energy.New renewable sources like solar, wind andgeothermal energy make up 0.5%.
Biomass + waste
Hydro
Other (solar, wind, geothermal, etc.)
Coal
Oil
Gas
Nuclear
11.1
0.5
23.5
35
20.7
6.8
2.3
25
Natural gasNatural gas is made up mainly of methane (CH
4),
a compound that has a carbon atom surroundedby four hydrogen atoms. Methane is highly flam-mable and burns almost completely. There is noash and very little air pollution. Natural gas is col-ourless and in its pure form, odourless.
For most of the 1800s, a type of gas made fromcoal (a mixture of carbon monoxide, CO, andhydrogen, H
2) was already used as a fuel for lamps
to light city streets. In 1885, Robert Bunsen in-vented a burner that mixed air with gas. The “Bun-sen burner” is still used today to provide heat forcooking and warming buildings.
Today, natural gas provides one-fifth of all theenergy used in the EU. It is especially importantin homes, where it supplies nearly half of all theenergy used for heating, hot water and cooking.Because natural gas has no odour, gas companiesadd a chemical to make it smell. The odour makesit easy to smell if there is a gas leak in your house.
The advantages of gas are that it is easy to trans-port by pipeline from one place to another and itburns very cleanly with a high efficiency. Gas isused in power plants to generate electricity, and infactories both as a fuel and as an ingredient for avariety of chemicals.
CoalCoal is the most plentiful fuel in the fossil familyand it has the longest history. Coal has been usedfor heating since early mankind, and is now usedprimarily to generate electricity. Up to 1800, char-coal, which is made from wood, was also exten-
sively used. Coal formed from the dead remainsof trees, ferns and other plants that lived 300 to400 million years ago.
Different kinds of coal exists, with different prop-erties. Anthracite, which is very hard, gives muchheat, but little flame and smoke. Generally, theharder the coal, the more energy is present in it,up to 31 MJ per kilogram. Steam coal, which isused mainly in power plants, has a lower heat con-tent of 25 MJ per kilogram. In some countries,so-called brown coal, which has even lower heatcontent, is used. Some coals contain hardly anysulphur, others contain 5% of sulphur or more.
Fossil coal is burned in power plants to produceelectricity. If your family uses an electric stove,you use about half a ton of coal a year. In caseyour water boiler is electric, you use about twotons of coal a year. An electric fridge counts foranother half-ton a year. Even though you maynever see coal, you use several tons of it everyyear!
HOW WE USE FOSSIL FUELS
We use oil, coal and gas mainly for transport, spaceheating, fuel to make electricity, and as a raw ma-terial, as shown in figure 3 on the next page.. Oilcan be refined into a number of transport fuels,like petrol for cars, kerosene for airplanes, anddiesel for trucks. Electricity is made in power
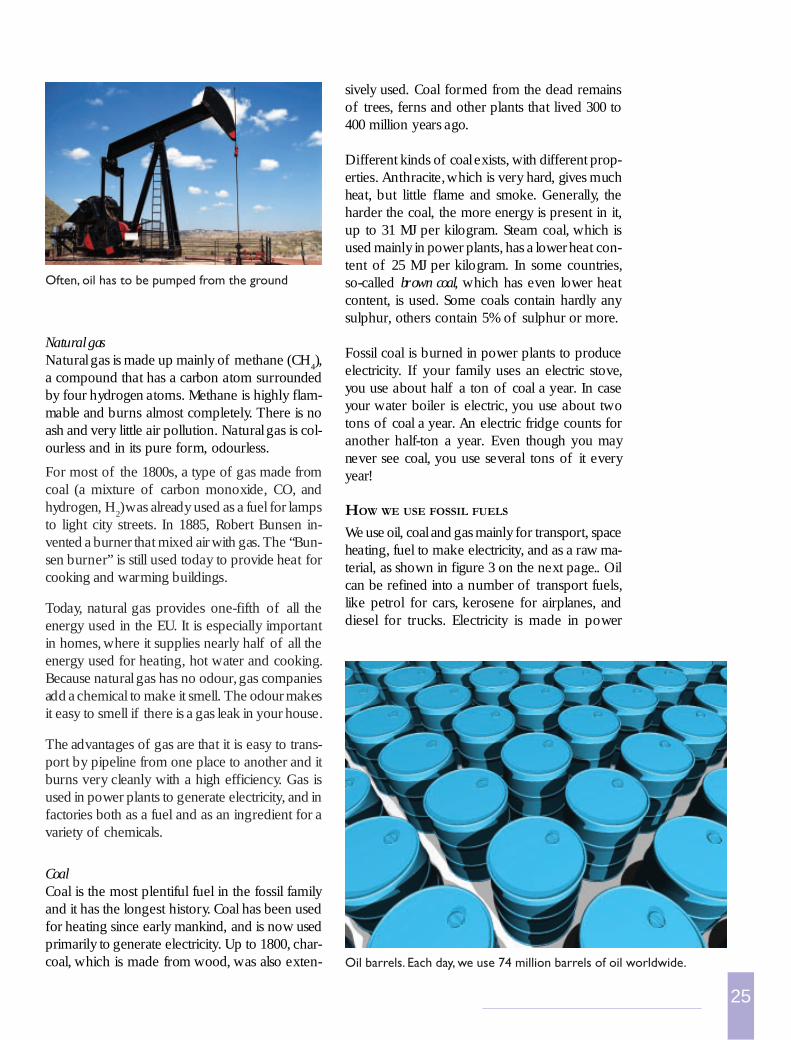
Oil barrels. Each day, we use 74 million barrels of oil worldwide.
Often, oil has to be pumped from the ground
26
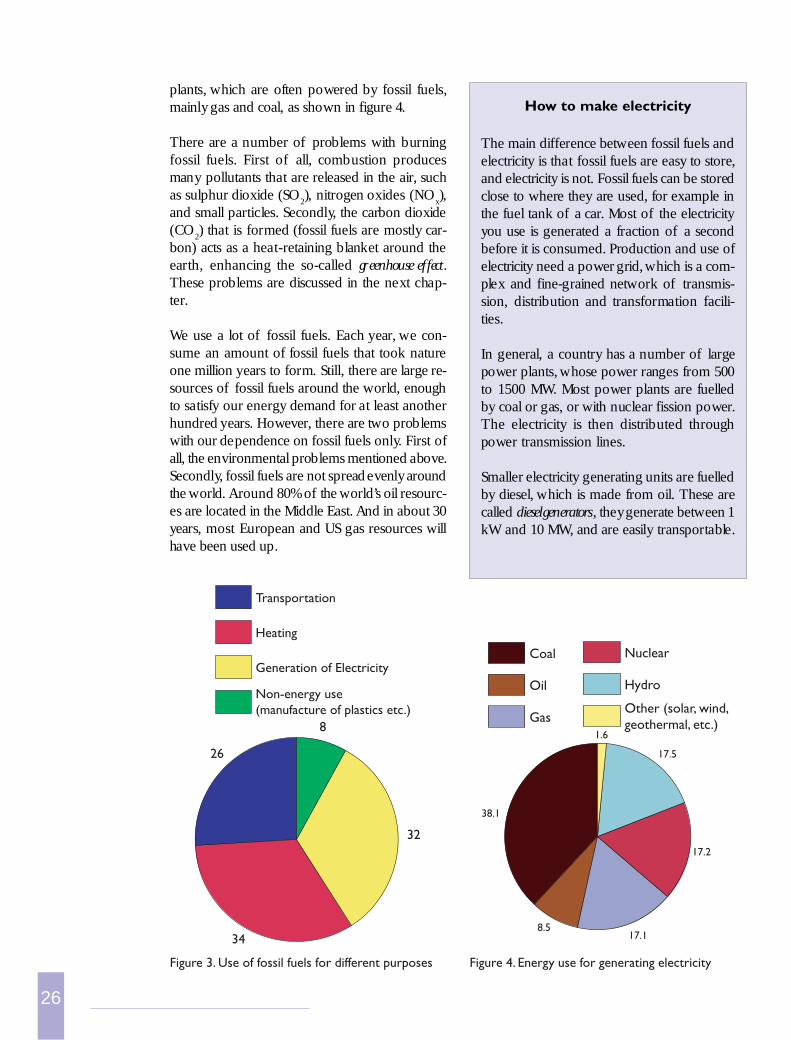
plants, which are often powered by fossil fuels,mainly gas and coal, as shown in figure 4.
There are a number of problems with burningfossil fuels. First of all, combustion producesmany pollutants that are released in the air, suchas sulphur dioxide (SO
2), nitrogen oxides (NO
x),
and small particles. Secondly, the carbon dioxide(CO
2) that is formed (fossil fuels are mostly car-
bon) acts as a heat-retaining blanket around theearth, enhancing the so-called greenhouse effect.These problems are discussed in the next chap-ter.
We use a lot of fossil fuels. Each year, we con-sume an amount of fossil fuels that took natureone million years to form. Still, there are large re-sources of fossil fuels around the world, enoughto satisfy our energy demand for at least anotherhundred years. However, there are two problemswith our dependence on fossil fuels only. First ofall, the environmental problems mentioned above.Secondly, fossil fuels are not spread evenly aroundthe world. Around 80% of the world’s oil resourc-es are located in the Middle East. And in about 30years, most European and US gas resources willhave been used up.
Figure 3. Use of fossil fuels for different purposes Figure 4. Energy use for generating electricity
How to make electricity
The main difference between fossil fuels andelectricity is that fossil fuels are easy to store,and electricity is not. Fossil fuels can be storedclose to where they are used, for example inthe fuel tank of a car. Most of the electricityyou use is generated a fraction of a secondbefore it is consumed. Production and use ofelectricity need a power grid, which is a com-plex and fine-grained network of transmis-sion, distribution and transformation facili-ties.
In general, a country has a number of largepower plants, whose power ranges from 500to 1500 MW. Most power plants are fuelledby coal or gas, or with nuclear fission power.The electricity is then distributed throughpower transmission lines.
Smaller electricity generating units are fuelledby diesel, which is made from oil. These arecalled diesel generators, they generate between 1kW and 10 MW, and are easily transportable.
Coal
Oil
Gas
Nuclear
Hydro
Other (solar, wind, geothermal, etc.)
17.5
1.6
38.1
8.517.1
17.2
Transportation
Heating
Generation of Electricity
Non-energy use (manufacture of plastics etc.)
8
32
26
34
27
Coal
Oil
Gas
Kettle
Steam
turbine
Cooling
water
Electrical
generator
Chimney
Power grid
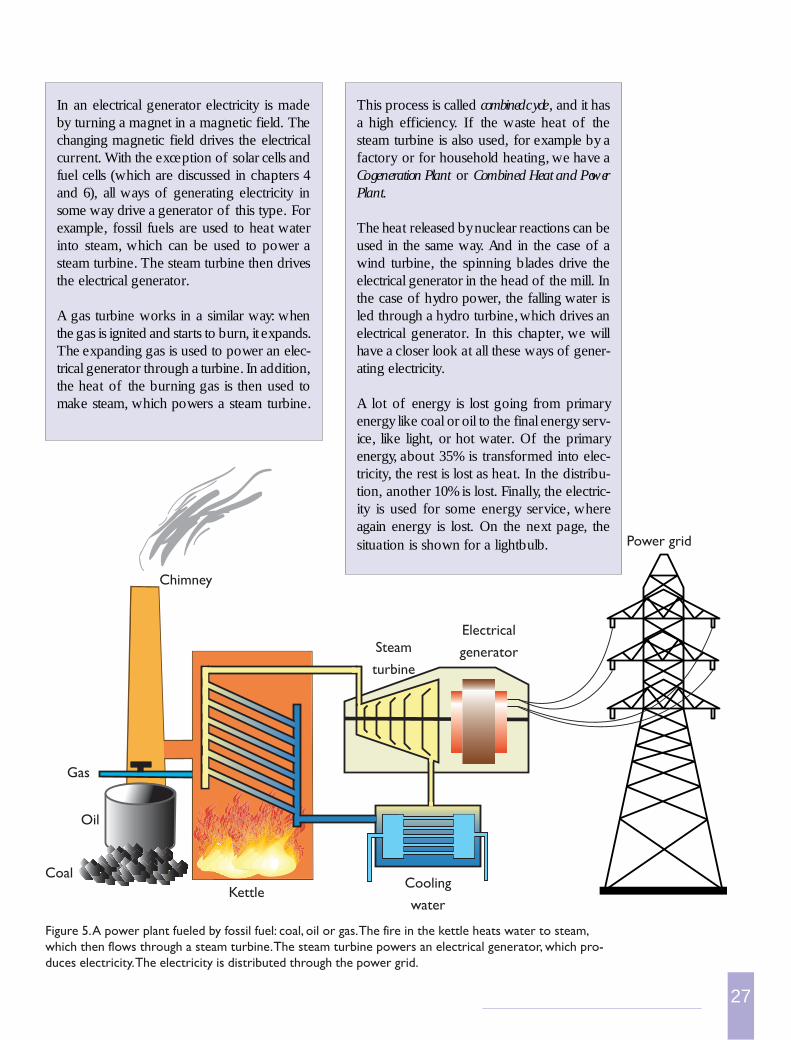
In an electrical generator electricity is madeby turning a magnet in a magnetic field. Thechanging magnetic field drives the electricalcurrent. With the exception of solar cells andfuel cells (which are discussed in chapters 4and 6), all ways of generating electricity insome way drive a generator of this type. Forexample, fossil fuels are used to heat waterinto steam, which can be used to power asteam turbine. The steam turbine then drivesthe electrical generator.
A gas turbine works in a similar way: whenthe gas is ignited and starts to burn, it expands.The expanding gas is used to power an elec-trical generator through a turbine. In addition,the heat of the burning gas is then used tomake steam, which powers a steam turbine.
Figure 5. A power plant fueled by fossil fuel: coal, oil or gas. The fire in the kettle heats water to steam,which then flows through a steam turbine. The steam turbine powers an electrical generator, which pro-duces electricity. The electricity is distributed through the power grid.
This process is called combined cycle, and it hasa high efficiency. If the waste heat of thesteam turbine is also used, for example by afactory or for household heating, we have aCogeneration Plant or Combined Heat and PowerPlant.
The heat released by nuclear reactions can beused in the same way. And in the case of awind turbine, the spinning blades drive theelectrical generator in the head of the mill. Inthe case of hydro power, the falling water isled through a hydro turbine, which drives anelectrical generator. In this chapter, we willhave a closer look at all these ways of gener-ating electricity.
A lot of energy is lost going from primaryenergy like coal or oil to the final energy serv-ice, like light, or hot water. Of the primaryenergy, about 35% is transformed into elec-tricity, the rest is lost as heat. In the distribu-tion, another 10% is lost. Finally, the electric-ity is used for some energy service, whereagain energy is lost. On the next page, thesituation is shown for a lightbulb.
28
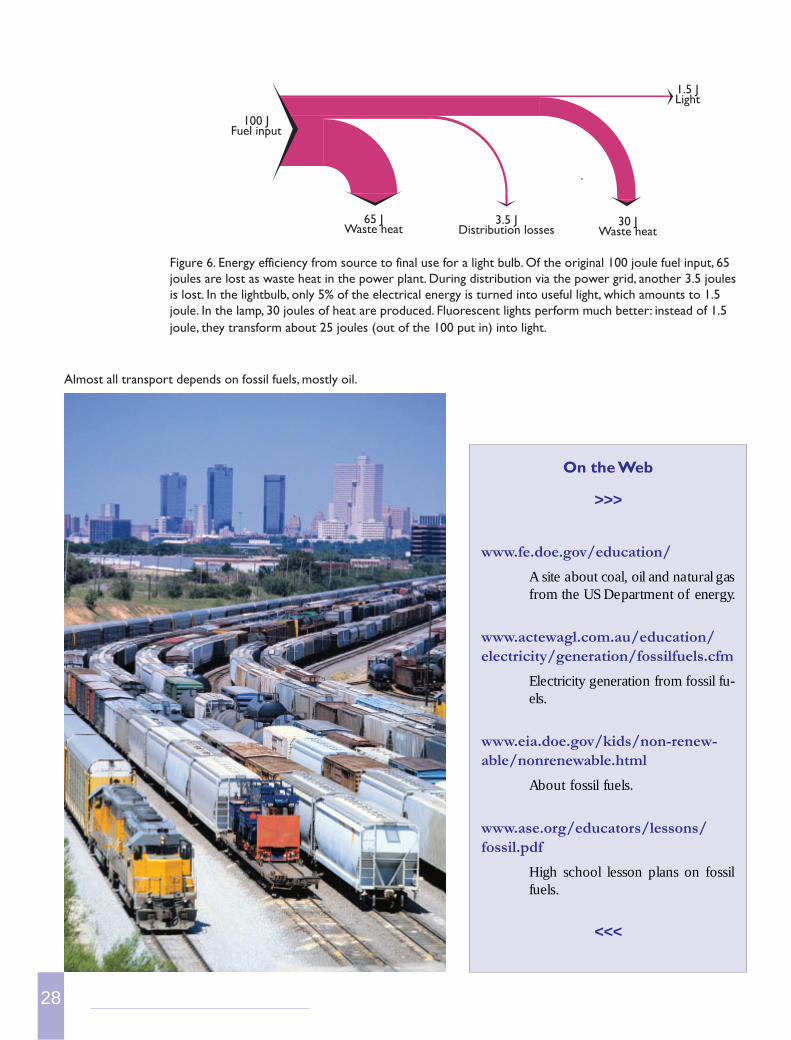
Figure 6. Energy efficiency from source to final use for a light bulb. Of the original 100 joule fuel input, 65joules are lost as waste heat in the power plant. During distribution via the power grid, another 3.5 joulesis lost. In the lightbulb, only 5% of the electrical energy is turned into useful light, which amounts to 1.5joule. In the lamp, 30 joules of heat are produced. Fluorescent lights perform much better: instead of 1.5joule, they transform about 25 joules (out of the 100 put in) into light.
Almost all transport depends on fossil fuels, mostly oil.
On the Web
>>>
www.fe.doe.gov/education/
A site about coal, oil and natural gasfrom the US Department of energy.
www.actewagl.com.au/education/electricity/generation/fossilfuels.cfm
Electricity generation from fossil fu-els.
www.eia.doe.gov/kids/non-renew-able/nonrenewable.html
About fossil fuels.
www.ase.org/educators/lessons/fossil.pdf
High school lesson plans on fossilfuels.
<<<
100 JFuel input
65 JWaste heat
3.5 JDistribution losses
30 JWaste heat
1.5 JLight
29
NUCLEAR FISSION
So far we have been dealing with fossil fuels andchemical combustion. In that case atoms rearrangethemselves into new molecules in which they aremore tightly bound, and energy is released. Sucha rearrangement is also possible among the ele-mentary particles – the protons and neutrons —that constitute the nucleus of atoms. In this case,the energy which is set free in each individual proc-ess is millions of times larger, and the total amountof material passing through a power plant basedon this principle is correspondingly thousands oftimes smaller.
There are two types of nuclear reactions whichcan lead to a release of energy: the splitting ofvery heavy nuclei, like uranium, used in fissionreactors, and the merging of very light nuclei, likehydrogen, which happens in stars and in a futurefusion reactor.
Nuclear fusion is in a sense similar to chemicalcombustion: the fuel has to be brought to a highenough temperature to ignite. Then the reactionheat, if it does not leak away too rapidly from thesource will itself be enough to maintain the tem-perature needed for the reaction. The big differ-ence is the level of temperature needed: it has tobe hundred of millions of degrees for nuclearfusion, compared to the hundreds or thousanddegrees in chemical combustion.
Nuclear fission is different: it is maintained by achain reaction. Every nucleus which splits pro-duces also a number of neutrons – for the typi-cally used reaction of Uranium-235, on the aver-age about 2.4 – which each can again trigger thefission of another nucleus. Nuclear fission is al-ready in widespread use, with nuclear power plantscovering some 17% of the world’s electricity de-mand. The material used for fission, uranium, isfound underground in the form of uranium ore.A small amount of uranium contains a lot of en-ergy: a piece the size of a golf ball can produce asmuch electricity as twenty train wagon loads fullof coal, without producing any acid rain, carbondioxide, or other polluting gasses. However, manycountries have stopped constructing new nuclearpower plants, because it has become clear thatnuclear power has some serious problems as well.
They arise essentially from the fact that the prod-ucts of the fission reaction emit radiation andproduce heat. Also the neutrons produced in thereaction can cause other atoms of the structureor the fuel to become radioactive. These materi-als have to be handled therefore with great care,and kept in a location where they cannot comeinto contact with human beings or the food chainfor a very long period (some parts for 10,000s ofyears). Stable geological formations – like under-ground salt-vaults – are believed to offer the nec-essary safety as storage locations. The fact thatthe fission products continue to emit heat also
Einstein and nuclear energy
Einstein discovered that mass can be turned into energy, and theother way round. This is expressed in his famous formula: E=mc2.In this formula, E is the energy, m is the mass, and c is the speedof light. The formula describes how much energy you get whenyou turn a mass m into energy. The speed of light is a very bignumber: 300,000,000 meters per second. The square of thatnumber is a very large number. If you change 500 kilogram ofmass into energy, you get 4.5·1019 joules of energy, which isenough to cover the whole electricity use of the world for a year.If you want to generate that much energy with fossil fuels, youneed 5 billion tons of coal! If you put that coal in a train, itwould be long enough to wrap around the earth 14 times. Thatis the power of nuclear energy.
Nuclear power plant in Borssele, the Netherlands.
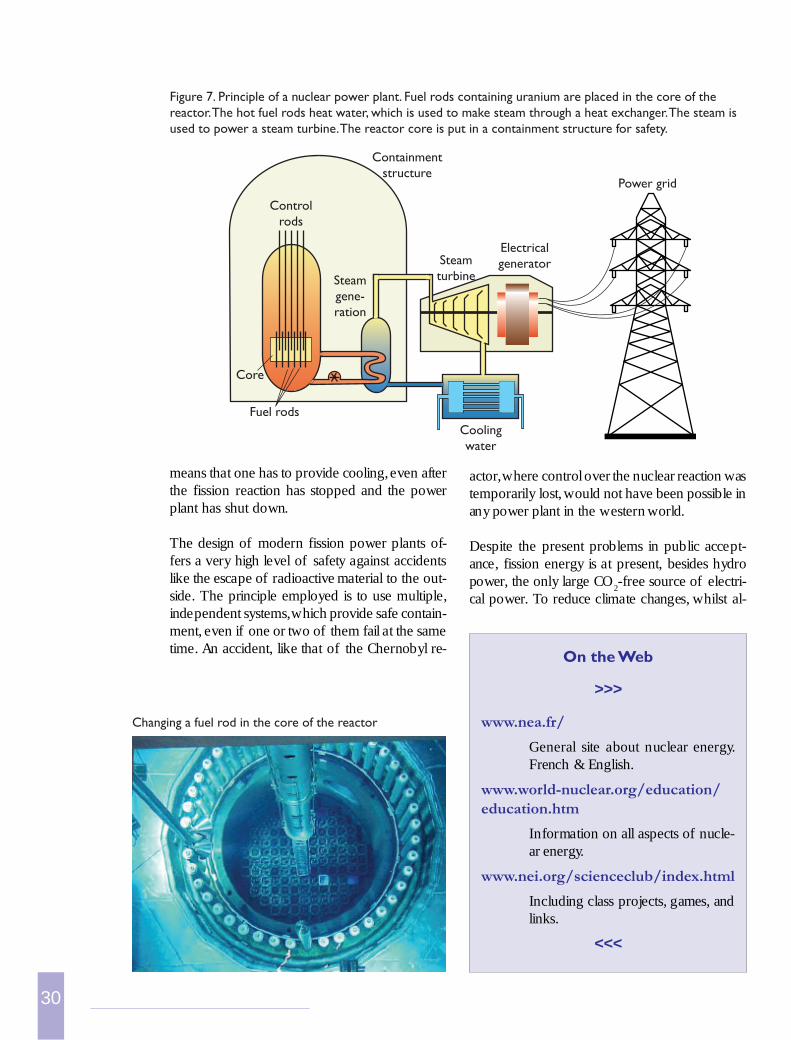
30
actor, where control over the nuclear reaction wastemporarily lost, would not have been possible inany power plant in the western world.
Despite the present problems in public accept-ance, fission energy is at present, besides hydropower, the only large CO
2-free source of electri-
cal power. To reduce climate changes, whilst al-
means that one has to provide cooling, even afterthe fission reaction has stopped and the powerplant has shut down.
The design of modern fission power plants of-fers a very high level of safety against accidentslike the escape of radioactive material to the out-side. The principle employed is to use multiple,independent systems, which provide safe contain-ment, even if one or two of them fail at the sametime. An accident, like that of the Chernobyl re-
Changing a fuel rod in the core of the reactor
Figure 7. Principle of a nuclear power plant. Fuel rods containing uranium are placed in the core of thereactor. The hot fuel rods heat water, which is used to make steam through a heat exchanger. The steam isused to power a steam turbine. The reactor core is put in a containment structure for safety.
On the Web
>>>
www.nea.fr/
General site about nuclear energy.French & English.
www.world-nuclear.org/education/education.htm
Information on all aspects of nucle-ar energy.
www.nei.org/scienceclub/index.html
Including class projects, games, andlinks.
<<<
Steamturbine
Coolingwater
Electricalgenerator
Power grid
Controlrods
Core
Containmentstructure
Steamgene-ration
Fuel rods
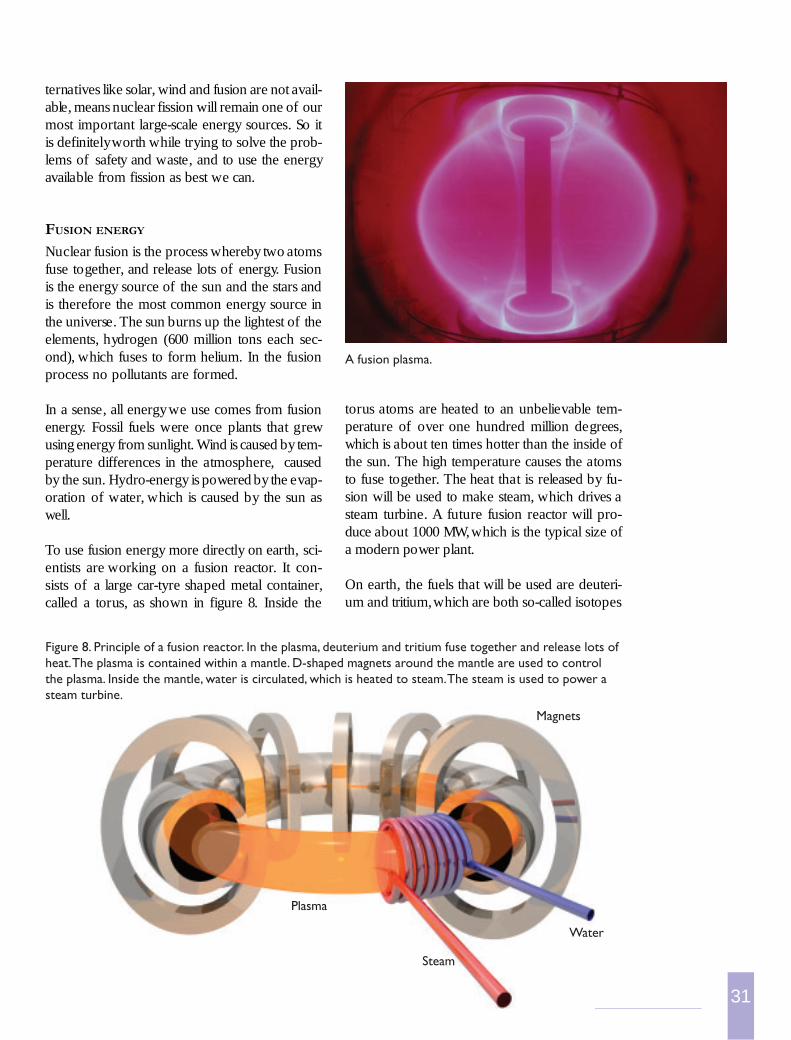
31
ternatives like solar, wind and fusion are not avail-able, means nuclear fission will remain one of ourmost important large-scale energy sources. So itis definitely worth while trying to solve the prob-lems of safety and waste, and to use the energyavailable from fission as best we can.
FUSION ENERGY
Nuclear fusion is the process whereby two atomsfuse together, and release lots of energy. Fusionis the energy source of the sun and the stars andis therefore the most common energy source inthe universe. The sun burns up the lightest of theelements, hydrogen (600 million tons each sec-ond), which fuses to form helium. In the fusionprocess no pollutants are formed.
In a sense, all energy we use comes from fusionenergy. Fossil fuels were once plants that grewusing energy from sunlight. Wind is caused by tem-perature differences in the atmosphere, causedby the sun. Hydro-energy is powered by the evap-oration of water, which is caused by the sun aswell.
To use fusion energy more directly on earth, sci-entists are working on a fusion reactor. It con-sists of a large car-tyre shaped metal container,called a torus, as shown in figure 8. Inside the
torus atoms are heated to an unbelievable tem-perature of over one hundred million degrees,which is about ten times hotter than the inside ofthe sun. The high temperature causes the atomsto fuse together. The heat that is released by fu-sion will be used to make steam, which drives asteam turbine. A future fusion reactor will pro-duce about 1000 MW, which is the typical size ofa modern power plant.
On earth, the fuels that will be used are deuteri-um and tritium, which are both so-called isotopes
A fusion plasma.
Figure 8. Principle of a fusion reactor. In the plasma, deuterium and tritium fuse together and release lots ofheat. The plasma is contained within a mantle. D-shaped magnets around the mantle are used to controlthe plasma. Inside the mantle, water is circulated, which is heated to steam. The steam is used to power asteam turbine.
Steam
Water
Plasma
Magnets
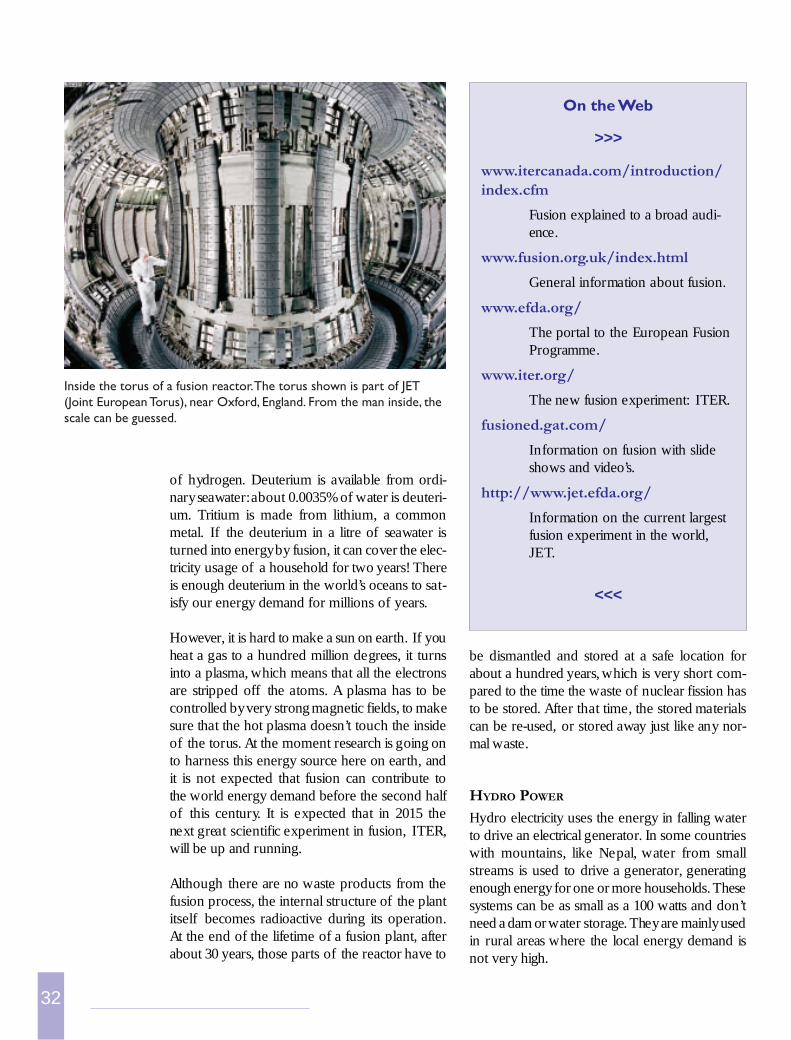
32
be dismantled and stored at a safe location forabout a hundred years, which is very short com-pared to the time the waste of nuclear fission hasto be stored. After that time, the stored materialscan be re-used, or stored away just like any nor-mal waste.
HYDRO POWER
Hydro electricity uses the energy in falling waterto drive an electrical generator. In some countrieswith mountains, like Nepal, water from smallstreams is used to drive a generator, generatingenough energy for one or more households. Thesesystems can be as small as a 100 watts and don’tneed a dam or water storage. They are mainly usedin rural areas where the local energy demand isnot very high.
of hydrogen. Deuterium is available from ordi-nary seawater: about 0.0035% of water is deuteri-um. Tritium is made from lithium, a commonmetal. If the deuterium in a litre of seawater isturned into energy by fusion, it can cover the elec-tricity usage of a household for two years! Thereis enough deuterium in the world’s oceans to sat-isfy our energy demand for millions of years.
However, it is hard to make a sun on earth. If youheat a gas to a hundred million degrees, it turnsinto a plasma, which means that all the electronsare stripped off the atoms. A plasma has to becontrolled by very strong magnetic fields, to makesure that the hot plasma doesn’t touch the insideof the torus. At the moment research is going onto harness this energy source here on earth, andit is not expected that fusion can contribute tothe world energy demand before the second halfof this century. It is expected that in 2015 thenext great scientific experiment in fusion, ITER,will be up and running.
Although there are no waste products from thefusion process, the internal structure of the plantitself becomes radioactive during its operation.At the end of the lifetime of a fusion plant, afterabout 30 years, those parts of the reactor have to
Inside the torus of a fusion reactor. The torus shown is part of JET(Joint European Torus), near Oxford, England. From the man inside, thescale can be guessed.
On the Web
>>>
www.itercanada.com/introduction/index.cfm
Fusion explained to a broad audi-ence.
www.fusion.org.uk/index.html
General information about fusion.
www.efda.org/
The portal to the European FusionProgramme.
www.iter.org/
The new fusion experiment: ITER.
fusioned.gat.com/
Information on fusion with slideshows and video’s.
http://www.jet.efda.org/
Information on the current largestfusion experiment in the world,JET.
<<<
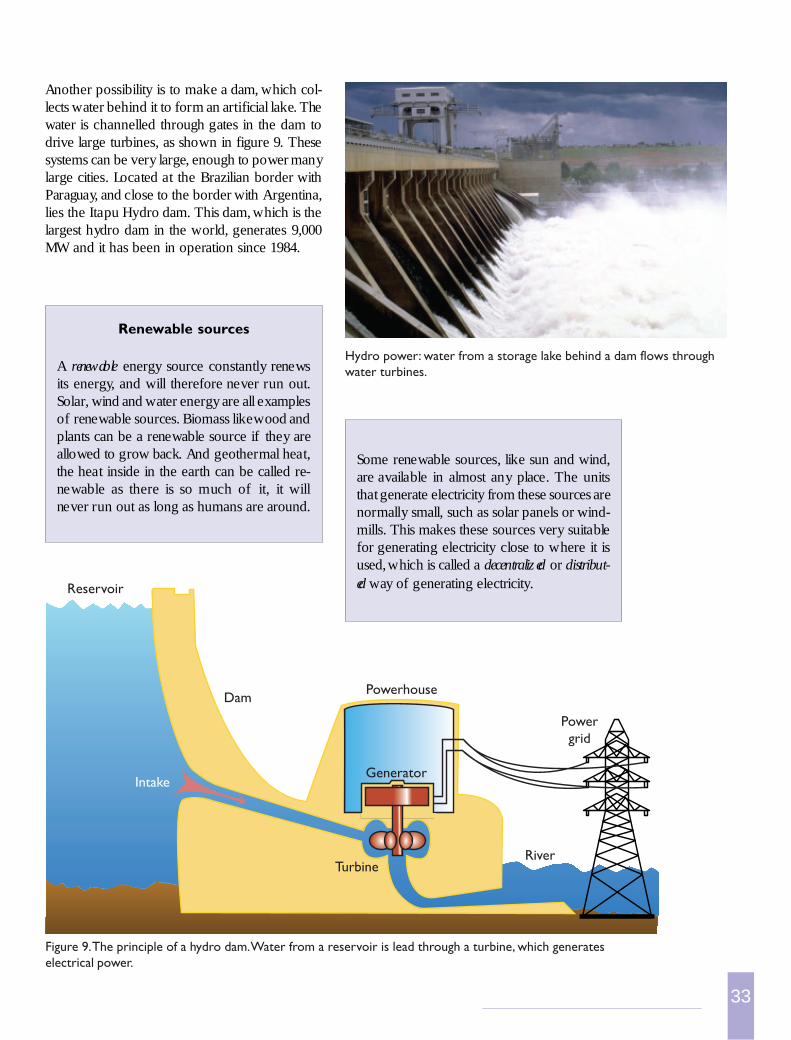
33
Reservoir
Intake
Powerhouse
Generator
Powergrid
TurbineRiver
Dam
Another possibility is to make a dam, which col-lects water behind it to form an artificial lake. Thewater is channelled through gates in the dam todrive large turbines, as shown in figure 9. Thesesystems can be very large, enough to power manylarge cities. Located at the Brazilian border withParaguay, and close to the border with Argentina,lies the Itapu Hydro dam. This dam, which is thelargest hydro dam in the world, generates 9,000MW and it has been in operation since 1984.
Hydro power: water from a storage lake behind a dam flows throughwater turbines.
Renewable sources
A renewable energy source constantly renewsits energy, and will therefore never run out.Solar, wind and water energy are all examplesof renewable sources. Biomass like wood andplants can be a renewable source if they areallowed to grow back. And geothermal heat,the heat inside in the earth can be called re-newable as there is so much of it, it willnever run out as long as humans are around.
Figure 9. The principle of a hydro dam. Water from a reservoir is lead through a turbine, which generateselectrical power.
Some renewable sources, like sun and wind,are available in almost any place. The unitsthat generate electricity from these sources arenormally small, such as solar panels or wind-mills. This makes these sources very suitablefor generating electricity close to where it isused, which is called a decentralized or distribut-ed way of generating electricity.
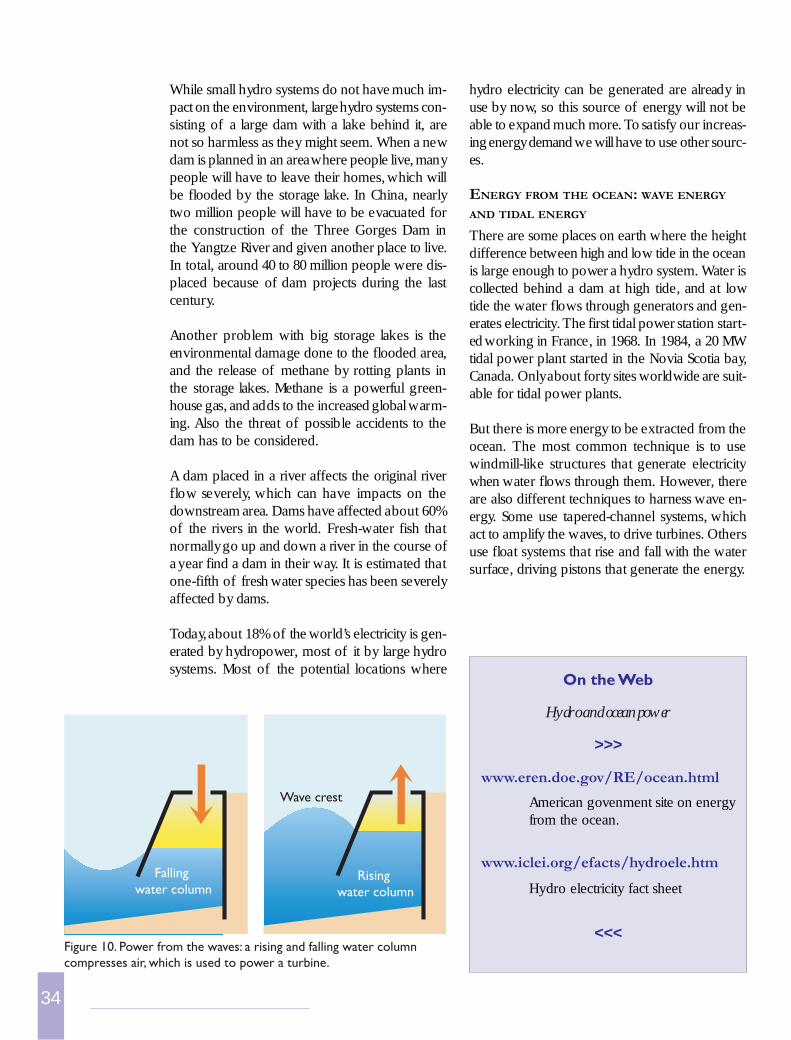
34
hydro electricity can be generated are already inuse by now, so this source of energy will not beable to expand much more. To satisfy our increas-ing energy demand we will have to use other sourc-es.
ENERGY FROM THE OCEAN: WAVE ENERGY
AND TIDAL ENERGY
There are some places on earth where the heightdifference between high and low tide in the oceanis large enough to power a hydro system. Water iscollected behind a dam at high tide, and at lowtide the water flows through generators and gen-erates electricity. The first tidal power station start-ed working in France, in 1968. In 1984, a 20 MWtidal power plant started in the Novia Scotia bay,Canada. Only about forty sites worldwide are suit-able for tidal power plants.
But there is more energy to be extracted from theocean. The most common technique is to usewindmill-like structures that generate electricitywhen water flows through them. However, thereare also different techniques to harness wave en-ergy. Some use tapered-channel systems, whichact to amplify the waves, to drive turbines. Othersuse float systems that rise and fall with the watersurface, driving pistons that generate the energy.
While small hydro systems do not have much im-pact on the environment, large hydro systems con-sisting of a large dam with a lake behind it, arenot so harmless as they might seem. When a newdam is planned in an area where people live, manypeople will have to leave their homes, which willbe flooded by the storage lake. In China, nearlytwo million people will have to be evacuated forthe construction of the Three Gorges Dam inthe Yangtze River and given another place to live.In total, around 40 to 80 million people were dis-placed because of dam projects during the lastcentury.
Another problem with big storage lakes is theenvironmental damage done to the flooded area,and the release of methane by rotting plants inthe storage lakes. Methane is a powerful green-house gas, and adds to the increased global warm-ing. Also the threat of possible accidents to thedam has to be considered.
A dam placed in a river affects the original riverflow severely, which can have impacts on thedownstream area. Dams have affected about 60%of the rivers in the world. Fresh-water fish thatnormally go up and down a river in the course ofa year find a dam in their way. It is estimated thatone-fifth of fresh water species has been severelyaffected by dams.
Today, about 18% of the world’s electricity is gen-erated by hydropower, most of it by large hydrosystems. Most of the potential locations where
Figure 10. Power from the waves: a rising and falling water columncompresses air, which is used to power a turbine.
On the Web
Hydro and ocean power
>>>
www.eren.doe.gov/RE/ocean.html
American govenment site on energyfrom the ocean.
www.iclei.org/efacts/hydroele.htm
Hydro electricity fact sheet
<<<
Falling water column
Rising water column
Wave crest
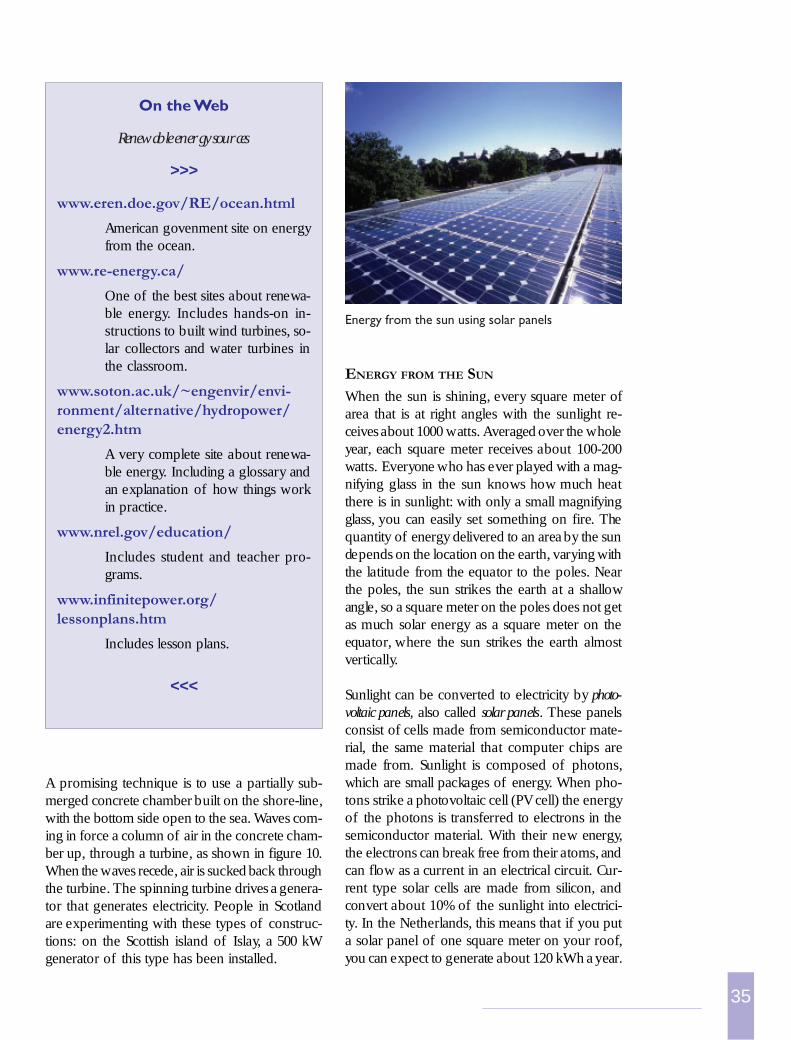
35
A promising technique is to use a partially sub-merged concrete chamber built on the shore-line,with the bottom side open to the sea. Waves com-ing in force a column of air in the concrete cham-ber up, through a turbine, as shown in figure 10.When the waves recede, air is sucked back throughthe turbine. The spinning turbine drives a genera-tor that generates electricity. People in Scotlandare experimenting with these types of construc-tions: on the Scottish island of Islay, a 500 kWgenerator of this type has been installed.
ENERGY FROM THE SUN
When the sun is shining, every square meter ofarea that is at right angles with the sunlight re-ceives about 1000 watts. Averaged over the wholeyear, each square meter receives about 100-200watts. Everyone who has ever played with a mag-nifying glass in the sun knows how much heatthere is in sunlight: with only a small magnifyingglass, you can easily set something on fire. Thequantity of energy delivered to an area by the sundepends on the location on the earth, varying withthe latitude from the equator to the poles. Nearthe poles, the sun strikes the earth at a shallowangle, so a square meter on the poles does not getas much solar energy as a square meter on theequator, where the sun strikes the earth almostvertically.
Sunlight can be converted to electricity by photo-voltaic panels, also called solar panels. These panelsconsist of cells made from semiconductor mate-rial, the same material that computer chips aremade from. Sunlight is composed of photons,which are small packages of energy. When pho-tons strike a photovoltaic cell (PV cell) the energyof the photons is transferred to electrons in thesemiconductor material. With their new energy,the electrons can break free from their atoms, andcan flow as a current in an electrical circuit. Cur-rent type solar cells are made from silicon, andconvert about 10% of the sunlight into electrici-ty. In the Netherlands, this means that if you puta solar panel of one square meter on your roof,you can expect to generate about 120 kWh a year.
Energy from the sun using solar panels
On the Web
Renewable energy sources
>>>
www.eren.doe.gov/RE/ocean.html
American govenment site on energyfrom the ocean.
www.re-energy.ca/
One of the best sites about renewa-ble energy. Includes hands-on in-structions to built wind turbines, so-lar collectors and water turbines inthe classroom.
www.soton.ac.uk/~engenvir/envi-ronment/alternative/hydropower/energy2.htm
A very complete site about renewa-ble energy. Including a glossary andan explanation of how things workin practice.
www.nrel.gov/education/
Includes student and teacher pro-grams.
www.infinitepower.org/lessonplans.htm
Includes lesson plans.
<<<
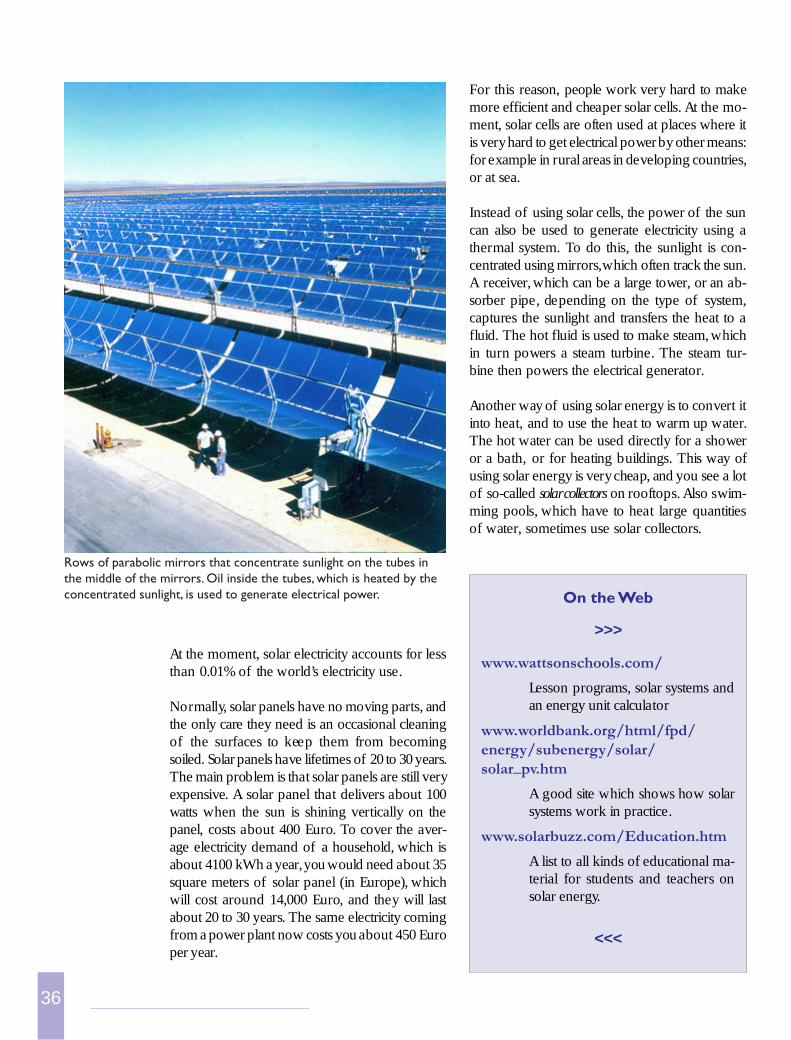
36
For this reason, people work very hard to makemore efficient and cheaper solar cells. At the mo-ment, solar cells are often used at places where itis very hard to get electrical power by other means:for example in rural areas in developing countries,or at sea.
Instead of using solar cells, the power of the suncan also be used to generate electricity using athermal system. To do this, the sunlight is con-centrated using mirrors, which often track the sun.A receiver, which can be a large tower, or an ab-sorber pipe, depending on the type of system,captures the sunlight and transfers the heat to afluid. The hot fluid is used to make steam, whichin turn powers a steam turbine. The steam tur-bine then powers the electrical generator.
Another way of using solar energy is to convert itinto heat, and to use the heat to warm up water.The hot water can be used directly for a showeror a bath, or for heating buildings. This way ofusing solar energy is very cheap, and you see a lotof so-called solar collectors on rooftops. Also swim-ming pools, which have to heat large quantitiesof water, sometimes use solar collectors.
At the moment, solar electricity accounts for lessthan 0.01% of the world’s electricity use.
Normally, solar panels have no moving parts, andthe only care they need is an occasional cleaningof the surfaces to keep them from becomingsoiled. Solar panels have lifetimes of 20 to 30 years.The main problem is that solar panels are still veryexpensive. A solar panel that delivers about 100watts when the sun is shining vertically on thepanel, costs about 400 Euro. To cover the aver-age electricity demand of a household, which isabout 4100 kWh a year, you would need about 35square meters of solar panel (in Europe), whichwill cost around 14,000 Euro, and they will lastabout 20 to 30 years. The same electricity comingfrom a power plant now costs you about 450 Europer year.
Rows of parabolic mirrors that concentrate sunlight on the tubes inthe middle of the mirrors. Oil inside the tubes, which is heated by theconcentrated sunlight, is used to generate electrical power. On the Web
>>>
www.wattsonschools.com/
Lesson programs, solar systems andan energy unit calculator
www.worldbank.org/html/fpd/energy/subenergy/solar/solar_pv.htm
A good site which shows how solarsystems work in practice.
www.solarbuzz.com/Education.htm
A list to all kinds of educational ma-terial for students and teachers onsolar energy.
<<<
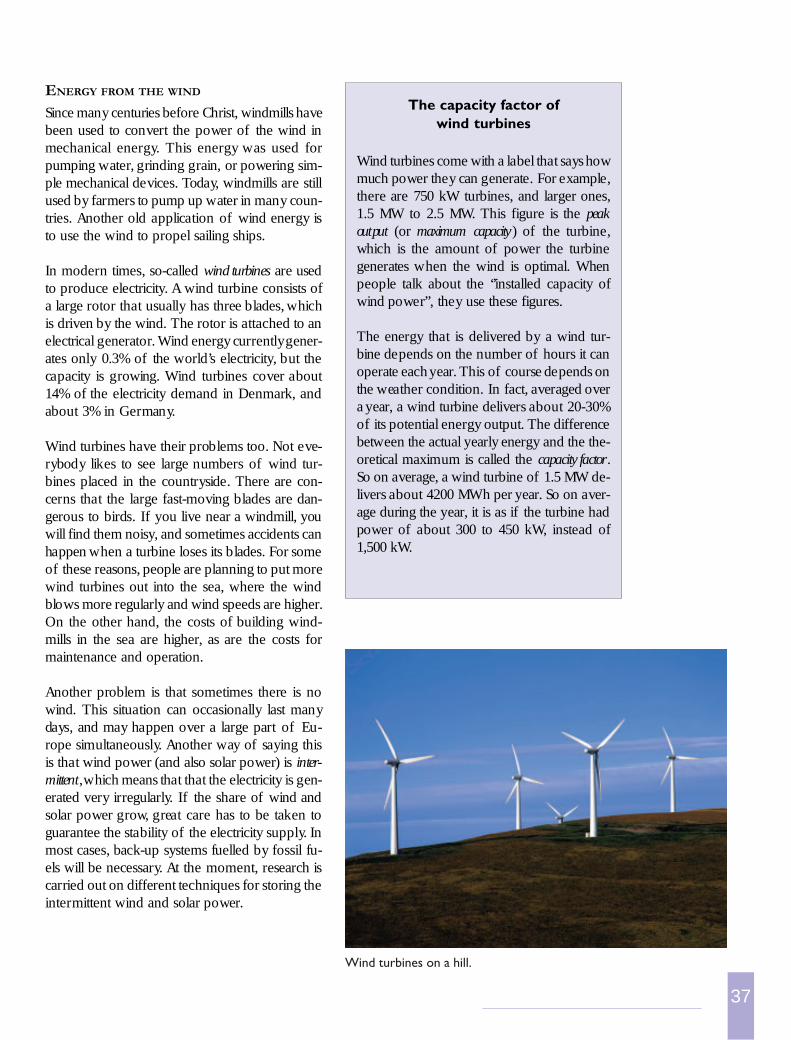
37
ENERGY FROM THE WIND
Since many centuries before Christ, windmills havebeen used to convert the power of the wind inmechanical energy. This energy was used forpumping water, grinding grain, or powering sim-ple mechanical devices. Today, windmills are stillused by farmers to pump up water in many coun-tries. Another old application of wind energy isto use the wind to propel sailing ships.
In modern times, so-called wind turbines are usedto produce electricity. A wind turbine consists ofa large rotor that usually has three blades, whichis driven by the wind. The rotor is attached to anelectrical generator. Wind energy currently gener-ates only 0.3% of the world’s electricity, but thecapacity is growing. Wind turbines cover about14% of the electricity demand in Denmark, andabout 3% in Germany.
Wind turbines have their problems too. Not eve-rybody likes to see large numbers of wind tur-bines placed in the countryside. There are con-cerns that the large fast-moving blades are dan-gerous to birds. If you live near a windmill, youwill find them noisy, and sometimes accidents canhappen when a turbine loses its blades. For someof these reasons, people are planning to put morewind turbines out into the sea, where the windblows more regularly and wind speeds are higher.On the other hand, the costs of building wind-mills in the sea are higher, as are the costs formaintenance and operation.
Another problem is that sometimes there is nowind. This situation can occasionally last manydays, and may happen over a large part of Eu-rope simultaneously. Another way of saying thisis that wind power (and also solar power) is inter-mittent, which means that that the electricity is gen-erated very irregularly. If the share of wind andsolar power grow, great care has to be taken toguarantee the stability of the electricity supply. Inmost cases, back-up systems fuelled by fossil fu-els will be necessary. At the moment, research iscarried out on different techniques for storing theintermittent wind and solar power.
The capacity factor ofwind turbines
Wind turbines come with a label that says howmuch power they can generate. For example,there are 750 kW turbines, and larger ones,1.5 MW to 2.5 MW. This figure is the peakoutput (or maximum capacity) of the turbine,which is the amount of power the turbinegenerates when the wind is optimal. Whenpeople talk about the ‘’installed capacity ofwind power”, they use these figures.
The energy that is delivered by a wind tur-bine depends on the number of hours it canoperate each year. This of course depends onthe weather condition. In fact, averaged overa year, a wind turbine delivers about 20-30%of its potential energy output. The differencebetween the actual yearly energy and the the-oretical maximum is called the capacity factor.So on average, a wind turbine of 1.5 MW de-livers about 4200 MWh per year. So on aver-age during the year, it is as if the turbine hadpower of about 300 to 450 kW, instead of1,500 kW.
Wind turbines on a hill.
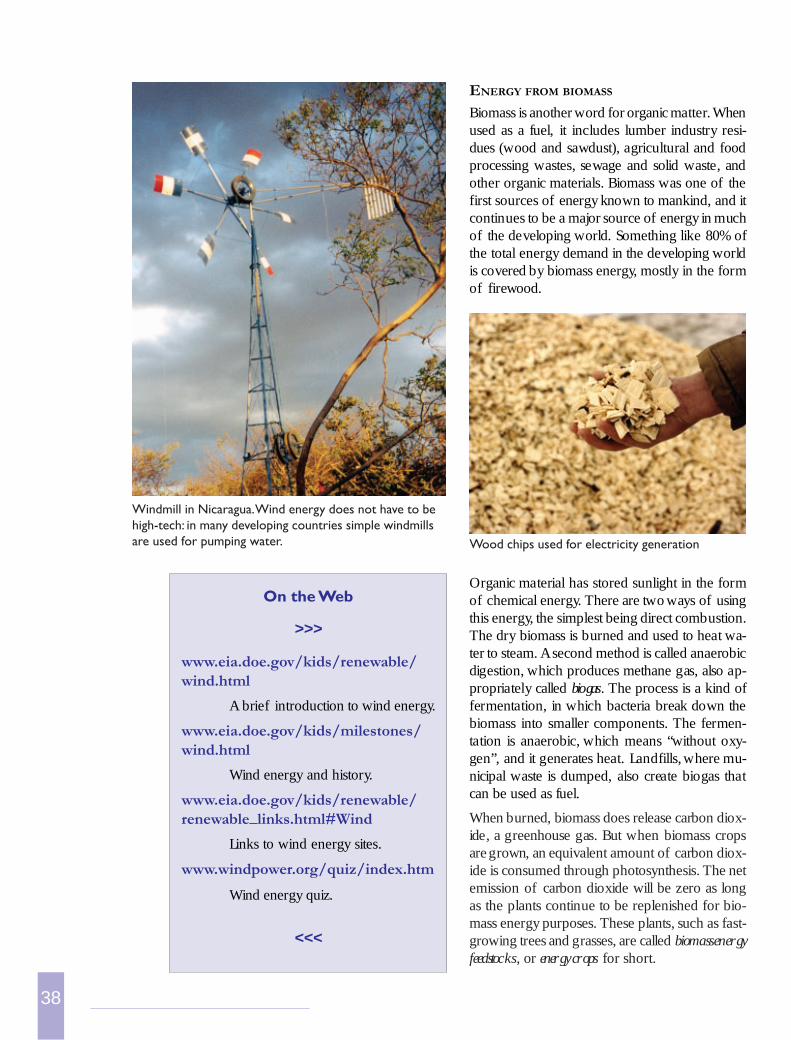
38
ENERGY FROM BIOMASS
Biomass is another word for organic matter. Whenused as a fuel, it includes lumber industry resi-dues (wood and sawdust), agricultural and foodprocessing wastes, sewage and solid waste, andother organic materials. Biomass was one of thefirst sources of energy known to mankind, and itcontinues to be a major source of energy in muchof the developing world. Something like 80% ofthe total energy demand in the developing worldis covered by biomass energy, mostly in the formof firewood.
On the Web
>>>
www.eia.doe.gov/kids/renewable/wind.html
A brief introduction to wind energy.
www.eia.doe.gov/kids/milestones/wind.html
Wind energy and history.
www.eia.doe.gov/kids/renewable/renewable_links.html#Wind
Links to wind energy sites.
www.windpower.org/quiz/index.htm
Wind energy quiz.
<<<
Organic material has stored sunlight in the formof chemical energy. There are two ways of usingthis energy, the simplest being direct combustion.The dry biomass is burned and used to heat wa-ter to steam. A second method is called anaerobicdigestion, which produces methane gas, also ap-propriately called biogas. The process is a kind offermentation, in which bacteria break down thebiomass into smaller components. The fermen-tation is anaerobic, which means “without oxy-gen”, and it generates heat. Landfills, where mu-nicipal waste is dumped, also create biogas thatcan be used as fuel.
When burned, biomass does release carbon diox-ide, a greenhouse gas. But when biomass cropsare grown, an equivalent amount of carbon diox-ide is consumed through photosynthesis. The netemission of carbon dioxide will be zero as longas the plants continue to be replenished for bio-mass energy purposes. These plants, such as fast-growing trees and grasses, are called biomass energyfeedstocks, or energy crops for short.
Windmill in Nicaragua. Wind energy does not have to behigh-tech: in many developing countries simple windmillsare used for pumping water. Wood chips used for electricity generation
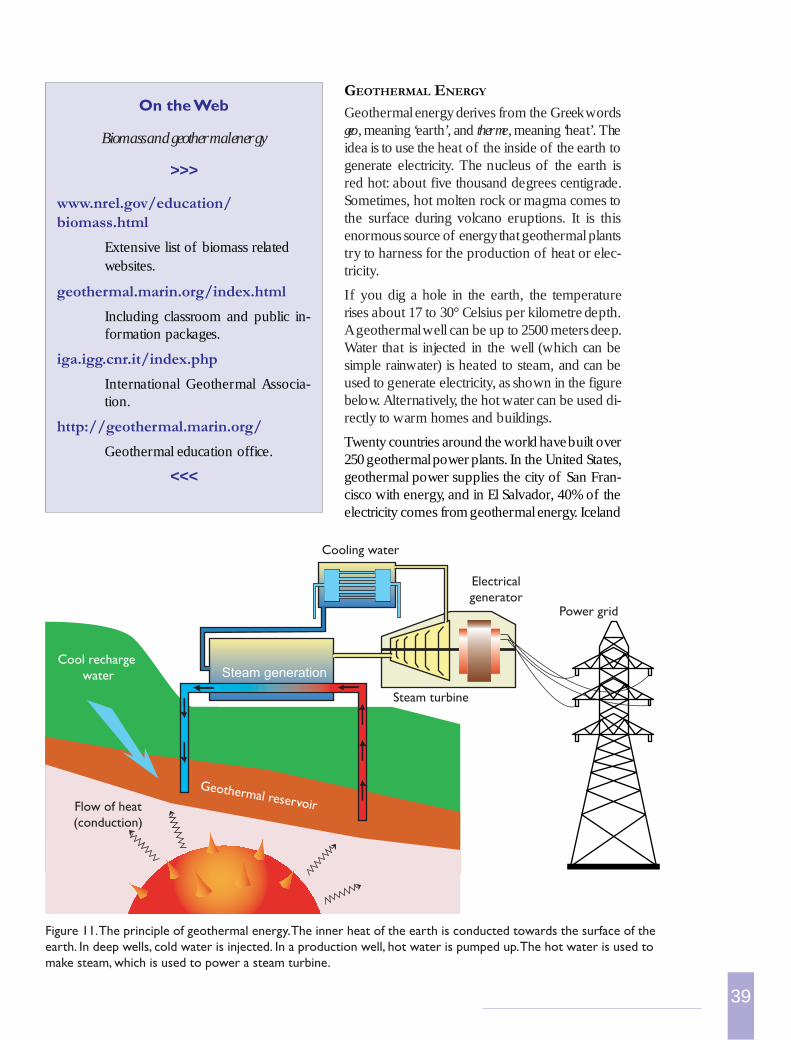
39
GEOTHERMAL ENERGY
Geothermal energy derives from the Greek wordsgeo, meaning ‘earth’, and therme, meaning ‘heat’. Theidea is to use the heat of the inside of the earth togenerate electricity. The nucleus of the earth isred hot: about five thousand degrees centigrade.Sometimes, hot molten rock or magma comes tothe surface during volcano eruptions. It is thisenormous source of energy that geothermal plantstry to harness for the production of heat or elec-tricity.
If you dig a hole in the earth, the temperaturerises about 17 to 30° Celsius per kilometre depth.A geothermal well can be up to 2500 meters deep.Water that is injected in the well (which can besimple rainwater) is heated to steam, and can beused to generate electricity, as shown in the figurebelow. Alternatively, the hot water can be used di-rectly to warm homes and buildings.
Twenty countries around the world have built over250 geothermal power plants. In the United States,geothermal power supplies the city of San Fran-cisco with energy, and in El Salvador, 40% of theelectricity comes from geothermal energy. Iceland
On the Web
Biomass and geothermal energy
>>>
www.nrel.gov/education/biomass.html
Extensive list of biomass relatedwebsites.
geothermal.marin.org/index.html
Including classroom and public in-formation packages.
iga.igg.cnr.it/index.php
International Geothermal Associa-tion.
http://geothermal.marin.org/
Geothermal education office.
<<<
Figure 11. The principle of geothermal energy. The inner heat of the earth is conducted towards the surface of theearth. In deep wells, cold water is injected. In a production well, hot water is pumped up. The hot water is used tomake steam, which is used to power a steam turbine.
Cooling water
Steam turbine
Electricalgenerator
Power grid
Steam generation
Geothermal reservoirFlow of heat(conduction)
Cool recharge water
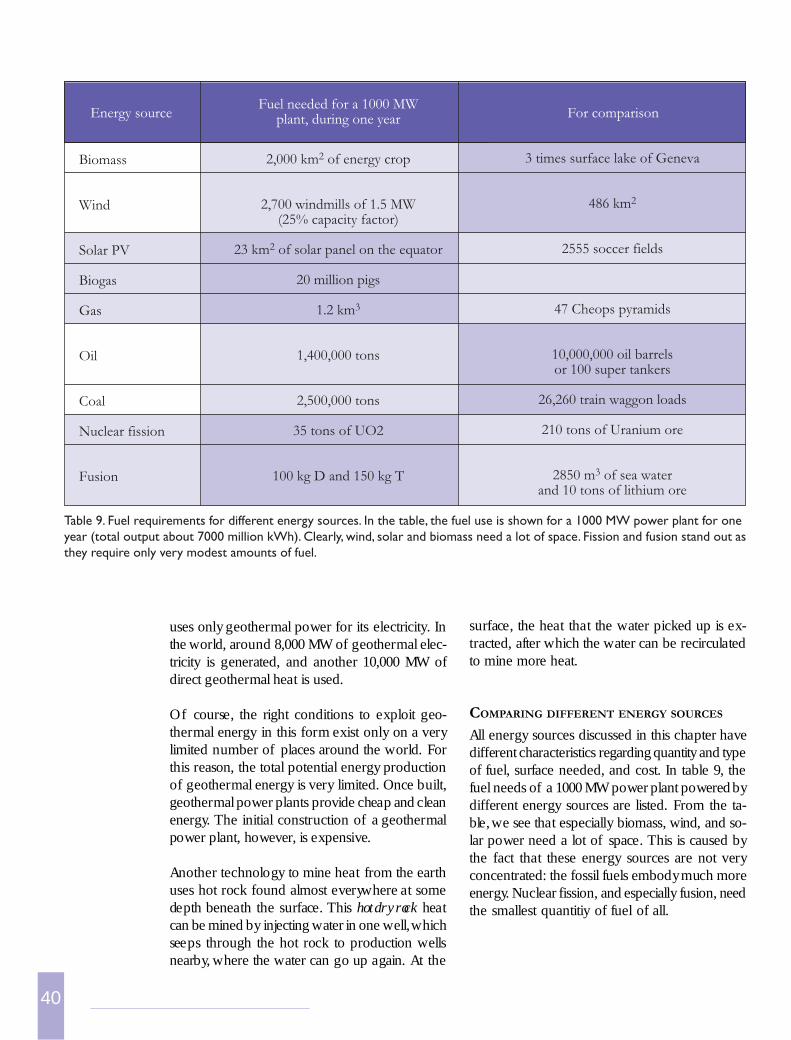
40
Table 9. Fuel requirements for different energy sources. In the table, the fuel use is shown for a 1000 MW power plant for oneyear (total output about 7000 million kWh). Clearly, wind, solar and biomass need a lot of space. Fission and fusion stand out asthey require only very modest amounts of fuel.
uses only geothermal power for its electricity. Inthe world, around 8,000 MW of geothermal elec-tricity is generated, and another 10,000 MW ofdirect geothermal heat is used.
Of course, the right conditions to exploit geo-thermal energy in this form exist only on a verylimited number of places around the world. Forthis reason, the total potential energy productionof geothermal energy is very limited. Once built,geothermal power plants provide cheap and cleanenergy. The initial construction of a geothermalpower plant, however, is expensive.
Another technology to mine heat from the earthuses hot rock found almost everywhere at somedepth beneath the surface. This hot dry rock heatcan be mined by injecting water in one well, whichseeps through the hot rock to production wellsnearby, where the water can go up again. At the
surface, the heat that the water picked up is ex-tracted, after which the water can be recirculatedto mine more heat.
COMPARING DIFFERENT ENERGY SOURCES
All energy sources discussed in this chapter havedifferent characteristics regarding quantity and typeof fuel, surface needed, and cost. In table 9, thefuel needs of a 1000 MW power plant powered bydifferent energy sources are listed. From the ta-ble, we see that especially biomass, wind, and so-lar power need a lot of space. This is caused bythe fact that these energy sources are not veryconcentrated: the fossil fuels embody much moreenergy. Nuclear fission, and especially fusion, needthe smallest quantitiy of fuel of all.
Biomass
Wind
Solar PV
Biogas
Gas
Oil
Coal
Nuclear fission
Fusion
2,000 km2 of energy crop
2,700 windmills of 1.5 MW(25% capacity factor)
23 km2 of solar panel on the equator
20 million pigs
1.2 km3
1,400,000 tons
2,500,000 tons
35 tons of UO2
100 kg D and 150 kg T
3 times surface lake of Geneva
486 km2
2555 soccer fields
47 Cheops pyramids
10,000,000 oil barrelsor 100 super tankers
26,260 train waggon loads
210 tons of Uranium ore
2850 m3 of sea waterand 10 tons of lithium ore
Fuel needed for a 1000 MWplant, during one year For comparisonEnergy source
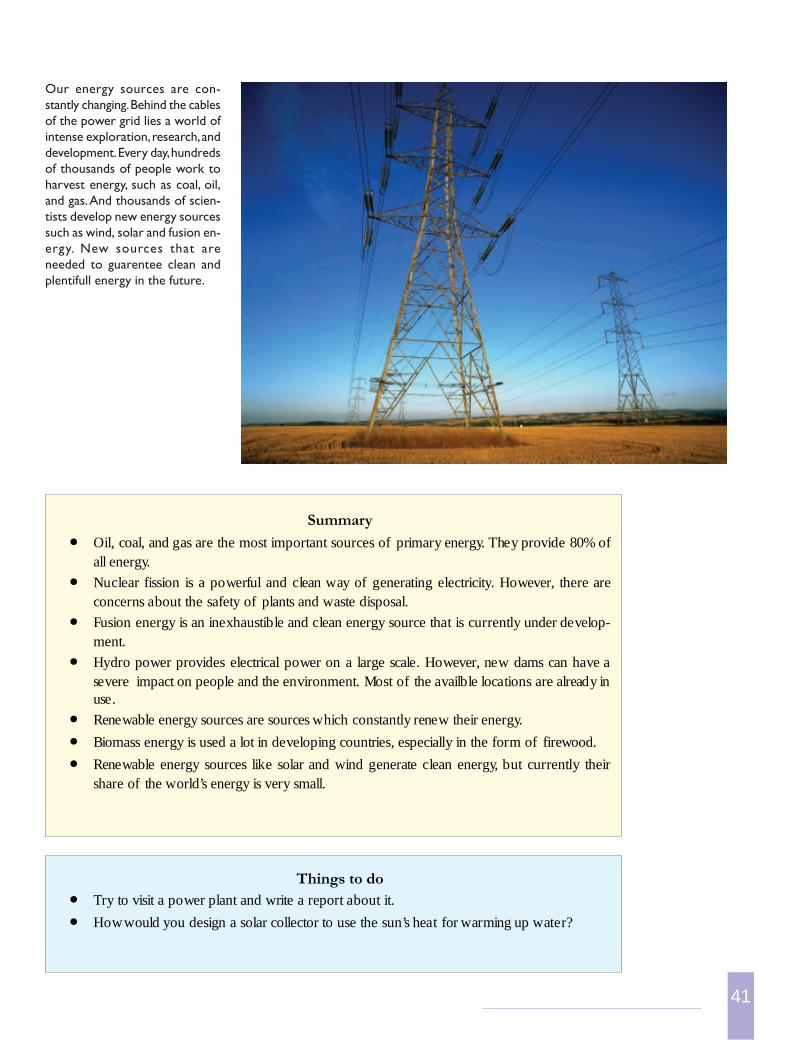
41
Summary
• Oil, coal, and gas are the most important sources of primary energy. They provide 80% ofall energy.
• Nuclear fission is a powerful and clean way of generating electricity. However, there areconcerns about the safety of plants and waste disposal.
• Fusion energy is an inexhaustible and clean energy source that is currently under develop-ment.
• Hydro power provides electrical power on a large scale. However, new dams can have asevere impact on people and the environment. Most of the availble locations are already inuse.
• Renewable energy sources are sources which constantly renew their energy.
• Biomass energy is used a lot in developing countries, especially in the form of firewood.
• Renewable energy sources like solar and wind generate clean energy, but currently theirshare of the world’s energy is very small.
Things to do• Try to visit a power plant and write a report about it.
• How would you design a solar collector to use the sun’s heat for warming up water?
Our energy sources are con-stantly changing. Behind the cablesof the power grid lies a world ofintense exploration, research, anddevelopment. Every day, hundredsof thousands of people work toharvest energy, such as coal, oil,and gas. And thousands of scien-tists develop new energy sourcessuch as wind, solar and fusion en-ergy. New sources that areneeded to guarentee clean andplentifull energy in the future.
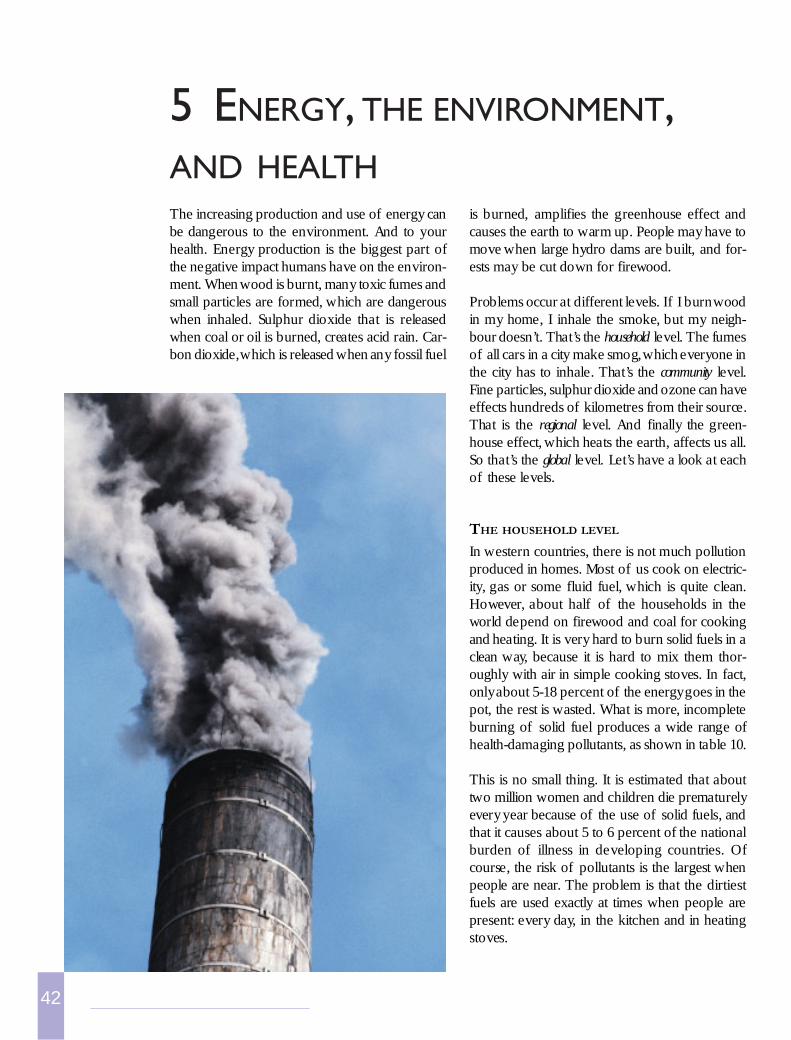
42
is burned, amplifies the greenhouse effect andcauses the earth to warm up. People may have tomove when large hydro dams are built, and for-ests may be cut down for firewood.
Problems occur at different levels. If I burn woodin my home, I inhale the smoke, but my neigh-bour doesn’t. That’s the household level. The fumesof all cars in a city make smog, which everyone inthe city has to inhale. That’s the community level.Fine particles, sulphur dioxide and ozone can haveeffects hundreds of kilometres from their source.That is the regional level. And finally the green-house effect, which heats the earth, affects us all.So that’s the global level. Let’s have a look at eachof these levels.
THE HOUSEHOLD LEVEL
In western countries, there is not much pollutionproduced in homes. Most of us cook on electric-ity, gas or some fluid fuel, which is quite clean.However, about half of the households in theworld depend on firewood and coal for cookingand heating. It is very hard to burn solid fuels in aclean way, because it is hard to mix them thor-oughly with air in simple cooking stoves. In fact,only about 5-18 percent of the energy goes in thepot, the rest is wasted. What is more, incompleteburning of solid fuel produces a wide range ofhealth-damaging pollutants, as shown in table 10.
This is no small thing. It is estimated that abouttwo million women and children die prematurelyevery year because of the use of solid fuels, andthat it causes about 5 to 6 percent of the nationalburden of illness in developing countries. Ofcourse, the risk of pollutants is the largest whenpeople are near. The problem is that the dirtiestfuels are used exactly at times when people arepresent: every day, in the kitchen and in heatingstoves.
The increasing production and use of energy canbe dangerous to the environment. And to yourhealth. Energy production is the biggest part ofthe negative impact humans have on the environ-ment. When wood is burnt, many toxic fumes andsmall particles are formed, which are dangerouswhen inhaled. Sulphur dioxide that is releasedwhen coal or oil is burned, creates acid rain. Car-bon dioxide, which is released when any fossil fuel
5 ENERGY, THE ENVIRONMENT,AND HEALTH
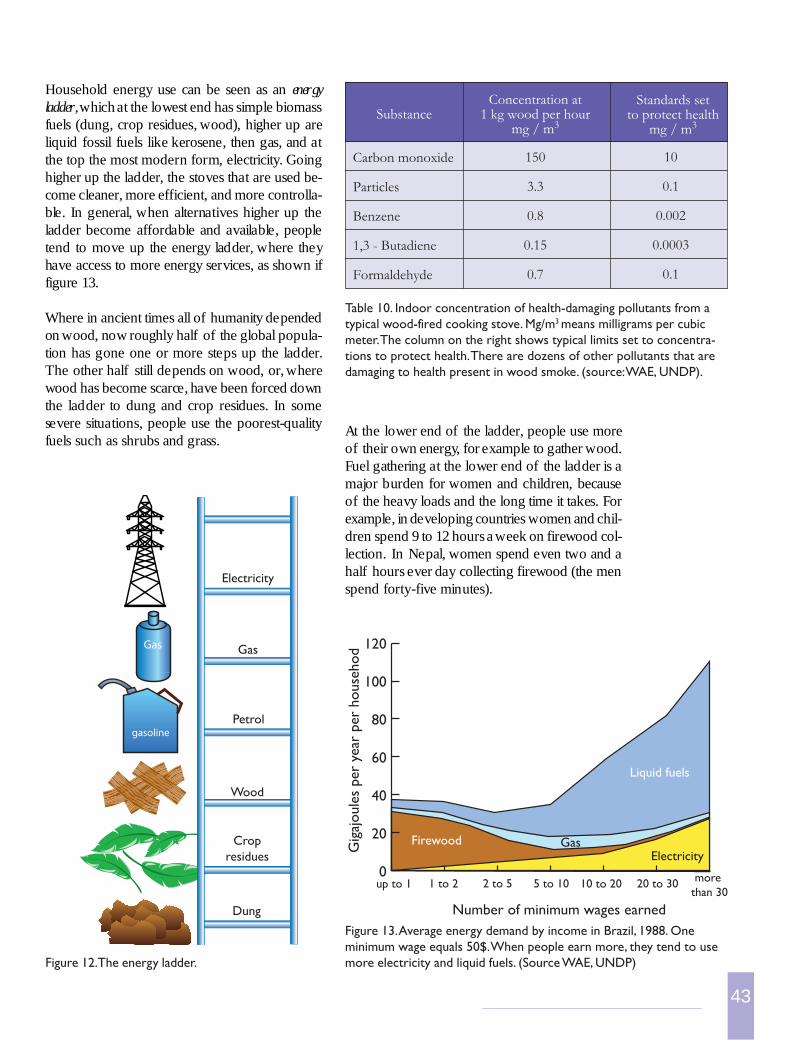
43
At the lower end of the ladder, people use moreof their own energy, for example to gather wood.Fuel gathering at the lower end of the ladder is amajor burden for women and children, becauseof the heavy loads and the long time it takes. Forexample, in developing countries women and chil-dren spend 9 to 12 hours a week on firewood col-lection. In Nepal, women spend even two and ahalf hours ever day collecting firewood (the menspend forty-five minutes).
Household energy use can be seen as an energyladder, which at the lowest end has simple biomassfuels (dung, crop residues, wood), higher up areliquid fossil fuels like kerosene, then gas, and atthe top the most modern form, electricity. Goinghigher up the ladder, the stoves that are used be-come cleaner, more efficient, and more controlla-ble. In general, when alternatives higher up theladder become affordable and available, peopletend to move up the energy ladder, where theyhave access to more energy services, as shown iffigure 13.
Where in ancient times all of humanity dependedon wood, now roughly half of the global popula-tion has gone one or more steps up the ladder.The other half still depends on wood, or, wherewood has become scarce, have been forced downthe ladder to dung and crop residues. In somesevere situations, people use the poorest-qualityfuels such as shrubs and grass.
Table 10. Indoor concentration of health-damaging pollutants from atypical wood-fired cooking stove. Mg/m3 means milligrams per cubicmeter. The column on the right shows typical limits set to concentra-tions to protect health. There are dozens of other pollutants that aredamaging to health present in wood smoke. (source: WAE, UNDP).
Figure 12. The energy ladder.
Figure 13. Average energy demand by income in Brazil, 1988. Oneminimum wage equals 50$. When people earn more, they tend to usemore electricity and liquid fuels. (Source WAE, UNDP)
0
20
40
60
80
100
120
up to 1 1 to 2 2 to 5 5 to 10 20 to 30more
than 3010 to 20
Firewood GasElectricity
Liquid fuels
Number of minimum wages earned
Gig
ajoule
s per
yea
r per
house
hod
gasoline
Gas
Electricity
Gas
Petrol
Wood
Cropresidues
Dung
Carbon monoxide
Particles
Benzene
1,3 - Butadiene
Formaldehyde
150
3.3
0.8
0.15
0.7
10
0.1
0.002
0.0003
0.1
Concentration at1 kg wood per hour
mg / m3
Standards setto protect health
mg / m3Substance
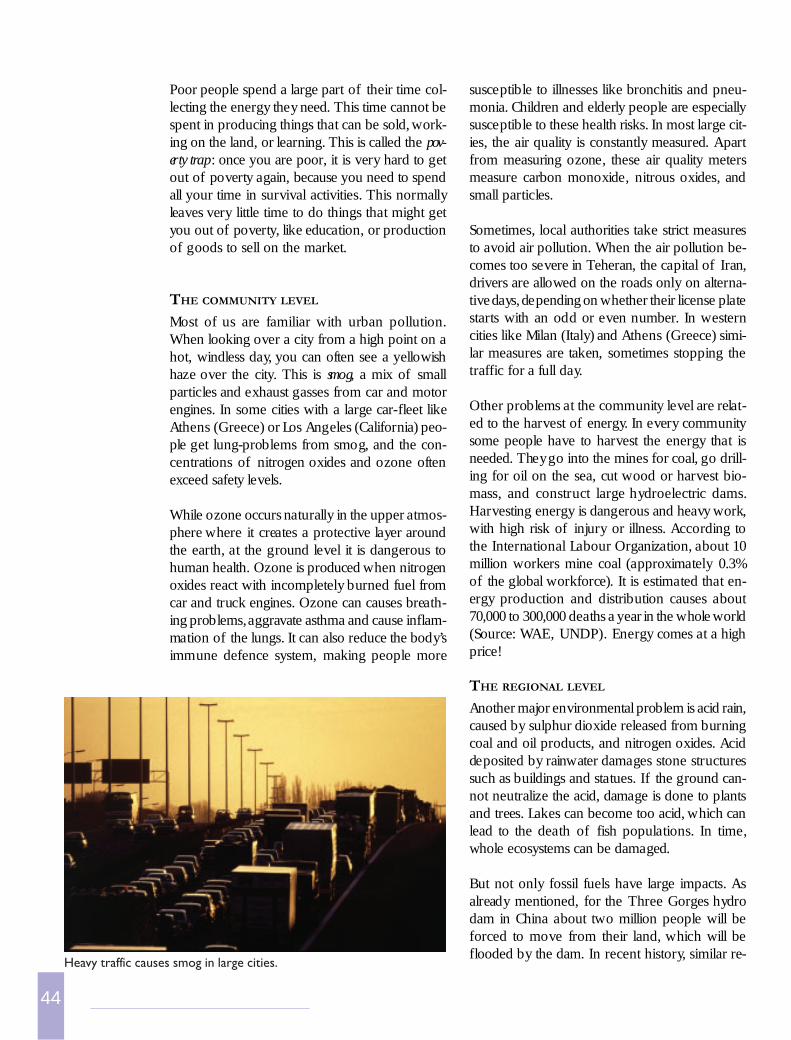
44
susceptible to illnesses like bronchitis and pneu-monia. Children and elderly people are especiallysusceptible to these health risks. In most large cit-ies, the air quality is constantly measured. Apartfrom measuring ozone, these air quality metersmeasure carbon monoxide, nitrous oxides, andsmall particles.
Sometimes, local authorities take strict measuresto avoid air pollution. When the air pollution be-comes too severe in Teheran, the capital of Iran,drivers are allowed on the roads only on alterna-tive days, depending on whether their license platestarts with an odd or even number. In westerncities like Milan (Italy) and Athens (Greece) simi-lar measures are taken, sometimes stopping thetraffic for a full day.
Other problems at the community level are relat-ed to the harvest of energy. In every communitysome people have to harvest the energy that isneeded. They go into the mines for coal, go drill-ing for oil on the sea, cut wood or harvest bio-mass, and construct large hydroelectric dams.Harvesting energy is dangerous and heavy work,with high risk of injury or illness. According tothe International Labour Organization, about 10million workers mine coal (approximately 0.3%of the global workforce). It is estimated that en-ergy production and distribution causes about70,000 to 300,000 deaths a year in the whole world(Source: WAE, UNDP). Energy comes at a highprice!
THE REGIONAL LEVEL
Another major environmental problem is acid rain,caused by sulphur dioxide released from burningcoal and oil products, and nitrogen oxides. Aciddeposited by rainwater damages stone structuressuch as buildings and statues. If the ground can-not neutralize the acid, damage is done to plantsand trees. Lakes can become too acid, which canlead to the death of fish populations. In time,whole ecosystems can be damaged.
But not only fossil fuels have large impacts. Asalready mentioned, for the Three Gorges hydrodam in China about two million people will beforced to move from their land, which will beflooded by the dam. In recent history, similar re-
Poor people spend a large part of their time col-lecting the energy they need. This time cannot bespent in producing things that can be sold, work-ing on the land, or learning. This is called the pov-erty trap: once you are poor, it is very hard to getout of poverty again, because you need to spendall your time in survival activities. This normallyleaves very little time to do things that might getyou out of poverty, like education, or productionof goods to sell on the market.
THE COMMUNITY LEVEL
Most of us are familiar with urban pollution.When looking over a city from a high point on ahot, windless day, you can often see a yellowishhaze over the city. This is smog, a mix of smallparticles and exhaust gasses from car and motorengines. In some cities with a large car-fleet likeAthens (Greece) or Los Angeles (California) peo-ple get lung-problems from smog, and the con-centrations of nitrogen oxides and ozone oftenexceed safety levels.
While ozone occurs naturally in the upper atmos-phere where it creates a protective layer aroundthe earth, at the ground level it is dangerous tohuman health. Ozone is produced when nitrogenoxides react with incompletely burned fuel fromcar and truck engines. Ozone can causes breath-ing problems, aggravate asthma and cause inflam-mation of the lungs. It can also reduce the body’simmune defence system, making people more
Heavy traffic causes smog in large cities.
45
coal, gas or oil are burned. Methane is released byrotting plants, mining, and cattle.
Not all gasses have the same effect in the atmos-phere. Methane for example retains heat in theatmosphere 21 times more than carbon dioxide.So if you produce 1 gram of methane, and 21grams of carbon dioxide, it has the same effecton the greenhouse-warming of the earth.
settlement programs where in total some 40 to 80million people were moved, have caused largesocial problems.
THE GLOBAL LEVEL
Some gasses in the atmosphere have the effect offorming a warm blanket around the earth, whichis called the greenhouse effect. The gasses absorb partof the heat radiation from the ground, and sendpart of it back to the earth. A greenhouse worksin a similar way: the sunlight passes through thegreenhouse, but the glass stops the heat radiationthat comes from the hot ground.
The greenhouse effect is a powerful effect: it keepsthe earth 33 °C warmer than the earth would bewithout it. So without the greenhouse effect, theaverage temperature would be below the freezingpoint! Life on earth, including human, animal andvegetable life, could not exist without the green-house effect.
All the gasses that contribute to this effect arecalled greenhouse gasses. The gasses, which contrib-ute most to this effect in the atmosphere, are wa-ter vapour, carbon dioxide (CO
2), and methane
(CH4). Carbon dioxide is released when wood,
Acid rain can cause buildings, statues and bridges todeteriorate faster than usual.
Cattle and methane
About 20% of the methane emissions in theatmosphere come from animals like oxen,cows, and sheep. Cows can only digest somefoods after a fermentation process, called ru-mination. During this process, bacteria in thecow’s stomach produce methane gas. In a cow,around 2-12% of the energy from food is usedto make methane. The total effect of 1.3 bil-lion cattle making 100 millions tons of meth-ane each year can have an effect on the bal-ance of greenhouse gases. Human relatedprocesses, from energy production to agricul-ture, produce about 60% of the world’s meth-ane. Ruminants produce approximately a thirdof that amount, or 20% of the world’s totalemission of methane.
Ruminating cattle release greenhouse gases.
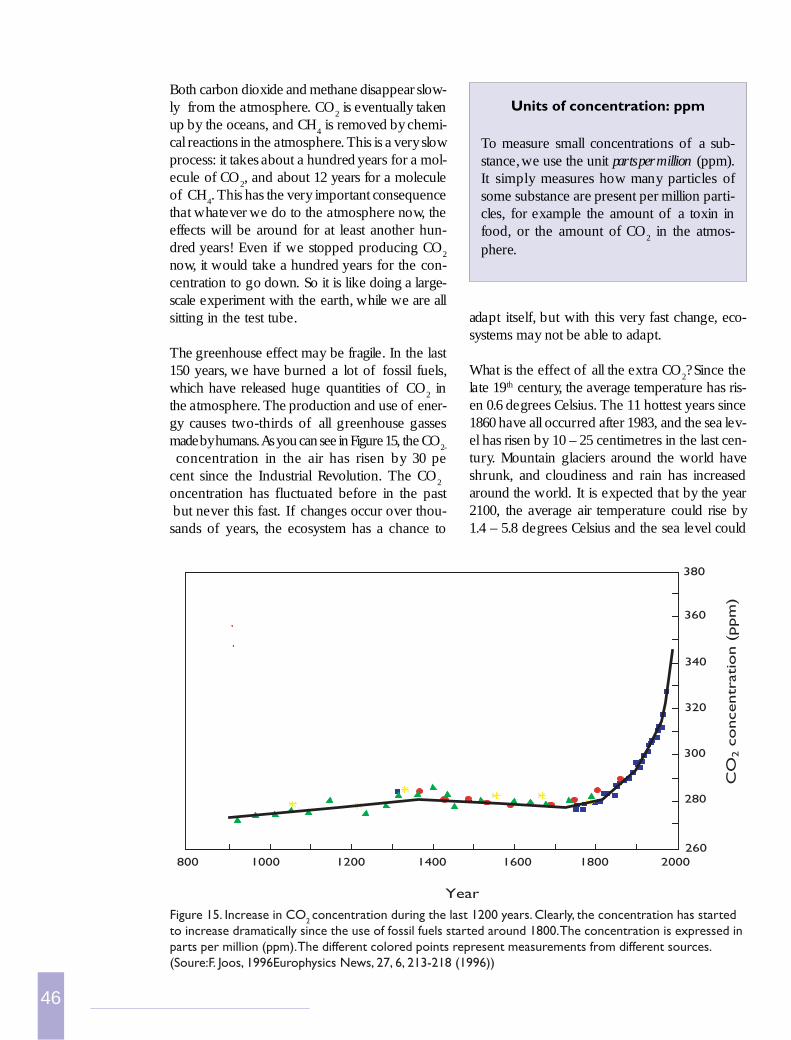
46
adapt itself, but with this very fast change, eco-systems may not be able to adapt.
What is the effect of all the extra CO2? Since the
late 19th century, the average temperature has ris-en 0.6 degrees Celsius. The 11 hottest years since1860 have all occurred after 1983, and the sea lev-el has risen by 10 – 25 centimetres in the last cen-tury. Mountain glaciers around the world haveshrunk, and cloudiness and rain has increasedaround the world. It is expected that by the year2100, the average air temperature could rise by1.4 – 5.8 degrees Celsius and the sea level could
Both carbon dioxide and methane disappear slow-ly from the atmosphere. CO
2 is eventually taken
up by the oceans, and CH4 is removed by chemi-
cal reactions in the atmosphere. This is a very slowprocess: it takes about a hundred years for a mol-ecule of CO
2, and about 12 years for a molecule
of CH4. This has the very important consequence
that whatever we do to the atmosphere now, theeffects will be around for at least another hun-dred years! Even if we stopped producing CO
2
now, it would take a hundred years for the con-centration to go down. So it is like doing a large-scale experiment with the earth, while we are allsitting in the test tube.
The greenhouse effect may be fragile. In the last150 years, we have burned a lot of fossil fuels,which have released huge quantities of CO
2 in
the atmosphere. The production and use of ener-gy causes two-thirds of all greenhouse gassesmade by humans. As you can see in Figure 15, the CO
2-
concentration in the air has risen by 30 pecent since the Industrial Revolution. The CO
2
oncentration has fluctuated before in the past but never this fast. If changes occur over thou-sands of years, the ecosystem has a chance to
Units of concentration: ppm
To measure small concentrations of a sub-stance, we use the unit parts per million (ppm).It simply measures how many particles ofsome substance are present per million parti-cles, for example the amount of a toxin infood, or the amount of CO
2 in the atmos-
phere.
Figure 15. Increase in CO2 concentration during the last 1200 years. Clearly, the concentration has startedto increase dramatically since the use of fossil fuels started around 1800. The concentration is expressed inparts per million (ppm). The different colored points represent measurements from different sources.(Soure:F. Joos, 1996Europhysics News, 27, 6, 213-218 (1996))
800 1000 1200 1400 1600 1800 2000
Year
380
360
340
320
300
280
260
CO
2 c
oncentr
ation (
ppm
)
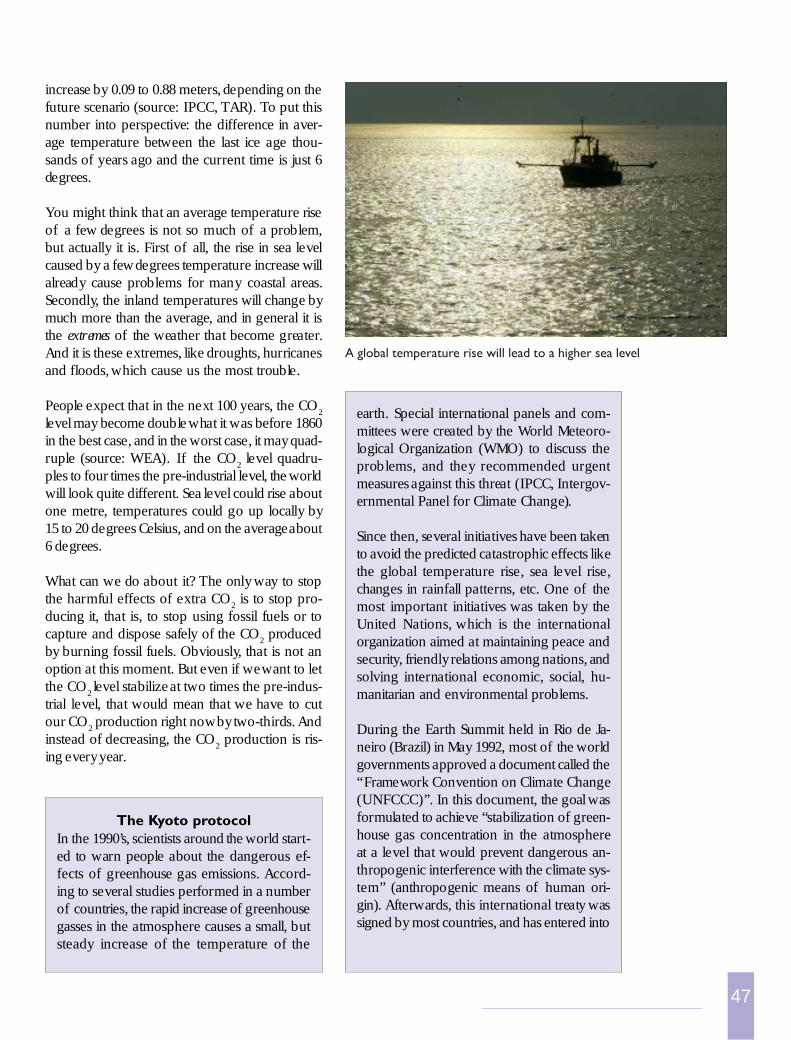
47
increase by 0.09 to 0.88 meters, depending on thefuture scenario (source: IPCC, TAR). To put thisnumber into perspective: the difference in aver-age temperature between the last ice age thou-sands of years ago and the current time is just 6degrees.
You might think that an average temperature riseof a few degrees is not so much of a problem,but actually it is. First of all, the rise in sea levelcaused by a few degrees temperature increase willalready cause problems for many coastal areas.Secondly, the inland temperatures will change bymuch more than the average, and in general it isthe extremes of the weather that become greater.And it is these extremes, like droughts, hurricanesand floods, which cause us the most trouble.
People expect that in the next 100 years, the CO2
level may become double what it was before 1860in the best case, and in the worst case, it may quad-ruple (source: WEA). If the CO
2 level quadru-
ples to four times the pre-industrial level, the worldwill look quite different. Sea level could rise aboutone metre, temperatures could go up locally by15 to 20 degrees Celsius, and on the average about6 degrees.
What can we do about it? The only way to stopthe harmful effects of extra CO
2 is to stop pro-
ducing it, that is, to stop using fossil fuels or tocapture and dispose safely of the CO
2 produced
by burning fossil fuels. Obviously, that is not anoption at this moment. But even if we want to letthe CO
2 level stabilize at two times the pre-indus-
trial level, that would mean that we have to cutour CO
2 production right now by two-thirds. And
instead of decreasing, the CO2 production is ris-
ing every year.
The Kyoto protocolIn the 1990’s, scientists around the world start-ed to warn people about the dangerous ef-fects of greenhouse gas emissions. Accord-ing to several studies performed in a numberof countries, the rapid increase of greenhousegasses in the atmosphere causes a small, butsteady increase of the temperature of the
earth. Special international panels and com-mittees were created by the World Meteoro-logical Organization (WMO) to discuss theproblems, and they recommended urgentmeasures against this threat (IPCC, Intergov-ernmental Panel for Climate Change).
Since then, several initiatives have been takento avoid the predicted catastrophic effects likethe global temperature rise, sea level rise,changes in rainfall patterns, etc. One of themost important initiatives was taken by theUnited Nations, which is the internationalorganization aimed at maintaining peace andsecurity, friendly relations among nations, andsolving international economic, social, hu-manitarian and environmental problems.
During the Earth Summit held in Rio de Ja-neiro (Brazil) in May 1992, most of the worldgovernments approved a document called the“Framework Convention on Climate Change(UNFCCC)”. In this document, the goal wasformulated to achieve “stabilization of green-house gas concentration in the atmosphereat a level that would prevent dangerous an-thropogenic interference with the climate sys-tem” (anthropogenic means of human ori-gin). Afterwards, this international treaty wassigned by most countries, and has entered into
A global temperature rise will lead to a higher sea level
48
ENERGY OPTIONS AND THE GREENHOUSE
EFFECT
Not all energy sources produce greenhouse gas-ses. Solar panels, wind energy, and hydropowerare all examples of energy sources that produceelectricity, but no CO
2. But even that is not quite
true. To make the materials for windmills or solarpanels, energy is needed, which mostly comesfrom fossil fuels. And in the case of hydro damsfor example, rotting plants produce methane,which is a very powerful greenhouse gas.
Can we generate all our energy without produc-ing greenhouse gasses? Yes, but we will have towork very hard to achieve that stage. Solar andwind energy only play a very small role now, andit will take many decades and a lot of researchbefore they will generate substantial amounts ofenergy. Eventually, they can only supply part ofthe electricity because they are intermittent. Cleanfossil, the technique of putting CO
2 back in the
ground, is still an experimental technique, andquestions about the effects and risks in the long-er term still have to be answered. Fusion energydoesn’t work yet, and it will take some decades ofresearch before fusion delivers a reasonable shareof the energy mix. If we take the climate prob-lems seriously, we will have to develop all cleanenergy sources, and we will have to do it quickly.
As we only have one earth, we cannot afford to make mistakes
Even if the Kyoto protocol is not ratified,many countries have decided that they shouldmeet the target of 8% reduction anyway. Atthe moment, countries try to think of howthese reductions can best be realized, and whatthe most practical methods of reduction are.Should we use energy more efficiently, orshould we supply more electricity CO
2-free,
for example using solar panels? Do we haveto build more nuclear power plants, just be-cause they don’t emit greenhouse gasses?Should we invest in windmills or in fusion re-search, or in both?
The Kyoto protocol(continued)
force, meaning that it is now obligatory forall countries.
During the United Nations Climate ChangeConference in Kyoto, in December 1997,major industrial nations agreed to reducegreenhouse emissions. After long and diffi-cult negotiations about how much, where, andwhen to reduce emissions, and who is goingto pay for it, a pact was signed to reduce theglobal emissions of the developed countriesby 5.2% (8% reduction for the EuropeanUnion) of the 1990 levels between 2008 and2012. This pact is known as the Kyoto protocol.(As it is part of another document, it is actu-ally called the Kyoto protocol to the UNFC-CC).
However, the Kyoto protocol is not obliga-tory until enough countries sign it (also calledratifying a protocol). The protocol becomesobligatory if signed by nations that togetherproduced in 1990 55% of all the greenhouseemissions of the developed nations. Now,after five years, we are slowly approaching thistarget. The problem is that the USA have de-clared that they will not sign the agreement,and the USA alone accounts for 36% of allthe greenhouse emissions of the developednations.
49
Summary
• The production of energy can have dangerous effects on the household, community, re-gional and global level.
• The household level: smoke causes illness in developing countries
• The community level: Energy production is a dangerous job. Many people are injured orkilled in mines.
• Also at the community level, energy use can cause smog above cities and the formation ofozone.
• The regional level: use of energy can cause acid rain.
• Globally, the greenhouse effect caused by carbon dioxide and methane is starting to have an
discernable influence on the climate everywhere on earth.
Things to do• What is your opinion about nuclear energy?
• How do you think we should stop global warming?
• Find out what your country does to stop pollution from energy production.
• Has your country signed/ratified the Kyoto protocol?
On the Web
>>>
unfccc.int
Provides information on the UnitedNations Framework Convention onClimate Change
www.ipcc.ch
The site of the IntergovernmentalPanel on Climate Change
www.arm.gov/docs/education/warming.html
A good site with translations inFrench, Spanish, German and Ital-ian. It also provides exercises for stu-dents.
www.defra.gov.uk/environment/climatechange/schools/index.htm
Climate change information for 12 –16 year olds students and theirteachters.
hdgc.epp.cmu.edu/teachersguide/teachersguide.htm#lesson
Teacher’s guide to Climate Change,including lesson material.
globalwarming.enviroweb.org/games/index.html
Global Warming Games.
www.climatechange.gc.ca/english/workroom/students/greenhouse.shtml
Special site for schools including pos-sible actions and a workroom. Eng-lish and French.
<<<
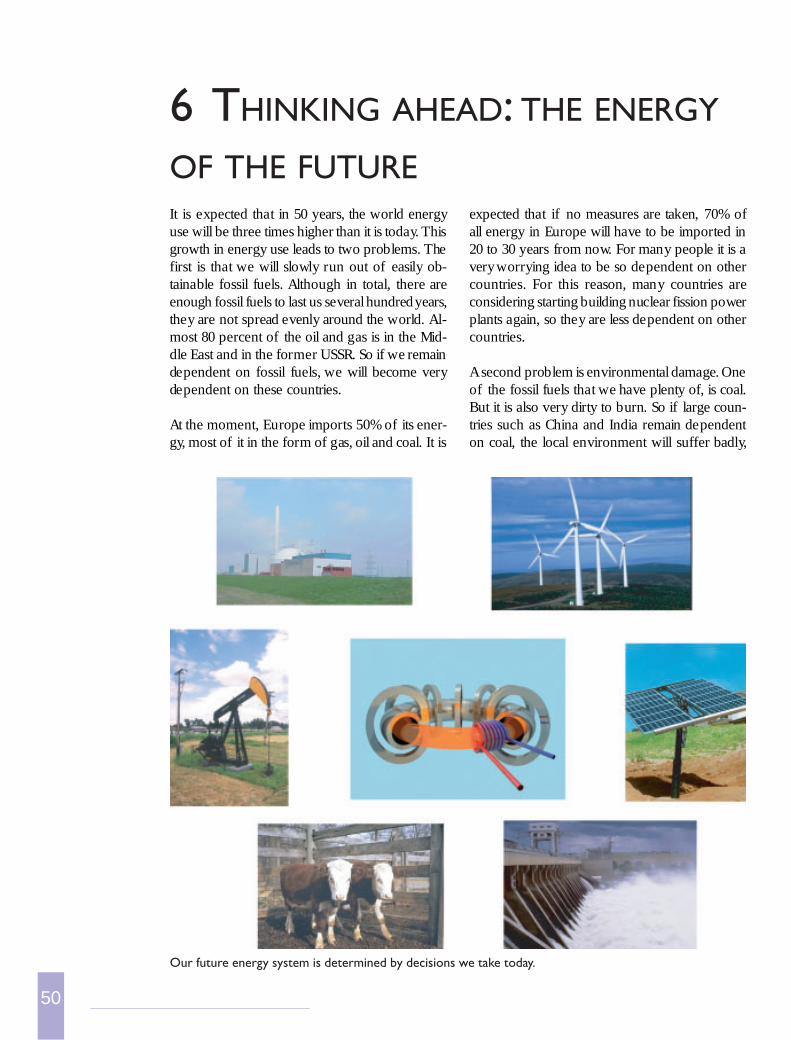
50
expected that if no measures are taken, 70% ofall energy in Europe will have to be imported in20 to 30 years from now. For many people it is avery worrying idea to be so dependent on othercountries. For this reason, many countries areconsidering starting building nuclear fission powerplants again, so they are less dependent on othercountries.
A second problem is environmental damage. Oneof the fossil fuels that we have plenty of, is coal.But it is also very dirty to burn. So if large coun-tries such as China and India remain dependenton coal, the local environment will suffer badly,
It is expected that in 50 years, the world energyuse will be three times higher than it is today. Thisgrowth in energy use leads to two problems. Thefirst is that we will slowly run out of easily ob-tainable fossil fuels. Although in total, there areenough fossil fuels to last us several hundred years,they are not spread evenly around the world. Al-most 80 percent of the oil and gas is in the Mid-dle East and in the former USSR. So if we remaindependent on fossil fuels, we will become verydependent on these countries.
At the moment, Europe imports 50% of its ener-gy, most of it in the form of gas, oil and coal. It is
6 THINKING AHEAD: THE ENERGY
OF THE FUTURE
Our future energy system is determined by decisions we take today.
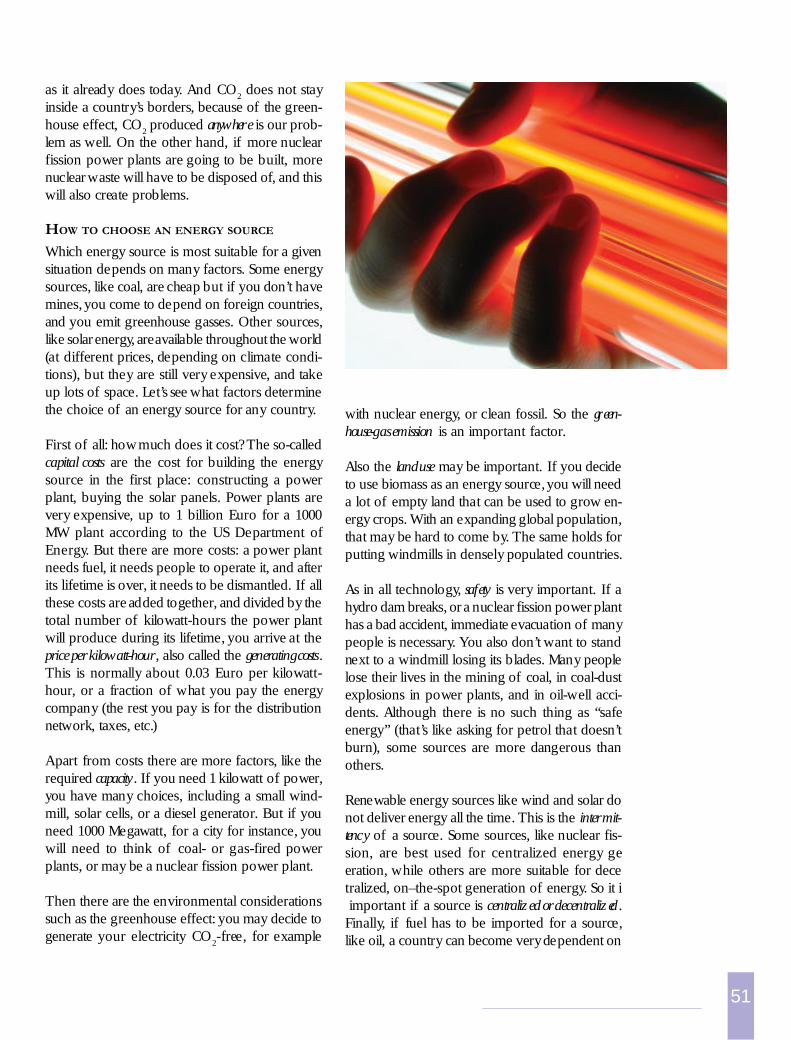
51
as it already does today. And CO2 does not stay
inside a country’s borders, because of the green-house effect, CO
2 produced anywhere is our prob-
lem as well. On the other hand, if more nuclearfission power plants are going to be built, morenuclear waste will have to be disposed of, and thiswill also create problems.
HOW TO CHOOSE AN ENERGY SOURCE
Which energy source is most suitable for a givensituation depends on many factors. Some energysources, like coal, are cheap but if you don’t havemines, you come to depend on foreign countries,and you emit greenhouse gasses. Other sources,like solar energy, are available throughout the world(at different prices, depending on climate condi-tions), but they are still very expensive, and takeup lots of space. Let’s see what factors determinethe choice of an energy source for any country.
First of all: how much does it cost? The so-calledcapital costs are the cost for building the energysource in the first place: constructing a powerplant, buying the solar panels. Power plants arevery expensive, up to 1 billion Euro for a 1000MW plant according to the US Department ofEnergy. But there are more costs: a power plantneeds fuel, it needs people to operate it, and afterits lifetime is over, it needs to be dismantled. If allthese costs are added together, and divided by thetotal number of kilowatt-hours the power plantwill produce during its lifetime, you arrive at theprice per kilowatt-hour, also called the generating costs.This is normally about 0.03 Euro per kilowatt-hour, or a fraction of what you pay the energycompany (the rest you pay is for the distributionnetwork, taxes, etc.)
Apart from costs there are more factors, like therequired capacity. If you need 1 kilowatt of power,you have many choices, including a small wind-mill, solar cells, or a diesel generator. But if youneed 1000 Megawatt, for a city for instance, youwill need to think of coal- or gas-fired powerplants, or may be a nuclear fission power plant.
Then there are the environmental considerationssuch as the greenhouse effect: you may decide togenerate your electricity CO
2-free, for example
with nuclear energy, or clean fossil. So the green-house-gas emission is an important factor.
Also the land use may be important. If you decideto use biomass as an energy source, you will needa lot of empty land that can be used to grow en-ergy crops. With an expanding global population,that may be hard to come by. The same holds forputting windmills in densely populated countries.
As in all technology, safety is very important. If ahydro dam breaks, or a nuclear fission power planthas a bad accident, immediate evacuation of manypeople is necessary. You also don’t want to standnext to a windmill losing its blades. Many peoplelose their lives in the mining of coal, in coal-dustexplosions in power plants, and in oil-well acci-dents. Although there is no such thing as “safeenergy” (that’s like asking for petrol that doesn’tburn), some sources are more dangerous thanothers.
Renewable energy sources like wind and solar donot deliver energy all the time. This is the intermit-tency of a source. Some sources, like nuclear fis-sion, are best used for centralized energy geeration, while others are more suitable for decetralized, on–the-spot generation of energy. So it i important if a source is centralized or decentralized.Finally, if fuel has to be imported for a source,like oil, a country can become very dependent on
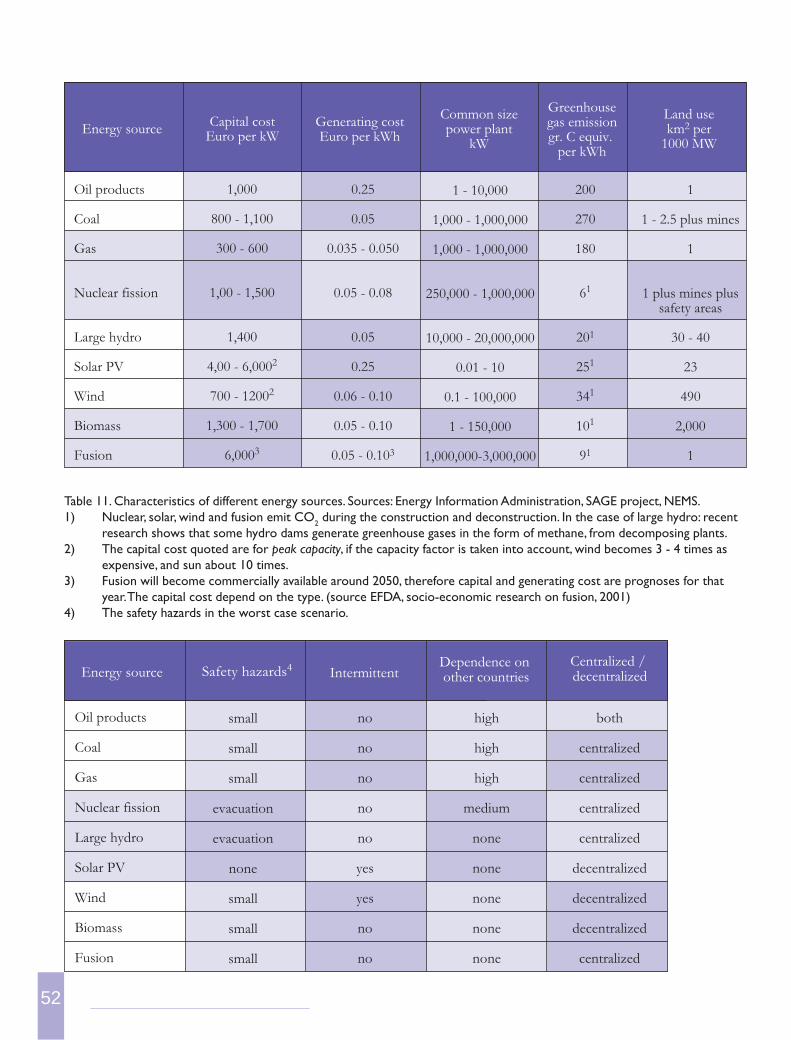
52
Table 11. Characteristics of different energy sources. Sources: Energy Information Administration, SAGE project, NEMS.1) Nuclear, solar, wind and fusion emit CO2 during the construction and deconstruction. In the case of large hydro: recent
research shows that some hydro dams generate greenhouse gases in the form of methane, from decomposing plants.2) The capital cost quoted are for peak capacity, if the capacity factor is taken into account, wind becomes 3 - 4 times as
expensive, and sun about 10 times.3) Fusion will become commercially available around 2050, therefore capital and generating cost are prognoses for that
year. The capital cost depend on the type. (source EFDA, socio-economic research on fusion, 2001)4) The safety hazards in the worst case scenario.
Oil products
Coal
Gas
Nuclear fission
Large hydro
Solar PV
Wind
Biomass
Fusion
1,000
800 - 1,100
300 - 600
1,00 - 1,500
1,400
4,00 - 6,0002
700 - 12002
1,300 - 1,700
6,0003
0.25
0.05
0.035 - 0.050
0.05 - 0.08
0.05
0.25
0.06 - 0.10
0.05 - 0.10
0.05 - 0.103
1 - 10,000
1,000 - 1,000,000
1,000 - 1,000,000
250,000 - 1,000,000
10,000 - 20,000,000
0.01 - 10
0.1 - 100,000
1 - 150,000
1,000,000-3,000,000
200
270
180
61
201
251
341
101
91
Capital costEuro per kW
Generating costEuro per kWh
Greenhousegas emissiongr. C equiv.
per kWh
Common sizepower plant
kWEnergy source
1
1 - 2.5 plus mines
1
1 plus mines plussafety areas
30 - 40
23
490
2,000
1
Land usekm2 per
1000 MW
Oil products
Coal
Gas
Nuclear fission
Large hydro
Solar PV
Wind
Biomass
Fusion
small
small
small
evacuation
evacuation
none
small
small
small
no
no
no
no
no
yes
yes
no
no
high
high
high
medium
none
none
none
none
none
both
centralized
centralized
centralized
centralized
decentralized
decentralized
decentralized
centralized
Safety hazards4 IntermittentCentralized / decentralized
Dependence on other countriesEnergy source
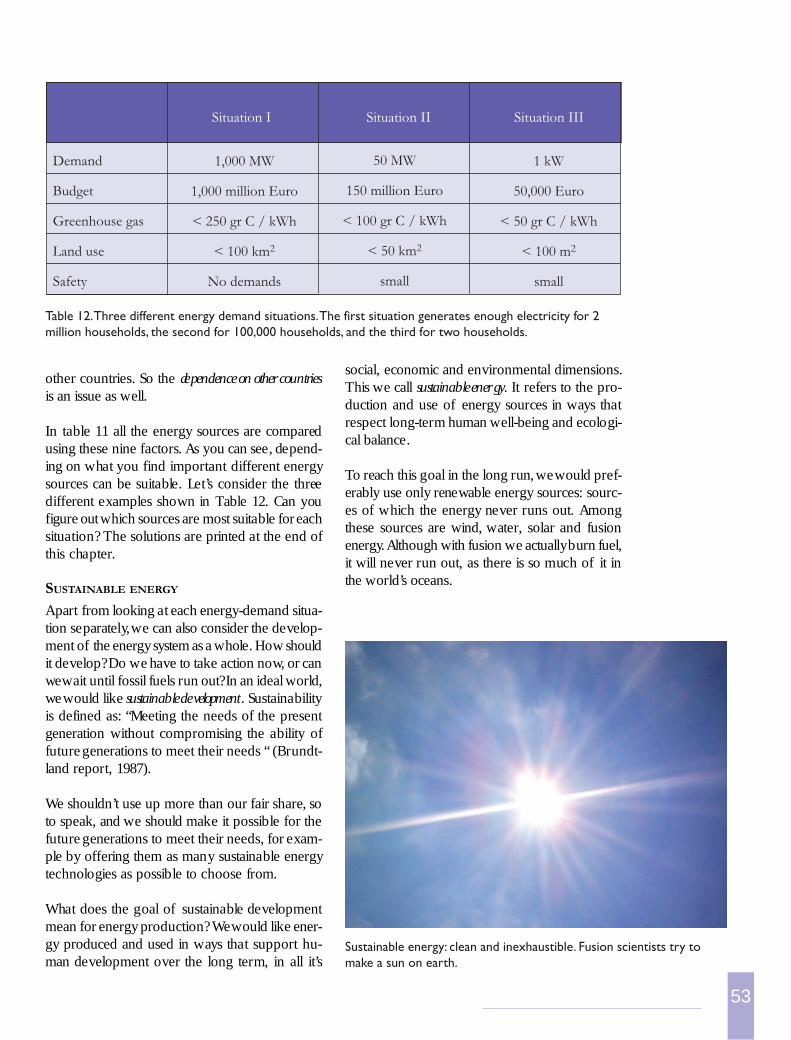
53
other countries. So the dependence on other countriesis an issue as well.
In table 11 all the energy sources are comparedusing these nine factors. As you can see, depend-ing on what you find important different energysources can be suitable. Let’s consider the threedifferent examples shown in Table 12. Can youfigure out which sources are most suitable for eachsituation? The solutions are printed at the end ofthis chapter.
SUSTAINABLE ENERGY
Apart from looking at each energy-demand situa-tion separately, we can also consider the develop-ment of the energy system as a whole. How shouldit develop? Do we have to take action now, or canwe wait until fossil fuels run out? In an ideal world,we would like sustainable development. Sustainabilityis defined as: “Meeting the needs of the presentgeneration without compromising the ability offuture generations to meet their needs “ (Brundt-land report, 1987).
We shouldn’t use up more than our fair share, soto speak, and we should make it possible for thefuture generations to meet their needs, for exam-ple by offering them as many sustainable energytechnologies as possible to choose from.
What does the goal of sustainable developmentmean for energy production? We would like ener-gy produced and used in ways that support hu-man development over the long term, in all it’s
social, economic and environmental dimensions.This we call sustainable energy. It refers to the pro-duction and use of energy sources in ways thatrespect long-term human well-being and ecologi-cal balance.
To reach this goal in the long run, we would pref-erably use only renewable energy sources: sourc-es of which the energy never runs out. Amongthese sources are wind, water, solar and fusionenergy. Although with fusion we actually burn fuel,it will never run out, as there is so much of it inthe world’s oceans.
Table 12. Three different energy demand situations. The first situation generates enough electricity for 2million households, the second for 100,000 households, and the third for two households.
Sustainable energy: clean and inexhaustible. Fusion scientists try tomake a sun on earth.
Demand
Budget
Greenhouse gas
Land use
Safety
1,000 MW
1,000 million Euro
< 250 gr C / kWh
< 100 km2
No demands
Situation I Situation II Situation III
50 MW
150 million Euro
< 100 gr C / kWh
< 50 km2
small
1 kW
50,000 Euro
< 50 gr C / kWh
< 100 m2
small
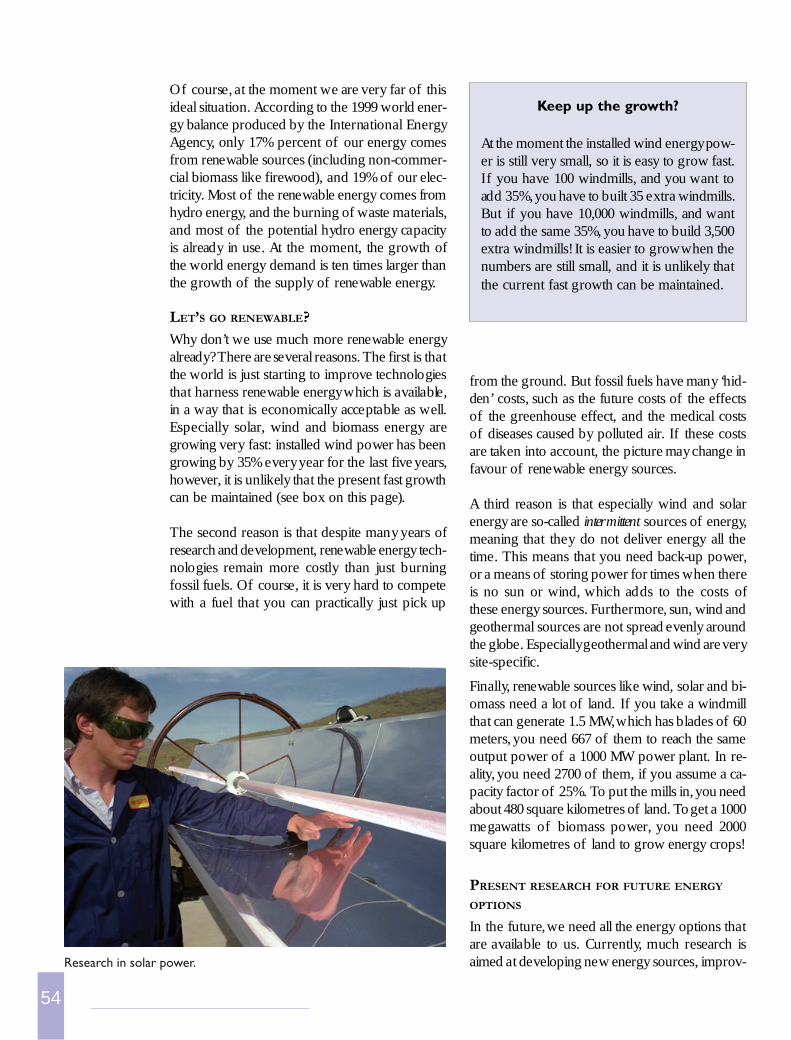
54
Of course, at the moment we are very far of thisideal situation. According to the 1999 world ener-gy balance produced by the International EnergyAgency, only 17% percent of our energy comesfrom renewable sources (including non-commer-cial biomass like firewood), and 19% of our elec-tricity. Most of the renewable energy comes fromhydro energy, and the burning of waste materials,and most of the potential hydro energy capacityis already in use. At the moment, the growth ofthe world energy demand is ten times larger thanthe growth of the supply of renewable energy.
LET’S GO RENEWABLE?
Why don’t we use much more renewable energyalready? There are several reasons. The first is thatthe world is just starting to improve technologiesthat harness renewable energy which is available,in a way that is economically acceptable as well.Especially solar, wind and biomass energy aregrowing very fast: installed wind power has beengrowing by 35% every year for the last five years,however, it is unlikely that the present fast growthcan be maintained (see box on this page).
The second reason is that despite many years ofresearch and development, renewable energy tech-nologies remain more costly than just burningfossil fuels. Of course, it is very hard to competewith a fuel that you can practically just pick up
from the ground. But fossil fuels have many ‘hid-den’ costs, such as the future costs of the effectsof the greenhouse effect, and the medical costsof diseases caused by polluted air. If these costsare taken into account, the picture may change infavour of renewable energy sources.
A third reason is that especially wind and solarenergy are so-called intermittent sources of energy,meaning that they do not deliver energy all thetime. This means that you need back-up power,or a means of storing power for times when thereis no sun or wind, which adds to the costs ofthese energy sources. Furthermore, sun, wind andgeothermal sources are not spread evenly aroundthe globe. Especially geothermal and wind are verysite-specific.
Finally, renewable sources like wind, solar and bi-omass need a lot of land. If you take a windmillthat can generate 1.5 MW, which has blades of 60meters, you need 667 of them to reach the sameoutput power of a 1000 MW power plant. In re-ality, you need 2700 of them, if you assume a ca-pacity factor of 25%. To put the mills in, you needabout 480 square kilometres of land. To get a 1000megawatts of biomass power, you need 2000square kilometres of land to grow energy crops!
PRESENT RESEARCH FOR FUTURE ENERGY
OPTIONS
In the future, we need all the energy options thatare available to us. Currently, much research isaimed at developing new energy sources, improv-Research in solar power.
Keep up the growth?
At the moment the installed wind energy pow-er is still very small, so it is easy to grow fast.If you have 100 windmills, and you want toadd 35%, you have to built 35 extra windmills.But if you have 10,000 windmills, and wantto add the same 35%, you have to build 3,500extra windmills! It is easier to grow when thenumbers are still small, and it is unlikely thatthe current fast growth can be maintained.
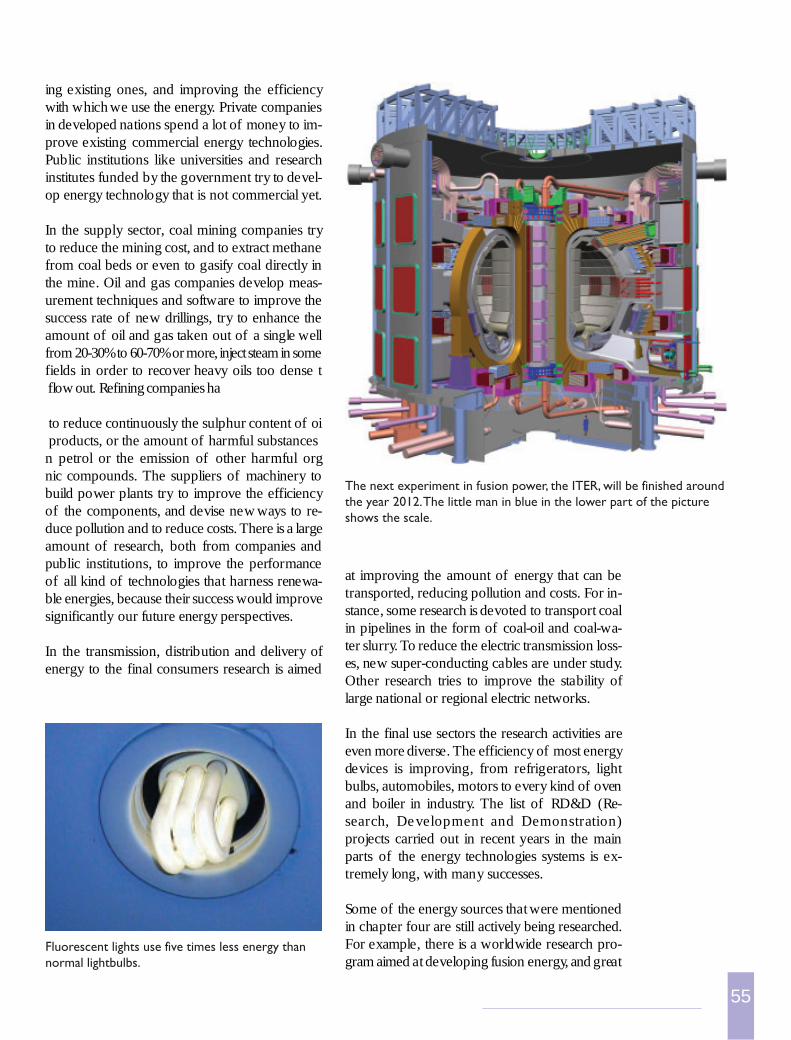
55
ing existing ones, and improving the efficiencywith which we use the energy. Private companiesin developed nations spend a lot of money to im-prove existing commercial energy technologies.Public institutions like universities and researchinstitutes funded by the government try to devel-op energy technology that is not commercial yet.
In the supply sector, coal mining companies tryto reduce the mining cost, and to extract methanefrom coal beds or even to gasify coal directly inthe mine. Oil and gas companies develop meas-urement techniques and software to improve thesuccess rate of new drillings, try to enhance theamount of oil and gas taken out of a single wellfrom 20-30% to 60-70% or more, inject steam in somefields in order to recover heavy oils too dense t flow out. Refining companies ha
to reduce continuously the sulphur content of oi products, or the amount of harmful substances n petrol or the emission of other harmful orgnic compounds. The suppliers of machinery tobuild power plants try to improve the efficiencyof the components, and devise new ways to re-duce pollution and to reduce costs. There is a largeamount of research, both from companies andpublic institutions, to improve the performanceof all kind of technologies that harness renewa-ble energies, because their success would improvesignificantly our future energy perspectives.
In the transmission, distribution and delivery ofenergy to the final consumers research is aimed
at improving the amount of energy that can betransported, reducing pollution and costs. For in-stance, some research is devoted to transport coalin pipelines in the form of coal-oil and coal-wa-ter slurry. To reduce the electric transmission loss-es, new super-conducting cables are under study.Other research tries to improve the stability oflarge national or regional electric networks.
In the final use sectors the research activities areeven more diverse. The efficiency of most energydevices is improving, from refrigerators, lightbulbs, automobiles, motors to every kind of ovenand boiler in industry. The list of RD&D (Re-search, Development and Demonstration)projects carried out in recent years in the mainparts of the energy technologies systems is ex-tremely long, with many successes.
Some of the energy sources that were mentionedin chapter four are still actively being researched.For example, there is a worldwide research pro-gram aimed at developing fusion energy, and great
The next experiment in fusion power, the ITER, will be finished aroundthe year 2012. The little man in blue in the lower part of the pictureshows the scale.
Fluorescent lights use five times less energy thannormal lightbulbs.
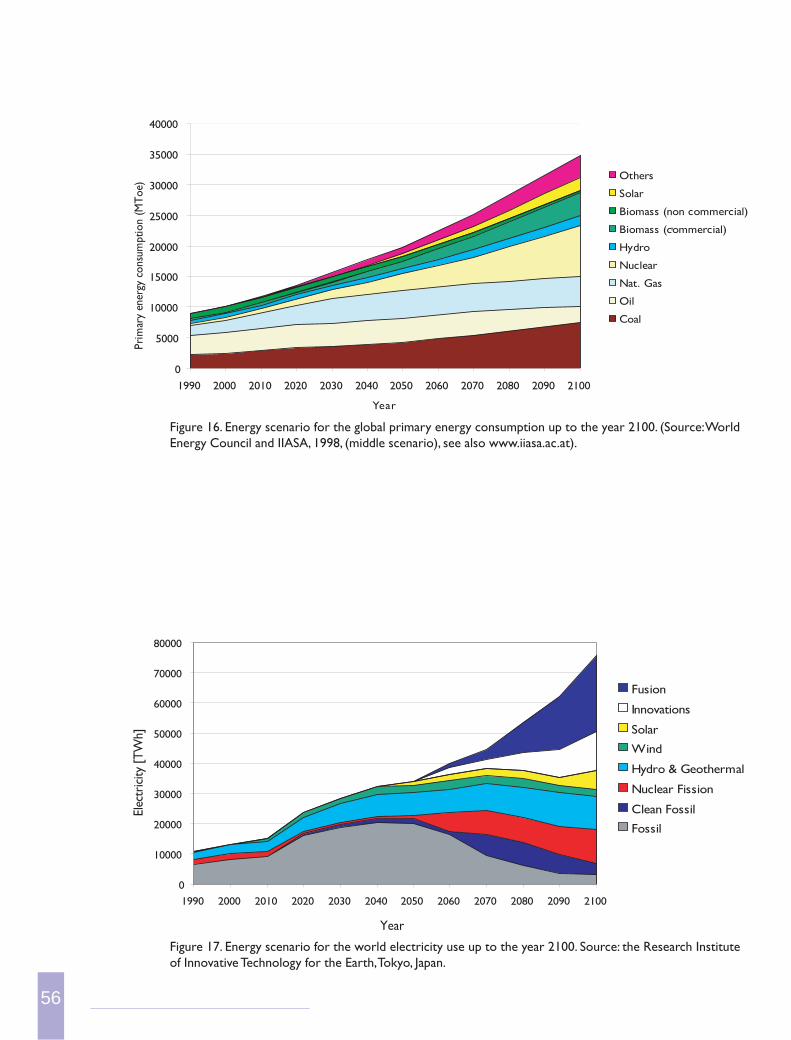
56
0
5000
10000
15000
20000
25000
30000
35000
40000
1990 2000 2010 2020 2030 2040 2050 2060 2070 2080 2090 2100
Year
Pri
mar
y en
ergy
co
nsum
ptio
n (M
To
e)
Others
Solar
Biomass (non commercial)
Biomass (commercial)
Hydro
Nuclear
Nat. Gas
Oil
Coal
,
0
10000
20000
30000
40000
50000
60000
70000
80000
1990 2000 2010 2020 2030 2040 2050 2060 2070 2080 2090 2100
Elec
tric
ity
[TW
h]
Fusion
Innovations
Solar
Wind
Hydro & Geothermal
Nuclear Fission
Clean Fossil
Fossil
Year
Figure 17. Energy scenario for the world electricity use up to the year 2100. Source: the Research Instituteof Innovative Technology for the Earth, Tokyo, Japan.
Figure 16. Energy scenario for the global primary energy consumption up to the year 2100. (Source: WorldEnergy Council and IIASA, 1998, (middle scenario), see also www.iiasa.ac.at).
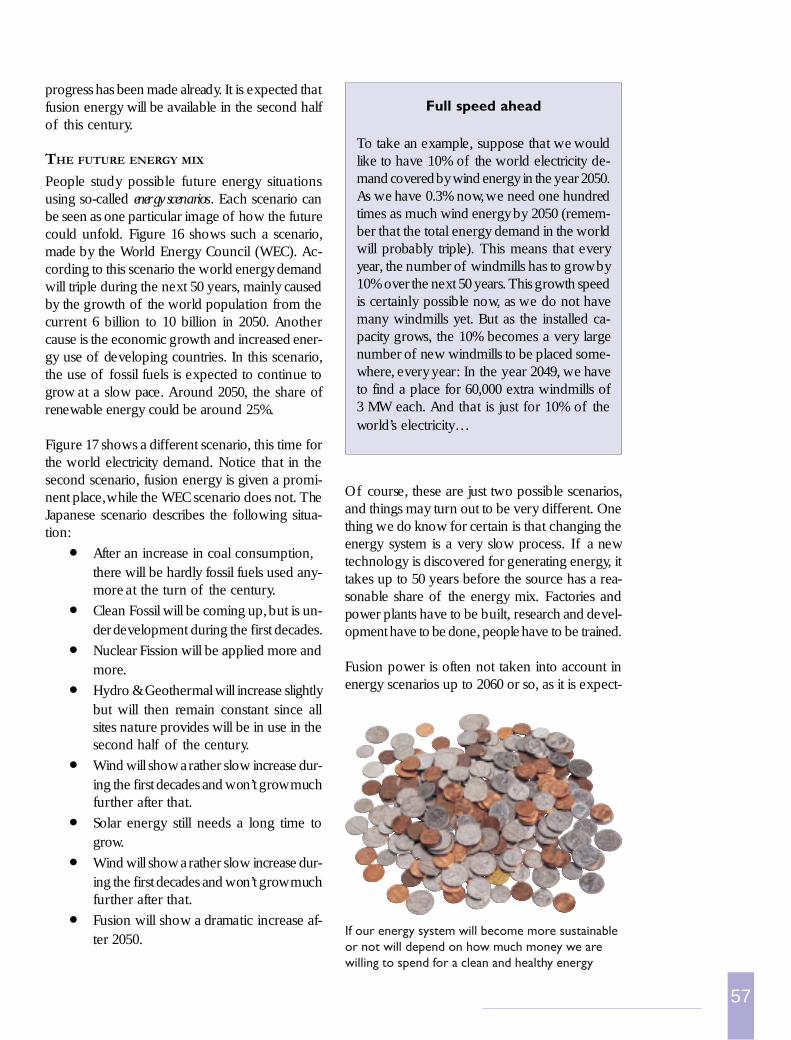
57
progress has been made already. It is expected thatfusion energy will be available in the second halfof this century.
THE FUTURE ENERGY MIX
People study possible future energy situationsusing so-called energy scenarios. Each scenario canbe seen as one particular image of how the futurecould unfold. Figure 16 shows such a scenario,made by the World Energy Council (WEC). Ac-cording to this scenario the world energy demandwill triple during the next 50 years, mainly causedby the growth of the world population from thecurrent 6 billion to 10 billion in 2050. Anothercause is the economic growth and increased ener-gy use of developing countries. In this scenario,the use of fossil fuels is expected to continue togrow at a slow pace. Around 2050, the share ofrenewable energy could be around 25%.
Figure 17 shows a different scenario, this time forthe world electricity demand. Notice that in thesecond scenario, fusion energy is given a promi-nent place, while the WEC scenario does not. TheJapanese scenario describes the following situa-tion:
• After an increase in coal consumption,there will be hardly fossil fuels used any-more at the turn of the century.
• Clean Fossil will be coming up, but is un-der development during the first decades.
• Nuclear Fission will be applied more andmore.
• Hydro & Geothermal will increase slightlybut will then remain constant since allsites nature provides will be in use in thesecond half of the century.
• Wind will show a rather slow increase dur-ing the first decades and won’t grow muchfurther after that.
• Solar energy still needs a long time togrow.
• Wind will show a rather slow increase dur-ing the first decades and won’t grow muchfurther after that.
• Fusion will show a dramatic increase af-ter 2050.
Of course, these are just two possible scenarios,and things may turn out to be very different. Onething we do know for certain is that changing theenergy system is a very slow process. If a newtechnology is discovered for generating energy, ittakes up to 50 years before the source has a rea-sonable share of the energy mix. Factories andpower plants have to be built, research and devel-opment have to be done, people have to be trained.
Fusion power is often not taken into account inenergy scenarios up to 2060 or so, as it is expect-
Full speed ahead
To take an example, suppose that we wouldlike to have 10% of the world electricity de-mand covered by wind energy in the year 2050.As we have 0.3% now, we need one hundredtimes as much wind energy by 2050 (remem-ber that the total energy demand in the worldwill probably triple). This means that everyyear, the number of windmills has to grow by10% over the next 50 years. This growth speedis certainly possible now, as we do not havemany windmills yet. But as the installed ca-pacity grows, the 10% becomes a very largenumber of new windmills to be placed some-where, every year: In the year 2049, we haveto find a place for 60,000 extra windmills of3 MW each. And that is just for 10% of theworld’s electricity…
If our energy system will become more sustainableor not will depend on how much money we arewilling to spend for a clean and healthy energy
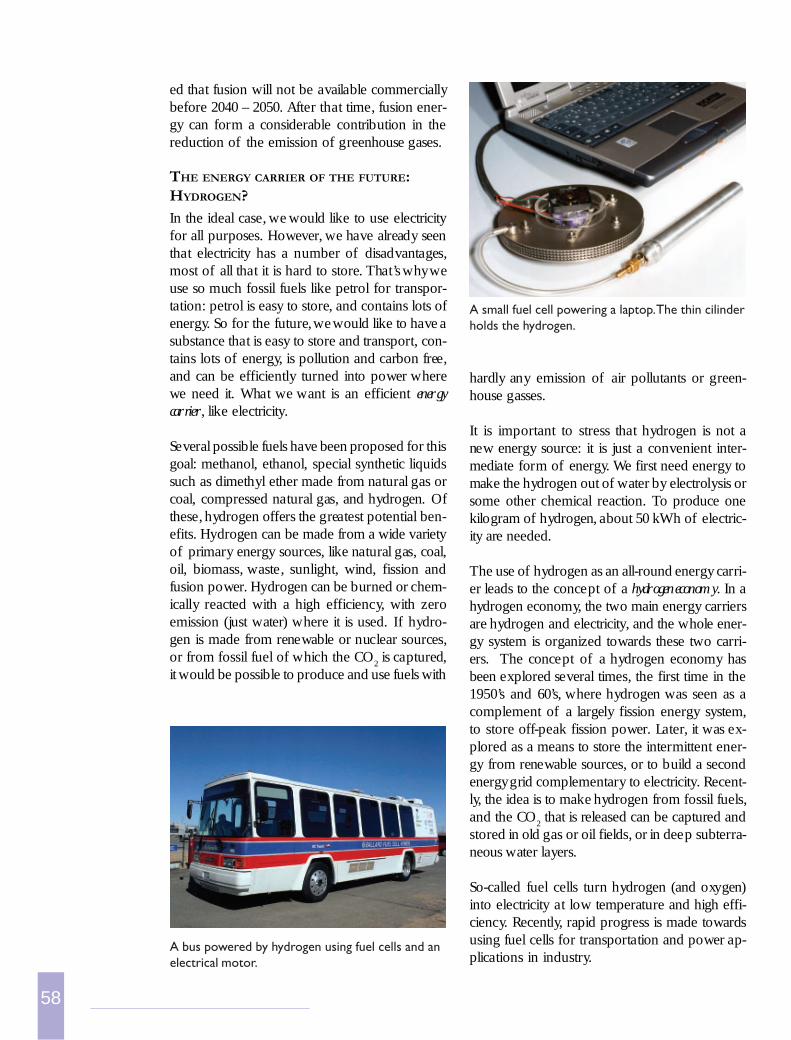
58
ed that fusion will not be available commerciallybefore 2040 – 2050. After that time, fusion ener-gy can form a considerable contribution in thereduction of the emission of greenhouse gases.
THE ENERGY CARRIER OF THE FUTURE:HYDROGEN?
In the ideal case, we would like to use electricityfor all purposes. However, we have already seenthat electricity has a number of disadvantages,most of all that it is hard to store. That’s why weuse so much fossil fuels like petrol for transpor-tation: petrol is easy to store, and contains lots ofenergy. So for the future, we would like to have asubstance that is easy to store and transport, con-tains lots of energy, is pollution and carbon free,and can be efficiently turned into power wherewe need it. What we want is an efficient energycarrier, like electricity.
Several possible fuels have been proposed for thisgoal: methanol, ethanol, special synthetic liquidssuch as dimethyl ether made from natural gas orcoal, compressed natural gas, and hydrogen. Ofthese, hydrogen offers the greatest potential ben-efits. Hydrogen can be made from a wide varietyof primary energy sources, like natural gas, coal,oil, biomass, waste, sunlight, wind, fission andfusion power. Hydrogen can be burned or chem-ically reacted with a high efficiency, with zeroemission (just water) where it is used. If hydro-gen is made from renewable or nuclear sources,or from fossil fuel of which the CO
2 is captured,
it would be possible to produce and use fuels with
hardly any emission of air pollutants or green-house gasses.
It is important to stress that hydrogen is not anew energy source: it is just a convenient inter-mediate form of energy. We first need energy tomake the hydrogen out of water by electrolysis orsome other chemical reaction. To produce onekilogram of hydrogen, about 50 kWh of electric-ity are needed.
The use of hydrogen as an all-round energy carri-er leads to the concept of a hydrogen economy. In ahydrogen economy, the two main energy carriersare hydrogen and electricity, and the whole ener-gy system is organized towards these two carri-ers. The concept of a hydrogen economy hasbeen explored several times, the first time in the1950’s and 60’s, where hydrogen was seen as acomplement of a largely fission energy system,to store off-peak fission power. Later, it was ex-plored as a means to store the intermittent ener-gy from renewable sources, or to build a secondenergy grid complementary to electricity. Recent-ly, the idea is to make hydrogen from fossil fuels,and the CO
2 that is released can be captured and
stored in old gas or oil fields, or in deep subterra-neous water layers.
So-called fuel cells turn hydrogen (and oxygen)into electricity at low temperature and high effi-ciency. Recently, rapid progress is made towardsusing fuel cells for transportation and power ap-plications in industry.
A bus powered by hydrogen using fuel cells and anelectrical motor.
A small fuel cell powering a laptop. The thin cilinderholds the hydrogen.
59
CONCLUSION
All large-scale energy production systems havetheir problems and their merits. Fossil fuels emitgreenhouse gasses and other pollutants, most hy-dro-capacity has already been used, and new hy-dro dams change the environment and have so-cial costs. Nuclear fission power plants are emis-sion-free but produce waste. Using fossil fuelsoften makes countries very dependent on othercountries. Apparently, we cannot have the goodwithout some of the bad. The best way is to havea diversified energy system, using all possible en-ergy sources, so the risks and negative impacts ofall sources can be limited.
There are other reasons for a diverse energy mix.For urban populations, the best thing to have iscentralized energy generation in the form of pow-er stations of a 1000 MW or more, combined witha strong power grid. On the other hand, rural so-
cieties are better served with small, decentralizedsources of energy such as wind or solar power.
The energy system changes only slowly, becauseit is such a big and important system. Our deci-sions now on which technologies to develop andsupport, will largely determine what the energysystem looks like in 50 years time or longer. Wehave to provide the generations that come afterus with the techniques they need to satisfy theirenergy demand. As there are so many uncertain-ties about the future developments, it is best todevelop all available energy sources so that theycome available when they are needed.
Research in renewable energy sources, safe andclean ways of using fission power, and new sourceslike fusion energy are all needed to guarantee ourenergy many years away. The future of energystarts today.
On the Web
>>>
www.eren.doe.gov/kids/
Renewables, energy efficiency, quiz-zes.
www.energyquest.ca.gov/index.html
A very good and interactive site withalmost all energy subjects covered.
www.irish-energy.ie/energy_linked/subjects_geog.htm
Complete lessons about fossil and re-newable energy subjects.
www.academyofenergy.org/intro.html
Including materials for students andteachers.
europa.eu.int/comm/dgs/energy_transport/index.html
Multilingual site with informationabout EU-policy on energy and trans-port.
europa.eu.int/comm/research/energy
The European Commission site forenergy research.
Links for teachers:
www.nef1.org/educatorlinks.html
www.eren.doe.gov/education/
www.solarnow.org/links.htm
sln.fi.edu/tfi/hotlists/energy.html
dir.yahoo.com/Science/Energy/
An extensive list about all aspects ofenergy varying from sources to newsand media about energy.
<<<
60
SOURCES
The supplied data (all tables and all percentages relat-ing to energy sources and consumptions) derive from:
- Energy balances of non-OECD countries (1999),International Energy Agency (IAE)- Energy Balances of OECD countries (1999), IAE- International Energy Annual (1999) – Energy Infor-mation Administration (EIA), DOE- International Energy Outlook (2002) – EIA, DOE- Energy and the challenge of sustainability (2000)—
World Energy Assessment, UNDP- F. Joos, 1996, Europhysics News, 27, 6, 213-218- Energy research Centre of the Netherlands (ECN)
Solution to the exercise:Exercise I:
- The electricity demand is 1 Gigawatt: oil, so-lar, wind and biomass are excluded.
- The budget for the plant is 1 billion Euro’s,which corresponds with capital costs of 1,000Euro/kW: coal, gas or nuclear are still op-tional.
- The C – limit leaves coal out.- Land occupancy is not a problem for gas or
fission.- Depending on the safety considerations (e.g.
whether there is room for safety areas), ei-ther a gas fired power station or a fissionpower station would be the solution.
Exercise II:- The demand is 50 Mega watt: oil and solar
are excluded.- The budget is 150 million Euros to generate
50 Mega watt, this corresponds with 3,000Euro / kW.
- The C – limit leaves coal and gas out.- The safety hazard and the capacity exclude
fission too.- The available options are wind and biomass.
The available land occupancy prevents 100% f the demand being covered by biomass only. Cosidering the budget and land occupancy, combination of 50% wind and 50% biomasswill do the job. (Wind has higher capital costs,but occupies less land then biomass resultingin an optimum of these two options of 50 /50)
Exercise III:- The demand is only 1 kW, excluding coal, gas,
nuclear and large hydro- A budget of 50,000 Euro means 50,000
Euro/kW, leaving room for even solar.- A C – limit of 50 gr. / kWh excludes oil.- A land occupancy of 100 m2 for 1 kW, corres-
ponding with 100 km2 / GW, leaves solar asthe only option. Disregarding the surface arealimit would probably result in a choice forwind energy, however, as it is much cheaper.
Summary
• The continuous use of fossil fuels creates a burden for future generations, forcing us tothink today about the world of tomorrow in terms of sustainable development and energy.
• Fusion energy might become one of the important energy sources in the future, but it stillneeds some decades of development.
• Although renewable energy sources are already available, several decades are also needed tobring these technologies to a mature state.
• The uncertainties of the future energy mix require us to develop all possible energy technol-ogies to a mature state, starting today.
Things to do• A class discussion or essay about how you think energy in the world should be produced and
consumed fifty years from now. Try to focus also on developing countries.

61
Photo credits(l = left, r = right, t = top, b = bottom)
Adam Hart-Davis (DHD photo gallery): 2(water drop, tap), 45 tl.
Adrienne Hart-Davis (DHD photo gallery):6 bl.
Audiovisual library European Commission:9 tr,9 br, 10 tl, 12, 21 tr, 37, 44, 47.
Ballard power systems: 58 bl.Bonneville Power Administration: 33 tr.Brookhaven National Laboratory: 6 bl.Bruno Girin / DHD photo gallery: 4 tr.Charles Edison Fund: 7 bl.Damon Hart-Davis (DHD photo gallery):
2 (hamburger), 55 bl.DaimlerChrystler: 8 tl.Dionysius Lardner (1793-1859), The steam
engine familiarly explained and illustrated: 5.European Fusion Development Agreement
(EFDA): 31 tr, 32, 55 tr.Fraunhover ISE: 58 tr.Illinois department of National Resources: 25 tl.Illinois Railway Museum: 6 br.John T. Daniels 1903 (Library of congres
LC-USZ62-65137): 8 bl.Ken Hammond (USDA): 45 br.Kramer Junction Company: 36.Mark-Tiele Westra: 25 br, 31 bl, 38 tl.Matt Bridger (DHD photo gallery): 21 tl.NASA: cover, 10 bl.NASA Goddard Space Flight Center: 48.Robb Williamson (PIX DOE/NREL): 35.Ross Taylor (Images of the World): 4 bl.S.M. Prokudin-Gorskii, (Library of Congress
LC-DIG-ppmsc-04415): 7 tr.Stichting Borssele 2004+: 29, 30.USDA: 50 bl.USDOE: 36.Warren Gretz (PIX DOE/NREL): 10, 38 tr, 54.www.freeimages.co.uk: 2 (computer, phone, car,
lamp, CD), 13 br, 15, 16, 51, 53, 57.