Embed Size (px)
Citation preview
Energy Performance of Tata Steel, Jamshedpur
…a journey towards excellence
Energy Efficiency Summit, 29-31 August’2018CII, Hyderabad
Slide No. 2
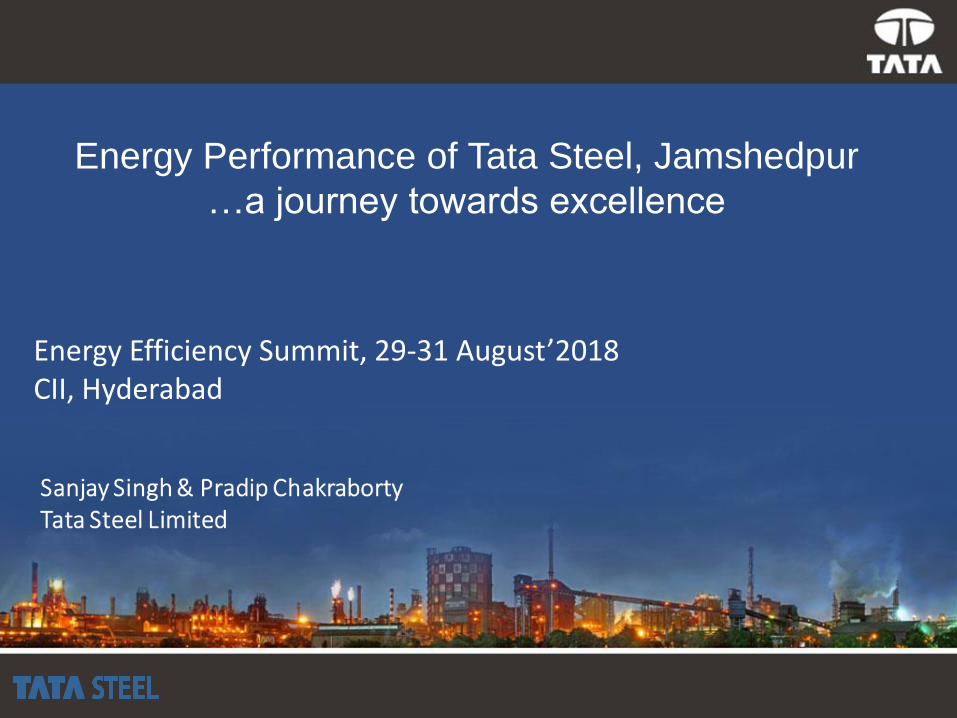
Company Profile
Established in 1907, presence in 26countries, is 2nd most geographicallydiversified Steel producer.
Bagged the Deming Application Prizeand Deming Grand Prize forcontinuous improvement.
Awarded best integrated steel plant13 times; won PM’s Trophy 11 times;Certificate for Excellence twice
Named as Steel SustainabilityChampion 2017 by World SteelAssociation
Tata Steel awarded the CII Environmental Best Practices Trophy 2018
Tata Steel GroupCapacity: 27 mtpa
Revenue (FY-17) Rs 1,17,420 crRanked 10th in World by Global
Steel Production
India & SEA[Tata Steel India]
[NatSteel] [Tata Steel Thailand]Capacity: 14.8 mtpa
Europe[Tata Steel Europe]Capacity: 12.2 mtpa
SEA
ASIA
Central and Eastern
Europe
LATIN AMRICA
NMDL,
CANADA (IRON
ORE)
IVORY
COST (IRON
ORE)
Slide No. 3
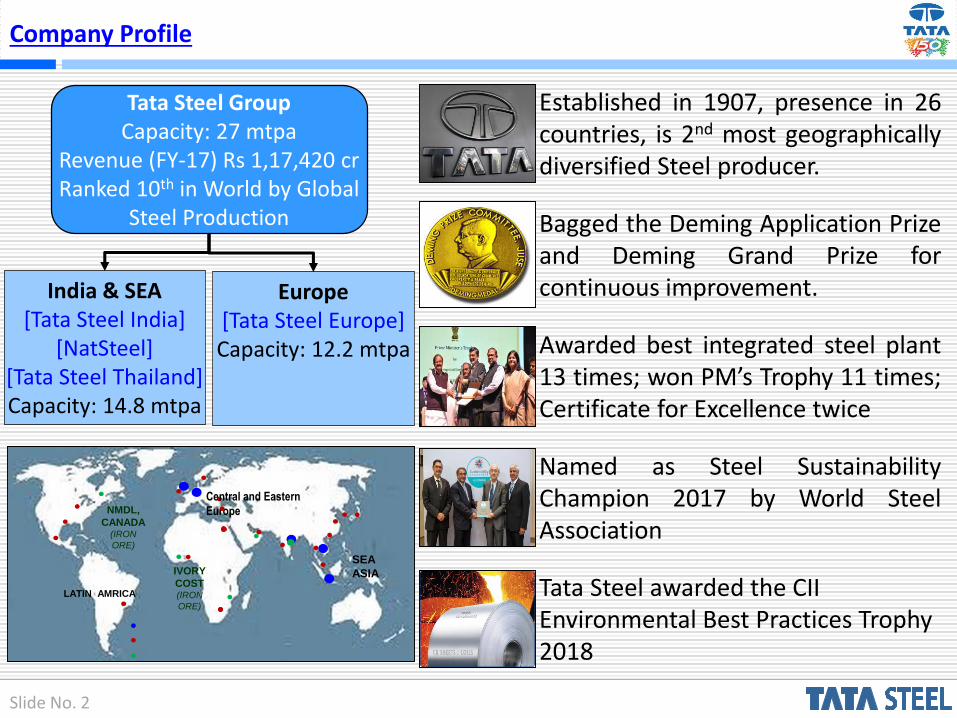
Key Work Process (Tata Steel, Jamshedpur)
Raw Materials Iron Making Steel Manufacturing
Pellet Making
Coke Making
Blast Furnaces BOF Shop
Sinter Making
Long Product Mills
Flat Product Mills
Billet Caster
Slab Caster
Ore Mining
Coal Mining
Captive & Purchased Ore, Flux,
Coal
Casting & Rolling
Slide No. 4
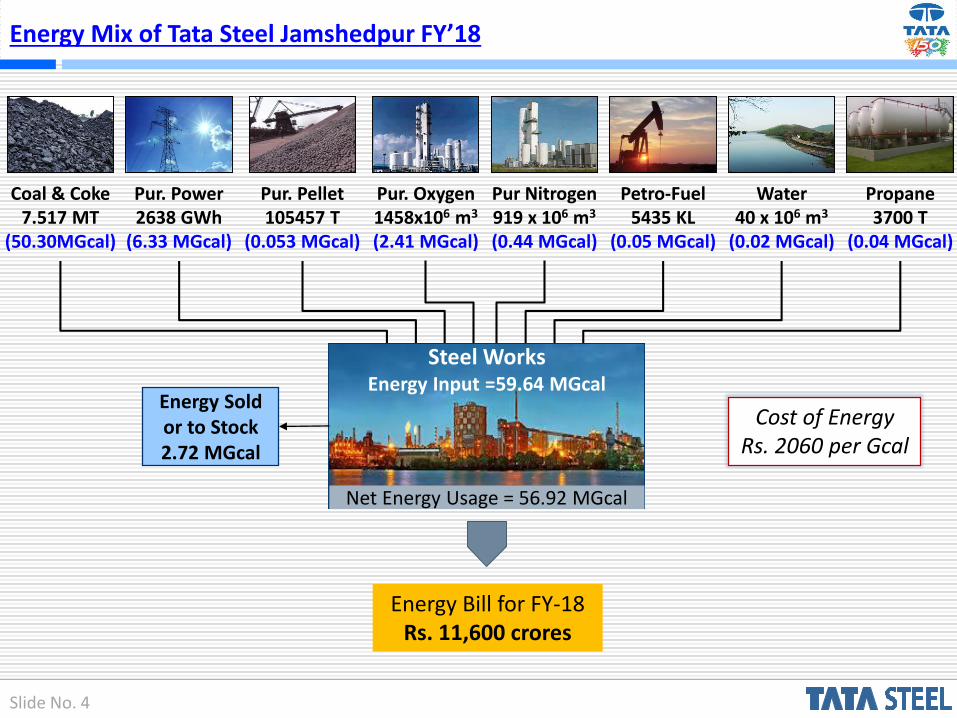
Energy Mix of Tata Steel Jamshedpur FY’18
Pur. Power2638 GWh
(6.33 MGcal)
Pur. Pellet105457 T
(0.053 MGcal)
Pur. Oxygen1458x106 m3
(2.41 MGcal)
Pur Nitrogen919 x 106 m3
(0.44 MGcal)
Petro-Fuel5435 KL
(0.05 MGcal)
Water40 x 106 m3
(0.02 MGcal)
Propane3700 T
(0.04 MGcal)
Coal & Coke7.517 MT
(50.30MGcal)
Energy Sold or to Stock 2.72 MGcal
Steel Works Energy Input =59.64 MGcal
Net Energy Usage = 56.92 MGcal
Cost of Energy Rs. 2060 per Gcal
Energy Bill for FY-18Rs. 11,600 crores
Slide No. 5
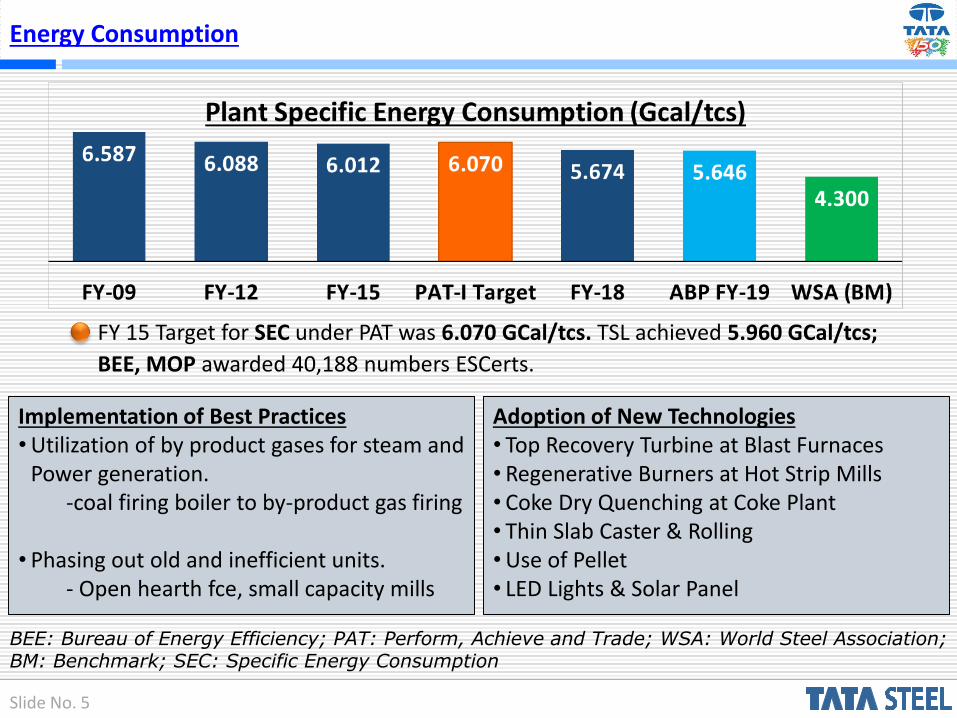
Energy Consumption
FY 15 Target for SEC under PAT was 6.070 GCal/tcs. TSL achieved 5.960 GCal/tcs;
BEE, MOP awarded 40,188 numbers ESCerts.
BEE: Bureau of Energy Efficiency; PAT: Perform, Achieve and Trade; WSA: World Steel Association; BM: Benchmark; SEC: Specific Energy Consumption
Implementation of Best Practices• Utilization of by product gases for steam and
Power generation.-coal firing boiler to by-product gas firing
• Phasing out old and inefficient units.- Open hearth fce, small capacity mills
Adoption of New Technologies• Top Recovery Turbine at Blast Furnaces• Regenerative Burners at Hot Strip Mills• Coke Dry Quenching at Coke Plant• Thin Slab Caster & Rolling• Use of Pellet• LED Lights & Solar Panel
Slide No. 6
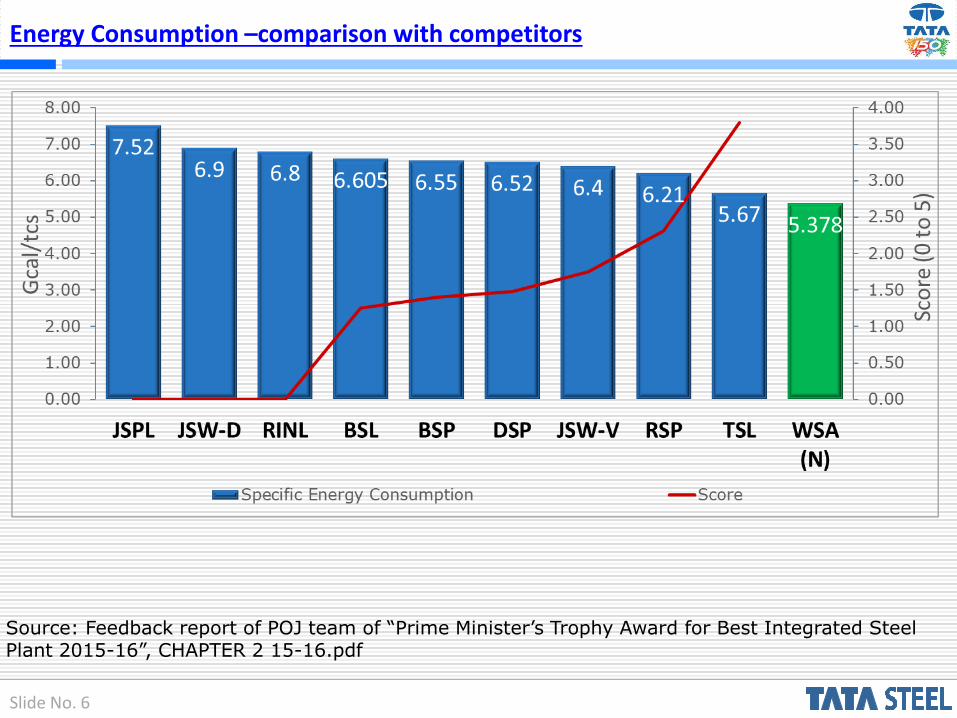
Energy Consumption –comparison with competitors
Source: Feedback report of POJ team of “Prime Minister’s Trophy Award for Best Integrated Steel Plant 2015-16”, CHAPTER 2 15-16.pdf
Slide No. 7
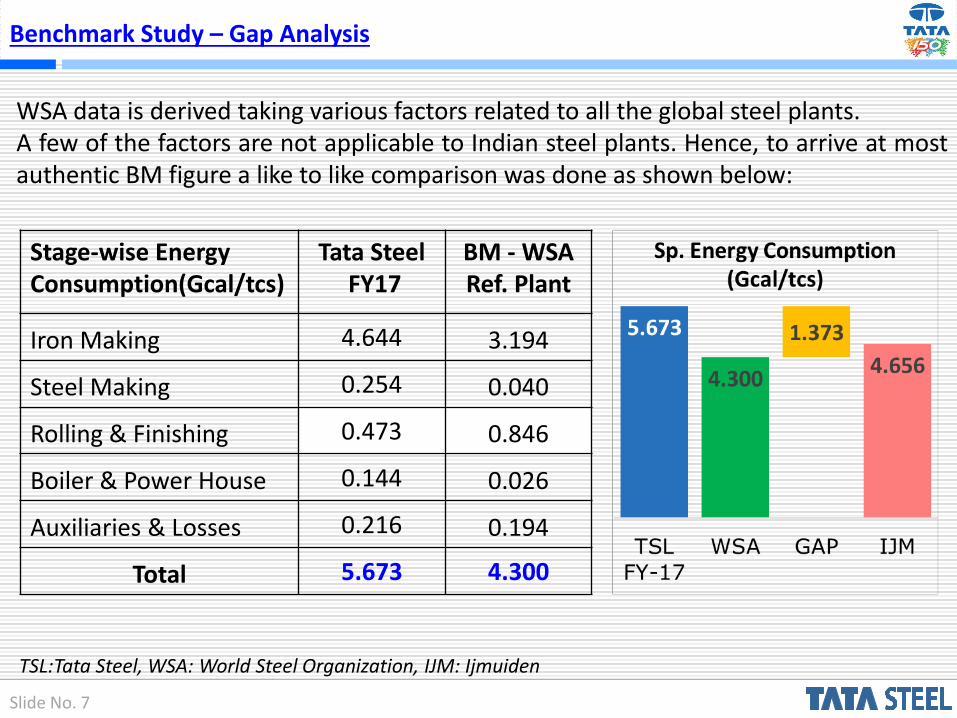
Benchmark Study – Gap Analysis
Stage-wise Energy Consumption(Gcal/tcs)
Tata SteelFY17
BM - WSA Ref. Plant
Iron Making 4.644 3.194
Steel Making 0.254 0.040
Rolling & Finishing 0.473 0.846
Boiler & Power House 0.144 0.026
Auxiliaries & Losses 0.216 0.194
Total 5.673 4.300
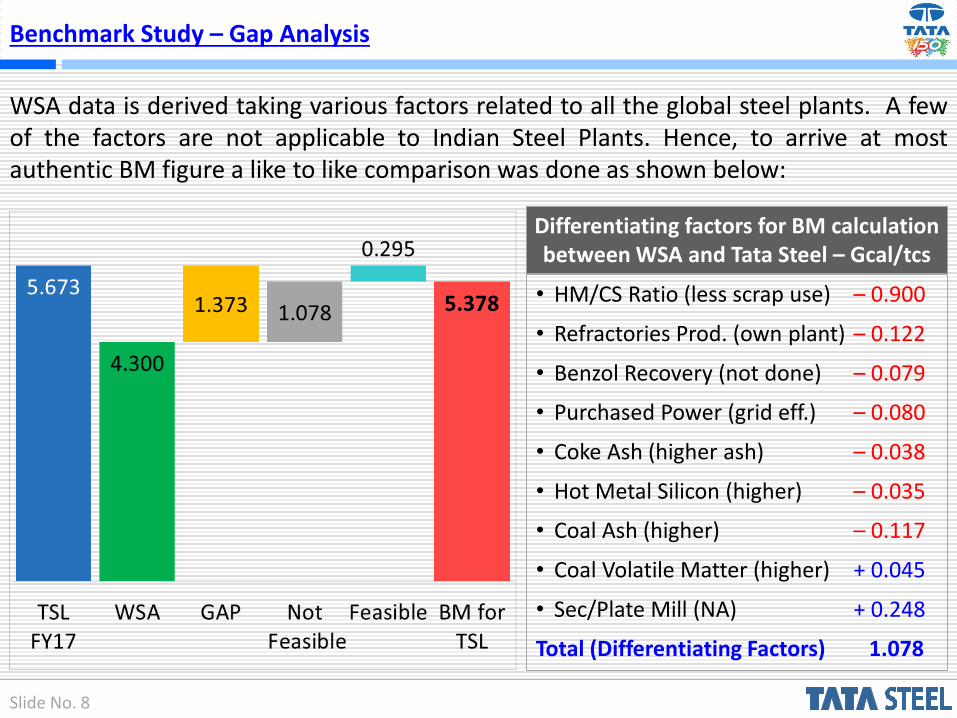
WSA data is derived taking various factors related to all the global steel plants.A few of the factors are not applicable to Indian steel plants. Hence, to arrive at mostauthentic BM figure a like to like comparison was done as shown below:
TSL:Tata Steel, WSA: World Steel Organization, IJM: Ijmuiden
Slide No. 8
Benchmark Study – Gap Analysis
WSA data is derived taking various factors related to all the global steel plants. A fewof the factors are not applicable to Indian Steel Plants. Hence, to arrive at mostauthentic BM figure a like to like comparison was done as shown below:
• HM/CS Ratio (less scrap use) – 0.900
• Refractories Prod. (own plant) – 0.122
• Benzol Recovery (not done) – 0.079
• Purchased Power (grid eff.) – 0.080
• Coke Ash (higher ash) – 0.038
• Hot Metal Silicon (higher) – 0.035
• Coal Ash (higher) – 0.117
• Coal Volatile Matter (higher) + 0.045
• Sec/Plate Mill (NA) + 0.248
Total (Differentiating Factors) 1.078
Differentiating factors for BM calculation between WSA and Tata Steel – Gcal/tcs
Slide No. 9
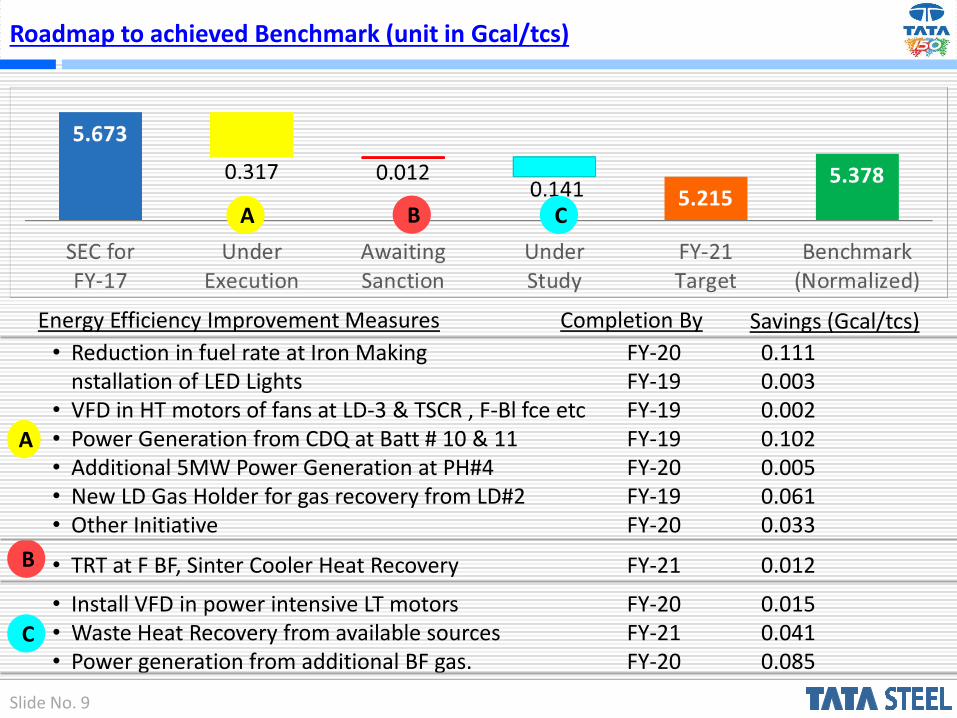
Roadmap to achieved Benchmark (unit in Gcal/tcs)
Energy Efficiency Improvement Measures Completion By Savings (Gcal/tcs)
• Reduction in fuel rate at Iron Making FY-20 0.111 nstallation of LED Lights FY-19 0.003
• VFD in HT motors of fans at LD-3 & TSCR , F-Bl fce etc FY-19 0.002 • Power Generation from CDQ at Batt # 10 & 11 FY-19 0.102 • Additional 5MW Power Generation at PH#4 FY-20 0.005 • New LD Gas Holder for gas recovery from LD#2 FY-19 0.061 • Other Initiative FY-20 0.033
• TRT at F BF, Sinter Cooler Heat Recovery FY-21 0.012
• Install VFD in power intensive LT motors FY-20 0.015 • Waste Heat Recovery from available sources FY-21 0.041 • Power generation from additional BF gas. FY-20 0.085
A B C
A
B
C

Slide No. 10
Energy Recovery Gap Analysis & Opportunity (MGCal)
Total thermal Energy Input.A
Heat Energy available for use.
B
Heat Energy converted to useful work. (Petro-fuel)
C
Loss due to Condensation, Radiation & Others.
D
A B C D
Thermal Energy Input vs Waste Heat
Heat Energy available for use.
B
Heat Energy being Recovered.
E
Future Plan for Energy Recovery.
F
Opportunity to be explored.G
Waste Energy Available vs Recovery
B E F G
Opportunity to be explored.G
Sensible Heat of flue gases, By-Product Gases & Water.
H
Thro’ application of Daily Mgt. 50% can be Recovered.
I
Technology available but not economically viable.
J
G H I J
Opportunity for Waste Heat Recovery
Slide No. 11
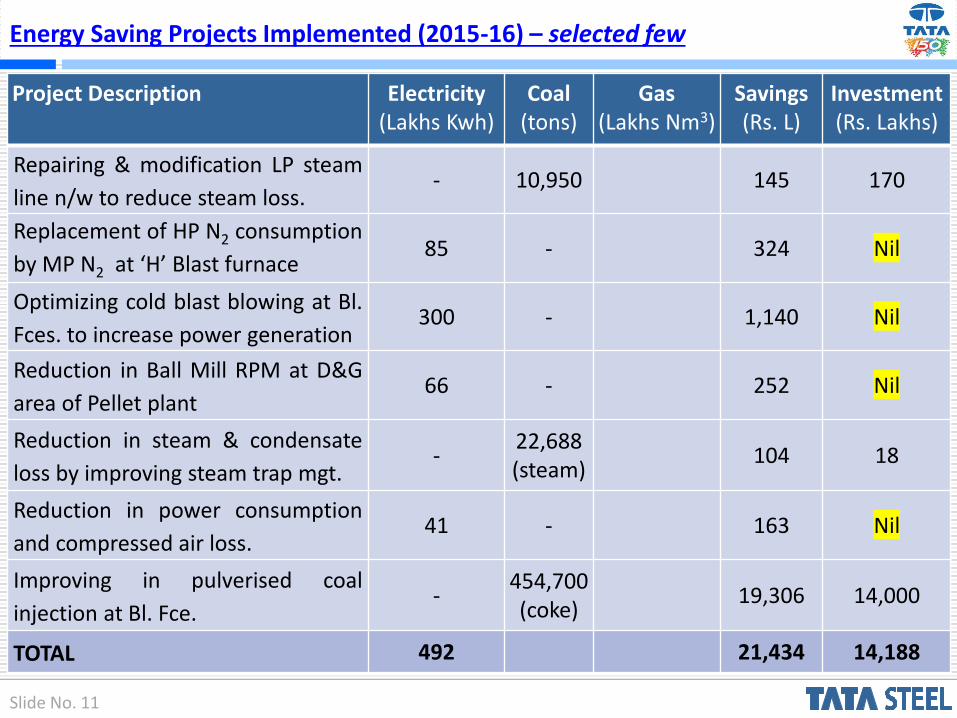
Project Description Electricity(Lakhs Kwh)
Coal (tons)
Gas(Lakhs Nm3)
Savings (Rs. L)
Investment (Rs. Lakhs)
Repairing & modification LP steam
line n/w to reduce steam loss.- 10,950 145 170
Replacement of HP N2 consumption
by MP N2 at ‘H’ Blast furnace85 - 324 Nil
Optimizing cold blast blowing at Bl.
Fces. to increase power generation300 - 1,140 Nil
Reduction in Ball Mill RPM at D&G
area of Pellet plant66 - 252 Nil
Reduction in steam & condensate
loss by improving steam trap mgt.-
22,688 (steam)
104 18
Reduction in power consumption
and compressed air loss.41 - 163 Nil
Improving in pulverised coal
injection at Bl. Fce.-
454,700 (coke)
19,306 14,000
TOTAL 492 21,434 14,188
Energy Saving Projects Implemented (2015-16) – selected few
Slide No. 12
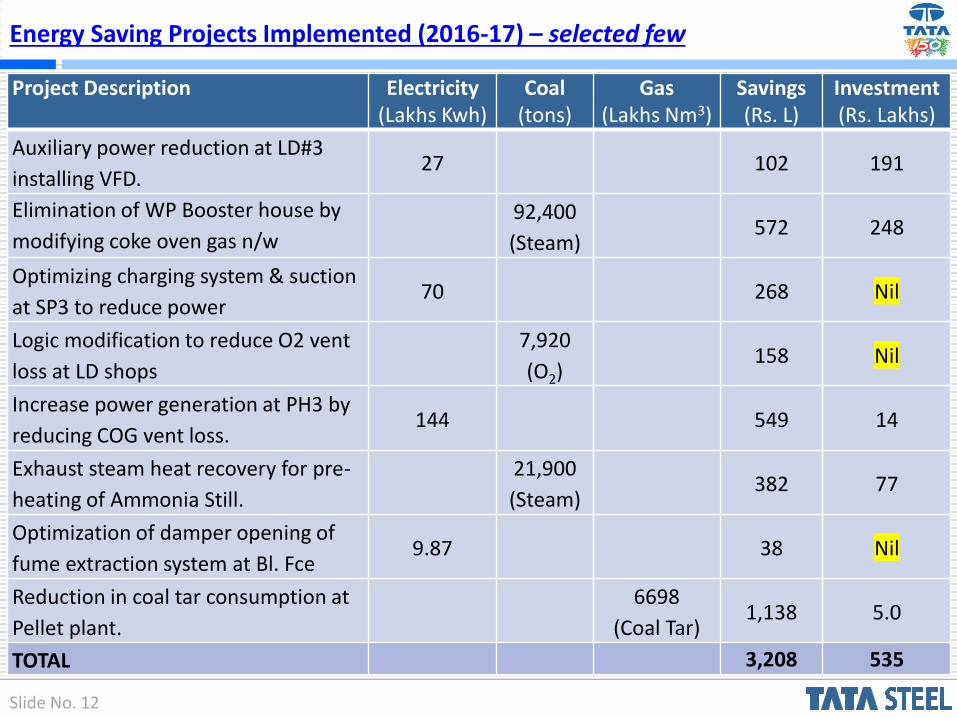
Project Description Electricity(Lakhs Kwh)
Coal (tons)
Gas(Lakhs Nm3)
Savings (Rs. L)
Investment (Rs. Lakhs)
Auxiliary power reduction at LD#3
installing VFD.27 102 191
Elimination of WP Booster house by
modifying coke oven gas n/w
92,400
(Steam)572 248
Optimizing charging system & suction
at SP3 to reduce power70 268 Nil
Logic modification to reduce O2 vent
loss at LD shops
7,920
(O2)158 Nil
Increase power generation at PH3 by
reducing COG vent loss.144 549 14
Exhaust steam heat recovery for pre-
heating of Ammonia Still.
21,900
(Steam)382 77
Optimization of damper opening of
fume extraction system at Bl. Fce9.87 38 Nil
Reduction in coal tar consumption at
Pellet plant.
6698
(Coal Tar)1,138 5.0
TOTAL 3,208 535
Energy Saving Projects Implemented (2016-17) – selected few
Slide No. 13
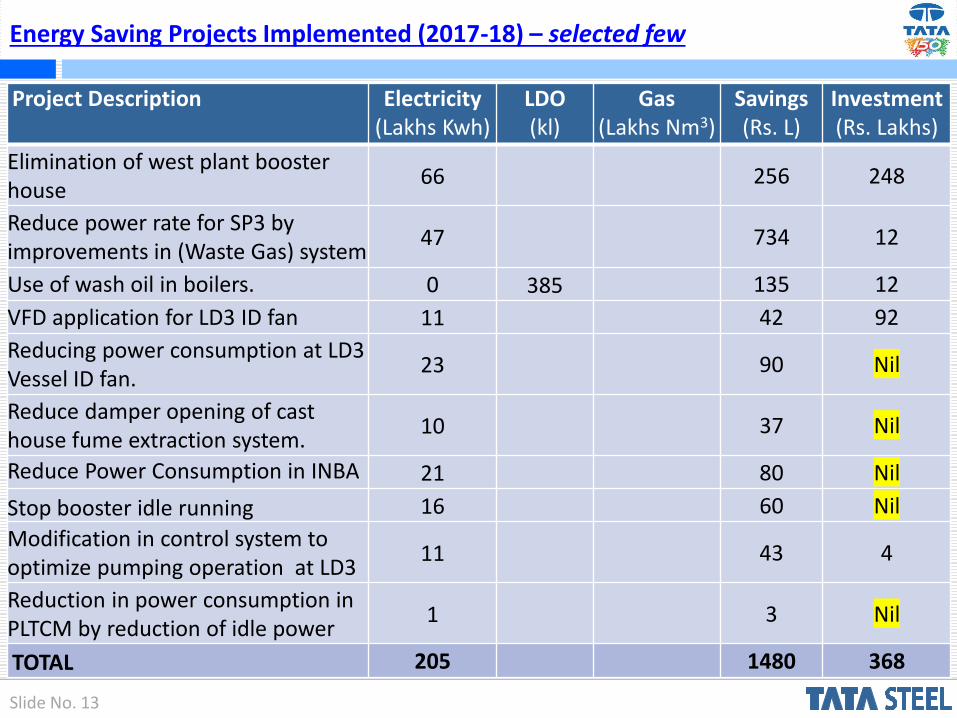
Project Description Electricity(Lakhs Kwh)
LDO (kl)
Gas(Lakhs Nm3)
Savings (Rs. L)
Investment (Rs. Lakhs)
Elimination of west plant booster house
66 256 248
Reduce power rate for SP3 by improvements in (Waste Gas) system
47 734 12
Use of wash oil in boilers. 0 385 135 12
VFD application for LD3 ID fan 11 42 92
Reducing power consumption at LD3 Vessel ID fan.
23 90 Nil
Reduce damper opening of cast house fume extraction system.
10 37 Nil
Reduce Power Consumption in INBA 21 80 Nil
Stop booster idle running 16 60 Nil
Modification in control system to optimize pumping operation at LD3
11 43 4
Reduction in power consumption in PLTCM by reduction of idle power
1 3 Nil
TOTAL 205 1480 368
Energy Saving Projects Implemented (2017-18) – selected few
Slide No. 14
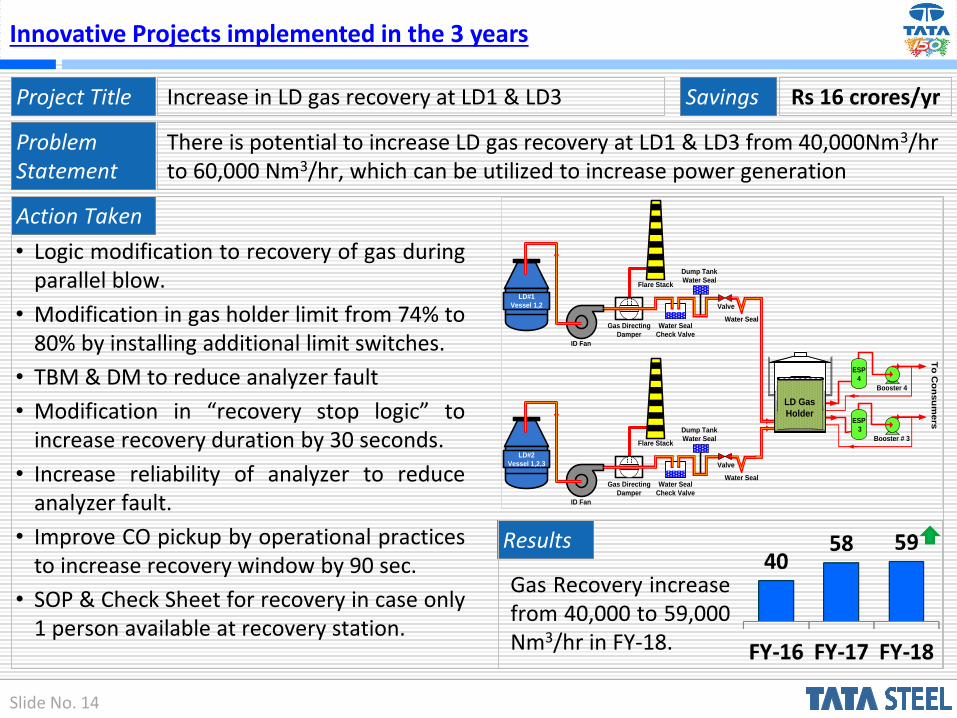
Innovative Projects implemented in the 3 years
Project Title Increase in LD gas recovery at LD1 & LD3
Problem Statement
There is potential to increase LD gas recovery at LD1 & LD3 from 40,000Nm3/hrto 60,000 Nm3/hr, which can be utilized to increase power generation
• Logic modification to recovery of gas duringparallel blow.
• Modification in gas holder limit from 74% to80% by installing additional limit switches.
• TBM & DM to reduce analyzer fault
• Modification in “recovery stop logic” toincrease recovery duration by 30 seconds.
• Increase reliability of analyzer to reduceanalyzer fault.
• Improve CO pickup by operational practicesto increase recovery window by 90 sec.
• SOP & Check Sheet for recovery in case only1 person available at recovery station.
LD#2
Vessel 1,2,3
Gas Directing
Damper
Water Seal
Check Valve
Dump Tank
Water Seal
Water Seal
Valve
Flare Stack
ID Fan
LD#1
Vessel 1,2
Gas Directing
Damper
Water Seal
Check Valve
Dump Tank
Water Seal
Water Seal
Valve
Flare Stack
ID Fan
Booster # 3
ESP
3
Booster 4
ESP
4
LD Gas
Holder
To
Co
ns
um
ers
Action Taken
Savings Rs 16 crores/yr
Results
Gas Recovery increasefrom 40,000 to 59,000Nm3/hr in FY-18.
Slide No. 15
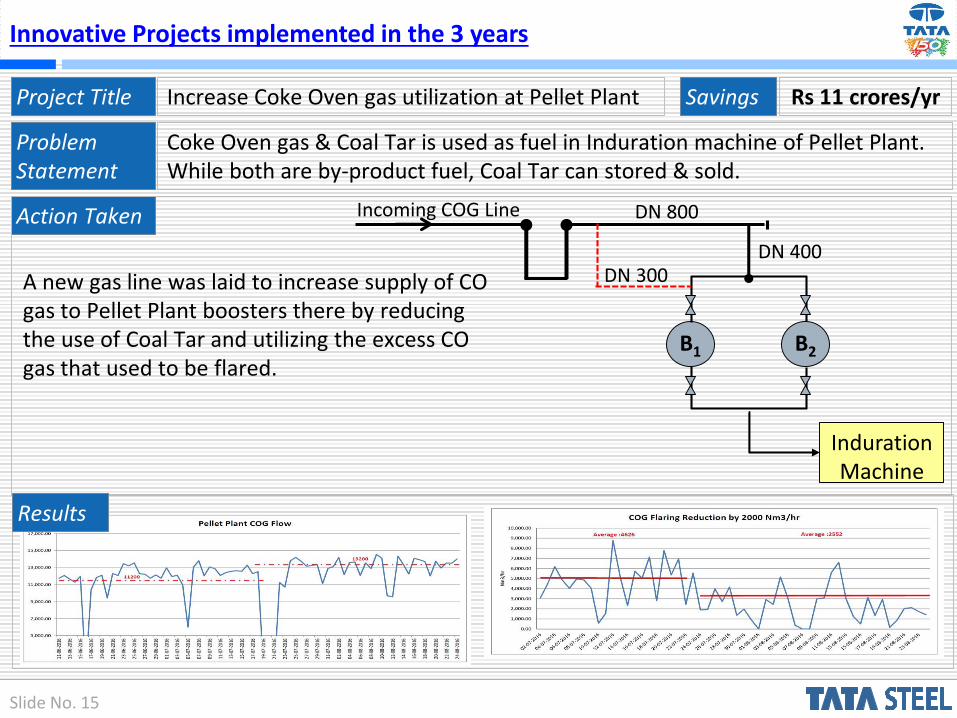
Innovative Projects implemented in the 3 years
Project Title Increase Coke Oven gas utilization at Pellet Plant
Problem Statement
Coke Oven gas & Coal Tar is used as fuel in Induration machine of Pellet Plant. While both are by-product fuel, Coal Tar can stored & sold.
Action Taken
Savings Rs 11 crores/yr
A new gas line was laid to increase supply of CO gas to Pellet Plant boosters there by reducing the use of Coal Tar and utilizing the excess CO gas that used to be flared.
B1 B2
Induration Machine
Incoming COG Line DN 800
DN 400DN 300
Results
Slide No. 16
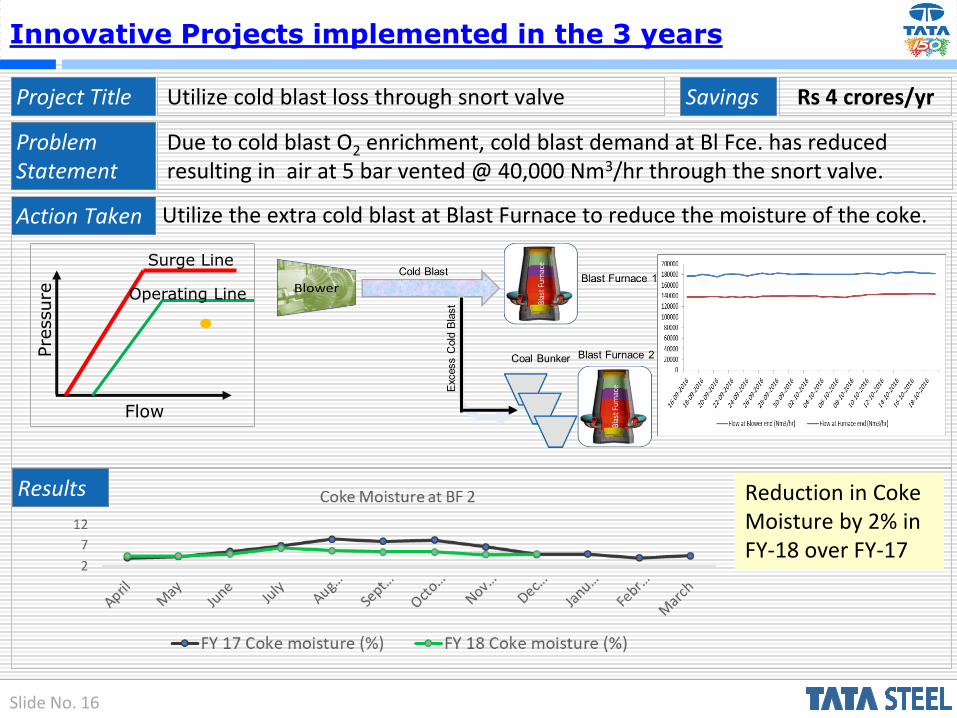
Innovative Projects implemented in the 3 years
Project Title Utilize cold blast loss through snort valve
Problem Statement
Due to cold blast O2 enrichment, cold blast demand at Bl Fce. has reduced resulting in air at 5 bar vented @ 40,000 Nm3/hr through the snort valve.
Action Taken
Savings Rs 4 crores/yr
Utilize the extra cold blast at Blast Furnace to reduce the moisture of the coke.
Results Reduction in Coke Moisture by 2% in FY-18 over FY-17
Surge Line
Operating Line
Pre
ssure
Flow
Slide No. 17
Utilization of Renewable Energy Source
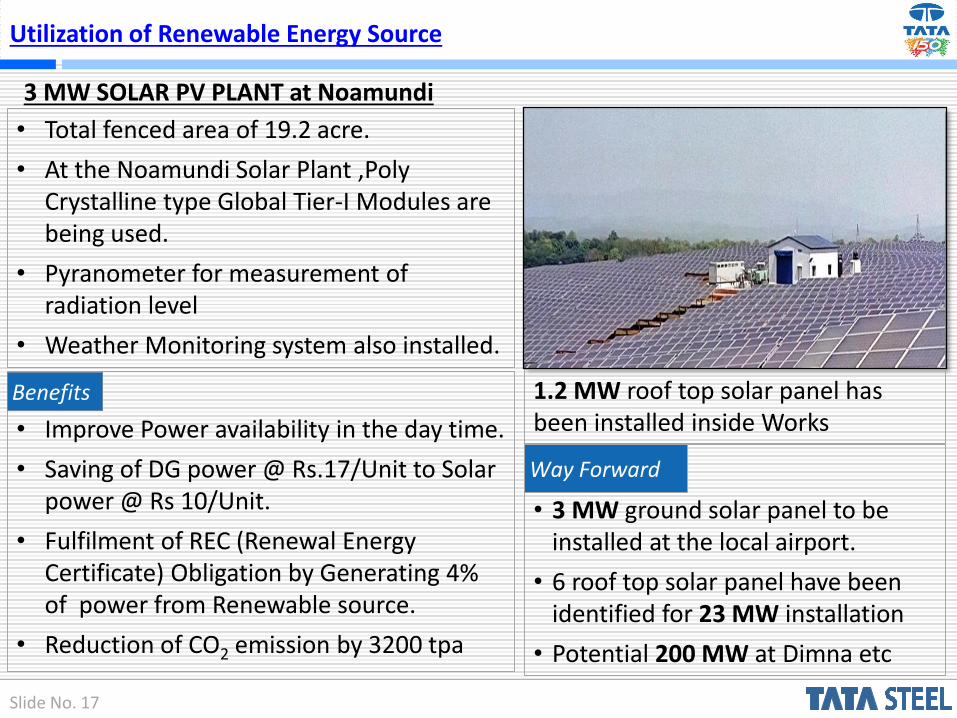
3 MW SOLAR PV PLANT at Noamundi
• Total fenced area of 19.2 acre.
• At the Noamundi Solar Plant ,Poly Crystalline type Global Tier-I Modules are being used.
• Pyranometer for measurement of radiation level
• Weather Monitoring system also installed.
• Improve Power availability in the day time.
• Saving of DG power @ Rs.17/Unit to Solar power @ Rs 10/Unit.
• Fulfilment of REC (Renewal Energy Certificate) Obligation by Generating 4% of power from Renewable source.
• Reduction of CO2 emission by 3200 tpa
Benefits
Way Forward
• 3 MW ground solar panel to be installed at the local airport.
• 6 roof top solar panel have been identified for 23 MW installation
• Potential 200 MW at Dimna etc
1.2 MW roof top solar panel has been installed inside Works
Slide No. 18
Utilization of waste material as fuel – project 1
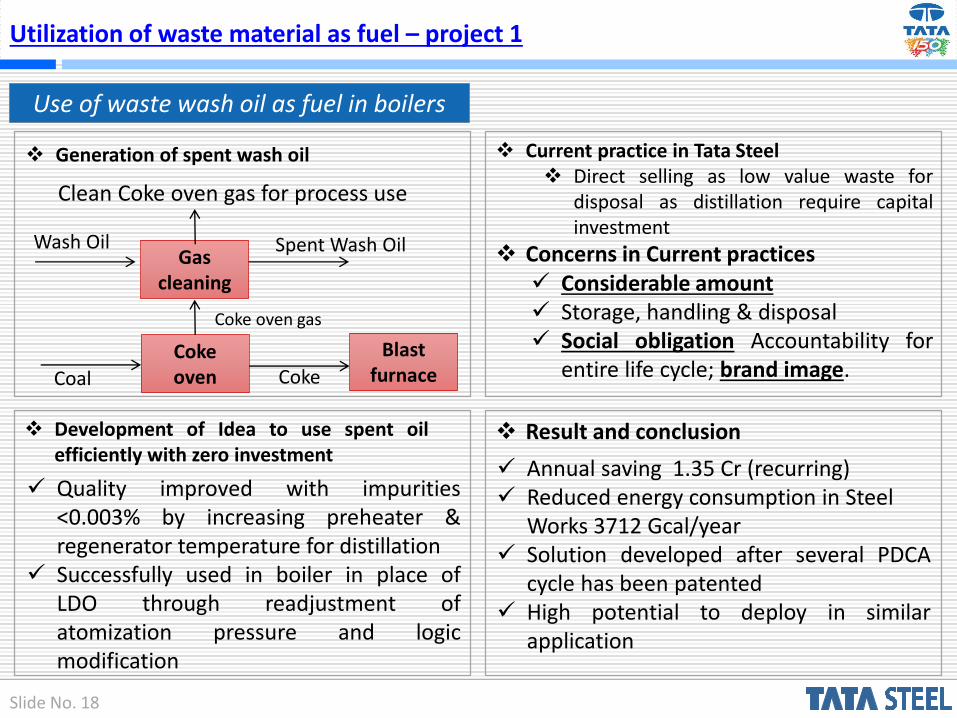
Use of waste wash oil as fuel in boilers
❖ Concerns in Current practices
❖ Development of Idea to use spent oilefficiently with zero investment
❖ Current practice in Tata Steel❖ Direct selling as low value waste for
disposal as distillation require capitalinvestment
✓ Considerable amount✓ Storage, handling & disposal✓ Social obligation Accountability for
entire life cycle; brand image.Coke ovenCoal Coke
Coke oven gas
Blast furnace
❖ Generation of spent wash oil
Gas cleaning
Wash Oil Spent Wash Oil
Clean Coke oven gas for process use
✓ Quality improved with impurities<0.003% by increasing preheater ®enerator temperature for distillation
✓ Successfully used in boiler in place ofLDO through readjustment ofatomization pressure and logicmodification
❖ Result and conclusion
✓ Annual saving 1.35 Cr (recurring)✓ Reduced energy consumption in Steel
Works 3712 Gcal/year✓ Solution developed after several PDCA
cycle has been patented✓ High potential to deploy in similar
application
Slide No. 19
Utilization of waste material as fuel – project 1 (cont..)
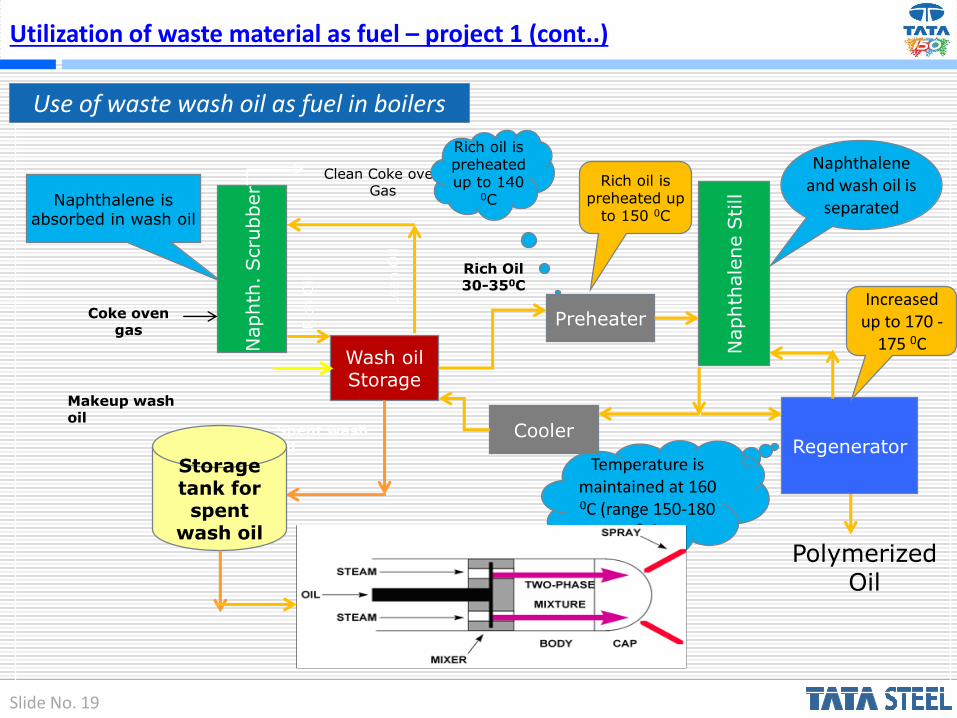
Use of waste wash oil as fuel in boilers
Naphthalene is absorbed in wash oil
Wash oil Storage
Spent wash oil
Ric
h O
il
Naphth
. Scru
bber
Coke oven gas
Clean Coke oven Gas
Storage tank for spent
wash oil
Lean O
ilMakeup wash oil
Temperature is maintained at 160 0C (range 150-180
0C)
Rich oil is preheated up to 140
0C
Naphthalene and wash oil is
separated
Preheater
Naphth
ale
ne S
till
RegeneratorCooler
Rich Oil30-350C
Rich oil is preheated up
to 150 0C
Increased up to 170 -
175 0C
Polymerized Oil
Slide No. 20
Utilization of waste material as fuel – project 2
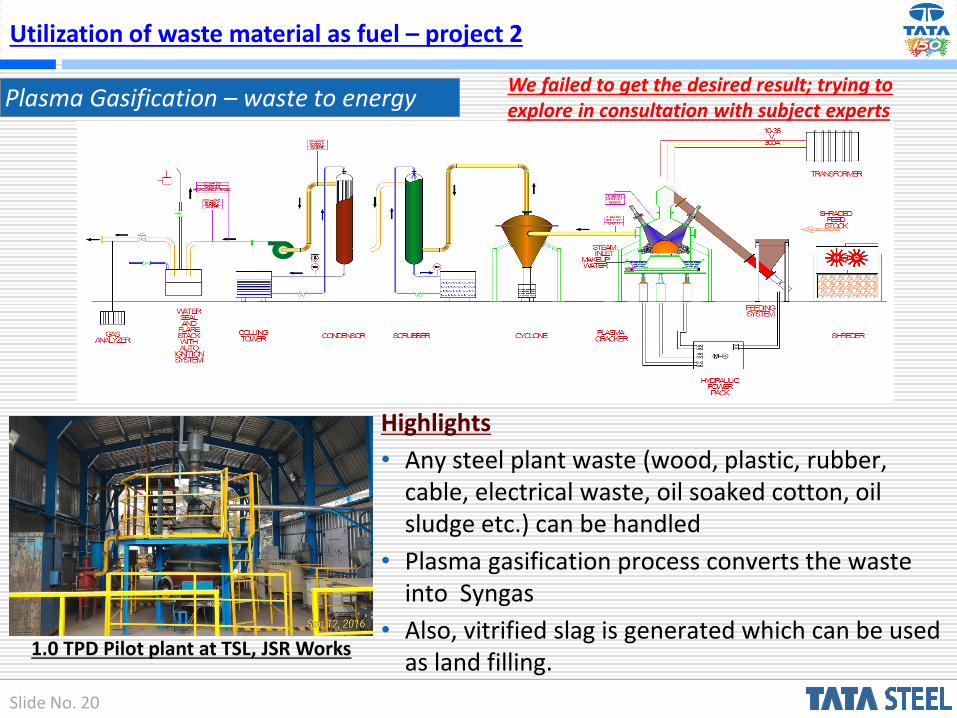
Plasma Gasification – waste to energy
Highlights
• Any steel plant waste (wood, plastic, rubber, cable, electrical waste, oil soaked cotton, oil sludge etc.) can be handled
• Plasma gasification process converts the waste into Syngas
• Also, vitrified slag is generated which can be used as land filling.
1.0 TPD Pilot plant at TSL, JSR Works
We failed to get the desired result; trying to explore in consultation with subject experts
Slide No. 21
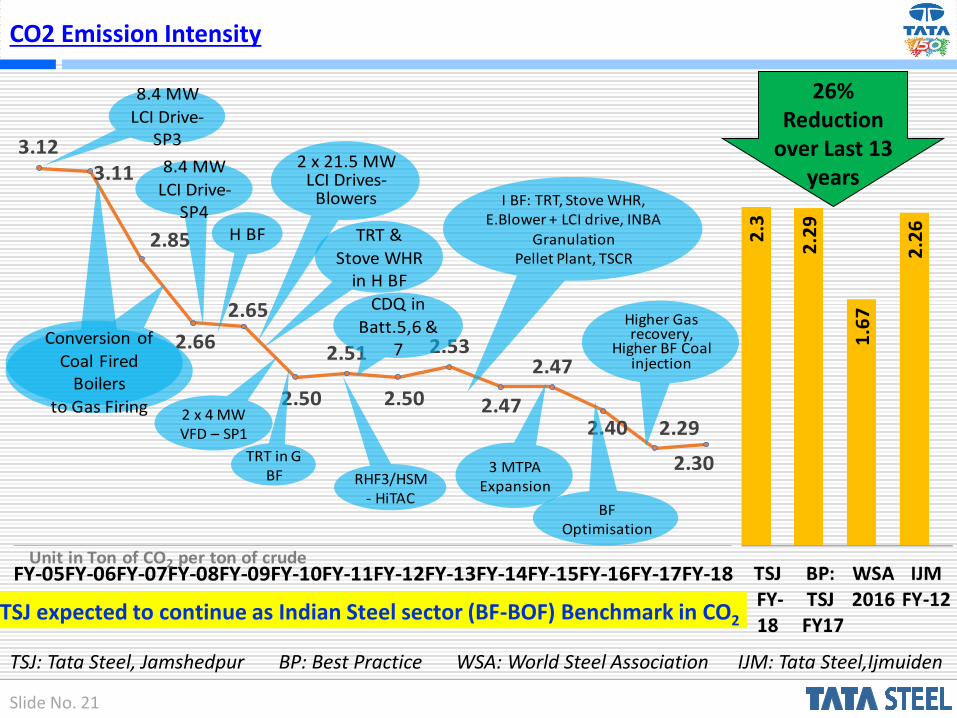
CO2 Emission Intensity
3.123.11
2.85
2.66
2.65
2.50
2.51
2.50
2.53
2.47
2.47
2.40 2.29
2.30
FY-05FY-06FY-07FY-08FY-09FY-10FY-11FY-12FY-13FY-14FY-15FY-16FY-17FY-18
8.4 MW
LCI Drive-SP3
Conversion of
Coal Fired Boilers
to Gas Firing
8.4 MW
LCI Drive-SP4
H BF TRT &
Stove WHR in H BF
2 x 21.5 MW LCI Drives-
Blowers
2 x 4 MW VFD – SP1
TRT in G BF
CDQ in
Batt.5,6 & 7
I BF: TRT, Stove WHR, E.Blower + LCI drive, INBA
GranulationPellet Plant, TSCR
RHF3/HSM - HiTAC
BF Optimisation
3 MTPA Expansion
Unit in Ton of CO2 per ton of crude
Higher Gasrecovery,
Higher BF Coal injection
TSJ expected to continue as Indian Steel sector (BF-BOF) Benchmark in CO2
26% Reduction
over Last 13 years
TSJ: Tata Steel, Jamshedpur BP: Best Practice WSA: World Steel Association IJM: Tata Steel,Ijmuiden
Slide No. 22
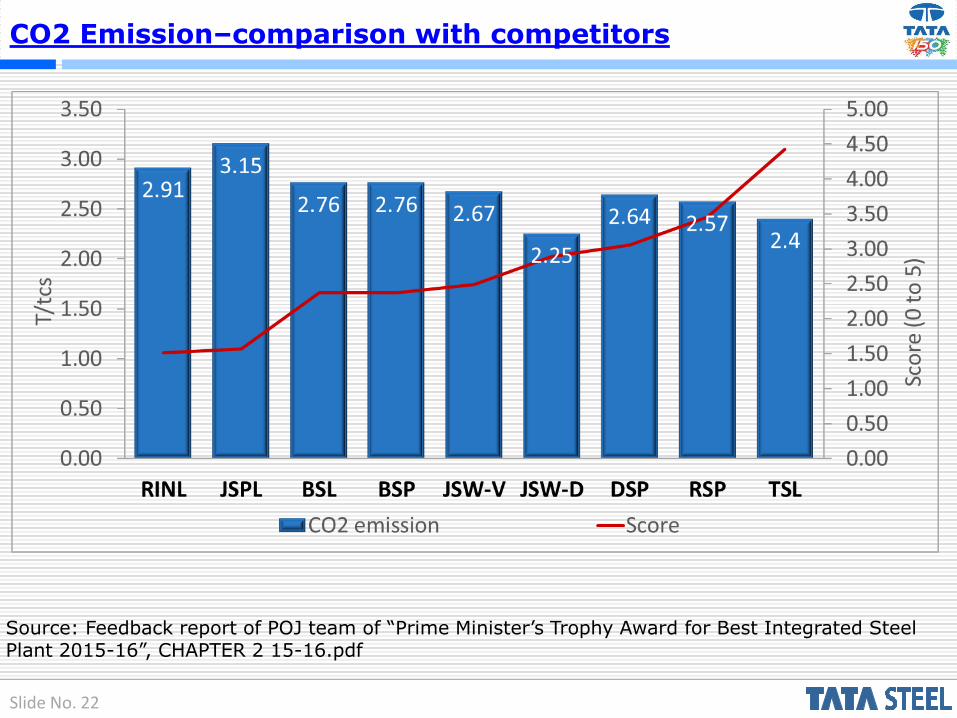
CO2 Emission–comparison with competitors
Source: Feedback report of POJ team of “Prime Minister’s Trophy Award for Best Integrated Steel Plant 2015-16”, CHAPTER 2 15-16.pdf
Slide No. 23
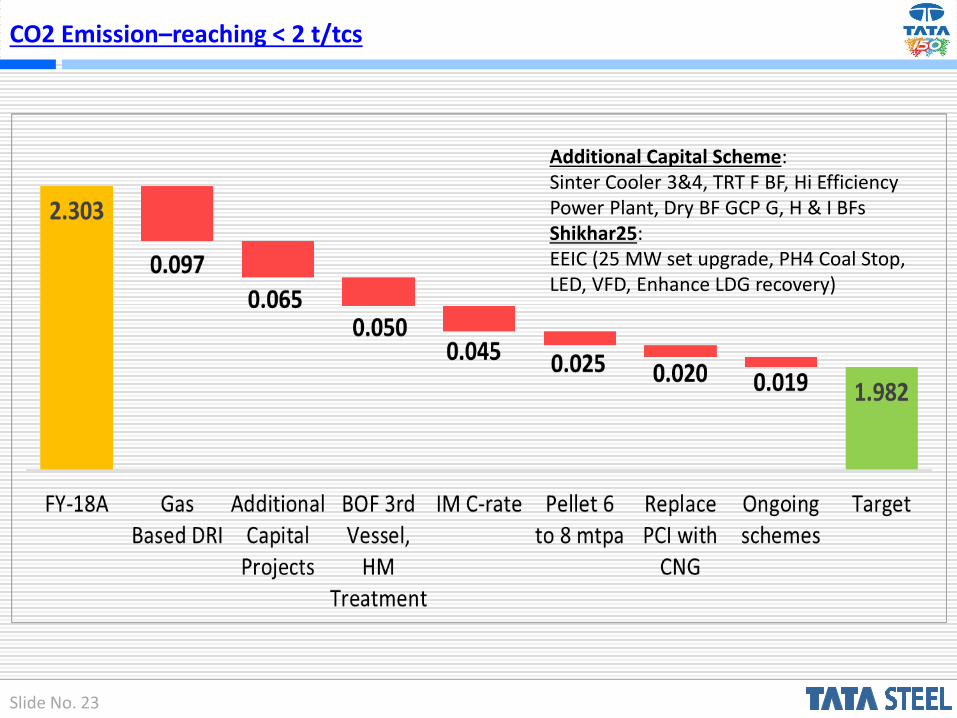
CO2 Emission–reaching < 2 t/tcs
Additional Capital Scheme:Sinter Cooler 3&4, TRT F BF, Hi Efficiency Power Plant, Dry BF GCP G, H & I BFsShikhar25:EEIC (25 MW set upgrade, PH4 Coal Stop, LED, VFD, Enhance LDG recovery)
Slide No. 24
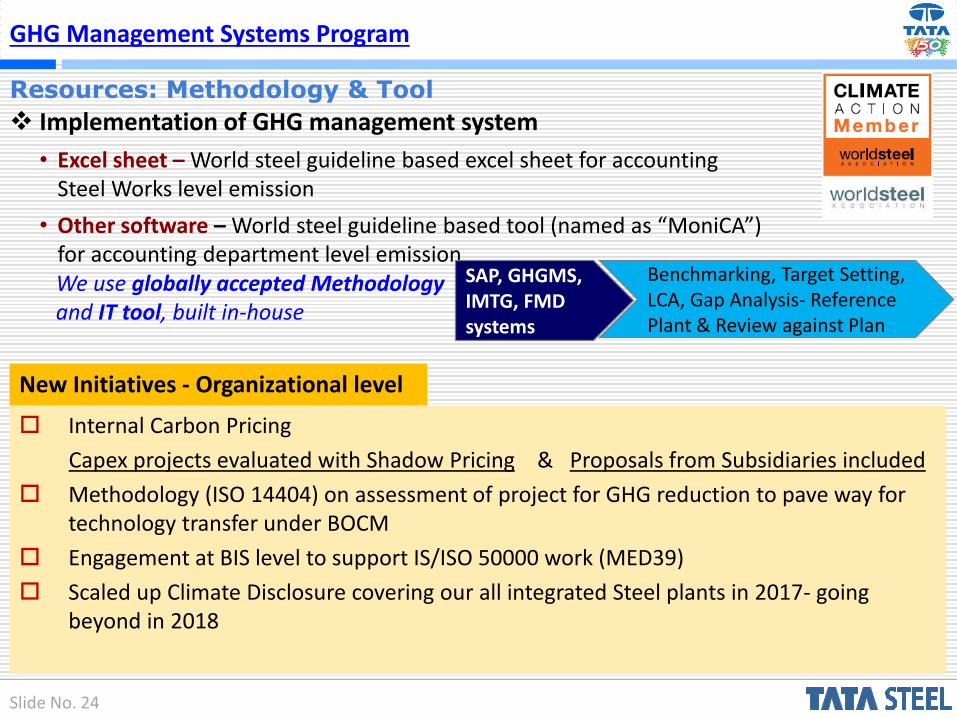
GHG Management Systems Program
Resources: Methodology & Tool
❖ Implementation of GHG management system
• Excel sheet – World steel guideline based excel sheet for accounting Steel Works level emission
• Other software – World steel guideline based tool (named as “MoniCA”) for accounting department level emission
SAP, GHGMS, IMTG, FMD systems
Benchmarking, Target Setting, LCA, Gap Analysis- Reference Plant & Review against Plan
We use globally accepted Methodologyand IT tool, built in-house
New Initiatives - Organizational level
Internal Carbon Pricing
Capex projects evaluated with Shadow Pricing & Proposals from Subsidiaries included
Methodology (ISO 14404) on assessment of project for GHG reduction to pave way for technology transfer under BOCM
Engagement at BIS level to support IS/ISO 50000 work (MED39)
Scaled up Climate Disclosure covering our all integrated Steel plants in 2017- going beyond in 2018
Slide No. 25
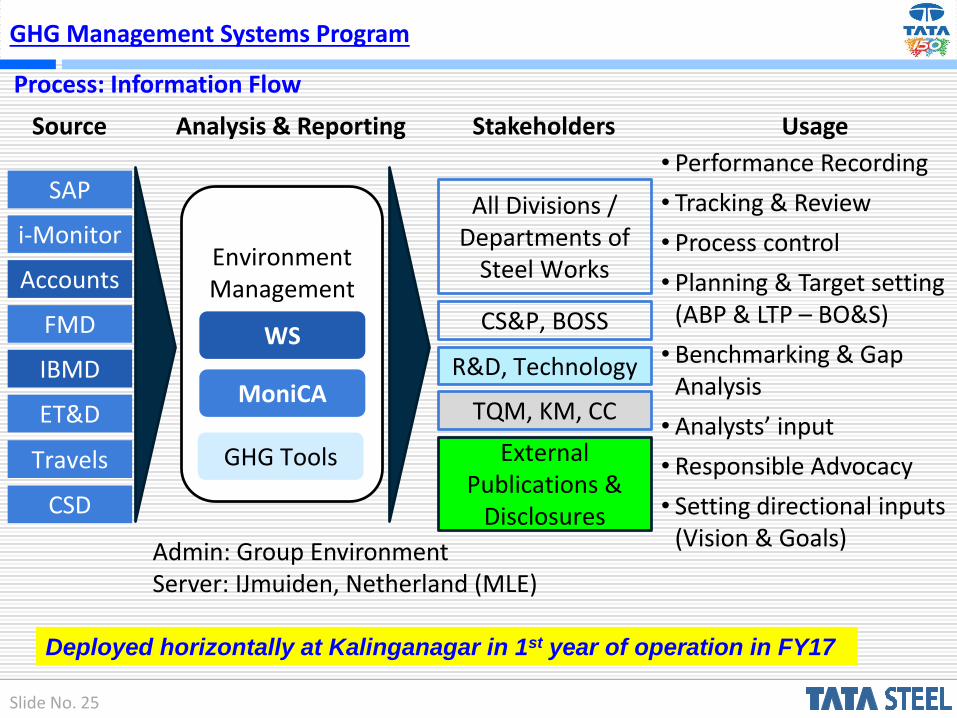
GHG Management Systems Program
Environment Management
SAP
i-Monitor
Accounts
FMD
IBMD
ET&D
All Divisions / Departments of
Steel Works
WS
MoniCAR&D, Technology
CS&P, BOSS
Source Analysis & Reporting Stakeholders Usage
• Performance Recording
• Tracking & Review
• Process control
• Planning & Target setting (ABP & LTP – BO&S)
• Benchmarking & Gap Analysis
• Analysts’ input
• Responsible Advocacy
• Setting directional inputs (Vision & Goals)
TQM, KM, CC
Travels
CSD
GHG Tools External Publications &
Disclosures
Admin: Group EnvironmentServer: IJmuiden, Netherland (MLE)
Deployed horizontally at Kalinganagar in 1st year of operation in FY17
Process: Information Flow
Slide No. 26
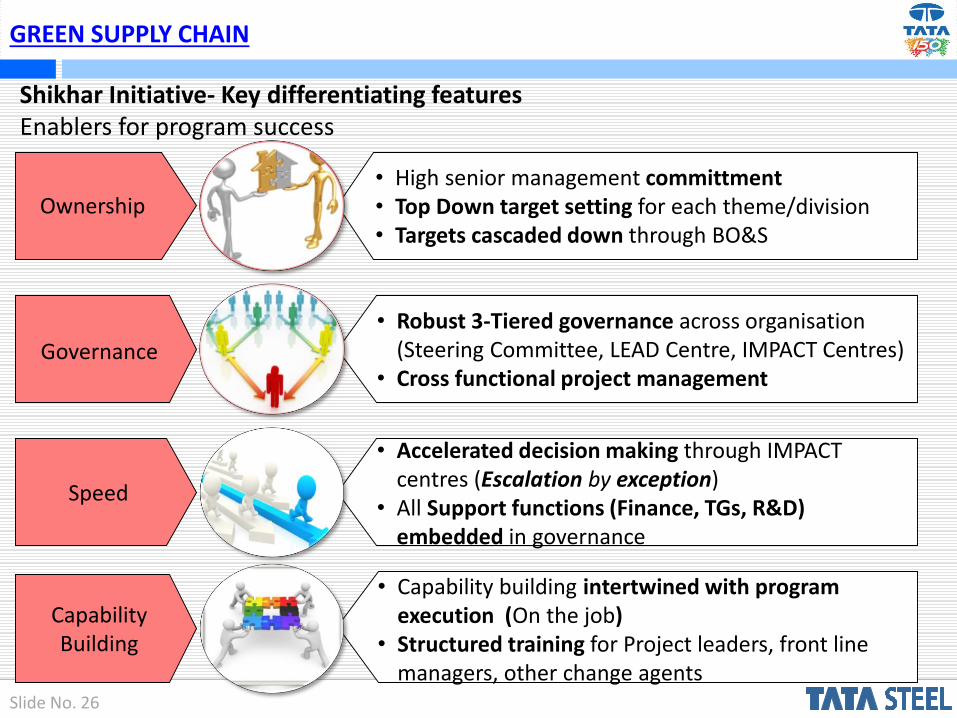
Shikhar Initiative- Key differentiating featuresEnablers for program success
Ownership• High senior management committment • Top Down target setting for each theme/division• Targets cascaded down through BO&S
Governance
• Robust 3-Tiered governance across organisation (Steering Committee, LEAD Centre, IMPACT Centres)
• Cross functional project management
Speed
• Accelerated decision making through IMPACT centres (Escalation by exception)
• All Support functions (Finance, TGs, R&D) embedded in governance
Capability Building
• Capability building intertwined with program execution (On the job)
• Structured training for Project leaders, front line managers, other change agents
GREEN SUPPLY CHAIN
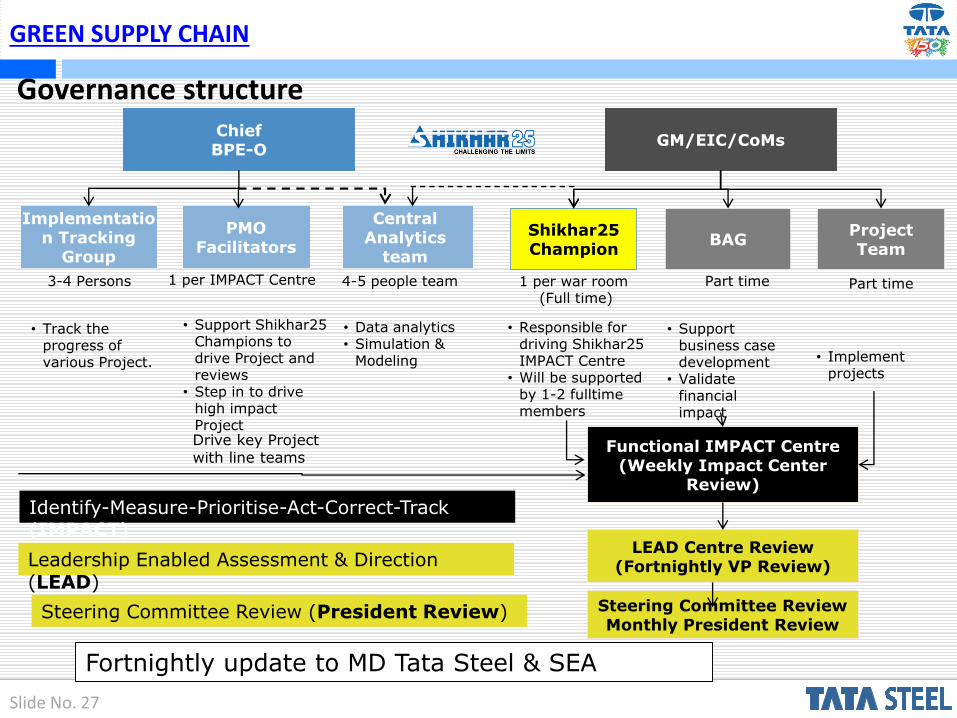
Slide No. 27
Governance structureChiefBPE-O
GM/EIC/CoMs
Implementation Tracking
Group
Central Analytics
team
PMO Facilitators
Shikhar25 Champion
BAGProject Team
• Track the progress of various Project.
• Data analytics• Simulation &
Modeling
• Support Shikhar25 Champions to drive Project and reviews
• Step in to drive high impact Project
• Implement projects
• Support business case development
• Validate financial impact
• Responsible for driving Shikhar25 IMPACT Centre
• Will be supported by 1-2 fulltime members
Functional IMPACT Centre(Weekly Impact Center
Review)
LEAD Centre Review(Fortnightly VP Review)
Drive key Project with line teams
1 per war room(Full time)
1 per IMPACT Centre3-4 Persons 4-5 people team Part timePart time
Identify-Measure-Prioritise-Act-Correct-Track (IMPACT)
Leadership Enabled Assessment & Direction (LEAD)
Steering Committee Review (President Review) Steering Committee ReviewMonthly President Review
Fortnightly update to MD Tata Steel & SEA
GREEN SUPPLY CHAIN
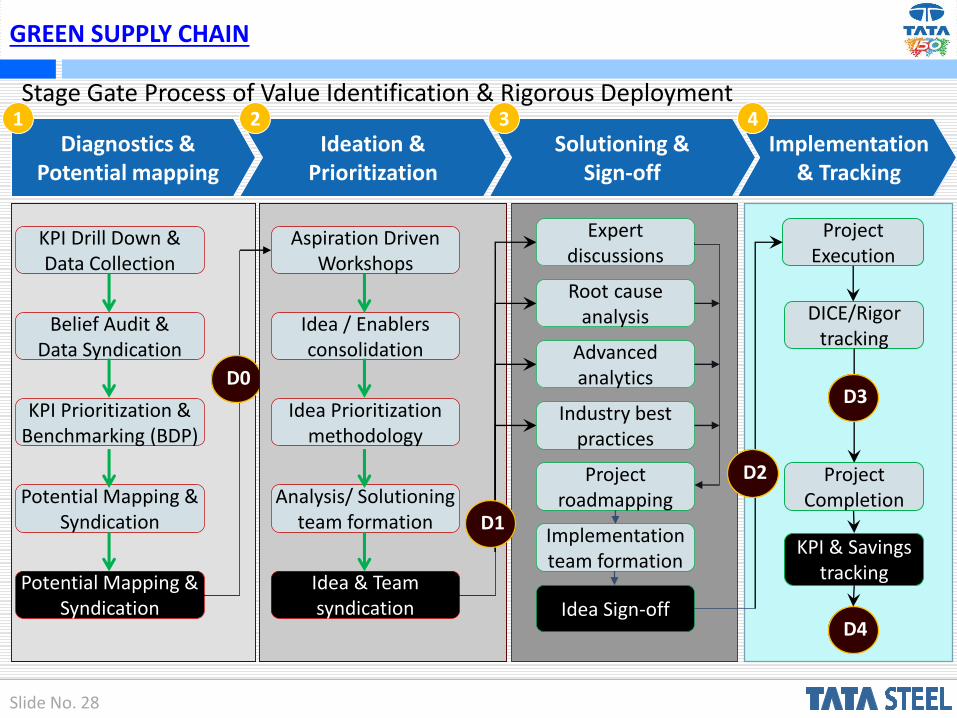
Slide No. 28
Stage Gate Process of Value Identification & Rigorous Deployment
Diagnostics & Potential mapping
Ideation & Prioritization
Solutioning & Sign-off
Implementation & Tracking
KPI Drill Down & Data Collection
Advanced analytics
Expert discussions
Root cause analysis
Industry best practices
Project roadmapping
Implementation team formation
Idea Sign-off
Project Execution
DICE/Rigor tracking
1 2 3 4
D2
D3
D4
Belief Audit & Data Syndication
KPI Prioritization & Benchmarking (BDP)
Potential Mapping & Syndication
Potential Mapping & Syndication
D0
Aspiration Driven Workshops
Idea / Enablers consolidation
Idea Prioritization methodology
Analysis/ Solutioning team formation
Idea & Team syndication
D1KPI & Savings
tracking
Project Completion
GREEN SUPPLY CHAIN
Slide No. 29
GREEN SUPPLY CHAIN
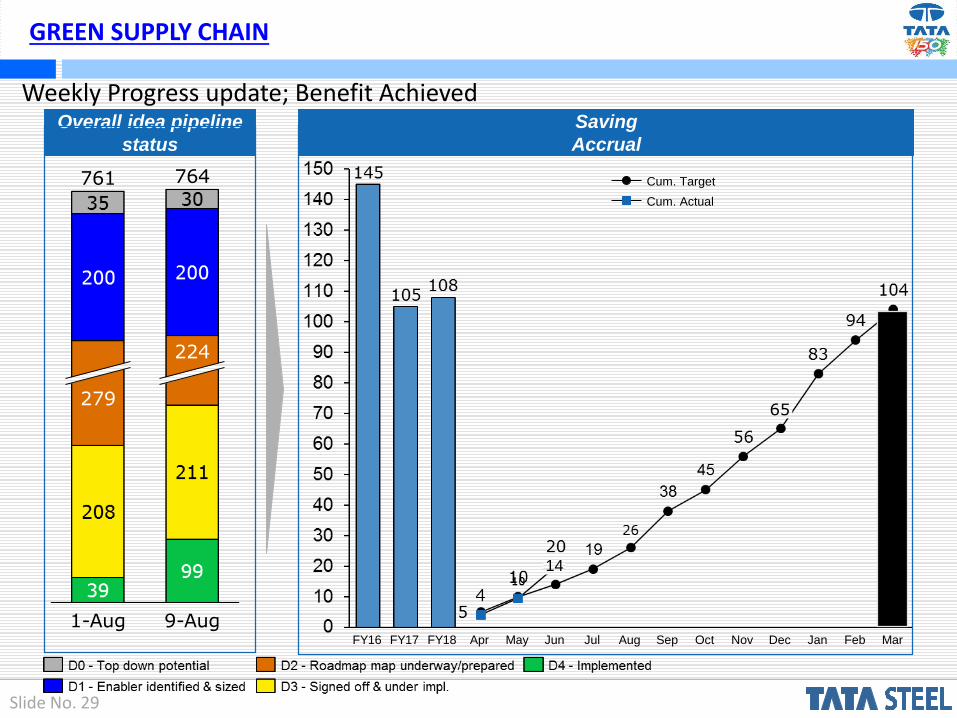
Weekly Progress update; Benefit AchievedOverall idea pipeline
status
279
1-Aug
224
9-Aug
761 764
JulFY17FY16 FY18 Apr Jun
14
May Aug Sep Oct Nov
65
Dec Jan Feb Mar
Saving
Accrual
Cum. Target
Cum. Actual
Slide No. 30
GREEN SUPPLY CHAIN
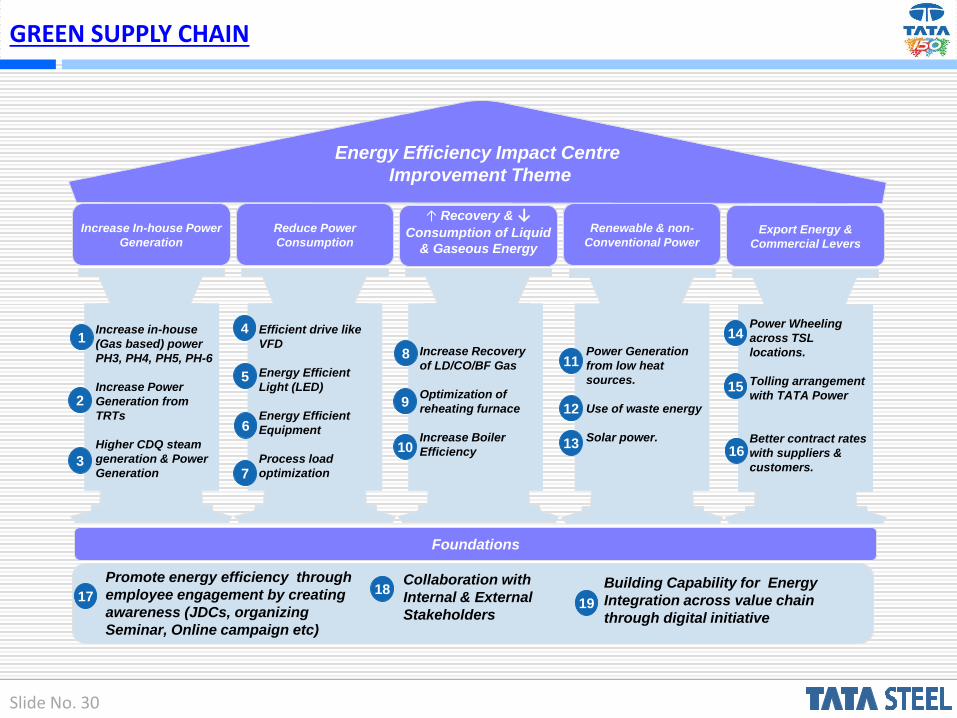
Energy Efficiency Impact Centre
Improvement Theme
Foundations
Increase In-house Power
Generation
Reduce Power
ConsumptionExport Energy &
Commercial Levers
Increase in-house
(Gas based) power
PH3, PH4, PH5, PH-6
Increase Power
Generation from
TRTs
Higher CDQ steam
generation & Power
Generation
1
3
1718
↑ Recovery & ↓Consumption of Liquid
& Gaseous Energy
2
Renewable & non-
Conventional Power
Efficient drive like
VFD
Energy Efficient
Light (LED)
Energy Efficient
Equipment
Process load
optimization
4
5
6
7
Increase Recovery
of LD/CO/BF Gas
Optimization of
reheating furnace
Increase Boiler
Efficiency
Power Generation
from low heat
sources.
Use of waste energy
Solar power.
Power Wheeling
across TSL
locations.
Tolling arrangement
with TATA Power
Better contract rates
with suppliers &
customers.
8
9
10
11
12
13
14
15
16
Building Capability for Energy
Integration across value chain
through digital initiative
Promote energy efficiency through
employee engagement by creating
awareness (JDCs, organizing
Seminar, Online campaign etc)
Collaboration with
Internal & External
Stakeholders19
Slide No. 31
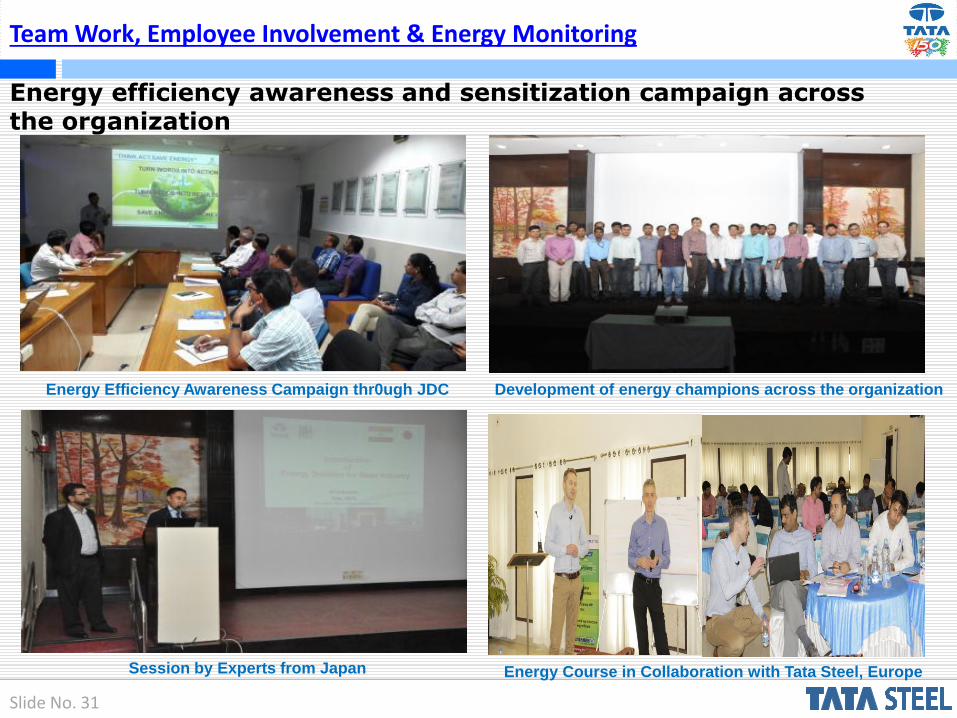
Energy Efficiency Awareness Campaign thr0ugh JDC Development of energy champions across the organization
Session by Experts from Japan Energy Course in Collaboration with Tata Steel, Europe
Energy efficiency awareness and sensitization campaign across the organization
Team Work, Employee Involvement & Energy Monitoring
Slide No. 32
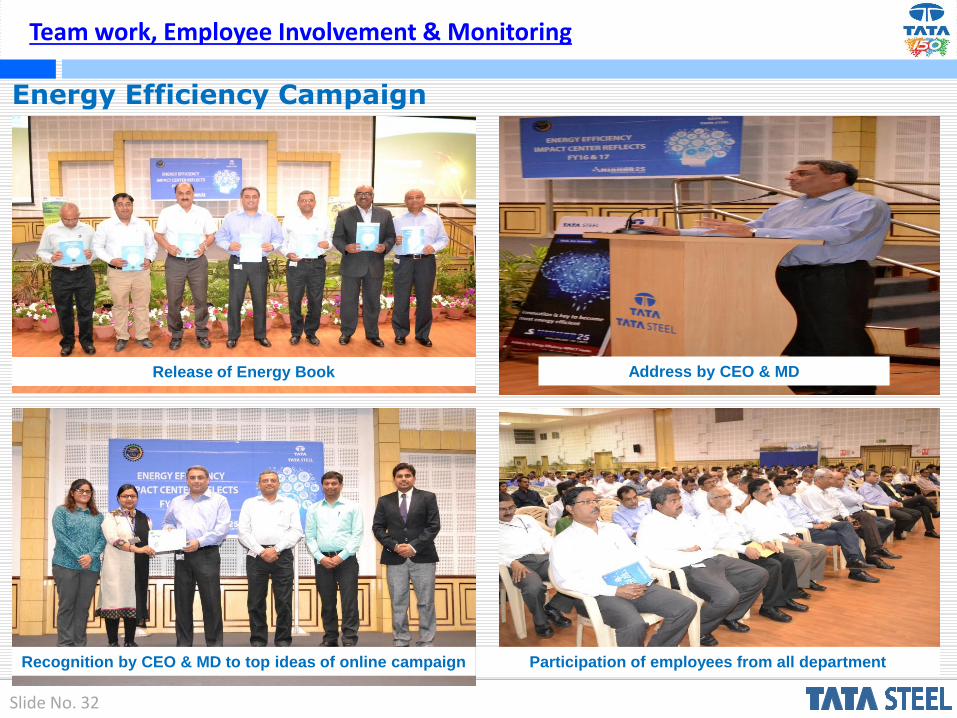
Team work, Employee Involvement & Monitoring
Energy Efficiency Campaign
Release of Energy Book Address by CEO & MD
Recognition by CEO & MD to top ideas of online campaign Participation of employees from all department
Slide No. 33
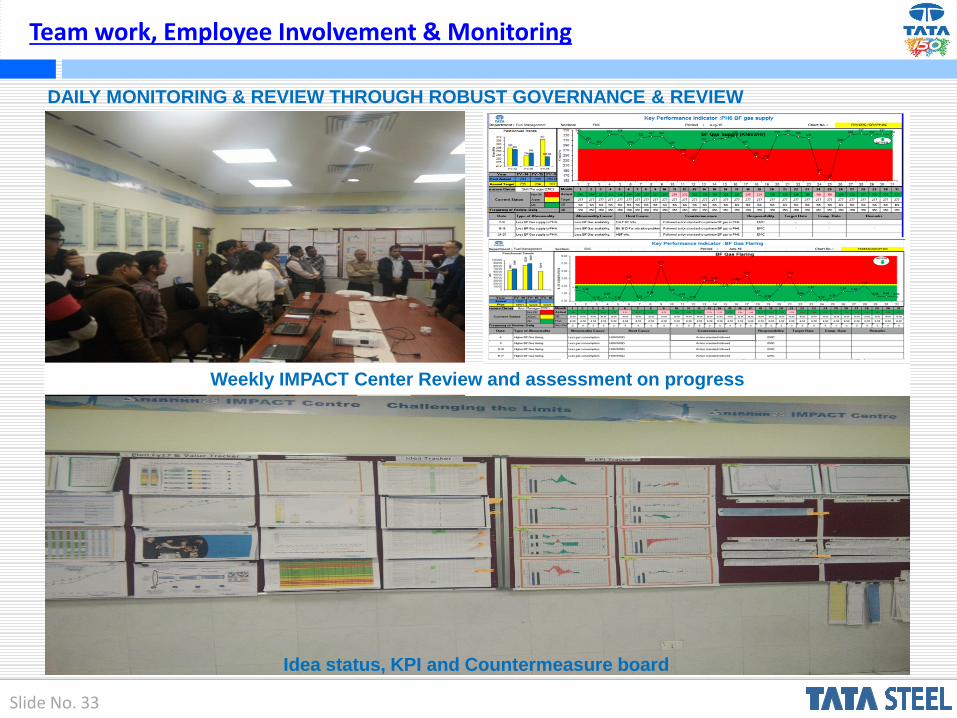
Team work, Employee Involvement & Monitoring
DAILY MONITORING & REVIEW THROUGH ROBUST GOVERNANCE & REVIEW
MECHANISM
Idea status, KPI and Countermeasure board
Weekly IMPACT Center Review and assessment on progress
Slide No. 34
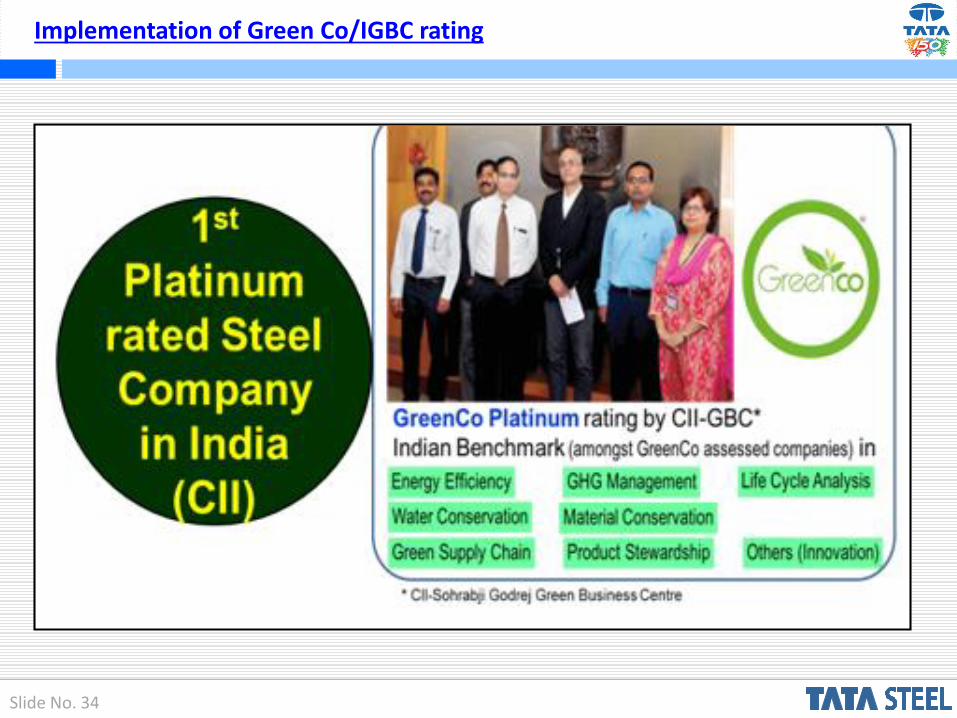
Implementation of Green Co/IGBC rating
Slide No. 35
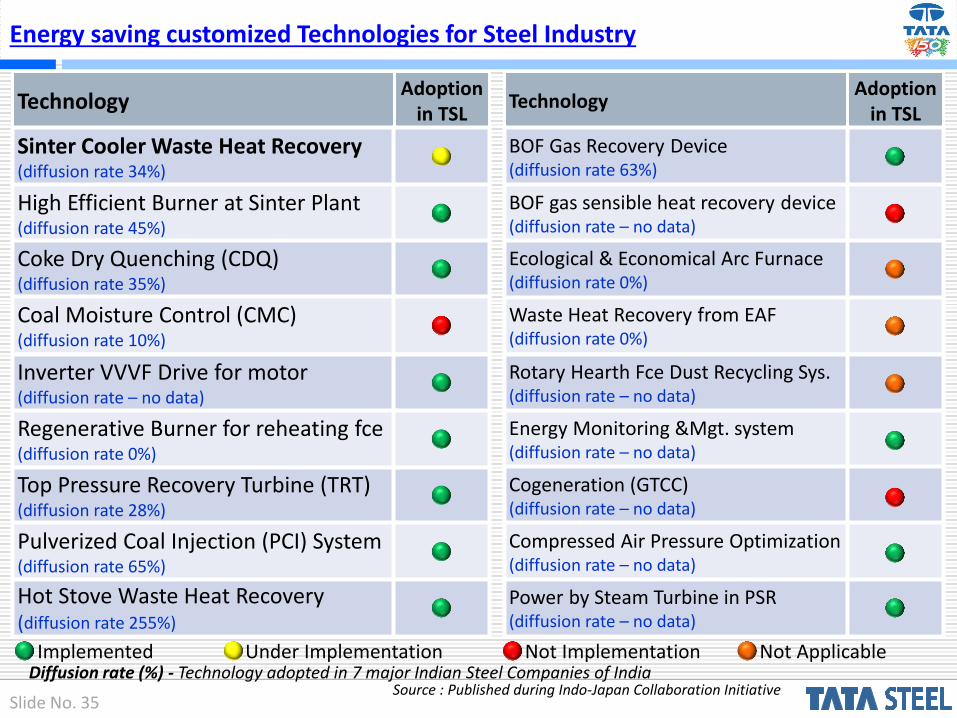
Energy saving customized Technologies for Steel Industry
TechnologyAdoption
in TSLTechnology
Adoption in TSL
Sinter Cooler Waste Heat Recovery(diffusion rate 34%)
High Efficient Burner at Sinter Plant(diffusion rate 45%)
Coke Dry Quenching (CDQ)(diffusion rate 35%)
Coal Moisture Control (CMC)(diffusion rate 10%)
Inverter VVVF Drive for motor(diffusion rate – no data)
Top Pressure Recovery Turbine (TRT)(diffusion rate 28%)
Regenerative Burner for reheating fce(diffusion rate 0%)
Pulverized Coal Injection (PCI) System(diffusion rate 65%)
Hot Stove Waste Heat Recovery(diffusion rate 255%)
BOF Gas Recovery Device(diffusion rate 63%)
BOF gas sensible heat recovery device(diffusion rate – no data)
Waste Heat Recovery from EAF(diffusion rate 0%)
Rotary Hearth Fce Dust Recycling Sys.(diffusion rate – no data)
Energy Monitoring &Mgt. system(diffusion rate – no data)
Cogeneration (GTCC)(diffusion rate – no data)
Compressed Air Pressure Optimization(diffusion rate – no data)
Power by Steam Turbine in PSR(diffusion rate – no data)
Ecological & Economical Arc Furnace(diffusion rate 0%)
Under ImplementationImplemented Not Implementation Not ApplicableDiffusion rate (%) - Technology adopted in 7 major Indian Steel Companies of India
Source : Published during Indo-Japan Collaboration Initiative
Slide No. 36
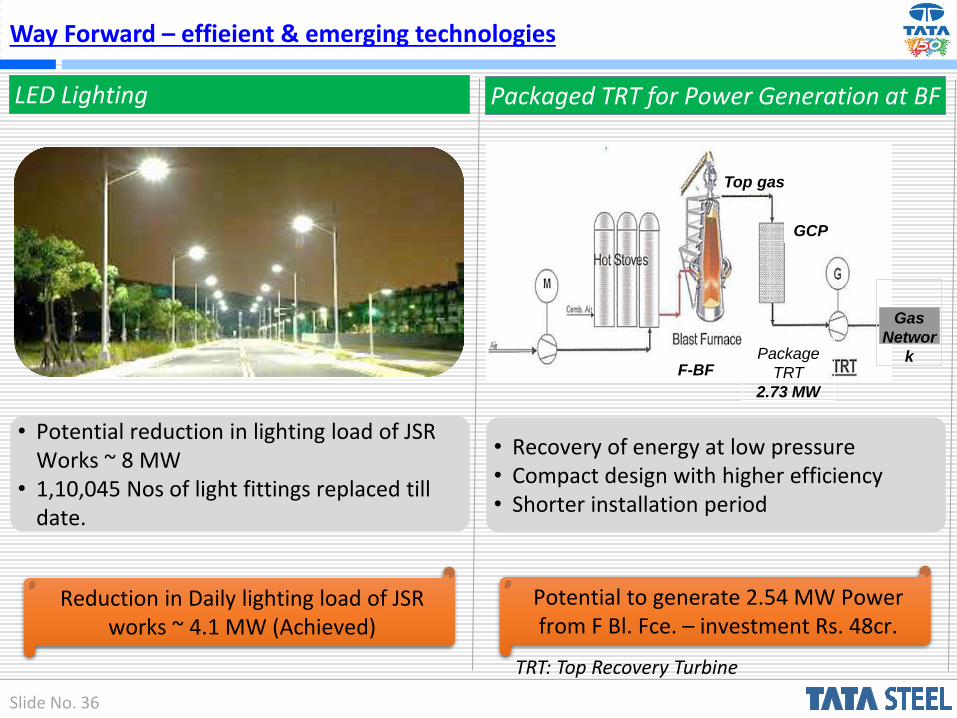
Way Forward – effieient & emerging technologies
LED Lighting
• Potential reduction in lighting load of JSR Works ~ 8 MW
• 1,10,045 Nos of light fittings replaced till date.
Reduction in Daily lighting load of JSR works ~ 4.1 MW (Achieved)
Packaged TRT for Power Generation at BF
• Recovery of energy at low pressure• Compact design with higher efficiency• Shorter installation period
Potential to generate 2.54 MW Power from F Bl. Fce. – investment Rs. 48cr.
Package
TRT
2.73 MW
F-BF
Top gas
GCP
Gas
Networ
k
TRT: Top Recovery Turbine
Slide No. 37
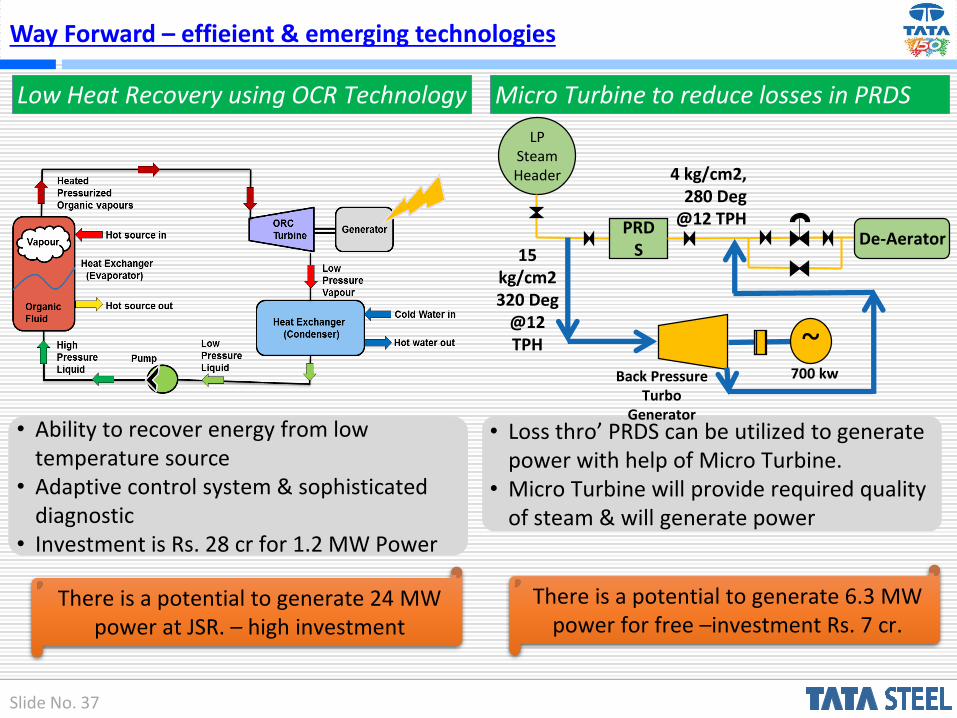
Micro Turbine to reduce losses in PRDS
• Loss thro’ PRDS can be utilized to generate power with help of Micro Turbine.
• Micro Turbine will provide required quality of steam & will generate power
There is a potential to generate 6.3 MW power for free –investment Rs. 7 cr.
LP Steam Header
PRDS
De-Aerator15
kg/cm2320 Deg
@12 TPH ~
700 kw
4 kg/cm2, 280 Deg
@12 TPH
Back PressureTurbo
Generator
Low Heat Recovery using OCR Technology
• Ability to recover energy from low temperature source
• Adaptive control system & sophisticated diagnostic
• Investment is Rs. 28 cr for 1.2 MW Power
There is a potential to generate 24 MW power at JSR. – high investment
Way Forward – effieient & emerging technologies
Slide No. 38
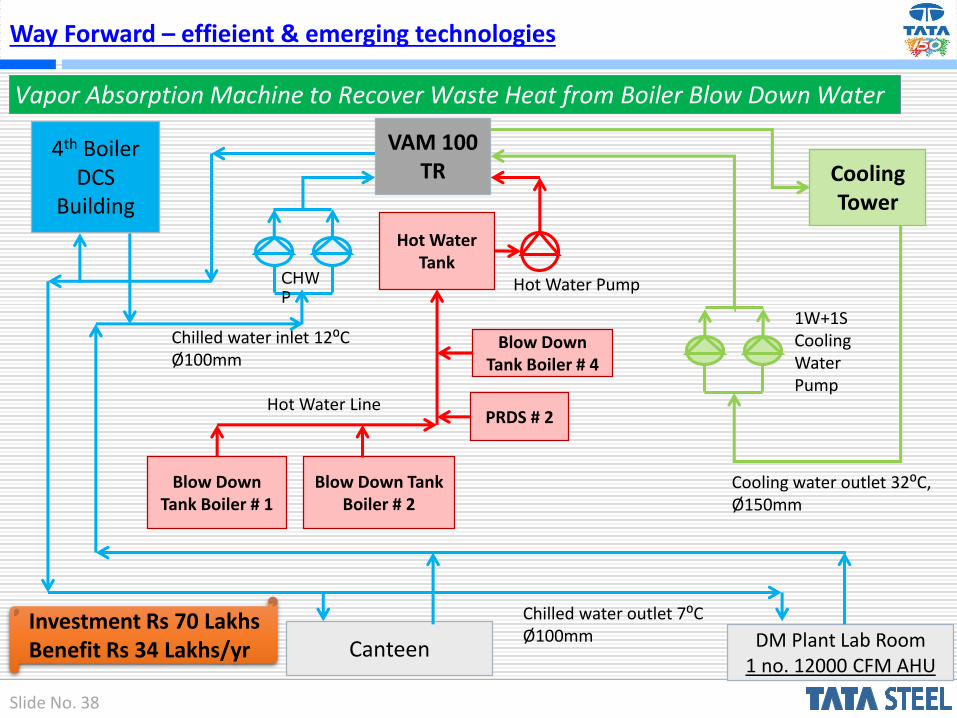
Vapor Absorption Machine to Recover Waste Heat from Boiler Blow Down Water
4th BoilerDCS
Building
VAM 100 TR
DM Plant Lab Room1 no. 12000 CFM AHU
Cooling Tower
Hot Water Tank
Canteen
Blow Down Tank Boiler # 1
Blow Down Tank Boiler # 2
PRDS # 2
Blow Down Tank Boiler # 4
Hot Water Pump
Hot Water Line
1W+1SCooling Water Pump
Cooling water outlet 32⁰C, Ø150mm
Chilled water outlet 7⁰CØ100mm
Chilled water inlet 12⁰CØ100mm
CHWP
Investment Rs 70 LakhsBenefit Rs 34 Lakhs/yr
Way Forward – effieient & emerging technologies
Slide No. 39
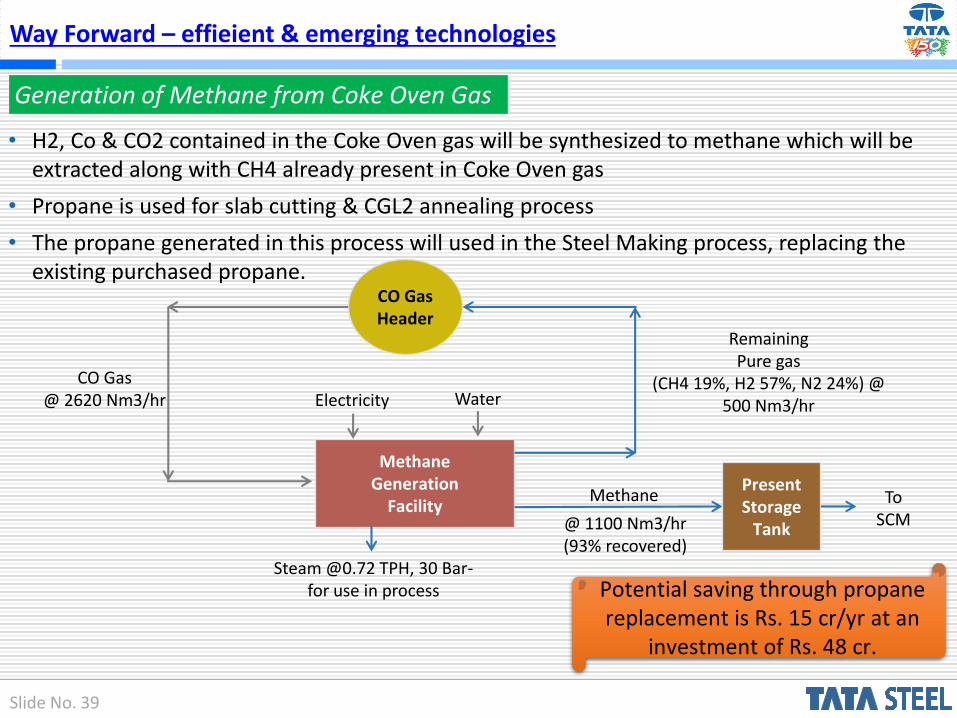
Generation of Methane from Coke Oven Gas
CO Gas Header
Methane Generation
Facility
CO Gas @ 2620 Nm3/hr
Remaining Pure gas
(CH4 19%, H2 57%, N2 24%) @ 500 Nm3/hr
PresentStorage
Tank
To SCM
Electricity Water
Steam @0.72 TPH, 30 Bar-for use in process
@ 1100 Nm3/hr (93% recovered)
Methane
• H2, Co & CO2 contained in the Coke Oven gas will be synthesized to methane which will be extracted along with CH4 already present in Coke Oven gas
• Propane is used for slab cutting & CGL2 annealing process
• The propane generated in this process will used in the Steel Making process, replacing the existing purchased propane.
Potential saving through propane replacement is Rs. 15 cr/yr at an
investment of Rs. 48 cr.
Way Forward – effieient & emerging technologies
Slide No. 40
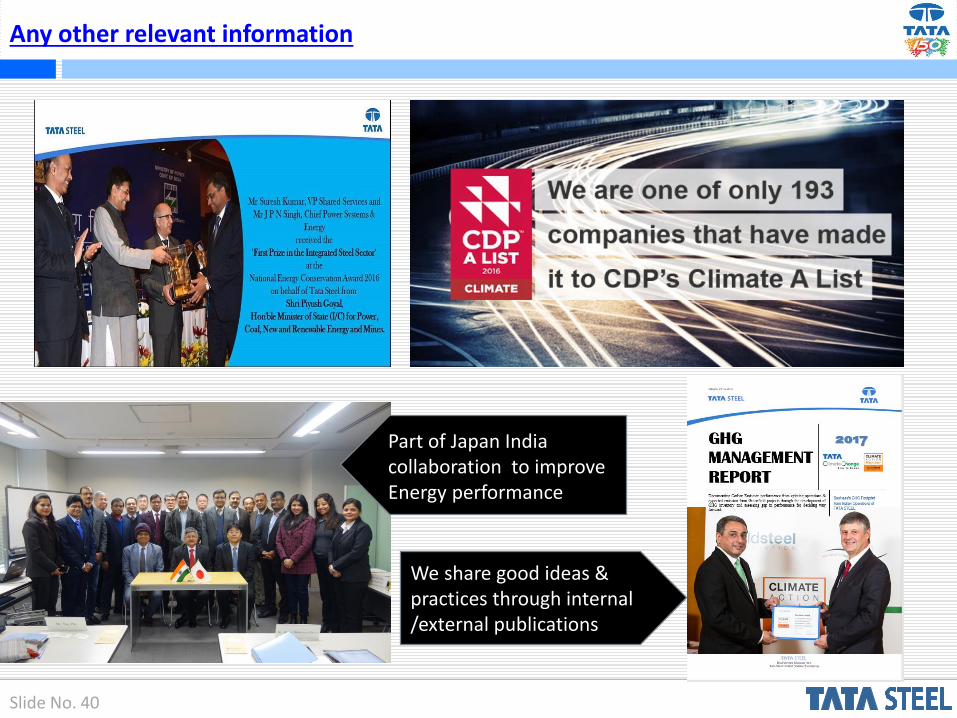
We share good ideas & practices through internal /external publications
Part of Japan India collaboration to improve Energy performance
Any other relevant information

© Confederation of Indian Industry
Thank you