Embed Size (px)
Citation preview
UBC Social Ecological Economic Development Studies (SEEDS) Student Report
Alexander Sylvester, Ambuj Nagchaudhuri, Jingjing Liu, Tsz-Shan Leung, Yilin Fan
Energy Performance and Life Cycle Costing of Ventilation
APSC 598G
April 14, 2016
1431
2100
University of British Columbia
Disclaimer: “UBC SEEDS Program provides students with the opportunity to share the findings of their studies, as well as their opinions, conclusions and recommendations with the UBC community. The reader should bear in mind that this is a student project/report and is not an official document of UBC. Furthermore readers should bear in mind that these reports may not reflect the current status of activities at UBC. We urge you to contact the research persons mentioned
in a report or a SEEDS team representative about the current status of the subject matter of a project/report”.
Energy Performance and Life Cycle Costing of Ventilation
Jingjing Liu
Alexander Sylvester
Tsz-Shan Leung
Ambuj Nagchaudhuri
Yilin Fan
Report submitted to APSC 598G and UBC Properties Trust
Dr. Nemkumar Banthia
April 14, 2016
Vancouver, BC
Keywords: Energy Performance, Life Cycle Cost, Ventilation
1
Contents
SUMMARY ................................................................................................................................ 2
1. INTRODUCTION .................................................................................................................. 4
1.1 Project Information ........................................................................................................... 4
1.2 Research Scope ................................................................................................................. 4
1.3 Tasks ................................................................................................................................. 4
2. VENTILATION BACKGROUND ....................................................................................... 5
2.1 Centralized HRV ............................................................................................................... 6
2.2 Passive Ventilation............................................................................................................ 7
3. METHODOLOGY ................................................................................................................ 8
3.1 The BC Building Code...................................................................................................... 8
3.2 Vancouver Building Trends and Performance Trends at UBC ........................................ 8
3.3 A Review of Common and Best Practices in the Industry.............................................. 11
3.4 Mechanical Drawings ..................................................................................................... 12
3.5 Energy Modeling of Site B and Lot E ............................................................................ 12
4. RESULTS ............................................................................................................................ 23
4.1 Ventilation Requirements in BC Building Code ............................................................ 23
4.2 Performance Trend of Building in Vancouver and UBC................................................ 25
4.3 Common and Best Practices in the Industry ................................................................... 34
4.4 Mechanical Drawings ..................................................................................................... 37
4.5 Life Cycle Costing of Ventilation systems ..................................................................... 41
5. CONCLUSIONS................................................................................................................... 46
BIBLIOGRAPHY ..................................................................................................................... 47
2
SUMMARY
Lot E and Site B are two projects under construction with two different ventilation systems. Due
to the fact that space conditioning has dominated a great portion of energy consumption, our
client - UBC Properties Trust, would like to determine the pros and cons of both ventilation
systems for future reference. According to client’s request, we did some studies on both
ventilation systems on regulation complexity, energy consumption performance, strategies used
in the industry, architectural structure, and life cycle costing.
For regulation complexity, 2012 British Columbia Building Code was reviewed. Both designs
have met the criterion of the code. Comparing with mechanical ventilation system, natural
ventilation system has more requirements. The most significant difference of requirements for
natural ventilation system or combination of natural and mechanical ventilation were applied in
occupant load during normal use, permits required for use of large openings in the building
envelope even during the winter and restriction of occupancy of seasonal buildings. Thus,
requirements and regulation for natural ventilation system is more complicated.
For information of energy performance of residential buildings in Vancouver, a report about
energy consumption in mid- and high-rise residential building in British Columbia published by
RDH Building Engineering Ltd. was reviewed. In their study, consumption data from 39 samples
were analyzed. As a result, the average energy consumption is 213kWh/m2/yr, and average
energy consumption for space conditioning is 37%. Since ventilation system has the most effect
on space heating energy consumption, simulation with data from 13 samples shows that with a
constant make-up air flow rate, annual space heat consumption can goes up to 108.4 kWh/m2/yr
in an environment with high leaky rate (windows open) and it can goes down to 96.7 kWh/m2/yr
in an environment with tight rate. Knowing natural ventilation system tends to have a higher air
leakage rate, it is believed that mechanical ventilation would perform better on saving annual
space heat consumption.
Previous studies gave us some strategies that may improve the energy efficiency and
consumption for residential buildings. There are three most efficient ways which are improving
3
glazing and wall assemblies, control airflow including make-up air ventilation strategies, and
control air leakage. The study also provided some practical improvements. Varying makeup air
temperature set-point between 13 to 23 degrees results in a significant difference in energy
consumption. The architectural design for natural ventilation has more restricts in floor area,
exposed wall area, window to wall ratio, overall wall and roof R-values, window U-value and
window solar heat gain coefficient. Decreasing ventilation air flow rates up to 60% of the
nominal flow rate would be optimal. Finally, it is very practical to provide heating and
ventilation directly to each suite. Using the in-suite approach is more economical considering the
cost for ductwork and fire-dampers.
The mechanical drawings were reviewed, compared, and checked for conformance to best
practices. Lot E had significantly less ducting requirements, which saved material and space use.
Also, each apartment was isolated from the main ventilation system, reducing fire risk and
stabilizing energy requirements. It had at least three times as many exterior penetrations as Site
B, which will likely increase air leakage. Lot E also had more pieces of equipment, which will
likely require more maintenance time. One possible improvement for Site B would be to
incorporate the dryer exhaust into the HRV, which, while intermittent, presents a significant heat
recovery potential.
Reports of energy modeling for both projects were reviewed. For Site B, EUI of the building
design is 136.6 kWh/m2/year and it meets the energy efficiency target for REAP gold plus
certification. The result of Lot E modeling shows that EUI of Lot E (base design) is 176.5
kWh/m2/year which is higher than REAP gold certification EUI target 163.8 kWh/m
2/year. Cost
calculations with respect to lifetime of ventilation systems (20 years) for the two projects were
carried out. Using Net Present Value (NPV) calculations at nominal discount rate of 5% and
inflation of 2% the real discount rate was calculated to be 3%. The maintenance cost and yearly
energy cost (District Energy System rates) were accounted for. The NPV values were normalized
by dividing the results by residential area. This made the results directly comparable (NPV/m2).
The residential area was used, rather than total building because the residential ventilation
systems are being compared. The results favor the ventilation system Lot E.
4
1. INTRODUCTION
1.1 Project Information
The purpose of this project is to compare and contrast two different residential ventilation
systems – centralized HRV (Site B project) and passive ventilation (Lot E).
Site B (Central) is a 6 storey mixed-use building with 98 residential units on levels 2-6 ranging
from studios to 3 bedroom units and 7 CRUs on the ground level. There is a level of
underground parking; levels P1 – L1 are of concrete construction and L2-6 are of wood frame
construction. This project is located in the UBLVD neighbourhood at 6015 University Boulevard
and will be connected to UBC District Energy at project completion.
Lot E (Village Square) is a 6 storey mixed-use building with 90 residential units ranging from
studios to 3 bedroom units and 8 CRUs on levels 1 and 2. There are 2 levels of underground
parking; levels P2 – L2 are of concrete construction and L3-6 are of wood frame construction.
This project is located in the Wesbrook Village Neighbourhood at 3338 Webber Lane and will
be connected to the south campus District Energy system managed by Corix at project
completion.
By doing this research, we aim to support UBC’s environmental sustainability goals of reducing
energy, materials, and carbon by encouraging sustainable event practices.
1.2 Research Scope
In this research, we addressed the pros and cons for design implications, initial/upfront costs and
ongoing (post-occupancy) maintenance costs between the two ventilation system designs. We
proposed suggestions for better energy efficiency and consumption in residential buildings
regarding to different ventilation systems.
1.3 Tasks
Our main tasks include three parts:
5
1. Review of design drawings (and applicable design standards/codes pertaining to ventilation)
liaising with mechanical consultants and architects to understand design and associated
impact to architectural design
2. Review construction costs and operating costs associated with both systems, perform life-
cycle analysis as necessary.
3. Review common practice in the industry for similar projects and analyze
performance/feedback in terms of energy efficiency, value for money, ease of temperature
control etc.
2. VENTILATION BACKGROUND
Ventilation is the process of supplying air to and/or removing air from a space for the purpose of
controlling air contaminant levels, humidity, or temperature. It is an important contributor to the
health and comfort of an indoor environment. Specifically, ventilation serves two primary
purposes:
1. To provide fresh air for occupants to breathe.
2. To dilute or remove contaminants.
These contaminants can include any of the following:
a. Moisture generated by people, pets, and plants, and by activities such as cooking and
showering.
b. Contaminants and odours generated by interior sources including people, plants, cooking,
household cleaners, and off-gassing of interior finishes and furnishings.
c. Contaminants from exterior air including dust, particulates, allergens, and mould.
Poor indoor air quality has reported impacts on human health, particularly for the young, the
elderly, and those with sensitivities. Impacts can include increased asthma, headaches, and
fatigue. Health Canada publishes Residential Indoor Air Quality Guidelines, which advise on
recommended exposure limits for a range of indoor pollutants, including benzene, carbon
monoxide, fine particulate matter, formaldehyde, mould, naphthalene, nitrogen dioxide, ozone,
6
and toluene 1 - all of which can be found in residences. While source control is an essential first
step toward limiting exposure to indoor pollutants 2, adequate ventilation (paired with filtration)
is a critical means of establishing and maintaining indoor air quality.
There are two traditional approaches to providing ventilation to a space:
1. Natural (passive) ventilation, where airflow is driven by natural pressure differentials
through open windows, doors, grilles, and other planned penetrations.
2. Mechanical ventilation, where airflow is planned and controlled using fans and associated
ductwork, grilles, diffusers and vents.
2.1 Centralized HRV
HRVs simultaneously supply and exhaust equal quantities of air to and from a building or suite
while transferring heat between the two air streams (with minimal mixing of air in the two
streams). This reduces the energy consumption associated with heating or cooling ventilation air
while providing a balanced ventilation system. Heat recovery also helps condition the incoming
outdoor air to temperatures that are more acceptable to the occupants. (BC Housing, 2015)
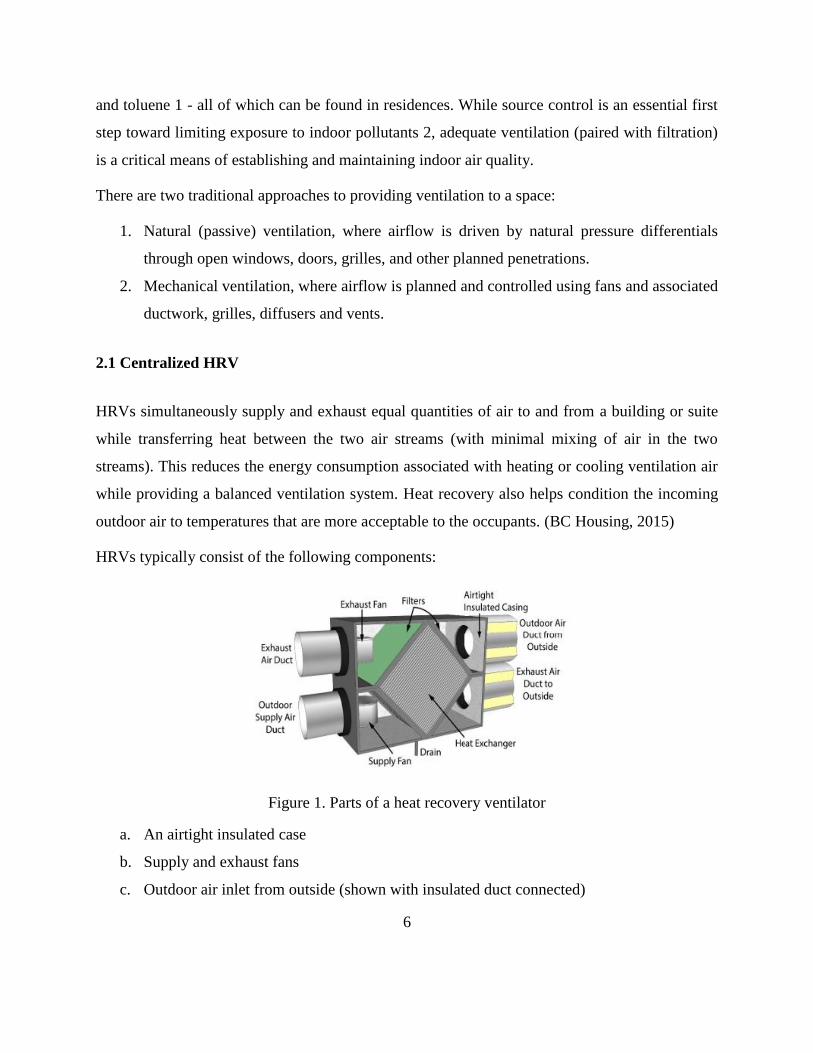
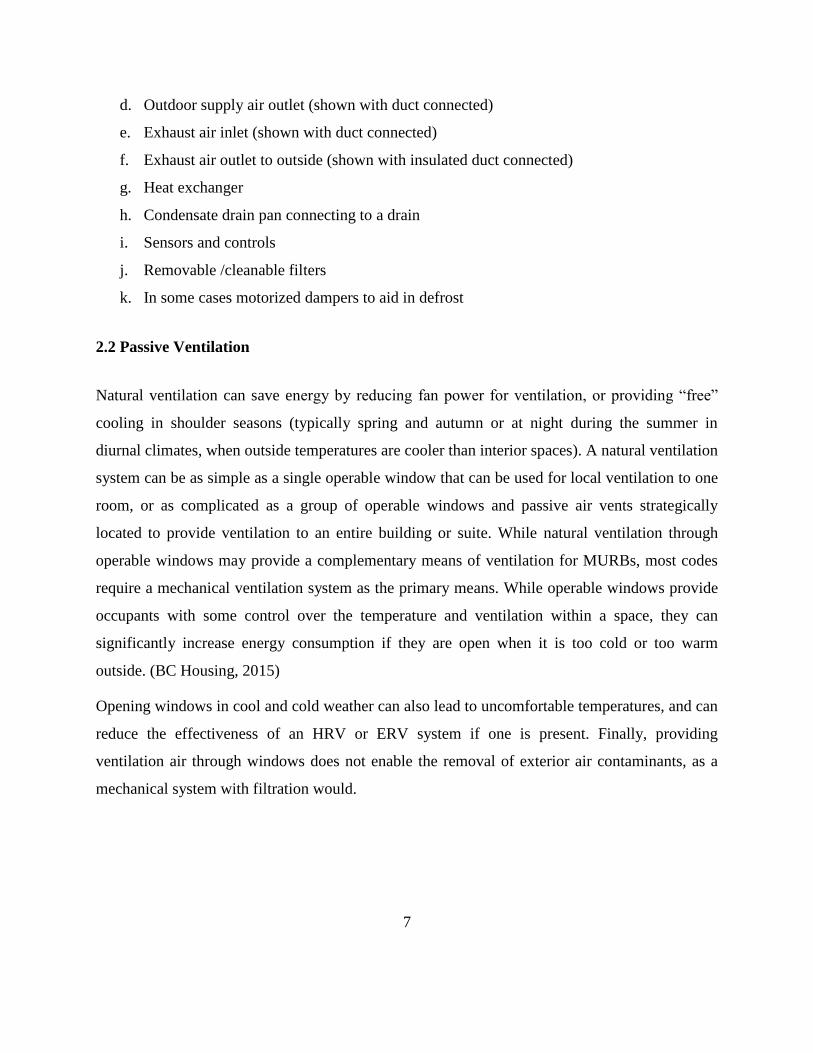
HRVs typically consist of the following components:
Figure 1. Parts of a heat recovery ventilator
a. An airtight insulated case
b. Supply and exhaust fans
c. Outdoor air inlet from outside (shown with insulated duct connected)
7
d. Outdoor supply air outlet (shown with duct connected)
e. Exhaust air inlet (shown with duct connected)
f. Exhaust air outlet to outside (shown with insulated duct connected)
g. Heat exchanger
h. Condensate drain pan connecting to a drain
i. Sensors and controls
j. Removable /cleanable filters
k. In some cases motorized dampers to aid in defrost
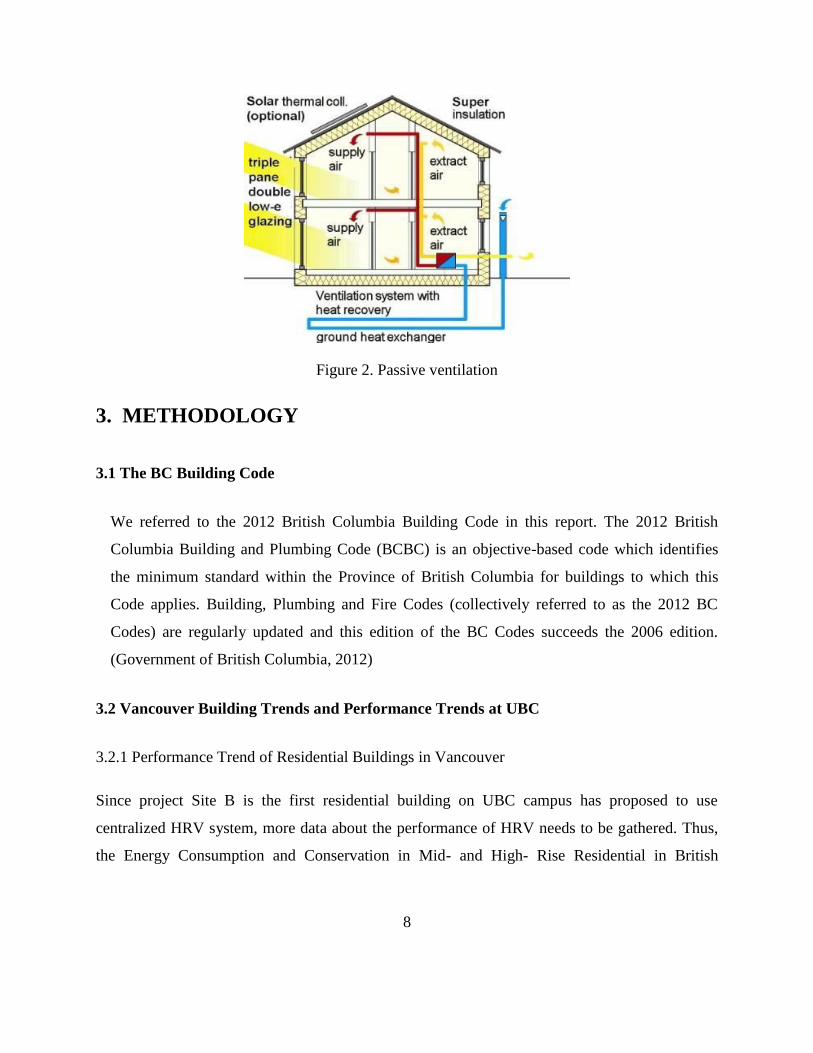
2.2 Passive Ventilation
Natural ventilation can save energy by reducing fan power for ventilation, or providing “free”
cooling in shoulder seasons (typically spring and autumn or at night during the summer in
diurnal climates, when outside temperatures are cooler than interior spaces). A natural ventilation
system can be as simple as a single operable window that can be used for local ventilation to one
room, or as complicated as a group of operable windows and passive air vents strategically
located to provide ventilation to an entire building or suite. While natural ventilation through
operable windows may provide a complementary means of ventilation for MURBs, most codes
require a mechanical ventilation system as the primary means. While operable windows provide
occupants with some control over the temperature and ventilation within a space, they can
significantly increase energy consumption if they are open when it is too cold or too warm
outside. (BC Housing, 2015)
Opening windows in cool and cold weather can also lead to uncomfortable temperatures, and can
reduce the effectiveness of an HRV or ERV system if one is present. Finally, providing
ventilation air through windows does not enable the removal of exterior air contaminants, as a
mechanical system with filtration would.
8
Figure 2. Passive ventilation
3. METHODOLOGY
3.1 The BC Building Code
We referred to the 2012 British Columbia Building Code in this report. The 2012 British
Columbia Building and Plumbing Code (BCBC) is an objective-based code which identifies
the minimum standard within the Province of British Columbia for buildings to which this
Code applies. Building, Plumbing and Fire Codes (collectively referred to as the 2012 BC
Codes) are regularly updated and this edition of the BC Codes succeeds the 2006 edition.
(Government of British Columbia, 2012)
3.2 Vancouver Building Trends and Performance Trends at UBC
3.2.1 Performance Trend of Residential Buildings in Vancouver
Since project Site B is the first residential building on UBC campus has proposed to use
centralized HRV system, more data about the performance of HRV needs to be gathered. Thus,
the Energy Consumption and Conservation in Mid- and High- Rise Residential in British
9
Columbia report which was written by RDH building engineering Ltd. was reviewed. (RDH,
2012)
3.2.1.1 Distribution of Energy Consumption
In the reviewed report, consumption data from 39 non-combustible construction MURBs located
in the Lower Mainland of BC, Victoria, BC were analyzed to assess the current level of energy
consumption. They have used the following steps to analyze the data:
1. Gather at least 10 years of gas and electricity billing data from 1998 to 2008 from BC Hydro
and Fortis BC.
2. Study the effect of climate on heating consumptions in the first 10 years
3. Capture at least 2 to 3 years of data after building enclosure upgrade
4. Compare pre and post- rehabilitation energy consumption
3.2.1.2 Energy Model Simulation
For a further and more detailed study, RDH building engineering Ltd. chose 13 samples as
representatives of larger building set. Energy model was performed by the software program
FAST (Facility Analysis and Simulation Tool) with mechanical and architectural information
collected for the 13 samples. Since the metered energy consumption data was collected for the
study mentioned in previous section, input the metered data can enhance the accuracy of the
simulation result, and those result will be called “meter calibrated” model. In the simulation, it is
assumed that make-up air system operates at 100% of its rated air flow capacity at leaky rate
(high value in cfm/sf) and it operates at 80% of rated air flow capacity at tight rate (low or 0
cfm/sf). Range of airtightness was set between 0 to 0.4 cfm/sf and the values between were
scaled linearly.
3.2.2 Performance Trend of Buildings in UBC
Due to the fact that the two projects (Site B and Lot E) that are investigated will be located in
UBC area, so a study of the energy consumption performance of other buildings in the same area
would be a useful information for future consumption behavior prediction and design trend.
10
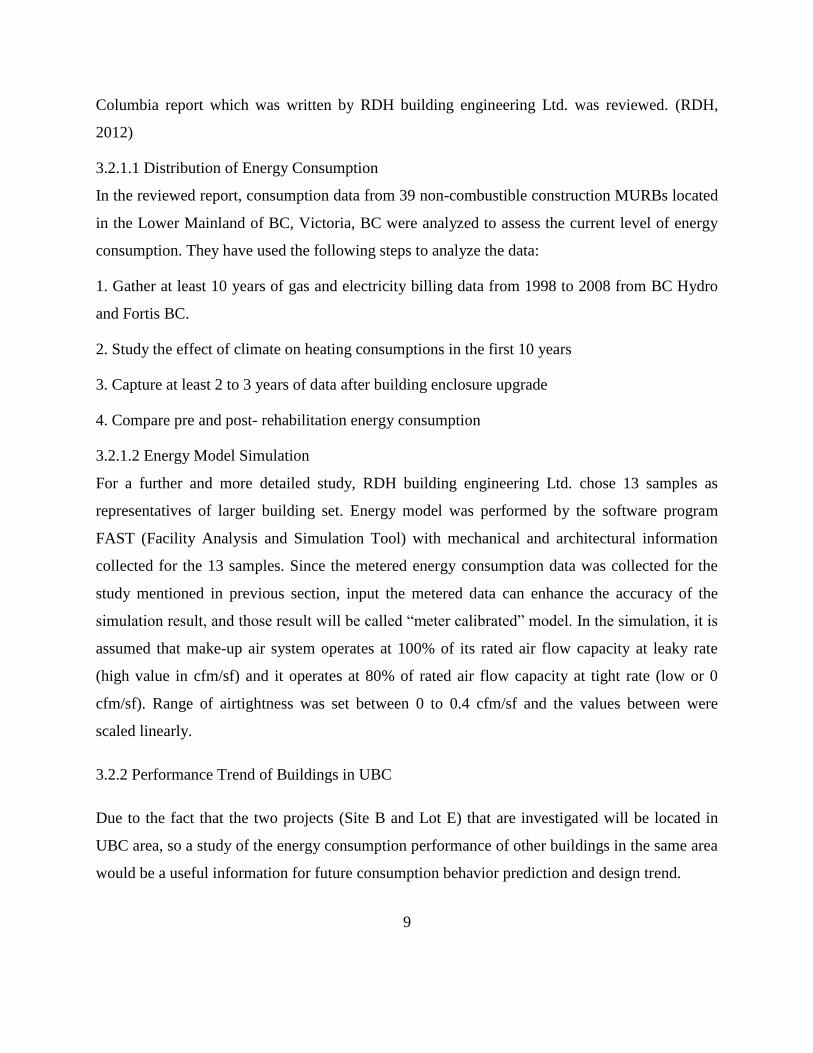
In order to collect the energy consumption of buildings in the UBC area, a core component of
UBC’s energy management and building performance monitoring called ION Historian was
used. This database is publicly accessible and it provides real-time and long-term trending of
energy and water consumption data for majority of UBC Vancouver campus buildings. However,
this database does not contain energy consumption for any residential building in UBC campus.
We believe that the trending of data of those non-residential buildings can provide some insight
of effect of both ventilation systems. (http://ion.energy.ubc.ca/ion/)
Procedure for data gathering from ION Historian:
Step 1: Location specification
In the ION front page, there is a main campus diagram. The whole campus was divided into 7
sections. Based on the location of the targeted building, click the corresponding area on the
diagram. Then, click on the meter icon of the targeted building, and the building’s real-time
electrical energy meter diagram will be displayed.
Figure 3. ION front page
Step 2: Choosing data
11
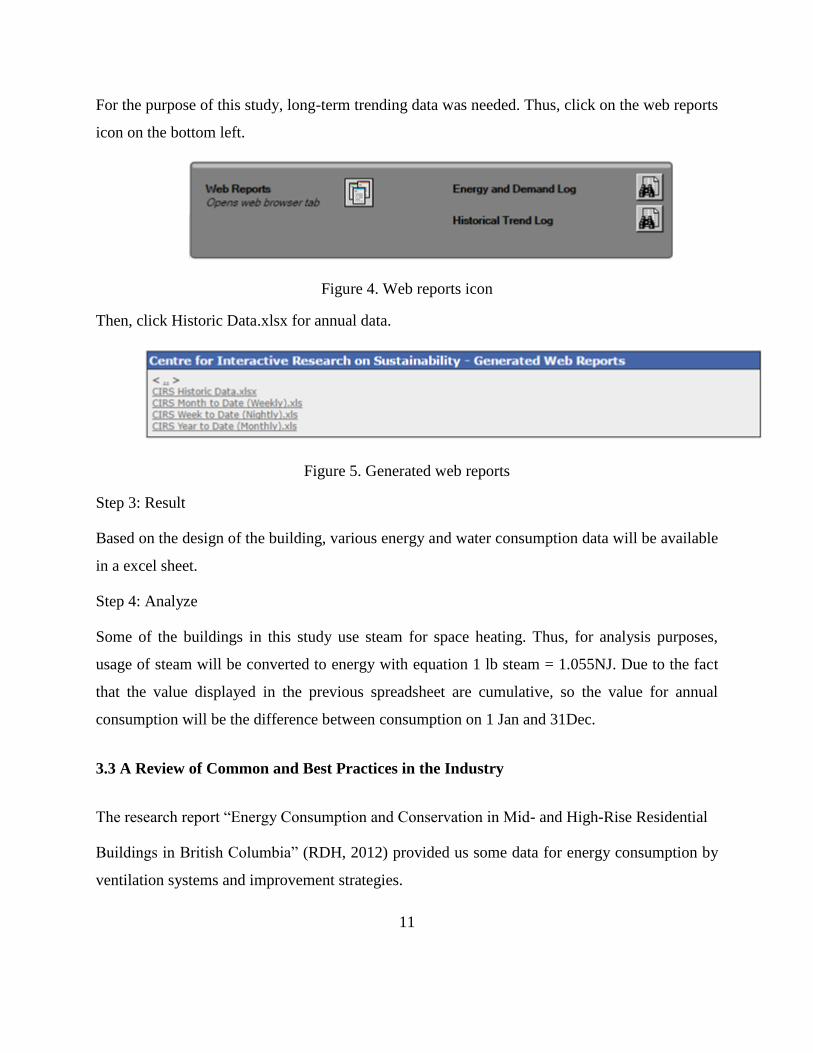
For the purpose of this study, long-term trending data was needed. Thus, click on the web reports
icon on the bottom left.
Figure 4. Web reports icon
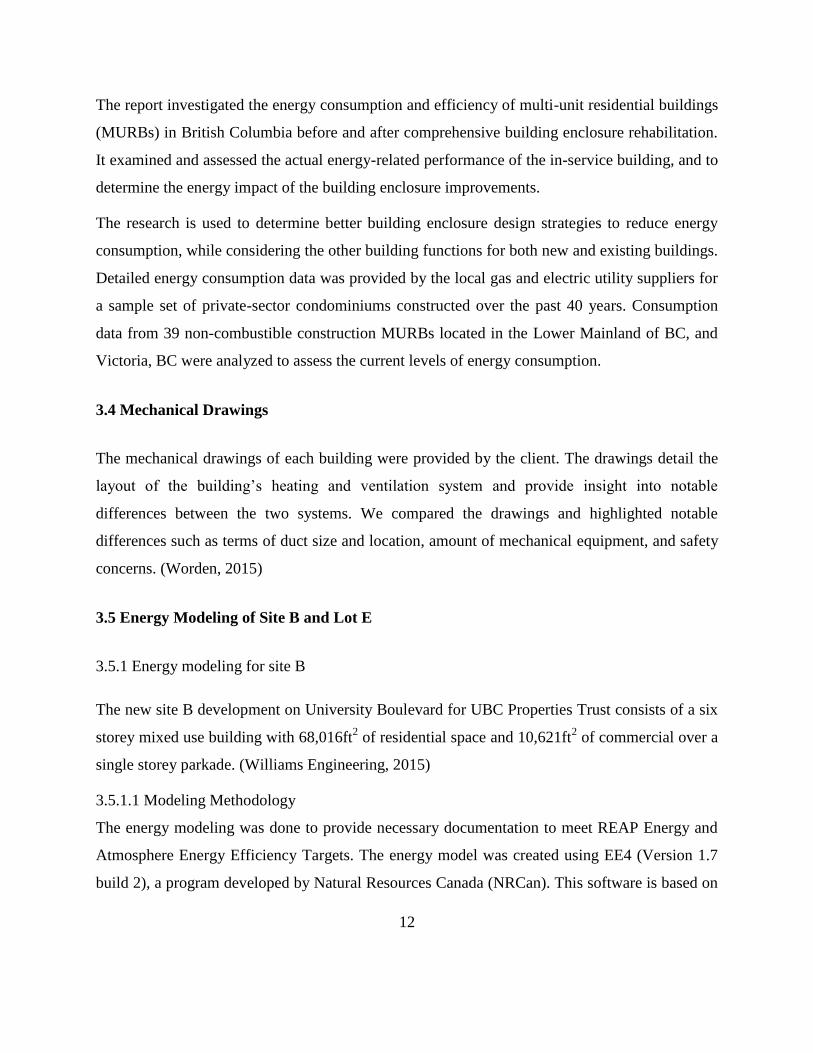
Then, click Historic Data.xlsx for annual data.
Figure 5. Generated web reports
Step 3: Result
Based on the design of the building, various energy and water consumption data will be available
in a excel sheet.
Step 4: Analyze
Some of the buildings in this study use steam for space heating. Thus, for analysis purposes,
usage of steam will be converted to energy with equation 1 lb steam = 1.055NJ. Due to the fact
that the value displayed in the previous spreadsheet are cumulative, so the value for annual
consumption will be the difference between consumption on 1 Jan and 31Dec.
3.3 A Review of Common and Best Practices in the Industry
The research report “Energy Consumption and Conservation in Mid- and High-Rise Residential
Buildings in British Columbia” (RDH, 2012) provided us some data for energy consumption by
ventilation systems and improvement strategies.
12
The report investigated the energy consumption and efficiency of multi-unit residential buildings
(MURBs) in British Columbia before and after comprehensive building enclosure rehabilitation.
It examined and assessed the actual energy-related performance of the in-service building, and to
determine the energy impact of the building enclosure improvements.
The research is used to determine better building enclosure design strategies to reduce energy
consumption, while considering the other building functions for both new and existing buildings.
Detailed energy consumption data was provided by the local gas and electric utility suppliers for
a sample set of private-sector condominiums constructed over the past 40 years. Consumption
data from 39 non-combustible construction MURBs located in the Lower Mainland of BC, and
Victoria, BC were analyzed to assess the current levels of energy consumption.
3.4 Mechanical Drawings
The mechanical drawings of each building were provided by the client. The drawings detail the
layout of the building’s heating and ventilation system and provide insight into notable
differences between the two systems. We compared the drawings and highlighted notable
differences such as terms of duct size and location, amount of mechanical equipment, and safety
concerns. (Worden, 2015)
3.5 Energy Modeling of Site B and Lot E
3.5.1 Energy modeling for site B
The new site B development on University Boulevard for UBC Properties Trust consists of a six
storey mixed use building with 68,016ft2 of residential space and 10,621ft
2 of commercial over a
single storey parkade. (Williams Engineering, 2015)
3.5.1.1 Modeling Methodology
The energy modeling was done to provide necessary documentation to meet REAP Energy and
Atmosphere Energy Efficiency Targets. The energy model was created using EE4 (Version 1.7
build 2), a program developed by Natural Resources Canada (NRCan). This software is based on
13
the DOE 2.1e simulation engine, which calculates energy consumption on an hourly basis based
on the detailed set of inputs that includes the following:
a. Building orientation
b. Building configuration
c. Window to wall ratio
d. Type of glazing
e. Type of building materials and construction
f. Internal and external shading
g. Internal lighting types and schedules
h. Heating and cooling loads and schedules
i. Zone temperature set point and schedules
j. Terminal equipment characteristics and performance
k. Central system characteristics and performance
l. Energy type and cost
3.5.1.2 Climate Data
Climate data for Vancouver B.C was used for this report. This data describes a typical
meteorogical year and includes hourly values for many parameters including:
a. Dry bulb temperature
b. Dew point temperature
c. Relative Humidity
d. Solar Radiation
e. Wind speed and direction
f. Cloud cover
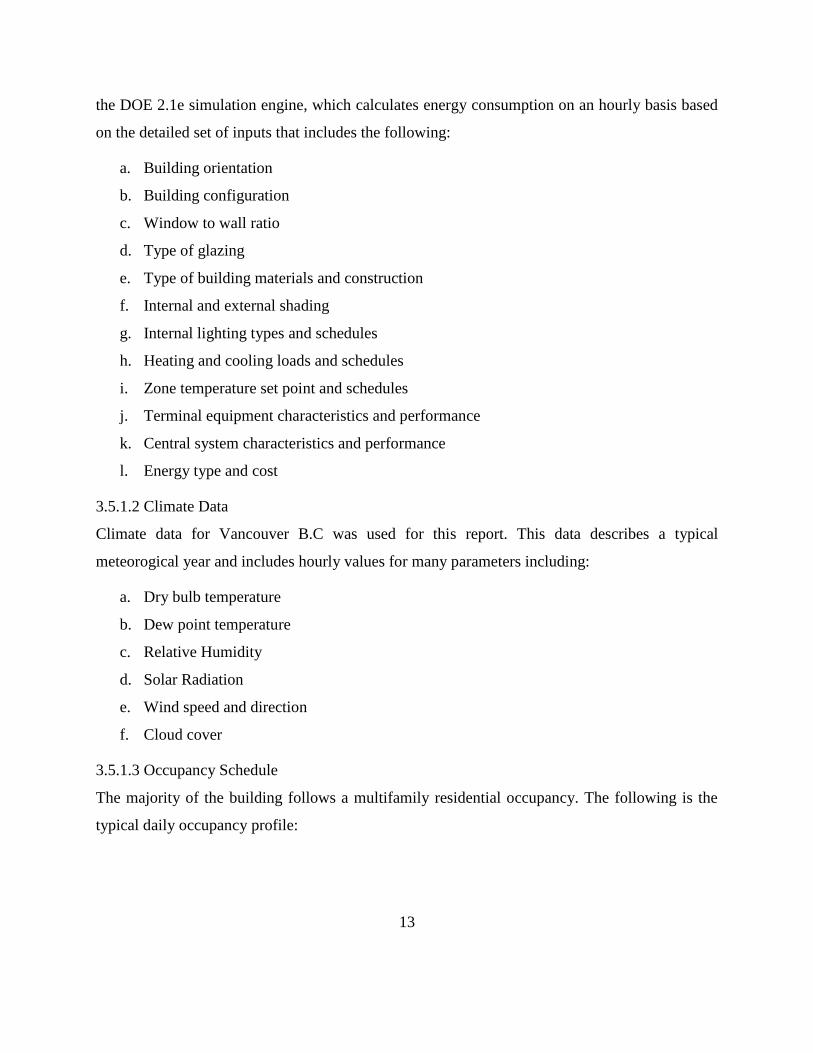
3.5.1.3 Occupancy Schedule
The majority of the building follows a multifamily residential occupancy. The following is the
typical daily occupancy profile:
14
The occupancy is typical to any multifamily residential occupancy. The peak loads are during the
morning and night except the office hours. However, the loads during the weekends are higher
than weekdays.
3.5.1.4 Modeling procedures under REAP
The energy model generated follows the modeling procedures outlined in the most recent version
of NRCan’s EE4 Modelling Guide and UBC’s Energy Modelling Guidelines.
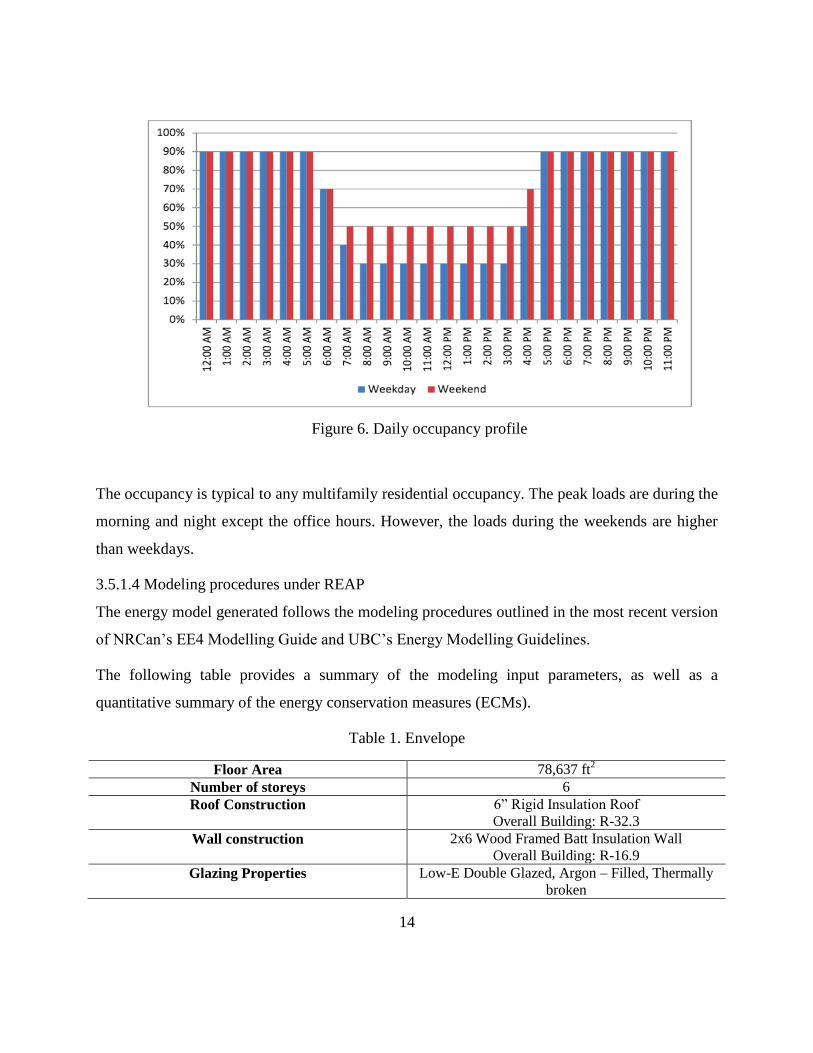
The following table provides a summary of the modeling input parameters, as well as a
quantitative summary of the energy conservation measures (ECMs).
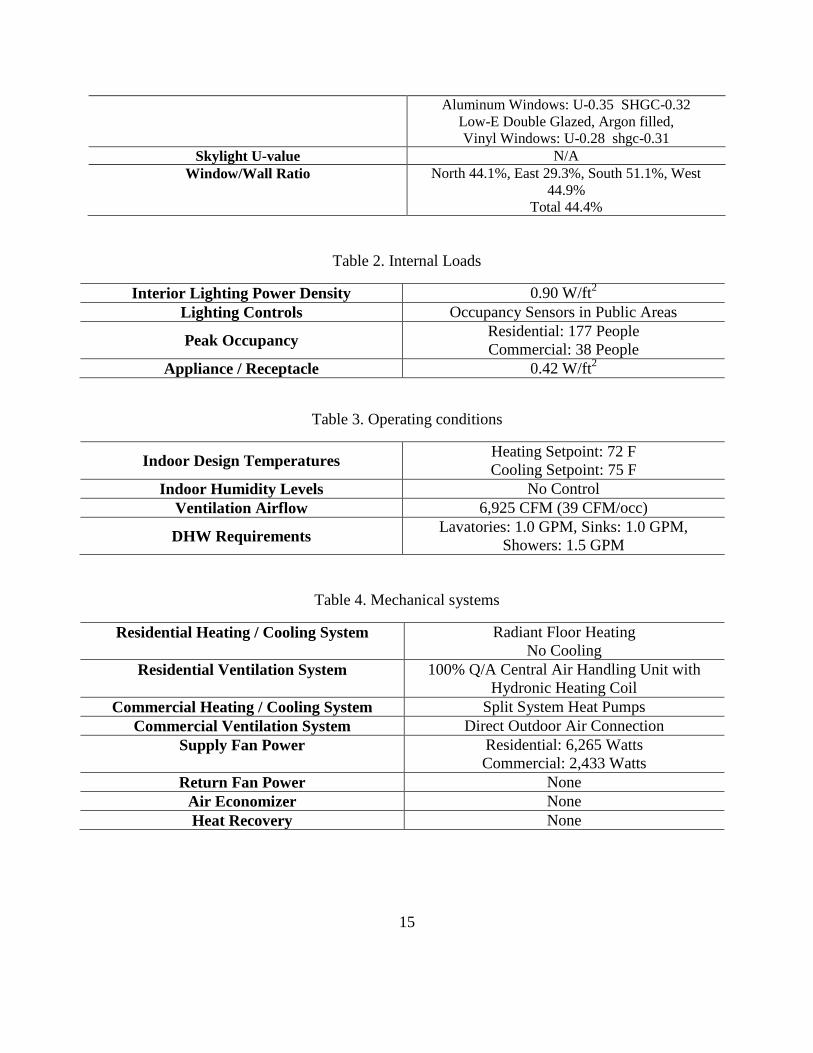
Table 1. Envelope
Floor Area 78,637 ft2
Number of storeys 6 Roof Construction 6” Rigid Insulation Roof
Overall Building: R-32.3 Wall construction 2x6 Wood Framed Batt Insulation Wall
Overall Building: R-16.9 Glazing Properties Low-E Double Glazed, Argon – Filled, Thermally
broken
Figure 6. Daily occupancy profile
15
Aluminum Windows: U-0.35 SHGC-0.32 Low-E Double Glazed, Argon filled, Vinyl Windows: U-0.28 shgc-0.31
Skylight U-value N/A Window/Wall Ratio North 44.1%, East 29.3%, South 51.1%, West
44.9% Total 44.4%
Table 2. Internal Loads
Interior Lighting Power Density 0.90 W/ft2
Lighting Controls Occupancy Sensors in Public Areas
Peak Occupancy Residential: 177 People
Commercial: 38 People
Appliance / Receptacle 0.42 W/ft2
Table 3. Operating conditions
Indoor Design Temperatures Heating Setpoint: 72 F
Cooling Setpoint: 75 F
Indoor Humidity Levels No Control
Ventilation Airflow 6,925 CFM (39 CFM/occ)
DHW Requirements Lavatories: 1.0 GPM, Sinks: 1.0 GPM,
Showers: 1.5 GPM
Table 4. Mechanical systems
Residential Heating / Cooling System Radiant Floor Heating
No Cooling
Residential Ventilation System 100% Q/A Central Air Handling Unit with
Hydronic Heating Coil
Commercial Heating / Cooling System Split System Heat Pumps
Commercial Ventilation System Direct Outdoor Air Connection
Supply Fan Power Residential: 6,265 Watts
Commercial: 2,433 Watts
Return Fan Power None
Air Economizer None
Heat Recovery None
16
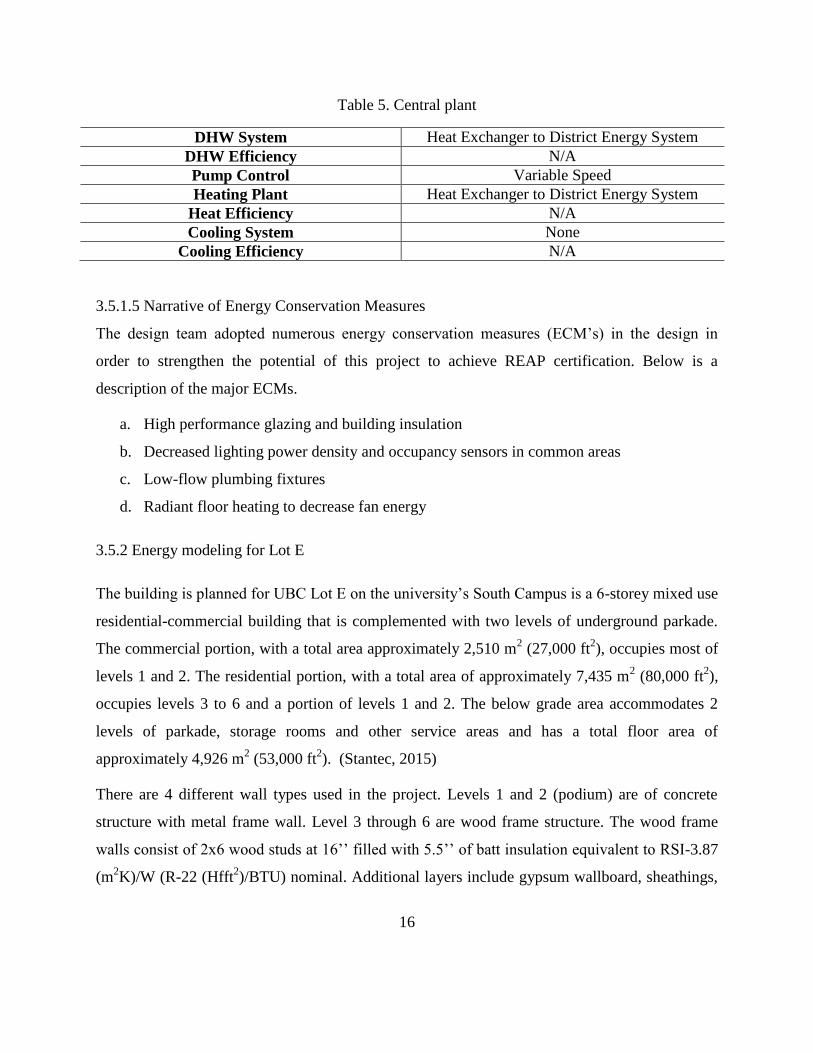
Table 5. Central plant
DHW System Heat Exchanger to District Energy System
DHW Efficiency N/A
Pump Control Variable Speed
Heating Plant Heat Exchanger to District Energy System
Heat Efficiency N/A
Cooling System None
Cooling Efficiency N/A
3.5.1.5 Narrative of Energy Conservation Measures
The design team adopted numerous energy conservation measures (ECM’s) in the design in
order to strengthen the potential of this project to achieve REAP certification. Below is a
description of the major ECMs.
a. High performance glazing and building insulation
b. Decreased lighting power density and occupancy sensors in common areas
c. Low-flow plumbing fixtures
d. Radiant floor heating to decrease fan energy
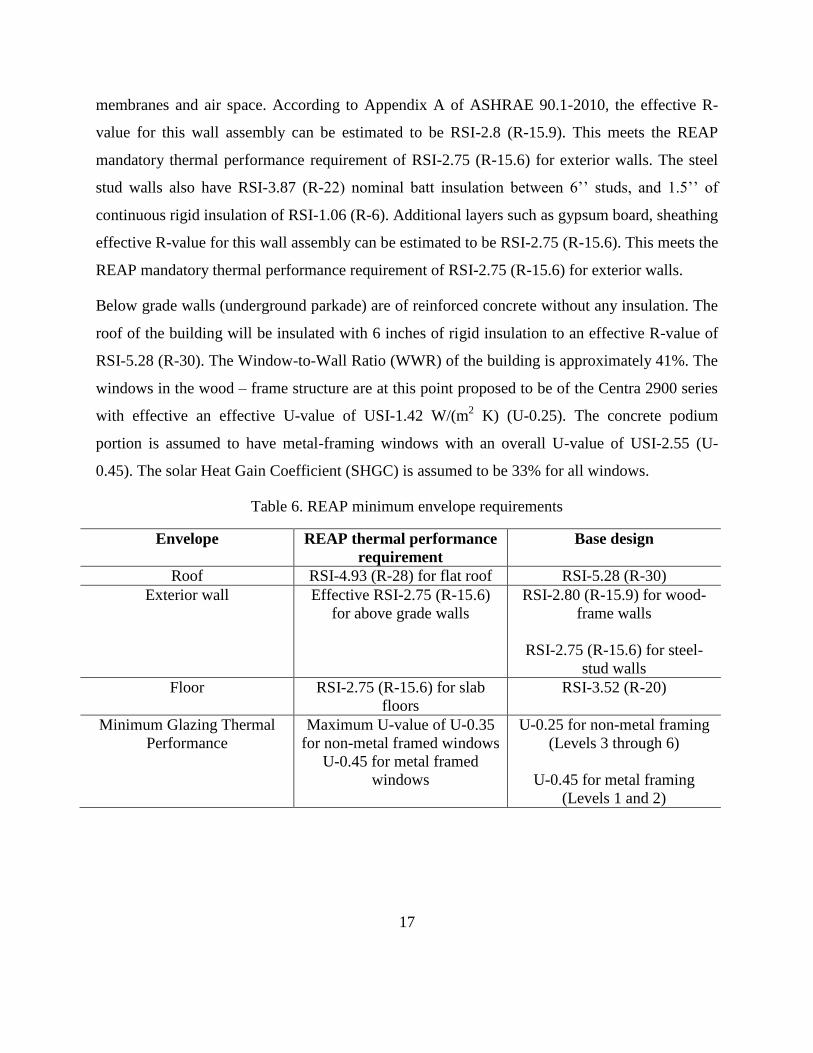
3.5.2 Energy modeling for Lot E
The building is planned for UBC Lot E on the university’s South Campus is a 6-storey mixed use
residential-commercial building that is complemented with two levels of underground parkade.
The commercial portion, with a total area approximately 2,510 m2 (27,000 ft
2), occupies most of
levels 1 and 2. The residential portion, with a total area of approximately 7,435 m2 (80,000 ft
2),
occupies levels 3 to 6 and a portion of levels 1 and 2. The below grade area accommodates 2
levels of parkade, storage rooms and other service areas and has a total floor area of
approximately 4,926 m2 (53,000 ft
2). (Stantec, 2015)
There are 4 different wall types used in the project. Levels 1 and 2 (podium) are of concrete
structure with metal frame wall. Level 3 through 6 are wood frame structure. The wood frame
walls consist of 2x6 wood studs at 16’’ filled with 5.5’’ of batt insulation equivalent to RSI-3.87
(m2K)/W (R-22 (Hfft
2)/BTU) nominal. Additional layers include gypsum wallboard, sheathings,
17
membranes and air space. According to Appendix A of ASHRAE 90.1-2010, the effective R-
value for this wall assembly can be estimated to be RSI-2.8 (R-15.9). This meets the REAP
mandatory thermal performance requirement of RSI-2.75 (R-15.6) for exterior walls. The steel
stud walls also have RSI-3.87 (R-22) nominal batt insulation between 6’’ studs, and 1.5’’ of
continuous rigid insulation of RSI-1.06 (R-6). Additional layers such as gypsum board, sheathing
effective R-value for this wall assembly can be estimated to be RSI-2.75 (R-15.6). This meets the
REAP mandatory thermal performance requirement of RSI-2.75 (R-15.6) for exterior walls.
Below grade walls (underground parkade) are of reinforced concrete without any insulation. The
roof of the building will be insulated with 6 inches of rigid insulation to an effective R-value of
RSI-5.28 (R-30). The Window-to-Wall Ratio (WWR) of the building is approximately 41%. The
windows in the wood – frame structure are at this point proposed to be of the Centra 2900 series
with effective an effective U-value of USI-1.42 W/(m2 K) (U-0.25). The concrete podium
portion is assumed to have metal-framing windows with an overall U-value of USI-2.55 (U-
0.45). The solar Heat Gain Coefficient (SHGC) is assumed to be 33% for all windows.
Table 6. REAP minimum envelope requirements
Envelope REAP thermal performance
requirement
Base design
Roof RSI-4.93 (R-28) for flat roof RSI-5.28 (R-30)
Exterior wall Effective RSI-2.75 (R-15.6)
for above grade walls
RSI-2.80 (R-15.9) for wood-
frame walls
RSI-2.75 (R-15.6) for steel-
stud walls
Floor RSI-2.75 (R-15.6) for slab
floors
RSI-3.52 (R-20)
Minimum Glazing Thermal
Performance
Maximum U-value of U-0.35
for non-metal framed windows
U-0.45 for metal framed
windows
U-0.25 for non-metal framing
(Levels 3 through 6)
U-0.45 for metal framing
(Levels 1 and 2)
18
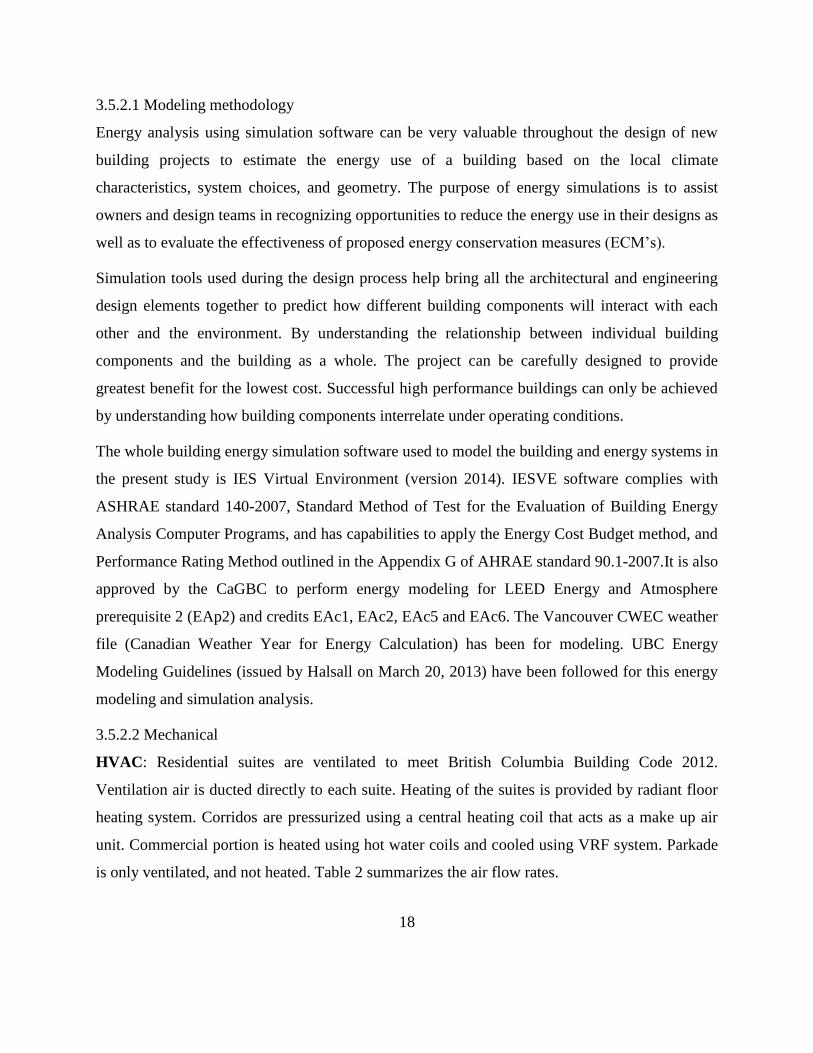
3.5.2.1 Modeling methodology
Energy analysis using simulation software can be very valuable throughout the design of new
building projects to estimate the energy use of a building based on the local climate
characteristics, system choices, and geometry. The purpose of energy simulations is to assist
owners and design teams in recognizing opportunities to reduce the energy use in their designs as
well as to evaluate the effectiveness of proposed energy conservation measures (ECM’s).
Simulation tools used during the design process help bring all the architectural and engineering
design elements together to predict how different building components will interact with each
other and the environment. By understanding the relationship between individual building
components and the building as a whole. The project can be carefully designed to provide
greatest benefit for the lowest cost. Successful high performance buildings can only be achieved
by understanding how building components interrelate under operating conditions.
The whole building energy simulation software used to model the building and energy systems in
the present study is IES Virtual Environment (version 2014). IESVE software complies with
ASHRAE standard 140-2007, Standard Method of Test for the Evaluation of Building Energy
Analysis Computer Programs, and has capabilities to apply the Energy Cost Budget method, and
Performance Rating Method outlined in the Appendix G of AHRAE standard 90.1-2007.It is also
approved by the CaGBC to perform energy modeling for LEED Energy and Atmosphere
prerequisite 2 (EAp2) and credits EAc1, EAc2, EAc5 and EAc6. The Vancouver CWEC weather
file (Canadian Weather Year for Energy Calculation) has been for modeling. UBC Energy
Modeling Guidelines (issued by Halsall on March 20, 2013) have been followed for this energy
modeling and simulation analysis.
3.5.2.2 Mechanical
HVAC: Residential suites are ventilated to meet British Columbia Building Code 2012.
Ventilation air is ducted directly to each suite. Heating of the suites is provided by radiant floor
heating system. Corridos are pressurized using a central heating coil that acts as a make up air
unit. Commercial portion is heated using hot water coils and cooled using VRF system. Parkade
is only ventilated, and not heated. Table 2 summarizes the air flow rates.
19
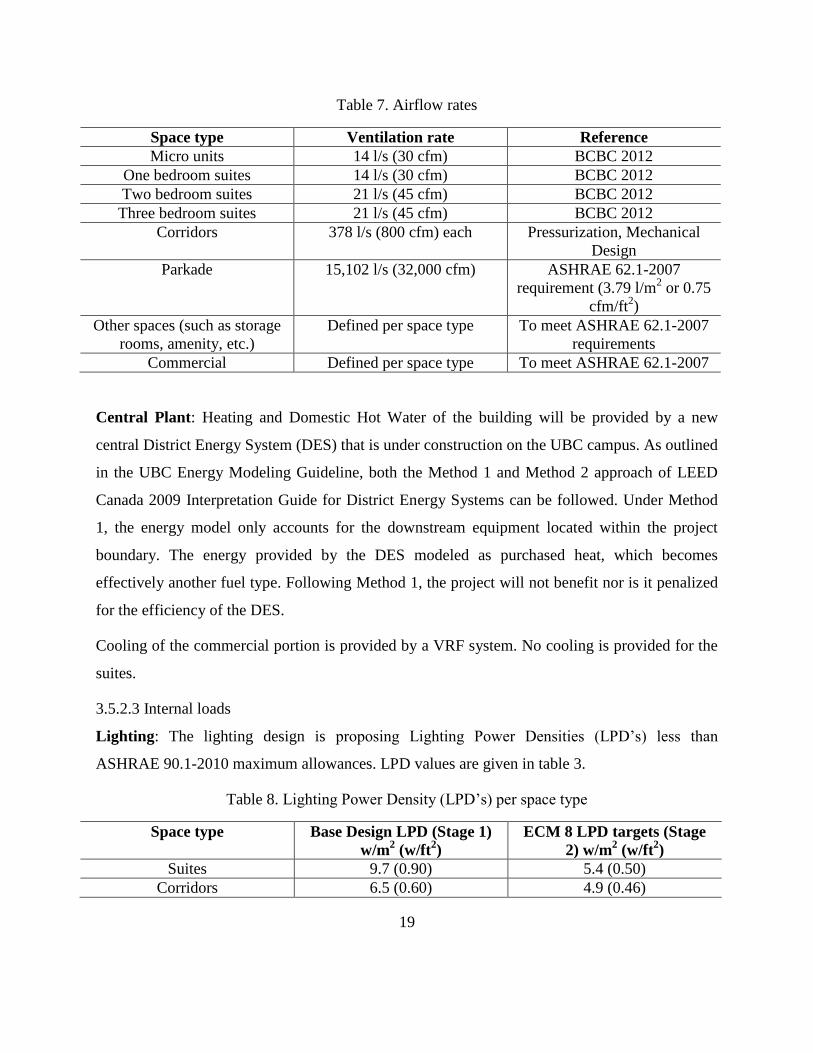
Table 7. Airflow rates
Space type Ventilation rate Reference
Micro units 14 l/s (30 cfm) BCBC 2012
One bedroom suites 14 l/s (30 cfm) BCBC 2012
Two bedroom suites 21 l/s (45 cfm) BCBC 2012
Three bedroom suites 21 l/s (45 cfm) BCBC 2012
Corridors 378 l/s (800 cfm) each Pressurization, Mechanical
Design
Parkade 15,102 l/s (32,000 cfm) ASHRAE 62.1-2007
requirement (3.79 l/m2 or 0.75
cfm/ft2)
Other spaces (such as storage
rooms, amenity, etc.)
Defined per space type To meet ASHRAE 62.1-2007
requirements
Commercial Defined per space type To meet ASHRAE 62.1-2007
Central Plant: Heating and Domestic Hot Water of the building will be provided by a new
central District Energy System (DES) that is under construction on the UBC campus. As outlined
in the UBC Energy Modeling Guideline, both the Method 1 and Method 2 approach of LEED
Canada 2009 Interpretation Guide for District Energy Systems can be followed. Under Method
1, the energy model only accounts for the downstream equipment located within the project
boundary. The energy provided by the DES modeled as purchased heat, which becomes
effectively another fuel type. Following Method 1, the project will not benefit nor is it penalized
for the efficiency of the DES.
Cooling of the commercial portion is provided by a VRF system. No cooling is provided for the
suites.
3.5.2.3 Internal loads
Lighting: The lighting design is proposing Lighting Power Densities (LPD’s) less than
ASHRAE 90.1-2010 maximum allowances. LPD values are given in table 3.
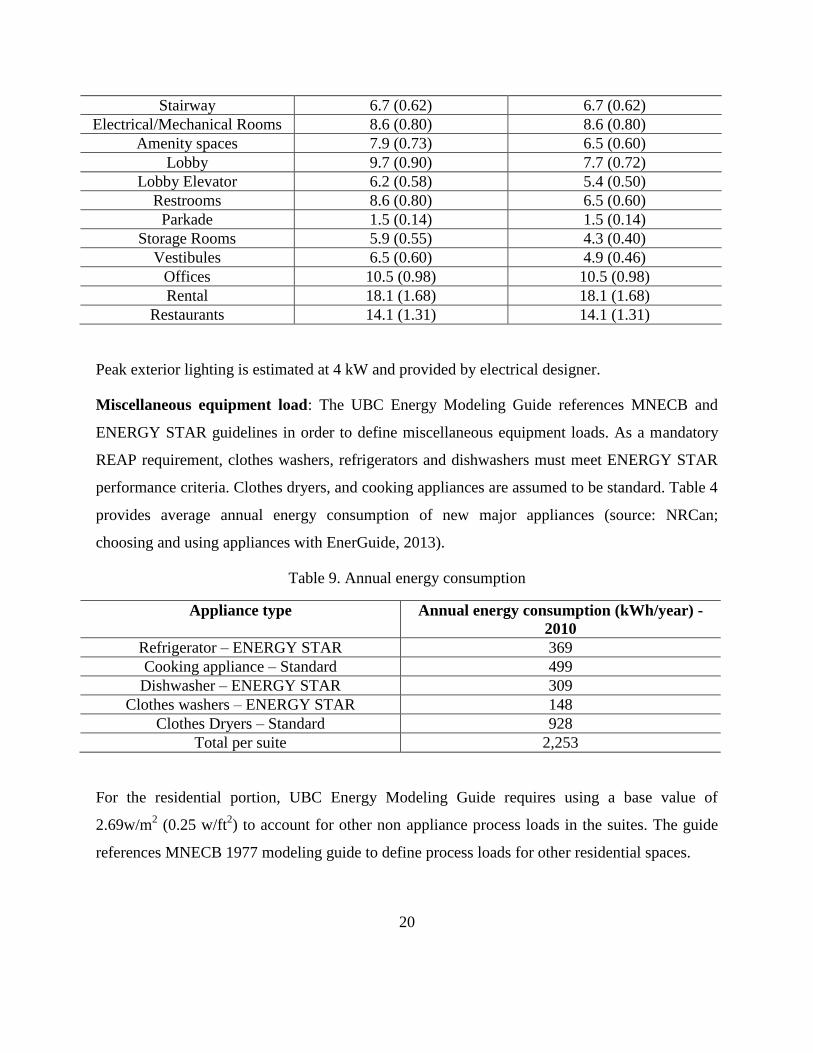
Table 8. Lighting Power Density (LPD’s) per space type
Space type Base Design LPD (Stage 1)
w/m2 (w/ft
2)
ECM 8 LPD targets (Stage
2) w/m2 (w/ft
2)
Suites 9.7 (0.90) 5.4 (0.50)
Corridors 6.5 (0.60) 4.9 (0.46)
20
Stairway 6.7 (0.62) 6.7 (0.62)
Electrical/Mechanical Rooms 8.6 (0.80) 8.6 (0.80)
Amenity spaces 7.9 (0.73) 6.5 (0.60)
Lobby 9.7 (0.90) 7.7 (0.72)
Lobby Elevator 6.2 (0.58) 5.4 (0.50)
Restrooms 8.6 (0.80) 6.5 (0.60)
Parkade 1.5 (0.14) 1.5 (0.14)
Storage Rooms 5.9 (0.55) 4.3 (0.40)
Vestibules 6.5 (0.60) 4.9 (0.46)
Offices 10.5 (0.98) 10.5 (0.98)
Rental 18.1 (1.68) 18.1 (1.68)
Restaurants 14.1 (1.31) 14.1 (1.31)
Peak exterior lighting is estimated at 4 kW and provided by electrical designer.
Miscellaneous equipment load: The UBC Energy Modeling Guide references MNECB and
ENERGY STAR guidelines in order to define miscellaneous equipment loads. As a mandatory
REAP requirement, clothes washers, refrigerators and dishwashers must meet ENERGY STAR
performance criteria. Clothes dryers, and cooking appliances are assumed to be standard. Table 4
provides average annual energy consumption of new major appliances (source: NRCan;
choosing and using appliances with EnerGuide, 2013).
Table 9. Annual energy consumption
Appliance type Annual energy consumption (kWh/year) -
2010
Refrigerator – ENERGY STAR 369
Cooking appliance – Standard 499
Dishwasher – ENERGY STAR 309
Clothes washers – ENERGY STAR 148
Clothes Dryers – Standard 928
Total per suite 2,253
For the residential portion, UBC Energy Modeling Guide requires using a base value of
2.69w/m2 (0.25 w/ft
2) to account for other non appliance process loads in the suites. The guide
references MNECB 1977 modeling guide to define process loads for other residential spaces.
21
For commercial spaces, ASHRAE 90.1-2010 values are used as they are more recent than
MNECB and better represent commercial plug loads.
Table 10. Equipment plug loads
Appliance type Equipment load W/m2 (W/ft
2)
Suites 2.69 (0.25)
Offices 16.14 (1.5)
Retail 5.38 (0.5)
Restaurant 5.38 (0.5)
Mechanical/Electrical Rooms 1.08 (0.1)
Washrooms 1.08 (0.1)
Corridors, Stairs, Storage Rooms 0
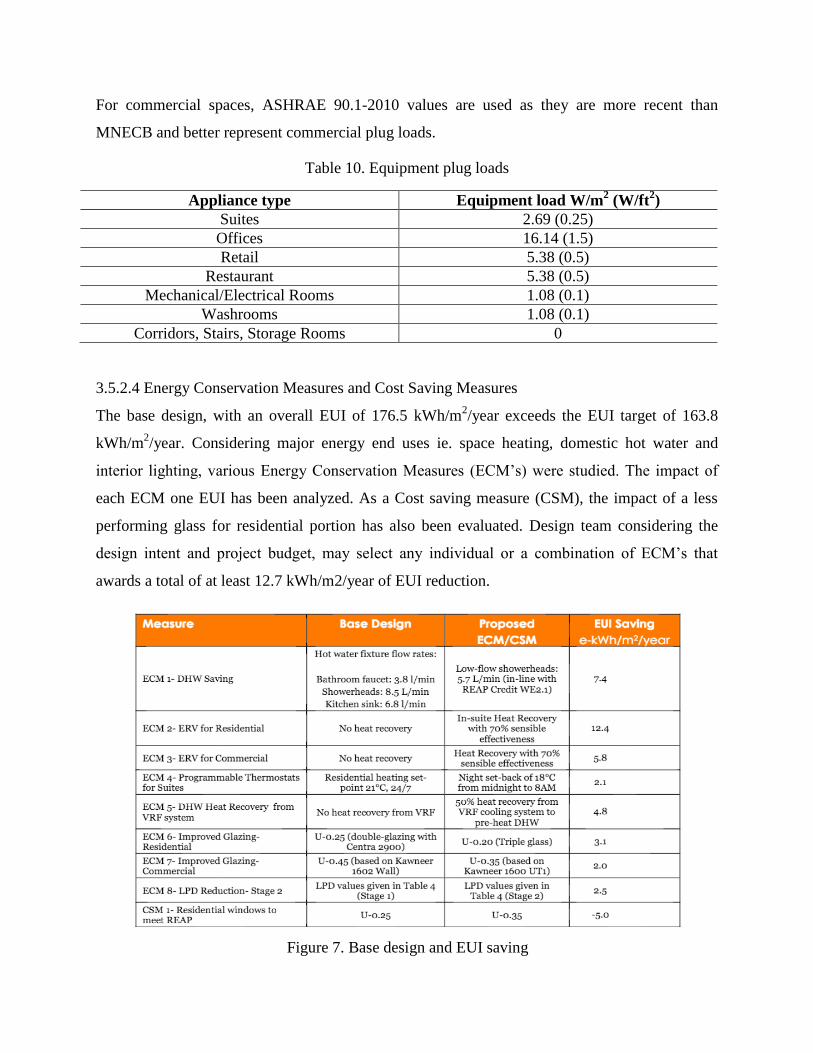
3.5.2.4 Energy Conservation Measures and Cost Saving Measures
The base design, with an overall EUI of 176.5 kWh/m2/year exceeds the EUI target of 163.8
kWh/m2/year. Considering major energy end uses ie. space heating, domestic hot water and
interior lighting, various Energy Conservation Measures (ECM’s) were studied. The impact of
each ECM one EUI has been analyzed. As a Cost saving measure (CSM), the impact of a less
performing glass for residential portion has also been evaluated. Design team considering the
design intent and project budget, may select any individual or a combination of ECM’s that
awards a total of at least 12.7 kWh/m2/year of EUI reduction.
Figure 7. Base design and EUI saving
22
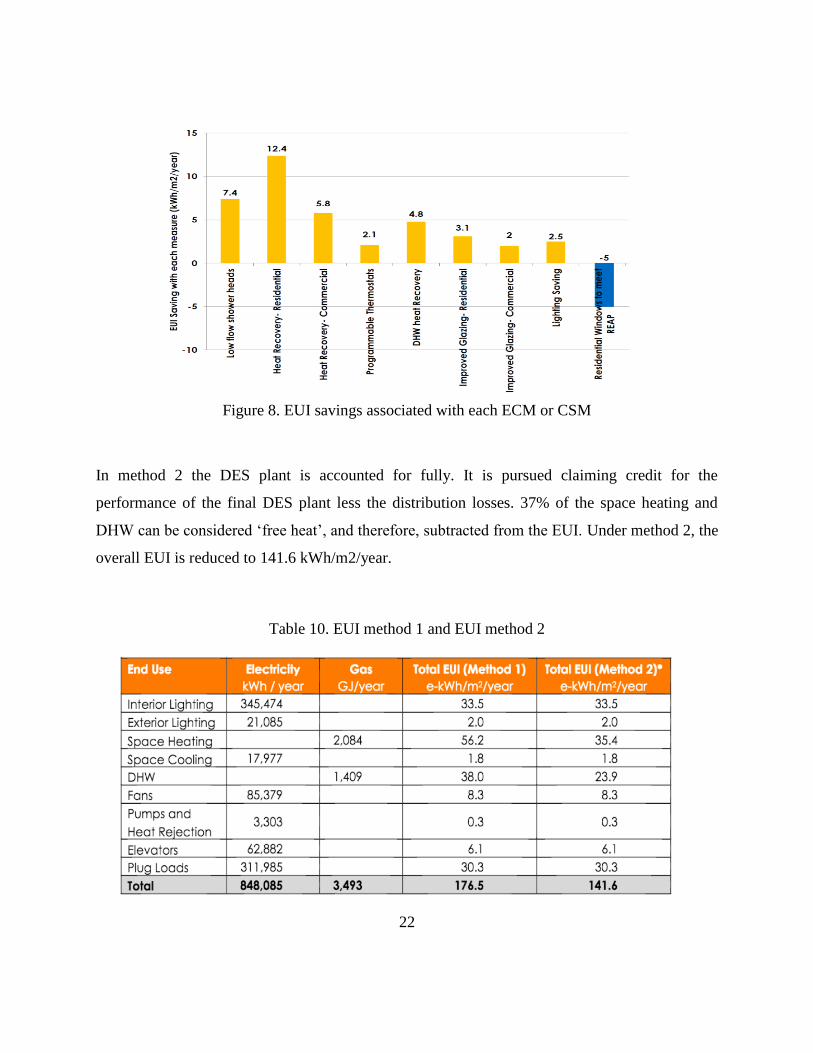
In method 2 the DES plant is accounted for fully. It is pursued claiming credit for the
performance of the final DES plant less the distribution losses. 37% of the space heating and
DHW can be considered ‘free heat’, and therefore, subtracted from the EUI. Under method 2, the
overall EUI is reduced to 141.6 kWh/m2/year.
Table 10. EUI method 1 and EUI method 2
Figure 8. EUI savings associated with each ECM or CSM
23
*Space Heating and DHW load is multiplied by 0.63 to calculate the method 2 values.
4. RESULTS
4.1 Ventilation Requirements in BC Building Code
4.1.1 BC Building Code for Natural Ventilation
Except as permitted by Sentence (2), the ventilation required shall be provided by mechanical
ventilation, except that it can be provided by natural ventilation or a combination of natural and
mechanical ventilation in
a. Buildings of other than residential occupancy having an occupant load of not more than
one person per 40 m2 during normal use.
b. Buildings of industrial occupancy where the nature of the processes contained therein
permits or requires the use of large openings in the building envelope even during the
winter, and seasonal buildings not intended to be occupied during the winter.
Where climatic conditions permit, buildings containing occupancies other than residential
occupancies may be ventilated by natural ventilation methods in lieu of mechanical ventilation
where engineering data demonstrates that such a method will provide the required ventilation for
the type of occupancy.
4.1.2 BC Building Code for Mechanical Ventilation
Mechanical Ventilation System Components:
1. A mechanical ventilation system shall include
a. A principal ventilation system that
(1) provides supply air in accordance with Article 9.32.3.4., and
(2) includes an exhaust fan that conforms with Article 9.32.3.5.,
b. the kitchen and bathroom exhaust fans that are required by Article 9.32.3.6., and
24
c. if the building includes a heated crawl space, the components that are required by
Article 9.32.3.7.
2. Principal Ventilation System Supply Air
Except as provided in Sentence (6), a principal ventilation system shall mechanically
provide supply air in accordance with Sentence (2), (3), (4) or (5).
3. Where the principal ventilation system is a ducted forced-air heating system, the ducted
forced-air heating system shall
a. provide supply air through the ducting to each bedroom, and each floor level without
a bedroom,
b. draw supply air from an outdoor inlet that is connected to the cabinet containing the
furnace air circulating fan required by Clause (d) by ducting that measures, from that
cabinet to the point at which the ducting intersects the return air plenum, between 3 m
and 4.5 m in length, or if a flow control device is used, not more than 4.5 m in length.
c. draw supply air through ducting that is rigid ducting with an equivalent diameter of at
least 100 mm, or flexible ducting with an equivalent diameter of at least 125 mm, and
d. have a furnace air circulating fan set to run continuously.
4. Where the principal ventilation system is a ducted forced-air heating system used in
combination with a heat-recovery ventilator,
a. the ducted forced-air heating system shall conform to Clauses (2)(a), (c) and (d),
b. the heat-recovery ventilator shall draw supply air from an outdoor inlet into the return
air plenum of the ducted forced-air heating system, and
c. the heat-recovery ventilator shall draw exhaust air, through dedicated ducting,
d. from one or more indoor inlets, at least one of which is located at least 2 m
e. above the floor of the uppermost floor level, and
f. at the capacity rating of the heat-recovery ventilator, which shall be no less than the
air-flow rate specified in Table 9.32.3.5.
4. Where the principal ventilation system is a heat-recovery ventilator, the heat-recovery
ventilator shall
a. provide supply air through dedicated ducting to
b. each bedroom, and

25
c. each floor level without a bedroom, and
d. draw exhaust air, through dedicated ducting, from one or more indoor inlets, at least
one of which is located at least 2 m above the floor of the uppermost floor level, and at
the capacity rating of the heat-recovery ventilator, which shall be no less than the air-
flow rate specified in Table 9.32.3.5.
6. Where the principal ventilation system is a ducted central-recirculation ventilation
system, the ducted central-recirculation ventilation system shall
a. draw supply air from an outdoor inlet connected upstream of the fan, and
b. draw air from each bedroom and deliver it to a common area, or a common area and
deliver it to each bedroom.
7. A principal ventilation system need not conform to Sentence (1) if the principal
ventilation system
a. services a dwelling unit that is located where the January design temperature, on a 2.5%
basis determined in conformance with Article 1.1.3.1., is greater than −20°C or has only
1 storey and a floor area of less than 168 m2 within the building envelope (see
Appendix A), and does not have a ducted forced-air heating system, and
b. provides supply air passively from outdoors through dedicated inlets that are located in
each bedroom and at least one common area, are located at least 1 800 mm above the
floor, and have an unobstructed vent area of not less than 25 cm2.
4.2 Performance Trend of Building in Vancouver and UBC
4.2.1 Distribution of Energy Consumption in residential buildings in Vancouver
Knowing that the case studies in the report use MAU (make-up air unit) instead of centralized
HRV, the value of energy consumption will definitely be different. Moreover, they are both
mechanical ventilation, so it is believed the result of the report can still provide precise trending
and can be used as a reference.
In the report written by RDH building engineering Ltd., it summarized a few statements about
the average distribution of energy of those 39 cases. (RDH, 2012)
26
Average size of the MURBs in this study was 11,023 m2 within a range of 2,142 to 19,563 m
2
● 49% of energy consumption is electricity (102kWh/ m2/year)
o 57% of electricity was used in suites
▪ 38% used for electric heating
▪ 62% used for appliances (plugs) and lighting
o 43% of electricity was used in common areas
▪ 100% used HVAC, elevators, lighting, plumbing, etc.
22% of total electricity consumption is used for space heat (4% to 36%)
● 51% of energy consumption is gas (111kWh/ m2/year)
○ 51% of the energy is used for space heat within make-up air unit
○ 49% of energy is used for domestic hot water
37% of the total energy consumption of the building is used for space conditioning
(heating and ventilation)
Thus, 37% of total energy consumption of the building is used for space conditioning which did
not include cooling. This number can be used for as a reference in order to compare the
efficiency of the design in Site B and Lot E with other designs within Vancouver area.
4.2.2 Effect of Ventilation System on Space Heat Consumption in Residential Building in
Vancouver
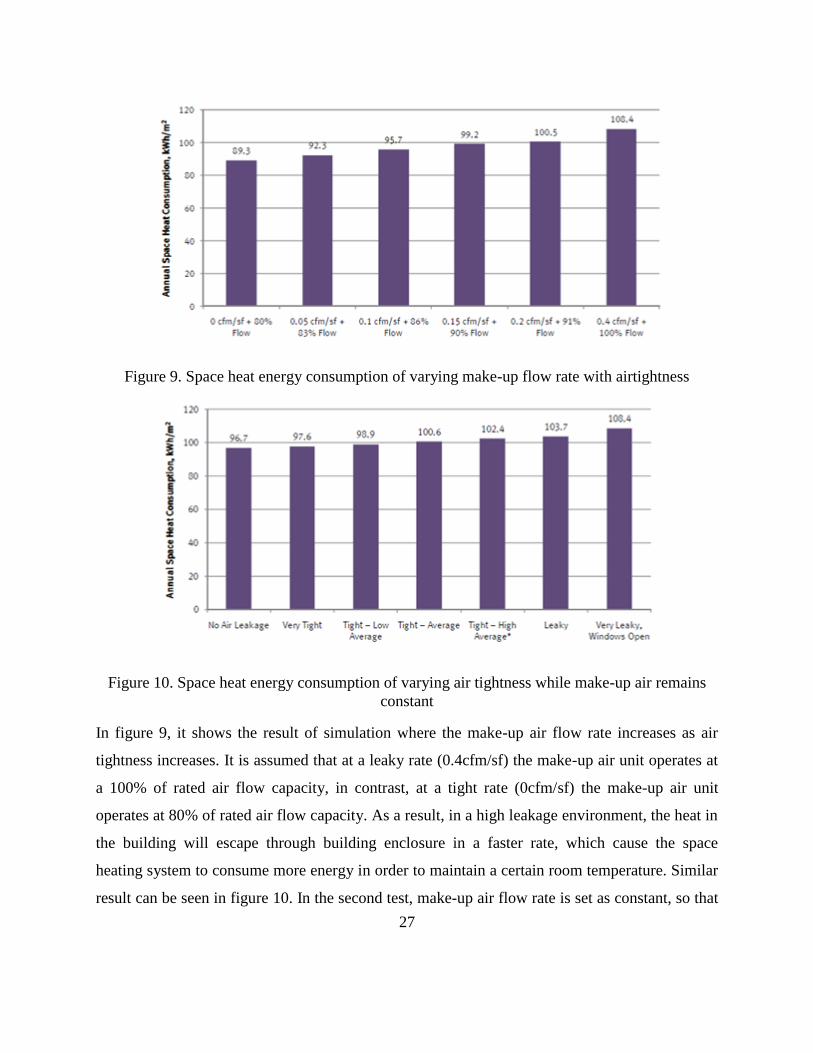
The following two figures show the effect of airtightness and make-up air flow rate on space heat
energy consumption in simulation.
27
Figure 9. Space heat energy consumption of varying make-up flow rate with airtightness
Figure 10. Space heat energy consumption of varying air tightness while make-up air remains
constant
In figure 9, it shows the result of simulation where the make-up air flow rate increases as air
tightness increases. It is assumed that at a leaky rate (0.4cfm/sf) the make-up air unit operates at
a 100% of rated air flow capacity, in contrast, at a tight rate (0cfm/sf) the make-up air unit
operates at 80% of rated air flow capacity. As a result, in a high leakage environment, the heat in
the building will escape through building enclosure in a faster rate, which cause the space
heating system to consume more energy in order to maintain a certain room temperature. Similar
result can be seen in figure 10. In the second test, make-up air flow rate is set as constant, so that
28
the impact of airtightness to space heat consumption can be earlier to observe. At a leaky rate,
annual space heat consumption is around 108.4kWh/m2. However, the annual space heat
consumption decreases to 96.7kWh/m2 at a tight rate. Therefore, it is conclusive that the higher
the air tightness rate (cfm/sf), the higher the space heating consumption will be.
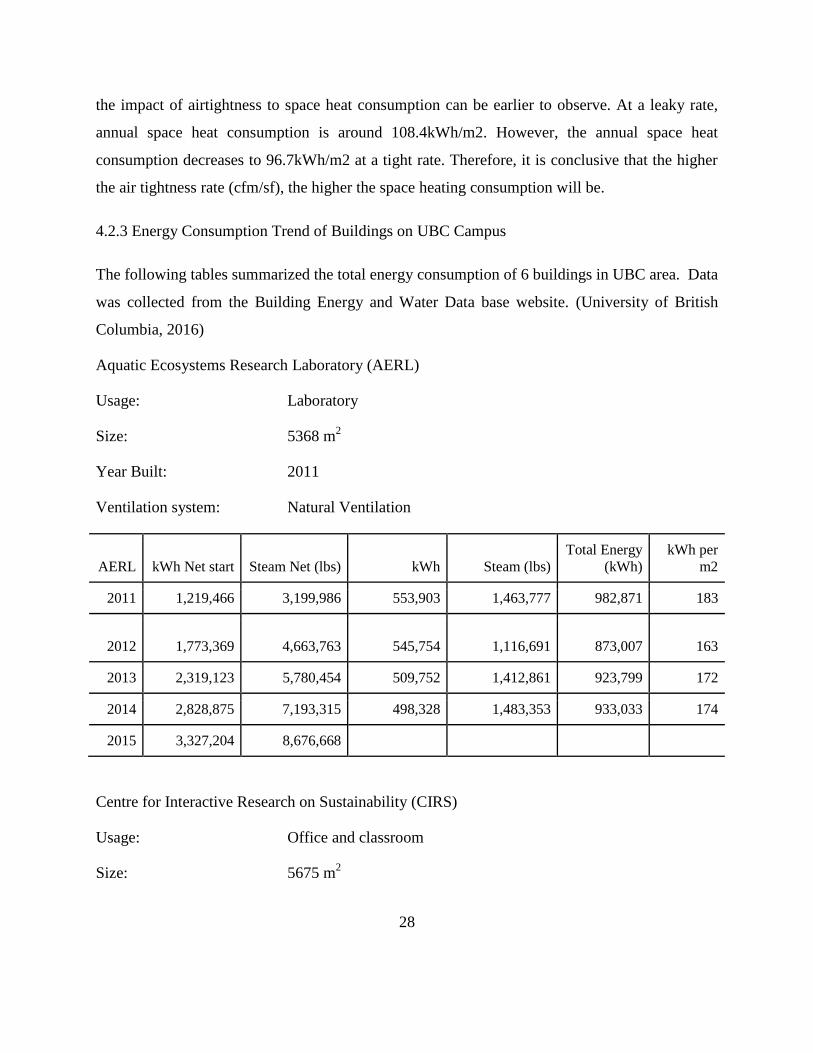
4.2.3 Energy Consumption Trend of Buildings on UBC Campus
The following tables summarized the total energy consumption of 6 buildings in UBC area. Data
was collected from the Building Energy and Water Data base website. (University of British
Columbia, 2016)
Aquatic Ecosystems Research Laboratory (AERL)
Usage: Laboratory
Size: 5368 m2
Year Built: 2011
Ventilation system: Natural Ventilation
AERL kWh Net start Steam Net (lbs) kWh Steam (lbs)
Total Energy
(kWh)
kWh per
m2
2011 1,219,466 3,199,986 553,903 1,463,777 982,871 183
2012 1,773,369 4,663,763 545,754 1,116,691 873,007
163
2013 2,319,123 5,780,454 509,752 1,412,861 923,799 172
2014 2,828,875 7,193,315 498,328 1,483,353 933,033 174
2015 3,327,204 8,676,668
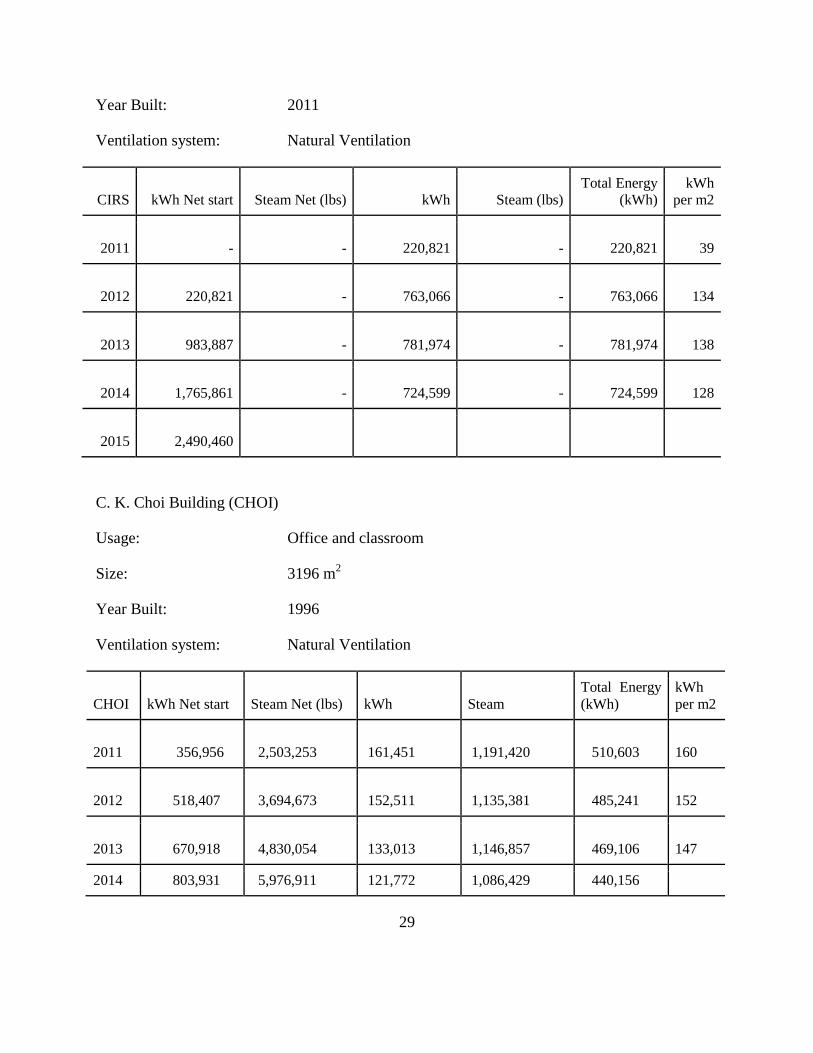
Centre for Interactive Research on Sustainability (CIRS)
Usage: Office and classroom
Size: 5675 m2
29
Year Built: 2011
Ventilation system: Natural Ventilation
CIRS kWh Net start Steam Net (lbs) kWh Steam (lbs)
Total Energy
(kWh)
kWh
per m2
2011 - - 220,821 - 220,821 39
2012
220,821 - 763,066 -
763,066 134
2013
983,887 - 781,974 - 781,974
138
2014
1,765,861 - 724,599 -
724,599
128
2015
2,490,460
C. K. Choi Building (CHOI)
Usage: Office and classroom
Size: 3196 m2
Year Built: 1996
Ventilation system: Natural Ventilation
CHOI kWh Net start Steam Net (lbs) kWh Steam
Total Energy
(kWh)
kWh
per m2
2011 356,956 2,503,253 161,451 1,191,420 510,603
160
2012 518,407 3,694,673 152,511 1,135,381 485,241
152
2013 670,918 4,830,054 133,013 1,146,857 469,106
147
2014 803,931 5,976,911 121,772 1,086,429 440,156
30
138
2015 925,703 7,063,340
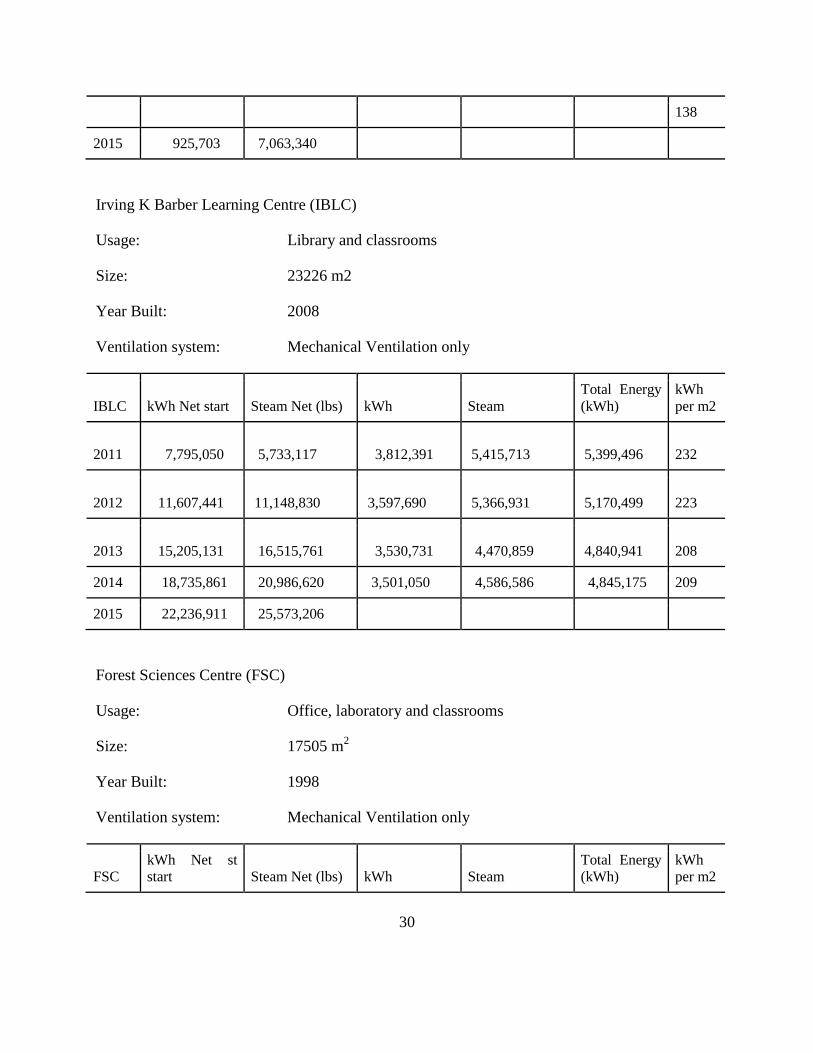
Irving K Barber Learning Centre (IBLC)
Usage: Library and classrooms
Size: 23226 m2
Year Built: 2008
Ventilation system: Mechanical Ventilation only
IBLC kWh Net start Steam Net (lbs) kWh Steam
Total Energy
(kWh)
kWh
per m2
2011 7,795,050 5,733,117 3,812,391 5,415,713 5,399,496
232
2012 11,607,441 11,148,830 3,597,690 5,366,931 5,170,499
223
2013 15,205,131 16,515,761 3,530,731 4,470,859 4,840,941
208
2014 18,735,861 20,986,620 3,501,050 4,586,586 4,845,175 209
2015 22,236,911 25,573,206
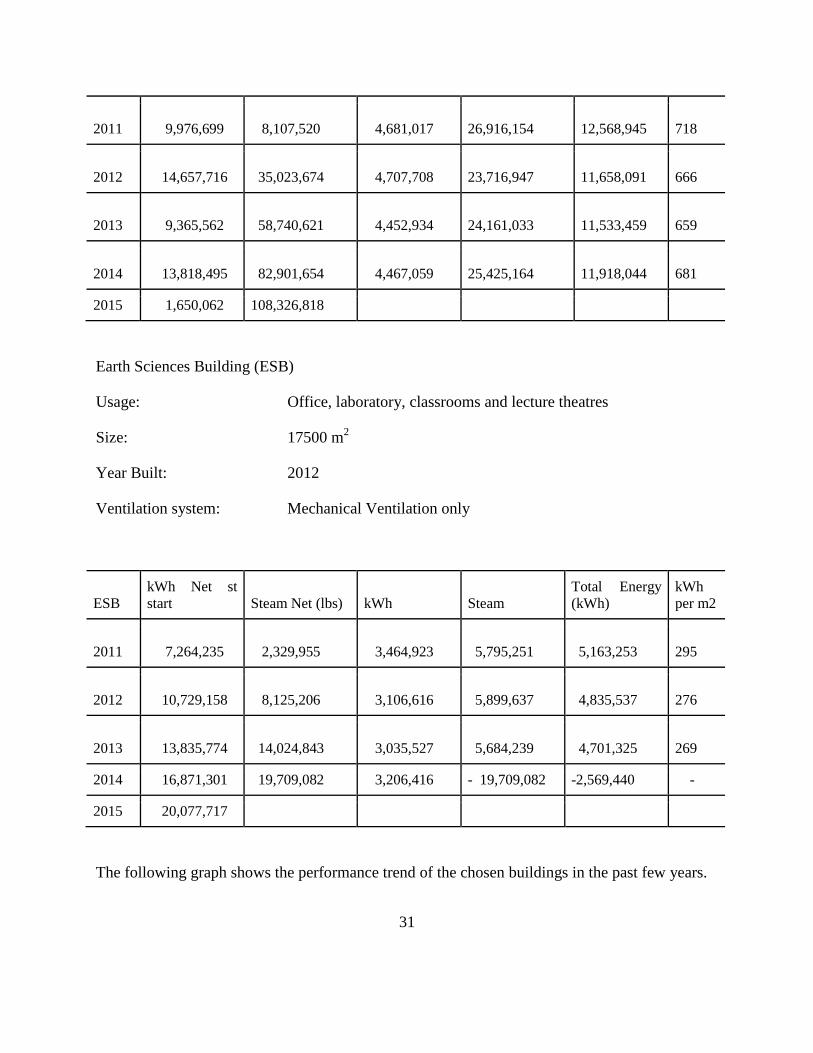
Forest Sciences Centre (FSC)
Usage: Office, laboratory and classrooms
Size: 17505 m2
Year Built: 1998
Ventilation system: Mechanical Ventilation only
FSC
kWh Net st
start Steam Net (lbs) kWh Steam
Total Energy
(kWh)
kWh
per m2
31
2011 9,976,699 8,107,520 4,681,017 26,916,154 12,568,945
718
2012 14,657,716 35,023,674 4,707,708 23,716,947 11,658,091
666
2013 9,365,562 58,740,621 4,452,934 24,161,033 11,533,459
659
2014 13,818,495 82,901,654 4,467,059 25,425,164 11,918,044
681
2015 1,650,062 108,326,818
Earth Sciences Building (ESB)
Usage: Office, laboratory, classrooms and lecture theatres
Size: 17500 m2
Year Built: 2012
Ventilation system: Mechanical Ventilation only
ESB
kWh Net st
start Steam Net (lbs) kWh Steam
Total Energy
(kWh)
kWh
per m2
2011 7,264,235 2,329,955 3,464,923 5,795,251 5,163,253
295
2012 10,729,158 8,125,206 3,106,616 5,899,637 4,835,537
276
2013 13,835,774 14,024,843 3,035,527 5,684,239 4,701,325
269
2014 16,871,301 19,709,082 3,206,416 - 19,709,082 -2,569,440 -
2015 20,077,717
The following graph shows the performance trend of the chosen buildings in the past few years.
32
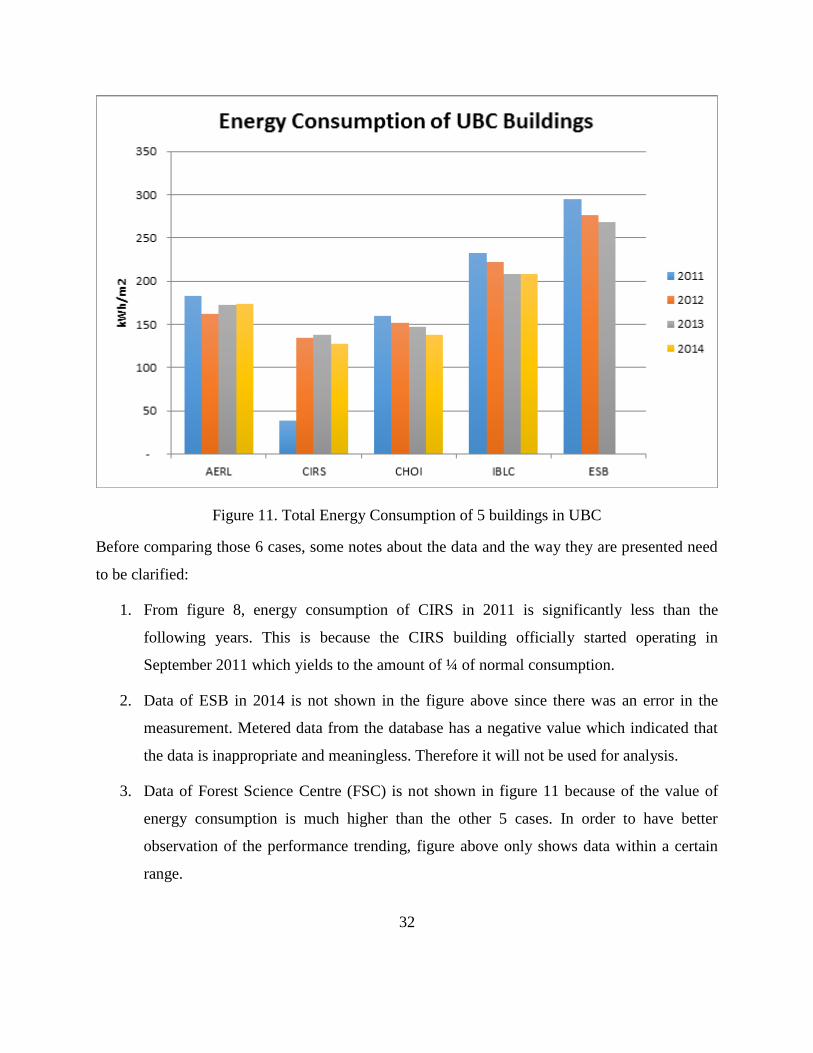
Figure 11. Total Energy Consumption of 5 buildings in UBC
Before comparing those 6 cases, some notes about the data and the way they are presented need
to be clarified:
1. From figure 8, energy consumption of CIRS in 2011 is significantly less than the
following years. This is because the CIRS building officially started operating in
September 2011 which yields to the amount of ¼ of normal consumption.
2. Data of ESB in 2014 is not shown in the figure above since there was an error in the
measurement. Metered data from the database has a negative value which indicated that
the data is inappropriate and meaningless. Therefore it will not be used for analysis.
3. Data of Forest Science Centre (FSC) is not shown in figure 11 because of the value of
energy consumption is much higher than the other 5 cases. In order to have better
observation of the performance trending, figure above only shows data within a certain
range.
33
Disclosure:
In this study, 6 buildings with various usages were chosen. Although the purposes and usages of
each building is different, the trending of energy consumption can still provide some insights of
the effect of ventilation systems. As mentioned in the previous section, the first 3 cases (AERL,
CIRS and CHOI) use natural ventilation system and the other 3 cases (IBLC, FSC and ESB)
operate with mechanical ventilation system. These 6 cases will be compared in terms of level of
consumption, building usages and trend of design.
Looking closely at the performance trend of each building, the annual consumption for most of
them is decreasing, expect for CIRS and AERL. Based on table xx, noticed that the electrical
energy was decreasing in the past few years, which means that the consumption of steam for
heating was increasing. Comparing with AERL, CIRS’s consumption fluctuated a little but the
values are fairly close. Based on the result from the database, noticed that it is difficult to point
out the effect of natural ventilation on the trend of energy consumption because there are many
other factors need to be considered such as weather and user behaviors. However, the trend of
decreasing energy consumption in buildings with mechanical building could be caused by the
optimization of building operation with the study of building usage behavior. In conclusion,
there are many other factors need to be consider in order to point out which ventilation system
has a better control on efficiency.
As listed in the previous section, the study included buildings with various usages. In general,
buildings with laboratories, which contain huge equipment or operate in a longer hour, would
consume more energy. For instance, FSC consumes in average 400kWh per m2 higher than the
other two cases with mechanical ventilation because of its laboratories equipment. Similarly,
AERL’s energy consumption is higher than the other two cases with natural ventilation because
AERL contains laboratories and the other two don’t. Although both buildings have laboratories,
the requirements and specifications of those labs can be significantly different. Therefore, the
decision of applying natural ventilation or mechanical ventilation system purely depends on the
load and usage of the area.
34
According to the result of all calculation, we noticed that the natural ventilation system is often
used in the buildings with smaller area such as AERL, CIRS and CHOI with an average of 4745
m2. In contrast, mechanical ventilation system is chosen for buildings with greater area such
ESB, FSC and IBLC with an average of 19,410m2. This trending may point out that the area of
the building can be an important factor to consider when choosing the ventilation system.
Number of buildings with natural ventilation in UBC is small, so more samples are needed in
order to prove this design trend.
4.3 Common and Best Practices in the Industry
Some strategies that may improve the energy efficiency and consumption were recommended for
those residential buildings. (RDH, 2012)
4.3.1 Strategies to improve energy efficiency and consumption
1. Improve thermal performance of building enclosure
These opportunities include improving glazing and wall assemblies. Much higher thermally
performing windows and reasonable glazing ratios (i.e. less than 40% window area) are
necessary. In terms of targets, glazing assemblies with R-values in the range of R-4 to R-6
(double to triple glazing within non-conductive frames, i.e. Energy Star Zone C & D windows)
should be considered for use in mid- and high-rise buildings. More effective use of the same
level of currently provided insulation (i.e. by the reduction of thermal bridging at cladding
supports, and thermal breaks within balcony and projecting slabs etc.). Roofs and decks should
also be insulated.
2. Control air flow including make-up air ventilation strategies
Better control of air flow within, and through buildings is a key factor in reducing energy
consumption in this building type. Optimal airtightness levels for both the building enclosure and
the whole building under in-service conditions should be determined. This highlights the need
for in-suite and space heating and ventilation systems where occupants are directly responsible
for their energy consumption without impact to the remainder of the building. The study findings
35
identify the need to move away from the traditional pressurized corridor approach of MURB
ventilation and de-couple ventilation from space heating. Separate in-suite ventilation and space
heat systems should be considered. The energy simulations for a typical building showed
significant benefits with the use of heat-recovery ventilators (either in-suite or ducted central
systems). Direct ventilation systems with heat recovery can improve occupant comfort, even in
temperate climates such as Vancouver. As part of the improvements to ventilation strategies,
there is a need for suite compartmentalization to control stack and mechanical pressures across
the building enclosure and across the ducts of in-suite systems.
3. Control air leakage
The use of operable windows (particularly in temperate climates) further invalidates most
estimates of operating building pressures, building enclosure airtightness, and suite
ventilation/heating distribution. Air is exhausted from individual suites by means of exhaust fans,
through air leakage paths (both known and unknown) and occupants opening windows and
exterior doors. The pressurized corridor distribution system is relatively ineffective at
distributing ventilation air to suites – this ventilation system results in significant energy
inefficiencies because the air is heated.
Air leakage results in natural ventilation (albeit with limited ventilation effectiveness and
mixing) and is separate from mechanical ventilation. Mechanical ventilation systems induce
pressures across the building enclosure which also result in air leakage, in addition to
uncontrolled natural infiltration/exfiltration (caused by stack or wind pressures).
Architectural inputs for the energy model were obtained through the detailed quantity take-off
process discussed previously. These included the floor area, exposed wall area, window to wall
ratio, overall wall and roof R-values, window U-value and window solar heat gain coefficient.
Integrated building improvements adopted that include improvements to the thermal
performance of the building enclosure (walls, roofs and windows), airtightness, space heating
system, and ventilation strategies can reduce in space-conditioning (space heating and
ventilation) loads from greater than 100 kWh/m2/yr to less than 10 kWh/m
2/yr using the
calibrated typical building model.
36
4.3.2 Best practices
The Impact of Mechanical Improvements.
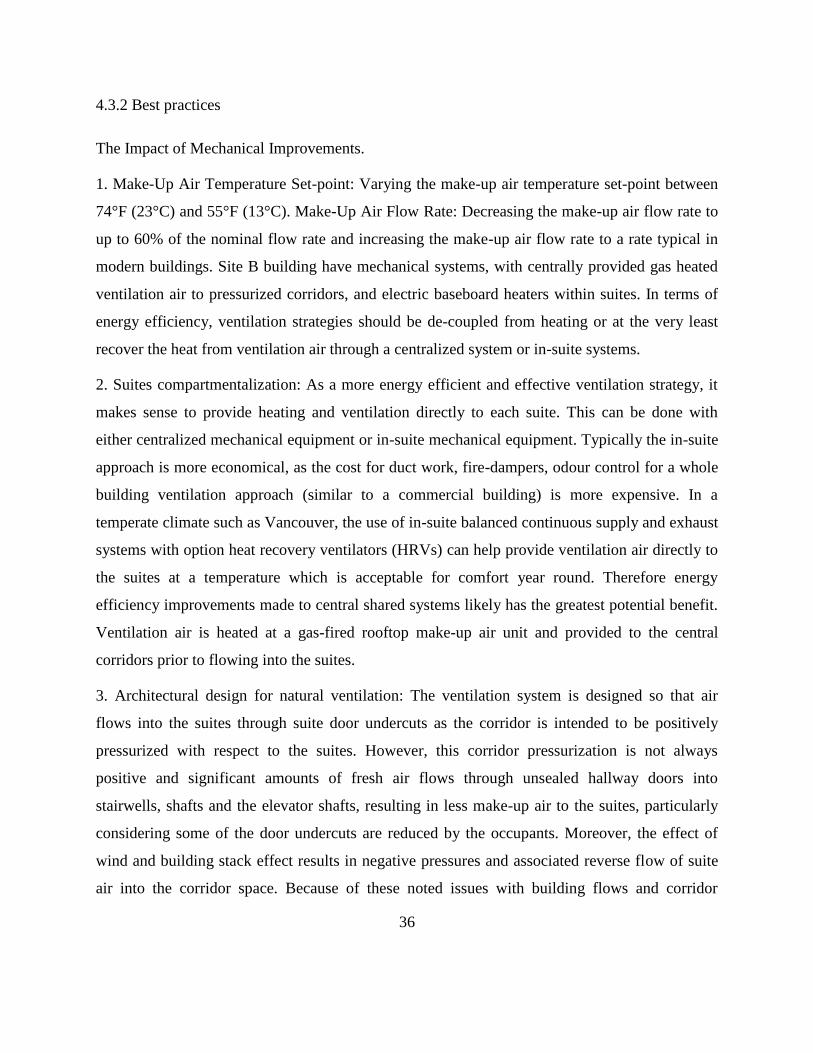
1. Make-Up Air Temperature Set-point: Varying the make-up air temperature set-point between
74°F (23°C) and 55°F (13°C). Make-Up Air Flow Rate: Decreasing the make-up air flow rate to
up to 60% of the nominal flow rate and increasing the make-up air flow rate to a rate typical in
modern buildings. Site B building have mechanical systems, with centrally provided gas heated
ventilation air to pressurized corridors, and electric baseboard heaters within suites. In terms of
energy efficiency, ventilation strategies should be de-coupled from heating or at the very least
recover the heat from ventilation air through a centralized system or in-suite systems.
2. Suites compartmentalization: As a more energy efficient and effective ventilation strategy, it
makes sense to provide heating and ventilation directly to each suite. This can be done with
either centralized mechanical equipment or in-suite mechanical equipment. Typically the in-suite
approach is more economical, as the cost for duct work, fire-dampers, odour control for a whole
building ventilation approach (similar to a commercial building) is more expensive. In a
temperate climate such as Vancouver, the use of in-suite balanced continuous supply and exhaust
systems with option heat recovery ventilators (HRVs) can help provide ventilation air directly to
the suites at a temperature which is acceptable for comfort year round. Therefore energy
efficiency improvements made to central shared systems likely has the greatest potential benefit.
Ventilation air is heated at a gas-fired rooftop make-up air unit and provided to the central
corridors prior to flowing into the suites.
3. Architectural design for natural ventilation: The ventilation system is designed so that air
flows into the suites through suite door undercuts as the corridor is intended to be positively
pressurized with respect to the suites. However, this corridor pressurization is not always
positive and significant amounts of fresh air flows through unsealed hallway doors into
stairwells, shafts and the elevator shafts, resulting in less make-up air to the suites, particularly
considering some of the door undercuts are reduced by the occupants. Moreover, the effect of
wind and building stack effect results in negative pressures and associated reverse flow of suite
air into the corridor space. Because of these noted issues with building flows and corridor
37
pressurization, the in-situ efficiency of supplying tempered ventilation air from the corridors to
each of the suites is questionable in terms of both ventilation and heating effectiveness. The
efficiency of the ventilation air delivered to the corridors is poor for several reasons including air
leakage through shafts, stairwells, wind and stack-effect and blocked suite door undercuts – this
results in poor heating efficiency of this gas space heat. However, the heated air that does get
into the suite does reduce the amount of heat input from suite sources. For these reasons, it is
likely that the useful space heat from the ventilation air is less than what the metering analysis
indicates, but cannot be determined accurately without further information of the actual air flow
distribution throughout this building.
4. Ventilation air flow rates. New residential buildings have ventilation air flow rates up to and
exceeding 100 cfm/suite. The higher flow rates in these newer buildings with similar make-up air
units of efficiency will result in significantly greater gas energy consumption.
Table 11. Summary of energy consumption for a typical residential building
4.4 Mechanical Drawings
4.4.1 Overview
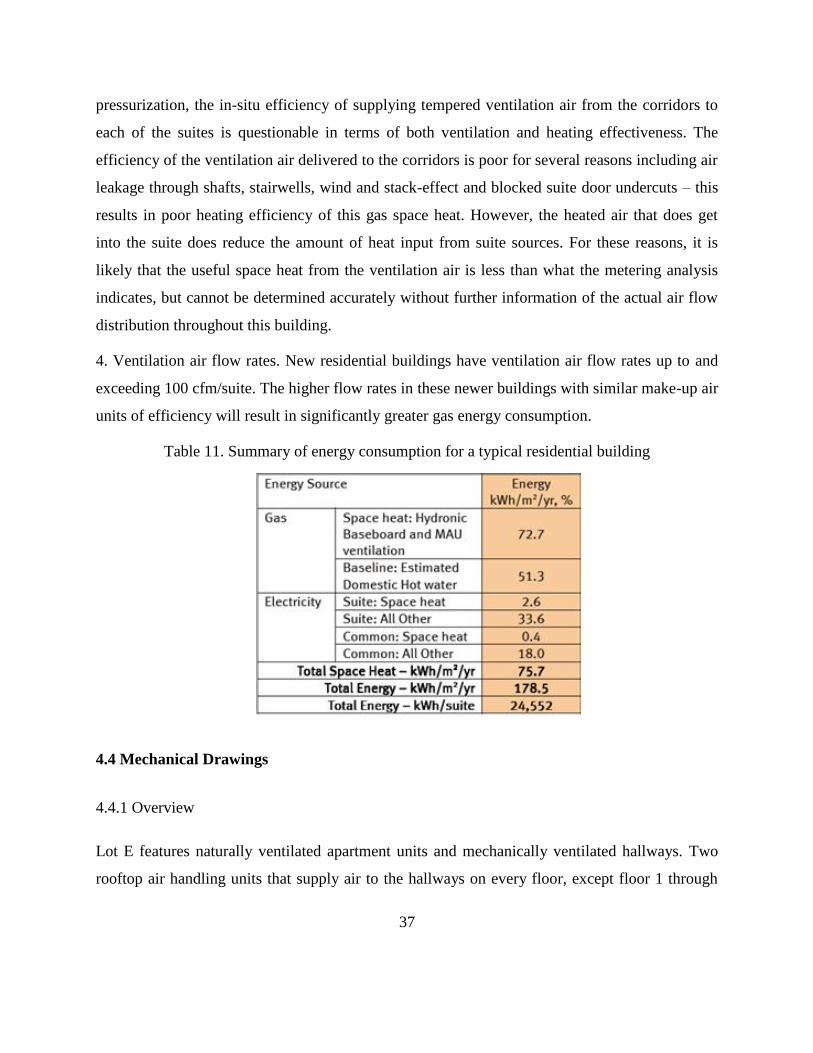
Lot E features naturally ventilated apartment units and mechanically ventilated hallways. Two
rooftop air handling units that supply air to the hallways on every floor, except floor 1 through
38
vertical ducts ranging in size from 16”x20” on the rooftop to 6”x6” in the basement. Fire
dampers are placed at the exhaust into each hallway for a total of two fire dampers per floor.
There are no ducts in the hallways themselves.
Each apartment is has several dedicated intake vents supplying air directly from outside. There is
one exhaust vent for each bathroom and an additional two for the range and dryer. Overall there
are at least 6 exterior penetrations per apartment. The main ducting is 12”x1” in-slab
‘ECCODUCT’, while the range and dryer exhaust ducts are circular and 6” and 5” in diameter,
respectively. Heating is supplied via a radiant floor system. No fire dampers are installed in the
apartments.
Site B features exclusively mechanical ventilation, provided by one large HRV on the rooftop.
Supply and return air for floors 2-6 travels via two vertical ducts on opposite sides of the
building. These ducts are larger than those in Lot E, ranging from 32”x30” at the top of the
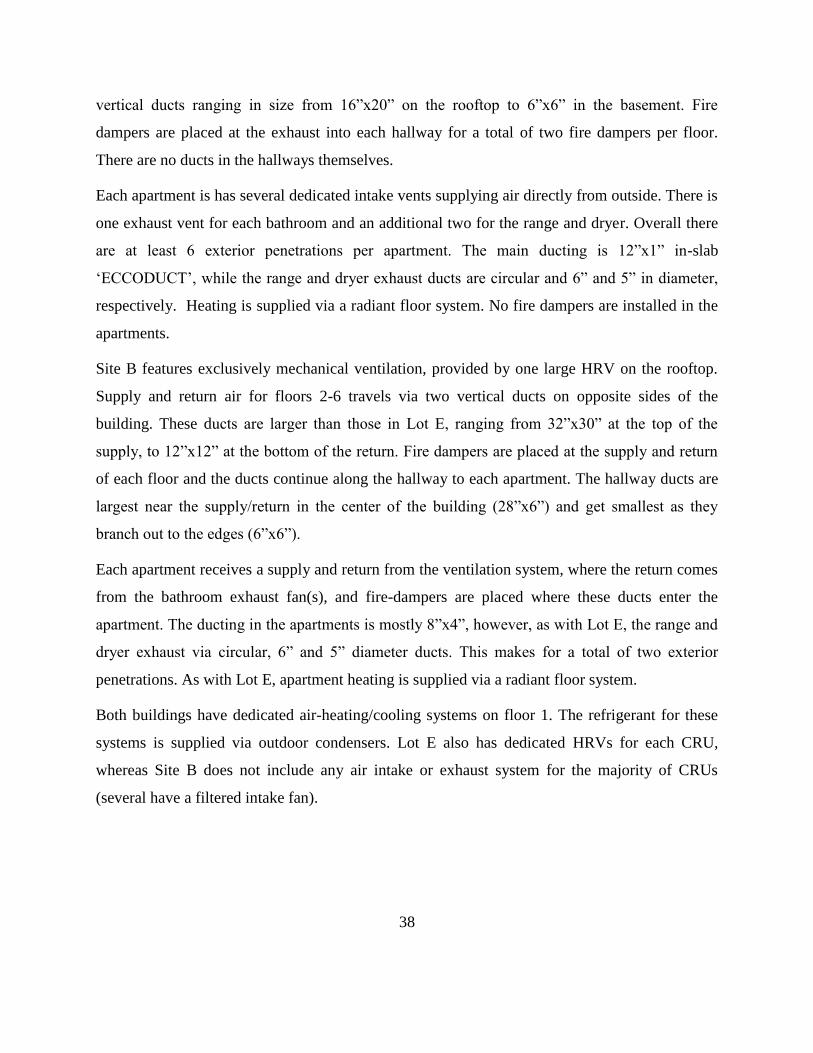
supply, to 12”x12” at the bottom of the return. Fire dampers are placed at the supply and return
of each floor and the ducts continue along the hallway to each apartment. The hallway ducts are
largest near the supply/return in the center of the building (28”x6”) and get smallest as they
branch out to the edges (6”x6”).
Each apartment receives a supply and return from the ventilation system, where the return comes
from the bathroom exhaust fan(s), and fire-dampers are placed where these ducts enter the
apartment. The ducting in the apartments is mostly 8”x4”, however, as with Lot E, the range and
dryer exhaust via circular, 6” and 5” diameter ducts. This makes for a total of two exterior
penetrations. As with Lot E, apartment heating is supplied via a radiant floor system.
Both buildings have dedicated air-heating/cooling systems on floor 1. The refrigerant for these
systems is supplied via outdoor condensers. Lot E also has dedicated HRVs for each CRU,
whereas Site B does not include any air intake or exhaust system for the majority of CRUs
(several have a filtered intake fan).
39
Figure 12. Building cross-section featuring air handling units for Lot E (left, only half of
building shown) and Site B (right)
Figure 13. Hallway ducts in Site B
40
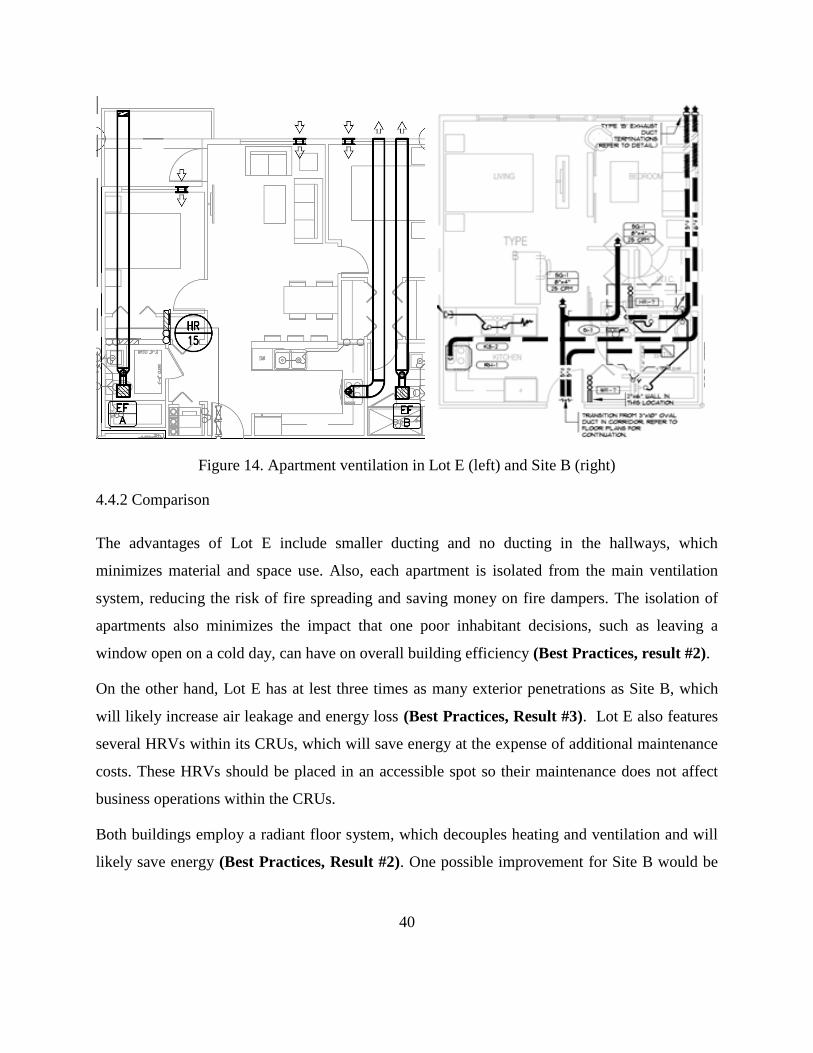
Figure 14. Apartment ventilation in Lot E (left) and Site B (right)
4.4.2 Comparison
The advantages of Lot E include smaller ducting and no ducting in the hallways, which
minimizes material and space use. Also, each apartment is isolated from the main ventilation
system, reducing the risk of fire spreading and saving money on fire dampers. The isolation of
apartments also minimizes the impact that one poor inhabitant decisions, such as leaving a
window open on a cold day, can have on overall building efficiency (Best Practices, result #2).
On the other hand, Lot E has at lest three times as many exterior penetrations as Site B, which
will likely increase air leakage and energy loss (Best Practices, Result #3). Lot E also features
several HRVs within its CRUs, which will save energy at the expense of additional maintenance
costs. These HRVs should be placed in an accessible spot so their maintenance does not affect
business operations within the CRUs.
Both buildings employ a radiant floor system, which decouples heating and ventilation and will
likely save energy (Best Practices, Result #2). One possible improvement for Site B would be
41
to incorporate the dryer exhaust into the HRV, which, while intermittent, presents a significant
heat recovery potential.
4.5 Life Cycle Costing of Ventilation systems
To compare the residential ventilation systems in Site B and Lot E, cost calculations with respect
to lifetime of ventilation system (20 Years) was carried out. Using Net Present Value (NPV)
calculations at nominal discount rate of 5% and inflation of 2% the real discount rate was
calculated to be 3%. Net Present Value (NPV) is the difference between the present value of cash
inflows and the present value of cash outflows. NPV is used in capital budgeting to analyze the
profitability of a projected investment or project.
The following is the formula for calculating NPV:
where
Ct = net cash inflow during the period t
Co = total initial investment costs
r = discount rate, and
t = number of time periods
A positive net present value indicates that the projected earnings generated by a project or
investment (in present dollars) exceeds the anticipated costs (also in present dollars). Generally,
an investment with a positive NPV will be a profitable one and one with a negative NPV will
result in a net loss. This concept is the basis for the Net Present Value Rule, which dictates that
the only investments that should be made are those with positive NPV values.
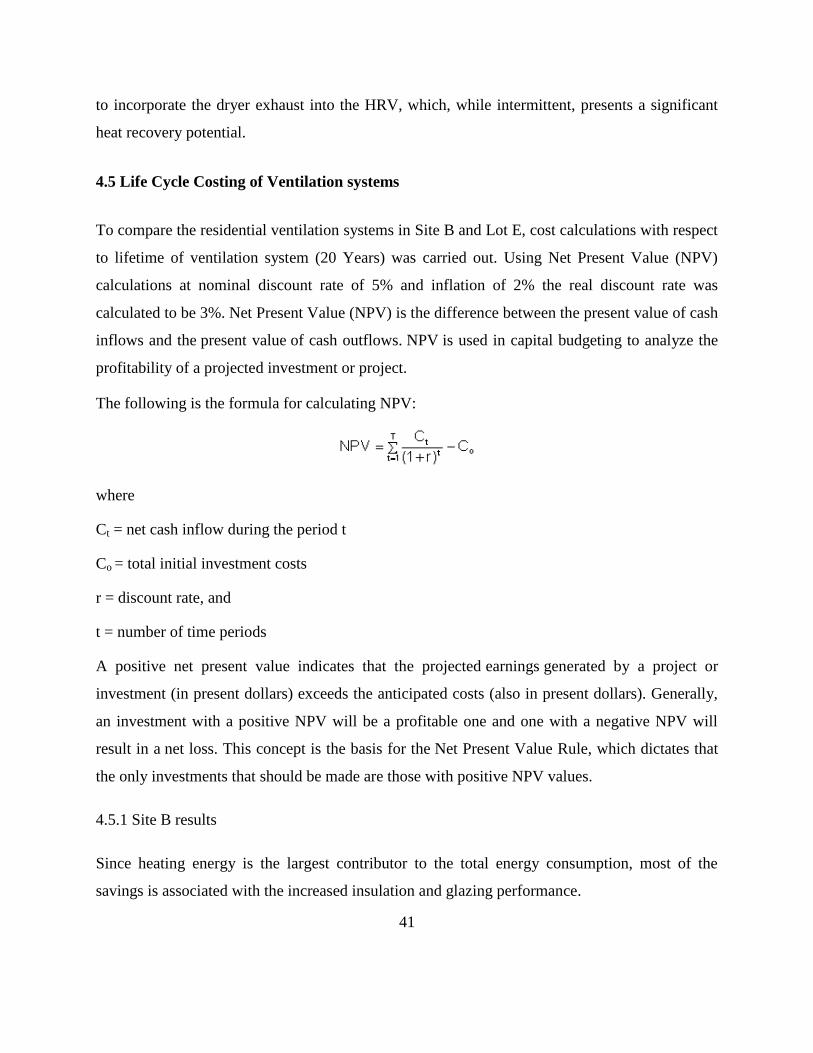
4.5.1 Site B results
Since heating energy is the largest contributor to the total energy consumption, most of the
savings is associated with the increased insulation and glazing performance.
42
4.5.1.2 Net Present Value for Site B
Total project cost of site B = $18M
Mechanical value = $3.3M (including HVAC)
Ventilation system capital cost (With installation) = $800,000
NPV calculation:
The space heating EUI of the residential unit = 56.2 kWh/m2/year
Area of residential unit = 6319 m2
Total energy consumption = 56.2 kWh/m2/year x 6319 m
2
= 355,127.80 kWh/year
Total cost of energy consumption = 355,127.80 kWh/year x DES rates for 20
years (Cash outflow) - [1]
Nominal discount rate (Given) = 5%
Inflation (Given) = 2%
Figure 15. Annual Energy Consumption End – Use breakdown
43
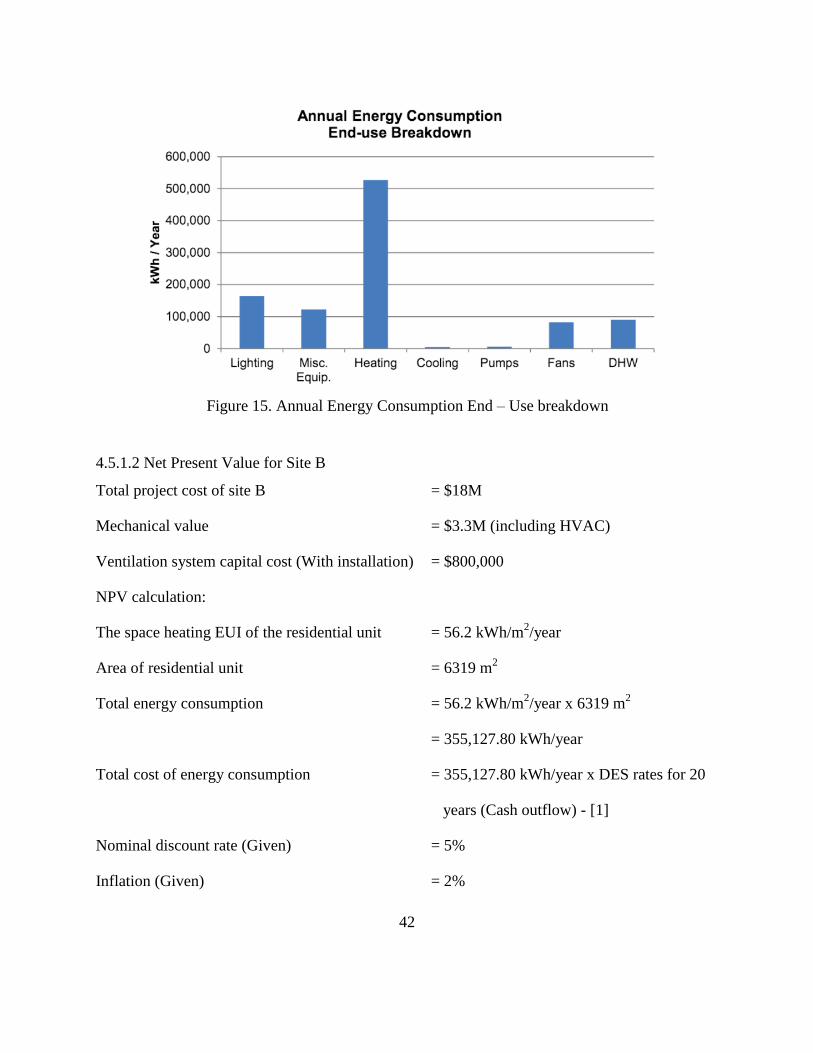
Real discount rate = (1.05/1.02)-1 = 0.0294 ~ 3%
Real discount rate is used because The nominal interest rate doesn’t tell the whole story, because
inflation reduces the lender's or investor’s purchasing power so that they cannot buy the same
amount of goods or services at payoff or maturity with a given amount of money as they can
now. The real interest rate is so named because it states the “real” rate that the lender or investor
receives after inflation is factored in; that is, the interest rate that exceeds the inflation rate.
Total maintenance cost of HVAC unit = $6000 per year (Cash outflow) - [2]
The maintenance cost is higher compared to Lot E because of the HRV system.
Total cash flows = -$ {[1]+[2]} (For 20 years)
Then, NPV is calculated using the ventilation system value, total cash flows and the real discount
rate. The NPV values were normalized by dividing the results by residential area. This made the
results directly comparable (NPV/m2). It is shown in the figure below.
Therefore,
Net Present Value (NPV) = -$1,155,957.15
NPV/m2 = -$182.93/m
2
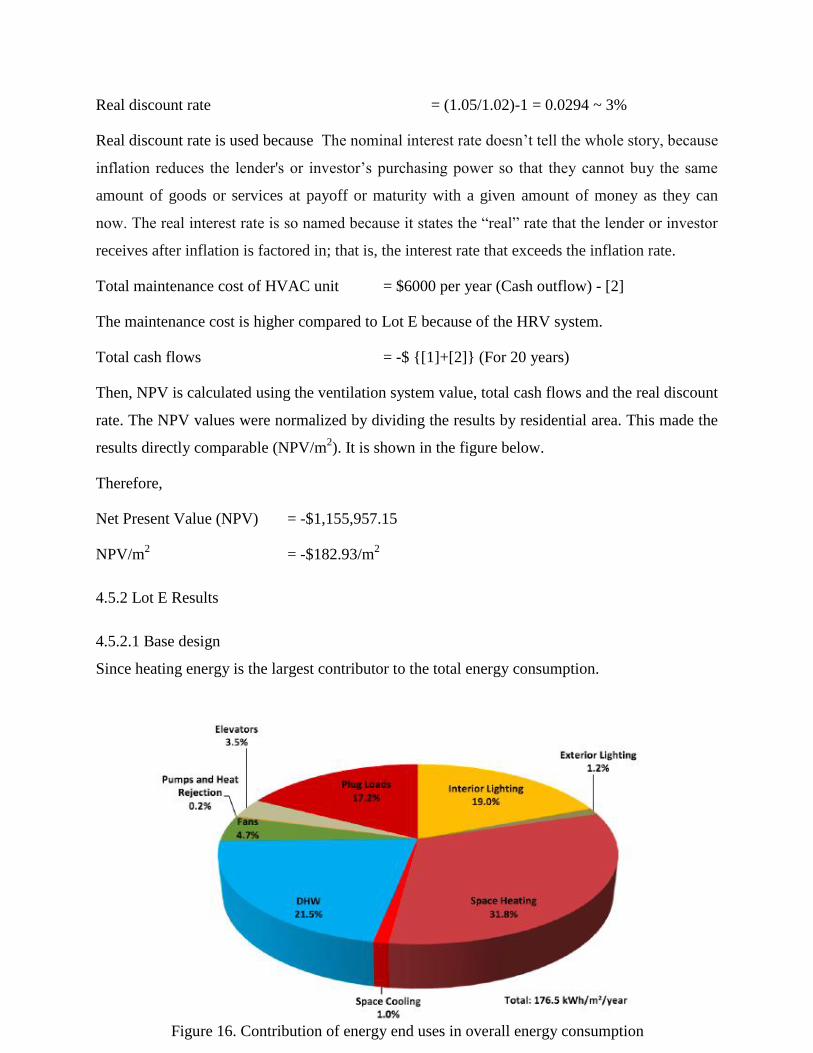
4.5.2 Lot E Results
4.5.2.1 Base design
Since heating energy is the largest contributor to the total energy consumption.
Figure 16. Contribution of energy end uses in overall energy consumption
44
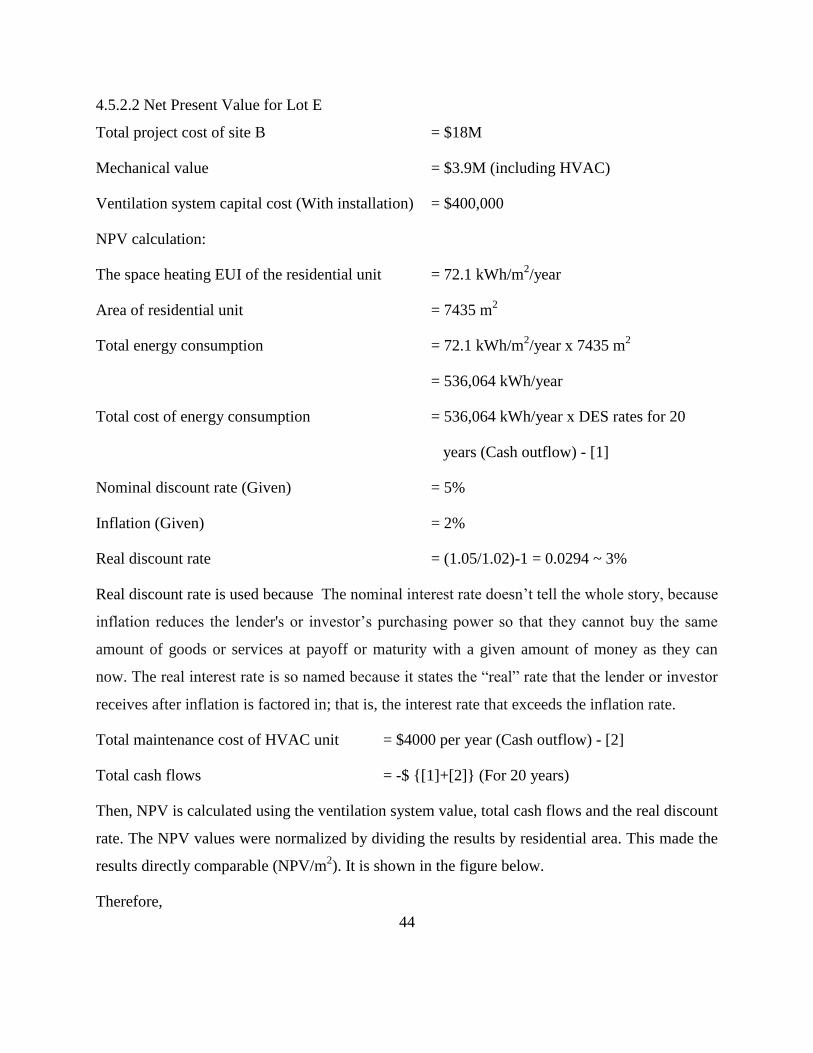
4.5.2.2 Net Present Value for Lot E
Total project cost of site B = $18M
Mechanical value = $3.9M (including HVAC)
Ventilation system capital cost (With installation) = $400,000
NPV calculation:
The space heating EUI of the residential unit = 72.1 kWh/m2/year
Area of residential unit = 7435 m2
Total energy consumption = 72.1 kWh/m2/year x 7435 m
2
= 536,064 kWh/year
Total cost of energy consumption = 536,064 kWh/year x DES rates for 20
years (Cash outflow) - [1]
Nominal discount rate (Given) = 5%
Inflation (Given) = 2%
Real discount rate = (1.05/1.02)-1 = 0.0294 ~ 3%
Real discount rate is used because The nominal interest rate doesn’t tell the whole story, because
inflation reduces the lender's or investor’s purchasing power so that they cannot buy the same
amount of goods or services at payoff or maturity with a given amount of money as they can
now. The real interest rate is so named because it states the “real” rate that the lender or investor
receives after inflation is factored in; that is, the interest rate that exceeds the inflation rate.
Total maintenance cost of HVAC unit = $4000 per year (Cash outflow) - [2]
Total cash flows = -$ {[1]+[2]} (For 20 years)
Then, NPV is calculated using the ventilation system value, total cash flows and the real discount
rate. The NPV values were normalized by dividing the results by residential area. This made the
results directly comparable (NPV/m2). It is shown in the figure below.
Therefore,
45
Net Present Value (NPV) = -$861,670.06
NPV/m2 = -$115.89/m
2
4.5.3 Life Cycle Cost Summary
Based on the NPV calculations Lot E provide a better NPV/m2 (-$115.89m
2) compared to Site B
(-$182.93 m2). A positive net present value indicates that the projected earnings generated by a
project or investment (in present dollars) exceeds the anticipated costs (also in present dollars).
Generally, an investment with a positive NPV will be a profitable one and one with a negative
NPV will result in a net loss. However, in the aforementioned projects both the NPV values are
negative. Therefore, the project with less negative NPV value is more viable in this case.
Changing the maintenance costs: Even if Site B's maintenance cost is brought down to Lot E's
maintenance cost the NPV/m2 value favours Lot E. However, the maintenance cost of Site B will
be higher than Lot E as Site B has HRV system and Lot E has passive ventilation.
Increasing the discount rates: It Changes the NPV rates positively, however slight changes in
discount rates makes no difference in the decision.
Alongwith NPV, payback period could be determined if the capital cost of ECMs were known.
Payback period determines the period of time required to recoup the funds expended in an
investment.
46
5. CONCLUSIONS
By doing this research, we have a few findings listed as below:
1. The criterion for natural ventilation systems in BC building code (2012) has more restricts
than mechanical ventilation systems.
2. Natural ventilation has higher air leakage rate which leads to greater energy consumption on
space heating.
3. To enhance energy efficiency, we can improve glazing and wall assemblies, control airflow
and air leakage. It is practical to vary make-up air temperature set-point and provide heating and
ventilation directly to each suite.
4. The minimalist structure of Lot E will likely save enough money to justify its air leakage and
lack of heat recovery.
5. Both the NPVs are negative. Lot E’s ventilation system has a lower capital cost and better
NPV/sq.m compared to Site B. Hence investment in Lot E is favorable.
47
BIBLIOGRAPHY
Government of British Columbia (2012). BC Building Code. Victoria, BC.
BC Housing (2015). Heat Recovery Ventilation Guide for Houses. Vancouver, BC.
BC Housing (2015). Heat Recovery Ventilation Guide for Multi-Unit Residential Buildings .
Vancouver,BC.
Stantec Inc. (2015). UBC Lot E Project REAP Gold Energy Study Report. Vancouver.
Williams Engineering Inc., (2015). Site B, University Boulevard, REAP Energy Modeling
Report. Vancouver.
RDH, E. B. (2012). Energy Consumption and Conservation in Mid- and High-Rise Residential
Buildings in British Columbia. Vancouver.
Worden, R. (2015). Site B University Boulevard - Site Plan. Vancouver.
Worden, R. (2015). UBC - LOT E South Campus- Key Plan, Site Plan, Mechenical Notes,
Legends, Drawing List. Vancouver.