Embed Size (px)
Citation preview
Energy-Optimal Control of RO DesalinationLarry Gao, Anditya Rahardianto, Han Gu, Panagiotis D. Christofides,* and Yoram Cohen*
Water Technology Research Center, Department of Chemical and Biomolecular Engineering, University of California, Los Angeles,California 90095-1592, United States
ABSTRACT: A novel model-based control system for the operation of a spiral-wound RO membrane desalination system wasdeveloped with a focus on maintaining energy-optimal operation. The control scheme utilized an operational model for spiral-wound RO desalting with a supervisory controller providing real-time updates of membrane permeability and the appropriatefeed pressure set-points for maintaining the target permeate productivity at the lowest feasible specific energy consumption.System RO feed pressure and flow rates were controlled by a lower-level RO controller through adjustment of the RO highpressure feed pump, variable frequency drive, and RO concentrate valve. Seawater desalination tests with an RO plant, capable ofpermeate productivity up to 18 000 gallons/day, demonstrated effective self-adaptive energy-optimal operation, subject to feedsalinity fluctuations, constraints imposed by the system’s physical limitations (i.e., minimum and maximum feasible operationalpressures and flow rates), and the thermodynamic restriction for cross-flow RO operation.
1. INTRODUCTION
Reverse osmosis (RO) desalination has emerged globally as aleading method for desalting seawater, inland brackish water,and water reuse applications.1 Since the birth of ROdesalination, RO energy consumption has been reduced viathe development of membranes of increased permeability,2−4
more efficient high pressure pumps,5 optimization ofmembrane module hydrodynamics,6−13 and the introductionof energy recovery devices (ERDs).14,15 ERDs have enabledefficient recovery of unutilized pressure energy from the ROconcentrate and have proven particularly effective for large-scale seawater RO plants.16−18 However, ERDs designed forsmall RO systems are of low efficiency, are of a relatively highcapital cost, and may introduce inflexibility in terms of systemcontrol.19 It is important to recognize that RO operation maybe confronted with temporal variability of feedwater quality, aswell as by various water production objectives.20,21 In thisregard, effective process control and optimization are importantfor small RO systems in order to lower the overall cost ofpermeate water production.21−24
RO plant control via classical control algorithms (i.e.,proportional−integral (PI) control) has been deployed tocontrol system pressure in order to meet permeate productionset-points.25 Multiloop control of both permeate flow rate andpermeate quality have also been proposed.26 In addition toclassical control, several nonlinear model-based controlstrategies have been developed to improve RO process controlunder conditions of varying feedwater quality and correctvarious faults that may occur during operation.27,28 Model-predictive control (MPC) and Lyapunov-based control havealso been designed and evaluated through computersimulations.28−32 More recently, an RO control strategy thatconsiders minimization of energy consumption has beenintroduced with the concept demonstrated in a small laboratoryRO system.33 The above study introduced the role of thethermodynamic restriction34 and specific energy consumption(SEC) in the optimization and control of cross-flow ROoperation.
A theoretical framework for minimization of RO permeateproduction cost was introduced recently,34−36 within thecontext of the SEC and thermodynamic restriction,34 thatconsidered the impact of water recovery, energy recovery andpumping efficiencies, feed and permeate flow rate constraints,membrane module topology,34−36 and optimization of feedpressure subject to feed salinity fluctuations.37 An energyoptimization nonlinear control algorithm (without theinclusion of an ERD) that builds on the above SEC modelingframework was also demonstrated with a small laboratoryspiral-wound RO system. It was shown, in limited proof-of-concept laboratory tests, that energy-optimal control for spiral-wound RO operation, subject to a simple step change in feedsalinity, was feasible through simultaneous control of feedpressure and feed flow rate.33 The above approach provided aframework for a controller architecture that can be deployed forRO operation that is confronted with temporal variability ofboth RO membrane permeability (e.g., due to membranefouling or aging) and feedwater salinity.In the present work, an approach for control of RO plant
operation is introduced, following the general scheme in ref 33,demonstrating the integration of lower-level and supervisorycontrollers. Implementation of the control algorithm onlyrequires operator input of the target permeate production (i.e.,RO permeate flow rate set-point). The control system thenautomatically considers constraints imposed by the requiredpermeate production, system operability (e.g., operationallimitation of system components), high pressure feed pumpand ERD efficiencies, membrane permeability changes, andtemporal variability of feed salinity. The proposed ROcontroller was field demonstrated for seawater desalinationwith respect to (a) maintaining pressure and flow rate (feed
Special Issue: John Congalidis Memorial
Received: July 19, 2013Revised: August 28, 2013Accepted: September 2, 2013Published: September 2, 2013
Article
pubs.acs.org/IECR
© 2013 American Chemical Society 7409 dx.doi.org/10.1021/ie402304d | Ind. Eng. Chem. Res. 2014, 53, 7409−7420
and permeate streams) set-points and (b) ensuring energy-optimal operation with temporally variable feed salinity.
2. EXPERIMENTAL SECTION
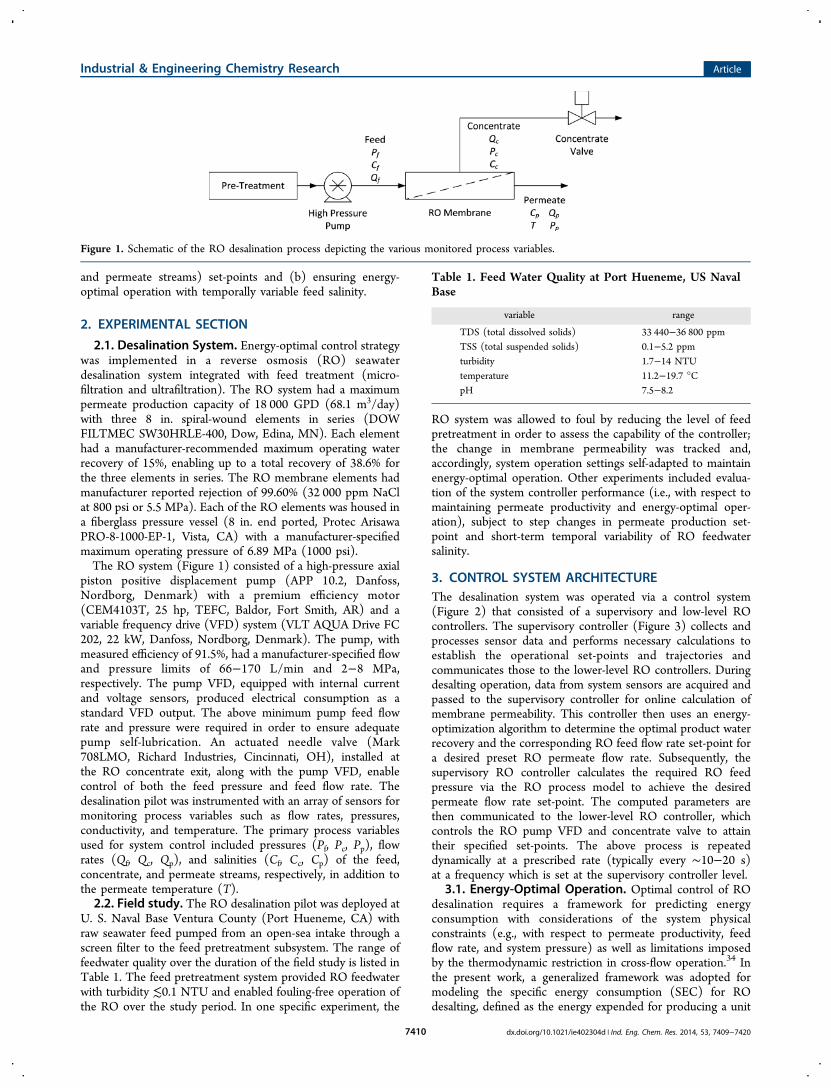
2.1. Desalination System. Energy-optimal control strategywas implemented in a reverse osmosis (RO) seawaterdesalination system integrated with feed treatment (micro-filtration and ultrafiltration). The RO system had a maximumpermeate production capacity of 18 000 GPD (68.1 m3/day)with three 8 in. spiral-wound elements in series (DOWFILTMEC SW30HRLE-400, Dow, Edina, MN). Each elementhad a manufacturer-recommended maximum operating waterrecovery of 15%, enabling up to a total recovery of 38.6% forthe three elements in series. The RO membrane elements hadmanufacturer reported rejection of 99.60% (32 000 ppm NaClat 800 psi or 5.5 MPa). Each of the RO elements was housed ina fiberglass pressure vessel (8 in. end ported, Protec ArisawaPRO-8-1000-EP-1, Vista, CA) with a manufacturer-specifiedmaximum operating pressure of 6.89 MPa (1000 psi).The RO system (Figure 1) consisted of a high-pressure axial
piston positive displacement pump (APP 10.2, Danfoss,Nordborg, Denmark) with a premium efficiency motor(CEM4103T, 25 hp, TEFC, Baldor, Fort Smith, AR) and avariable frequency drive (VFD) system (VLT AQUA Drive FC202, 22 kW, Danfoss, Nordborg, Denmark). The pump, withmeasured efficiency of 91.5%, had a manufacturer-specified flowand pressure limits of 66−170 L/min and 2−8 MPa,respectively. The pump VFD, equipped with internal currentand voltage sensors, produced electrical consumption as astandard VFD output. The above minimum pump feed flowrate and pressure were required in order to ensure adequatepump self-lubrication. An actuated needle valve (Mark708LMO, Richard Industries, Cincinnati, OH), installed atthe RO concentrate exit, along with the pump VFD, enablecontrol of both the feed pressure and feed flow rate. Thedesalination pilot was instrumented with an array of sensors formonitoring process variables such as flow rates, pressures,conductivity, and temperature. The primary process variablesused for system control included pressures (Pf, Pc, Pp), flowrates (Qf, Qc, Qp), and salinities (Cf, Cc, Cp) of the feed,concentrate, and permeate streams, respectively, in addition tothe permeate temperature (T).2.2. Field study. The RO desalination pilot was deployed at
U. S. Naval Base Ventura County (Port Hueneme, CA) withraw seawater feed pumped from an open-sea intake through ascreen filter to the feed pretreatment subsystem. The range offeedwater quality over the duration of the field study is listed inTable 1. The feed pretreatment system provided RO feedwaterwith turbidity ≲0.1 NTU and enabled fouling-free operation ofthe RO over the study period. In one specific experiment, the
RO system was allowed to foul by reducing the level of feedpretreatment in order to assess the capability of the controller;the change in membrane permeability was tracked and,accordingly, system operation settings self-adapted to maintainenergy-optimal operation. Other experiments included evalua-tion of the system controller performance (i.e., with respect tomaintaining permeate productivity and energy-optimal oper-ation), subject to step changes in permeate production set-point and short-term temporal variability of RO feedwatersalinity.
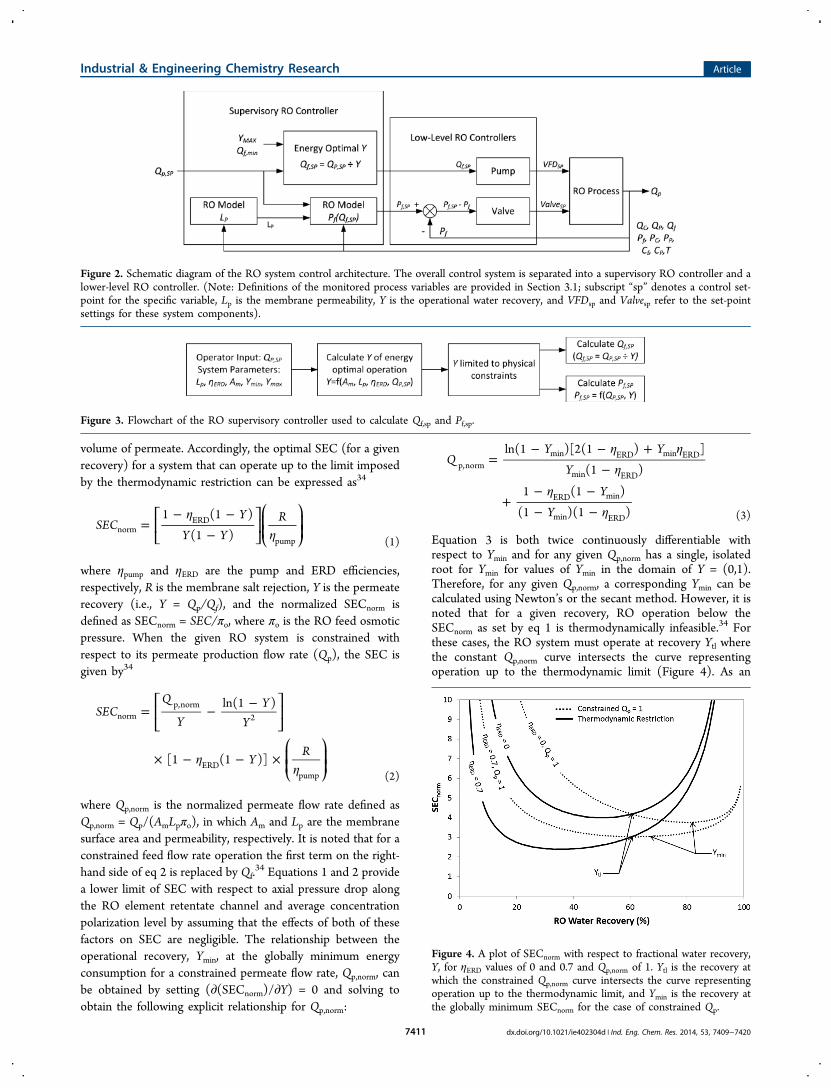
3. CONTROL SYSTEM ARCHITECTUREThe desalination system was operated via a control system(Figure 2) that consisted of a supervisory and low-level ROcontrollers. The supervisory controller (Figure 3) collects andprocesses sensor data and performs necessary calculations toestablish the operational set-points and trajectories andcommunicates those to the lower-level RO controllers. Duringdesalting operation, data from system sensors are acquired andpassed to the supervisory controller for online calculation ofmembrane permeability. This controller then uses an energy-optimization algorithm to determine the optimal product waterrecovery and the corresponding RO feed flow rate set-point fora desired preset RO permeate flow rate. Subsequently, thesupervisory RO controller calculates the required RO feedpressure via the RO process model to achieve the desiredpermeate flow rate set-point. The computed parameters arethen communicated to the lower-level RO controller, whichcontrols the RO pump VFD and concentrate valve to attaintheir specified set-points. The above process is repeateddynamically at a prescribed rate (typically every ∼10−20 s)at a frequency which is set at the supervisory controller level.
3.1. Energy-Optimal Operation. Optimal control of ROdesalination requires a framework for predicting energyconsumption with considerations of the system physicalconstraints (e.g., with respect to permeate productivity, feedflow rate, and system pressure) as well as limitations imposedby the thermodynamic restriction in cross-flow operation.34 Inthe present work, a generalized framework was adopted formodeling the specific energy consumption (SEC) for ROdesalting, defined as the energy expended for producing a unit
Figure 1. Schematic of the RO desalination process depicting the various monitored process variables.
Table 1. Feed Water Quality at Port Hueneme, US NavalBase
variable range
TDS (total dissolved solids) 33 440−36 800 ppmTSS (total suspended solids) 0.1−5.2 ppmturbidity 1.7−14 NTUtemperature 11.2−19.7 °CpH 7.5−8.2
Industrial & Engineering Chemistry Research Article
dx.doi.org/10.1021/ie402304d | Ind. Eng. Chem. Res. 2014, 53, 7409−74207410
volume of permeate. Accordingly, the optimal SEC (for a givenrecovery) for a system that can operate up to the limit imposedby the thermodynamic restriction can be expressed as34
ηη
=− −
−
⎡⎣⎢
⎤⎦⎥⎛⎝⎜⎜
⎞⎠⎟⎟SEC
Y
Y YR1 (1 )
(1 )normERD
pump (1)
where ηpump and ηERD are the pump and ERD efficiencies,respectively, R is the membrane salt rejection, Y is the permeaterecovery (i.e., Y = Qp/Qf), and the normalized SECnorm isdefined as SECnorm = SEC/πo, where πo is the RO feed osmoticpressure. When the given RO system is constrained withrespect to its permeate production flow rate (Qp), the SEC isgiven by34
ηη
= − −
× − − ×
⎡⎣⎢
⎤⎦⎥
⎛⎝⎜⎜
⎞⎠⎟⎟
SECQ
YY
Y
YR
ln(1 )
[1 (1 )]
normp,norm
2
ERDpump (2)
where Qp,norm is the normalized permeate flow rate defined asQp,norm = Qp/(AmLpπo), in which Am and Lp are the membranesurface area and permeability, respectively. It is noted that for aconstrained feed flow rate operation the first term on the right-hand side of eq 2 is replaced by Qf.
34 Equations 1 and 2 providea lower limit of SEC with respect to axial pressure drop alongthe RO element retentate channel and average concentrationpolarization level by assuming that the effects of both of thesefactors on SEC are negligible. The relationship between theoperational recovery, Ymin, at the globally minimum energyconsumption for a constrained permeate flow rate, Qp,norm, canbe obtained by setting (∂(SECnorm)/∂Y) = 0 and solving toobtain the following explicit relationship for Qp,norm:
η ηη
ηη
=− − +
−
+− −− −
QY Y
Y
Y
Y
ln(1 )[2(1 ) ]
(1 )
1 (1 )
(1 )(1 )
p,normmin ERD min ERD
min ERD
ERD min
min ERD (3)
Equation 3 is both twice continuously differentiable withrespect to Ymin and for any given Qp,norm has a single, isolatedroot for Ymin for values of Ymin in the domain of Y = (0,1).Therefore, for any given Qp,norm, a corresponding Ymin can becalculated using Newton’s or the secant method. However, it isnoted that for a given recovery, RO operation below theSECnorm as set by eq 1 is thermodynamically infeasible.34 Forthese cases, the RO system must operate at recovery Ytl wherethe constant Qp,norm curve intersects the curve representingoperation up to the thermodynamic limit (Figure 4). As an
Figure 2. Schematic diagram of the RO system control architecture. The overall control system is separated into a supervisory RO controller and alower-level RO controller. (Note: Definitions of the monitored process variables are provided in Section 3.1; subscript “sp” denotes a control set-point for the specific variable, Lp is the membrane permeability, Y is the operational water recovery, and VFDsp and Valvesp refer to the set-pointsettings for these system components).
Figure 3. Flowchart of the RO supervisory controller used to calculate Qf,sp and Pf,sp.
Figure 4. A plot of SECnorm with respect to fractional water recovery,Y, for ηERD values of 0 and 0.7 and Qp,norm of 1. Ytl is the recovery atwhich the constrained Qp,norm curve intersects the curve representingoperation up to the thermodynamic limit, and Ymin is the recovery atthe globally minimum SECnorm for the case of constrained Qp.
Industrial & Engineering Chemistry Research Article
dx.doi.org/10.1021/ie402304d | Ind. Eng. Chem. Res. 2014, 53, 7409−74207411
example, the functional dependencies of SECnorm on recoveryfor different values of ηERD for operation up to thethermodynamic limit and for cases of constrained permeateflow rate are illustrated in Figure 4 for the case of ηpump = 1, R =1, and Qp,norm = 1.In order to simplify the control algorithm, it is convenient to
first identify if Ymin would be located above or below the curverepresenting operation up to the thermodynamic limit (e.g.,solid curves in Figure 4). The above can be achieved by notingthat Ytl, or the point at which the constant Qp,norm curveintersects with the curve representing operation up to thethermodynamic limit, can be determined by equating eq 1 andeq 2, resulting in
=−
+−
QY
YY
1(1 )
ln(1 )p,norm
tl
tl
tl (4)
The right-hand side of eq 4 is a strictly increasing function of Ytlover the domain Y = (0,1) with a unique value of Ytl for eachQp,norm. It is also noted that as Y→0, SECnorm for operation withconstrained Qp (eq 2) is greater than SECnorm for operation upto the thermodynamic limit (eq 1); That is,
η
η
− − − −
>− −
−
⎡⎣⎢
⎤⎦⎥
Q
YY
YY
Y
Y Y
ln(1 )[1 (1 )]
1 (1 )
(1 )
p,norm2 ERD
ERD
(5)
The above inequality can be proven by multiplying it by Y andsetting 1 − Y ≈ 1 for the case of Y→0, which implies thatQp,norm > 0. Thus, the inequality holds as Y→0 for all validvalues of Qp,norm, which are by definition greater than zero.Because eq 1 and eq 2 have one unique intersection, inequalityeq 5 holds true for all values of Y from 0 up to Ytl. This impliesthat in the region of Y = (0, Ytl], the globally minimum SEC fora constrained Qp operation exists above the SEC for operationup to the thermodynamic limit. However, for the region of Y =[Ytl,1), the globally minimum SEC for a constrained Qp processexists below the SEC for RO desalting operation up to thethermodynamic limit and, hence, is infeasible. Therefore, theabove analysis concludes that if Ymin < Ytl, then Ymin will be theSEC-optimal operating recovery and if Ymin > Ytl, then Ytl will bethe SEC-optimal operating recovery.3.2. Physical System Constraints. RO desalination plants
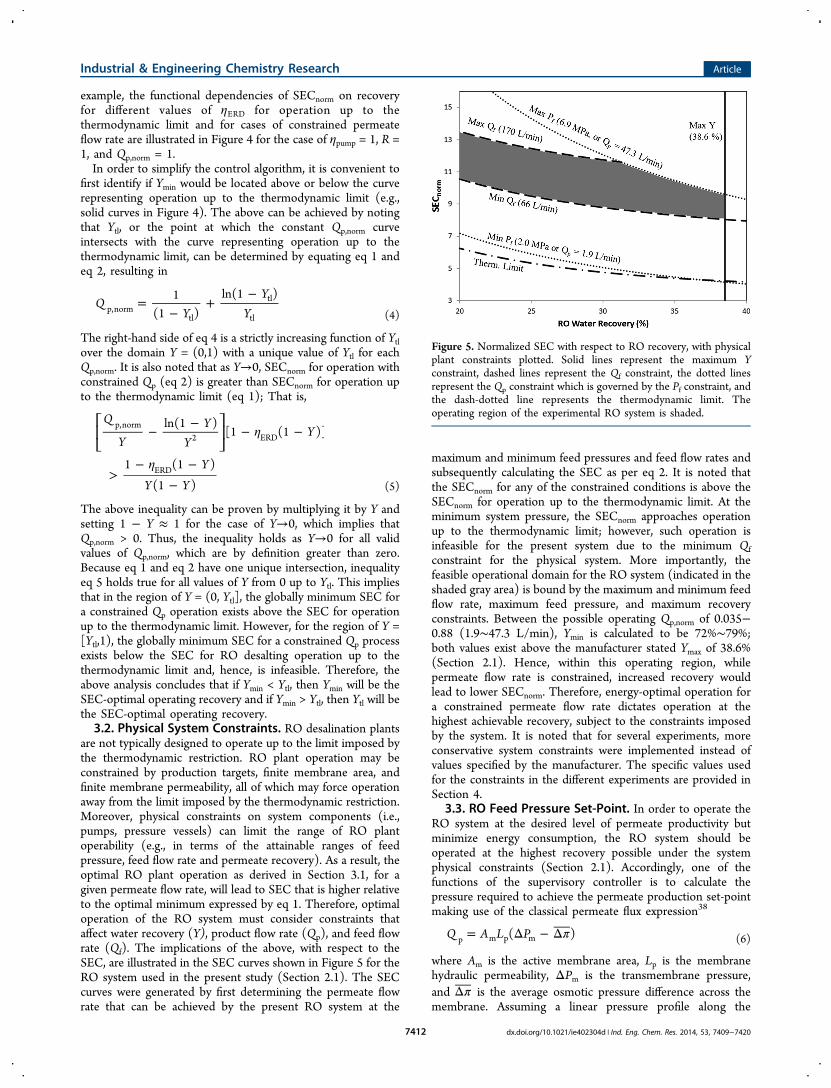
are not typically designed to operate up to the limit imposed bythe thermodynamic restriction. RO plant operation may beconstrained by production targets, finite membrane area, andfinite membrane permeability, all of which may force operationaway from the limit imposed by the thermodynamic restriction.Moreover, physical constraints on system components (i.e.,pumps, pressure vessels) can limit the range of RO plantoperability (e.g., in terms of the attainable ranges of feedpressure, feed flow rate and permeate recovery). As a result, theoptimal RO plant operation as derived in Section 3.1, for agiven permeate flow rate, will lead to SEC that is higher relativeto the optimal minimum expressed by eq 1. Therefore, optimaloperation of the RO system must consider constraints thataffect water recovery (Y), product flow rate (Qp), and feed flowrate (Qf). The implications of the above, with respect to theSEC, are illustrated in the SEC curves shown in Figure 5 for theRO system used in the present study (Section 2.1). The SECcurves were generated by first determining the permeate flowrate that can be achieved by the present RO system at the
maximum and minimum feed pressures and feed flow rates andsubsequently calculating the SEC as per eq 2. It is noted thatthe SECnorm for any of the constrained conditions is above theSECnorm for operation up to the thermodynamic limit. At theminimum system pressure, the SECnorm approaches operationup to the thermodynamic limit; however, such operation isinfeasible for the present system due to the minimum Qfconstraint for the physical system. More importantly, thefeasible operational domain for the RO system (indicated in theshaded gray area) is bound by the maximum and minimum feedflow rate, maximum feed pressure, and maximum recoveryconstraints. Between the possible operating Qp,norm of 0.035−0.88 (1.9∼47.3 L/min), Ymin is calculated to be 72%∼79%;both values exist above the manufacturer stated Ymax of 38.6%(Section 2.1). Hence, within this operating region, whilepermeate flow rate is constrained, increased recovery wouldlead to lower SECnorm. Therefore, energy-optimal operation fora constrained permeate flow rate dictates operation at thehighest achievable recovery, subject to the constraints imposedby the system. It is noted that for several experiments, moreconservative system constraints were implemented instead ofvalues specified by the manufacturer. The specific values usedfor the constraints in the different experiments are provided inSection 4.
3.3. RO Feed Pressure Set-Point. In order to operate theRO system at the desired level of permeate productivity butminimize energy consumption, the RO system should beoperated at the highest recovery possible under the systemphysical constraints (Section 2.1). Accordingly, one of thefunctions of the supervisory controller is to calculate thepressure required to achieve the permeate production set-pointmaking use of the classical permeate flux expression38
π= Δ − ΔQ A L P( )p m p m (6)
where Am is the active membrane area, Lp is the membranehydraulic permeability, ΔPm is the transmembrane pressure,and πΔ is the average osmotic pressure difference across themembrane. Assuming a linear pressure profile along the
Figure 5. Normalized SEC with respect to RO recovery, with physicalplant constraints plotted. Solid lines represent the maximum Yconstraint, dashed lines represent the Qf constraint, the dotted linesrepresent the Qp constraint which is governed by the Pf constraint, andthe dash-dotted line represents the thermodynamic limit. Theoperating region of the experimental RO system is shaded.
Industrial & Engineering Chemistry Research Article
dx.doi.org/10.1021/ie402304d | Ind. Eng. Chem. Res. 2014, 53, 7409−74207412
retentate channel of the RO elements,20 the average trans-membrane pressure can be expressed as
Δ =+
−PP P
P2m
f cp (7)
where P̅p is the average permeate-side pressure, Pf is the feedpressure, and Pc is the concentrate pressure at the module exit.The first term on the right-hand side of eq 7 represents theaverage feed-side pressure. The average feed-side osmoticpressure difference is as follows:39
π π πΔ = − − −YY
CP Rln(1 )
(1 )o o (8)
where πo is the feed osmotic pressure, CP is the averageconcentration polarization modulus in each RO membraneelement (i.e.,CP = Cm/Cb, where Cb and Cm are the average saltconcentrations in the bulk and at the membrane surface,respectively), and R is the observed salt rejection defined as
= −RC
C1 p
f (9)
where Cp and Cf are permeate and feed concentrations,respectively. The feed osmotic pressure can be estimated by:39
π ϕ= · · +C T(273.15 )o f (10)
in which feed concentration (Cf), the osmotic pressurecoefficient (ϕ), and temperature (T) are used as a temperaturecorrection factor. The average concentration polarizationapplicable to the membrane elements used in the presentwork (Section 2.1) was estimated as39
= − −CP Yexp(0.7[1 (1 ) ])n1/(11)
in which n is the number of RO membrane elements in series(n = 3 for the present system). Combining eqs 6−8 results inthe following equation for the permeate flow rate:
π
π
=+
− − −
+ −
⎡⎣⎢
⎤⎦⎥
Q A LP P
PY
YCP
R
2ln(1 )
(1 )
p m pf c
p o
o(12)
from which the membrane permeability, Lp, can be initiallydetermined as the system ramps up its operation, givenmeasured values of Qp and Pf. Subsequently, the permeateproduction set-point and the calculated permeability are usedto calculate the required RO feed pressure Pf. The membranepermeability is calculated and updated dynamically as neededfor the calculation of the required feed pressure.3.4. Lower-Level RO Controller. The supervisory RO
controller provides the lower-level RO controller (Figure 2)with the necessary feed pressure and flow rate set-points. Thelower-level controller consists of a linear model for the ROpump VFD and a PI controller for the concentrate valve. Thelower-level controllers do not enforce decoupling of the twocontrol loops in the closed-loop system; that is, a change in theRO pump VFD setting may affect the RO feed pressureregulated by the RO concentrate valve feedback controller. Inthis regard, it is stressed that the required feed pressure set-point for optimal operation is determined via a process model(eq 12). However, at the same time, it is important to constrainthe VFD ramp speed in order to partially decouple the
dynamics of the two control loops and allow the valvecontroller to provide responsive control on pressure even whenthe feed flow rate is changing. Although the determination ofthese time constants of the two control loops can be done apriori on the basis of a process model, in the present work, steptests were used to determine these time constants and thepresent system’s 5 rpm/s VFD ramp speed constraint. It isnoted that multivariable control design could be used toprovide an integrated approach to control action calculation forboth inputs. However, given the significantly different timeconstants of the two control loops when the VFD ramp speedis constrained, such an approach is not expected to substantiallyimprove the achievable closed-loop performance. At the sametime, coupling of the controllers would considerably increasethe burden of controller maintenance and decrease therobustness of the overall control architecture.For the present RO pump/VFD combination (Section 2.1),
the linear relationship between the pump RPM (VFDspRO) and
feed flow rate (Qfdesired) was determined experimentally as
= −⎛⎝⎜
⎞⎠⎟QVFD 11.38
RPML/min
29.009RPMSPRO
fdesired
(13)
The Qf set-point is calculated using the energy-optimal Ydetermined in Sections 3.1, 3.2 and the Qp set-point as specifiedby the desired permeate productivity. Given this Qf set-point asprovided by the supervisory controller, eq 13 is then used todetermine the required RO VFD setting.Adjustment of the applied feed pressure is most sensitive to
the RO concentrate valve position (Valvesp) which wascontrolled by a PI controller of the following form:
∫τ
τ τ
= −
+ −
K P P t
KP P d
Valve ( ( ))
( ( ))
SP
i
t
p1
RO,feedSP
RO,feed
p1
1 0RO,feedSP
RO,feed(14)
in which Valvesp is the control action applied to the RO valve,PRO,feedSP is the pressure set-point for the RO feed pressure, Kp
1 isthe proportional gain, and τi
1 is the integral time constant.Initial experiments carried out over a range of operationalparameters enabled tuning of the PI controller parameters totheir optimal values of Kp
1 = −0.0725 (Valve %/MPa) and (Kp1/
τi1) = 0.001 s.Due to feed pressure fluctuations caused by the pump (e.g.,
±70 KPa in amplitude, or 8% of the feed pressure), tightercontrol of the pressure cannot be achieved once the set-pointtracking error (i.e., absolute difference between the pressureand its set-point) becomes very small (as defined by an upperbound on the error which was set at 70 KPa). Therefore, theuse of the PI controller when the tracking error becomessmaller than the upper error bound is counterproductive andwould increase sensitivity of the closed-loop system todisturbances due to pump operation. Therefore, in the presentcontrol scheme, the PI controller was intermittently deactivatedwhen the difference between the set-point and the pressure wasbelow the upper bound pressure error threshold such that
Industrial & Engineering Chemistry Research Article
dx.doi.org/10.1021/ie402304d | Ind. Eng. Chem. Res. 2014, 53, 7409−74207413
τ
τ
| − | >
= − =
| − | <
= =
K
K
If P P (t) 70 kPa
then K 0.0725Valve%
MPaand 0.001 s
If P P (t) 70 kPa
then K 0Valve%
MPaand 0 s
RO,feedSP
RO,feed
p1 p
1
i1
RO,feedSP
RO,feed
p1 p
1
i1
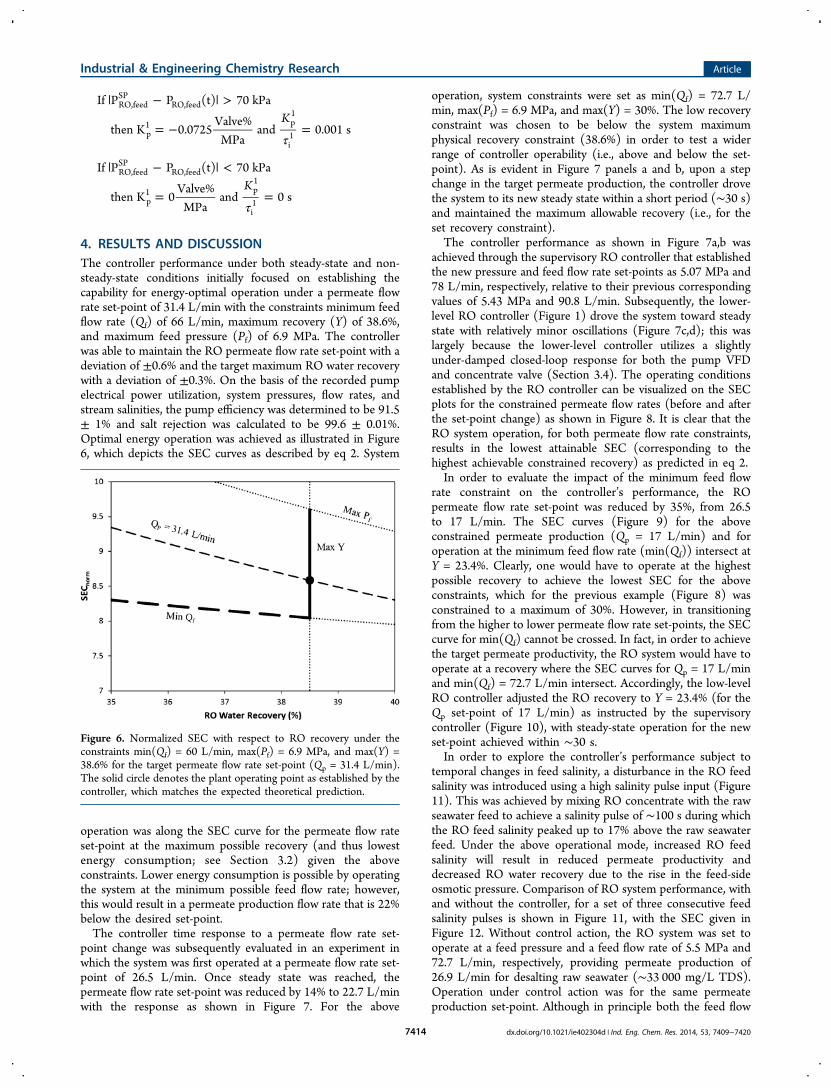
4. RESULTS AND DISCUSSIONThe controller performance under both steady-state and non-steady-state conditions initially focused on establishing thecapability for energy-optimal operation under a permeate flowrate set-point of 31.4 L/min with the constraints minimum feedflow rate (Qf) of 66 L/min, maximum recovery (Y) of 38.6%,and maximum feed pressure (Pf) of 6.9 MPa. The controllerwas able to maintain the RO permeate flow rate set-point with adeviation of ±0.6% and the target maximum RO water recoverywith a deviation of ±0.3%. On the basis of the recorded pumpelectrical power utilization, system pressures, flow rates, andstream salinities, the pump efficiency was determined to be 91.5± 1% and salt rejection was calculated to be 99.6 ± 0.01%.Optimal energy operation was achieved as illustrated in Figure6, which depicts the SEC curves as described by eq 2. System
operation was along the SEC curve for the permeate flow rateset-point at the maximum possible recovery (and thus lowestenergy consumption; see Section 3.2) given the aboveconstraints. Lower energy consumption is possible by operatingthe system at the minimum possible feed flow rate; however,this would result in a permeate production flow rate that is 22%below the desired set-point.The controller time response to a permeate flow rate set-
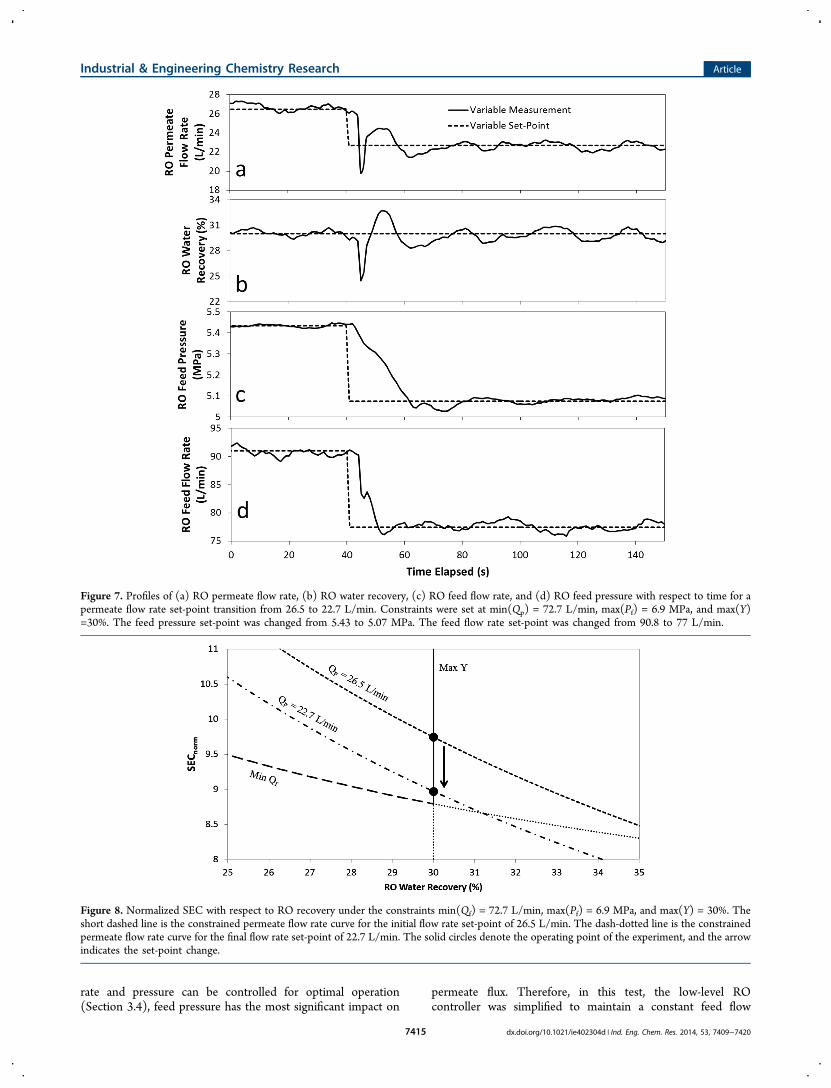
point change was subsequently evaluated in an experiment inwhich the system was first operated at a permeate flow rate set-point of 26.5 L/min. Once steady state was reached, thepermeate flow rate set-point was reduced by 14% to 22.7 L/minwith the response as shown in Figure 7. For the above
operation, system constraints were set as min(Qf) = 72.7 L/min, max(Pf) = 6.9 MPa, and max(Y) = 30%. The low recoveryconstraint was chosen to be below the system maximumphysical recovery constraint (38.6%) in order to test a widerrange of controller operability (i.e., above and below the set-point). As is evident in Figure 7 panels a and b, upon a stepchange in the target permeate production, the controller drovethe system to its new steady state within a short period (∼30 s)and maintained the maximum allowable recovery (i.e., for theset recovery constraint).The controller performance as shown in Figure 7a,b was
achieved through the supervisory RO controller that establishedthe new pressure and feed flow rate set-points as 5.07 MPa and78 L/min, respectively, relative to their previous correspondingvalues of 5.43 MPa and 90.8 L/min. Subsequently, the lower-level RO controller (Figure 1) drove the system toward steadystate with relatively minor oscillations (Figure 7c,d); this waslargely because the lower-level controller utilizes a slightlyunder-damped closed-loop response for both the pump VFDand concentrate valve (Section 3.4). The operating conditionsestablished by the RO controller can be visualized on the SECplots for the constrained permeate flow rates (before and afterthe set-point change) as shown in Figure 8. It is clear that theRO system operation, for both permeate flow rate constraints,results in the lowest attainable SEC (corresponding to thehighest achievable constrained recovery) as predicted in eq 2.In order to evaluate the impact of the minimum feed flow
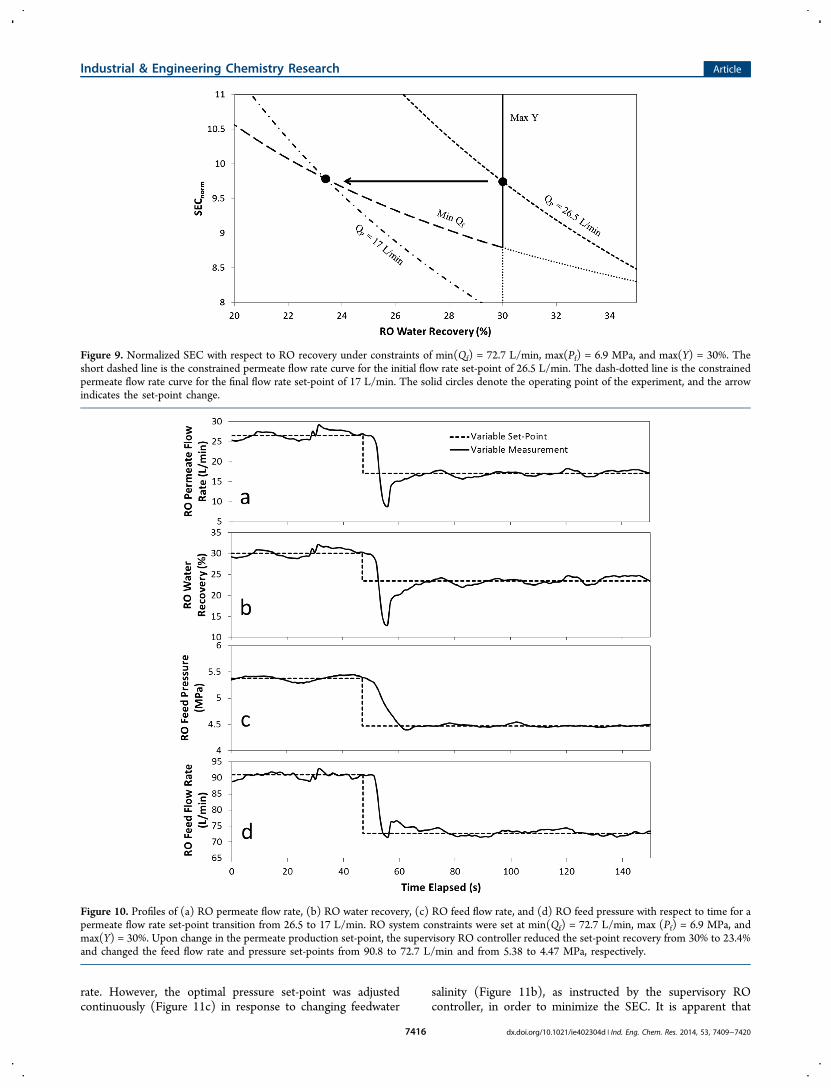
rate constraint on the controller’s performance, the ROpermeate flow rate set-point was reduced by 35%, from 26.5to 17 L/min. The SEC curves (Figure 9) for the aboveconstrained permeate production (Qp = 17 L/min) and foroperation at the minimum feed flow rate (min(Qf)) intersect atY = 23.4%. Clearly, one would have to operate at the highestpossible recovery to achieve the lowest SEC for the aboveconstraints, which for the previous example (Figure 8) wasconstrained to a maximum of 30%. However, in transitioningfrom the higher to lower permeate flow rate set-points, the SECcurve for min(Qf) cannot be crossed. In fact, in order to achievethe target permeate productivity, the RO system would have tooperate at a recovery where the SEC curves for Qp = 17 L/minand min(Qf) = 72.7 L/min intersect. Accordingly, the low-levelRO controller adjusted the RO recovery to Y = 23.4% (for theQp set-point of 17 L/min) as instructed by the supervisorycontroller (Figure 10), with steady-state operation for the newset-point achieved within ∼30 s.In order to explore the controller’s performance subject to
temporal changes in feed salinity, a disturbance in the RO feedsalinity was introduced using a high salinity pulse input (Figure11). This was achieved by mixing RO concentrate with the rawseawater feed to achieve a salinity pulse of ∼100 s during whichthe RO feed salinity peaked up to 17% above the raw seawaterfeed. Under the above operational mode, increased RO feedsalinity will result in reduced permeate productivity anddecreased RO water recovery due to the rise in the feed-sideosmotic pressure. Comparison of RO system performance, withand without the controller, for a set of three consecutive feedsalinity pulses is shown in Figure 11, with the SEC given inFigure 12. Without control action, the RO system was set tooperate at a feed pressure and a feed flow rate of 5.5 MPa and72.7 L/min, respectively, providing permeate production of26.9 L/min for desalting raw seawater (∼33 000 mg/L TDS).Operation under control action was for the same permeateproduction set-point. Although in principle both the feed flow
Figure 6. Normalized SEC with respect to RO recovery under theconstraints min(Qf) = 60 L/min, max(Pf) = 6.9 MPa, and max(Y) =38.6% for the target permeate flow rate set-point (Qp = 31.4 L/min).The solid circle denotes the plant operating point as established by thecontroller, which matches the expected theoretical prediction.
Industrial & Engineering Chemistry Research Article
dx.doi.org/10.1021/ie402304d | Ind. Eng. Chem. Res. 2014, 53, 7409−74207414
rate and pressure can be controlled for optimal operation(Section 3.4), feed pressure has the most significant impact on
permeate flux. Therefore, in this test, the low-level ROcontroller was simplified to maintain a constant feed flow
Figure 7. Profiles of (a) RO permeate flow rate, (b) RO water recovery, (c) RO feed flow rate, and (d) RO feed pressure with respect to time for apermeate flow rate set-point transition from 26.5 to 22.7 L/min. Constraints were set at min(Qp) = 72.7 L/min, max(Pf) = 6.9 MPa, and max(Y)=30%. The feed pressure set-point was changed from 5.43 to 5.07 MPa. The feed flow rate set-point was changed from 90.8 to 77 L/min.
Figure 8. Normalized SEC with respect to RO recovery under the constraints min(Qf) = 72.7 L/min, max(Pf) = 6.9 MPa, and max(Y) = 30%. Theshort dashed line is the constrained permeate flow rate curve for the initial flow rate set-point of 26.5 L/min. The dash-dotted line is the constrainedpermeate flow rate curve for the final flow rate set-point of 22.7 L/min. The solid circles denote the operating point of the experiment, and the arrowindicates the set-point change.
Industrial & Engineering Chemistry Research Article
dx.doi.org/10.1021/ie402304d | Ind. Eng. Chem. Res. 2014, 53, 7409−74207415
rate. However, the optimal pressure set-point was adjustedcontinuously (Figure 11c) in response to changing feedwater
salinity (Figure 11b), as instructed by the supervisory ROcontroller, in order to minimize the SEC. It is apparent that
Figure 9. Normalized SEC with respect to RO recovery under constraints of min(Qf) = 72.7 L/min, max(Pf) = 6.9 MPa, and max(Y) = 30%. Theshort dashed line is the constrained permeate flow rate curve for the initial flow rate set-point of 26.5 L/min. The dash-dotted line is the constrainedpermeate flow rate curve for the final flow rate set-point of 17 L/min. The solid circles denote the operating point of the experiment, and the arrowindicates the set-point change.
Figure 10. Profiles of (a) RO permeate flow rate, (b) RO water recovery, (c) RO feed flow rate, and (d) RO feed pressure with respect to time for apermeate flow rate set-point transition from 26.5 to 17 L/min. RO system constraints were set at min(Qf) = 72.7 L/min, max (Pf) = 6.9 MPa, andmax(Y) = 30%. Upon change in the permeate production set-point, the supervisory RO controller reduced the set-point recovery from 30% to 23.4%and changed the feed flow rate and pressure set-points from 90.8 to 72.7 L/min and from 5.38 to 4.47 MPa, respectively.
Industrial & Engineering Chemistry Research Article
dx.doi.org/10.1021/ie402304d | Ind. Eng. Chem. Res. 2014, 53, 7409−74207416
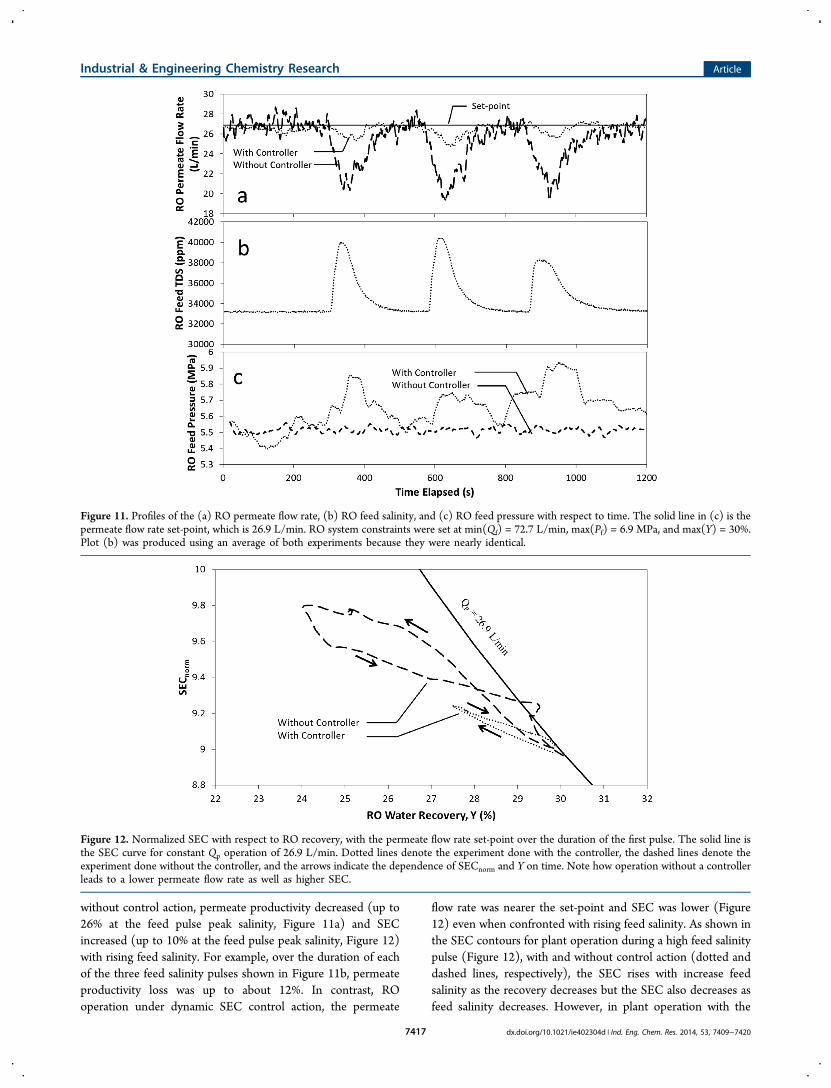
without control action, permeate productivity decreased (up to26% at the feed pulse peak salinity, Figure 11a) and SECincreased (up to 10% at the feed pulse peak salinity, Figure 12)with rising feed salinity. For example, over the duration of eachof the three feed salinity pulses shown in Figure 11b, permeateproductivity loss was up to about 12%. In contrast, ROoperation under dynamic SEC control action, the permeate
flow rate was nearer the set-point and SEC was lower (Figure12) even when confronted with rising feed salinity. As shown inthe SEC contours for plant operation during a high feed salinitypulse (Figure 12), with and without control action (dotted anddashed lines, respectively), the SEC rises with increase feedsalinity as the recovery decreases but the SEC also decreases asfeed salinity decreases. However, in plant operation with the
Figure 11. Profiles of the (a) RO permeate flow rate, (b) RO feed salinity, and (c) RO feed pressure with respect to time. The solid line in (c) is thepermeate flow rate set-point, which is 26.9 L/min. RO system constraints were set at min(Qf) = 72.7 L/min, max(Pf) = 6.9 MPa, and max(Y) = 30%.Plot (b) was produced using an average of both experiments because they were nearly identical.
Figure 12. Normalized SEC with respect to RO recovery, with the permeate flow rate set-point over the duration of the first pulse. The solid line isthe SEC curve for constant Qp operation of 26.9 L/min. Dotted lines denote the experiment done with the controller, the dashed lines denote theexperiment done without the controller, and the arrows indicate the dependence of SECnorm and Y on time. Note how operation without a controllerleads to a lower permeate flow rate as well as higher SEC.
Industrial & Engineering Chemistry Research Article
dx.doi.org/10.1021/ie402304d | Ind. Eng. Chem. Res. 2014, 53, 7409−74207417
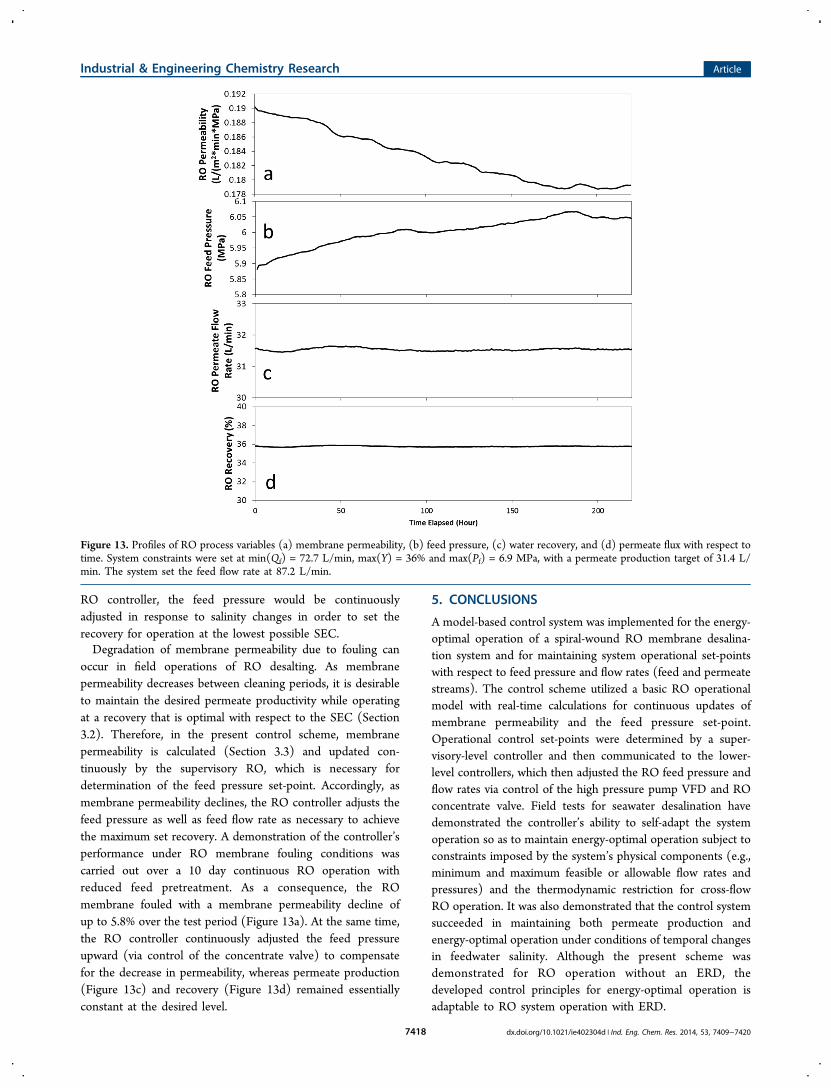
RO controller, the feed pressure would be continuouslyadjusted in response to salinity changes in order to set therecovery for operation at the lowest possible SEC.Degradation of membrane permeability due to fouling can
occur in field operations of RO desalting. As membranepermeability decreases between cleaning periods, it is desirableto maintain the desired permeate productivity while operatingat a recovery that is optimal with respect to the SEC (Section3.2). Therefore, in the present control scheme, membranepermeability is calculated (Section 3.3) and updated con-tinuously by the supervisory RO, which is necessary fordetermination of the feed pressure set-point. Accordingly, asmembrane permeability declines, the RO controller adjusts thefeed pressure as well as feed flow rate as necessary to achievethe maximum set recovery. A demonstration of the controller’sperformance under RO membrane fouling conditions wascarried out over a 10 day continuous RO operation withreduced feed pretreatment. As a consequence, the ROmembrane fouled with a membrane permeability decline ofup to 5.8% over the test period (Figure 13a). At the same time,the RO controller continuously adjusted the feed pressureupward (via control of the concentrate valve) to compensatefor the decrease in permeability, whereas permeate production(Figure 13c) and recovery (Figure 13d) remained essentiallyconstant at the desired level.
5. CONCLUSIONS
A model-based control system was implemented for the energy-optimal operation of a spiral-wound RO membrane desalina-tion system and for maintaining system operational set-pointswith respect to feed pressure and flow rates (feed and permeatestreams). The control scheme utilized a basic RO operationalmodel with real-time calculations for continuous updates ofmembrane permeability and the feed pressure set-point.Operational control set-points were determined by a super-visory-level controller and then communicated to the lower-level controllers, which then adjusted the RO feed pressure andflow rates via control of the high pressure pump VFD and ROconcentrate valve. Field tests for seawater desalination havedemonstrated the controller’s ability to self-adapt the systemoperation so as to maintain energy-optimal operation subject toconstraints imposed by the system’s physical components (e.g.,minimum and maximum feasible or allowable flow rates andpressures) and the thermodynamic restriction for cross-flowRO operation. It was also demonstrated that the control systemsucceeded in maintaining both permeate production andenergy-optimal operation under conditions of temporal changesin feedwater salinity. Although the present scheme wasdemonstrated for RO operation without an ERD, thedeveloped control principles for energy-optimal operation isadaptable to RO system operation with ERD.
Figure 13. Profiles of RO process variables (a) membrane permeability, (b) feed pressure, (c) water recovery, and (d) permeate flux with respect totime. System constraints were set at min(Qf) = 72.7 L/min, max(Y) = 36% and max(Pf) = 6.9 MPa, with a permeate production target of 31.4 L/min. The system set the feed flow rate at 87.2 L/min.
Industrial & Engineering Chemistry Research Article
dx.doi.org/10.1021/ie402304d | Ind. Eng. Chem. Res. 2014, 53, 7409−74207418
■ AUTHOR INFORMATION
Corresponding Authors*P. D. Christofides. Phone: +1 (310) 794-1015. E-mail: [email protected].*Y. Cohen. Phone: +1 (310) 825-8766. E-mail: [email protected].
NotesThe authors declare no competing financial interest.
■ ACKNOWLEDGMENTS
This work was funded in part by the United States Office ofNaval Research, the California Department of Water Resources,U.S. Bureau of Reclamation, and the UCLA Water TechnologyResearch Center. The authors acknowledge the contributionsof Dr. Richard Zhu on the initial design of the control systemand of Dr. Alex Bartman on the software implementation of thecontrol system. The assistance of John Thompson in theconstruction of the pilot system is also acknowledged. Theauthors also acknowledge support by Danfoss Sea Recovery(Henrik Wendelboe and Christopher Okada), Inge GmbH(Peter Berg, Martin Heijnen, and Josef Wunram), GeorgFischer (Rick Hines), and Dow Water & Process Solutions(Michael Kim) and Ahlstrom (Rod Komlenic and DeniseRussell) for equipment contributions toward construction ofthe desalination plant. The personnel of the SeawaterDesalination Test Facility at the U.S. Naval Base VenturaCounty (William Varnava, Mark Miller, Paul Giuffrida, andMicah Ing) are also acknowledged for their technical assistanceduring the field study.
■ REFERENCES(1) Gray, S.; Semiat, R.; Duke, M.; Rahardianto, A.; Cohen, Y.Seawater Use and Desalination Technology. In Treatise on WaterScience; Peter, W., Ed.; Elsevier: Oxford, U.K., 2011; pp 73−109.(2) Fethi, K. Optimization of energy consumption in the 3300 m3/dRO Kerkennah plant. Desalination 2003, 157 (1−3), 145−149.(3) Nemeth, J. E. Innovative system designs to optimize performanceof ultra-low pressure reverse osmosis membranes. Desalination 1998,118 (1−3), 63−71.(4) Wilf, M. Design consequences of recent improvements inmembrane performance. Desalination 1997, 113 (2−3), 157−163.(5) Oklejas, E., Jr; Pergande, W. F. Integration of advanced high-pressure pumps and energy recovery equipment yields reduced capitaland operating costs of seawater RO systems. Desalination 2000, 127(2), 181−188.(6) Rautenbach, R.; Dahm, W. Design and Optimization of Spiral-Wound and Hollow Fiber Ro-Modules. Desalination 1987, 65 (1−3),259−275.(7) Avlonitis, S.; Hanbury, W. T.; Benboudinar, M. Spiral WoundModules Performance - an Analytical Solution 0.1. Desalination 1991,81 (1−3), 191−208.(8) Boudinar, M. B.; Hanbury, W. T.; Avlonitis, S. Numericalsimulation and optimization of spiral-wound modules. Desalination1992, 86 (3), 273−290.(9) Avlonitis, S.; Hanbury, W. T.; Benboudinar, M. Spiral WoundModules Performance - an Analytical Solution 0.2. Desalination 1993,89 (3), 227−246.(10) van der Meer, W. G. J.; van Dijk, J. C. Theoretical optimizationof spiral-wound and capillary nanofiltration modules. Desalination1997, 113 (2−3), 129−146.(11) Geraldes, V.; Pereira, N. E.; de Pinho, M. N. Simulation andoptimization of medium-sized seawater reverse osmosis processes withspiral-wound modules. Ind. Eng. Chem. Res. 2005, 44 (6), 1897−1905.
(12) Villafafila, A.; Mujtaba, I. M. Fresh water by reverse osmosisbased desalination: simulation and optimization. Desalination 2003,155 (1), 1−13.(13) Avlonitis, S. A.; Pappas, M.; Moutesidis, K. A unified model forthe detailed investigation of membrane modules and RO plantsperformance. Desalination 2007, 203 (1−3), 218−228.(14) Singh, R.; Cabibbo, S. V. Hydraulic turbine energy recovery -R.O. System. Desalination 1980, 32, 281−296.(15) Woodcock, D. J.; White, I. M. The application of pelton typeimpulse turbines for energy recovery on sea water reverse osmosissystems. Desalination 1981, 39, 447−458.(16) El-ghonemy, A. M. K. Waste energy recovery in seawater reverseosmosis desalination plants. Part 1: Review. Renewable SustainableEnergy Rev. 2013, 18, 6−22.(17) Bartels, C. R.; Andes, K. Consideration of energy savings inSWRO. Desalin. Water Treat. 2013, 51 (4−6), 717−725.(18) Kim, Y.; Kang, M. G.; Lee, S.; Jeon, S. G.; Choi, J. S. Reductionof energy consumption in seawater reverse osmosis desalination pilotplant by using energy recovery devices. Desalin. Water Treat. 2013, 51(4−6), 766−771.(19) Geisler, P.; Hahnenstein, F. U.; Krumm, W.; Peters, T. Pressureexchange system for energy recovery in reverse osmosis plants.Desalination 1999, 122 (2−3), 151−156.(20) Lu, Y.-Y.; Hu, Y.-D.; Zhang, X.-L.; Wu, L.-Y.; Liu, Q.-Z.Optimum design of reverse osmosis system under different feedconcentration and product specification. J. Membr. Sci. 2007, 287 (2),219−229.(21) Manth, T.; Gabor, M.; Oklejas, E. Minimizing RO energyconsumption under variable conditions of operation. Desalination2003, 157 (1−3), 9−21.(22) Busch, M.; Mickols, W. E. Reducing energy consumption inseawater desalination. Desalination 2004, 165 (1−3), 299−312.(23) Wilf, M.; Klinko, K. Optimization of seawater RO systemsdesign. Desalination 2001, 138 (1−3), 299−306.(24) Wilf, M.; Bartels, C. Optimization of seawater RO systemsdesign. Desalination 2005, 173 (1), 1−12.(25) Alatiqi, I.; Ettouney, H.; El-Dessouky, H. Process control inwater desalination industry: an overview. Desalination 1999, 126 (1−3), 15−32.(26) Alatiqi, I. M.; Ghabris, A. H.; Ebrahim, S. System-Identificationand Control of Reverse-Osmosis Desalination. Desalination 1989, 75(1−3), 119−140.(27) Bartman, A. R.; Christofides, P. D.; Cohen, Y. Nonlinear Model-Based Control of an Experimental Reverse-Osmosis Water Desalina-tion System. Ind. Eng. Chem. Res. 2009, 48 (13), 6126−6136.(28) McFall, C. W.; Bartman, A.; Christofides, P. D.; Cohen, Y.Control and monitoring of a high recovery reverse osmosisdesalination process. Ind. Eng. Chem. Res. 2008, 47 (17), 6698−6710.(29) Abbas, A. Model predictive control of a reverse osmosisdesalination unit. Desalination 2006, 194 (1−3), 268−280.(30) Bartman, A. R.; McFall, C. W.; Christofides, P. D.; Cohen, Y.Model-predictive control of feed flow reversal in a reverse osmosisdesalination process. J. Process. Control 2009, 19 (3), 433−442.(31) Gambier, A.; Badreddin, E. Application of hybrid modeling andcontrol techniques to desalination plants. Desalination 2003, 152 (1−3), 175−184.(32) Krstic, M. Performance improvement and limitations inextremum seeking control. Syst. Control Lett. 2000, 39 (5), 313−326.(33) Bartman, A. R.; Zhu, A. H.; Christofides, P. D.; Cohen, Y.Minimizing energy consumption in reverse osmosis membranedesalination using optimization-based control. J. Process Control2010, 20 (10), 1261−1269.(34) Zhu, A. Z.; Christofides, P. D.; Cohen, Y. Effect ofThermodynamic Restriction on Energy Cost Optimization of ROMembrane Water Desalination. Ind. Eng. Chem. Res. 2009, 48 (13),6010−6021.(35) Zhu, A. H.; Christofides, P. D.; Cohen, Y. Minimization ofenergy consumption for a two-pass membrane desalination: Effect of
Industrial & Engineering Chemistry Research Article
dx.doi.org/10.1021/ie402304d | Ind. Eng. Chem. Res. 2014, 53, 7409−74207419
energy recovery, membrane rejection and retentate recycling. J.Membr. Sci. 2009, 339 (1−2), 126−137.(36) Zhu, A. H.; Rahardianto, A.; Christofides, P. D.; Cohen, Y.Reverse osmosis desalination with high permeability membranes -Cost optimization and research needs. Desalin. Water Treat. 2010, 15(1−3), 256−266.(37) Zhu, A. H.; Christofides, P. D.; Cohen, Y. Energy ConsumptionOptimization of Reverse Osmosis Membrane Water DesalinationSubject to Feed Salinity Fluctuation. Ind. Eng. Chem. Res. 2009, 48(21), 9581−9589.(38) Mulder, M. Basic Principles of Membrane Technology; KluwerAcademic Publishers: Boston, MA, 1997.(39) Dow Water & Process Solutions, FILMTEC MembranesSystem Design, System Performance Projection (Form No. 609-00071-1009); Dow Chemical Company: Midland, MI; pp. 89−92. http://msdssearch.dow.com/PublishedLiteratureDOWCOM/dh_0036/0901b803800362e9.pdf?filepath=liquidseps/pdfs/noreg/609-02057.pdf&fromPage=GetDoc (accessed Aug 22, 2013).
Industrial & Engineering Chemistry Research Article
dx.doi.org/10.1021/ie402304d | Ind. Eng. Chem. Res. 2014, 53, 7409−74207420


![Local cost of seawater RO desalination based on solar PV ... · manage and augment the existing fresh water supply [2]. Seawater desalination is growing as an alternative fresh water](https://img.pdfslide.us/doc/110x75/5f0520947e708231d4116733/local-cost-of-seawater-ro-desalination-based-on-solar-pv-manage-and-augment.jpg)