Embed Size (px)
Citation preview

OATAO is an open access repository that collects the work of Toulouseresearchers and makes it freely available over the web where possible
Any correspondence concerning this service should be sent
to the repository administrator: [email protected]
This is an author’s version published in: http://oatao.univ-toulouse.fr/2 2131
To cite this version:
Almeida, Francisco and Assunção, Marcos D. and Barbosa, Jorge and Blanco,
Vincente and Brandic, Ivona and Da Costa, Georges and Doltz, Manuel F. and Ester, Anne C. and Jarus, Mateusz and Karatza, Helen D. and Lefèvre, Laurent and Mavridis, Ilias and Oleksiak, Ariel and Orgerie, Anne-Cécile and Pierson,
Jean-Marc Energy monitoring as an essential building block towards sustainable ultrascale systems. (2018) Sustainable Computing, 17. 27-42. ISSN 2210-5379.
Official URL:
https://doi.org/10.1016/j.suscom.2017.10.013
Open Archive Toulouse Archive Ouverte

Energyultrasc
FranciscoIvona BrHelen D. Jean-Ma
• Universidad d• lnria. Ecole No' Universidade d Vienna Unive• fnstitute of Co'Universidad Cg Norwegian Un• Poznan Superi Department oi CNRS.IRISA. F
Keywords: Ultra large-scaEnergy-awareEnergy-efficieMonitoring
1. Introduc
Society igenerating processes,
* Sorne of thworking groupCOST..A.ctions/
* CorresponE-mail add
monitoring as an essential building block towards sustainable ale syste1ns*
Almeida a. Marcos D. Assunçào b,•. Jorge Barbosa c. Vicente Blanco a.andicd , Georges Da Costa e. Manuel F. Dolz f, Anne C. Elsterg. Mateusz Jarus h.Karatza i. Laurent Lefèvre b, Ilias Mavridis i. Ariel Oleksiakh. Anne-Cécile Orgeriej.
rc Pierson e
e La Laguna. Spain rmale Superieure de Lyon. France
do Porto. Portugal rsity ofTeclmology, A us tria mputer Science Research, University of Toulouse, France arlos Ill de Madrid, Spain iversity of Science and Technology, Norway
computing and Networking Center, Poznan University ofTechnology, Po/and f lnformatics, Aristotle University ofThessaloniki, Greece
rance
le systems ness ncy
ABS TRACT
An ultrascale system (USS) joins parallel and distributed computing systems that will be two to three orders of magnitude larger than today's infrastructure regarding scale, performance, the numberof components and their complexity. For such systems to become a reality, however, advances must be made in high performance computing (HPC), large-scale distributed systems, and big data solutions, also tackling challenges such as improving the energy efficiency of the IT infrastructure. Monitoring the power consumed by underlying IT resources is essential towards optimising the manner IT resources are used and hence improve the sustainability of such systems. Nevertheless, monitoring the energy consumed by USSs is a challenging endeavour as the system can comprise thousands ofheterogeneous server resources spanning multiple data centres. Moreover, the amount of monitoring data. its gathering, and processing,
should never become a bottleneck nor profoundly impact the energy efficiency of the overall system. This work surveys state of the art on energy monitoring ofla rge-scale systems and methodologies for monitoring the power consumed by large systems and discusses some of the challenges to be addressed towards monitoring and improving the energy efficiency of USSs. Next, we present efforts made on designing monitoring solutions. Finally, we discuss potential gaps in existing solutions when tackling emerging large-scale monitoring scenarios and present some directions for future research on the topic.of v
tion torings increasingly becoming more instrumented and hence large volumes of data. The data results from business advanced scientific experiments, operational moni-
designed toanalysis, ambe preservechallenges agement, in
e work has been conducted in the context of the Energy Efficiency of the Nesus European COST Action IC1305: http://www.cost.eu/
ict/lC1305.ding author.ress: assuncao@acmorg (M.D. Assunçao).
ln this arfor handlingresources. Athat look atorders of mscale, perfo
arious types of infrastructures, medical applications assess the health conditions of populations, financial ong other sources. Much of the produced data must
d and requires processing of some sort, which poses to existing 1T infrastructure concerning storage, manteroperability, governance, processing, and analysis [ 1 ]. ticle, we focus on USSs, one of the envisioned solutions
navel applications and services that demand scores of n USS joins parallel and distributed computing systems Exascale (2) and beyond, which will be two to three agnitude larger than today's infrastructures regardingrmance, the number of components and their complex-

ibtsc
eranp[tbroms
pstssit
ltescldt
stlsacp
2
oFvaat
Fig. 2. Energy monitoring infrastructure.
Table 1Wattmeter infrastructure.
Device name Interface Refresh time (s) Precision (W)
Dell iDrac6 IPMI/Ethernet 5 7Eaton Serial, SNMP Ethernet 5 1OmegaWatt IrDA Serial 1 0.125Schleifenbauer SNMP via Ethernet 3 0.1
Fig. 1. Areas that affect the analysis of energy efficiency in USSs.
ty. For such systems to become a reality, however, advances muste made in high performance computing (HPC), large-scale dis-ributed systems, and big data solutions [3], also tackling challengesuch as improving the energy efficiency of the underlying IT andooling infrastructure.
In addition to optimising the production and life-cycle ofmployed equipment, improving the energy efficiency of USSsequires means to exploit the available resources efficiently, thuschieving energy proportionality [4]. Over the years, several tech-ical solutions have been proposed to improve the efficiency ofrocessors [5,6], data storage solutions and network equipment7]. Although all these techniques are crucial towards improvinghe overall effectiveness of USS, the amount of energy consumedy large-scale distributed systems is still heavily impacted by howesources are allocated to applications. Such allocation decisionsften carried out by resource management systems [8], should beade considering how much energy the underlying resources con-
ume.Monitoring is therefore essential for determining how much
ower the resources consume and the impact of allocation deci-ions on the system overall energy efficiency. However, monitoringhe energy consumption of USSs is a challenging endeavour as theystem can comprise thousands of heterogeneous server resourcespanning multiple data centres. Moreover, the amount of monitor-ng data, its gathering and processing, should not heavily impacthe energy efficiency of the observed system.
In this work, we survey state of the art on energy monitoring ofarge-scale systems and discuss some of the needs and challengeshat must be addressed towards monitoring and improving thenergy efficiency of USSs. The work describes energy-monitoringolutions and discusses the challenges they aim to address. We thenarry out a gap analysis, discuss some challenges that are currentlyeft unaddressed by existing solutions, and describe some areas thateserve particular attention on monitoring the energy consump-ion and improving the efficiency of ultra large-scale systems.
The rest of this paper is organised as follows. Section 2 surveystate of the art on power monitoring of large systems and moni-oring methodologies. In Section 3, we describe a non-exhaustiveist of challenges on energy monitoring for USSs. A description ofelected solutions is provided in Section 4. Section 5 presents a gapnalysis and discusses future directions on monitoring the energyonsumed by large-scale systems. Finally, Section 6 concludes theaper.
. Power monitoring of large-scale systems
Improving the energy efficiency of USSs is a challenging endeav-ur that requires advances in several areas [9]. As illustrated inig. 1, reducing the energy consumption of USSs requires inno-ations in hardware and on the assignment and execution of
pplications and services onto available resources while takingdvantage of the heterogeneous hardware. It has also been iden-ified that to improve energy efficiency, accurate and real-timeWatts Up? Proprietary via USB 1 0.1ZES LMG450 Serial 0.05 0.01
power monitoring may be required, which is difficult to achievesince, at large scale, the monitoring system can become a USS itself.
It is desirable to gain insights into the consumption of existingsystems at all possible levels to optimise the energy usage acrossthe whole stack of a USS. System designers and operators, as wellas application developers, should be able to access power data atmultiple granularity levels, from the whole system to individualserver components. Given the importance that monitoring has onoptimising systems for energy efficiency, during the second phaseof the action we opted for reviewing state of the art in this domainand describe the solutions designed by participants for monitoringthe power consumed by large-scale systems.
Previous work has discussed performance analysis method-ologies that consider available energy monitoring and energyawareness mechanisms for HPC architectures. Benedict [10] forinstance, defines a taxonomy encompassing methods based onmeasurement, estimation, and analytical modelling. The authorclassifies energy monitoring and analysis solutions for HPC inhardware-based, software-focused and hybrid. Noureddine et al.surveyed approaches on energy modelling and measurement [11].A study more focused on energy monitoring has been performedby Hsu and Poole [12], whereas Hackenberg et al. [13] investigatedhardware-based methods to monitor the energy consumed by com-puting nodes. Other general surveys on energy-efficient resourceallocation mechanisms have been presented [5,14] where many ofthe surveyed mechanisms require monitoring of some type. Therest of this section provides a non-exhaustive description of tech-nologies, approaches, and methodologies for energy monitoring oflarge-scale distributed systems and HPC infrastructure.
2.1. Energy monitoring infrastructure
Several hardware and software solutions have been used tomonitor the power consumed by computing systems and data cen-tres. Such solutions enable multiple levels of measurement withvarying degrees of precision and intrusiveness. While focusing ondata centres and compute clusters, we have previously classifiedsuch solutions as external devices, intra-resource devices, hard-ware sensors, and software interfaces (Fig. 2). A revised summary of
these solutions is presented here, centred on hardware and hybridapproaches, whereas a more detailed discussion is found in previ-ous work [9].
s
2
opwisePe
ismomMeum
•
••
bvu[
2
sbm[PowtTtsiost
2
tcopo
Moreover, Table 1 lists equipment deployed and used by theolutions described later in Section 4.
.1.1. External devicesThese devices, commonly called wattmeters or powermeters,
ften comprise equipment not embedded into the resources whoseower consumption is measured. They mostly lie in between theall socket and the plug of the measured equipment, thus measur-
ng the consumption of an entire sub-system (e.g. a server node, atorage array). Examples of this type of equipment include pow-rmeters such as Kill-a-Watt [15], Watt’s Up Pro [16], enclosureDUs (ePDUs) with measurement and managing capabilities,1 Pow-rPack [17], PowerScope [18], among other solutions.
Wattmeters available in the market vary regarding physicalnterconnection, communication protocols, packaging and preci-ion of measurements they take. They are mostly packaged inultiple outlet power strips called power distribution units (PDUs)
r ePDUs, and more recently in the intelligent platform manage-ent interface (IPMI) cards embedded in the servers themselves.oreover, wattmeters may differ in the manner they operate; some
quipment sends measurements to a management node on a reg-lar basis (push mode), whereas others respond to queries (pullode). Other characteristics that differ across wattmeters include:
refresh rate (i.e. maximum number of measurements per sec-ond);measurement precision; andmethodology applied to each measurement (e.g. mean of severalmeasurements, instantaneous values, and exponential movingaverages).
Depending on the measurement hardware and infrastructure,iases such as the overhead of the monitoring software, PSU con-ersion impact, among other issues, have to be taken into accountsing, for instance, the methodology described in previous work19].
.1.2. Intra-resource devicesThis class of devices comprises equipment that is placed inside
erver nodes – often between the power supply and the mainoard – to measure the power consumption of individual equip-ent or voltage lines. Examples include the PowerMon devices
20], placed between a node’s power supply and mainboard; theowerInsight [21], designed for component-level instrumentationf commodity hardware; the ARM Energy Probe [22], integratedith the ARM development tool chain; the Linux Energy Attribu-
ion and Accounting Platform LEA2P [23]; among other solutions.he high definition energy efficiency monitoring (HDEEM) infras-ructure [24] which proposes a sophisticated approach towardsystem-wide and fine-grained power measurements by introduc-ng, among other features, a field-programmable gate array (FPGA)n each server blade able to improve spatial granularity to mea-ure blade, CPU, and DRAM power consumption while improvingemporal granularity to up to 1 kSa/s.
.1.3. Hardware sensors and software interfacesMore recent data-centre hardware offers many built-in sensors
o report the energy that a piece of equipment consumes. The data
an be made available to monitoring tools via performance countersr vendor-specific APIs. Examples include the Intel running averageower limit (RAPL) interface which reports per-package estimatesf total energy consumed on Intel Sandy Bridge CPUs and later; the1 http://www.eaton.com/Eaton/index.htm.
NVIDIA Management Library (NVML) interface that queries instantpower drawn by NVIDIA Tesla GPUs; several motherboards reportpower drawn by extending IPMI.
Hardware performance counters (PCs) are special-purpose reg-isters built into modern microprocessors to store the counts ofhardware-related activities. Their content can be made availableat the operating system level via special file descriptors availablethrough, for instance, the Linux kernel API [25]. PCs can provide CPUinformation, such as clock cycles, instructions, cache referencesand misses, branch instructions and misses, page faults, contextswitches, among others. Along with power usage metrics, thisinformation has been exploited for determining the energy costof certain hardware operations.
Several attempts have been made over the past years towardsproviding standard APIs for monitoring the energy consumed byequipment in a data centre or HPC. Reviewed in previous work,some of these initiatives are the performance API (PAPI) [26], whichincludes an integrated energy consumption interface for monitor-ing the energy consumed by computing resources; the PowerAPI,an attempt to standardise access to power measurement data andpower control [27]; the Energy Measurement Library (EML), a soft-ware library that simplifies the analysis of energy consumed byheterogeneous systems; among other power measurement APIs[28]. Concerning HDEEM infrastructure mentioned beforehand, aparticular API has been designed to access power and energy mea-surements supporting both in-band access through GPIO and PCIeas well as out-of-band access through IPMI [29]. Besides, at the levelof resource and job management systems for HPC, functionalitieshave been introduced [30] to directly relate the monitoring mea-surements to power profiling and energy accounting per job. Thesefeatures facilitate the analysis of energy data by users and admin-istrators during the real-scale executions upon the HPC platforms.
2.2. Monitoring methodologies
The power-monitoring methodology proposed by the StandardPerformance Evaluation Corporation (SPEC) [31] is certainly oneof the most popular methodologies for evaluating the energy con-sumed by a system under test. It was designed for evaluating theenergy efficiency of a server or a group of servers running a Java-based business benchmark. Although the methodology was initiallydesigned for server workloads, it has been adapted to suit otherscenarios [32] as highlighted by Scogland et al. [33].
Some initiatives have been undertaken towards devisingmethodologies for monitoring the energy consumption of largecomputing systems and for enabling architectural analysis andcomparison for rankings such as the Top500 [34] and Green500[35]. One important effort has been made by the Energy EfficientHPC Working Group (EE HPC WG) [33], which by undertaking asurvey of power submissions to the Green500 and Top500 lists,demonstrated that there is a wide variation in the quality of themeasurements reported. Though some of the analysed power sub-missions were comprehensive and reflected a high level of quality,others were based on course grained information such as speci-fication sheets provided by hardware vendors. Aiming to providea common methodology the EE HPC WG identified several issues,including:
• Unclear demarcation between the computer system and the datacentre infrastructure, e.g. fans, power supplies, and liquid cooling.
• Use of shared resources such as storage and networking.• Limitations on data centre and instrumentation for system level
power measurement.
To accommodate systems that cannot be fully instrumented,the provided methodology proposed three levels of measurements.

Table 2Summary of aspects and quality levels [33].
Aspect Level 1 Level 2 Level 3
Granularity One power sample per second One power sample per second Continuously integrated energyTiming The longer of one minute or
20% of the runEqually spaced across the full run Equally spaced across the full run
Measurements Core phase average power 10 average power measurements inthe core phase; Full run averagepower; Idle power
10 average power measurements inthe core phase; Full run averagepower; Idle power
Machine fraction The greater of 1/64 of thecompute subsystem or 1 kW
The greater of 1/8 of the computesubsystem or 10 kW
All included subsystems
Subsystems Compute-nodes only All participating subsystems, eithermeasured or estimated
All participating subsystems must bemeasured
Point of measurement Upstream of power conversion Upstream of power conversion oronvereasu
upply
Upstream of power conversion or
LaLtranim
•
•
••
owslt
3
oPcovstdprhcd
••
•
c
or Conversion loss modelledwith manufacturer data
Cms
evel 1 is similar to Green500’s Rev0.9 rules, where a single aver-ge power measurement is extrapolated from a machine subset.evel 2 still consists in a power measurement based on a subset ofhe overall system. Level 3, the most rigorous, offers a valid, accu-ate measurement of the full system, but it is often only possiblet a few sites. The methodology then defines three quality levels,amely good, better, and best with Level 3 being the best. The qual-
ty ratings impose requirements on four different aspects of powereasurement as follows:
The time span over which a measurement is taken, the time gran-ularity, and the reported measurements.The number of resources, or fraction of the system that is instru-mented.Subsystems required in the measurement.Where in the power system the measurements are taken.
The EE HPC methodology distinguishes between the core phasef a workload and the entire workload, while taking the Green500orkload as a basis. Table 2 summarises the various aspects con-
idered by the methodology and the criteria used by each proposedevel and quality. This methodology was later applied to investigatehe inter-node power usage variability [36] as explained next.
. Challenges in energy monitoring and usage
As measuring the power consumed by a large-scale system isften difficult, many published measurements are extrapolated.revious work has investigated the validity of extrapolations in theontext of inter-node power variability [37] and power variationsver time within a workload run [36]. By characterising the powerariability across nodes at eight supercomputer centres, a studyhowed that the current requirement for measurements submittedo the Green500 [35] and others allow for variations of up to 20%ue to measurement timing and 10-15% due to insufficient sam-le sizes [36]. Other works have determined that high samplingates are required to capture power fluctuations, while wattmetersave to be accurate and reliable enough to assess the energy effi-iency of applications [38]. Although challenging, these analysesemonstrate the need for:
high-quality, fine-grained levels of measurement;a methodology for measuring the power consumed by a large-scale system and reporting results; andtransparent and verifiable means for comparing energy-
efficiency results obtained from different systems.Moreover, characterising the energy consumed by softwareomponents may require monitoring their resource utilisation and
sion loss modelled with off-linerements of a single power
Conversion loss measuredsimultaneously
impact on the overall system consumption. Such characterisationsmay need monitoring both configuration and performance of mul-tiple elements, or levels, of the software stack. As we envision thatUSSs may not only be supercomputers, but also federations of datacentres, edge computing systems [39], and surrounding infrastruc-ture, providing fine-grained measurements of power consumptioncan be challenging. Significant reduction of the energy consumed bysuch complex, large-scale systems also requires addressing manychallenges. Some of the problems regarding techniques and result-ing data management for large systems are as follows:
C1: Large-scale monitoring and profiling. To understand howresources of a large system consume energy, power consumptionmust be adequately measured, and information collected, inte-grated and analysed. For understanding how a large-scale softwaresystem consumes energy, not only the energy consumed by thephysical resources should be monitored, but also how services andapplications make use of the underlying resources. Proposed archi-tectures for such monitoring systems should be capable of handlinglarge amounts of data without creating bottlenecks. Ideally, archi-tecture should enable, through carefully designed communicationand interfaces, accessing fine-grained measurement data when andwhere needed. Since monitoring and profiling can be performedat multiple levels, a significant research challenge is to providemonitoring for multiple layers of software stack and techniques forpropagation of metrics between the layers. Some of the challengingendeavours towards this end include:
1. Fine-grained energy monitoring: Fine-grained measurementhere are approaches that, at a large-scale, provide or exceedLevel 2 of the EEHPC methodology described earlier [33] wheremeasurements are taken on a per-second basis at the upstreampower conversion of at least 1/8 of the computing subsystem.Previous work has shown that such a granularity can help reducevariations across energy reports [36]. Monitoring systems thatcomply with or exceed such level are here considered to be fine-grained. Data management under fine-grained monitoring forlarge systems becomes an issue due to the amount of data thatneeds to be transferred over the network, processed and stored.
2. Application and service monitoring: Characterising the energyconsumption of a software subsystem generally requires – inaddition to measuring the energy the hardware consumes –monitoring performance and resource utilisation metrics orcounters. The underlying challenge consists in providing tech-niques for monitoring resource utilisation and instrumentingapplications or services that can scale without causing significant
overheads in the instrumented system.3. Resource and service profiling: Monitoring solutions are com-monly used to accumulate time series of measured metrics thatcan be used to build usage profiles. Concerning energy con-

4
icecUmbnmarqase
1
2
pbGgsdwittmpitotGaUtf
and is currently the solution deployed on the Grid5000 platform[47] to monitor the energy consumed by computing and net-work resources. Its architecture, depicted in Fig. 3, relies on alayer of drivers that retrieve power measurements from several
sumption, the monitoring data is utilised to create resource-and service-level profiles. While the former requires monitor-ing the energy consumed by the physical resources, the latteroften demands correlating energy consumption with resourceusage metrics.
. Scalable architectures: To cope with the amount of data gener-ated by monitoring systems at large-scale, architectures shouldprovide means for achieving horizontal scalability, elasticity,and potentially exploit specialised hardware (e.g. FPGAs) thatcan reduce the delay of gathering data and making it availableto Application Programming Interfaces (APIs) and visualisationinterfaces.
C2: Models and simulation of energy consumption. As measur-ng the energy consumed by all components of USS could causeommunication bottlenecks and high additional costs, accuratestimation methods are useful when a fine-grained measurement isostly. To this end, precise yet computationally simple modelling ofSS components is needed. For the same reason as above, measure-ent methods that allow reducing the number of sensors would
e necessary. These methods could include disaggregation tech-iques to retrieve fine-grained information from coarse-grainedeasurement data. In a USS, energy monitoring will have to be
ccompanied by accurate models and estimation methods that areequired to reduce the number of sensors and meters, and conse-uently, cost and complexity of such systems. Moreover, there islso a need for incorporating power-consumption models in cloudimulators, so that researchers can evaluate software solutions fornergy-efficient resource allocation.
. Models and estimations: Monitoring all system components isnot always possible. A tool should provide models and meansto estimate the energy consumed by individual subsystems.While building such models in a small and controlled environ-ment already presents several challenges, devising models thataccount for factors such as internode variability and that can betested and validated at large-scale is a difficult endeavour [40].
. Integration with simulation tools: Monitoring tools are oftenused to gather the data required to devise energy consumptionmodels that are incorporated into simulation tools. Simulationtools are in turn commonly used to extrapolate certain scenariosand investigate application scheduling and resource manage-ment algorithms at scale.
C3: APIs and developer/user feedback. A large part of therogress on energy efficiency has been made in the hardware itselfy for instance adopting low-power CPUs or accelerators such asPUs and FPGAs. As large-scale systems are often very hetero-eneous – and heterogeneity is likely to increase at ultrascale –oftware developers and users often want to know what resourceseliver the best performance to energy consumption ratio for theirorkload. However, as highlighted in previous work, it is challeng-
ng to design a power-monitoring infrastructure that can provideimely and accurate feedback to system developers and applica-ion writers so that they can optimise the use of energy [41]. Many
onitoring infrastructures are not designed with application-levelower consumption measurements in mind. Yoshii et al. [41]
nvestigated the existing power monitoring of IBM Blue Gene sys-ems and found that meaningful power consumption data can bebtained under Blue Gene/P, where the measurement interval is inhe order of minutes, by carefully choosing micro-benchmarks. Blueene/Q, which offers per second-scale resolution of power data,
llows for studying the power characteristics of the Floating Pointnit (FPU) and memory subsystems. The authors of the study arguehat improvements can be made if power data were released morerequently. However, when increasing the frequency of measure-
ments, the issue of jitter arises. The bus and FPGA speed pose limitson the sampling rate, which may impact the energy efficiency ofthe overall system and compromise precision. One of the proposedsolutions is to enable applications to specify the start and end ofmonitoring intervals with the sampling and integration handled inhardware.
1. APIs: Users who want to assess the energy consumed by aninfrastructure or its software subsystems require APIs to inter-face with the monitoring system to obtain data on energyconsumption and configure parameters such as monitoringintervals, measurement frequency, among other factors. SuchAPIs should be able to cope with large amounts of data whileremaining responsive.
2. Interactive graphical interfaces: Visualisation tools that candeal with large quantities of data, while considering their qualityand presentation to facilitate navigation, are increasingly impor-tant [42]. The type of visualisation may have to be adjusteddynamically according to the amount of data to be displayedto improve both displaying and performance. There has beenan effort to explore visualisation in complex data analyses byusing, for instance, sophisticated reports and storytelling [43].Fisher et al. [44] point out, however, that many platforms thatprocess large amounts of data still resemble the batch-job modelwhere users typically submit their jobs and wait until the exe-cution is complete to download and analyse results to validatefull runs. The authors issue a call to arms for both research anddevelopment of better interactive interfaces for data analysiswhere users iteratively pose queries and see rapid responses.Energy monitoring and visualisation at ultrascale are likely toface similar challenges.
C4: Integrating other measurements in architectures and APIs.Power usage is not the only significant measurement value forenergy efficiency improvements, especially in the case of large-scale systems. The overall energy consumption also depends onenvironmental parameters such as room temperature and out-side temperature, air/liquid flow, humidity, cooling system powerusage, availability of renewable energy, etc. Hence, effective inte-gration of these measurements is an important part of USSmonitoring.
4. Solutions in the scope of the Nesus action
This section presents solutions proposed in the area of energymonitoring of large-scale computing systems.2 We describe thesolutions – namely KWAPI, EML, PMLib, ECTools and BEMOS – theirdesign goals, challenges they aim to address, and lessons learntduring their deployment and use.
4.1. KiloWatt API (KWAPI)
The KWAPI framework3 was created to enable measuring thepower consumed by cluster resources in OpenStack [45]. It hasbeen adapted to support large-scale federations of clusters [46]
2 The solutions described here have been conducted in the context of the EnergyEfficiency working group of the Nesus European COST Action IC1305: http://www.cost.eu/COST Actions/ict/IC1305.
3 KWAPI was originally designed during the French FSN XLCloud project: http://xlcloud.org.

dtc
ctert(pcr[anh
Zpptns
snaaesBdtdtp
nintrca
Fig. 3. KWAPI architecture [46].
evices, and plug-ins or data consumers that collect and processhe measurement data. A bus, the forwarder, is responsible for theommunication between these two layers.
The driver layer is controlled by a Driver Manager that reads aonfiguration file compliant with the OpenStack format and starts ahread for each entry. An entry contains a list of probes and param-ters including IP address and port, the type of driver to use, andelevant metrics to measure (e.g. SNMP OID). The measurementshat a driver obtains are represented as JavaScript Object NotationJSON) dictionaries that maintain a small footprint and are easilyarsed. The size of dictionaries varies depending on the number ofonfigured fields (e.g. whether messages are signed). Each driveretrieves and pushes measurements to the forwarder via ZeroMQ48]. Drivers can manage incidents themselves, but the managerlso checks periodically if all threads are active, restarting them ifecessary. Support for several types of wattmeters, listed in Table 1,as been provided.
The Forwarder is an internal communication bus based oneroMQ and works as a publish/subscribe service, where drivers areublishers and plug-ins, are subscribers. It can work locally, i.e. withublishers and subscribers on the same machine, or through a dis-ributed architecture using gateway devices to interconnect remoteetworks. Under a distributed architecture, a plug-in can listen toeveral drivers located at remote locations using the forwarder.
A Data Consumer or plug-in retrieves and processes mea-urements from the Forwarder. Two plug-ins were implemented,amely, a REST API (used to interface with Ceilometer4) that allowsn external system to access real-time measurements, and a visu-lisation plug-in based on Round-Robin Database (RRD) files thatxpose metrics through a Web interface. Data consumers can alsoubscribe to receive information from drivers from multiple sites.y using a system of prefixes, consumers can subscribe to all pro-ucers or a subset. When receiving a message, a consumer verifieshe signature, extracts the content and processes the data. Bothrivers and consumers can be easily extended to support, respec-ively, several types of wattmeters and provide additional datarocessing services.
The current REST API allows an external system to retrieve theame of probes, measurements in Watts or kWh, and timestamps. It
s secured by OpenStack Keystone tokens5, whereby the consumereeds to ensure the validity of a token before sending a responseo the system. The visualisation consumer builds RRD files from
eceived measurements and generates graphs that show the energyonsumption over a given period, with additional information suchs average electricity consumption, minimum and maximum Watt4 https://wiki.openstack.org/wiki/Telemetry.5 http://keystone.openstack.org.
values, last value, total energy and cost in Euros. More details aboutthe visualisation features are available in previous work [45].
4.1.1. Design goalsKWAPI has been designed to provide experimenters with deep
insight into the effects of their experiments on testbeds, and usersof cloud infrastructure with feedback on the energy consumed bycluster resources. It has been devised to interface with several typesof sensor technologies, enabling users to specify which resourcesare monitored, the start and end of measurement intervals; allwithout heavily impacting the usage of the underlying IT infras-tructure.
The KWAPI framework has been deployed as a telemetry solu-tion in Grid5000 [47], which comprises several sites with multipleclusters. The framework collects information of both power con-sumption and network usage, enabling users to evaluate theperformance of their experiments [46]. Even though KWAPI doesnot build energy consumption models itself, it provides users anddevelopers with feedback on their optimisation choices and hashence been used for profiling experiments and building powerconsumption models that are incorporated in discrete-event sim-ulators.
In addition to the default visualisation tools, which provide userfeedback per experiment (i.e. a job or reservation), the API can beused by external systems, or scripts, to collect both measurementsof instantaneous power usage and the energy consumed by specificresources over a given time frame. This information is relevant toapplication eco-design. Similar to monitoring network usage, theframework can incorporate other metrics that are not energy-related.
4.1.2. Results and lessons learntOver the past years during which the framework has been in
place in Grid5000, it has addressed a list of operational challengesby providing a unified API that experimenters can use for evaluatingtheir applications. The functional usage of KWAPI has demon-strated several benefits of monitoring every IT resource used bylarge-scale applications.
Experiments have also shown that by exploiting features ofmonitoring hardware, KWAPI can monitor a large set of resourceswithout perturbing experiments [46]. The throughput, latency, andjitter of measuring power consumption and transferring the mea-surement data have also been evaluated under several conditions[45]. The architecture and communication bus can handle signifi-cant amounts of data under short delays, but they have limitations.Under fine-grained measurement with small intervals, which canresult in an enormous number of observations per second, an archi-tecture based on stream processing systems that guarantee dataprocessing might be more appropriate to provide users with nearreal-time feedback on power consumption.
Moreover, users have been increasingly interested in measur-ing the usage and power consumption of other types of resources,such as storage and network equipment and the temperature ofmultiple spots in a server room. In addition, certain users requirefine-grained measurement to build and refine models of powerconsumption. Providing a general-purpose API that allows for suchfine-grained monitoring can result in large amounts of data thatneed to be transferred over the network and stored for furtherprocessing. As a result, users often deploy specialised hardwareand software on premises and utilise ad-hoc solutions that suittheir needs. Although the KWAPI API allows for scripting and forpower to be measured over the duration of an experiment, it lacks
programmability functions that enable application developers tospecify, at design time, which sections of code should be instru-mented and the desired granularity, thus reducing the amount ofcollected data.
4
eptfiwtP
4
eAai
icmnabths
4
o
1
2
3
4
Fig. 4. Minimum example of EML use.
.1.3. Ongoing and future workAlthough KWAPI has been in use for some time on a large
xperimental platform, development is continuous towards incor-orating other metrics to the framework, such as room and rackemperature, and other types of equipment to fulfil the needs forne-grained measurements by certain users. Future collaborativeork is also envisioned for providing programmability features
o developers via existing frameworks such as EML (Section 4.2),MLib (Section 4.3) and ECTools (Section 4.4).
.2. Energy Measurement Library
The EML [28,49] is a C/C++ software library built to assess thenergy consumed by distributed systems. The main component, anPI to speed up the measurement and experimentation process,utomatically discovers available devices and monitoring capabil-ties while abstracting the user from hardware details.
EML was originally designed around the factory pattern andmplemented in C++. Instrumented code would measure energyonsumption for a supported device through a unified Measure-ent Tool interface. This design had drawbacks as it required theumber and type of monitored devices to be known at compilation,nd instrumentation of C code was not possible. EML has henceeen redesigned to support instrumentation of C code [49]. Addi-ional features include exporting measurement data to JSON andigher-level API methods to measure multiple types of equipmentimultaneously.
.2.1. Usage modeThe basic usage pattern of EML used to measure a single section
f code on all available devices (Fig. 4) involves:
. Library initialisation (emlInit), which discovers available devicesand allocates necessary resources.
. A call to emlStart before the relevant section of code, which maylaunch per-device threads that periodically perform and recordmeasurements.
. Calling emlStop after the section, which hence ends the laststarted monitoring interval and returns opaque emlData t* han-
dles to the recorded interval data.. Operating on the obtained data. API functions are provided toquery energy and time totals or to serialise and export data asJSON.
Fig. 5. Annotation of a matrix multiplication code using TIA.
5. Library deinitialisation (emlShutdown).
The overhead introduced by EML has been evaluated and hasbeen shown to be low [49].
4.2.2. Energy modelling with TIA and EMLCurrent parallel performance analysis tools are typically based
on either measurement or modelling techniques, with littleintegration between both approaches. Researchers developingpredictive models have to build their validation experiments. Con-versely, most application profiling tools do not produce output thatcan be readily used to generate automatically approximated mod-els.
The Tools for Instrumentation and Analysis (TIA) [50] frame-work was originally designed to bridge the gap between analyticalcomplexity modelling and performance profiling tools. Throughloosely coupled, but well- integrated components, TIA providesboth profiling on a specified set of metrics for source-annotatedregions of parallel code and analysis facilities to help find and vali-date an appropriate performance model. This methodology can alsobe applied to power performance, enhancing TIA with energy mea-surement capabilities through EML. An example of annotating codewith TIA directives considering an energy-related metric is shownin Fig. 5.
The data gathered from the instrumentation can be processedwith an R library where a model can be obtained. Fig. 6 shows anexample for a matrix product in terms of matrix sizes. The comput-ing stage has cubic complexity on the problem size, as expected. Formore complex programs, the cll.fit function can be instructedto consider more factors and other metrics as terms. The R pack-age includes functions to produce basic graphical visualisations ofpredictions and model fit graphs (Fig. 7). More sophisticated rep-resentations can take advantage of the plotting functionality in theR environment.
4.2.3. Design goalsEML has been designed to provide an abstraction layer to dif-
ferent energy monitoring devices. The design is driver-oriented toease the inclusion of new energy monitoring hardware, currentlycovering CPUs through RAPL interface, GPUs via NVML, Xeon Phithrough MPSS and Schleifenbauer PDUs.

Fig. 6. Sample model for a matrix product in terms of matrix sizes.
Frt
lwtaITe
4
mrAaarfm
ig. 7. Generated model (red) from measurements (black). (For interpretation of theeferences to color in this figure legend, the reader is referred to the web version ofhis article.)
EML simple design can be valuable to address the challenge ofarge-scale monitoring, combined with other tools and frameworks
hich handle the large-scale requirements and complexity of thisask. The EML interface enables instrumenting a small subset ofpplication code as well as controlling the monitoring sample rate.t can be used as an application profiling tool, and combined withIA framework energy consumption models can be built, includingnergy consumption and other performance metrics.
.2.4. Results and lessons learntEML has been successfully used to obtain energy analytical
odels [51], showing that it is viable to get structural and algo-ithmic parameters that affect energy consumption and efficiency.nalytical energy models have been achieved for master-slavepplications [52], the High-Performance Linpack benchmark [53],
nd MPI communications OSU microbenchmarks [54]. From expe-ience, we learnt that it is possible to obtain analytical modelsor energy consumption suitable for scheduling purposes, perfor-ance prediction, or scalability analysis. We also learnt that tuning
Fig. 8. Architecture of PMLib.
the monitoring stage, like adjusting sampling rate, is important toobtain accurate models.
4.2.5. Ongoing and future workFuture work will comprise a production-ready modular analy-
sis framework, an effort that involves streamlined installation andusage processes, improved visualisation and statistical capabilities,and a graphical interface for the analysis package. The EML com-ponent is also expected to undergo further API development andincrease device support in coming releases.
4.3. The PMLib library
The Power Measurement Library (PMLib) is part of a frameworkfor power-performance tracing and analysis of scientific applica-tions [55]. This library can interface with a broad range of powermeasuring devices: i) external commercial products, such as intel-ligent APC PDUs, WattsUp? Pro.Net and ZES Zimmer devices; ii)internal DC wattmeters, like a commercial Data Acquisition Sys-tem (DAS) from National Instruments (NI); and iii) specific designsthat use microcontrollers to sample power data (see Fig. 8). Thecomplete PMLib package is publicly available [56].
Fig. 9 details the framework for power-performance tracing andanalysis of scientific applications. The starting point is a parallelscientific application instrumented with the PMLib software thatruns on a parallel target platform – e.g., a cluster, a multicorearchitecture, or a hybrid computer equipped with one or Graph-ics Processing Units (GPUs) – that consumes a certain amount ofpower. Connected to the target platform, there is one or severalpowermeter devices – either internal DC or external alternatingcurrent (AC) – that steadily monitor the power consumption, send-ing the data to a tracing server. Calls from the application runningon the target platform to the PMLib API, instruct the tracing serverto start/stop collecting the data captured by the powermeters,dump the samples in a given format into a disk file (power trace),query multiple properties of the powermeters, etc. Upon comple-tion of the application execution, the power trace can be inspected,optionally hand-in-hand with a performance trace, using somevisualisation tool. Our current setting allows a smooth integrationof the framework power-related traces and the performance tracesobtained with Extrae. The resulting combined traces can be visu-alised with the Paraver tool from the Barcelona Supercomputing
Centre. Nevertheless, the modular design of the framework caneasily accommodate other tracing tools like, e.g. TAU, Vampir, etc.As an additional feature, PMLib can read the C- and P-statesinformation of each core on a multi-core platform. To do so, the

F
srCtaenut
4
ihmiiiaotOca
etTdvaama
4
rd
Application power estimators that are also application-level sen-sors comprise multiple sub-sensors used to estimate an applicationpower consumption.
ig. 9. Collecting traces at runtime and visualisation of power-performance data.
erver daemon integrated into the power framework reads the cor-esponding MSRs (Model Specific Registers) of the system, for eachPU X and state Y, with a user-configured frequency. Note thathe state-recording daemon necessarily has to run on the targetpplication and, thus, it introduces a certain overhead (regardingxecution time as well as power consumption) which can becomeon-negligible depending on the software being monitored. Theser is advised to experimentally adjust the sampling frequency ofhis daemon with care to avoid this effect.
.3.1. Design goalsFor years, existing tools for HPC focused solely on monitor-
ng and evaluation of performance metrics. Nevertheless, newerardware has started to incorporate a broad range of sensors andeasurement devices related to power consumption with vary-
ng granularity and precision. The PMLib library aims to build anntegrated framework for power-performance profiling and trac-ng, and hence bridge the gap between performance analysis toolsnd power sensors. We believe that to gain a better understandingf energy usage, performance metrics, such as performance coun-ers or everyday events, should be correlated with the power traces.nly analysing these measurements, energy inefficiencies in theode can be identified and optimised. PMLib was designed havingll these needs in mind.
With PMLib we aim at facing some of the challenges above innergy monitoring. It is possible to profile and monitor USS sys-ems with PMLib with the user interface provided by the package.o some extent, PMLib can also be used to develop power modelsuring the training stage. Nevertheless, PMLibmainly aims to pro-ide feedback to the users so as to gain insights about energy usagend turn them to be more energy-efficient. Finally, the modularrchitecture of the library allows users to create new measurementodules, either for new wattmeter devices or system sensors, such
s temperature or humidity.
.3.2. Results and lessons learntDuring past research, PMLib has been broadly used in several
esearch lines: (i) modelling power and energy consumption; (ii)esigning of energy-aware techniques for scientific applications;
(iii) developing new fine-grained power measurement devices;and (iv) assessing accuracy of existing power measuring devices.A research result thanks to PMLib, is a tool for automatic detec-tion of power sinks during the execution of concurrent scientificworkloads [57]. This tool has been shaped in the form of a multi-threaded Python module that offers high reliability and flexibility,rendering an overall inspection process and introducing very lowoverheads. The detection of power sinks has been based on a com-parison between the application performance trace and the C-statetraces per core. When a core is supposed to be in an “idle” state butthe C-state is C0 (i.e. active), the tool detects a power sink. More-over, the analyser is flexible, because the task type that correspondsto “useful” work can be user-defined; furthermore, the length of theanalysis interval and the divergence (discrepancy) threshold areparameters that can be adjusted by the user to the desired level.Thanks to this tool, several applications have been analysed andimproved for energy efficiency.
With the development ofPMLib, we learnt several lessons. Whilethe PMLib server was implemented to support multiple types ofwattmeters running concurrently with multiple users queryingthem, connecting or disconnecting devices from the server is some-times not straightforward and requires to reboot the PMLibdaemonrunning on the server. On the other hand, very long measurementsat a high sampling rate may lead to memory overflows in the server.We are already aware of these shortcomings and plan to addressthem in future releases. A final lesson learnt is the overheads thatPMLibmight introduce when measuring P-/C-states. In this case, itis the user’s responsibility to set the sampling frequency with care.
4.3.3. Ongoing and future workWhile several research institutions in Spain, Germany, and
France use PMLib, its development continues towards a new ver-sion of the server implemented in C++. This new version will allowusing fine-grained measurement devices, with a sampling rate ofseveral kilo-samples per second. On the other hand, we also plan toextend it to support other kinds of metrics and hardware countersavailable in the system. An ultimate goal will be to make the PMLibuser interface compatible with the current PowerAPI from SandiaLabs.
4.4. ECTools
The Energy Consumption Library (LibEC) is an open source toolto estimate the power dissipated by a machine or an application,even if wattmeters are not available [58]. The library6 uses a set ofsensors to feed several power models. Although most informationthat sensors gather comes from the Linux kernel’s API (e.g. /sysand /proc file systems), its modular design allows for the libraryto be easily extended to support other sources.LibEC aims to abstract two types of sensors (i.e. machine-level
and/or application-level sensors) and application power estima-tors, while providing for an extensible system where new powermodels can be easily integrated. The application-level sensors canbe directly associated with a Process IDentification (PID) and mainlyreport software usage, such as performance counters. Machine-level sensors, on the other hand, report not only aggregate valuesfor all processes but also physical property measurements thatcannot be associated with a PID, such as CPU thermal dissipation.
6 LibEC was implemented in C++ and is distributed under the GNU General PublicLicense (GPL) version 3.0 or later [59].

hi
rag
saCsmha
st–vse
pi
bo
ttCp
eaprtsp[(
gmeap
Miivitv
P
re
The library enables new sensors to be created and added, butere we describe those that are provided by default when explain-
ng the types of sensors that the library supports.Application/machine-level sensors. At least one application-
elated variable is required to estimate the energy that anpplication consumes. LibEC provides PID-related sensors thatather both application and machine-level information.
As CPU, memory, and disk are often the most power-consumingerver components, information on their usage is required tochieve good power models. For such one can exploit Performanceounters, CPU time, CPU elapsed time and CPU usage. Furthermore,ensors of memory usage and disk reads/writes can be used foremory and disk modelling, respectively. The sensors described
ere exploit PCs to obtain the counts between two updates, whichre user defined.
CPU usage (CPU%) is a sensor that comprises two intermediateensors, namely CPU time and Elapsed CPU time, that provide respec-ively the total CPU time – i.e. the sum of the system and user times
and the CPU time difference between two updates. CPU% pro-ides the percentage of CPU that a PID or CPU core utilises. Thisensor uses the elapsed CPU time divided by the machine-level CPUlapsed time, i.e. the total elapsed time.
Memory usage (MEM%) is the percentage of memory that a givenrocess uses. It collects an application’s resident set size and divides
t by the total available memory.Disk Read/Write provides the number of bytes read/written
etween function calls for any file partition stored on flash drivesr a hard drive.
Machine-level sensors. In addition to application-level sensorshat collect machine information related to a process, LibEC con-ains sensors that gather device data, such as CPU temperature,PU frequency, and network traffic, that is not associated with arocess.
The library provides interfaces to wattmeters that allow it tomploy PDUs that monitor power consumption directly as wells a component that exploits ACPI information to estimate theower that a portable device consumes. The ACPI Power Meteretrieves the current and voltage drained by the battery fromhe /sys/class/power directory and computes its power con-umption. The communication with PDUs depends on the vendor’srotocol. We provide interfaces to some of Grid5000’s wattmeters47], the RECS system [60], and Energy Optimisers Limited’s Ploggan outlet adapter to measure the power dissipated by devices).
Application power estimators. The library enables users to inte-rate new power estimators. Currently, a static and two dynamicodels are available to demonstrate this feature. Static mod-
ls require a priori information, whereas dynamic models canuto-adapt to different workloads, but must be calibrated by aowermeter.
The simplest static model is CPU proportional, where CPUinMax is a linear estimator based on the minimum (Pmin) and max-
mum (Pmax) power consumption of a machine. This informations user-provided. It uses a CPU usage sensor to weight the powerariance and the number of active processes (|AP|) to normalise thedle power (Pmin) for each process as stated in the following equa-ion. This estimator is architecture dependent, and its performancearies according to the accuracy of the user-provided data.
pid = (Pmax − Pmin) × tpidcpu
tcpu + tidl+ Pmin
|PRt |
When available, a wattmeter is used to achieve more preciseesults or to calibrate models for machines that do not have a pow-rmeter. The Inverse CPU power estimator uses information on the
Fig. 10. ectop command line interface.
total power consumption of a computer and attributes it to appli-cations using a CPU usage sensor as stated below
Ppid = PPM × tpidcpu
tcpu
Linear regression is a well-known method for achievingdynamic estimators by weighting pre-defined sensors and findinga model without user-provided information. The Linear RegressionDynamic Power Estimator estimates the weights (wi) for any appli-cation level sensor (si) within the following equation:
Ppid = w0 +n∑
i=1
wi ∗ si
4.4.1. Results and lessons learntOver time, the tool has demonstrated to be a useful asset that
other work can leverage. LibEC has been used to implement severalsolutions, such as a power monitoring tool, an application energyprofiler, and dynamic power estimators. It has helped us gaininsights on the advantages and limitations of monitoring powerconsumption and trying to correlate information with performancecounters. The following describes some of the solutions based onLibEC.
Power monitoring tool. The Energy Consumption MonitoringTool (ectop) is a command line application conceived to provide aneasy way to monitor power estimators and compare their accuracyin real time. A user can keep track of the top consuming processesand add/remove application level sensors and power estimators.
Fig. 10 shows an example of ectopwith three sensors (CPU use,memory use, and disk I/O) and a power estimator (min-max CPUproportional, PE MMC). The ectop monitor shows a sum bar foreach sensor’s column, which presents its system-wide values. Forthe presented scenario the sum of the power estimations is largerthan the value given in the power field. The power field is fed bythe ACPI power estimator. This difference occurs due to the qualityof the power estimator in use. As stated earlier, LibEC is a library fordeveloping estimators that can be used for building other models.
Application energy profiling. Valgreen is an application energyprofiler [61] that uses LibEC to assist a programmer in implementingenergy efficient algorithms by sampling the power consumptionof a given application in small time steps. These time steps maybe configured; the smaller the step, the more precise the energymeasurement.
Dynamic power estimators. Auto-generated models have beenwidely used for application power estimation. This use case com-pares a dynamic model that is updated through linear regression inregular time intervals with a simple static model. These dynamic

Fs
mdwl
pitsg
4
dmwK
4
(Nnsw(
btovoreb
tsaltsab
ig. 11. Comparison between a wattmeter, an adaptive model (CPU ADAPT) and atatic model (CPU MINMAX).
odels do not need any user input and can run with differentevices. The idea is to show the importance of a dynamic modelhen the workload on the machine changes and our model is no
onger valid.Fig. 11 presents a comparison of a dynamic model, the actual
ower measured with a wattmeter, and a static model configuredn another machine. Over time the adaptive model approaches tohe actual dissipated power while the static one diverges. Here wehow the total power consumption of the machine, but the sameoes with the power consumed by each process.
.4.2. Ongoing and future workFuture work on ectop library includes the integration of new
ynamic power models, in particular, those constructed usingachine learning techniques [62]. We also plan to integrate otherattmeters, probably by interfacing with other tools such as thewapi presented in Section 4.1.
.5. BEMOS
The Energy Benchmarking, Monitoring and Statistics SystemBEMOS) is a platform designed by Poznan Supercomputing andetworking Center to manage and monitor large-scale heteroge-eous server infrastructure and environmental parameters of aerver room. The system integrates sensors from multiple tools,hich are synchronised with the BEMOS Network Time Protocol
NTP) server to ensure data consistency over time.The system architecture, depicted in Fig. 12, relies on a Graphite
ackend server [63]. A circular-buffer database, similar in designo RRDs, stores the time-series data collected from multiple typesf sensors. The database assumes a pre-specified number of storedalues thus “wrapping around” after some time to overwrite theldest data. The values are also aggregated over time, trading accu-acy for collecting data over longer periods of time. Values fromach sensor are stored in its database file. Their size is specifiedefore the beginning of the experiments and does not change.
The solution is designed to handle large numbers of numericime-series data, like dozens of performance metrics from thou-ands of servers. It scales horizontally and is fault tolerant, avoidingsingle point of failure. Data aggregation does not allow for calcu-
ating accurate metrics over extended periods of time. Therefore,
he Statistics module was designed to collect data over pre-pecified time periods and store it in a relational database. Statisticsnd graphs can be created from this data using R environment [64]efore the data is sent to the Graphite server.Fig. 12. The architecture of the BEMOS platform.
In addition to monitoring, BEMOS is used for server manage-ment; e.g. executing benchmarks on servers for further monitoring.The management module allows creating configuration files thatdefine the automatic execution of specific applications and serverson which they run, sequentially or in parallel.
The system allows collecting information from sensors of mul-tiple types and producers. An abstraction layer between sensorsand the database allows independence from sensor implementa-tion details. A module for obtaining measurements must be createdto pool the sensor and send the data to the Graphite service. Sen-sors are not necessarily physical devices. A software-defined sensorcan monitor various metrics including processor load, the numberof active users, parameters of running applications such as FLOPSdatabase transactions. Thus, BEMOS also enables monitoring appli-cations and services.
Measurements from sensors can be taken at configurable timeintervals and granularity. The sensors currently deployed in ourinfrastructure take measurements every 1 or 5 s, depending on theuser requirements. The system also allows for specifying rules withactions to execute if certain anomalies arise (e.g. send an e-mail ifthe temperature exceeds a given threshold).
A module for estimating the power server consumes [65]enables gathering power data of servers without wattmeters orservers with low-precision wattmeters. The module can calculatethe power usage of a machine under any load at runtime based onthe analysis of performance counters. Training data is used for agiven server to create a model. The execution of pre-selected appli-cations is monitored under multiple conditions, during which thefollowing parameters are observed: CPU frequency; P-State volt-age table; values from multiple CPU-related performance counters(PeC) such as number of instructions, cycles, branches and CPUcache counters including loads, load misses, stores, pre-fetches;and memory-related counters such as number of performed bustransactions. Power usage values of the whole server are retrievedsimultaneously. The power meter is only used once to collect thetraining data.
The model is created using linear regression where the accu-racy criterion is the adjusted R-squared value. As many variablesshow non-linear correlation with machine power consumption, anappropriate transformation is automatically established so that lin-ear regression could use these variables. The algorithm chooses
among no transformation, logarithmic, and square root. The choiceis made based on the comparison of R-squared values of modelswith different transformations applied to the analysed variable.Once the model is created, it can serve as a sensor in the BEMOS
pbf
cfpbmftpd
4
i
•
•
•
•
4
pni
•
•
•
•
Baecspa
chd
latform and be used to estimate in real-time the power consumedy a server under any load. The overhead on the processor resultedrom calculating the values for the model is negligible.
Results are presented either directly in the interactive graphi-al interface accessible via Web browser and based on the Djangoramework. It provides interactive, easily editable graphs, with theossibility to extensively adapt charts for user’s purposes. The com-ination of Graphite with Grafana also gives the opportunity toanipulate the collected series with a set of predefined functions,
or instance taking the average of multiple series, or the deriva-ive of one of the series concerning time. This opportunity enableserforming fast and easy prototyping and seeking for patterns andependencies within the collected datasets.
.5.1. Design goalsBEMOS addresses the following main challenges related to mon-
toring large-scale systems:
It combines computing systems’ power usage measurement datawith infrastructure measurements and environmental parame-ters such as temperature, air flow, humidity, and others.It can efficiently monitor multi-layered systems (with differentlevels of detail) that generate large amounts of monitoring datawith varying accuracy.It enables monitoring computing systems where the density is toohigh to install individual sensors and collect precise information.It allows to disaggregate coarse-grained data into smaller, moredetailed information, e.g. by defining virtual temperature sensorsusing an infrared camera, and by power usage estimations basedon application characteristics.
.5.2. Results and lessons learntBEMOS system was successfully deployed at Poznan Supercom-
uting and Networking Center to gather energy data from a largeumber of sensors. The available sensors are currently the follow-
ng:
Sensors at the level of a single server: processor load, proces-sor/GPU temperature, processor/memory/GPU power, memoryusage, network card usage, disk usage, air temperature, the veloc-ity at the air inlet and outlet, temperature of the liquid in case ofliquid-cooled servers.Sensors at the level of the room: temperature of the air from theair conditioner, the temperature of the room, the power drawnby all servers, humidity of the air in the room.Thermal imaging camera that allows monitoring larger areas,such as multiple servers; at the same time, it is possible to accu-rately select specific points in the thermal image and retrievevalues of temperature from them over time.Power data from intelligent PDUs that collect consumption infor-mation from multiple connected servers.
The accuracy of the Estimation module was also analysed.ased on the experiments performed on some commodity serversvailable on the market despite the architectural differences ofvaluated machines and various characteristics of tested appli-ations, the results were very stable and reliable, with the meanquare error within 4% [65]. Fig. 13 presents the real and estimatedower consumption of a server while running Make application onn Intel processor.
From these experiences, we learnt that the presented system isapable of efficiently collecting significant amounts of data frometerogeneous sensors. The drawback of this solution is that moreetailed information is lost over longer periods of time, something
Fig. 13. Power consumption estimation while running Make application.
that the Statistics module tries to compensate by enabling deeperanalyses over shorter executions.
4.5.3. Ongoing and future workFuture work will consist in implementing further capabilities
regarding intelligent management of analysed resources. Based oncollected data the system may take automatic decisions to reduceenergy consumption further.
4.6. Summary of the solutions
In this section, we examine the aforementioned solutions forenergy monitoring of large-scale computing systems and reviewwhich challenges each solution addresses. This review aims at com-paring functionality supported by the tools so as to know theirfeatures and to give a general overview of the design goals andtrends followed.
As shown in Table 3, most challenges stated in Section 3 areeither fully or partially addressed by the tools. Regarding chal-lenges C1 and C3, we observe that they are moderately tackledby all tools at different levels. Hence, supporting large-scale pro-filing and monitoring and providing feedback to the end-user areimportant requirements. Nevertheless, for challenge C1 we noticethat some of the tools do not offer support for profiling applications(C1.2-C1.3), and services are not fully scalable (C1.4). Similarly, chal-lenge C3 is not fully addressed by all solutions, as some of them donot offer interactive graphical interfaces (C3.2). Focusing on chal-lenge C2, we detect that providing models for simulating energyconsumption was not directly tackled by the tools (C2.1), but theycan be integrated with simulation tools (C2.2). The main reason isthat models go one step ahead of power monitoring as they firstrequire profiling and tracing capabilities. Therefore, KWAPI, EMLand PMLib, need extra solutions or frameworks to derive properpower and energy models. Finally, we detect that challenge C4 wasaddressed by all tools. Thanks to their modular design, extendingthese tools with other measurement sources does not imply hugeefforts.
5. Gap analysis and future directions
This section first discusses two large-scale system scenariosand then describes a list of topics that deserve attention from theresearch community. The first scenario illustrates the needs of largeHadoop setups that mostly run on data centres and clouds. Asdiscussed in previous work [3], unification of HPC and big data ana-lytics is required to address challenges in data processing in majorresearch domains. The second scenario considers highly distributed
services that, in addition to services hosted at traditional data cen-tres and clouds, are increasingly making use of the Internet edges;something often referred to as edge or fog computing.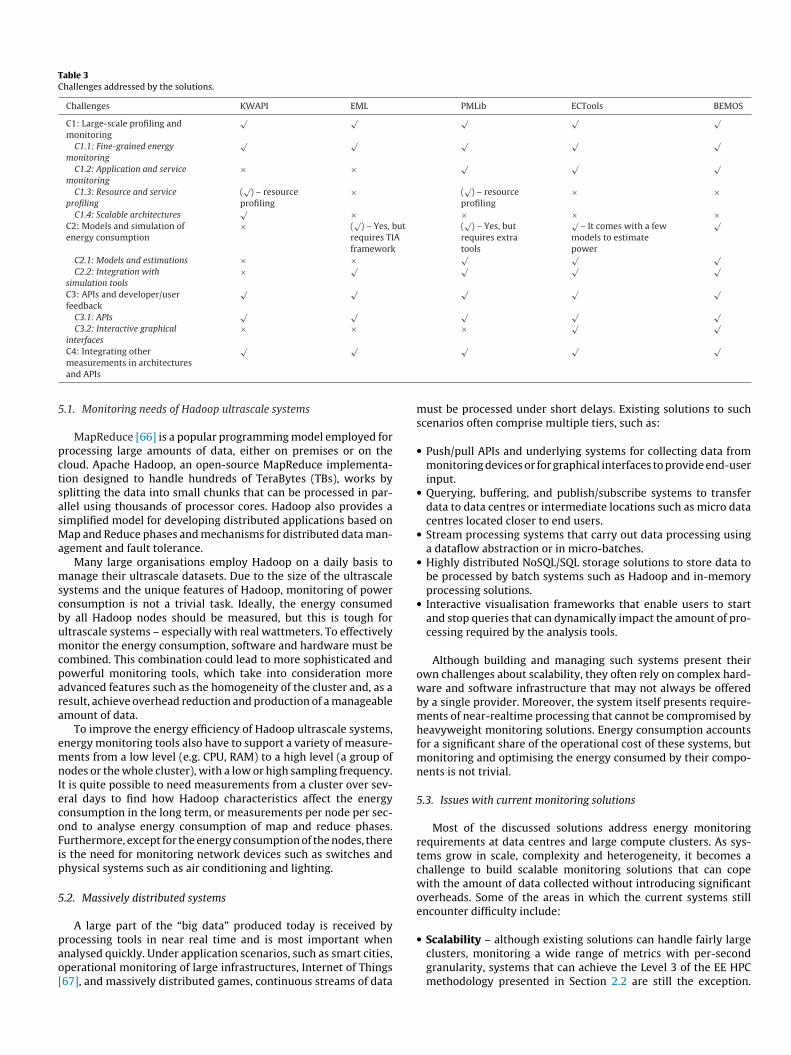
Table 3Challenges addressed by the solutions.
Challenges KWAPI EML PMLib ECTools BEMOS
C1: Large-scale profiling andmonitoring
√ √ √ √ √
C1.1: Fine-grained energymonitoring
√ √ √ √ √
C1.2: Application and servicemonitoring
× × √ √ √
C1.3: Resource and serviceprofiling
(√
) – resourceprofiling
× (√
) – resourceprofiling
× ×
C1.4: Scalable architectures√ × × × ×
C2: Models and simulation ofenergy consumption
× (√
) – Yes, butrequires TIAframework
(√
) – Yes, butrequires extratools
√– It comes with a few
models to estimatepower
√
C2.1: Models and estimations × × √ √ √C2.2: Integration with
simulation tools× √ √ √ √
C3: APIs and developer/userfeedback
√ √ √ √ √
C3.1: APIs√ √ √ √ √
C3.2: Interactive graphicalinterfaces
× × × √ √
√ √ √ √ √
5
pctsasMa
mscbumcpara
emnIecoFip
5
pao[
C4: Integrating othermeasurements in architecturesand APIs
.1. Monitoring needs of Hadoop ultrascale systems
MapReduce [66] is a popular programming model employed forrocessing large amounts of data, either on premises or on theloud. Apache Hadoop, an open-source MapReduce implementa-ion designed to handle hundreds of TeraBytes (TBs), works byplitting the data into small chunks that can be processed in par-llel using thousands of processor cores. Hadoop also provides aimplified model for developing distributed applications based onap and Reduce phases and mechanisms for distributed data man-
gement and fault tolerance.Many large organisations employ Hadoop on a daily basis to
anage their ultrascale datasets. Due to the size of the ultrascaleystems and the unique features of Hadoop, monitoring of poweronsumption is not a trivial task. Ideally, the energy consumedy all Hadoop nodes should be measured, but this is tough forltrascale systems – especially with real wattmeters. To effectivelyonitor the energy consumption, software and hardware must be
ombined. This combination could lead to more sophisticated andowerful monitoring tools, which take into consideration moredvanced features such as the homogeneity of the cluster and, as aesult, achieve overhead reduction and production of a manageablemount of data.
To improve the energy efficiency of Hadoop ultrascale systems,nergy monitoring tools also have to support a variety of measure-ents from a low level (e.g. CPU, RAM) to a high level (a group of
odes or the whole cluster), with a low or high sampling frequency.t is quite possible to need measurements from a cluster over sev-ral days to find how Hadoop characteristics affect the energyonsumption in the long term, or measurements per node per sec-nd to analyse energy consumption of map and reduce phases.urthermore, except for the energy consumption of the nodes, theres the need for monitoring network devices such as switches andhysical systems such as air conditioning and lighting.
.2. Massively distributed systems
A large part of the “big data” produced today is received by
rocessing tools in near real time and is most important whennalysed quickly. Under application scenarios, such as smart cities,perational monitoring of large infrastructures, Internet of Things67], and massively distributed games, continuous streams of datamust be processed under short delays. Existing solutions to suchscenarios often comprise multiple tiers, such as:
• Push/pull APIs and underlying systems for collecting data frommonitoring devices or for graphical interfaces to provide end-userinput.
• Querying, buffering, and publish/subscribe systems to transferdata to data centres or intermediate locations such as micro datacentres located closer to end users.
• Stream processing systems that carry out data processing usinga dataflow abstraction or in micro-batches.
• Highly distributed NoSQL/SQL storage solutions to store data tobe processed by batch systems such as Hadoop and in-memoryprocessing solutions.
• Interactive visualisation frameworks that enable users to startand stop queries that can dynamically impact the amount of pro-cessing required by the analysis tools.
Although building and managing such systems present theirown challenges about scalability, they often rely on complex hard-ware and software infrastructure that may not always be offeredby a single provider. Moreover, the system itself presents require-ments of near-realtime processing that cannot be compromised byheavyweight monitoring solutions. Energy consumption accountsfor a significant share of the operational cost of these systems, butmonitoring and optimising the energy consumed by their compo-nents is not trivial.
5.3. Issues with current monitoring solutions
Most of the discussed solutions address energy monitoringrequirements at data centres and large compute clusters. As sys-tems grow in scale, complexity and heterogeneity, it becomes achallenge to build scalable monitoring solutions that can copewith the amount of data collected without introducing significantoverheads. Some of the areas in which the current systems stillencounter difficulty include:
• Scalability – although existing solutions can handle fairly largeclusters, monitoring a wide range of metrics with per-secondgranularity, systems that can achieve the Level 3 of the EE HPCmethodology presented in Section 2.2 are still the exception.

•
•
•
•
5
bhattFaeto
tshaervt
v
Ultrascale systems can pose additional scalability issues to solu-tions that already struggle to handle current scenarios.Monitoring overhead – monitoring solutions should not incursignificant costs on the monitored system. Although efforts havebeen made to reduce the overhead introduced my energy mon-itoring of large clusters, as the software systems increasinglypresent near-realtime processing requirements, the overheadintroduced by existing monitoring solutions can become an issue.Data management – similar to many systems that have to handlelarge amounts of data, energy monitoring can become a so-calledbig-data system as not only power consumption information iscollected, but also information on resource usage and other vari-ables with which information is correlated during analysis. Thisscenario can be exacerbated by the fact that administrators, engi-neers, and decision makers are increasingly willing to performpredictive and prescriptive data analyses using interactive inter-faces. These analyses can require adjusting data collection andmonitoring metrics on demand. Current solutions fall short ofsupporting such use patterns.Scalable architectures – monitoring solutions should be able toscale horizontally, allowing administrators to add more capacityon demand. Existing solutions try to cope with scalability chal-lenges and responsiveness by adding dedicated hardware to hostand execute the monitoring solution. The size of such dedicatedinfrastructure is often statically defined based on the expectedmonitoring needs, which may, in turn, make the monitoring sys-tem a large energy consumer. Architectures that can cope withthe monitoring load and adjust allocated capacity on demand arepreferable, but still not an ordinary reality.Power consumption models – the use of power models can helpreduce the number of required monitored devices and samplerates when resources across a cluster are statistically similar,which is the case of several Hadoop settings. However, as theheterogeneity of large-scale systems grows and services makeincreasing use of equipment at the Internet edge, it becomes morecomplicated to build accurate energy models for a large spectrumof devices. Moreover, many software systems are deployed onvirtual machines and lightweight containers, whose individualenergy consumption is often difficult to determine. Present solu-tions do not offer systematic means to build and include suchmodels in monitoring systems.
.4. Future directions
The measurement and monitoring overhead should be kept to aare minimum to cope with ultrascale systems. Application andardware energy profiles should also scale to millions of coresnd consider large virtualised infrastructures that make use ofechniques such as lightweight containers. As previously men-ioned, monitoring systems could exploit specialised hardware (e.g.PGAs) to reduce the delay of gathering data and making it avail-ble to APIs and visualisation interfaces. In addition to specialisedquipment, monitoring architectures could exploit lightweight vir-ualisation to achieve horizontal scalability and elasticity, avoidingver-provisioning compute resources to monitor tasks.
Flexible programming techniques that can enable developerso adjust the monitoring granularity and intervals dynamically forpecific periods depending on the monitoring system workload canelp reduce its overhead and improve scalability. Also concerningrchitectures, scalability and data management can be enhanced bymploying multilayered approaches where individual elements areesponsible for a subset of the infrastructure. Such method can pre-
ent transferring large amounts of monitoring information acrosshe network still storing the data if required.Work carried out by designers of monitoring systems, andisualisation should be intertwined to allow for adjusting data col-
lection and management processes dynamically, based on insightsthat a user or service designer may gain while interacting with avisualisation tool. At present, there is still a gap between the twocommunities that should be bridged. We also envision an increas-ing use of machine learning techniques, such as deep learning [68],not only for understanding how a large system consumes energybut also for building sophisticated models of power consumptionand for managing ultrascale systems.
6. Conclusions
As USSs join parallel and distributed computing systems thatwill be two to three orders of magnitude larger than today’s infras-tructure, fine-grained monitoring of the power consumed by theirunderlying IT resources can be challenging. In this work, we sur-veyed state of the art on energy monitoring of large-scale systemsand methodologies for monitoring the power consumed by largesystems. We discussed some of the challenges towards monitoringand improving the energy efficiency of USSs.
Previous work often extrapolates energy measurements of largesystems. Extrapolations can lead to variations of up to 20% due tomeasurement timing and 10-15% due to insufficient sample sizes[36]. There is a need for high-quality levels of measurement andpower-monitoring infrastructure that can provide timely and accu-rate feedback to system developers and application writers so thatthey can optimise the energy use [41].
Many challenges must be addressed to significantly reducethe energy consumption and enable fine-grained measurement incomplex and large-scale systems. Appropriate architectures mustbe investigated to allow monitoring to provide sufficiently detailedinformation and avoid communication bottlenecks. This architec-ture should enable, through carefully designed communication andinterfaces, accessing fine-grained measurement data when andwhere needed. As the use of hardware measurement devices forall components of USS could cause communication bottlenecks andhigh additional costs, accurate estimation methods would be veryuseful. The overall energy consumption also depends on environ-mental parameters such as temperature, air/liquid flow, humidity,cooling system power usage, among other factors. Hence, effectiveintegration of these measurements is an important part of moni-toring.
Acknowledgements
This work was carried out by members of the Energy EfficiencyWorking Group of the Nesus European COST Action IC1305. It waspartly funded by the European Commission under contract 288701through the project CoolEmAll and supported by the French Fondsnational pour la Société Numérique (FSN) XLCloud project. Someresults discussed in this paper were carried out using the Grid5000experimental testbed, being developed under the Inria ALADDINdevelopment action with support from CNRS, RENATER and severalUniversities as well as other funding bodies (see https://grid5000.fr).
References
[1] M.D. de Assuncao, R.N. Calheiros, S. Bianchi, M.A.S. Netto, R. Buyya, Big datacomputing and clouds: trends and future directions, J. Parallel Distrib.Comput. 79–80 (0) (2015) 3–15, http://dx.doi.org/10.1016/j.jpdc.2014.08.003.
[2] K. Bergman, S. Borkar, D. Campbell, W. Carlson, W. Dally, M. Denneau, P.Franzon, W. Harrod, K. Hill, J. Hiller, et al., Exascale Computing Study:
Technology Challenges in Achieving Exascale Systems, Defense AdvancedResearch Projects Agency Information Processing Techniques Office (DARPAIPTO), Tech. Rep. 15, 2008.[3] D.A. Reed, J. Dongarra, Exascale computing and big data, Commun. ACM 58 (7)(2015) 56–68, http://dx.doi.org/10.1145/2699414.

[
[
[
[
[
[
[[
[
[
[
[
[
[
[
[[
[
[
[[
[
[
[
[[[
[
[
[
[
[
[
[
[
[
[
[
[
[
[
[
[
[
[
[
[[
[
[4] L.A. Barroso, U. Hölzle, The case for energy-proportional computing,Computer 40 (12) (2007) 33–37, http://dx.doi.org/10.1109/MC.2007.443.
[5] A.-C. Orgerie, M.D.d. Assuncao, L. Lefevre, A survey on techniques forimproving the energy efficiency of large-scale distributed systems, ACMComput. Surv. (CSUR) 46 (4) (2014) 47.
[6] A. Kulseitova, A.T. Fong, A survey of energy-efficient techniques in cloud datacenters, in: 2013 International Conference on ICT for Smart Society (ICISS),IEEE, 2013, pp. 1–5.
[7] R. Bolla, R. Bruschi, F. Davoli, F. Cucchietti, Energy efficiency in the futureinternet: a survey of existing approaches and trends in energy-aware fixednetwork infrastructures, IEEE Commun. Surv. Tutor. 13 (2) (2011) 223–244,http://dx.doi.org/10.1109/SURV.2011.071410.00073.
[8] K. Krauter, R. Buyya, M. Maheswaran, A taxonomy and survey of grid resourcemanagement systems for distributed computing, Softw.: Pract. Exp. 32 (2)(2002) 135–164.
[9] M. Bagein, J. Barbosa, V. Blanco, I. Brandic, S. Cremer, S. Fremal, H. Karatza, L.Lefevre, T. Mastelic, A. Oleksiak, A.-C. Orgerie, G. Stavrinides, S. Varrette,Energy efficiency for ultrascale systems: challenges and trends from Nesusproject, Supercomput. Front. Innov. 2 (2) (2015) 105–131 http://superfri.org/superfri/article/view/48.
10] S. Benedict, Energy-aware performance analysis methodologies for HPCarchitectures – an exploratory study, J. Netw. Comput. Appl. 35 (6) (2012)1709–1719.
11] A. Noureddine, R. Rouvoy, L. Seinturier, A review of energy measurementapproaches, SIGOPS Oper. Syst. Rev. 47 (3) (2013) 42–49.
12] C.-H. Hsu, S.W. Poole, Power measurement for high performance computing:state of the art, International Green Computing Conference and Workshops(IGCC) (2011) 1–6.
13] D. Hackenberg, T. Ilsche, R. Schöne, D. Molka, M. Schmidt, W.E. Nagel, Powermeasurement techniques on standard compute nodes: a quantitativecomparison, International Symposium on Performance Analysis of Systemsand Software (ISPASS) (2013) 194–204.
14] T. Mastelic, A. Oleksiak, H. Claussen, I. Brandic, J.-M. Pierson, A.V. Vasilakos,Cloud computing: survey on energy efficiency, ACM Comput. Surv. 47 (2)(2014), 33:1–33:36.
15] P3 International. Kill a Watt Product Page. http://www.p3international.com/products/p4400.html.
16] Watt’s Up Meters: Watt’s Up Product Page. https://www.wattsupmeters.com/.17] R. Ge, X. Feng, S. Song, H.C. Chang, D. Li, K.W. Cameron, Powerpack: energy
profiling and analysis of high-performance systems and applications, IEEETrans. Parallel Distrib. Syst. 21 (5) (2010) 658–671.
18] J. Flinn, M. Satyanarayanan, Powerscope: a tool for profiling the energy usageof mobile applications, 2nd IEEE Workshop on Mobile Computing Systemsand Applications (WMCSA ’99) (1999) 2–10.
19] G. Da Costa, J.-M. Pierson, L. Fontoura Cupertino, Mastering system and powermeasures for servers in datacenter, Sustain. Comput.: Inform. Syst. 15 (2017)28–38, http://dx.doi.org/10.1016/j.suscom.2017.05.003.
20] D. Bedard, M.Y. Lim, R. Fowler, A. Porterfield, Powermon: fine-grained andintegrated power monitoring for commodity computer systems, IEEESoutheastCon 2010 (SoutheastCon) (2010) 479–484.
21] J.H. Laros, P. Pokorny, D. DeBonis, Powerinsight – a commodity powermeasurement capability, International Green Computing Conference (IGCC)(2013) 1–6.
22] Arm Limited: Arm Energy Probe. http://ds.arm.com/ds-5/optimize/arm-energy-probe/.
23] S. Ryffel, Lea2p – The Linux Energy Attribution and Accounting Platform(Master’s thesis), Swiss Federal Institute of Technology (ETH), Zurich,Switzerland, 2009.
24] D. Hackenberg, T. Ilsche, J. Schuchart, R. Schöne, W.E. Nagel, M. Simon, Y.Georgiou, Hdeem: High definition energy efficiency monitoring, in:International Workshop on Energy Efficient Supercomputing (E2SC), IEEEPress, 2014, http://dx.doi.org/10.1109/e2sc.2014.13.
25] Linux Man-Pages Project: Perf Event Open(2), 2013.26] S. Browne, J. Dongarra, N. Garner, G. Ho, P. Mucci, A portable programming
interface for performance evaluation on modern processors, Int. J. HighPerform. Comput. Appl. 14 (3) (2000) 189–204.
27] Sandia National Laboratories: High Performance Computing PowerApplication Programming Interface (API) Specification. http://powerapi.sandia.gov/.
28] A. Cabrera, F. Almeida, J. Arteaga, V. Blanco, Energy measurement library(eml) usage and overhead analysis, 23rd Euromicro International Conferenceon Parallel, Distributed, and Network-Based Processing (2015) 554–558,http://dx.doi.org/10.1109/PDP.2015.120.
29] HDEEM Library Reference Guide, Tech. Rep., Bull Atos Technologies, 2016.30] Y. Georgiou, T. Cadeau, D. Glesser, D. Auble, M. Jette, M. Hautreux, Energy
accounting and control with SLURM resource and job management system,in: Distributed Computing and Networking – 15th International Conference,ICDCN 2014, Coimbatore, India, January 4–7, 2014. Proceedings, 2014, pp.96–118.
31] Spec Power and Performance Benchmark Methodology v2.1. https://www.spec.org/power/.
32] D. Hackenberg, R. Schöne, D. Molka, M.S. Müller, A. Knüpfer, Quantifyingpower consumption variations of HPC systems using SPEC MPI benchmarks,Comput. Sci. Res. Dev. 25 (3) (2010) 155–163.
33] T.R. Scogland, C.P. Steffen, T. Wilde, F. Parent, S. Coghlan, N. Bates, W.-c. Feng,E. Strohmaier, A power-measurement methodology for large-scale,
[
[
high-performance computing, in: 5th ACM/SPEC International Conference onPerformance Engineering, ICPE’14, ACM, New York, USA, 2014, pp. 149–159,http://dx.doi.org/10.1145/2568088.2576795.
34] http://www.top500.org/.35] http://www.green500.org/.36] T. Scogland, J. Azose, D. Rohr, S. Rivoire, N. Bates, D. Hackenberg, Node
variability in large-scale power measurements: Perspectives from thegreen500, top500 and eehpcwg, in: International Conference for HighPerformance Computing, Networking, Storage and Analysis, SC’15, ACM, NewYork, USA, 2015, pp. 74:1–74:11.
37] M.E.M. Diouri, O. Glück, L. Lefèvre, J.-C. Mignot, Your cluster is not powerhomogeneous: take care when designing green schedulers!, in: IGCC – 4thIEEE International Green Computing Conference, Arlington, United States,2013, https://doi.org/10.1109/IGCC.2013.6604506.
38] M.E.M. Diouri, M.F. Dolz, O. Glück, L. Lefèvre, P. Alonso, S. Catalán, R. Mayo,E.S. Quintana-Ortí, Assessing power monitoring approaches for energy andpower analysis of computers, Sustain. Comput. Informat. Syst. 4 (2) (2014)68–82, Special Issue on Selected papers from EE-LSDS2013 Conference.
39] Y.C. Hu, M. Patel, D. Sabella, N. Sprecher, V. Young, Mobile edge computing: Akey technology towards 5G, in: Whitepaper ETSI White Paper No. 11,European Telecommunications Standards Institute (ETSI), 2015.
40] J. Mair, Z. Huang, D. Eyers, Manila: using a densely populated PMC-space forpower modelling within large-scale systems, 45th International Conferenceon Parallel Processing Workshops (ICPPW 2016) (2016) 210–219, http://dx.doi.org/10.1109/ICPPW.2016.41.
41] K. Yoshii, K. Iskra, R. Gupta, P. Beckman, V. Vishwanath, C. Yu, S. Coghlan,Evaluating power-monitoring capabilities on ibm blue gene/p and bluegene/q, 2012 IEEE International Conference on Cluster Computing (2012)36–44.
42] J. Davey, F. Mansmann, J. Kohlhammer, D. Keim, The Future Internet,Springer-Verlag, Berlin, Heidelberg, 2012, pp. 93–104, Ch. Visual Analytics:Towards Intelligent Interactive Internet and Security Solutions.
43] R. Kosara, J. Mackinlay, Storytelling: the next step for visualization, Computer46 (5) (2013) 44–50.
44] D. Fisher, R. DeLine, M. Czerwinski, S. Drucker, Interactions with big dataanalytics, Interactions 19 (3) (2012) 50–59.
45] F. Rossigneux, L. Lefevre, J.-P. Gelas, M. Dias De Assuncao, A generic andextensible framework for monitoring energy consumption of openstackclouds, in: The 4th IEEE International Conference on Sustainable Computingand Communications (Sustaincom 2014), Sydney, Australia, 2014 https://hal.inria.fr/hal-01094387.
46] F. Clouet, S. Delamare, J.-P. Gelas, L. Lefèvre, L. Nussbaum, C. Parisot, L.Pouilloux, F. Rossigneux, A unified monitoring framework for energyconsumption and network traffic, in: TRIDENTCOM – InternationalConference on Testbeds and Research Infrastructures for the Development ofNetworks & Communities, Vancouver, Canada, 2015, p. 10 https://hal.inria.fr/hal-01167915.
47] R. Bolze, F. Cappello, E. Caron, M. Daydé, F. Desprez, E. Jeannot, Y. Jégou, S.Lantéri, J. Leduc, N. Melab, G. Mornet, R. Namyst, P. Primet, B. Quetier, O.Richard, E.-G. Talbi, T. Iréa, Grid’5000: a large scale and highly reconfigurableexperimental GRID testbed, Int. J. High Perform. Comput. Appl. 20 (4) (2006)481–494.
48] P. Hintjens, ZeroMQ: Messaging for Many Applications, O’Reilly Media,Sebastopol, USA, 2013.
49] F. Almeida, J. Arteaga, V. Blanco, A. Cabrera, Energy measurement tools forultrascale computing: a survey, Supercomput. Front. Innov. 2 (2) (2015).
50] D. Martinez, J. Cabaleiro, T. Pena, F. Rivera, V. Blanco, Accurate analyticalperformance model of communications in MPI applications, in: 23rd IEEEInternational Symposium on Parallel and Distributed Processing, IPDPS 2009,Rome, Italy, May 23–29, 2009, 2009, pp. 1–8, http://dx.doi.org/10.1109/IPDPS.2009.5161175.
51] A.C. Pérez, F. Almeida, J. Arteaga, V.B. Pérez, Measuring energy consumptionusing EML (energy measurement library), Comput. Sci. R&D 30 (2) (2015)135–143, http://dx.doi.org/10.1007/s00450-014-0269-5.
52] F. Almeida, V.B. Pérez, A.C. Pérez, J. Ruiz, Modeling energy consumption formaster-slave applications, J. Supercomput. 65 (3) (2013) 1137–1149.
53] A.C. Pérez, F. Almeida, V.B. Pérez, D. Giménez, Analytical modeling of theenergy consumption for the high performance linpack, PDP, IEEE ComputerSociety (2013) 343–350.
54] F. Almeida, V.B. Pérez, I. Gonzalez, A.C. Pérez, D. Giménez, Analytical energymodels for MPI communications on a sandy-bridge architecture, in: ICPP, IEEEComputer Society, 2013, pp. 868–876.
55] S. Barrachina, M. Barreda, S. Catalán, M.F. Dolz, G. Fabregat, R. Mayo, E.S.Quintana-Ortí, An Integrated Framework for Power-Performance Analysis ofParallel Scientific Workloads, 2013, pp. 114–119.
56] M.F. Dolz, https://github.com/mdolz/PMLib.57] M. Barreda, S. Catalán, M.F. Dolz, R. Mayo, E.S. Quintana-Ortí, Automatic
detection of power bottlenecks in parallel scientific applications, FourthInternational Conference on Energy-Aware High Performance Computing,Comput. Sci. Res. Dev. 29 (3–4) (2013) 221–229.
58] L.F. Cupertino, G.D. Costa, A. Sayah, J.-M. Pierson, Energy Consumption
Library, Springer Berlin Heidelberg, Berlin, Heidelberg, 2013, pp. 51–57.59] L.F. Cupertino, Energy Consumption Tools Web-Page, 2013 https://www.irit.fr/georges.da-costa/ectools.tgz.
60] Christmann, Description for Resource Efficient Computing System (RECS),2009.

[
[
[[
[
[66] http://hadoop.apache.org/.[67] L. Atzori, A. Iera, G. Morabito, The internet of things: a survey, Comput. Netw.
61] L. Fontoura Cupertino, G. Da Costa, A. Sayah, J.-M. Pierson, Valgreen: anapplication’s energy profiler, International Journal of Soft Computing andSoftware Engineering, SCSE’13 Conference, vol. 3, no. 3 (2013), http://dx.doi.org/10.7321/jscse.v3.n3.83.
62] L. Fontoura Cupertino, Modeling the Power Consumption of Computing
Systems and Applications Through Machine Learning Techniques (Ph.D.thesis), Université Paul Sabatier, Toulouse, France, 2015 (Defence on July 17,2015).63] https://github.com/graphite-project/graphite-web.64] https://www.r-project.org/.
[
65] M. Jarus, A. Oleksiak, T. Piontek, J. Weglarz, Runtime power usage estimationof HPC servers for various classes of real-life applications, Future Gen.Comput. Syst. 26 (2014) 299–310.
54 (15) (2010) 2787–2805.68] I. Arel, D.C. Rose, T.P. Karnowski, Deep machine learning – a new frontier in
artificial intelligence research, IEEE Comput. Intell. Mag. 5 (4) (2010) 13–18.


![eia_936environmental impact assessment study report towards construction of office block 2[1].pdf](https://img.pdfslide.us/doc/110x75/55cf9b9d550346d033a6bda9/eia936environmental-impact-assessment-study-report-towards-construction-of.jpg)