Embed Size (px)
Citation preview

ENERGY MARKET INVESTIGATION A report for the Competition and Markets Authority by GfK NOP.
Prepared by: Nick Moon/David Rodgers/Sarah McHugh Date: Issue:
February 2015 Final

2
Table of Contents
1 Executive Summary .................................................................................................................. 1
2 Background and Research Objectives ................................................................................... 4
3 Research Design ....................................................................................................................... 5 3.1 Sampling 5 3.2 Questionnaire development 5 3.3 Fieldwork 5 3.4 Analysis 6 3.5 Definitions: 6 3.6 Statistical reporting conventions 7
4 Survey Findings ........................................................................................................................ 8 4.1 Customer Profile from survey data 8 4.2 Consumer attitudes 10 4.3 Questionnaire structure for the switching process 12 4.4 Overview of energy market 13 4.5 Market Engagement 15 4.5.1 Switching behaviour in different markets 15 4.5.2 Sales attempts from other energy suppliers 15 4.5.3 Consumer engagement in the energy market 18 4.5.4 Shopping around for an energy supplier 23 4.5.5 Switching in the energy market 24 4.6 Satisfaction with energy supplier and likelihood to recommend 28 4.7 Choice Drivers 33 4.8 Triggers for market engagement 37 4.9 Potential barriers to market engagement 39 4.9.1 Awareness of options available to customers 39 4.9.2 Barriers to changing tariff 40 4.9.3 Barriers to considering switching 42 4.9.4 Barriers to shopping around 46 4.9.5 Ease of shopping around 50 4.9.6 Barriers to switching supplier 53 4.9.7 Overall summary 57 4.10 Consumer confidence 58 4.10.1 Confidence in current deal/tariff 58 4.10.2 Confidence in making the right decision if changing energy supplier 59 4.10.3 Confidence in using the internet/PCWs 60 4.11 Engagement experience 64 4.11.1 Shopping experience 64 4.11.2 Switching experience 69 4.11.3 Savings when switching 71 4.11.4 Customer service when switching 75

1
1 Executive Summary
Background
1. The Competition and Markets Authority (CMA) has been investigating the Energy Market. As part of the inquiry the CMA commissioned GfK NOP to undertake a research exercise to help understand how consumers view the energy market.
2. The survey was designed to be representative of all domestic mains gas and mains electricity customers. Complete customer records were provided by the parties, and from these a sample was drawn, with oversampling of smaller regions and smaller suppliers. Advance letters were sent out to sampled customers
3. A questionnaire was developed in consultation between GfK and the CMA, and this was tested in cognitive interviewing and a pilot survey before a final questionnaire was agreed. Telephone interviews, averaging 20 minutes each, were conducted with 6,999 customers. Data were weighted to correct for differential probabilities of selection, and to mitigate for differential non-response.
Findings
Engagement/Switching
4. There is a relatively low level of engagement in the energy market. Although three quarters of customers (76%) are aware that it is possible for them to change tariff with their current supplier, and more than four fifths (89%) know they could change to a new energy supplier, the proportion who actually have switched is much lower. A quarter (27%) have switched supplier in the last three years, whilst just under a fifth (17%) had switched more than three years ago but a third (34%) have not even considered switching.
5. Where people have engaged with the market as at least potential switchers they predominantly did so in order to save money, with almost half of those who shopped around saying they did so in order to save money (47%). When it came to actually making a switch, cost was an even more important driver, with 83% citing cost/tariff as a reason for choosing a particular energy supplier. Dissatisfaction with current service provision was not a significant driver of either looking around (7% gave it as a reason) or switching (13% cited it). Indeed the second most common answer given as to why people looked around was that they were just curious, or did so for no particular reason: 22% said this. Dissatisfaction with the current supplier in terms of quality and reliability of service was the second most common reason for switching, but with just 13% saying this it was a long way behind the 83% who changed for cost reasons.
6. Those who thought that switching is possible were generally confident that they would be able to make the correct decision if they were to switch supplier: 29% were very confident and a further 41% fairly confident, with only 8% not confident at all.
7. Those who said they switched for cost reasons were asked how confident they were that they would save money, and the vast majority (93%) were confident, with 50% very confident and 43% fairly confident. They were also asked how much they had expected to save; a fifth (19%) said they expected to save between £100-£149 whilst a quarter (23%) expected to save between £150-£249, However, a quarter (26%) of those who said they switched because they expected to save money didn’t know how much they expected so save. Amongst those who switched supplier because of price reasons the mean expected saving was £174. Nearly three

2
fifths (59%) of those who had switched for price reasons and were able to estimate the amount they expected to save reported they had made the expected saving.
Barriers
8. Satisfaction with current tariff and general apathy tended to be the two most frequently given reasons by those consumers who did not even consider switching supplier. Around two in five of those who thought it was possible to switch supplier but had never considered doing so said they had not switched supplier for cost/tariff reasons (46%) and in particular as their current tariff was satisfactory (41%); whilst more than a quarter (27%) were put off switching supplier because the process of searching and switching to an alternative was seen as arduous. It should be noted that cost/tariff reasons were significantly more likely to be mentioned by those with no internet access (52%) compared with those who had internet access (44%).
9. Trust is also an issue concerning the energy market in general. Consumers’ trust in their own energy supplier is far higher at 62% than their level of trust in other energy suppliers at only 27%, and this may be a powerful barrier to change for those who are uncertain about the benefits of switching.
Shopping around
10. In similar vein, the most frequently mentioned barriers to shopping around by those who had not done so were again linked to the perception that the process of searching for alternatives takes too long (37%) and requires too much effort (23%). Many consumers do not feel the likely gain justifies the time/effort involved in shopping around, nearly three quarters (73%) of customers who had considered switching but had not shopped around agreed that switching is a “hassle I do not have time for” (56% agreed on average). These consumers are generally more pessimistic when compared to those who have switched. They are more likely to think there is no real difference between suppliers (41% c.f. 33%) and that things will go wrong if they switch (57% c.f. 33%).
11. Given the perception mentioned above that the searching process would take too long, it is relevant to see how long it actually took for those who did look around. Consumers who checked their existing usage or tariff spent around three hours researching this (189 minutes on average) and a similar amount of time was taken finding out information and comparing other suppliers with their own (164 minutes on average).
12. When shopping around consumers tend to look at both the major six and minor suppliers. Two thirds (66%) of those who had shopped around in the last three years had looked at both types of suppliers, but more than a quarter (27%) had only looked at the major six suppliers. Lack of awareness was the biggest single reason for not looking at smaller suppliers – almost a third (30%) of those who had only looked at the major six suppliers said that they were not aware of the smaller suppliers – but there were substantive objections as well. There were three factors each mentioned by around one in ten: that looking at smaller suppliers was too much extra effort/time (12%), there was uncertainty or a risk about customer service (11%) or that they did not come up on the price comparison website (11%). But there is a clear majority who would not rule out a smaller supplier, with only one in three (30%) saying they think it is either essential or very important that their supplier is large or an established brand. Consumers who had switched suppliers in the last three years were less likely to think that being a large established brand was either essential or very important compared to those who had not switched within the last three years (19% c.f. 34%).

3
Information
13. Despite the perceptions of those who had not looked around, looking for information was seen by the majority of those who had shopped around in the last three years as easy with more
than three quarters saying it was easy to find out information about their own energy use (79%) or find information about other suppliers (77%). Consumers found that the most difficult task when shopping around was understanding and making comparisons between available options. Around a third found it difficult to understand the options available (30%), and/or to make comparisons between them (36%).
14. Similarly, those who had shopped around in the last three years generally found the overall task of shopping around to be fairly easy – just under a quarter (23%) found it difficult, and almost two in three (64%) found it easy. Amongst those aged 65 or over (29%) and those who were struggling financially (27%) the proportion who felt this task was difficult was significantly higher than the average (23%). In addition households on a standard variable tariff (25%) were more likely when compared with those on a fixed tariff (21%) to say that the task of shopping around had been difficult.
15. The difficulty of making comparisons also came up in a more general question, whether those who had shopped around in the past three years disliked anything about it. A quarter (25%) said they didn’t dislike anything in particular but a further quarter mentioned each of not understanding the tariffs or finding them difficult to compare (28%), and of the process taking too long/not having enough time (24%).
Price Comparison Websites
16. Price comparison websites (PCWs) are a key source of information in the shopping process, with nearly three in four (71%) of those who had shopped around for energy in the last three years saying they used a PCW as an information source the last time they did so. Usage of a PCW was highest amongst 18-64 year-olds (75%), those with qualifications (74%), owners and private renters (73%), those with dual fuel supplier (73%) and those who earn £18,000 or more (78%).
17. However, while most of those who shop around use PCWs, they do not necessarily trust PCWs to help them find the right deal. This is not simply the result of any lack of confidence about using the internet, in general, or about using the internet to make price and quality comparisons – there are specific concerns about PCWs in the energy market. Seven in ten (70%) are confident about “using the internet to search for information about suppliers of different products or services in general” but considerably fewer (55%) are confident that they could “get the right deal for your energy supply using a price comparison website.
18. Consumers seem to blame the PCWs themselves for this lack of confidence, more than any lack of ability of their own in using them. Of those who are not confident that they would get the best energy deal through using a PCW the biggest single reason given was that they didn’t trust or believe the PCW (43%), with the proportion who blamed complexity being next (at 26%) and 13% don’t think PCWs include prices from all suppliers. However, 16% did cite the fact that they had never used PCWs and/or wouldn’t know what to do.

4
2 Background and Research Objectives
19. On 26th June 2014 OFGEM referred the GB energy market to the CMA. As part of the investigation the CMA commissioned GfK NOP to undertake a research exercise to help understand how consumers interacted with the energy market. In particular the research was required to help understand:
Searching and switching – the incidence of searching and switching both between suppliers and within suppliers (e.g. switching tariffs) and the outcomes of decisions (e.g. were savings made).
Drivers of behaviour:
awareness of who their supplier(s) is/are, the tariffs to which they subscribe and the right to switch,
triggers for searching and switching, information available to and used by domestic customers and approach to
the assessment of information, expectations and experience in relation to the gains to be had from switching
and the risks and costs associated with doing so, and the decision making process.
Role and use of price comparison and cashback sites.
Customer characteristics – how drivers, behaviours and outcomes vary by customer attitudes, and demographics.

5
3 Research Design
3.1 Sampling 20. The aim of the research was to represent all households in GB with either one or both of mains
electricity and mains gas. To ensure as wide a coverage as practicable, all the six major energy companies were asked to supply their full domestic customer lists to GfK for sampling purposes, as were four of the most prominent minor suppliers: Cooperative Energy, First Utility, Ovo, and Utility Warehouse.
21. To allow for cases with invalid or out of date contact details and anticipated levels of response, a total sample of 105,000 was drawn to achieve a target of 7,000 completed interviews. The energy companies then supplied more detailed energy usage data for all the sampled cases for analysis purposes.
22. Full details of the sample design can be found in the Technical Report.
3.2 Questionnaire development 23. The first draft of the questionnaire was produced by GfK after a meeting with CMA, discussing
the main aims of the survey and the amount of information that could be collected within the 20 minute telephone survey.
24. In order to gain a complete understanding of how consumers decided whether or not to switch supplier it was important that the questionnaire covered three aspects of the process and they are: considered switching, shopping around and the actual switching. This process was not however viewed as a continuum as it was recognised that consumers could fall out of the switching process at any stage, switch without shopping around or even consider switching in cases where the contact was supplier driven. Further details are provided in section 4.3.
25. The initial draft was refined over several iterations, and was then tested in a cognitive pilot stage before proceeding to a full-scale pilot study of 55 interviews.
26. Following the pilot, discussions were held between CMA and GfK to resolve any remaining problems that emerged during the pilot interviewing, and a further series of amendments was made to the questionnaire to produce the version for use in main fieldwork (included as Appendix B of the Technical Report).
3.3 Fieldwork 27. Interviewing began on 30 September and continued until 17 November 2014. All interviewers
were briefed before starting work.
28. All sample members were sent an advance letter on CMA letterhead (included as Appendix C of the Technical Report) before being called.
29. In the end a total of 98,873 cases were loaded into the SMS, and a total of 7,001 interviews
were conducted. Two respondents decided after being interviewed that they did not wish their answers to be kept, so they were removed from the data before analysis, and the final number of interviews included in the dataset was thus 6,999.

6
30. These 6,999 interviews represent a response rate of 9.8%, once non-valid numbers and ineligible cases are excluded.
3.4 Analysis 31. The first stage of the analysis was the back-coding of “other answers” at open precoded
questions where there had been a high proportion of other answers.
32. Weights were applied to correct for differential probabilities of selection, and to attempt to correct for differential non-response between different types of consumer..
33. A specification for the computer tables, involving cross-analysis of survey response against other survey responses and additional data supplied by the energy companies about the respondents’ tariff and usage details, was agreed between CMA and GfK NOP.
34. Standard statistical tests of significance were carried out, and the tables show all differences significant at the 95% level. Only differences significant at the 95% level are commented upon in this report.
35. Once the tables had been checked an SPSS data file was produced for the CMA.
3.5 Definitions: 36. Within the report we have used a number of terms which require definitions. These are listed
below:
Priority Services Register – this is a scheme which offers extra free services to people who
are of pensionable age, disabled or chronically sick or who are on means tested benefits with children under the age of 5 years old.
Warm home discount – this is a scheme to give £140 to households who claim the Guarantee Credit element of pension credit
Vulnerability indicator – flagged as vulnerable on the supplier’s database Major 6 supplier – British Gas/Centrica/Scottish Gas, E.ON, EDF Energy, RWE Npower,
Scottish Power and SSE Minor suppliers – OVO Energy, First Utility, Co-Operative Energy and the Utility Warehouse
37. Within this report we comment on cross-analysis of survey response by other variables. Most of
these are variables derived from the survey questionnaire, but a small number are variables from the data provided by the energy companies. The following variables commented on in the report come from supplier data:
Warm home discount,
On the priority service register,
Vulnerability indicator,
Type of tariff: Fixed v Standard Variable.

7
3.6 Statistical reporting conventions 38. In this report the following statistical conventions are followed:
Sample sizes shown are the unweighted base sizes The data referred to in the report and shown in the charts is weighted Don’t know responses are excluded from the charts unless >2% Differences between sub-groups are only discussed if statistically significant at the 95%
confidence level Bases refer to all answering the question denotes a significant positive difference denotes a significant negative difference. If
total bar present denotes difference to total otherwise to relevant sub-group.

8
4 Survey Findings
4.1 Customer Profile from survey data
39. Because the sample is of energy decision-makers its demographic make-up differs in some ways from the population as a whole. The sample contains slightly more men than the wider population (52% c.f. 48%) and has an understandably older age profile. The age profile was older than the equivalent national population, with just a fifth (19%) aged under 35 years old, compared with 29% of the whole population, reflecting that some in this younger age group are not energy decision-makers (still in full-time education, living at home with parents etc.).
40. As one would expect, the tenure profile matched very closely that of the population as a whole, with two thirds (64%) being in owner-occupation, and 15% each being social and private renting. Nearly a third were occupied by either social renters or private renters.
The great majority (83%) had access to the internet either at home, through work or via mobile phones. This is almost exactly the same as the latest ONS estimate
Figure 1: Demographic profile
52%
48%
0%
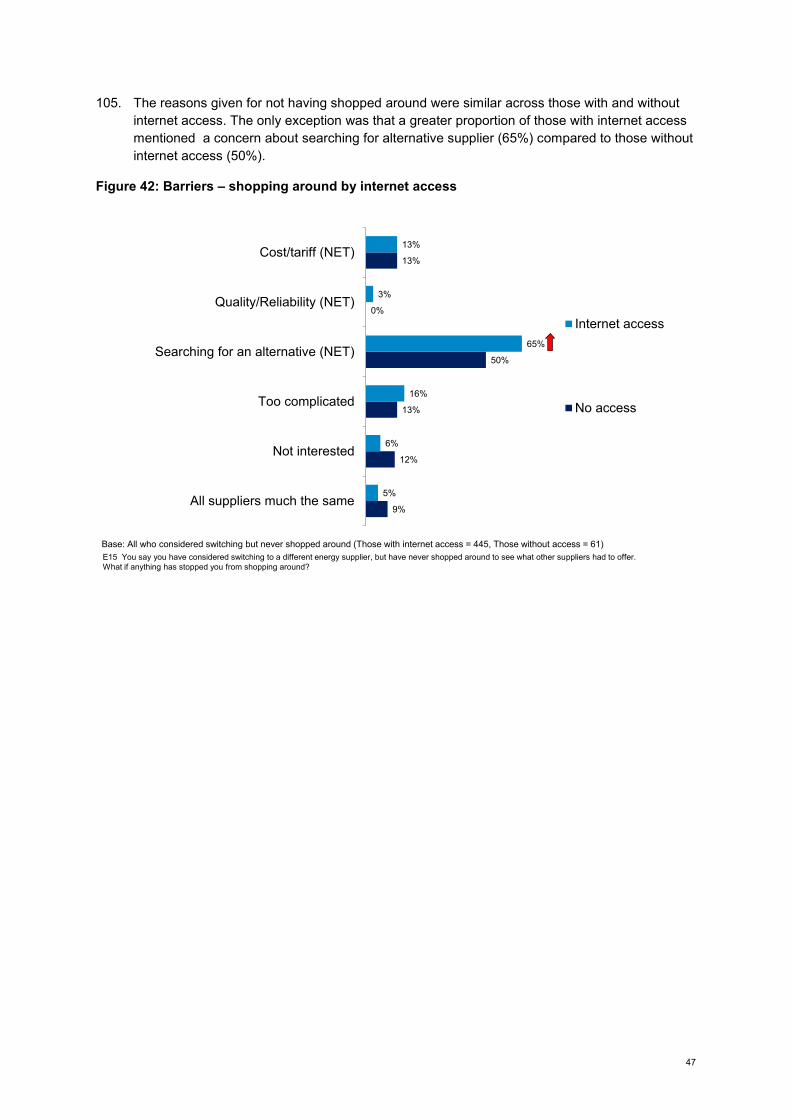
50%
100%
Female
Male
19%
37%
14%
30% 65+
55-64
35-54
18-34
64%
15%
15%
6%
Other
Socialrent
Privaterent
Owner-occupier
Household tenureAge of respondentGender of
respondent
Base: All (6,999)
K2 Record gender of respondent K1 What is your age K5 Do you have access to the internet at home, work, or via a mobile phone?
83%
17%
No
Yes
Access to internet

9
41. Nearly three quarters of households (72%) had their gas and electricity supplied by one provider, just under one in ten had separate suppliers for gas and electricity, and one in seven households (17%) only had electricity (no mains gas supply).
42. More than a half (57%) of households were on a standard variable tariff with most of the remainder (38%) on a fixed tariff.
43. The most common form of payment type was direct debit (73%).
Figure 2: Energy supply of household
44. Nearly a quarter (23%) of respondents had been living at their current address for less than three years, a quarter (26%) had lived there for more than three years but for less than 10 years whilst a half (50%) had lived there for more than 10 years.
38%
57%
2%3%
OtherMixVariableFixed
73%
14%
9%
Pre-payment
Credit
Direct debit
Payment typeTariff
Base: All (6,999)
72%
4%5%
15%
0%
50%
100%
Electricity only
Two suppliers -gas
Two suppliers -electricity
Gas andElectricity - onesupplier
Supply type


15
4.5 Market Engagement 4.5.1 Switching behaviour in different markets
57. Looking at switching behaviour in the energy and other markets, on average consumers had
switched supplier in 2 out of the 5 categories we asked about. Half (53%) of those with car insurance had changed supplier whilst a quarter had switched Energy (27%); a similar level to Mobile Phone Network (24%).
58. Familiarity with switching providers generally is an important driver of energy switching. Those who had switched energy provider in the last three years were much more likely to have switched provider in other markets, compared with those who had not switched energy supplier.
Figure 10: Switched supplier in different markets in the last 3 years
4.5.2 Sales attempts from other energy suppliers 59. Those who had been contacted by another energy supplier (43% of the total sample) were
asked when this last happened. Nearly two thirds of those contacted (63%) had been contacted within the last year and nearly a third (30%) had been contacted within the last three months.
60. The contact method used varied but a half (50%) of those contacted by another energy supplier had been contacted by telephone, whilst more than a quarter (28%) reported that a sales representative came to their door. The following vulnerable groups were much more likely to have had a sales representative come to their door:
12%
12%
24%
27%
52%
Current account
Mortgage
Mobile phone network provider
Energy
Car insurance
Base all who have each product/service
I1. In which if any of the following have you changed supplier within the last three years? If you don’t have one of these please say so.
Base: All who have each product/service (Mobile phone = 6,497, Car insurance = 5,600, Current account = 6,456, Mortgage = 3,670, Energy = 6,999) | Switched energy (2,338), not switched energy (4,572)
72%
53%
27%
46%
0%
50%
100%
Not switched inother market
Switched inother market(s)
Switched energy
Have not switched energy supplier in last 3 years

16
those in social rented housing (38%), warm home discount (37%), those with no qualifications (34%), those on the vulnerable register (32%).
Figure 11: Experience of those contacted by another supplier
61. All those who had been contacted by another supplier were asked whether they were offered a better deal by the other supplier. A fifth (20%) said they had been offered a better deal, two fifths (43%) said they did not offer them a better deal and more than a third (37%) were uncertain as to whether the deal was better or not.
62. One in ten (12%) of those who had been contacted by another supplier had switched supplier
as a result, and this rose to nearly a half (47%) amongst those who had been offered a better deal.
E7 You said you had been contacted by an energy company suggesting you switch supplier. When was the last time this happenedr? E8 How did they contact you?
50%
28%
19%
6%
5%
30%
16%
17%
20%
13%
5%
0%
50%
100%
Don't know
> 3 years
within 3 years
within a year
within 6 months
within 3 months
When last contacted How contacted
Base: All who have been contacted by another supplier (3,340)

17
Figure 12: Reaction to deal offered by other suppliers
E9 Did they offer you a deal that looked better than from your existing supplier or was their deal no better? E10 Did you switch to that energy supplier after they contacted you, or not?
20%
43%
37%
0%
50%
100%
Don't know
No
Yes
12%
88%
0%
50%
100%
No
Yes
Whether other supplier offered a better deal
Whether switched to other supplier
Base: All who have been contacted by another supplier (3,340)

18
4.5.3 Consumer engagement in the energy market 63. Around a third (34%) of consumers had either thought that switching was not possible (5%) or
had never considered switching (29%). More than two in five (44%) had ever switched supplier, more than a quarter (27%) had switched supplier in the last three years whilst fewer than a fifth (17%) had switched more than three years ago. A further fifth had either shopped around but not switched (12%) or considered switching but did not shop around (9%).
Figure 13: Energy market engagement
E2 The next question is about things you and your household have ever done in connection with your energy supply. E13 Have you ever considered switching to another energy supplier (for your {textfill fuel type}?
5%
29%
17%
9%
12%
27%
0%
50%
100%
Have switched within the last 3 years
Shopped around but not switched
Considered but not shopped around
Switched more than 3 years ago
Not considered switching
Switching not thought possible
Base: All (6,999)Figures calculated from two questions E2/E13

19
64. The proportion who had not considered switching supplier increased to more than half for those with no qualifications (54%). Around two fifths of those aged 65 years or above (43%) social renters (44%) and those who were struggling financially (38%) had not considered switching and all groups were more likely than average to have not considered switching.
Figure 14: Energy market engagement by demographics
33%43% 44%
54%
38%
17%
21% 14%
16%
15%
9%
7%9%
7%
9%
12%
9%11%
6%
11%
27%19% 21% 16%
25%
0%
50%
100%
Total Aged 65+ Social Rent Noqualifications
Financiallystruggling
Switched within last3yrs
Shopped around withinlast 3yrs
Considered but notshopped around
Switched more than 3years ago
Not considered
Base: All (Total = 6,999, Aged 65+ = 1,913, Social rent = 842, No qualifications = 901, Financially struggling = 2,586)
2% of the sample is not
included within the
above codes

20
65. Consumer attitudes towards shopping influenced levels of engagement with the energy market, particularly the inclination to shop around. A higher proportion of those who are loyal to a brand (36%), don’t have time to shop around (39%), often makes decisions on impulse (41%) and don’t like to shop around (55%), and had never considered switching energy supplier.
Figure 15: Energy market engagement by general attitudes
33% 38%23%
31% 32%
17%17%
15%16% 18%
9%6%
17% 7%11%
12% 12%13% 15%
10%
27% 25% 29% 31% 28%
0%
50%
100%
Total Trust own energycompany
Don't trust ownenergy company
Trust other energycompanies
Don't trust otherenergy companies
Switched within last 3yrs
Shopped aroundwithin last 3 yrs
Considered but notshopped around
Switched more than 3years ago
Not considered
Base: All (Total = 6,999, Trust own energy company = 4,415, Don’t trust own energy company = 1,002, Trust other energy companies = 1,932 , Don’t trust other energy companies = 1,849)

21
66. Consumer attitudes towards the energy market influenced their levels of engagement and their inclination to switch providers. A higher proportion of those who say they don’t take an active interest in energy (46%), there was no difference on price (40%), switching is a hassle (40%) and worry switch might go wrong (39%) had never considered switching energy supplier.
Figure 16: Energy market engagement by energy attitudes
33%40% 46% 40% 39%
17%
19%17%
18% 18%9%
8%10%
11% 10%12%
12%8% 11% 13%
27%19% 18% 18% 18%
0%
50%
100%
Total No difference onprice
Don't take activeinterest in energy
Switching is ahassle
Worry switchmight go wrong
Switched within last 3 yrs
Shopped around withinlast 3 yrs
Considered but notshopped around
Switched more than 3years ago
Not considered
Base: All (Total = 6,999, No difference on price = 3,032, Don’t take an active interest in energy = 1,285, Switching is a hassle = 3,642 , Worry switch might go wrong = 3,327)

22
67. Levels of engagement in the energy market reflect levels of trust in energy companies. Households who trusted their own energy company were more likely to have not considered switching supplier than households who do not trust their own energy company (38% c.f. 23%). Those who trusted other energy companies were more likely than those who do not trust other energy companies to have shopped around but not switched (15% c.f. 10%).
Figure 17: Energy market engagement by trust in energy companies
33% 38%23%
31% 32%
17%17%
15%16% 18%
9%6%
17% 7%11%
12% 12%13% 15%
10%
27% 25% 29% 31% 29%
0%
50%
100%
Total Trust own energycompany
Don't trust ownenergy company
Trust other energycompanies
Don't trust otherenergy companies
Switched within last 3yrs
Shopped aroundwithin last 3 yrs
Considered but notshopped around
Switched more than 3years ago
Not considered
Base: All (Total = 6,999, Trust own energy company = 4,744, Don’t trust own energy company = 1,188, Trust other energy companies = 2,078 , Don’t trust other energy companies = 2,003)

23
68. Household factors such as tariff type and internet access were also influential. More than a third (37%) of households who were on a standard variable tariff had never considered switching energy supplier compared with only a quarter (23%) of those on a fixed tariff. Three fifths (59%) of households with no internet access had not considered switching supplier compared with around a quarter (28%) of households who had internet access.
Figure 18: Energy market engagement by tariff type/internet access
4.5.4 Shopping around for an energy supplier
69. Fewer than half (47%) of all households had ever shopped around for their energy supply. All
households who had previously shopped around were asked when this had last taken place. Just over two in three (68%) had shopped around within the least year; and 42% had done so within the last 6 months. One in ten (9%) had last shopped around more than three years ago.
70. A third (33%) of those who had shopped around in the last three years had done so on three or
more occasions, whilst similar proportions had done so once (28%) or twice (29%).
33% 37%23% 28%
59%
17%18%
14%17%
16%
9%10%
5%
9%
5%
12%12%
12%
14%
4%27%20%
44%30%
13%
0%
50%
100%
Total Variable tariff Fixed tariff Internet No internet
Switched within last 3yrs
Shopped around withinlast 3 yrs
Considered but notshopped around
Switched more than 3years ago
Not considered
Base: All (Total = 6,999, Variable tariff = 3,976, Fixed tariff = 2,673, Internet = 5,956, No internet = 1,039)

24
Figure 19: Shopping behaviour
71. The frequency of shopping around varied by tariff type and switching experience in other
markets. Those on a fixed tariff (40%) were much more likely than those on a standard variable tariff (28%) to have shopped around on three or more occasions during the last three years. Similarly, those who had switched in two or more markets apart from energy were much more likely to have shopped around frequently (three or more times) in the energy market (41%) compared with those who had switched in only one other market (31%) or had not switched in any other market (27%).
72. Looking specifically at those who had shopped around, but not within the last three years (7%), a higher proportion were evident in specific sub-groups:
those on a warm home discount (23%),
no qualifications (14%),
the vulnerable (12%),
those aged 65 years or more (12%).
4.5.5 Switching in the energy market 73. Just under half (44%) of all households had ever switched their energy supplier with just over a
quarter (25%) doing so within the last three years.
74. All those who had ever switched energy supplier were asked when was the last time they had switched. Just over a quarter (28%) had done so within the last year, representing 13% of the total sample. Tariff type was a factor in how long ago households had switched supplier, nearly half (48%) of households on a fixed tariff had switched within the last year compared with less
E17 When was the last time that you shopped around (for your {textfill fuel type}? E16 How many times have you shopped around to compare the pros and cons of different energy suppliers (for your {textfill fuel type}) in the last three years?
28%
29%
33%
7%3%
0%
50%
100%
Don't know
Have not shoppedaround in last 3 yrs
3+
2
1
42%
27%
15%
4%
9%
0%
50%
100%
> 3 years ago
Within 3 years
Within 2 years
Within a year
Within 6 months
When last shopped around –(47% of total sample)
No. times shopped around in last three years
Base: All who have ever shopped around (3,299)

25
than a fifth (18%) of those on a standard variable tariff. Nearly half (47%) of those on a standard variable tariff had switched supplier more than three years ago (c.f. 25% on a fixed tariff).
75. Of those who had switched energy supplier within the last three years after shopping around, nearly two in three (61%) had only switched supplier once. Households who were on a standard variable tariff (67%) were much more likely to have only switched supplier once in the last three years when compared with households on a fixed tariff (54%).
Figure 20: Switching behaviour
76. The profiles of switchers in the last three years and non-switchers were very different.
Switchers tended to be younger, educated to degree level and either own their property outright or on a mortgage. Non-switchers tended to be older, have no qualifications, live in rented accommodation and be less well off financially. The table below shows the proportion of each sub-group who are switchers/non-switchers
Switchers (27% overall) Non-switchers (72% overall)
18-44 years old (32%) Degree (32%) Owned outright/mortgage (29%)
65 years or more (79%) No qualifications (82%) Renters – private/social (77%) Income of less than £18,000 (77%) Standard variable tariff (78%)
77. All those who thought it was possible to switch energy supplier were asked how likely they were
to do so in the next three years, using a five-point “Very likely” to “Not very likely” scale.
E30 When was the last time that you switched to a different energy supplier? E31 How many times in the last three years have you switched to a different supplier (for your {textfill fuel type} after shopping around?
61%
22%
11%
6%
0%
50%
100%
DK
3+
2
1
28%
17%
11%
39%
4%
0%
50%
100%
DK
> 3 years ago
Within 3 years
Within 2 years
Within a year
When last switched (3,654) No. times switched in last three years after shopping around
Base: E30 - All who have ever switched (3,654). E31 - All who have switched in the last three years after shopping around (2,223)
13% of all respondents had switched within
the last year

26
Opinions were divided with similar proportions reporting they were likely (45%) as unlikely to switch (41%).
Figure 21: Likelihood of switching supplier in the future
78. Groups who were more unlikely than average (41%) to switch in the future were:
65+ years (61%),
those with no qualifications (65%),
those who had lived at the address for 10 years + (49%),
those with disabilities (57%),
those on low incomes (53%),
households on a standard variable tariff (45%).
23%
22%
11%
18%
24%
3%
0%
50%
100%
Don't know
Very unlikely
Fairly unlikely
Neither
Fairly likely
Very likely
F1 How likely is it that you will consider switching your supplier for {textfill fuel type} in the next three years? Base: All who think it is possible to switch supplier (6,949)

27
79. Previous experience of switching energy supplier was a factor in how likely households were to say they would switch in the future. Two thirds (67%) of households who had previously switched said that they were likely to switch again in the future compared with just over a third (37%) of households who had not previously switched supplier.
Figure 22: Likelihood of switching supplier in the future by whether have switched within the last 3 years
45%
67%
36%
11%
9%
12%
41%
22%
49%
3% 2% 3%
0%
50%
100%
Don't know
Very/fairly unlikely
Neither
Very/Fairly likely
Total Switched supplier in last 3
years
Have not switched supplier in the last 3
years
F1 How likely is it that you will consider switching your supplier for {textfill fuel type} in the next three years? Base: All (6,999), Switchers (2,338), Non-switchers (4,522)


32
86. All households who were dissatisfied with their energy supplier were asked why they were dissatisfied, with answers captured spontaneously. Cost and quality of service /reliability were the two most frequently mentioned reasons for dissatisfaction. Two in three identified cost related reasons for their dissatisfaction; a third (36%) said their existing tariff was expensive, whilst more than a fifth (22%) said they had received a very high bill. Quality and reliability comments were mentioned by just under two thirds of dissatisfied households, principally poor service from existing supplier (47%) and problems with bills (27%)
Figure 28: Reasons for dissatisfaction with energy supplier
C3/6/9. Why are you dissatisfied with your current supplier?
8%
6%
12%
27%
47%
63%
9%
15%
22%
36%
66%
Other (NET)
Switching (NET)
Prepayment meter problems e.g. settings, faults, use
Problems with bills
Poor service from existing supplier
Quality/Reliabilty (NET)
Price increase announcement
Problems with direct debit
Received very high bill
Existing tariff expensive
Cost/tariff (NET)
Base: All who were dissatisfied with their energy supplier (647)

33
4.7 Choice Drivers
87. All households were asked what would be most important to them when choosing a supplier for mains gas or electricity, with responses captured spontaneously. Nearly three quarters (73%) of all households first response to this question was related to the cost or tariff. No other factor was mentioned to any great extent, the second most frequently given response being the quality and reliability of the service (14%). It is worth noting that the first top of mind response given by respondents is usually an indicator of what is the most important factor.
Figure 29: Factors considered when choosing a supplier – first mentions
88. Cost or tariff were less likely than average (73%) to be mentioned first as the most important aspect of choosing a supplier by the following:
on the priority service register (69%),
in social rented accommodation (67%),
carers (67%),
a vulnerable indictor (65%),
living with someone with a disability (64%),
aged 65 or more (63%),
with no qualifications (62%),
receiving a warm home discount (62%).
6%
1%
2%
1%
2%
3%
1%
13%
14%
1%
69%
73%
Don't know
Nothing specific
Other (NET)
Additional features/services of existing supplier (NET)
Good reputation
Existing supplier characteristics (NET)
Get accurate/useful/informative/clear bills on time
Good quality service
Quality/Reliability (NET)
Payment options
Cost/tariff/price/rate
Cost/tariff (NET)
D1. When choosing a supplier for mains gas or electricity people take all sorts of things into account. What would be most important to you?
Base: All (6,999)
First mentions only

34
89. After the initial response to the question about what was most important to them when choosing an energy supplier, interviewers probed further to find out what else was important. The chart below shows the combined answers (first and other mentions). Whilst cost or tariff again receives most mentions, after probing quality and reliability reasons come to the fore. The fact that this is only evident after probing indicates that cost factors are the most important in this market.
Figure 30: Factors considered when choosing a supplier – all mentions
6%
1%
7%
4%
7%
12%
7%
50%
53%
5%
81%
84%
Don't know
Nothing specific
Other (NET)
Additional features/services of existing supplier (NET)
Good reputation
Existing supplier characteristics (NET)
Get accurate/useful/informative/clear bills on time
Good quality service
Quality/Reliability (NET)
Payment options
Cost/tariff/price/rate
Cost/tariff (NET)
D1. When choosing a supplier for mains gas or electricity people take all sorts of things into account. What would be most important to you?
Base: All (6,999)
All mentions

35
90. Having captured responses spontaneously, we then asked respondents to rate how important a number of reasons for choosing an energy supplier were to them, using a four-point “Essential/Very important/Fairly important/Not important” scale. The chart below shows the proportion rating each feature as essential or very important. Good customer service (83% essential/very important), simple/easy to understand tariffs (78%) and cheap tariff rate (78%) were the three most important factors to customers. At the next level down in terms of importance were payments based on actuals not estimated usage (66%) and tariffs tailored to your energy usage or circumstances (61%). Only a minority thought that being a large established brand (30%), providing a range of other services such as boiler maintenance (25%) or the supplier providing a smart meter (24%) were essential or very important.
Figure 31: Importance of factors when considering a supplier – prompted rating
91. Overall fewer consumers who had switched supplier in the last three years said that the energy
company being a large established brand was either essential or very important when choosing a supplier than when compared with those who had not switched within the last three years (19% c.f. 34%).
7%
8%
9%
20%
23%
28%
29%
32%
17%
17%
21%
41%
43%
50%
49%
51%
Supplier provides smart meter
Range of other services available such as boilermaintenace
Large supplier/established brand
Tariffs tailored to your energy usage or circumstances
Payments based on actuals not estimated usage
Cheap tariff rate
Simple/easy to understand tariffs
Good customer service
Essential Very important
D2. I am going to read out a number of reasons why people choose an energy supplier. For each of these I’d like you to tell me how important it is to you personally?
Base: All (6,999)

36
92. Those who had switched energy providers in the last three years (83%) were more likely than those who had not switched (76%) to say that a cheap tariff rate was either essential or very important. In contrast those who had not switched were more likely to mention the importance of the following other factors:
Good customer service (85% have not switched compared with 80% switched) Large supplier/established brand (34% have not switched compared with 19% switched) Range of other services available such as boiler maintenance (28% have not switched
compared with 16% switched) Supplier provides smart meter (25% have not switched compared with 19% switched)
Figure 32: Importance of factors when considering a supplier – prompted rating: Switchers and Non-Switchers
19%
16%
19%
61%
65%
83%
78%
80%
25%
28%
34%
61%
67%
76%
79%
85%
Supplier provides smart meter
Range of other services available such as boilermaintenance
Large supplier/established brand
Tariffs tailored to your energy usage or circumstances
Payments based on actuals not estimated usage
Cheap tariff rate
Simple/easy to understand tariffs
Good customer service
Have not switched in last 3 years Switched in last 3 years
D2. I am going to read out a number of reasons why people choose an energy supplier. For each of these I’d like you to tell me how important it is to you personally?
Essential/very important
Base: Switched in last 3 years (2,338), Have not switched in last 3 years (4,747)

37
4.8 Triggers for market engagement
93. All those who had shopped around within the last three years were asked what had prompted them to do so, with answers captured spontaneously. Nearly half (47%) said they were prompted to shop around for cost reasons, which was by far the most commonly mentioned factor. Some shopped around as their contract was coming to an end (13%) a few because they were moving house (6%) or wanted better customer service (7%). Just over a fifth (22%) said that nothing specific had prompted them to shop around.
Figure 33: Triggers for shopping around within the last three years
22%
5%
15%
4%
7%
7%
6%
13%
19%
5%
7%
13%
20%
47%
Nothing specific/just curious
TV/press/political stories about the energy market
Other (NET)
Supplier characteristics (NET)
Wanted better customer service/ received poor customerservice
Quality/Reliability (NET)
Moved home
Contract with existing supplier due to end
Searching for alternative (NET)
Received very high bill
Price Increase announcement
Amount expected to save/ looking to save money
Existing tariff expensive
Cost/tariff (NET)
E18 Thinking just about the last time you shopped around for your Gas/Electricity, was there anything specifically that prompted you to do so?
Chart shows all responses mentioned by 4% or more
Base: All who had shopped around within the last three years (3,023)

38
94. All who had switched energy supplier within the last three years were asked what had made them decide to go ahead and switch suppliers, answers were captured spontaneously. Cost/tariff was again the most frequently mentioned reason and more than four fifths (83%) gave this response. Although cost/tariff was a driver for the great majority, those on a fixed tariff (88%) were more likely to cite this reason compared with those on a standard variable tariff (78%).
Figure 34: Drivers for switching supplier within the last three years
1%
9%
6%
7%
6%
10%
12%
13%
6%
11%
73%
83%
Nothing specific/just curious
Other (NET)
Searching for alternative (NET)
Additional features/ service of existing supplier (NET)
Heard good things about supplier
Supplier characteristics (NET)
Poor service from existing supplier
Quality/reliability (NET)
Wanted to fix the rate
Amount expected to save/ looking to save money
Cheaper tariff
Cost/tariff (NET)
E36 What made you decide to go ahead and switch supplier?
Chart shows all responses mentioned by 5% or moreBase: All who had switched energy supplier within the last three years (2,223)

39
4.9 Potential barriers to market engagement 4.9.1 Awareness of options available to customers
95. In order to understand customer knowledge about the energy market, respondents were asked whether they thought it was possible for energy customers in general to change tariff with their current supplier, change payment method or switch to another supplier. They were given the proviso that this was subject to any exit fees that may be charged. They were also told that if they did not know whether it was possible or not (i.e. they did not know) to inform the interviewer.
96. The great majority (89%) thought that it was possible to switcher suppliers, whilst just over four fifths said it was possible to change the payment method (81%) or change tariff with their current supplier (76%). Two thirds (64%) knew that it was possible to undertake all three actions.
Figure 35: Awareness of what it is possible to do in the energy market
76%81%
89%
7% 5% 4%
16% 14%6%
0%
50%
100%
Change tariff with currentsupplier
Change payment method Switch supplier
PossibleNot possibleDon't know
Base: All (6,999) E1. Which if any of the following do you think it is now possible for energy customers in general to do, subject to any exit fees that may be charged. If you don’t know please say so.

40
97. Whilst the majority did think that these changes were possible around a quarter were unaware
of the possibility of changing tariff within supplier. This was especially true for people with no qualifications or in perhaps greater financial hardship. The full analysis is shown in table 2
below. Table 1: % saying not possible to do action or don’t know, by demographics
Total No qualifications
Social rent Vulnerability indicator
Financially struggling
Unweighted base 6,999 901 842 1,433 2,728
Weighted base 7,000 945 1,025 1,568 2,995
% % % % %
Change tariff with current supplier
23 35 31 26 26
Change payment method
19 29 26 26 22
Switch to a different supplier
10 19 17 14 14
4.9.2 Barriers to changing tariff 98. Just under a half (48%) of all households had ever considered changing tariff with the same
supplier, with just over a quarter (28%) having made an active decision to do so at some time.
99. All households who had never considered changing tariff with their existing supplier were asked why they had never considered changing tariff, with answers captured spontaneously. The top three mentions were their existing tariff was satisfactory in terms of cost (41%), it was just too much effort or they couldn’t be bothered (14%) and they were confident they were on the best deal (12%).

41
Figure 36: Barriers – to changing tariff
4%
4%
8%
13%
34%
14%
26%
12%
5%
41%
53%
Don't know
Nothing specific
Didn't know you could
Not interested
Other (NET)
Too much effort/ can’t be bothered
Searching for alternative (NET)
Confident I am on the best deal for me
Didn't think I'd save enough
Existing tariff satisfactory
Cost/tariff (NET)
Base: All who have never considered switching tariff whilst staying with the same supplier (2,758)
Chart shows all responses mentioned by 4% or more
E4 Why have you never considered changing tariff?.

42
4.9.3 Barriers to considering switching 100. All respondents who knew it was possible to switch but had never considered doing so were
asked why they had not switched suppliers, again spontaneous answers were collected. The most frequently mentioned response was again cost/tariff (46%). However, more than a quarter (27%) said some aspect of the searching/switching process had discouraged them from changing supplier, mostly that they could not be bothered to make the effort.
Figure 37: Barriers – why never considered switching
Base: All who think it is possible to switch but have never considered switching (1,694)
Chart shows all responses mentioned by 5% or more
E14 Why have you never considered switching supplier for your Gas/Electricity?
6%
6%
14%
29%
15%
18%
8%
13%
17%
18%
41%
46%
Too complicated
All suppliers are much the same/no difference
Not interested
Other (NET)
Too much effort can't be bothered
Switching to alternative (NET)
Too much effort/can’t be bothered
Searching for alternative (NET)
Good quality service
Quality/Reliability (NET)
Existing tariff satisfactory
Cost/Tariff (NET)
27% Searching/Switching (NET)

43
101. Barriers to switching varied by internet access. Cost/tariff was mentioned more frequently by those with no internet access (52% c.f. 44% internet access) whilst those with internet access were more likely to cite concerns about switching to an alternative (20% c.f. 14% no internet access).
Figure 38: Barriers – why never considered switching by internet access
6%
15%
5%
14%
11%
18%
52%
7%
14%
6%
20%
14%
19%
44%
All suppliers much the same
Not interested
Too complicated
Switching to an alternative (NET)
Searching for an alternative (NET)
Quality/Reliability (NET)
Cost/tariff (NET)
Internet access
No access
Base: All who think it is possible but have never considered switching (Those with internet access = 1,214, Those without = 479)E14 Why have you never considered switching supplier for your {textfill fuel type}?

44
102. Barriers to switching did not vary by tariff type. There were no differences in the reasons given for not switching energy supplier between tariff types.
Figure 39: Barriers – why never considered switching
7%
13%
6%
17%
13%
18%
46%
5%
17%
6%
19%
14%
18%
50%
All suppliers much the same
Not interested
Too complicated
Switching to an alternative (NET)
Searching for an alternative (NET)
Quality/Reliability (NET)
Cost/tariff (NET)
Fixed tariff
Variable tariff
E14 Why have you never considered switching supplier for your {textfill fuel type}? Base: All who have never considered switching (On fixed tariff = 399, Variable tariff = 1,190)

45
103. The chart below shows the reasons for not switching supplier (amongst those who knew they could switch supplier but never considered it) by the different attitudes towards energy supply. There were differences in the reasons given except that those who thought there was no difference in price between providers were more likely to cite cost as the reason why they had never considered switching (they saw no cheaper price benefit). Those with the view that the switch may go wrong were also more likely to mention cost as a reason for not considering a switch (46%).
Figure 40: Barriers – why never considered switching
6%
13%
6%
19%
13%
19%
46%
7%
16%
7%
21%
16%
18%
38%
7%
13%
7%
22%
16%
19%
42%
6%
12%
8%
19%
13%
20%
46%
All suppliers much the same
Not interested
Too complicated
Switching to an alternative (NET)
Searching for an alternative (Net)
Quality/Reliability (NET)
Cost/tariff (NET)Worry switch might go wrong
Switching is a hassle
Don't take active interest inenergy
No difference on price
E14 Why have you never considered switching supplier for your {textfill fuel type}?
Base: All who have never considered switching (Worry switch might go wrong = 1,006, Switching is a hassle = 1,141, Don’t take active interest in energy = 472, No difference on price = 954)

46
4.9.4 Barriers to shopping around 104. All those who had considered switching but had never shopped around were asked what
prevented them from shopping around. The most frequently mentioned reasons were related to the process of searching for an alternative supplier (63%). The top two mentions within this were the searching process would take too long/ they didn’t have enough time to search (37%) and they could not be bothered (23%). Cost/tariff reasons were not so much of a barrier to shopping around, compared with the reasons why respondents had never considered switching.
Figure 41: Barriers – shopping around
2%
4%
1%
5%
7%
15%
32%
37%
23%
63%
2%
2%
2%
4%
7%
13%
Don't know
Nothing specific
Additional features/services of existing supplier (NET)
All suppliers much the same
Not interested
Too complicated
Other (NET)
Takes too long/ would take too long
Too much effort can't be bothered
Searching for an alternative (NET)
Good quality service from existing supplier
Quality/Reliability (NET)
Confident I am on the best deal for me
Didn't think I'd save enough
Existing tariff satisfactory
Cost/tariff (NET)
Base: All who considered switching but never shopped around (507)E15 You say you have considered switching to a different energy supplier, but have never shopped around to see what other suppliers had to offer. What if anything has stopped you from shopping around.
47
105. The reasons given for not having shopped around were similar across those with and without internet access. The only exception was that a greater proportion of those with internet access mentioned a concern about searching for alternative supplier (65%) compared to those without internet access (50%).
Figure 42: Barriers – shopping around by internet access
9%
12%
13%
50%
0%
13%
5%
6%
16%
65%
3%
13%
All suppliers much the same
Not interested
Too complicated
Searching for an alternative (NET)
Quality/Reliability (NET)
Cost/tariff (NET)
Internet access
No access
Base: All who considered switching but never shopped around (Those with internet access = 445, Those without access = 61)E15 You say you have considered switching to a different energy supplier, but have never shopped around to see what other suppliers had to offer. What if anything has stopped you from shopping around?

48
106. There were differences in the barriers to shopping around by tariff type. Those on a standard variable tariff were much more likely (66%) to mention concerns about searching for an alternative supplier as a barrier when compared with those on a fixed tariff (52%). In contrast those on a fixed tariff were more likely to mention cost/tariff (20% c.f. 11% standard variable tariff) and quality/reliability of service (5% c.f. 2% standard variable tariff) reasons as a barrier to shopping around.
Figure 43: Barriers – shopping around by tariff type
5%
7%
17%
66%
2%
11%
6%
7%
11%
52%
5%
20%
All suppliers much the same
Not interested
Too complicated
Searching for an alternative (NET)
Quality/Reliability (NET)
Cost/tariff (NET)
Fixed tariff
Variable tariff
Base: All who considered switching but never shopped around (Fixed tariff = 106, Variable tariff = 380)E15 You say you have considered switching to a different energy supplier, but have never shopped around to see what other suppliers had to offer. What if anything has stopped you from shopping around?

49
107. The chart below shows the barriers to shopping around by attitudes to energy supply, with no differences evident.
Figure 44: Barriers – shopping around by attitudes
10%
6%
20%
61%
3%
17%
4%
8%
17%
63%
4%
14%
5%
6%
17%
68%
3%
12%
7%
4%
17%
63%
2%
14%
All suppliers much the same
Not interested
Too complicated
Searching for an alternative (NET)
Quality/Reliability (NET)
Cost/tariff (NET)Worry switch mightgo wrong
Switching is a hassle
Don't take activeinterest in energy
No difference onprice
Base: All who considered switching but never shopped around (Worry switch might go wrong = 288, Switching is a hassle = 360, Don’t take active interest = 117, No difference on price = 221)E15 You say you have considered switching to a different energy supplier, but have never shopped around to see what other suppliers had to offer. What if anything has stopped you from shopping around?

50
4.9.5 Ease of shopping around 108. All those who had shopped around within the last three years were read out a number of
different aspects of shopping around for energy suppliers and asked to rate how easy or difficult they had found each aspect on their last shopping occasion, using a five-point “Very easy” to “Very difficult” scale. Two thirds (64%) said that the overall task of shopping around had been either very or fairly easy. A quarter (23%) said that the overall task of shopping around had been difficult and this was particularly the case amongst those who were struggling financially (27%), aged 65 year or more (29%) and those who were not confident that they would get the right deal on a price comparison website (49%). In addition households on a standard variable tariff (25%) were more likely when compared with those on a fixed tariff (21%) to say that the task of shopping around had been difficult. Access to the internet did not influence how easy or difficult the overall task of shopping was perceived to have been.
Figure 45: Ease of overall task of shopping around by demographics
109. Understanding the options available, and making comparisons between options, were seen as
the most difficult aspects when shopping around – more difficult than finding about their own energy usage and finding out about other suppliers. Just under a third of those who had shopped around in the last three years said that it had been difficult to understand the options available to them (30%) and make comparisons between options (36%). Respondents who were struggling financially and particularly those who were not confident about obtaining the right deal on a price comparison website were more likely than average to say that these aspects were difficult (Understanding the options available - financially struggling 35% and not confident at getting the right deal on a price comparison website 53%; Making comparisons between options - financially struggling 39% and not confident at getting the right deal on a price comparison website 60%).
19% 18%26% 22% 18%
46% 42%
44%46%
43%
11%8%
10%6%
11%
18%22%
13%15% 20%
6% 7% 5% 8% 7%
0%
50%
100%
Total 65+ years Social rent No qualifications Financial struggle
Very difficult
Fairly difficult
Neither
Fairly easy
Very easy
E25 I am now going to read out different aspects of shopping around for energy suppliers, and I’d like you to tell me how easy or difficult each aspect was for you, using the following scale, when you last shopped around (for your {textfill fuel type})
Base: All who have shopped around in the last three years = 3,023, 65+ years = 580, Social rent = 225, No qualifications = 165 , Financial struggle = 950

51
Figure 46: Ease of shopping around
110. Those aged 45 or over were more likely than the under 45s to say that understanding the options available to them (32% c.f. 26% respectively) and making comparisons between options (37% c.f. 30% respectively) were difficult.
19%
36%26%
16% 17%
46%
43%51%
41% 39%
11%
6% 7%
11%9%
18%12% 11%
22%24%
6% 3% 3% 8% 11%
0%
50%
100%
Overall task ofshoppingaround
Finding outabout own
energy usage
Finding outabout othersuppliers
Understandingoptions
available
Makingcomparisons
betweenoptions
Very difficult
Fairly difficult
Neither
Fairly easy
Very easy
E25 I am now going to read out different aspects of shopping around for energy suppliers, and I’d like you to tell me how easy or difficult each aspect was for you, using the following scale, when you last shopped around (for your {textfill fuel type})
Base: All who have shopped around in the last three years (3,023)

52
111. All who had shopped around in the last three years were asked what, if anything, they disliked about the task of shopping around, spontaneous responses were again recorded. The top three most frequently mentioned dislikes about shopping around were that the tariffs were difficult to compare and understand (28%), the process takes too long/they didn’t have time (24%), and it was difficult to find out information (17%).
Figure 47: Shopping around – dislikes
25%
2%
1%
1%
3%
4%
12%
12%
17%
24%
28%
Nothing specific
Other
Pestered by phone call/emails after
Don't know how to do it
Not interested
Lack of confidence/trust in price comparison website
Too complicated
Too much effort/ can't be bothered
Difficult to find informaion
Takes too long/didn’t have time
Don’t understand/difficult to compare tariffs
E26. What if anything did you dislike about the task of shopping around? Base: All who have shopped around in the last three years (3,023)

53
4.9.6 Barriers to switching supplier 112. First of all, respondents who had been approached by another supplier but had not switched to
that supplier were asked why this was the case. The main barriers given related to cost/tariff (55%) reasons and concerns about the other supplier (23%). The most frequently mentioned barriers were:
their existing tariff was satisfactory (33%),
did not think they would save enough (10%),
they didn’t like or trust the other supplier (13%),
didn’t like the cold call/sales pitch (13%),
did not think that the gain would be achieved (9%).
Figure 48: Barriers – didn’t switch to supplier who approached
113. Then those who had not switched after their last experience of shopping around were asked why they had not switched supplier. The most frequently cited reason was a cost/tariff reason (68%), in particular two fifths said their existing tariff was satisfactory (39%), whilst a fifth said that they were confident they were on the best deal for me (20%) or they did not think they would save enough money (17%).
Base: All who did not switch to the supplier who approached them (2,933)
Chart shows all responses mentioned by 5% or more
E11 Why did you not switch to the supplier that approached you?.
12%22%
9%13%
5%7%
13%13%
24%10%11%
5%9%10%
33%55%
Not interested
Other (NET)
Too much effort
Switching to alternative (NET)
Prefer to seach myself
Searching for alternative (NET)
Didn't like sales pitch/cold call
Didn't like/trust other supplier
Other supplier (NET)
Good quality service
Quality/Reliability (NET)
Found cheaper tariff with current supplier
Didn't think the gain would be achieved
Didn't think I would save enough
Existing tariff satisfactory
Cost/Tariff (NET)

54
114. A fifth mentioned that the process of searching for an alternative supplier was a barrier to them switching after shopping around. The most frequently mentioned barriers in this category were it takes too much effort/I can’t be bothered (9%) and it takes too long/I don’t have time (6%).
Figure 49: Barriers – why not switched after shopping around
Base: All who didn’t switch on the last shopping around occasion (1,798)
Chart shows all responses mentioned by 3% or more
E29 Why did you not switch supplier?
7%
4%
3%
4%
18%
6%
9%
17%
12%
13%
20%
17%
39%
68%
Other (specify)
All suppliers the same
Not interested
Too complicated
Other (NET)
Takes too long/don't have time
Too much effort/can’t be bothered
Searching for alternative (NET)
Good quality service
Quality/Reliability (NET)
Confident I'm on the best deal for me
Didn't think I would save enough
Existing tariff satisfactory
Cost/Tariff (NET)

55
115. Internet access was not a factor in the barriers to switching, however some differences were evident by tariff type. Concerns about searching for alternative suppliers was more likely to be mentioned by those on a standard variable tariff (20% c.f. 14% fixed tariff), whilst cost/tariff reasons were more likely to be mentioned by those on a fixed tariff (75% c.f. 64% standard variable tariff).
Figure 50: Barriers – why not switched after shopping around
5%
4%
5%
20%
11%
64%
3%
3%
3%
14%
14%
75%
All suppliers much the same
Not interested
Too complicated
Searching for an alternative (NET)
Quality/Reliability (NET)
Cost/tariff (NET)
Fixed tariff
Variable tariff
E29 Why did you not switch supplier (the last time you shopped around)? Base: All who did not switch supplier (the last time they shopped around) (Fixed tariff = 793 , Variable tariff = 921 )

56
116. Attitudes towards energy supply did not differentiate barriers to switching levels.
Figure 51: Barriers to switching
6%
4%
5%
20%
10%
67%
3%
6%
3%
29%
9%
61%
5%
3%
6%
27%
11%
60%
4%
3%
5%
22%
13%
64%
All suppliers much the same
Not interested
Too complicated
Searching for an alternative (NET)
Quality/Reliability (NET)
Cost/tariff (NET)Worry switch might gowrong
Switching is a hassle
Don't take activeinterest in energy
No difference on price
E29 Why did you not switch supplier (the last time you shopped around)?
Base: All who did not switch supplier (the last time they shopped around) (Worry switch might go wrong = 781, Switching is a hassle = 776, Don’t take active interest = 193, No difference on price = 702)

57
4.9.7 Overall summary 117. There were different barriers to market engagement at different stages in the process.
Cost/tariff reasons were much more likely to be cited as a reason for non-engagement by those who had never considered switching, and by those who had shopped around but not switched. However, concerns about the searching process, and in particular the effort it takes, were much more likely to be mentioned as a reason for not shopping around among those who had considered switching.
Figure 52: Barriers – market engagement
Base: E14 All who think it is possible to switch but have never considered switching = 1,694; E15 All who have considered switching but never shopped around or switched = 507, E29 All who didn’t switch on the last shopping around occasionE14 Why have you never considered switching supplier? E15 What if anything has stopped you from shopping around? E29 Why did you not switch supplier
29%
2%
18%
13%
4%
3%
18%
46%
32%
1%
4%
63%
1%
2%
13%
18%
2%
2%
17%
2%
13%
68%
Other (NET)
Additional features/services ofexisting supplier
Switching to alternative (NET)
Searching for alternative (NET)
Other supplier (NET)
Existing supplier characteristics(NET)
Quality/Reliability (NET)
Cost/Tariff (NET)
Didn't switch but shopped around
Considered but not shopped around
Never considered
Responses come from different questions

58
4.10 Consumer confidence 4.10.1 Confidence in current deal/tariff 118. All respondents were asked how confident they were that they are on the right energy deal for
them when thinking of all the possible suppliers and tariff options, using a four-point “Very confident” to “Not at all confident” scale. Two thirds (63%) said they were very/fairly confident that they are currently on the right deal for them, and one third (31%) were not confident. Lack of confidence increased amongst those with a degree (40%), aged 18 to 44 years (38%) and those on a standard variable tariff (34%).
Figure 53: Confident that on the right deal
29%
41%
20%
8%
0%
50%
100%
Not at all confident
Not very confident
Fairly confident
Very confident
B14 Thinking about all possible suppliers and tariff options, how confident are you now that you are on the right energy deal for you?
Base: All who think it is possible or don’t know whether it is possible to switch supplier or change payment method (6,949)

59
119. Respondents were then asked how easy or difficult they thought it would be to find out what was the right deal for them, using a five-point “Very easy” to “Very difficult” scale. The majority (58%) said that it would be easy, but nearly three in ten (29%) said that it would be difficult to find out, and this was higher among those on the priority service register (36%), those with a disability (34%), those aged 65 years or more (34%), and respondents with a vulnerability indicator (34%) or who were struggling financially (33%).
Figure 54: Ease of switching supplier
4.10.2 Confidence in making the right decision if changing energy supplier 120. All respondents were asked how confident they were that they would be able to make the right
decision if they wanted to change energy supplier, using the same four-point confidence scale. Just over two in three (70%) said that they would be confident, but a sizeable minority (28%) said that they would not be confident. Lack of confidence in their ability to make the right was higher in the following vulnerable sub-groups:
on the priority service register (36%),
warm home discount (35%),
no qualifications (35%),
those with a disability (34%),
vulnerable indicator (34%),
struggling financially (33%).
18%
40%
9%
19%
10%
4%
0%
50%
100%
Don't know
Very difficult
Fairly difficult
Neither easy nor difficult
Fairly easy
Very easy
F3 How easy or difficult do you think it would be to find out what was the right deal for you?
Base: All who think it is possible or don’t know whether it is possible to switch supplier or change payment method (6,949)

60
121. Tariff type was associated with confidence in making the right decision if changing energy supplier. Households on a standard variable tariff (31%) were more likely to be not confident in their ability to make the right decision (31% c.f. 23% on a fixed rate tariff).
Figure 55: Confidence in making the right decision if changing energy supplier
4.10.3 Confidence in using the internet/PCWs 122. A minority (17%) did not have access to the internet either at home, work or through a mobile
device. The following groups were more likely than the average (17%) not to have internet access :
those with no qualification (53%),
those with the warm home discount (51%),
those aged 65+ (41%),
those with a disability (38%),
those on the priority service register (37%),
those on the vulnerability register (34%),
those living in social rented housing (32%),
carers (22%),
those financially struggling (22%).
123. All those who had internet access were asked how confident they were about using the internet
to search for information about suppliers of different products or services in general. The data from this question has been rebased to all respondents to provide an overview. Just over two in three (70%) were confident about using the internet to search for information about suppliers
29%
41%
20%
8%
0%
50%
100%
Not at all confident
Not very confident
Fairly confident
Very confident
F4 How confident are you that you would be able to make the right decision if you wanted to switch energy supplier?
Base: All who think it is possible or don’t know whether it is possible to switch supplier or change payment method (6,949)

61
of different products or services in general, but some groups were less likely than average to be confident and these were:
those struggling financially (63%),
carers (62%),
those with a vulnerability indicator (48%),
those with a disability (45%),
those aged 65 years or more (42%),
those with no qualifications (29%).
124. Whilst a majority said that they were either very or fairly confident (55%), a quarter (26%)
lacked confidence in their ability to use a PCW to get the right deal, so in total a sizeable minority (42%) either had no internet access or lacked confidence in getting the right energy deal using a PCW. This proportion who lacked confidence was particularly high amongst:
carers (31%),
those with a disability (28%)
those with vulnerability indicator (27%),
those financially struggling (27%),
those on the warm home discount (25%).
Figure 56: Confidence in searching for information in general and getting the right deal through a price comparison website
125. All those who did not feel confident in using a PCW were asked why they did not feel so. The top three most frequently mentioned responses were that they did not trust or believe the PCW (43%), that the information is far too complex – wouldn’t know if was on the right deal (26%) and that they had never used a PCW so would not know what to do (16%).
H1 The next few questions are about using the internet. Do you have access to the internet at home, work or via a mobile device? H3 As you probably know, price comparison websites allow you to compare prices from a number of suppliers for products and services on the same website. How confident are you that you would be able to get the right deal for your energy supply using a price comparison website?
46%
24%
8%4%
17%
0%
50%
100%No access tointernet
Not at allconfident
Not veryconfident
Fairlyconfident
Very confident
Confidence in searching for information about suppliers or services in general
19%
36%
18%
8%
17%
0%
50%
100%
No access tointernet
Not at allconfident
Not veryconfident
Fairlyconfident
Very confident
Confidence in getting the right deal for your energy supply using a PCW
Base: All (6,999)

62
126. Reasons for lack of confidence in using PCWs varied by demographics. Not trusting or believing a PCW was more likely to be cited by those with a degree (50%), those earning more than £36,000 per year (52%) and males (51%). Certain vulnerable groups were, on the other hand, more likely to say that they had never used a PCW and these were:
those with no qualifications (32%),
living in rented social housing (29%),
warm home discount (28%),
65 years or more (23%),
has a disability (22%),
vulnerable indicator (21%).
Figure 57: Reasons for lack of confidence in using PCWs
127. Resistance to using PCWs was evident in other non-energy markets as well; four in ten either
had no internet access or had access but had never used a PCW to search for information about non-energy suppliers.
H4 Why would you not feel confident in using a price comparison website to get the right energy deal?Base: All not confident about getting the right deal from a price comparison website (1,856)
2%
4%
2%
3%
4%
4%
13%
16%
26%
43%
Don't know
Other
Prefer to go directly to supplier/better deal if you godirectly to supplier
Prefer to speak to someone
Would need to know details of my own personalconsumption/usage
Not enough information given/hidden details
Do not include all supplier prices
Have never used comparison websites/ wouldn’t know what to do
Information too complex - not sure what the right dealwould be
Don’t trust/believe price comparison websites

63
128. Even among those who had used PCWs to search for information about suppliers in other markets, a sizeable minority (41%) had never used a PCW to switch supplier in a non-energy market.
Figure 58: Use of PCWs in other markets
Base: All (6,999)
60%
23%
17%
0%
50%
100%
No - no internetaccess
No - haveinternet access
Yes
Ever used a PCW to search for information about suppliers, for anything apart from energy
58%
41%
0%
50%
100%
No
Yes
Ever used a PCW to switch suppliers, for anything apart from energy
I2 Have you ever used a price comparison website to search for information for anything apart from energy supply, such as for insurance or broadband? I3 And have you ever used a price comparison website to switch supplier for anything apart from energy supply?
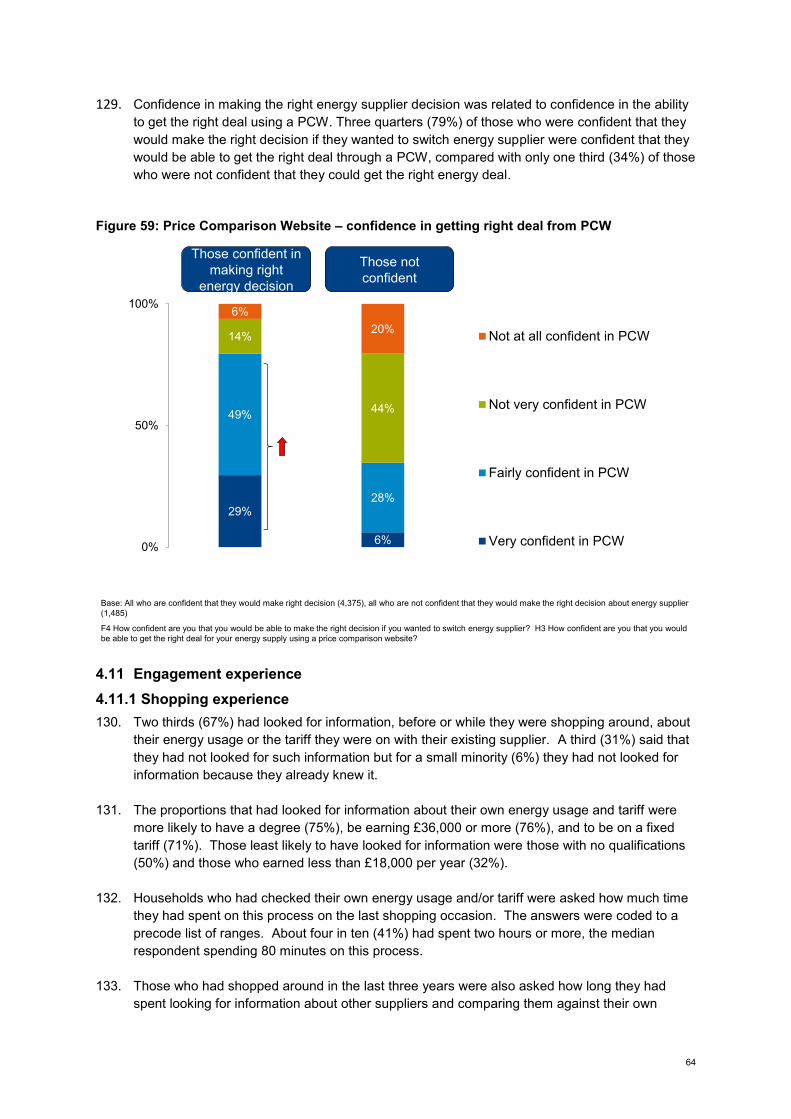
64
129. Confidence in making the right energy supplier decision was related to confidence in the ability to get the right deal using a PCW. Three quarters (79%) of those who were confident that they would make the right decision if they wanted to switch energy supplier were confident that they would be able to get the right deal through a PCW, compared with only one third (34%) of those who were not confident that they could get the right energy deal.
Figure 59: Price Comparison Website – confidence in getting right deal from PCW
4.11 Engagement experience 4.11.1 Shopping experience 130. Two thirds (67%) had looked for information, before or while they were shopping around, about
their energy usage or the tariff they were on with their existing supplier. A third (31%) said that they had not looked for such information but for a small minority (6%) they had not looked for information because they already knew it.
131. The proportions that had looked for information about their own energy usage and tariff were more likely to have a degree (75%), be earning £36,000 or more (76%), and to be on a fixed tariff (71%). Those least likely to have looked for information were those with no qualifications (50%) and those who earned less than £18,000 per year (32%).
132. Households who had checked their own energy usage and/or tariff were asked how much time they had spent on this process on the last shopping occasion. The answers were coded to a precode list of ranges. About four in ten (41%) had spent two hours or more, the median respondent spending 80 minutes on this process.
133. Those who had shopped around in the last three years were also asked how long they had
spent looking for information about other suppliers and comparing them against their own
29%
6%
49%
28%
14%
44%
6%20%
0%
50%
100%
Not at all confident in PCW
Not very confident in PCW
Fairly confident in PCW
Very confident in PCW
F4 How confident are you that you would be able to make the right decision if you wanted to switch energy supplier? H3 How confident are you that you would be able to get the right deal for your energy supply using a price comparison website?
Base: All who are confident that they would make right decision (4,375), all who are not confident that they would make the right decision about energy supplier (1,485)
Those confident in making right
energy decision
Those not confident

65
supplier. The answers were again coded to a precode list of ranges. The time spent comparing suppliers was less than the time spent researching their own energy usage, but there was still a third of shoppers who spent two hours or more on comparing suppliers (with a median of 65 minutes.
Figure 60: Time spent looking for information
12% 18%
15%18%
25%23%
19%16%
22% 17%
7% 10%
0%
50%
100%
Don't know3 hours +2-3 hours1- less than 2 hours30-59 mins<30 mins
E23 How much time did you spend on this? Please include all time you spent gathering up the information, looking through bills, checking your energy usage, and the details of the tariff you were on. E24 How much time did you spend looking for information about other suppliers, and comparing this against your own supplier
Current energy usage/tariff
Base: E23 - All who who checked existing usage and/or tariff (2,054). E24 All who have shopped around in the last three years (3,023)
Other suppliers/making comparison with own supplier
Mean = 189 minutes/ Median = 80 minutes Mean = 164 minutes/Median 65 minutes

66
134. The chart below shows those groups who were more likely than average to spend at least three hours on the information gathering and comparison process. It was the vulnerable groups who were most likely to fall into this category.
Figure 61: Time spent looking for information – those spending 3 hours or more
135. All those who had shopped around in the last three years were asked whether they had looked only at the major six suppliers, only at the smaller suppliers or both types of supplier on their last shopping occasion. Two thirds (66%) had looked at both large and smaller suppliers. However, nearly a quarter (27%) had only looked at the major six suppliers and this was most prevalent amongst those:
on a warm home discount (41%),
renting social housing (40%),
on a low income - less than £18,000 (38%),
with no qualifications (38%),
aged 65 year or more (33%),
on a standard variable tariff (32%).
27%
29%
29%
29%
22%Total
Low income
Vulnerable
Not confident get right deal PCW
Financially struggling
Current energy usage/tariff
22%
17%Total
Not confident get right deal PCW
Other suppliers/making comparison with own supplier
E23 How much time did you spend on this? Please include all time you spent gathering up the information, looking through bills, checking your energy usage, and the details of the tariff you were on. E24 How much time did you spend looking for information about other suppliers, and comparing this against your own supplier
Base: E23 - All who who checked existing usage and/or tariff (2,054). E24 All who have shopped around in the last three years (3,023)

67
136. Respondents who had only looked at the major six suppliers were asked their reasons for not looking at the smaller suppliers. Responses were varied, three in ten (30%) said they were not aware of the smaller suppliers, whilst about one in ten said that it took too much extra effort/hassle/time (12%), that there was uncertainty/risk about customer service (11%) or that they did not come up on a PCW (11%).
Figure 62: Whether shopping scope included smaller suppliers (last time shopped around)
E20 Did you look only at major suppliers, or only at smaller suppliers, or did you look at both. E21. Why did you not look at any of the smaller suppliers?
Base: E20 all who have shopped around in the last 3 years (3023). E21: all who had only looked at the major 6 suppliers when shopping around (693)
11%
5%
2%
2%
5%
4%
7%
11%
11%
12%
30%
Don't know
Other
Too new
Bad experience
Larger suppliers offer better deals
Poor reputation
Want a household name
They didn't come up on PCW
Uncertainty/risk about customer service
Too much extra effort/hassle/time
Not aware of smaller suppliers
27%
2%
66%
5%
0%
50%
100%
Don’t know
Both
Only smallersuppliers
Only 6 majorsuppliers
Whether looked at different size suppliers
Reasons for not looking at smaller suppliers

68
137. All those who had shopped around in the last three years were asked how they found out information about different suppliers on their last shopping occasion. Internet information sources were most prevalent, in particular a sizeable majority (71%) had found out information through a PCW. The next most frequently mentioned information source was supplier websites (23%).
Figure 63: Information sources used when shopping
138. Those most likely to have used a PCW were:
better off – earn £18,000 or more (78%),
those on a fixed tariff (77%),
had qualifications (75%),
18-64 year-olds (75%),
owners and private renters (73%),
those with dual fuel supplier (73%).
139. Those who had used a price comparison website were asked about how many PCWs they had
used. A third (36%) had not used a price comparison website but around a quarter said they had used one site (21%) and a further quarter had used two sites (24%).
E19 How did you find out information about different suppliers?
4%
5%
6%
9%
23%
71%PCWs
Supplier websites
Independent advice
Family and friends
Phoned supplier
Supplier advertisement
Base: All who shopped around in the last three years (3,023)

69
140. A half (53%) of all households who had shopped around in the last three years had made the switch via a PCW. A half of those who had not switched via a PCW had switched supplier by telephone (49%), a fifth had switched online (20%) and one in eight had switched in a face-to-face meeting (13%).
Figure 64: Use of PCWs
4.11.2 Switching experience 141. All those that had switched energy supplier in the last three years were asked how easy or
difficult it had been to make the switch to a different supplier on the last switching occasion. The great majority (83%) said it was easy, and just one in ten (11%) that it had been difficult.
37%
21%
24%
12%
4%
0%
50%
100%
Used, not surehow many
Three+
Two
One
Not used
53 41 6
Yes No Don't know
49% 19% 13% 10% 5%
TelephoneOnlineFace to faceThey contacted meOther
Made switch using PCW
Method used by those not switching through PCW
No. of PCWs visited
E33 How many price comparison websites did you go to? E34 Did you actually make the switch to the new supplier via a price comparison website, or not? E35 How did you make contact with the new supplier to arrange the switch?
Base: E33 All who shopped around in the last three years (1,469). E35 All who did not switch via a PCW (1,281)

70
142. Satisfaction with the new supplier was generally positive with more than a half (52%) reporting they were more satisfied with their new supplier than with their previous supplier. Most of the remainder said their satisfaction levels were no different.
Figure 65: Satisfaction with the switching process
E43 How easy or difficult was it to make the switch to a different supplier? E46 Overall, are you more satisfied with your new supplier compared with your previous supplier, less satisfied, or is there no difference?
50%
33%
6%5%5%1%
0%
50%
100%Don’t know
Very difficult
Fairly difficult
Neither/Nor
Fairly easy
Very easy
32%
20%
37%
2%4%6%
0%
50%
100%
Don't know
Lot less
Little less
No difference
Little more
Lot more
Ease of switching supplier Satisfaction with new supplier versus old supplier
Base: All who switched in the last 3 years (2,223)

71
143. All those who had switched suppliers in the last three years were asked what difficulties, if any, they had encountered on the last switch occasion. Nearly two thirds (63%) reported that they had not encountered any difficulties. The main difficulties that had been encountered were delays in the length of the switching process (11%), and that the previous supplier delayed the process (6%).
Figure 66: Difficulties encountered with last switch
4.11.3 Savings when switching 144. All who switched energy supplier because of price reasons on the last switch occasion were
asked to say how confident they were at the time of making the switch that they would make savings, using a four-point “Very confident” to “Not at all confident” scale. The very great majority of those who switched because of price reasons said they had been either very (49%) or fairly (43%) confident.
Base: All who switched in the last three years (2,223)
Chart shows all responses mentioned by 4% or more
E44 What difficulties, if any, did you encounter with the switch?
2%
63%
4%
6%
4%
4%
5%
6%
11%
28%
3%
5%
Don't know
None - no difficulties
Other
General (NET)
Things went wrong during the switching process
Issues with new supplier
Meter readings
Previous supplier delayed process
Delays in the length of switching process
Process (NET)
Large bill from existing supplier
Cost (NET)

72
145. The claimed expected saving from those who had switched for price reasons was £174 per annum on average. However a quarter (26%) said that they did not know how much they had expected to save.
Figure 67: Expectation of savings made by switching - those who switched for cost/tariff reasons
146. All who were able to estimate how much they expected to save by switching were asked if they
had realised these savings. The majority (59%) said that they had seen the savings they had expected, one in seven (15%) said it was too soon to tell, but a minority (16%) had not made the expected savings. Some vulnerable groups were more likely to have not made the savings they were expecting and these included:
those with no qualifications (31%),
those living in rented social housing (26%),
single parents (25%),
those who are financially struggling (22%).
E37 How confident were you at the time of switching that you would save money? E38 How much did you expect to save by switching supplier?
50%
43%
6%1%
0%
50%
100%
Not at all confident
Not very confident
Fairly confident
Very confident
Base: All who switched because of price reasons (1,742)
Confidence would save money
12%
19%
8%
15%
20%
26%Don’t know
£250 or more
£200-£249
£150-£199
£100-£149
£1-£99
£0
Mean expected saving per annum: £174Median expected saving per annum: £175
Money expected to save per annum

73
147. The households who did not make the savings they expected after changing supplier were asked whether they had saved any money with their new supplier or whether they were paying more money or whether the switch had made no difference to them. A half (49%) said that switching supplier had made no difference to the amount they were paying for energy, a quarter had saved some money even if it was not as much as they expected (22%), but a fifth said that they were now paying more (20%).
Figure 68: Whether made expected saving by switching
148. At least a half of consumers who had switched suppliers within the last 3 years and had said
how much they had expected to save had realised the saving. The proportion who realised the saving they expected was greatest amongst those who had expected to save £250 or more per annum.
E39 Do you feel you have actually made these savings you were expecting or not? E40 Would you say you have saved any money with your new supplier, or that you are paying more money, or has the switch made no difference?
59%
16%
15%
10%
0%
50%
100%
Don't Know
Too soon to tell
No
Yes
Did you make the savings you were expecting to make?
Of those who did not make the expected savings:
• 22% saved money (but not the amount they expected)
• 49% said it made no difference• 20% paid more money
Base: E39 All those who could estimate expected savings (1,584). E40 All those who did not make the expected savings (223)
Please note chart refers to survey responses

74
Figure 69: Expected saving per annum by whether saving made
149. All those who knew it was possible to change supplier (or were not sure) were asked what minimum amount of savings they required to encourage them to switch supplier. The mean saving required per annum was £158 whilst the median was £114 per annum. This is lower than the claimed amount that switchers had made.
E38 How much did you expect to save by switching supplier? E39 Do you feel you have actually made these savings you were expecting or not?
53% 56% 55% 57%72%
20% 15% 17% 18%
10%11% 19% 14%17%
12%16%
11% 14% 8% 6%
£1-£99 £100-£149 £150-£199 £200-£249 £250+
Don't know
Too soon to tell
Did not make expectedsaving
Made expected saving
Base: all switched in last 3 years and estimated how much they would save £1-£99 = 265, £100-£149 = 377, £150-£199 = 143, £200-£249 = 337, £250+ = 438
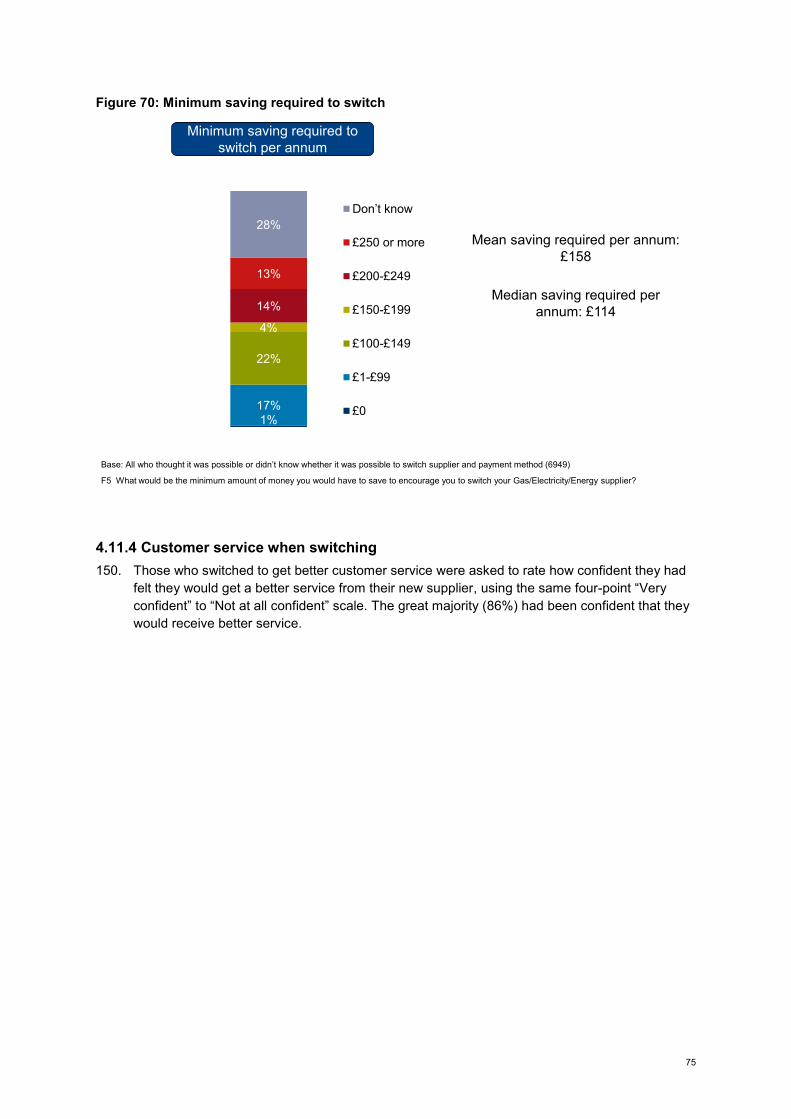
75
Figure 70: Minimum saving required to switch
4.11.4 Customer service when switching 150. Those who switched to get better customer service were asked to rate how confident they had
felt they would get a better service from their new supplier, using the same four-point “Very confident” to “Not at all confident” scale. The great majority (86%) had been confident that they would receive better service.
F5 What would be the minimum amount of money you would have to save to encourage you to switch your Gas/Electricity/Energy supplier?
Base: All who thought it was possible or didn’t know whether it was possible to switch supplier and payment method (6949)
Minimum saving required to switch per annum
1%17%
22%
4%
14%
13%
28%Don’t know
£250 or more
£200-£249
£150-£199
£100-£149
£1-£99
£0
Mean saving required per annum: £158
Median saving required per annum: £114

76
151. Three quarters (76%) of those who had switched to get better customer service said that they had actually received better customer service with their new supplier and most of the remainder said it had made no difference. Very few thought that the customer service they received with the new supplier was worse than with their previous supplier (3%).
Figure 71: Expectation of better customer service from switching - those who switched for
customer service reasons
E41 How confident were you that you would get better customer service with your new supplier? E42 In practice, is the customer service you are receiving from your new supplier better or worse than you received from your old supplier, or is it no different?
46%
40%
9%2%
0%
50%
100%
Not at all confident
Not very confident
Fairly confident
Very confident
76%
17%
3%2%
0%
50%
100%
Too soon to tell
New supplier worse
No difference
New supplier better
Base: All who switched to get better customer service (202)
Service received from new supplier
Confidence would get better service