Embed Size (px)
Citation preview
Energy Management with the use of an Intelligent Building
Management System
Focus
• Basic Concept of Intelligent Building Management System
• How an intelligent BMS can be applied on Energy Management in large size commercial buildings
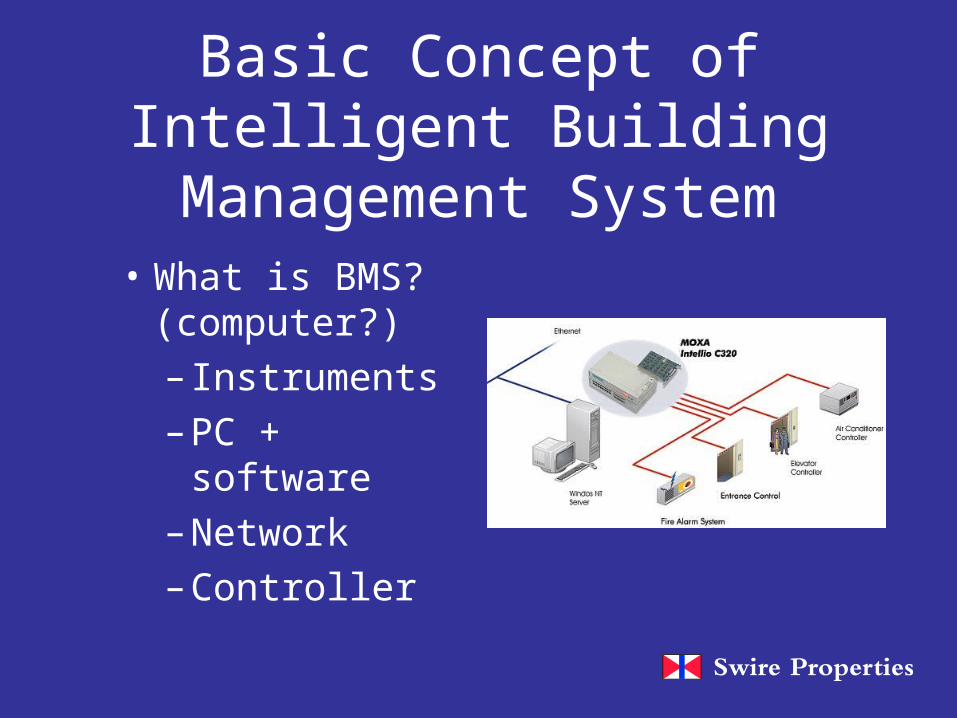
Basic Concept of Intelligent Building Management System
• What is BMS? (computer?)
– Instruments
– PC + software
– Network
– Controller
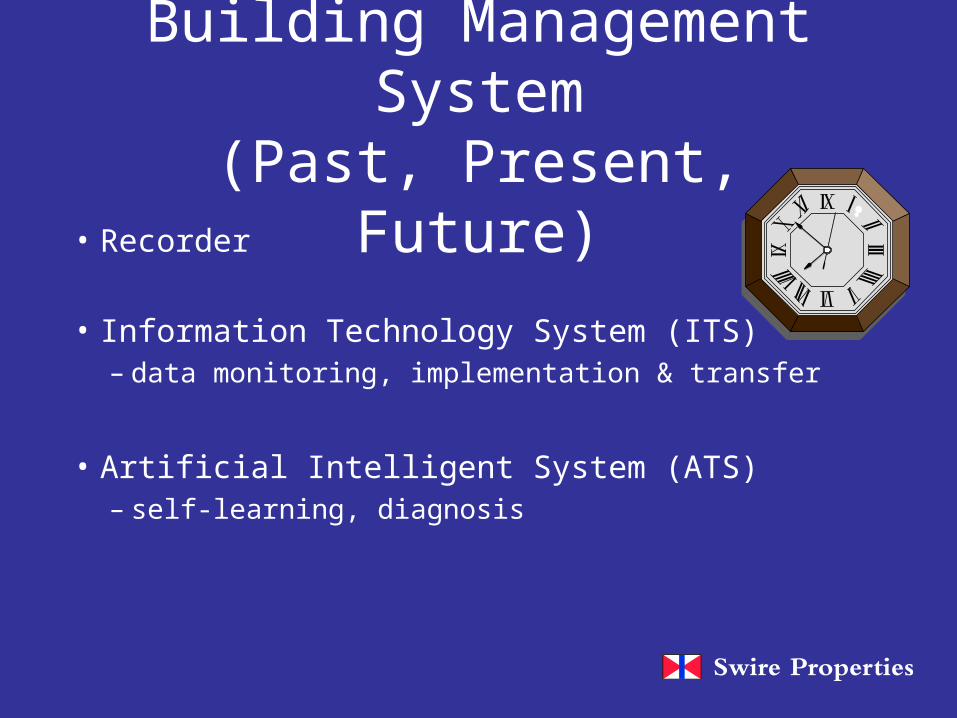
Building Management System(Past, Present, Future)
• Recorder
• Information Technology System (ITS)– data monitoring, implementation & transfer
• Artificial Intelligent System (ATS)– self-learning, diagnosis
What is the duties of BMS ?
• Reporting - information print out
• Monitoring - provide message / signal /alarm
• Prediction - cooling demand, energy
• Control - program, schedule
• Diagnosis - analysis
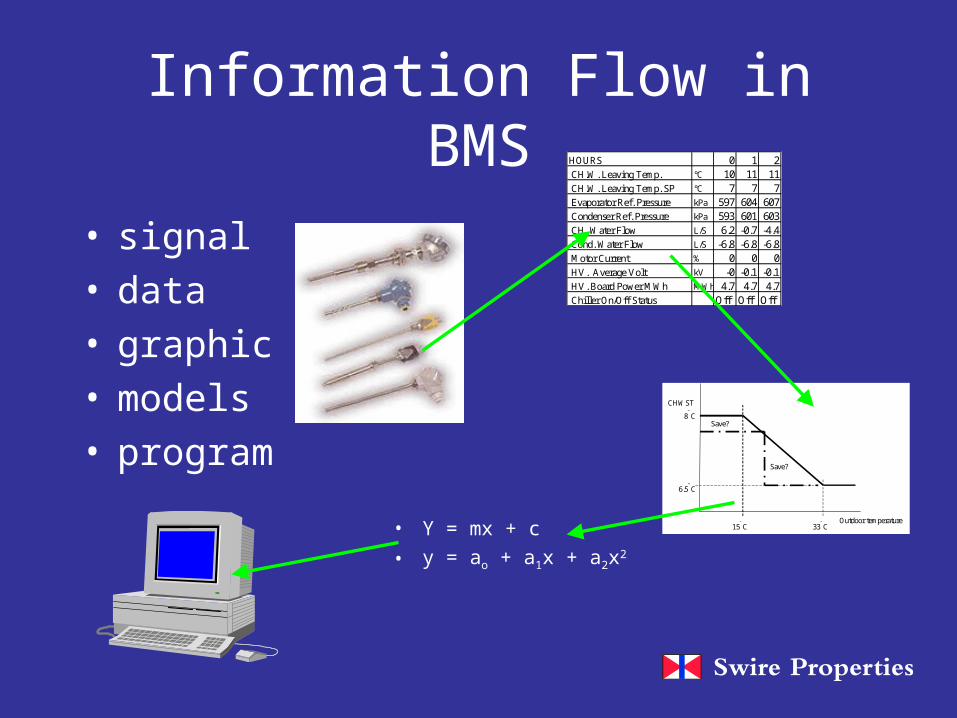
Information Flow in BMS
• signal• data• graphic• models• program
HOURS 0 1 2 CH.W. Leaving Temp. °C 10 11 11 CH.W. Leaving Temp. SP °C 7 7 7 Evaporator Ref. Pressure kPa 597 604 607 Condenser Ref. Pressure kPa 593 601 603 CH. Water Flow L/S 6.2 -0.7 -4.4 Cond. Water Flow L/S -6.8 -6.8 -6.8 Motor Current % 0 0 0 HV. Average Volt kV -0 -0.1 -0.1 HV. Board Power MWh MWh 4.7 4.7 4.7 Chiller On/Off Status Off Off Off
15C 33C
6.5C
8C
Outdoor temperature
CHWST
Save?
Save?
• Y = mx + c
• y = ao + a1x + a2x2
Advantages in using BMS in Building Facilities Management
• Operation– Centralize , Program, Automate, Remote– flexible, save operation & maintenance cost
• Maintenance– reactive proactive (monitor, keep checking)– increase services quality level (SQL)
• Applicable to Energy Management
O&M Examples
Operation• ON/OFF equipment
by IR-sensor• Signal - occupants• zoning & scheduling
by BMS program• ON/OFF/reset output• Automation
Maintenance• Fault identification of
VAV boxes• Signal - damper position,
temperature• abnormal data presented
in BMS• Output - message• Manpower saving
Energy Management in Building
(how to use BMS in EM?)
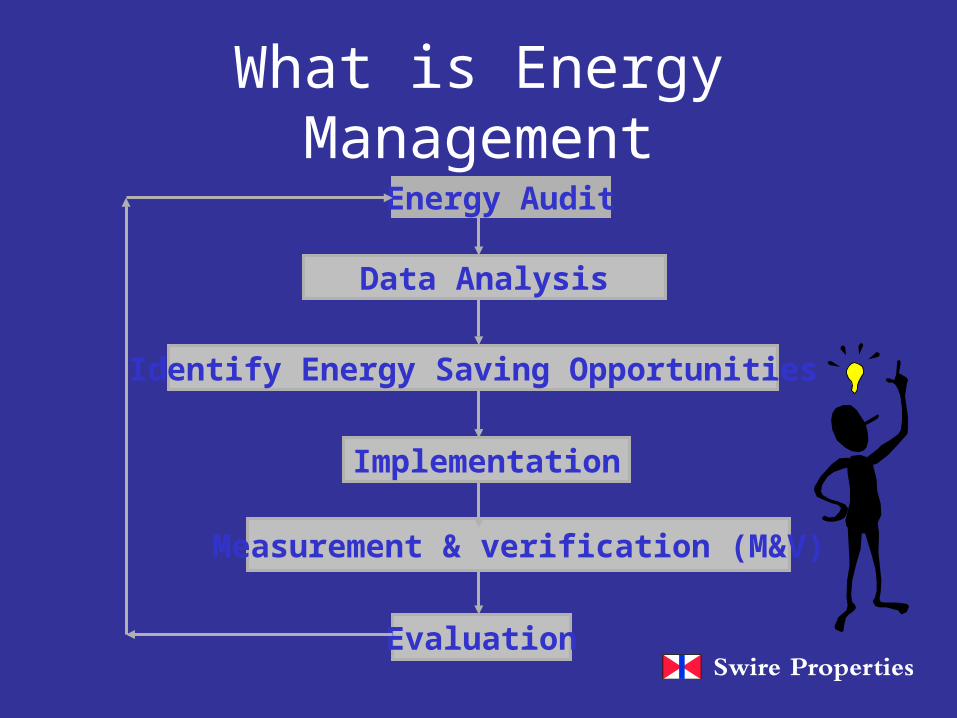
What is Energy Management
Energy Audit
Data Analysis
Identify Energy Saving Opportunities
Implementation
Measurement & verification (M&V)
Evaluation
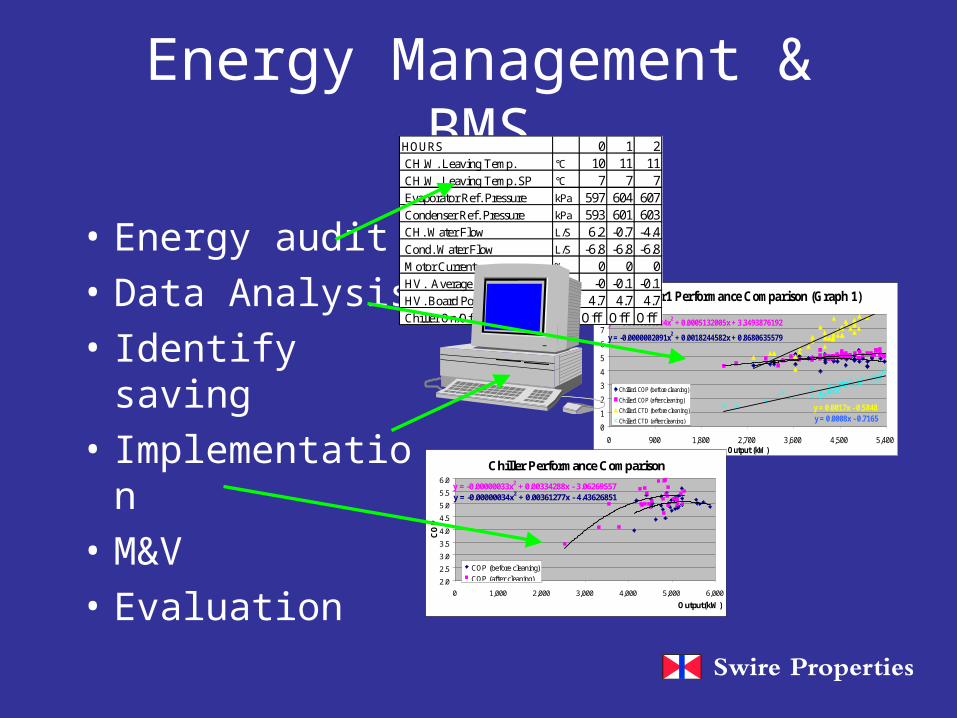
Energy Management & BMS
• Energy audit
• Data Analysis
• Identify saving
• Implementation
• M&V
• Evaluation
Chiller1 Performance Comparison (Graph 1)
y = -0.0000000304x2 + 0.0005132005x + 3.3493876192
y = -0.0000002091x2 + 0.0018244582x + 0.8680635579
y = 0.0017x - 0.5848y = 0.0008x - 0.7165
0
1
2
3
4
5
6
7
8
0 900 1,800 2,700 3,600 4,500 5,400Output (kW)
Chiller1 COP (before cleaning)
Chiller1 COP (after cleaning)
Chiller1 CTD (before cleaning)
Chiller1 CTD (after cleaning)
HOURS 0 1 2 CH.W. Leaving Temp. °C 10 11 11 CH.W. Leaving Temp. SP °C 7 7 7 Evaporator Ref. Pressure kPa 597 604 607 Condenser Ref. Pressure kPa 593 601 603 CH. Water Flow L/S 6.2 -0.7 -4.4 Cond. Water Flow L/S -6.8 -6.8 -6.8 Motor Current % 0 0 0 HV. Average Volt kV -0 -0.1 -0.1 HV. Board Power MWh MWh 4.7 4.7 4.7 Chiller On/Off Status Off Off Off
Chiller Performance Comparison
y = -0.00000033x2 + 0.00334288x - 3.06269557y = -0.00000034x2 + 0.00361277x - 4.43626851
2.0
2.5
3.0
3.5
4.0
4.5
5.0
5.5
6.0
0 1,000 2,000 3,000 4,000 5,000 6,000
Output(kW)
CO
P
COP (before cleaning)
COP (after cleaning)
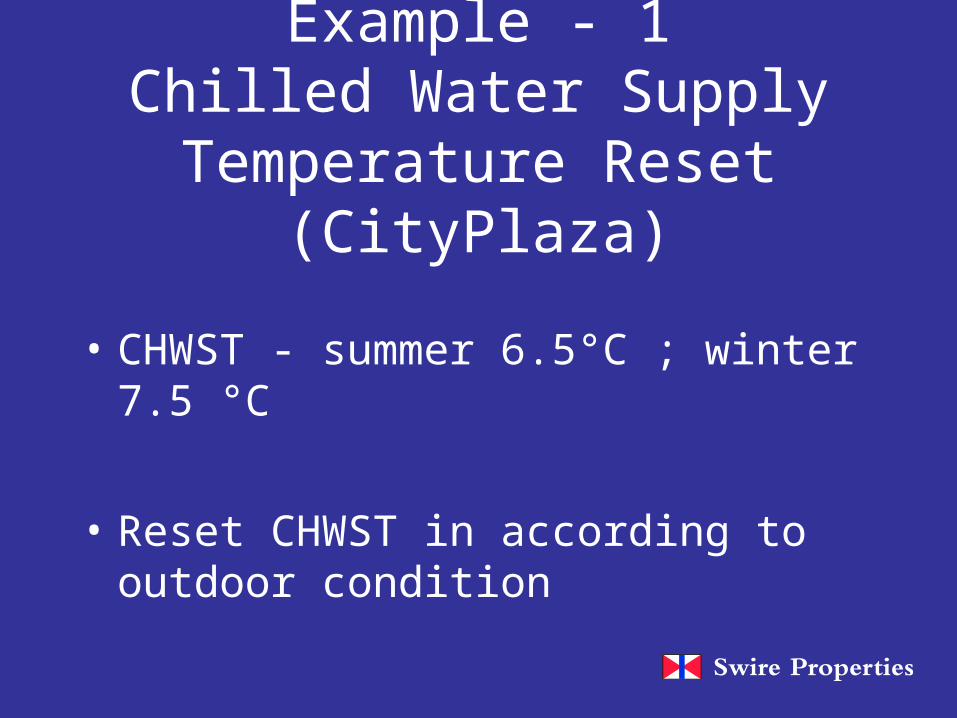
Example - 1Chilled Water Supply
Temperature Reset (CityPlaza)
• CHWST - summer 6.5°C ; winter 7.5 °C
• Reset CHWST in according to outdoor condition
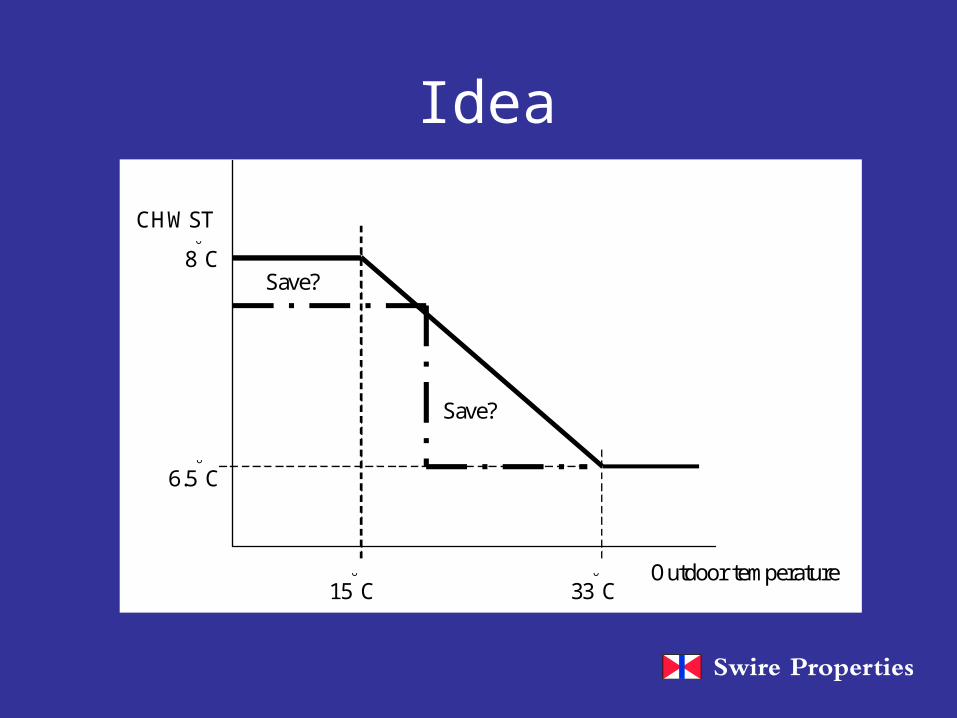
Idea
15C 33C
6.5C
8C
Outdoor temperature
CHWST
Save?
Save?
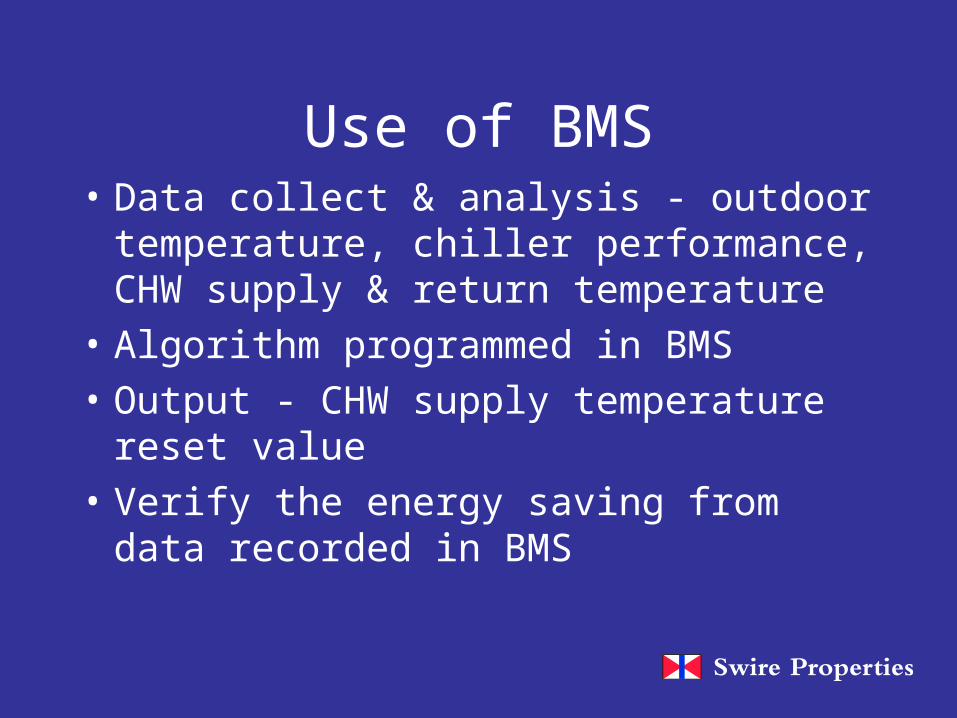
Use of BMS• Data collect & analysis - outdoor
temperature, chiller performance, CHW supply & return temperature
• Algorithm programmed in BMS
• Output - CHW supply temperature reset value
• Verify the energy saving from data recorded in BMS
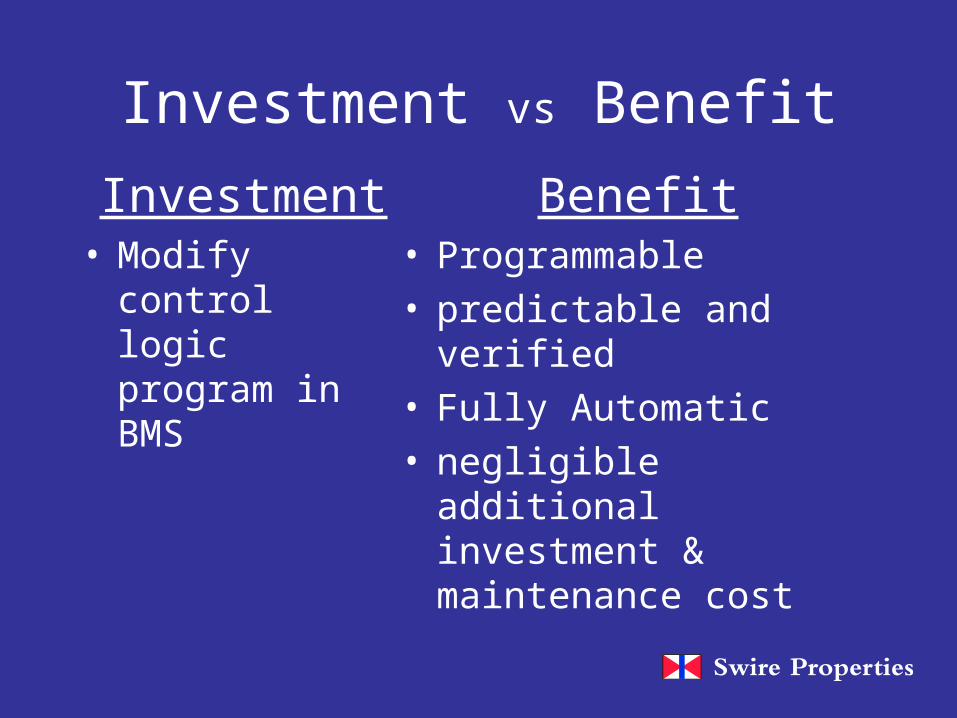
Investment vs Benefit
Investment• Modify control
logic program in BMS
Benefit• Programmable• predictable and verified• Fully Automatic• negligible additional
investment & maintenance cost
Example 2Free Cooling by Outdoor Air
(Taikoo Place)
• Constant amount of outdoor air intake
• Amount of outdoor air intake in according
to the air temperature between outdoor &
indoor
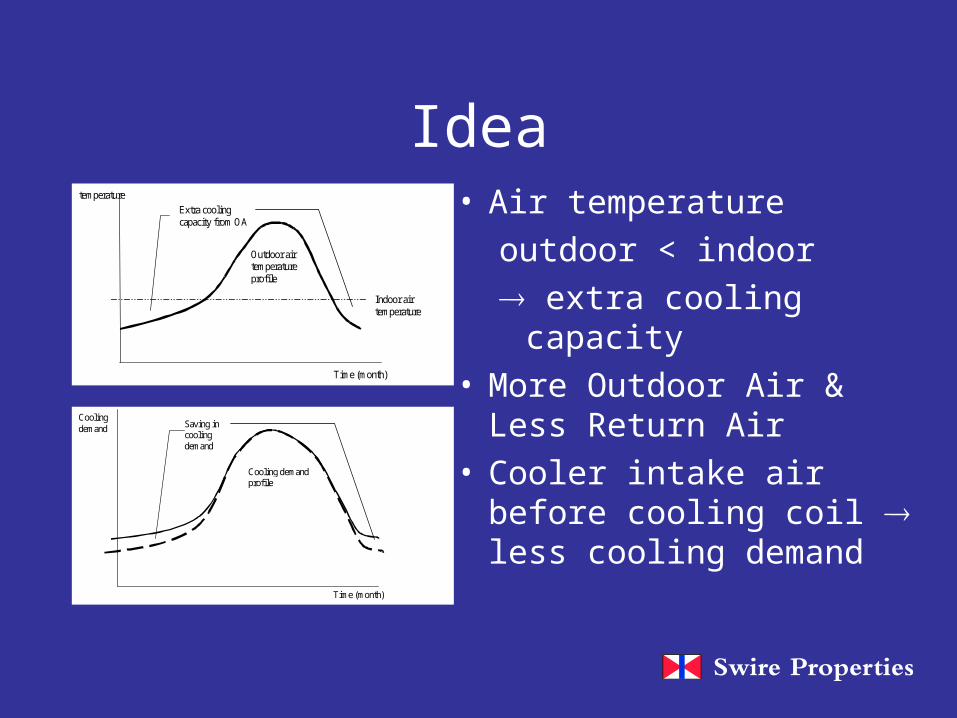
Idea• Air temperature
outdoor < indoor
extra cooling capacity• More Outdoor Air & Less
Return Air• Cooler intake air before
cooling coil less cooling demand
Indoor airtemperature
temperature
Outdoor airtemperatureprofile
Time (month)
Extra coolingcapacity from OA
Saving incoolingdemand
Cooling demandprofile
Time (month)
Coolingdemand
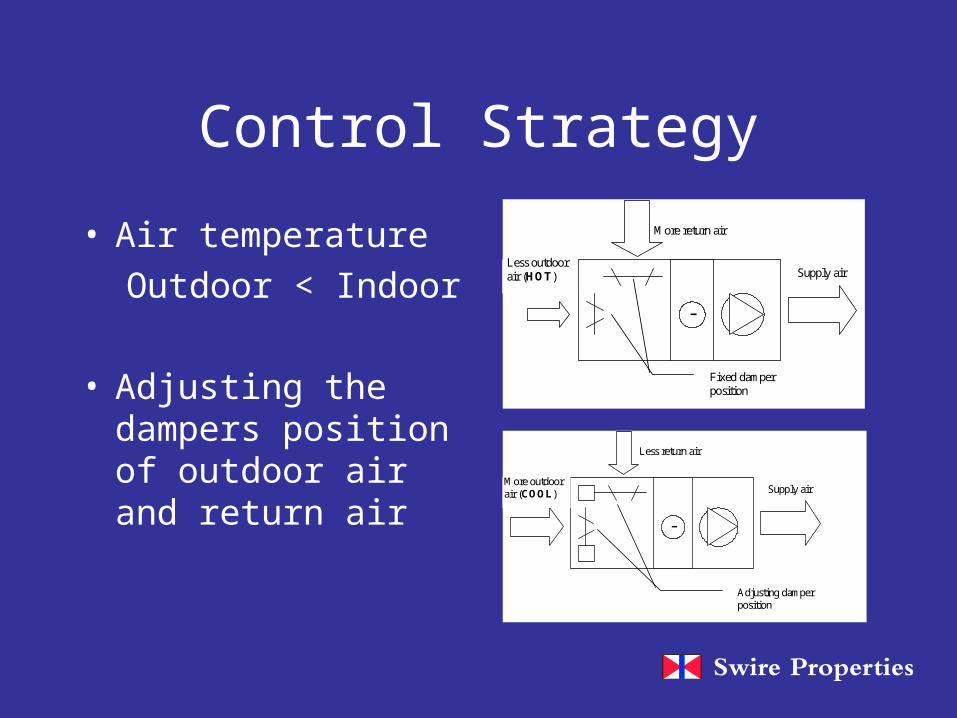
Control Strategy
• Air temperature
Outdoor < Indoor
• Adjusting the dampers position of outdoor air and return air
-
More return air
Less outdoorair (HOT) Supply air
Fixed damperposition
-
Less return air
More outdoorair (COOL) Supply air
Adjusting damperposition
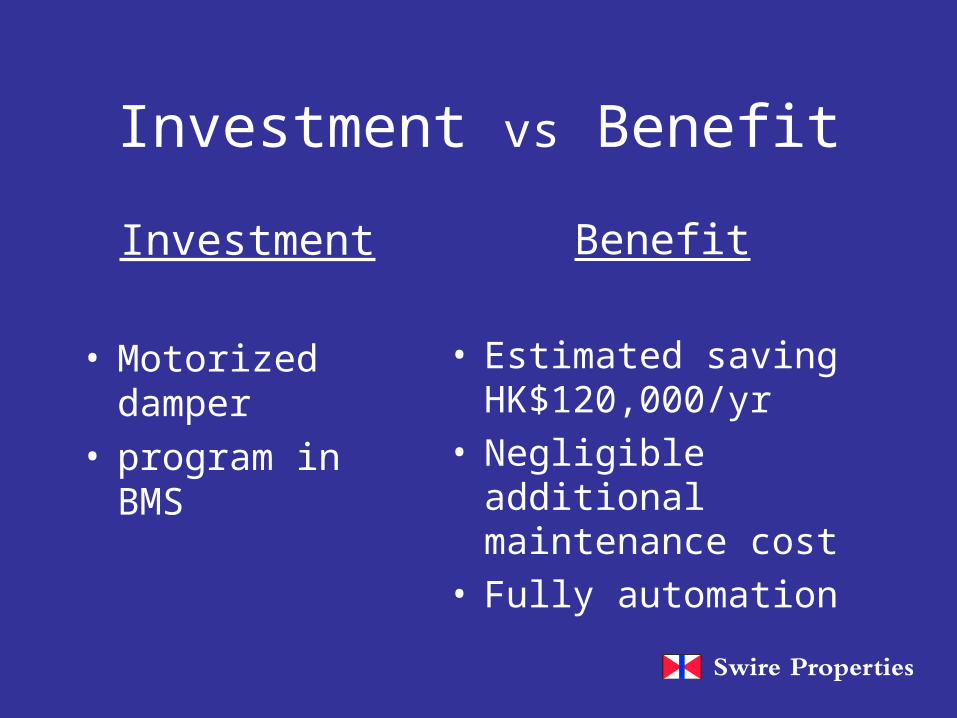
Investment vs Benefit
Investment
• Motorized damper• program in BMS
Benefit
• Estimated saving HK$120,000/yr
• Negligible additional maintenance cost
• Fully automation
Example 3Carpark Ventilation Control Based on Actual CO level
(CityPlaza)
• Any air quality problem?
• Fans are operated in 2 speed
– High speed 7:00 – 23:00
– Low speed 23:00 – tomorrow 7:00
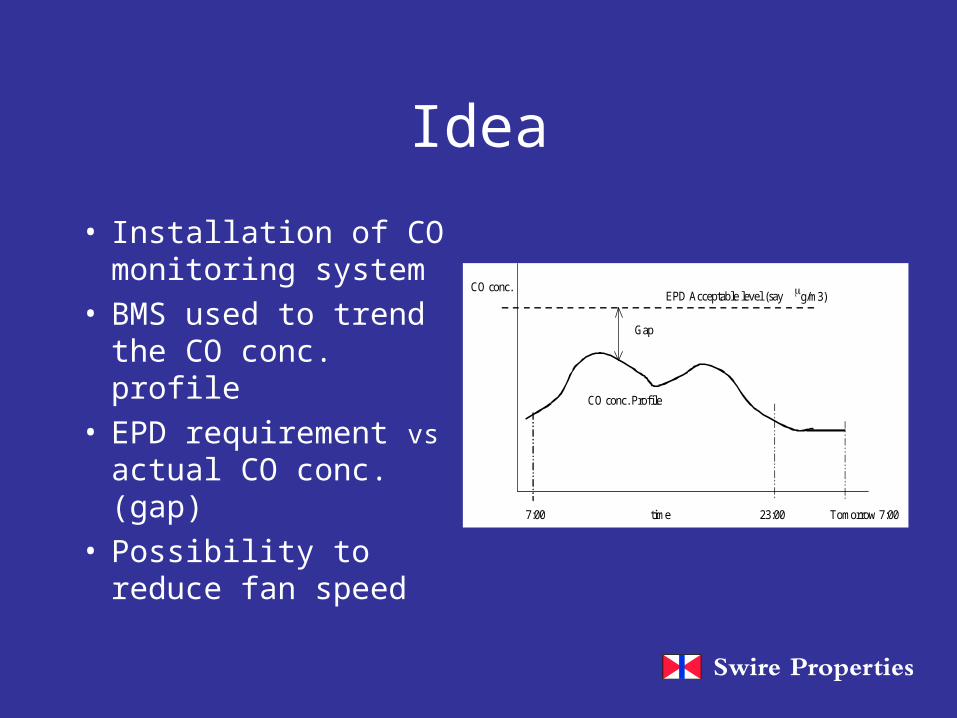
Idea
• Installation of CO monitoring system
• BMS used to trend the CO conc. profile
• EPD requirement vs actual CO conc. (gap)
• Possibility to reduce fan speed
EPD Acceptable level (say10,000
g/m3)
7:00 23:00 Tomorrow 7:00time
Gap
CO conc.
CO conc. Profile
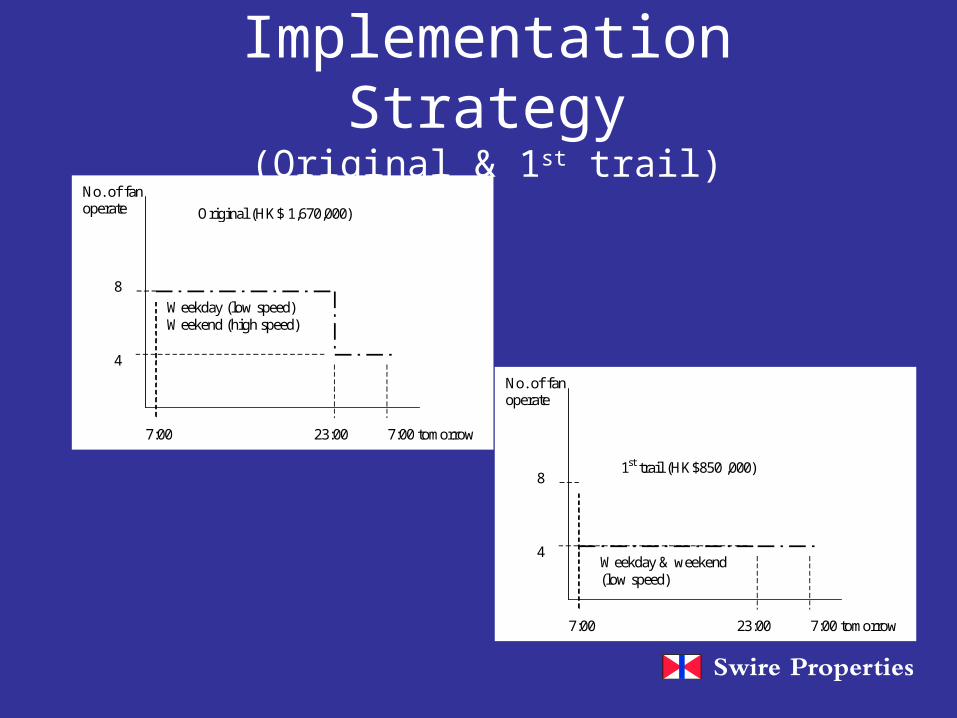
Implementation Strategy(Original & 1st trail)
No. of fanoperate
7:00 tomorrow7:00 23:00
8
4
Original (HK$ 1,670,000)
Weekday (low speed)Weekend (high speed)
No. of fanoperate
7:00 tomorrow7:00 23:00
8
4
1st trail (HK$850 ,000)
Weekday & weekend(low speed)
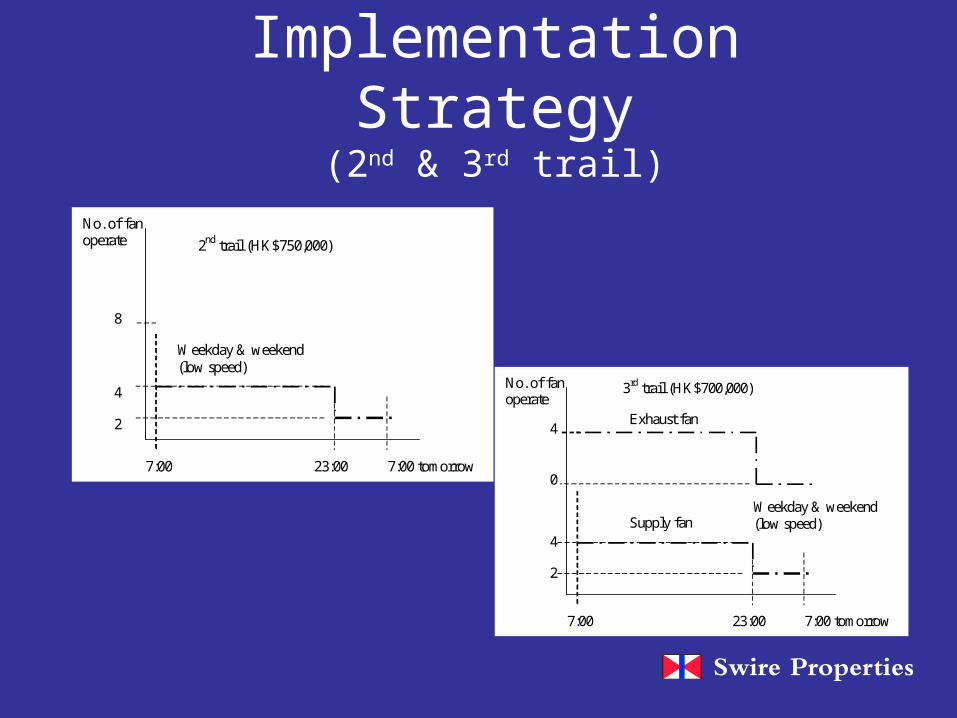
Implementation Strategy(2nd & 3rd trail)
No. of fanoperate
7:00 tomorrow7:00 23:00
8
4
2nd trail (HK$750,000)
2
Weekday & weekend(low speed)
No. of fanoperate
7:00 tomorrow7:00 23:00
0
4
3rd trail (HK$700,000)
2
4Exhaust fan
Supply fanWeekday & weekend(low speed)
Use of BMS
• Data collect & analysis - CO level
• Fan schedule programmed in BMS
• Output - Fan ON/OFF in high / low speed
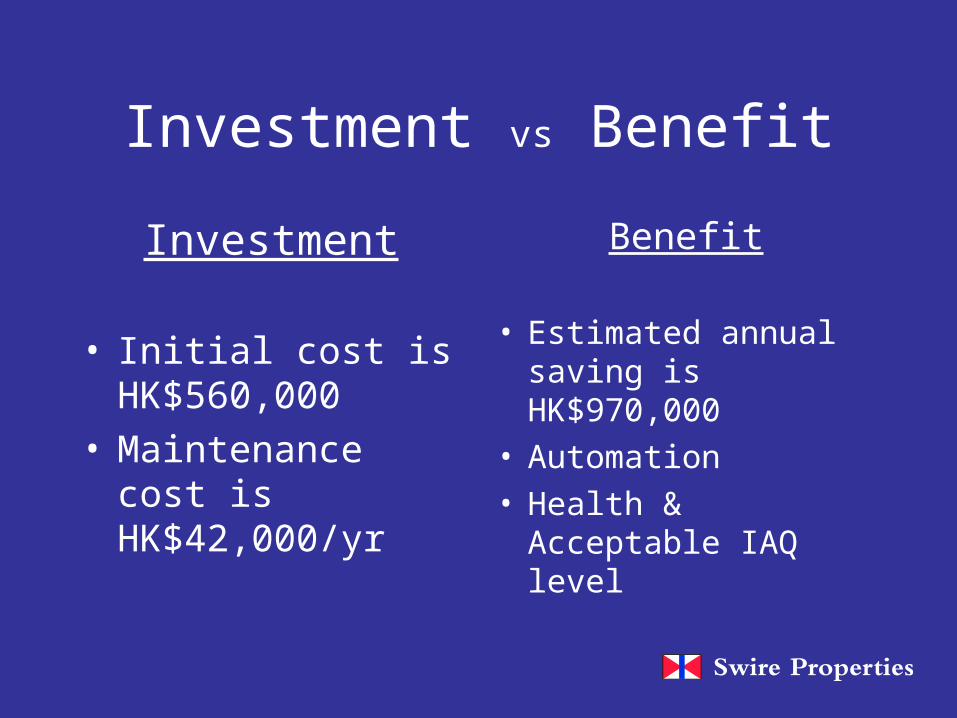
Investment vs Benefit
Investment
• Initial cost is HK$560,000
• Maintenance cost is HK$42,000/yr
Benefit
• Estimated annual saving is HK$970,000
• Automation• Health & Acceptable
IAQ level
Example 4
Optimal AHU/PAU Start Up Time in A/C System
Background
• Office Tower A/C hour 08:00-19:00
• AHUs start at 07:00 / 07:30 for pre-cooling
• PAUs start with AHU
• BMS to control the A/C system
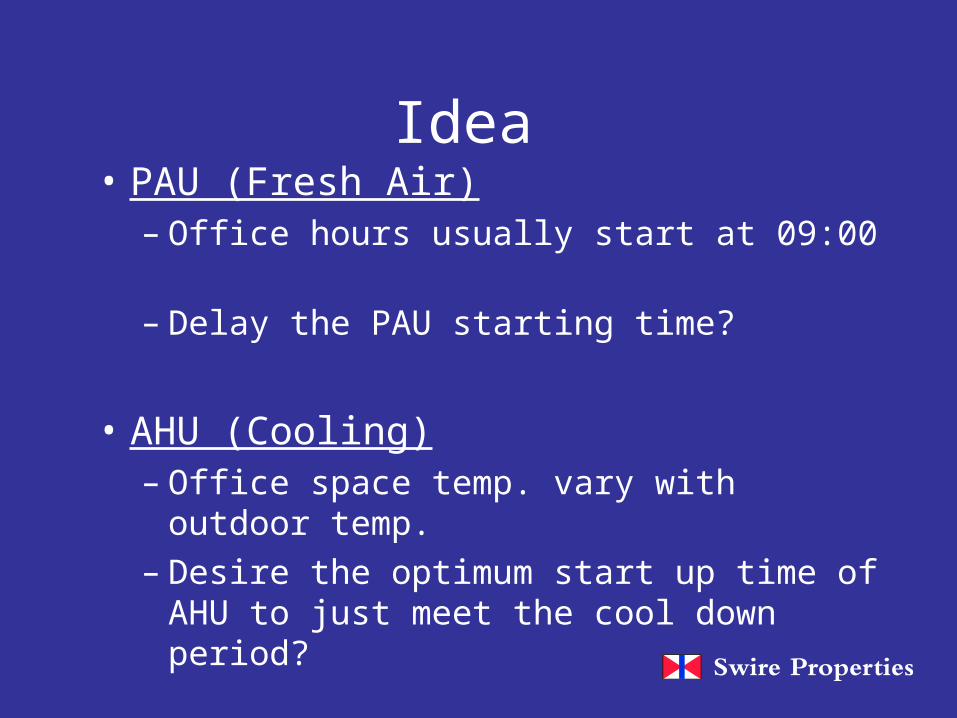
• PAU (Fresh Air)– Office hours usually start at 09:00– Delay the PAU starting time?
• AHU (Cooling)– Office space temp. vary with outdoor temp.– Desire the optimum start up time of AHU to
just meet the cool down period?
Idea
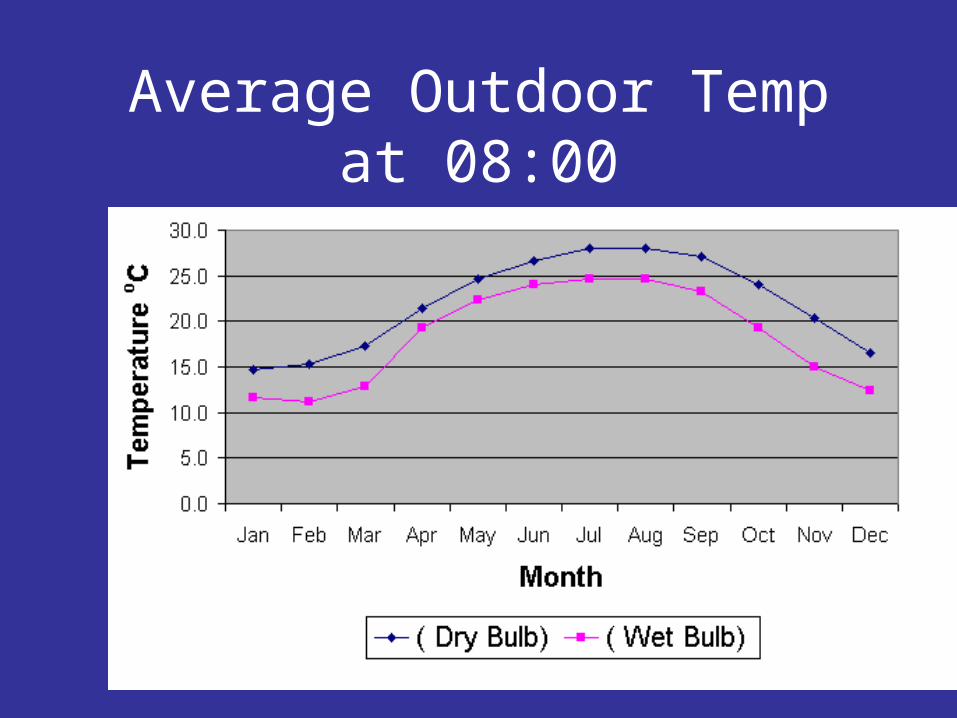
Average Outdoor Temp at 08:00
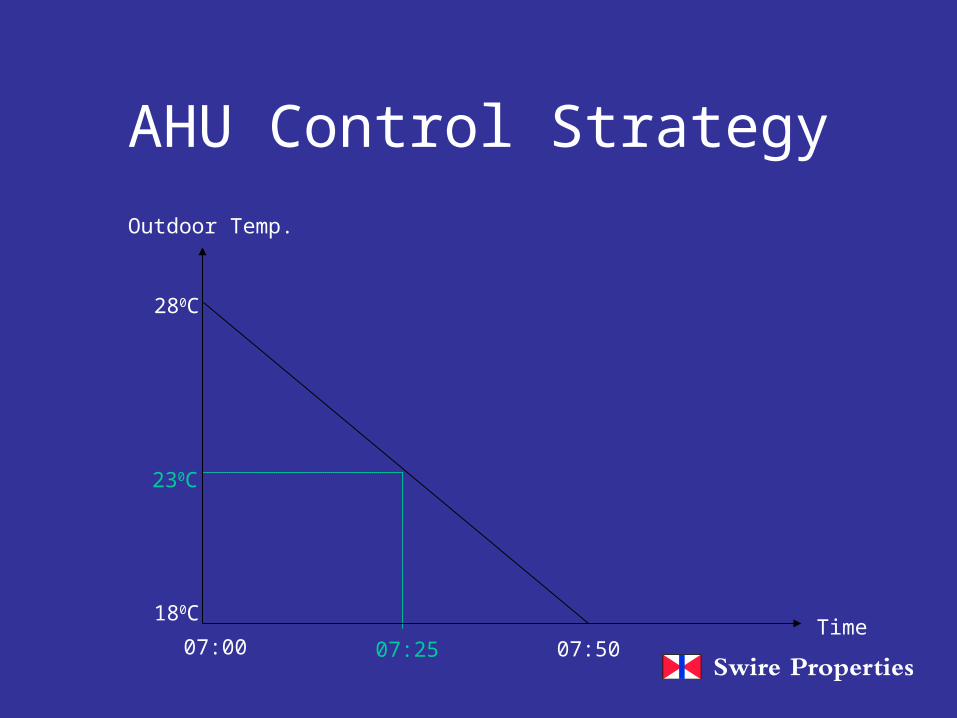
AHU Control Strategy
230C
07:2507:00 07:50Time
280C
180C
Outdoor Temp.
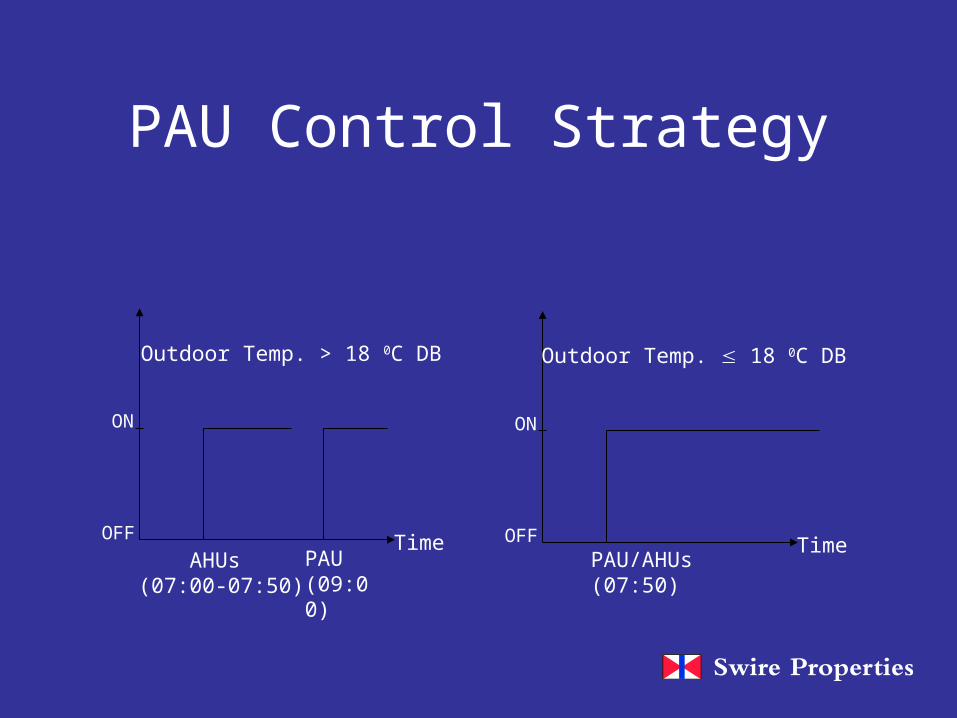
PAU Control Strategy
PAU(09:00)
AHUs(07:00-07:50)
Time
ON
OFF
Outdoor Temp. > 18 0C DB
PAU/AHUs(07:50)
Time
ON
OFF
Outdoor Temp. 18 0C DB
Use of BMS
• Feedback signal – outdoor temperature
• Programming in BMS
• Output - AHU/PAU start up time
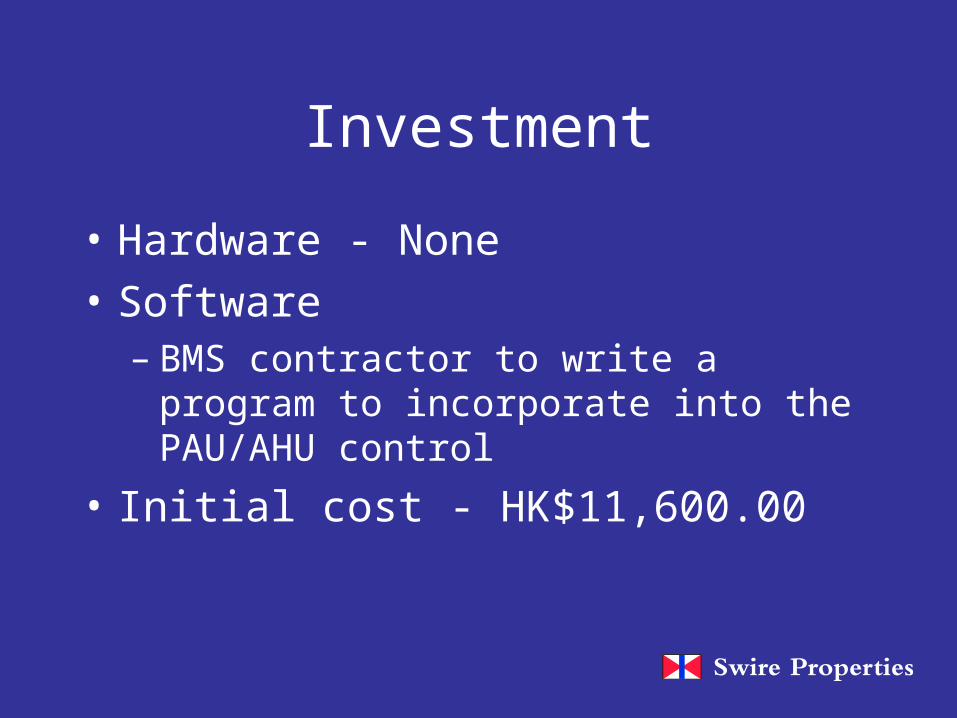
Investment
• Hardware - None
• Software– BMS contractor to write a program to
incorporate into the PAU/AHU control
• Initial cost - HK$11,600.00
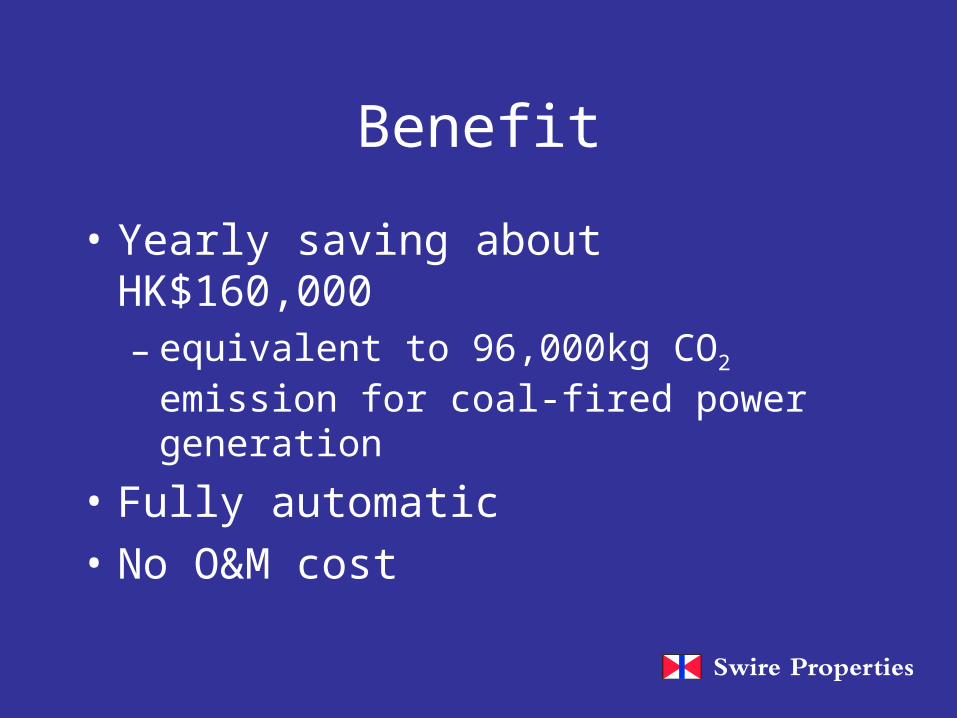
Benefit
• Yearly saving about HK$160,000– equivalent to 96,000kg CO2 emission for coal-
fired power generation
• Fully automatic
• No O&M cost

Example 5Optimal Static Pressure Reset in
Variable Air Volume A/C System
2002 Hong Kong Eco-Business Awards
Green Innovative Practice
‘Gold’ Award

CityplazaTaikoo Shing
• Built in 1997
• Grade A office with over 50000m2
• HK BEAM -Excellent rating
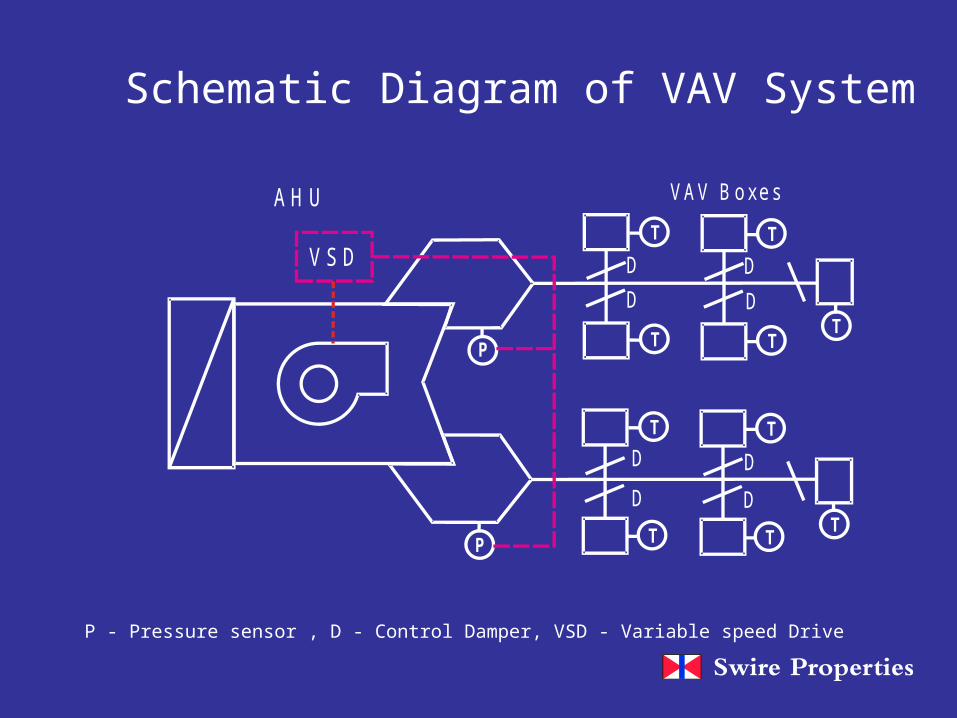
Schematic Diagram of VAV System
P - Pressure sensor , D - Control Damper, VSD - Variable speed Drive
VSD
P
P
T
T
VAV BoxesAH U
T
T
T
T
T
T
T
T
D
D
D
D
D
D
D
D
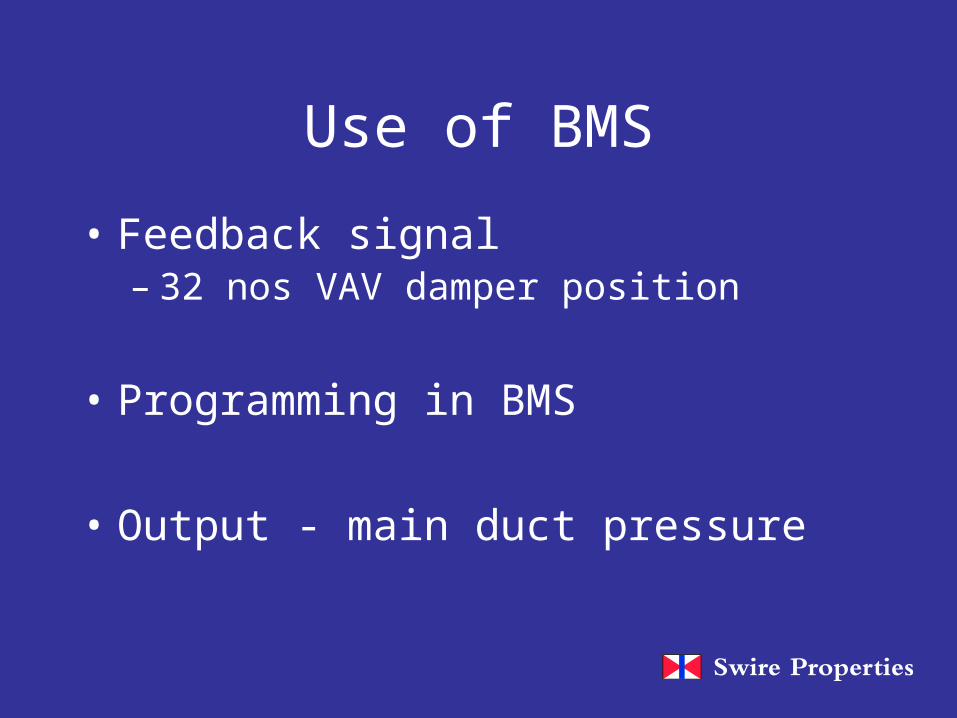
Use of BMS
• Feedback signal – 32 nos VAV damper position
• Programming in BMS
• Output - main duct pressure
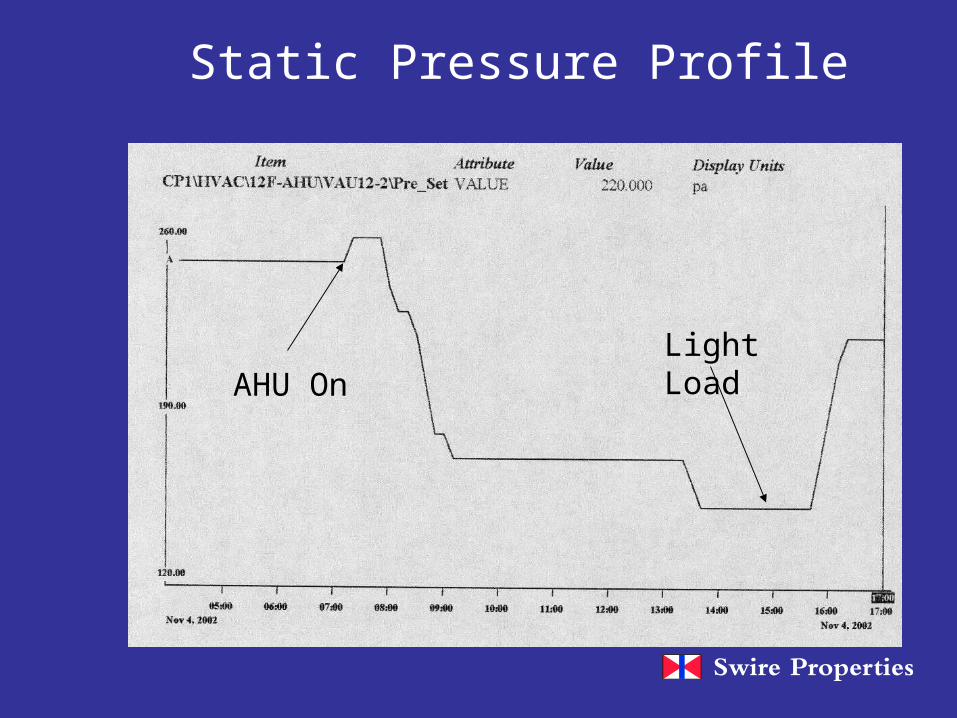
Static Pressure Profile
Light LoadAHU On
Investment
• Hardware– added a control unit
• Software– BMS contractor to write a program according
to designed control logic
• Initial cost - HK$69,400.00
Benefit
• Yearly saving is about HK$200,000– equivalent to 120,000kg CO2 emission for coal-
fired power generation
• VAV boxes re-commissioned
• noise reduced at part load
• assist in VAV fault diagnosis
• Fully automatic
Future Development
• Fruitful quality of information
• Web base performance
• Self learning
• fault detection and diagnostic

Thank You!