Embed Size (px)
Citation preview
1
Energy Management Strategies based on Efficiency Map for
Fuel Cell Hybrid Vehicles
Diego Feroldi (corresponding author), Maria Serra, and Jordi Riera
Institut de Robòtica i Informàtica Industrial (CSIC-UPC)
C. Llorens i Artigas 4, 08028 Barcelona, Spain
E-mail: [email protected]
Telephone: 34 93 4015754; fax: 34 93 4015750
Abstract
The addition of a fast auxiliary power source like a supercapacitor bank in fuel cell-
based vehicles has a great potential because permits a significant reduction of the
hydrogen consumption and an improvement of the vehicle efficiency. The Energy
Management Strategies, commanding the power split between the power sources in the
hybrid arrangement to fulfil the power requirement, perform a fundamental role to
achieve this objective. In this work, three strategies based on the knowledge of the fuel
cell efficiency map are proposed. These strategies are attractive due to the relative
simplicity of the real time implementation and the good performance. The strategies are
tested both in a simulation environment and in an experimental setup using a 1.2-kW
PEM fuel cell. The results, in terms of hydrogen consumption, are compared with an
optimal case, which is assessed trough an advantageous technique also introduced in
this work and with a pure fuel cell vehicle as well. This comparative reveals high
efficiency and good performance, allowing to save up to 26% of hydrogen in urban
scenarios.
Keywords: Proton exchange membrane; Fuel Cell Hybrid Vehicle; Automotive
application; Energy Management Strategy; Supercapacitor; Efficiency map
2
1. Introduction
Given the serious environmental problems and the anticipated fuel shortage for the next
decades it is important to find more efficient forms of using the power resources,
affecting minimally the environment. According to different sources, such as [1], global
oil reserves are only sufficient for around 40 years with the current level of oil
production. However, the global economy is rapidly increasing with a subsequent
increase in oil consumption: the total primary energy consumption has grown from
6128 Mtoe in 1973 to 11435 Mtoe in 2005; meanwhile, the CO2 emission has grown
from 15661 Mt to 7136 Mt in the same period [2]. Thus, oil reserves will therefore be
probably exhausted in a much shorter time period.
The main advantage of fuel cell-based vehicles as opposed to those with internal
combustion engine is that in the former the energy conversion is direct (without
combustion), allowing a higher efficiency and practically null emission of polluting
agents. The efficiency of a fuel cell-based vehicle using hydrogen is twice the
efficiency of a gasoline vehicle [3-4]. Moreover, unlike the internal combustion engines,
the fuel cell efficiency is also high at partial loads: a vehicle running in urban or
suburban areas is demanding a small fraction of the rated fuel cell power most of the
time [5]. Thus, fuel cell-based vehicles have long term potential to be the mainstream
vehicle in the future because they have almost zero emission and compatible driving
range to internal combustion vehicles [6].
Fuel Cell Hybrid Vehicles (FCHV) is a promising fuel cell application that has taken
more and more importance in the last years and is considered the most attractive long-
term option for passenger cars [7]. Hybridization in fuel cell-based vehicles consists in
3
adding a supplementary energy storage element (e.g., a battery or a supercapacitor
bank) to the primary power source (i.e., the fuel cell system) in order to adequate in an
optimum way the energy generation to the consumption. This procedure has important
advantages, allowing a greater reduction of the hydrogen consumption. Depending on
how the necessary power is obtained, a minimization of the hydrogen consumption can
be achieved: the Energy Management Strategies (EMSs) are algorithms which
determine at each sampling time the power generation split between the Fuel Cell
System (FCS) and the Energy Storage System (ESS) in order to fulfil the power balance
between the load power and the power source.
The EMSs in FCHV is an open issue, existing different approaches in the literature. In
the work of Thounthong et al. [8], the strategy is based on DC link voltage regulation
though the control of the power converters but does not deal with the system efficiency.
Jung et al. [9] propose a control strategy with two objectives, to obtain high efficiency
and to maintain a minimum state of charge in the batteries, giving priority to the second.
On the other hand, other literature works are focused on strategies based on
optimization theory. Paganelli et al. [10] present a method based on a control strategy
called Equivalent Consumption Minimization Strategy. This strategy demonstrates to be
robust under a wide range of operating conditions. Nevertheless, the efficiency is
sensible to several parameters. In the same line, Rodatz et al. [11] implement a real time
control by using the same concept of equivalent hydrogen consumption, showing
experimental results. Another optimization algorithm, presented in [12], diminishes a
cost function depending only on system variables considered at the present time but the
conclusion is that the efficiency is not significantly improved.
4
With regard to the energy storage element in FCHV, some publications in the literature
analyze the feasibility and performance of supercapacitors. Karden et al. [13],
analyzing energy storage devices for hybrid electric vehicles, conclude that
supercapacitors are effective for pulse power applications. Kotz et al. [14] analyze a
pilot system on small scale that represents a hybrid vehicle with fuel cell (FC) and
supercapacitors, demonstrating that supercapacitors are excellent energy storage
devices, which can be efficiently used in vehicle applications for energy braking
recovering and peak power reinforcing. Another approach using supercapacitors is
found in the work of Caux et al. [15, 16] in a tramway application. Schiffer et al. [17]
and Kim et al. [18] also show the benefits of using a fuel cell-supercapacitor system for
FCHVs.
The main objective of EMSs is to improve the efficiency reducing the hydrogen
consumption along the driving cycle. To find a global optimal solution, control
techniques where a minimization problem is resolved have been studied, e.g. in [19]. In
general, these techniques do not offer a causal solution, and, in consequence, are not
feasible because it is assumed that the future driving cycle is entirely known a priori.
Nevertheless, their results can be used to make comparative analysis of the performance
of new strategies in study. On the other hand, strategies which deal with local
optimization are convenient for real implementation. Another approach, particularly
convenient to work in real time operation, is the type of strategies where the system
operation is based on heuristic rules derived from the knowledge of the performance of
the system’s components. These strategies can achieve a comparable performance to
those strategies where some optimization technique is utilized.
5
In this work, three energy management strategies for FCHVs are presented. The
strategies are based on the knowledge of the fuel cell efficiency map: two of them are
heuristic type strategies and the third strategy is based on constrained nonlinear
programming. Besides, a novel method to asses the optimal consumption knowing the
future driving profile is presented. This last result is used to compare the performance of
the proposed strategies. The FCHV in study is based on a small car with the energy
storage system composed by a supercapacitor bank and the entire system is modelled
using ADVISOR (ADvanced VehIcle SimulatOR is a toolbox developed by the
National Renewable Energy Laboratory with the aim of analyzing the performance and
fuel economy of conventional, electric, and hybrid vehicles [20, 21]) in
MATLAB/SIMULINK. The proposed strategies are tested both in simulation and in an
experimental setup, showing an auspicious performance.
The organization of the paper is as follows. In Section 2, Fuel Cell Hybrid Vehicles are
introduced showing the advantages and the mechanism that allows improving the
efficiency. Then, the proposed Energy Management Strategies are introduced in Section
3. In Section 4, the simulation results obtained using these strategies are presented,
including the description of the procedure to asses the minimum consumption. In
Section 5, the experimental validation is presented, describing the experimental setup
and showing the comparative results. Finally, the discussion of the results and the
conclusions of the work are in Section 6 and 7, respectively.
2. Fuel Cell Hybrid Vehicles (FCHVs)
In a Fuel Cell Hybrid Vehicle (FCHV), the powertrain is composed by the fuel cell
system and an Energy Storage System (ESS) in order to increase the efficiency of the

6
integrated system (Fig. 1). Given a certain load power Pload(t), this can be supplied with
some power from the fuel cell system, Pfcs(t), being the rest of power supplied by the
energy storage system, Pess(t). The power balance in the DC bus must be fulfilled at
every time:
/( ) ( ) ( )fcs B ess B B ess loadP t P t P t tη η η+ = ∀ , (1)
where ηB, ηB/B, and ηess are the efficiency of the power converter that connects the fuel
cell with the bus, the efficiency of the power converter that connects the ESS with the
bus, and the efficiency of the ESS, respectively. The control of the DC/DC converters is
beyond the scope of this paper. We assume that the converters are controlled and their
efficiencies are known.
In a FCHV, three different mechanisms allow this efficiency improvement:
1. In automotive applications, it is possible to recover energy from regenerative
braking, allowing a considerable improvement in the hydrogen economy. The recovered
energy from regenerative braking may represent an important fraction of the economy
improvement. However, the amount of energy that is possible to recover is strongly
dependent on the driving profile. In urban driving cycles, in which there is considerable
braking, the percentage of regenerated energy is much greater than in non-urban cycles
where this percentage is quite small.
2. The efficiency of a FCS is high at partial loads. Therefore, it is convenient to
perform an energy management in which the fuel cell is preferably operated in its
maximum efficiency zone. Thus, taking advantage of an auxiliary power source, e.g. the
storage system, and an adequate energy strategy, it is possible to maintain the fuel cell

7
operating at its maximum efficiency region most of the time and reduce the hydrogen
consumption.
3. In a pure fuel cell vehicle, the fuel cell must be sized to meet the largest load.
One important advantage of hybridization is that it allows a diminution of the rated
power of the fuel cell stack in these types of applications. Therefore, it is possible to
meet the demand with a smaller FCS in combination with an energy storage system.
Besides, downsizing the FCS has an impact on the hydrogen economy in three ways: i)
downsizing leads to improvements in the hydrogen economy when the peak efficiency
of the FC stack is shifted to better match with the power requirements for a given load
cycle, ii) downsizing leads to a smaller compressor reducing the parasitic losses, and iii)
downsizing reduces the total mass of the vehicle.
Although the main motivation for introducing hybridization in fuel cell systems is to
improve the hydrogen economy, the benefits are not limited to that. In fact,
hybridization is also useful to solve two important problems in fuel cell control:
1. The dynamics of FCS are relatively slow, mainly because of the dynamics of the
air compressor and the manifold-filling dynamics [22]. In this context, an energy flow
from an energy storage device with high specific power output is useful to improve the
transient response. In the literature, this issue is not completely solved. In [23], it is
concluded that it is feasible to use a FCS in a load-following mode without any storage
device. In that work, the conclusions are based on results obtained from experimental
data working with a scaled-down FCS through the Federal Urban Driving Schedule
(FUDS). It is remarked that it is possible to pull short bursts of power from the stack,
due to the charge in the double layer (CDL) capacitance. However, several publications,
8
for example [14], [24] or [4], conclude that the use of energy storage devices is
beneficial from both the system dynamics and the hydrogen economy.
2. Hybridization can help avoiding oxygen starvation by means of the energy
supply from the energy storage elements. Thus, the peaks of actual current demand to
the fuel cell are lower than in the pure fuel cell case where no auxiliary power source is
present. Oxygen Starvation is a complicated phenomenon that occurs when the oxygen
partial pressure falls below a critical level at any point in the cathode. It can be
produced by an abrupt increase in the current demand (that produces a rapid increase in
the oxygen consumption due to the cathode electrochemical reaction) and an
insufficient air supply. This phenomenon can be observed by a rapid decrease in the cell
voltage and in severe cases can produce a short circuit and a hot spot on the surface of
the membrane cell [25]. The phenomenon is not well understood and more information
from electrochemical studies is needed to be able to quantify the critical level of oxygen
concentration below which permanent damage is produced or, perhaps more probably,
the combination of current level variation and its time duration.
3. Energy Management Strategies for FCHVs
In this work, a search for new EMSs in FCHVs is addressed, and, despite the Fuel Cell
Hybrid Systems have other applications, we concentrate our attention in automotive
applications. The objective is to improve the performance of a FC hybrid vehicle in
terms of hydrogen economy and transient response.
In Fig. 1 is represented the proposed topology of the system, where the FCS is
connected to the DC bus through a step-up power converter (Boost converter), whereas
the ESS is connected to the DC through a bidirectional power converter (Buck-Boost
9
converter) allowing the energy flow from regenerative braking. With regard to the load,
which is an AC induction motor, it is fed through a DC-AC inverter. This topology is
common in the three strategies proposed. In the same fig. 1, the energy flows in the
FCHS are also represented: the regenerated energy from the load to the ESS bank, the
charging energy from the FCS to the ESS, the boosting energy from the ESS to the load,
and the fuel cell energy that directly supplies the load from FCS.
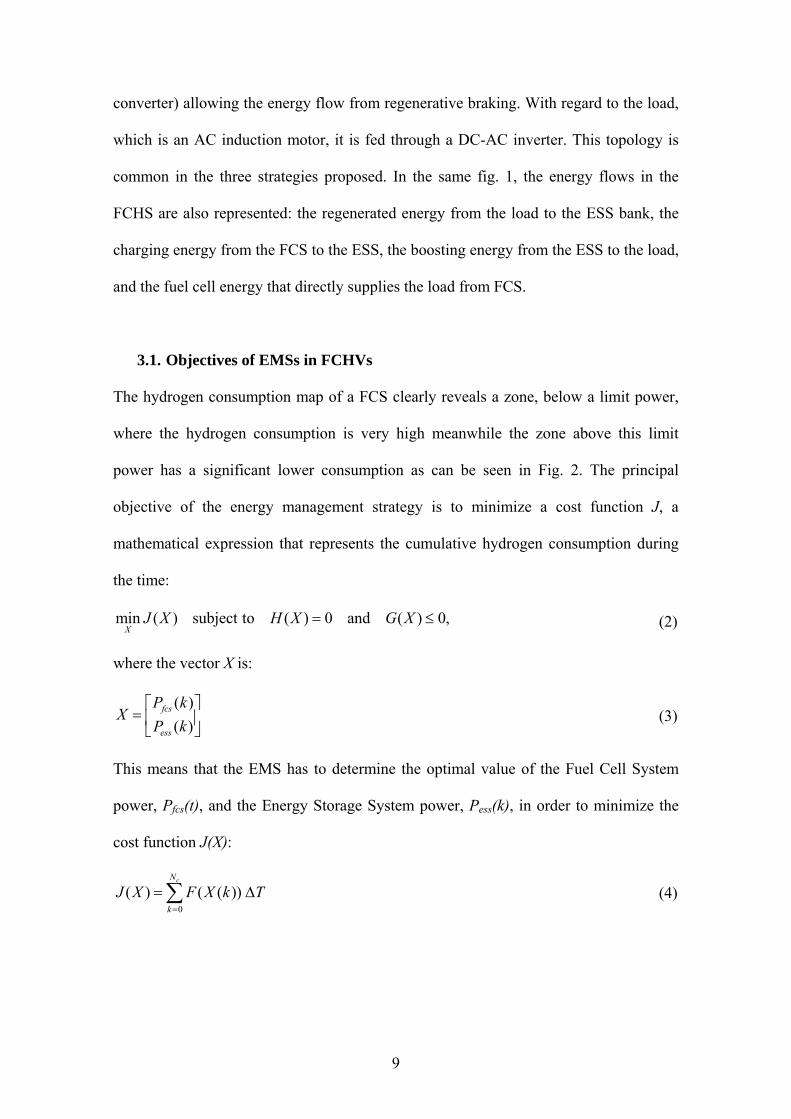
3.1. Objectives of EMSs in FCHVs
The hydrogen consumption map of a FCS clearly reveals a zone, below a limit power,
where the hydrogen consumption is very high meanwhile the zone above this limit
power has a significant lower consumption as can be seen in Fig. 2. The principal
objective of the energy management strategy is to minimize a cost function J, a
mathematical expression that represents the cumulative hydrogen consumption during
the time:
min ( ) subject to ( ) 0 and ( ) 0,X
J X H X G X= ≤ (2)
where the vector X is:
( )( )
fcs
ess
P kX
P k⎡ ⎤
= ⎢ ⎥⎣ ⎦
(3)
This means that the EMS has to determine the optimal value of the Fuel Cell System
power, Pfcs(t), and the Energy Storage System power, Pess(k), in order to minimize the
cost function J(X):
0( ) ( ( ))
cN
kJ X F X k T
=
= Δ∑ (4)

10
where Nc=tc/ΔT is the duration of the driving cycle, assuming a constant sampling
period ΔT=1s, and F(X(k)) is the hydrogen consumption according to the hydrogen
consumption map of the FCS:
( )2( ( )) ( )H fcsF X k Cons P k= (5)
The constraint H(X)=0 in (2) means that at every time the power load in the DC bus
must be satisfied by the power from the FC or the ESS:
/( ) ( ) ( ) 0,1, ,fcs B ess B B ess load cP k P k P k k Nη η η+ = = K (6)
where the efficiencies ηB, ηB/B, and ηess are assumed to be constants.
On the other hand, the constraint G(X)≤ 0 in (2) states the constraints in the FCS and the
ESS power for all k:
,min ,max( )fcs fcs fcsP P k P≤ ≤ (7)
, ,
( )fcsfcs fall rate fcs rise rate
dP kP P
dtΔ ≤ ≤ Δ
(8)
( ) ( ), max , max( ) ( ) ( )ess dischrg ess ess chrgP SoE k P k P SoE k≤ ≤ (9)
min max( )SoE SoE k SoE≤ ≤ (10)
The inequality (7) states the restrictions in the FCS power. The maximum power is
limited by the FCS rated power, whereas the minimum FCS power command must be
limited to a value below which it is not suitable to operate because the parasitic load is
too large, reducing the system net power.
There is a phenomenon of delay between the onset of the load on the FCS and the
response of the reactant supply system which may lead in a “starvation” of reactants in
the FCS. This may be avoided by restricting the dynamics required by the load [12].
The same approach is followed in [26] and [14] where the maximum positive rise is
11
limited to avoid damage in the stack. Therefore, in our work, the FCS power load is
increased no faster than a certain power rise rate (ΔPfcs,rise rate). Besides, we propose to
operate the FCS in such a way that the power is decreased no faster than a certain power
fall rate (ΔPfcs,fall rate) to prevent overpressure into the stack. Both situations can be
managed by using the ESS as a power buffer. These restrictions are formulated in (8).
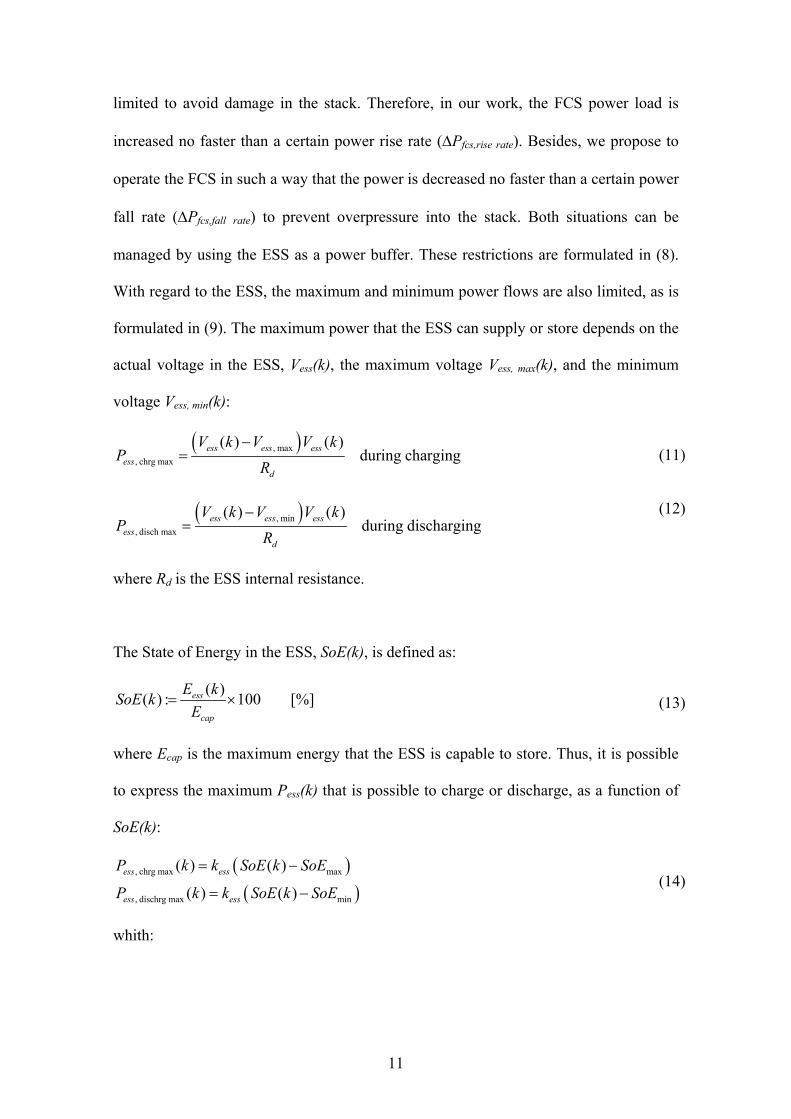
With regard to the ESS, the maximum and minimum power flows are also limited, as is
formulated in (9). The maximum power that the ESS can supply or store depends on the
actual voltage in the ESS, Vess(k), the maximum voltage Vess, max(k), and the minimum
voltage Vess, min(k):
( ), max, chrg max
( ) ( )during chargingess ess ess
essd
V k V V kP
R−
= (11)
( ), min, disch max
( ) ( )during dischargingess ess ess
essd
V k V V kP
R−
= (12)
where Rd is the ESS internal resistance.
The State of Energy in the ESS, SoE(k), is defined as:
( )( ) : 100 [%]ess
cap
E kSoE kE
= × (13)
where Ecap is the maximum energy that the ESS is capable to store. Thus, it is possible
to express the maximum Pess(k) that is possible to charge or discharge, as a function of
SoE(k):
( )( )
, chrg max max
, dischrg max min
( ) ( )
( ) ( )ess ess
ess ess
P k k SoE k SoE
P k k SoE k SoE
= −
= − (14)
whith:
12
capess
d R
k Ek
R C= (15)
where Rd and CR are the internal resistance and the capacitance of the supercapacitors,
and k is a constant depending in their particular technology. According to the sign
convention employed, the power is negative when the ESS is in charging mode;
meanwhile it is positive when the ESS is in discharging mode.
The internal resistance of supercapacitors is extremely low and the capacitance is
exceptionally high, allowing a very fast operation both during charging and discharging.
In the supercapacitors employed in this work, they are Rd = 0.019Ω and CR = 58 F,
thus, kess = 479 kW.
The temporal behaviour of FCS is fundamentally conditioned by the compressor
dynamics and the filling dynamics. Besides de minimization of J, another important
EMS objective is to overcome this drawback by means of an adequate energy
management strategy. In that sense, the energy management strategy acts as follows: if
the power requested to the FCS exceeds a determined maximum rise rate, then the
power rise rate that the FCS actually gives is limited and the rest of power is supplied
by the ESS if it is possible according to the present value of SoE(k). If, on the contrary,
the power requested to the FCS exceeds the maximum fall rate, then the actual power
fall rate is limited and the surplus power is absorbed by the ESS whenever there is
sufficient storage capacity.
3.2. Strategy based on the FCS efficiency map
One of the most relevant characteristic of a FCS is the efficiency map (Fig. 2), a chart
that shows how the efficiency changes with the load power. It is supposed that the FCS
13
operating point is controlled [27] and, thus, external parameters such the ambient
temperature have no influence in the efficiency map. The first strategy proposed in this
work is a quasi-load-following strategy where the FCS is operated in an advantageous
zone where the efficiency is high. In this case, the operating zone is constrained
between an inferior limit (Pfcs, lo) and a superior limit (Pfcs, hi). The superior limit is
imposed by the maximum power that the fuel cell can deliver (i.e., Pfcs, hi=Pfcs,max),
whereas the inferior limit is determined according to the efficiency curve. As mentioned
before, the efficiency of a FCS at low power is very poor due to the parasitic power.
Thanks to the inferior limit, the energy management strategy avoids this unfavourable
zone (Fig. 2).
This EMS gives priority to the FCS-power supply since the FCS is the primary power
source and the direct power flow to the DC bus through the FCS power converter has
lower losses than the indirect way through the ESS power converter, the ESS itself and
again to the DC bus through the power converter to supply the load. Consequently,
given the present Pload(k), if:
, , max( )fcs lo B load fcs BP P k Pη η≤ ≤ (16)
and
, ,( )fcs fall rate load fcs rise rateP P k PΔ ≤ Δ ≤ Δ (17)
where:
( ) ( ) ( 1)load load loadP k P k P kΔ = − − (18)
then, the FCS operates in load-following mode:
( ) ( ) /fcs load BP k P k η= (19)
and
14
( ) 0essP k = (20)
If, on the contrary:
,( ) ( )load fcs lo BP k P k η≤ (21)
then:
,( ) ( )fcs fcs loP k P k= (22)
and the ESS stores the rest of generated power if the ESS is not too charged:
/ max( ) min ( ) ( ) , ( )ess load fcs B ess B B essP k P k P k SoE k SoE kη η η= − − − (23)
On the other hand, in the case that the ESS is full charged, then Pfcs(k)=0. Conversely,
if:
,( ) ( )load fcs hi BP k P k η≥ (24)
then:
, max( )fcs fcsP k P= (25)
and the ESS supplies the rest of load power if there is enough energy in ESS:
( ) ( )min/
( ) ( )( ) min , ( ) .load fcs B
ess essB B ess
P k P kP k SoE k SoE k
η
η η
⎧ ⎫−⎪ ⎪= −⎨ ⎬⎪ ⎪⎩ ⎭
(26)
In Fig. 3, it is represented how is determined the FCS operating point. However, the
transition between operating points is limited by the maximum rates, thus, finally:
, ,
, ,
( 1) , if ( )( )
( 1) , if ( )fcs fcs fall rate fcs fcs fall rate
fcsfcs fcs rise rate fcs fcs rise rate
P k P T P k PP k
P k P T P k P− + Δ Δ Δ ≤ Δ⎧
= ⎨ − + Δ Δ Δ ≥ Δ⎩ (27)
where ΔPfcs=Pfcs(k)−Pfcs(k − 1), with Pfcs(k) as it was previously calculated in (19), (22)
or (25), according to the conditions (16), (21) or (24), respectively. The power Pess(k) is
calculated as in indicated in (23) and (26).

15
3.3. Improved strategy based on the FCS efficiency map
The second strategy based on the FCS efficiency map is a strategy which operates the
FCS preferably in its point of maximum efficiency in order to improve the hydrogen
economy, although the final operating point of the FCS is determined based on the
actual power demand and the state of energy of the ESS. The FCS power command is
determined according to the following rules. If the load power is:
, ,( )fcs lo B load fcs hi BP P k Pη η≤ ≤ (28)
and, the SoE is:
( )lo hiSoE SoE k SoE≤ ≤ (29)
where Pfcs, hi is:
, , max , ,fcs hi fcs B fcs hiP P Xη= (30)
and Xfcs, hi is a fraction of the maximum FCS power; then, the FCS is operated in its
point of maximum efficiency:
, max( )fcs fcs effP k P= (31)
The remaining power to achieve the load demand flows from or to the ESS according to
(26) if Pload(k) > Pfcs,max eff (discharging mode), or (23) if Pload(k) < Pfcs,max eff (charging
mode).
If the load power is:
, , max( )fcs hi B load fcs BP P k Pη η≤ ≤ (32)
and the SoE is:
( )lo hiSoE SoE k SoE≤ ≤ (33)
then, the FCS is operated in load following mode:
( ) ( ) /fcs load BP k P k η= (34)
and Pess(k) is as indicated in (23) or (26).
16
On the other hand, if:
, max( )load fcs BP k P η≥ and ( ) hiSoE k SoE≤ (35)
or:
( ) loSoE k SoE≤ (36)
then, the FCS is operated at its maximum power:
, max( )fcs fcsP k P= (37)
and Pess(k) is as indicated in (26). If, on the contrary:
,( )load fcs lo BP k P η≤ and ( ) loSoE k SoE≥ , (38)
or:
( ) hiSoE k SoE≥ (39)
then, the FCS is operated at its lower operating point:
,( )fcs fcs loP k P= , (40)
and Pess(k) is as in (23). Additionally, if Pload(k) = 0 ∀t ∈ [k1, k2] with (k2−k1) > Toff ,
and, SoE(k) > SoEhi with k > k2, then, the FCS is turned off to avoid unnecessary
hydrogen consumption because the parasitic losses in the FCS. Figure 4 indicates the
FCS operating point as a function of the SoE(k) and the load power Pload(k). In the same
way that in the previous strategy, the transition between operating points is realized
according to the constraints concerning the maximum fall power rate and the maximum
power rate as indicated in (27).
3.4. Strategy based on constrained nonlinear programming
In this strategy, an optimization problem with linear constraints is resolved at each
sampling period ΔT where a nonlinear cost function, which represents the hydrogen
consumption, is minimized. The problem can be put into the form [28]:

17
min ( ) subject to ( ) 0 and ( ) 0X
J x H X G X= ≤ (41)
where the vector X is:
fcs
ess
PX
P⎡ ⎤
= ⎢ ⎥⎣ ⎦
. (42)
The cost function J(X) represents the hydrogen consumption in the FCS:
( ) ( )( )fcsJ X F P k= (43)
where
( ) ( )2( ) ( ) ( )fcs fcs fcsF P k ConsH P k P k T= Δ , (44)
and ConsH2(Pfcs(k)) is the hydrogen consumption (g Wh−1) as a function of Pfcs(k). This
relationship is shown in the form of a consumption map in Fig. 2.
The set of constraints H(X) = 0 represents the power balance in the DC bus as in (6) and
the set of constraints G(X) ≤ 0 represents the limitations in Pfcs(k) and Pess(k). The Pfcs(k)
is limited in its maximum and minimum value, and in the maximum rise rate and fall
rate, thus:
, max , ,( ) max ; ( 1)fcs fcs hi fcs fall rateP k P P k P T⎡ ⎤= − + Δ Δ⎣ ⎦ (45)
, min , ,( ) min ; ( 1)fcs fcs lo fcs rise rateP k P P k P T⎡ ⎤= − + Δ Δ⎣ ⎦ (46)
On the other hand, Pess(k) is limited to its maximum or minimum value depending on
the actual SoE(k). The SoE(k) is limited:
min max( )SoE SoE k SoE≤ ≤ (47)
thus:
( ) ( )max min( ) ( ) ( )ess ess essk SoE k SoE P k k SoE k SoE− ≤ ≤ − (48)
where kess is the constant defined in (15).
18
4. Simulation results
The enunciated strategies were tested by simulation with a model of a hybrid system
consisting in the vehicle described in Table 1, provided with a FCS and a
supercapacitors-based ESS with the principal parameters listed in Table 2. The
supercapacitor bank is sized in order to accomplish the following acceleration
requirement: the vehicle (with total mass 1380 kg including an extra cargo mass) must
be capable to accelerate from 0 to 96.5 kph in 10 s with a 15-kW FCS. The fuel cell is
sized in order to be possible to fulfil all the Standard Driving Cycles described in
Section 4.1. On the other hand, the strategy parameters Pfcs,lo and Pfcs,hi are adjusted in
order to maximize the fuel economy and performance according to the particular
strategy and cycle. Their values are shown in Table 3.
4.1. Testing the EMSs with standard driving cycles
The strategies were tested on four Standard Driving Cycles: the New European Driving
Cycle (NEDC), the Urban Dynamometer Driving Schedule (UDDS), the Federal Test
Procedure (FTP), and the Highway Fuel Economy Test (HWFET). These speed
profiles, representing urban and highway scenarios, were originally stated for measuring
pollutant emissions and gasoline economy of engines [29] and are widely used in the
literature to evaluate the performance of EMSs and to assess the hybridization degree
(i.e., the parameter that indicates the relation between the maximum power of the fuel
cell and the maximum power of the energy storage system).
To illustrate the behaviour of the proposed strategies, the simulation results
corresponding to the NEDC cycle are shown: the power split between the fuel cell
system and the energy storage system, and the evolution of the SoE(t) in the ESS are

19
shown in Fig. 5 for the strategy based on efficiency map, in Fig. 6 for the improved
strategy based on efficiency map and in Fig. 7 for the strategy based on constrained
nonlinear programming. These figures are only plotted from time 960 to 1180 s for
clarity.
4.2. Comparative results
A comparative analysis of the strategies for the four cycles, in terms of hydrogen
consumption per kilometre, is shown in Fig. 8. The comparative is done with respect to
the optimal case where the consumption is minimum; the values in percentage indicate
the increment in consumption with respect to the optimal case.
The performance of the optimal case is estimated assuming that the entirely cycle is
known a priori and operating the FCS during the entirely cycle with maximum
efficiency. The proposed procedure to evaluate this minimum consumption is based on
the following assumptions:
• The capacity of storage in the ESS is sufficient to recover all the available energy from
regenerative braking.
• The friction brake is not employed during the entire cycle.
• The power consumption, when the FCS is turned off, is null.
• The FCS is already hot when the cycle starts.
• The entire vehicle mass is fixed for all the cycles: mveh = 1109 kg.
The procedure to determine the optimal hydrogen consumption is as follows. A
simulation is performed for each driving cycle in such a way that the FCS works
alternately in two operating points, namely “On” and “Off”, according to the actual
SoE(k): i) when SoE(k) < SoE(0), the FCS is operated at its point of maximum
20
efficiency (the “On” point) and , ii) when SoE(k) > SoE(0), the FCS is turned off (the
“Off” point). As a result, the final state of energy (SoE(N)) is the same as the initial state
of energy (SoE(0)). Thus, the hydrogen consumption only accounts the necessary
hydrogen to fulfil the cycle of duration N. The advantages of this method are considered
in the discussion Section.
In Fig. 9, it is shown a scheme with the FCS operation to perform the analysis
previously described and the results are recollected in Table 4. Since the FCS is either
working at the point of maximum efficiency or it is turned off (with the assumption that,
when the FCS is turned off, the power consumption is null), the minimum consumption
is guaranteed. In addition, in Fig. 10 is included the performance corresponding to the
pure fuel cell case where there is no hybridization. This analysis is performed with a
37.5-kW FCS, a power that is sufficient to fulfil the four cycles in study.
4.3. Influence of the initial SoE
In general, the final state of charge SoE(Nc) is different to the initial state of charge
SoE(0), resulting in a gain or a loss of energy in the ESS over the driving cycle. Because
of that, the results are corrected in order to compare the results correctly. The corrected
consumption of hydrogen is based on the assumption that after the cycle, the FCS is
continuing running in its point of maximum efficiency until the SoE reaches again the
initial value. Thus, the corrected consumption results:
,2, 2
2 / , max
ess storedcorrected
H B B B ess fcs
ECons H Cons H
LHV η η η ηΔ
= + (49)
where, Cons H2 is the cumulative consumption of hydrogen over the cycle previous to
the correction, ΔEess, stored is the difference of the energy stored in the ESS at the end

21
of the cycle with the energy at the beginning of the cycle (positive if SoE(Nc) > SoE(0)
and negative in the opposite situation), LHVH2 is the low heating value of hydrogen,
ηfcs,max is the maximum efficiency of the FCS and ηess is the ESS efficiency. In Fig. 11
and 12, it is shown the influence of the initial SoE on the hydrogen consumption
running on UDDS and HWFET, respectively.
5. Experimental validation
This section presents the implementation of the previously developed EMSs in an
experimental test setup. The arrangement of this Section is as follows. First, the
experimental setup is described. Then, the experimental results are presented showing
the temporal behaviour, the performance in terms of hydrogen consumption, and the
comparative between EMSs. Finally, the conclusions of this section are presented.
5.1. Description of the experimental setup
The experimental setup is a test station in which some components of the FCHV are
actually present, some are emulated, and some others are simulated. The objective of
this setup is to reproduce, as close as possible, the FCHV behaviour in order to validate
the EMSs. In this experimental setup (shown in Fig. 13), the FCS is a NEXA power
module from Ballard of 1.2 kW. The power module is fed with hydrogen from a
pressurized tank and the hydrogen flow is measured with a mass flow meter
(Bronkhorst, model F-201AC), with a maximum flow capacity of 50 SLPM.
The vehicle power consumption is emulated with a programmable electronic load
(Höcherl & Hackl, model ZS1606), a power device that can support up to 1600 W @ 60
V, 150A. This load is commanded by the Host computer, which is in charge of carrying
22
out the EMSs. The ESS is simulated with a model developed in the LabVIEW
environment. LabVIEW is a platform for a visual programming language from National
Instruments. This platform is commonly used for data acquisition, instrument control,
and industrial automation. For more detail see [30].
The supercapacitor bank is composed of 130 modules and each module is composed of
six serially connected cells. The main characteristics of these devices are listed in Table
5 and correspond to a module from Maxwell Technologies [31]. In this experimental
stage the supercapacitor bank is scaled in the same proportion as is the fuel cell (15 kW
to 1.2 kW). The scaled experimental supercapacitor bank is, thus, composed of 10
modules, the maximum energy that can be stored is 18.15 Wh, and the maximum power
that can be delivered is 14.25 kW. The SoE is calculated at each sampling time
according to this model, which is running in the Host computer.
The data acquisition and control system is composed by a Host computer and a
computer running in real time, namely RTOS computer. The RTOS computer
communicates with the input/output (I/O) modules, made by National Instrument,
throughout a FPGA target and a PCI bus in a second computer. The two computers are
connected via an Ethernet link. The Host computer also allows monitoring the evolution
of the system variables and commanding the system through a graphical interface
developed in LabVIEW. The measured variables are the hydrogen flow, the load current
and the stack voltage. This variables are measured every 200ms.
The operation of the experimental setup is as follows. Firstly, the FCS operation is
determined according to the EMSs that were described in Section 3. To that end, the
23
EMSs were programmed in the LabVIEW environment. These applications run in the
RTOS computer and assess a new request to the FCS, Pfcs(k), every 1 s. Then, the Pfcs(k)
is required to the NEXA power module through the electronic load, which is
commanded from the RTOS computer. The electronic load is operated in power mode,
i.e., the load sinks a power in accordance with the external-programming signal from
the RTOS computer. On the other hand, the Pess(k) value is determined from the power
balance in the DC bus as in (6) and is utilized in the ESS model, running in the Host
computer, to actualize the actual SoE(k).
5.2. Experimental results
The previously explained experimental setup was utilized to validate the enunciated
EMSs running on the same four driving cycles in Section 4. In the simulation stage, it
was utilized a 15-kW FCS to fulfil the driving cycles. In this stage, all the powers are
scaled down with a factor of 12.5 to fit with the rated power of the NEXA power
module (1.2 kW). In Fig. 14 is shown the comparative between the experimental
efficiency map of NEXA and the efficiency map of the FCS model in the ADVISOR
simulator. The experimental map is obtained measuring the inlet hydrogen flow rate
according to:
2 2
3600 [%]fcsH HCons LHV
η = , (50)
where ConsH2 is in g kWh-1 and LHVH2=120 kJ g-1. In Fig. 15, 16, and 17 are shown the
experimental results corresponding to the NEDC cycle, showing the evolution of FCS
power Pfcs, measuring the stack voltage and the stack current; the evolution of SoE,
from the ESS model; and the hydrogen consumption, measured with a mass flow meter.
24
In Fig. 18, it is shown the comparative of the hydrogen consumption between the
strategies in the experimental setup and the strategies in the simulation environment. To
do this comparative the experimental results are multiplied by the same scale factor
used to scale down the power. From this comparative, it is possible to draw some
observation. Firstly, the hydrogen consumption corresponding to the experimental setup
is higher than the corresponding to the simulation setup. This is owing to the fact that
the efficiency of the NEXA is lower than the efficiency of the FCS model in the
simulation setup as can be seen in Fig. 14. Secondly, the relative consumptions in the
experimental setup are similar to the experimental setup with some differences owing to
discrepancies in the modelling and measurement errors.
On the other hand, in Fig. 19 is shown the hydrogen savings achieved using the EMSs
with respect to the pure fuel cell case with no hybridization. The results show the
interest of hybridization, achieving hydrogen savings up to 33.7%.
6. Discussion
The analysis of the hydrogen economy in Fig. 8 shows that the three strategies have a
good performance compared to the optimal case where the entire driving cycle is known
a priori, which is not feasible in practice. In fact, the maximum deviation from the
optimal case is 9.6%, from the strategy based on efficiency map running on NEDC and
the minimum deviation is 4.0% in the improve strategy based on efficiency map
running on UDDS. The strategy based on constrained nonlinear programming gives the
best performance in all the cases; however, the performance is similar to the two
strategies based on efficiency map. On the other hand, compared to the pure fuel cell
case (Fig. 10), the results show considerable hydrogen savings running on cycles
25
NEDC, UDDS, and FTP. On the contrary, running on HWFET the savings are
exiguous. This cycle is a highway driving cycle and one of its characteristic is that the
average deceleration is significantly lower (−0.22 m s−2) than the corresponding to the
other cycles (NEDC: −0.79 m s−2; UDDS: −0.58 m s−2; FTP: −0.58 m s−2). These
results suggest that the strategies achieve the objectives satisfactorily when a significant
energy from braking is available.
It is remarkable that it is possible to meet the load power in the four driving cycles with
a 15-kW fuel cell, what is significantly lower to the 37.5-kW fuel cell that is necessary if
no hybridization is present. This advantage would be translated in a reduction in the
production costs and hydrogen consumption.
The analysis of the influence of the initial SoE on the hydrogen consumption (Fig. 11
and 12) shows that the first strategy and the third strategy have a minimal dependence
on this parameter, which denotes robustness of the strategies. On the other hand, the
performance of the second strategy is dependent on the initial SoE, especially in the
HWFET cycle. In this case, the performance is worse than in the first strategy if the
initial SoE is lower than 60%.
The supercapacitor bank is design in order to fulfill an acceleration requirement as
mentioned in Section 4. However, it is useful to analyze how the strategies work with
different sizes of supercapacitor bank. When the number of supercapacitors is increased,
the hydrogen consumption slightly increases because of the increment in the vehicle
mass is the preponderant factor. On the contrary, when the number of supercapacitors

26
starts to be decreased, the hydrogen consumption also decreases because of the mass
reduction although the acceleration test is not fulfilled.
Concerning to the analysis of the optimal hydrogen consumption, in some works, e.g.,
[19, 32-33], it is performed through the use of the Dynamic Programming (DP)
technique, a procedure that allows to determine a global optimal operation of the system
for a given load profile by evaluating all possible control sequences in a systematic way.
However, a disadvantage of this technique is the relative long computation time due to
the large required grid density. The grid is the result of the discretization of time and the
state variables in appropriate grid-levels. Thus, in order to obtain accurate results a high
density grid has to be considered. On the contrary, in our work, this issue is resolved
without discretization in the state variables, reducing the computation time without
losing accuracy.
7. Conclusions
In this work, Energy Management Strategies for Fuel Cell Hybrid Vehicles were
addressed. The objectives of the EMSs were enunciated and three strategies were
proposed. These strategies are based on the knowledge of the efficiency map. The first
strategy is a quasi-load-following strategy in which the FCS is operated in an
advantageous zone where the efficiency is high whereas the second strategy operates the
FCS preferably in its point of maximum efficiency in order to improve the hydrogen
economy. In the third strategy, an optimization problem with linear constraints is
resolved at each sampling period where a nonlinear cost function, which represents the
hydrogen consumption, is minimized.
27
Firstly, the EMSs were evaluated in a simulation environment using four standard
driving cycles and, then, the EMSs were tested in an experimental setup reproducing the
FCVH behaviour were some components are actually present, some are emulated and
some others are simulated.
The results show that using the proposed EMSs it is possible to achieve a high reduction
in the hydrogen consumption in the range of 17% average. This is achieved operating
the FCS properly and taking advantage of the energy from regenerative braking. To
evaluate the savings, the hydrogen consumptions are compared with two references: the
pure fuel cell case with no hybridization and the optimal case with minimum
consumption where the driving cycle is known a priori.
Acknowledgment
This work has been funded partially by the project CICYT DPI2007-62966 of the
Spanish Government and the Department of Universities, Investigation and Society of
Information of the Generalitat de Catalunya. We counted with the support of Fuel Cells
Laboratory of the Institute of Robotics and Industrial Informatics (IRI).
References
[1] P. Zegers, Journal of Power Sources, 154 (2006) 497–502. [2] International Energy Agency, “Key World Energy Statics” http:// www.iea.org/.
Last accessed 10/15/07. [3] K. Rajashekara, in: Fuel Cell Technology for Vehicles, 2000, pp. 179–187. [4] K. Jeong and B. Oh, Journal of Power Sources 1005 (2002) 58–65. [5] D. Friedman and R. Moore, Proceedings Electrochemical Society 27 (1998) 407–
423. [6] C. Chan, Proceedings of the IEEE, 90 (2002) 247–275. [7] R. Helmolt and U. Eberle, Journal of Power Sources 165 (2007) 833-843. [8] P. Thounthong, S. Raël, and B. Davat, Journal of Power Sources 158(2006) 806–
814. [9] J. Jung, Y. Lee, J. Loo, and H. Kim, in: Fuel Cell for Transportation, 2003, pp.
28
201–205. [10] G. Paganelli, Y. Guezennec, and G. Rizzoni, Optimizing Control Strategy for
Hybrid Fuel Cell Vehicle, 2002, pp. 71–79. [11] P. Rodatz, O. Garcia, L. Guzzella, F. Büchi, M. Bärschi, T. Tsukada, P. Dietrich,
R. Kotz, G. Schreder, and A.Woukan, in: Fuel Cell Power for Transportation, 2003, pp. 77–84.
[12] P. Rodatz, G. Paganelli, A. Sciarretta, and L. Guzzella, Control Engineering Practice, 13 (2004) 41–53.
[13] E. Karden, S. Plounen, B. Fricke, T. Miller, and K. Snyder, Journal of Power Sources, 168 (2007) 2-11.
[14] R. Kötz, S. Müller, M. Bärtschi, B. Schnyder, P. Dietrich, FN Büchi, A. Tsukada, GG Scherer, P. Rodatz, O. Garcia, ElectroChemical Society (2001) 2–7.
[15] S. Caux, J. Lachaize, M. Fadel, P. Shott, and L. Nicod, Journal of Process Control, 15 (2005) 481–491.
[16] S. Caux, J. Lachaize, M. Fadel, P. Shott, and L. Nicod, In Proceedings of the 16th IFAC World Congress, Prague, 2005.
[17] J. Schiffer, O. Bohlen, RW de Doncker, and DU Sauer, Vehicle Power and Propulsion, 2005 IEEE Conference, (2005) 716–723.
[18] M. Kim and H. Peng, Journal of Power Sources, 165 (2007) 819–832. [19] J. Kessels. Energy Management for Automotive Power Nets. PhD thesis,
Technische Universiteit Eindhoven, 2007. [20] T. Markel, A. Brooker, T. Hendricks, V. Johnson, K. Kelly, B. Kramer,
M. O’Keefe, S. Sprik, and K. Wipke, Journal of Power Sources, 110 (2002) 255–266.
[21] K. Wipke, M. Cuddy, and S. Burch, IEEE Transactions on Vehicular Technology, 48 (1999) 1751–1761.
[22] J. Pukrushpan. Modelling and Control of Fuel Cell Systems and Fuel Processors. PhD thesis, University of Michigan, 2003.
[23] K. Williams, W. Keith, M. Marcel, T. Haskew, Shepard, and B. Todd, Journal of Power Sources, 163 (2006) 971–985.
[24] R. Ahluwalia and X. Wang, Journal of Power Sources, 139 (2005) 152–164. [25] J. Pukrushpan, A. Stefanopoulou, and H. Peng, IEEE Control Systems Magazine,
24 (2004) 30–46. [26] F. Philipps, G. Simons, and K. Schiefer, Journal of Power Sources, 154 (2006)
412–419. [27] D. Feroldi and M. Serra and J. Riera, Journal of Power Sources, 169 (2007) 205-
212 [28] P. Gill, W. Murray, and M. Wright, Practical optimization, London Academic
Press, 1981. [29] DieselNet, “Emission test cycles” http:// www.dieselnet.com/standards/cycles/.
Last accessed 04/06/08. [30] National Instrument. “Introducing LabVIEW 8.6” http://www.ni.com/labview/.
Last accessed 23/07/08. [31] Mawwell Technologies, “Electrical Double Layer Capacitor: Boostcap
Ultracapacitor Series: BPAK” http://www.maxwell.com/ ultracapacitors/ index.asp. Last accessed 03/20/2006.
[32] M. Koot, A. Kessels, B. de Jager, W. Heemels, P. van den Bosch, and M. Steinbuch, IEEE Transaction on Vehicular Technology, 54 (2005) 771–782.
[33] T. Hofman, M. Steinbuch, R.M. van Druten, and A.F.A. Serrarens, In Proceedings of the 17th IFAC World Congress, (2008) 5652-5657.
29
Nomenclature ΔPfcs, fall rate Maximum fall rate of Pfcs
ΔPfcs, rise rate Maximum rise rate of Pfcs
ΔT Sampling time
ηB Efficiency of the Boost converter
ηB/B Efficiency of the Buck/Boost converter
ηess Efficiency of the ESS
ηfcs, max Maximum efficiency of the FCS
ConsH2 Hydrogen consumption
CR Capacitance of the supercapacitors
DC Direct Current
Ecap Maximum energy that the ESS is capable to store
EMS Energy Management Strategy
ESS Energy Storage System
FC Fuel Cell
FCS Fuel Cell System
FCHV Fuel Cell Hybrid Vehicle
kess Constant of the ESS
LHVH2 Low Heating Value of hydrogen
M Mass
Nc Number of sampling time in a driving cycle
P Power
Pfcs, hi Parameter in the EMSs
Pfcs, low Parameter in the EMSs

30
Pfcs, max Rated fuel cell power
Rd Internal resistance of the supercapacitors
SoE State of Energy in the ESS
tc Duration of a driving cycle
Captions of the figures
Fig. 1. FCHV scheme
Fig. 2. Efficiency and hydrogen consumption map for a 50-kW FCS as a function of the
power.
Fig. 3. FCS operating point for the strategy based on efficiency map.
Fig. 4. FCS operating point for the improved strategy based on efficiency map.
Fig. 5. Power split running on NEDC and the evolution of the SoE using the strategy
based on efficiency map.
Fig. 6. Power split running on NEDC and the evolution of the SoE using the improved
strategy based on efficiency map.
Fig. 7. Power split running on NEDC and the evolution of the SoE using the strategy
based on constrained nonlinear programming.
Fig. 8. Comparative between the hydrogen consumption of the proposed strategies, the
optimum case and the pure fuel cell case. The percentages in red indicate the increment
in consumption with respect to the optimal case.
Fig. 9. Scheme showing the On/Off operation of the FCS model to perform the analysis
of the minimum hydrogen consumption.
Fig. 10. Hydrogen savings with respect to the pure fuel cell case.
Fig. 11. Influence of the initial SoE on the hydrogen consumption running on UDDS.
Fig. 12. Influence of the initial SoE on the hydrogen consumption running on HWFET.

31
Fig. 13. Scheme showing the experimental setup to validate the EMSs.
Fig. 14. Comparative between the experimental efficiency map of NEXA and the
efficiency map of ADVISOR model.
Fig. 15. Experimental results of the strategy based on efficiency map.
Fig. 16. Experimental results of the improved strategy based on efficiency map.
Fig. 17. Experimental results of the strategy based on constrained nonlinear
programming.
Fig. 18. Experimental validation of the proposed strategies.
Fig. 19. Hydrogen savings achieved using the EMSs with respect to the pure fuel cell
case.