Embed Size (px)
Citation preview
Session D: Energy Deposition and Dosimetry
4131
IEEE Transactions on Nuclear Science, Vol. NS-28, No. 6, December 1981
ENERGY LOSSES AND MEAN FREE PATHS OF ELECTRONS IN SILICON DIOXIDE1
J. C. Ashley and V. E. Anderson2Health and Safety Research Division
Oak Ridge National LaboratoryOak Ridge, Tennessee 37380
Summary
Theoretical models and calculations are combinedwith experimental optical data to determine a modelenergy-loss function for SiO2. Sum-rule checks and
comparisons with experimental information are made toinsure overall consistency of the model. The modelenergy-loss function is employed to calculate electroninelastic mean free paths and stopping powers forelectrons with energies "' 10 keV in SiO2.
Introduction
Silicon dioxide, in its various solid-state forms,is a material of widespread interest and importancein the electronics industry. Studies of its basicphysical properties are so extensive that entire con-ferences are devoted to reports of current research.For military, space and commercial electronics appli-cations, the performance of devices involving Si°2 in
a radiation environment may be of critical importance.No matter what type of incident radiation is involved,calculations of energy deposition must include contri-butions from electron cascades generated in the mate-rial.
Our ultimate objective is to study the energydeposition processes which occur when a flux of elec-trons slows down in Si°2. A thin layer of Si02 or
SiO2 on Si is of particular interest. If one knows
the probabilities for various inelastic processes as afunction of electron energy, this information can beincorporated in Monte Carlo programs to examine thedetails of the energy deposition process as discussedearlier for Si.3 For example, one could study thedependence on layer thickness, the role of interfaceeffects, or the statistics of the energy-loss pro-cesses. The more limited purpose of this paper is todescribe a model for determining the required prob-abilities for inelastic events. The model is testedby computing quantities that can be compared withexperimental data. In particular we calculate themean energy loss per unit path length and inelasticmean free path for electrons in SiO2 and the mean
excitation energy of Si°2.
Theoretical Model
For incident electron energies considered here(. 10 keV), the main source of energy loss is due tointeractions with the electrons in the medium. Theresponse of a medium to a given energy transfer, w,and momentum transfer q may be described by a complexdielectric function c(q,w). In general, E may be a
tensor which depends on the direction of q. In this
work it is assumed that the medium is homogeneous andisotropic so that £ is a scalar quantity which dependson the magnitude of q and not its direction. If £ is
known, for an electron of kinetic energy E and velocityv, the probability of an energy loss w per unit energy
loss per unit distance traveled can be determined4'5from
T(E,w) = 2 qI a Im [-l/e(q,w)] .7rVqy
(1)
The equations in this paper are in Hartree atomic unitswhereli = m = e = 1. To account for the small rela-tivistic correction at the higher electron energiesconsidered here, the limits on the integral in Eq. (1)are given by
q+ [2E(1+E/2c2)]½ ± [2E(1+E/2c2)2 2 2½5- 2w(l+E/c ) + w /c ]
and v2/2 E(1+E/2c2)/(l+E/c2)2 with c = 137. For mostof the energy region considered here, these expressionsreduce to the usual nonrelativistic forms E = v2/2 andq+ = Y1v±+ i:. The quantity T(E,w) is also calledthe differential inverse mean free path, since by inte-grating it over allowed energy transfers, the inelasticinverse mean path for an electron of energy E is ob-tained. In addition, the quantity w'((E,w) integratedover allowed values of w gives the energy loss per unitpath length or, neglecting radiation by the electron,the stopping power of the medium for an electron ofenergy E.
The main task then is to find a suitable expres-sion for £(q,w) - E,(q,w) + ic2(q,w) to describe the
dielectric response of SiO2. For the purpose of mod-
eling, the electrons in the medium are divided into twogroups: valence electrons and inner-shell electrons.A model insulator theory6 is used to describe thevalence electrons, while generalized oscillatorstrengths are used to describe inner-shell ionization.
The theoretical model for £ is based, in part, onoptical data and has been employed previously for other
solids7 as well as for SiO28. The description of the
valence electron response has been improved over theresults of Ref. 8 by doing a more detailed fit of62(0,w), the imaginary part of the dielectric function
for zero momentum transfer, to experimental values9 of3
£2 for crystalline SiO2 of density 2.65 g/cm3. The
new fit is shown in Fig. 1 by the dashed curve, using a
band gap of 8.9 eV.10 The sharp peak at 10.3 eV isgenerally agreed to be due to an exciton transition,while the structure at higher energies is less certainand is described by some workers as due to interband
transitions11 or, most recently, as being due to exci-
tonic resonances.10 The assignment of the processesresponsible for these features in £2 may be importantin examining the detailed energy deposition processesin SiO2 as was done earlier for silicon3 and water.12The fitting process and the sum-rule checks for overall
consistency have been discussed in detail elsewhere. 13The insulator model describes the dielectric responseof 16.8 effective valence electrons per Si°2 molecule
0018-9499/81/1200-4132$00.75©1981 IEEE4132
7
6 II SiO2I'
- i-i EXPERIMEN-I ---- INSULATORI'
4
3
I~~~~~~
8 10 1 18 10 12 44 (e
Muw (eV)
4.2
1.0
w
E
E)- (E-- IN
0.6 _-
0.4 H
0.2 _
00
I ~ ~~~~~ISiO2 // \\-XPERIMENTAL DATA ,'3UECHNER) \JSULATOR MODEL /\
III \\ _ii 'I
"I
"..I
1o 20iw (eV)
30 40
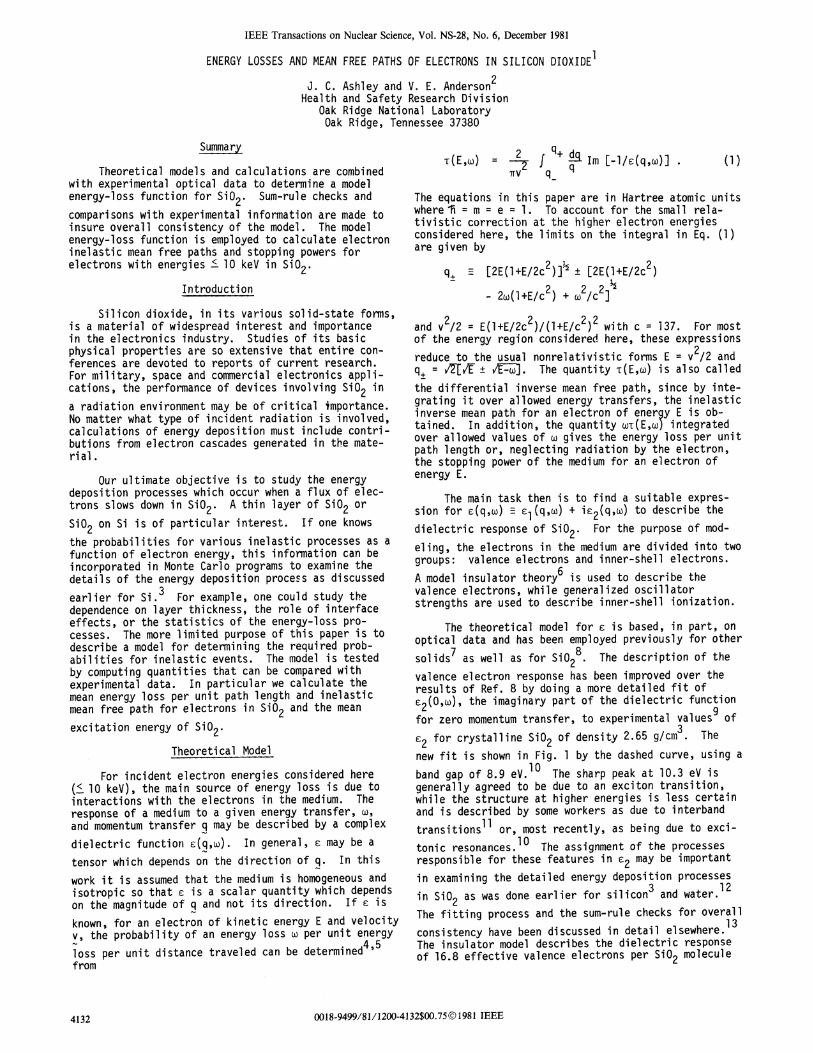
Fig9. 2 . The dashed l ine shows the energy-l ossfunction predicted by the insulator model. The solid
1 curve is from electron energy-loss measurements by16 18 20 22 Buechner. 17
Fig.functioncurve i scurve is
1. The imaginary part of the dielectricas a function of photon energy. The solidfrom the optical data of Phillip9; the dashedthe insulator model fit.
at zero momentum transfer. The effective number ofvalence electrons decreases to 16 for large momentumtransfers as the effective number of inner-shellelectrons increases to a value corresponding to theoccupation numbers for the inner shells.13
Given c2(q,w) for the valence electrons determinedby the insulator model, cl(q,w) was calculated from a
Kramers-Kronig relation, and thus we obtain the energy-loss function associated with valence electron excita-tion, 1(q,w)] - 1 +/ 2 )2 The totalenergy-loss function for the medium is given by
Im [-l/c(q,w)] = Im [-1/£(q,w)]val
2Tr2n df.(q)+
wl lW (2)
where the second term on the right-hand side is due toionization of the inner shells. The generalizedoscillator strength for shell i, df.(q)/dw, was takenfrom McGuire's tables14 for the K shell of oxygen,from Manson's valuesl5 for the L shell of silicon, andderived from hydrogenic wave functions16 for the Kshell of silicon. The number of shells of type i perunit volume is ni. The energy-loss function in Eq.(2) was constructed so that the energy-loss sum rule
f dw w Im [-l/c(q,w)] 27r n0N (3)0
is obeyed for any q where N = 30 electrons per SiO2molecule and n = 3.930xl03 molecules per unit volume
in atomic units. The energy-loss function in the q = 0limit (dashed curve) is shown in Fig. 2 for comparisonwith that determined by Buechner from electron energy-loss measurements (solid curve).17 The main peak inour result lies %l eV higher than Buechner's, possiblydue to a slightly different density. The structurebelow the main peak is sharper for the insulator model(or the optical data) than in the solid curve. Forlarge w, the insulator model predicts Im(-l/s)val a
As a further check on the model dielectric func-tion in the optical limit (q = 0), we have evaluated 18the mean excitation energy I of crystalline SiO2 from
I00
ZnI 2J dw w Im [-1/(0,)Znw (4)2r n0N 0
using Eq. (2). The mean excitation energy is found tobe I = 142 eV, in good agreement with the value 139.2eV determined from proton range measurements.19
Given the model energy-loss function, Eq. (2),differential inverse mean free paths were calculatedfrom Eq. (1). Exchange corrections were included asdescribed previously. 3,20 The inverse mean free path,or the energy loss per unit pathlength, for an electronof energy E is determined by integrating T, or wT, overallowed energy transfers.
Electron Mean Free Paths
The results for electron inelastic mean free pathsare shown in Fig. 3 and listed in Table I with electronenergies measured from the bottom of the conductionband. These new results are %20% larger than ourearlier results8 for E ' 80 eV. For comparison, pre-dicted mean free paths for electrons in silicon (p =2.33 g/cm3) are also shown where the "dashed" curve isfrom Ref. 8 and the "dot-dash" curve is from Ref. 21.The difference in these two calculations for silicon is< 3% for E 2 60 eV. The curve for Si has approximately
4133
I
0.8 _-
4O<
1-0
400 lIii l Iiiiil 1111404 402 403 40
E ( V)
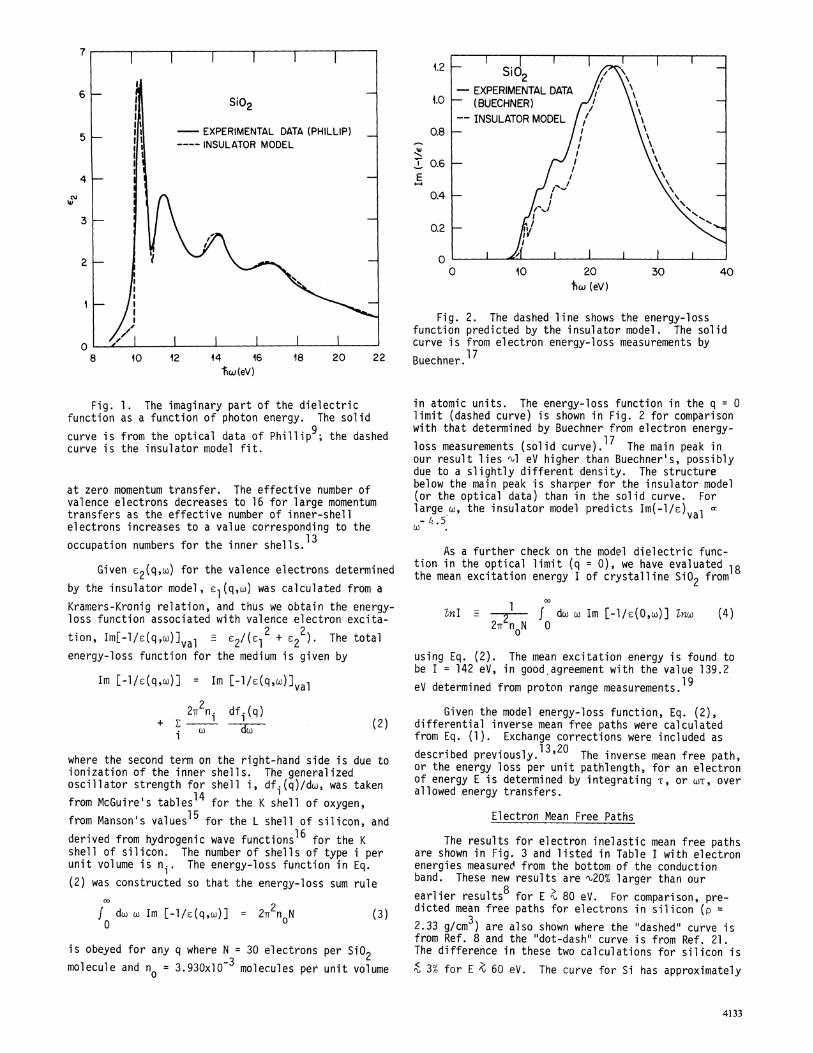
Fig. 3. The solid curve is the inelastic meanfree path as a function of electron kinetic energy
3~~~~~for SiO2 at p = 2.65 g/cm3 Also shown for comparisonis X for electrons in Si at p = 2.33 g/cm3 ; the dashedcurve is from Ref. 8, and the dot-dash curve is fromRef. 21. Experimental data are from: Ref. 22 - 0,Ref. 23 - a, and Ref. 24 - 0.
the same energy dependence as the curve for SiO2 atthe higher energies. For very low electron energies,mean free paths in SiO2 are much larger than those inSi due to the difference in the band gaps. Experi-mental data on electron mean free paths in silicon arecollected and discussed in the appendix.
Experimental measurements of electron mean freepaths from three sources are shown in Fig. 3. Thesources of these data are: open circles, Flitsch and
Raider22; triangles, Klasson et al.23; and solid dot,Hill et al.24 Reasonably good agreement is foundbetween the theoretical result and the experimentalmeasurements. The data of Flitsch and Raider22 areconsistent with the energy dependence of the modelcalculation but lie 20-25% below our predicted values.No attempt was made in these comparisons with theo-retical inelastic mean free paths to eliminate thecontribution of elastic scattering, differences insample densities, etc.
Stopping Power for Electrons
The results for the stopping power of SiO2 at a
density p = 2.65 g/cm3 are shown in Table I in the formS' = (l/p) (-dE/dx) where -dE/dx is the energy lossper unit pathlength. These values are %25% lower than
our earlier tabulated results8 near the Bragg peakaround 150 eV but agree to within 1% at 10 keV. Forthe smaller electron energies, the stopping power isdetermined entirely by interactions with the valenceelectrons. As the incident electron energy increases,ionization of the inner shells becomes increasinglyimportant in the stopping process and accounts for%30% of the total stopping power at 10 keV.
In Fig. 4 the total stopping power is displayedas a function of electron energy. Also shown is the
total inner-shell contribution. For E IL 10 keV the
Table I. Electron Inelastic Mean Free PathsStopping Powers for Electrons, and
Mean Pathlengths of Electrons in SiO2*
E (eV) x(A) S' (MeV - cm2/g) R10 (Gg/cm2)
15 170 2.40 4.37
20 73.0 6.64 5.64
30 23.9 26.2 6.40
40 13.7 55.1 6.66
60 9.09 105 6.91
80 8.40 128 7.08
100 8.40 137 7.23
150 9.26 141 7.59
200 10.4 137 7.95
300 12.7 127 8.71
400 15.0 117 9.53
600 19.5 99.6 11.4
800 23.7 87.5 13.5
1,000 27.8 78.1 16.0
2,000 46.7 52.8 31.9
4,000 81.3 33.5 81.0
6,000 114 25.1 151
8,000 144 20.4 241
10,000 173 17.4 348
*
The density of SiO2 is p = 2.65 g/cm , andelectron energies are measured from the bottomof the conduction band.
at
cw-E
C'.
lo, 102 io3 104 105E (eV)
Fig. 4. The stopping power S' E (l/p)(-dE/dx)of SiO2 for an electron of kinetic energy E. Thedashed curve is the Bethe-theory result for I = 142 eV.
Bethe-theory calculations of Pages et al., 25 recalcu-lated with I = 142 eV, are given by the dashed curve.The two theoretical calculations differ by %1.5% at10 keV. If the Bethe-theory calculation is extended tolower energies, the difference between the two theo-retical predictions increases to %5% at 1000 eV. Thereappear to be no experimental data available for compar-ison.
Mean Pathlengths for Electrons
From the stopping power we can determine the meanpathlength traveled by an electron as its energy is
4134
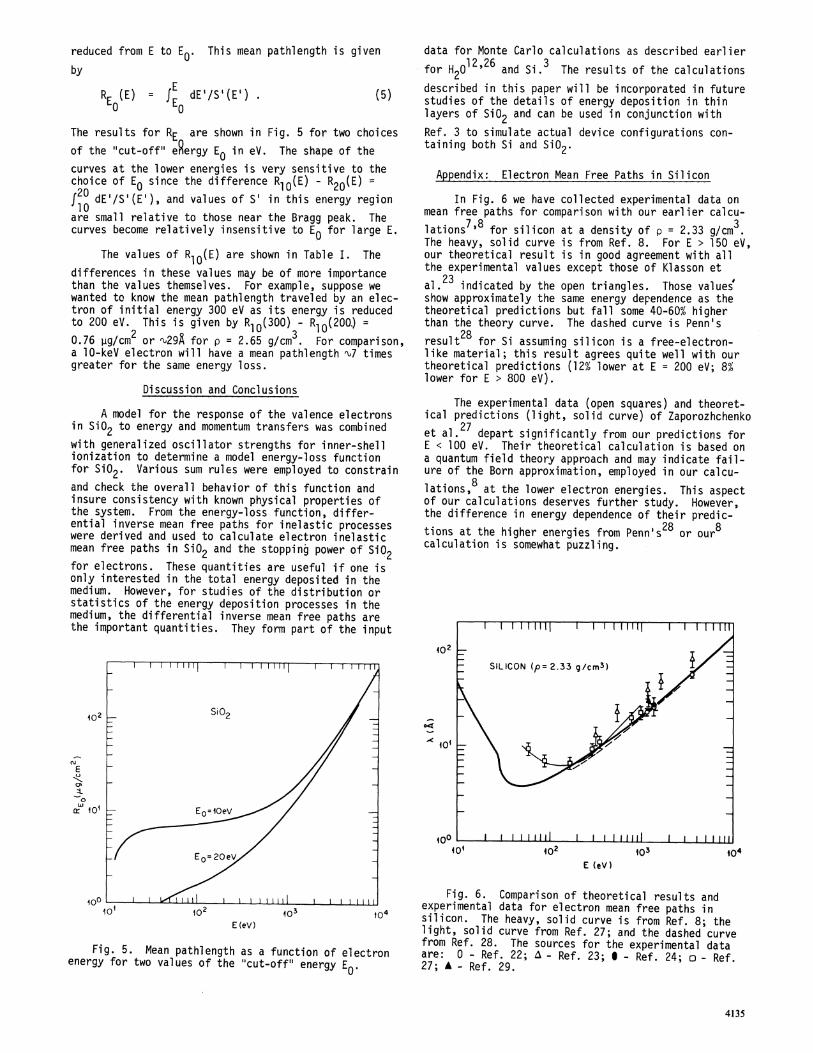
reduced from E to Eo0 This mean pathlength is givenby
RE (E) = dE'/S'(E') . (5)0 0
The results for RE are shown in Fig. 5 for two choicesof the "cut-off" e ergy E0 in eV. The shape of thecurves at the lower energies is very sensitive to thechoice of Eo since the difference RIO(E) - R20(E) =
f20 dE'/S'(E'), and values of S' in this energy region10are small relative to those near the Bragg peak. Thecurves become relatively insensitive to Eo for large E.
The values of Rlo(E) are shown in Table I. Thedifferences in these values may be of more importancethan the values themselves. For example, suppose wewanted to know the mean pathlength traveled by an elec-tron of initial energy 300 eV as its energy is reducedto 200 eV. This is given by R10(300) - R10(200) =0.76 ,ug/cm or 29A for p = 2.65 g/cm3. For comparison,a 10-keV electron will have a mean pathlength %7 timesgreater for the same energy loss.
Discussion and Conclusions
A model for the response of the valence electronsin SiO2 to energy and momentum transfers was combinedwith generalized oscillator strengths for inner-shellionization to determine a model energy-loss functionfor SiO2. Various sum rules were employed to constrainand check the overall behavior of this function andinsure consistency with known physical properties ofthe system. From the energy-loss function, differ-ential inverse mean free paths for inelastic processeswere derived and used to calculate electron inelasticmean free paths in SiO2 and the stopping power of SiO2for electrons. These quantities are useful if one isonly interested in the total energy deposited in themedium. However, for studies of the distribution orstatistics of the energy deposition processes in themedium, the differential inverse mean free paths arethe important quantities. They form part of the input
data for Monte Carlo calculations as described earlierfor H 012,26 and Si.3 The results of the calculations2described in this paper will be incorporated in futurestudies of the details of energy deposition in thinlayers of SiO2 and can be used in conjunction withRef. 3 to simulate actual device configurations con-taining both Si and SiO2.
Appendix: Electron Mean Free Paths in Silicon
In Fig. 6 we have collected experimental data onmean free paths for comparison with our earlier calcu-
7,8 3lations for silicon at a density of p = 2.33 g/cmThe heavy, solid curve is from Ref. 8. For E > 150 eV,our theoretical result is in good agreement with allthe experimental values except those of Klasson etal.23 indicated by the open triangles. Those values'show approximately the same energy dependence as thetheoretical predictions but fall some 40-60% higherthan the theory curve. The dashed curve is Penn'sresult'28 for Si assuming silicon is a free-electron-like material; this result agrees quite well with ourtheoretical predictions (12% lower at E = 200 eV; 8%lower for E > 800 eV).
The experimental data (open squares) and theoret-ical predictions (light, solid curve) of Zaporozhchenkoet al.27 depart significantly from our predictions forE < 100 eV. Their theoretical calculation is based ona quantum field theory approach and may indicate fail-ure of the Born approximation, employed in our calcu-lations, at the lower electron energies. This aspectof our calculations deserves further study. However,the difference in energy dependence of their predic-tions at the higher energies from Penn's28 or our8calculation is somewhat puzzling.
402
E
-:.0w
101
4oo010I
E (eV)
Fig. 5. Mean pathlength as a function of electronenergy for two values of the "cut-off" energy Eo0
-< 4oi
0oo L40O
E (eV)
Fig. 6. Comparison of theoretical results andexperimental data for electron mean free paths insilicon. The heavy, solid curve is from Ref. 8; thelight, solid curve from Ref. 27; and the dashed curvefrom Ref. 28. The sources for the experimental dataare: 0 - Ref. 22; A - Ref. 23; S - Ref. 24; o - Ref.27; A - Ref. 29.
4135
j04

References
1. Research sponsored jointly by the Deputy forElectronic Technology, Air Force Systems Command,under Interagency Agreement DOE No. 40-226-70 andthe Office of Health and Environmental Research,U. S. Department of Energy, under contract W-7405-eng-26 with the Union Carbide Corporation.
2. On assignment from Computer Sciences Division.
3. R. N. Hamm, J. E. Turner, H. A. Wright, and R.H. Ritchie, IEEE Trans. Nuci. Sci. NS-26, 4892(1979).
4. J. Lindhard, Kgl. Danske Vid. Sels. Mat. Fys.Medd. 28(8) (1954).
5.
6.
R. H. Ritchie, Phys. Rev. 114, 644 (1959).
C. J. Tung, R. H. Ritchie, J. C. Ashley, and V.E. Anderson, Inelastic Interactions of SwiftElectrons in Solids, Oak Ridge National Labora-tory Report, ORNL/TM-5188 (1976). Availablefrom NTIS, U. S. Department of Commerce, Spring-field, Virginia 22161.
7. J. C. Ashley, C. J. Tung, and R. H. Ritchie,IEEE Trans. Nucl. Sci. NS-25, 1566 (1978), andreferences therein.
8. C. J. Tung, J. C. Ashley, V. E. Anderson, and R.H. Ritchie, "Inverse Mean Free Path, StoppingPower, CSDA Range, and Straggling in Silicon andSilicon Dioxide for Electrons of-Energy ' 10keV," Air Force Report RADC-TR-76-125 (April1976). Note also that in this tabulation forboth Si and SiO2 the silicon K-shell contribution
to inverse mean free paths and stopping powersshould be increased by a factor of two. Thiscorrection makes only a small change in thetotal stopping power (l%) and makes essentiallyno change in the total inverse mean free path.
9. H. R. Phillip, Solid State Cormmun. 4, 73 (1966).
10. R. B. Laughlin, Phys. Rev. B 22, 3021 (1980).
11. G. Klein and H. -U. Chun, Phys. Status Solidi B49, 167 (1972).
12. R. N. Hamm, H. A. Wright, R. H. Ritchie, J. E.Turner, and T. P. Turner, Proceedings of theFifth Symposium on Microdosimetry, Verbania,Pallanza, Italy, September 22-26, 1975, EUR 5452d-e-f, p. 1037.
13. J. C. Ashley and V. E. Anderson, J. ElectronSpectrosc. Related Phenom. (to be published).
14. E. J. McGuire, "Calculated Generalized OscillatorStrengths for the Atoms He-Na," Sandia ResearchReport No. SC-RR-70-406 (May 1971).
15.
16.
S. T. Manson (unpublished).
E. Merzbacher and H. W. Lewis in Handbuch derPhysik, edited by S. FlUgge (Springer-Verlag,Berlin, 1958), pp. 166-192.
17. U. Buechner, J. Phys. C: SoZid State Phys. 8,2781 (1975).
18. U. Fano, Ann. Rev. Nuci. Sci. 13, 1 (1963).
19. C. Tschalar and Hans Bichsel, Phys. Rev. 175,476 (1968).
20. J. C. Ashley, C. J. Tung, and R. H. Ritchie,IEEE Trans. Nuci. Sci. NS-25, 1566 (1978).
21. J. C. Ashley, C. J. Tung, R. H. Ritchie, and V.E. Anderson, IEEE Trans. Nuci. Sci. NS-23, 1833(1976).
22. R. Flitsch and S. I. Raider, J. Vac. Sci. Technol.12, 305 (1975).
23. M. Klasson, A. Berndtsson, J. Hedman, R. Nilsson,R. Nyholm, and C. Nordling, J. EZectron Spectrosc.Related Phenom. 3, 427 (1974).
24. J. M. Hill, D. G. Royce, C. S. Fadley, L. F.Wagner, and F. J. Grunthaver, Chem. Phys. Lett.44, 225 (1976).
25. L. Pages, E. Bertel, H. Joffre, and L. Sklavenitis,Atomic Data 4, 1 (1972).
26. R. H. Ritchie, R. N. Hamm, J. E. Turner, and H.A. Wright, Proceedings of the Sixth Symposiwn onMicrodosimetry, Brussels, Belgium, May 22-26,1978, EVR 6064 DE-EN-FR, p. 345.
27. V. I. Zaporozhchenko, Yu. D. Kalafati, Yu. A.Kukharenko, and V. M. Sergeev, Izv. Akad. NaukSSSR Ser. Fiz. 43, 1919 (1979).
28. David R. Penn, J. Electron Spectrosc. RelatedPhenom. 9, 29 (1976); J. Vac. Sci. TechnoZ. 13,221 (197-)).
29. P. Cadman, G. Gossedge, and J. D. Scott, J.Electron Spectrosc. Related Phenom. 13, 1 (1978).
4136


![Biomasses and biofuels - Home - people.unica.it · [CH20) -Carbohydrate C02 —Carbon dioxide 10 Excited electron states 4.8eV I [CH20] Hað/C02 Four electrons transferred per C atom](https://img.pdfslide.us/doc/110x75/603da92f08c36914c24a2e6c/biomasses-and-biofuels-home-ch20-carbohydrate-c02-acarbon-dioxide-10-excited.jpg)