Embed Size (px)
Citation preview
Energy:Is there an energy crisis?
24 October 2012

Professor Pam Thomas(Department of Physics, Chair of the Board of the Faculty of Science)
Introduction to Ideas Café and this evenings agenda


Energy: Is there an energy crisis?
PresentationsProfessor Phil Mawby (School of Engineering, Energy GRP Lead)Introduction to and overview of the Energy Global Research Priority
Professor David Elmes (Academic Director, Warwick Global Energy MBA )The challenge that the global energy industry faces in meeting future supply and demand
Richard Smith (Head of Energy Strategy & Policy, National Grid)An overview of UK energy futures
Professor Evan Parker (Department of Physics)Developing new policy and approaches to geo-engineering
Jon Price (Director, Centre for Low Carbon Futures)An overview of alternative options for low carbon energy and the difficulties they present
Group discussionsAddress table questions and presentation points
Global Research Priorities:
Responding through research to global priorities
“Warwick’s world-class Global Research Priorities focus multi-disciplinary research on key areas of international significance, by bringing together scholarly expertise from across faculties and departments.”
• Supporting and enhancing multidisciplinary and cross-departmental research
• Demonstrating the impacts of research and engaging with key users
• Generating research income through interdisciplinary research that addresses major global issues

Global Research Priorities
Professor Phil Mawby (School of Engineering, Energy GRP Lead)
Introduction to and overview of the Energy Global Research Priority

The Energy GRP
Objectives of the energy GRP1. Draw together Energy Research Community2. Provide Critical Mass 3. Use the Campus as a living laboratory
Why Energy?
Arguably the single biggest challenge to mankind over the next 50 years – a truly global issue
Involves all sectors of the research community
Recognised by funding councils as major issue

Main Themes
Energy GRP
ElectricalEnergy
SolarEnergy
ThermalEnergy
Confined FusionEnergy
EnergyManagement
LowCarbon
Transport

Energy Efficiency Project
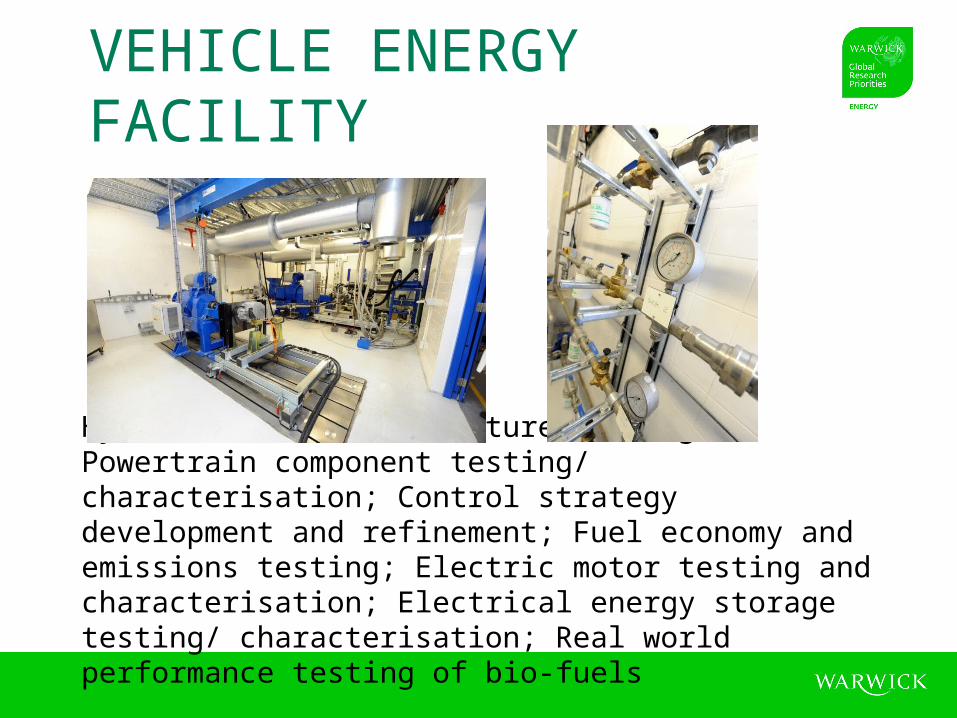
Hybrid vehicle architecture testing; Powertrain component testing/ characterisation; Control strategy development and refinement; Fuel economy and emissions testing; Electric motor testing and characterisation; Electrical energy storage testing/ characterisation; Real world performance testing of bio-fuels
VEHICLE ENERGY FACILITY

THERMAL CONTROL RESEARCH
Solar systems testing including a 3.2m2 solar simulator with variable tilt
Large environmental chambers with thermal systems testing and heat pumps
Sophisticated equipment for monitoring, testing and analysing heat transfer

Major Research ProjectsWill also spur the development of innovative solutions by sponsoring speculative research in uncharted areas.
Design of smart grids, communication technologies and the harnessing of the demand-side for the control and optimisation of the power system.
New materials for power equipment that are more efficient and more compact.
Study the interaction between multiple energy vectors to coordinate the planning and operation under uncertainty.
Management of transition assets

2 salt cavern facilities in world Huntorf, Germany (1978) McIntosh, USA (1981)
Number of rocks types couldprovide storage horizons
Salt – ideal storage horizon thick beds or flow structures ductile & flows very high impermeability -
gas tight ‘easily’ create large voids by
solution mining – pressure vessels
Integrated, Market-fit and Affordable Grid-scale Energy Storage
Major Research Projects
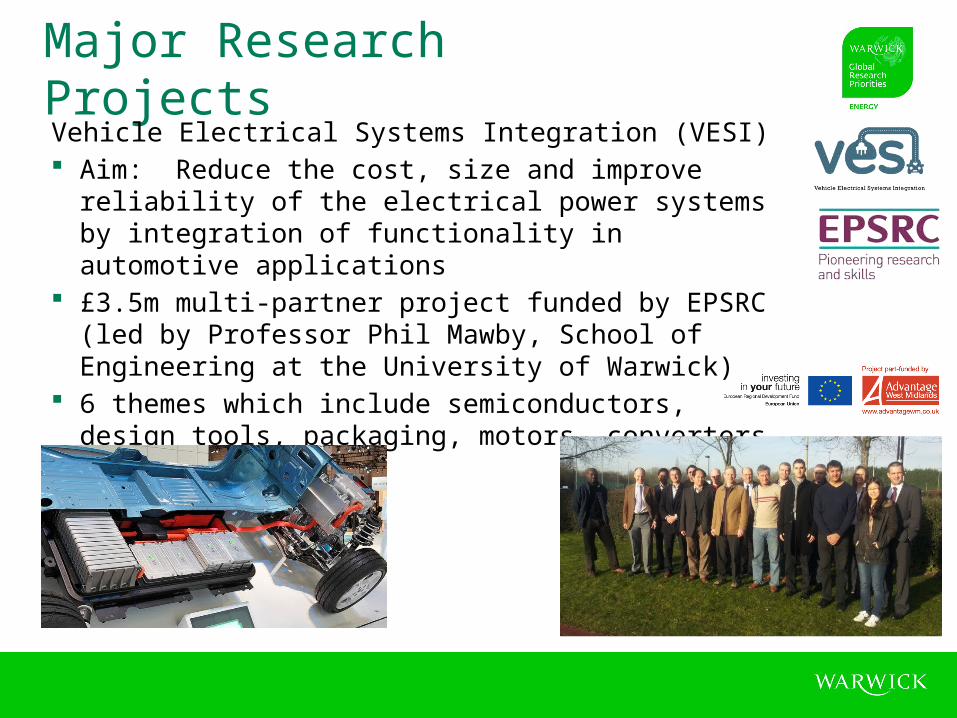
Major Research ProjectsVehicle Electrical Systems Integration (VESI) Aim: Reduce the cost, size and improve reliability of the electrical
power systems by integration of functionality in automotive applications
£3.5m multi-partner project funded by EPSRC (led by Professor Phil Mawby, School of Engineering at the University of Warwick)
6 themes which include semiconductors, design tools, packaging, motors, converters and passives
Major Research Projects
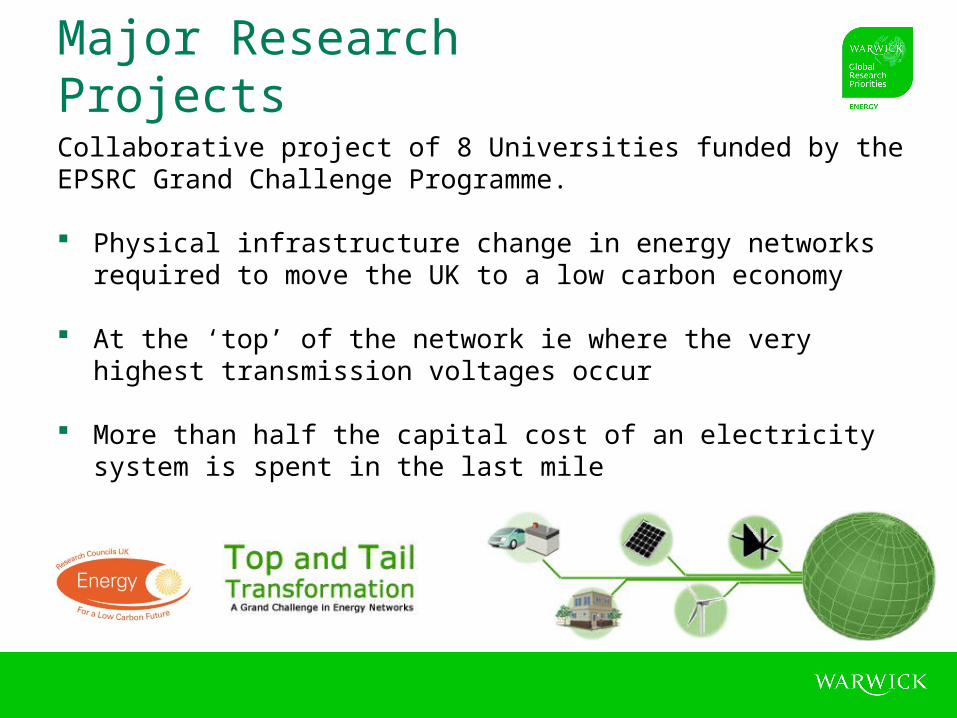
Collaborative project of 8 Universities funded by the EPSRC Grand Challenge Programme.
Physical infrastructure change in energy networks required to move the UK to a low carbon economy
At the ‘top’ of the network ie where the very highest transmission voltages occur
More than half the capital cost of an electricity system is spent in the last mile
IPT Meetings Industry and Parliament Trust (IPT) breakfast meeting
held on Wednesday 18th January 2012, chaired by Lord Oxburgh KBE.
We heard from three speakers:– Rashid Al-Marri (General Manager, South Hook Gas);– Kate Smith (Head of Government Relations, Shell UK);– Prof. Philip Mawby (Chair of Power Electronics, Applications and
Technology in Energy Research, University of Warwick).
16th May - Caroline Kuzemko

MEGS Midlands Energy Graduate School Event in September and December, will know
details by May
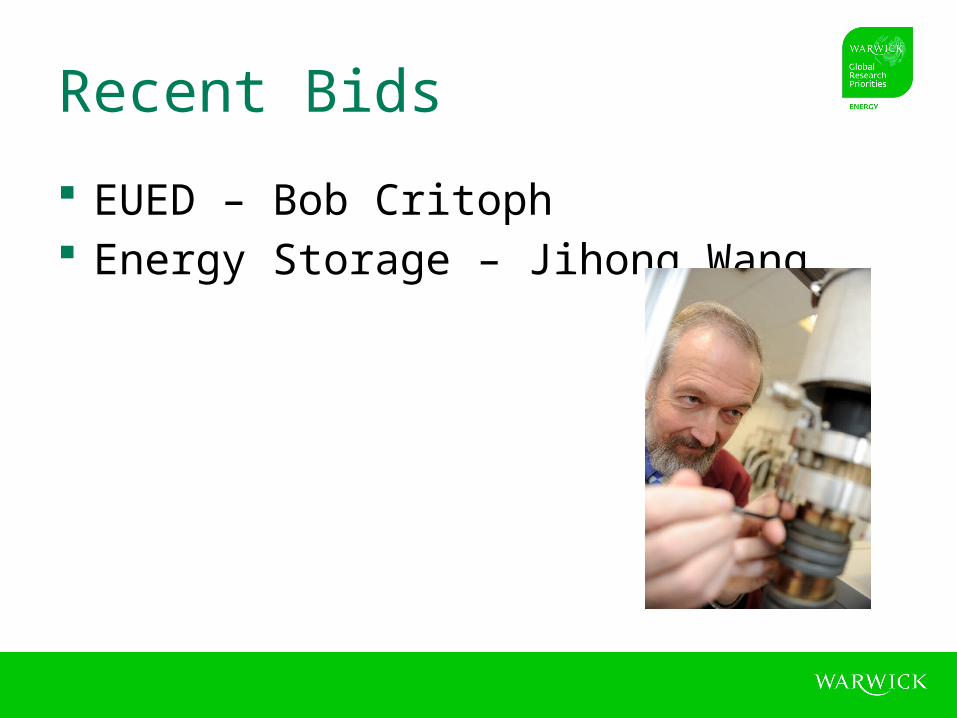
Recent Bids
EUED – Bob Critoph Energy Storage – Jihong Wang
Power Electronics
EPSRC call – Under pinning technologies
£18m A single bid from the community Result of BIS UK strategy for Power
Electronics Marked as an activity to grow
Energy & EnvironmentWolfson Special Interest Group
Rohit Bhagat (WMG), Nishal Ramadas (Physics), Ian Hancox (Chemistry), Fiona Collingan (Wolfson Exchange)
The vision of the Energy & Environment SIG is to generate a network of PG students and ECRs to generate added value.
Aims:- Knowledge transfer Forum for the discussion of ideas Generate collaboration and whole systems approach Retain Warwick's brightest talents
Synergy with the Energy GRP objectives
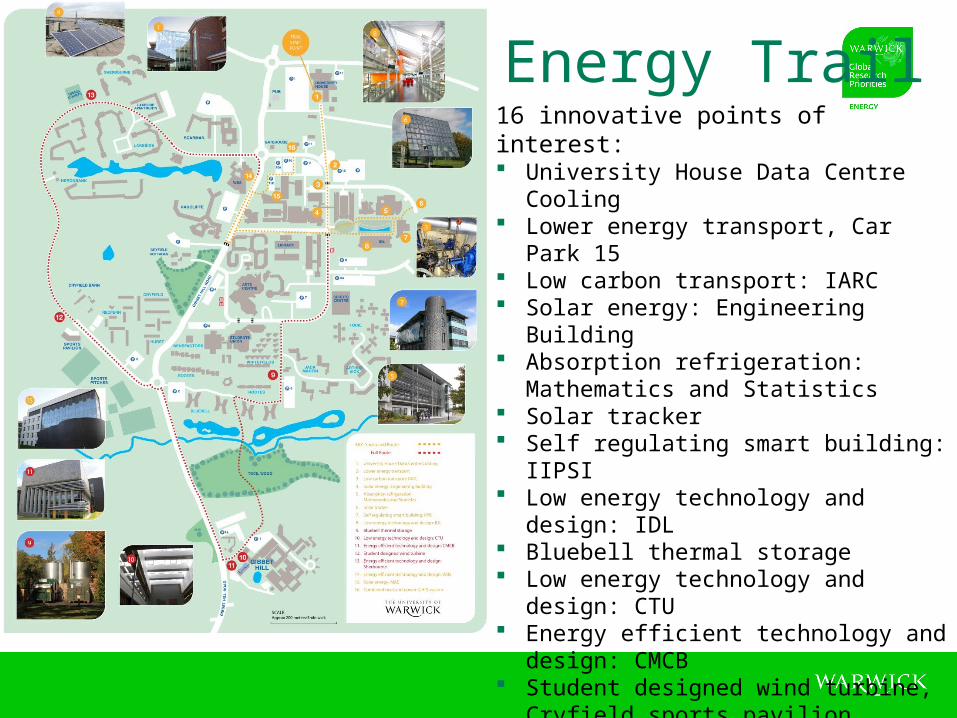
Energy Trail16 innovative points of interest: University House Data Centre Cooling Lower energy transport, Car Park 15 Low carbon transport: IARC Solar energy: Engineering Building Absorption refrigeration: Mathematics and
Statistics Solar tracker Self regulating smart building: IIPSI Low energy technology and design: IDL Bluebell thermal storage Low energy technology and design: CTU Energy efficient technology and design: CMCB Student designed wind turbine, Cryfield
sports pavilion Energy efficient technology and design:
Sherbourne Energy efficient technology and design: WBS Solar energy: MAS Combined heat and power (CHP) system
Professor David Elmes (Academic Director for the Warwick Global Energy MBA )
The challenge that the global energy industry faces in meeting future supply and demand
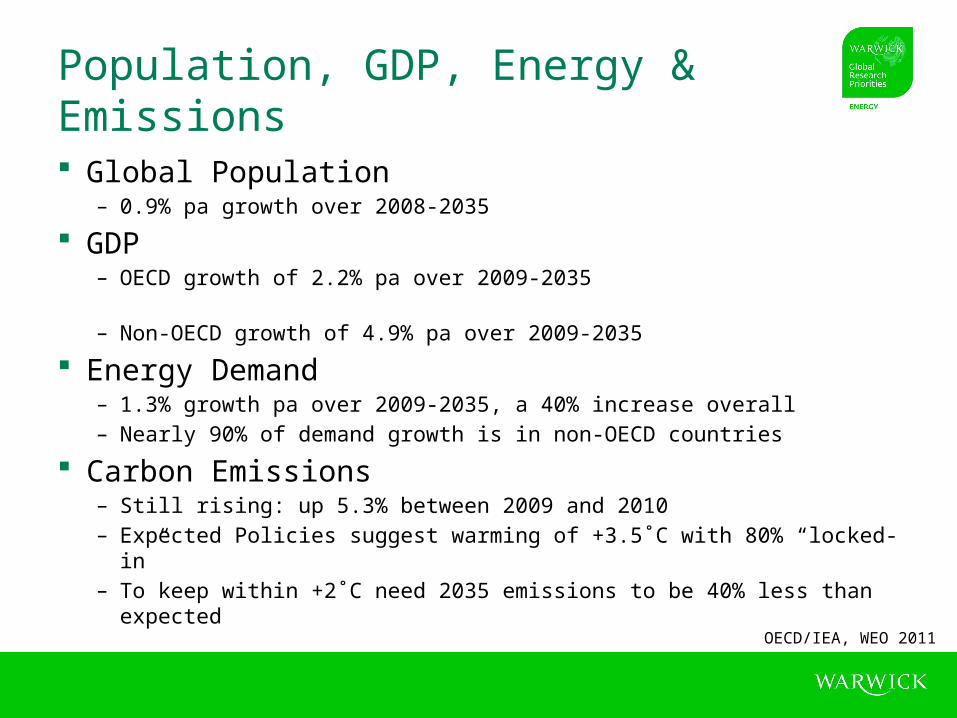
Population, GDP, Energy & Emissions
Global Population– 0.9% pa growth over 2008-2035
GDP– OECD growth of 2.2% pa over 2009-2035 – Non-OECD growth of 4.9% pa over 2009-2035
Energy Demand– 1.3% growth pa over 2009-2035, a 40% increase overall– Nearly 90% of demand growth is in non-OECD countries
Carbon Emissions– Still rising: up 5.3% between 2009 and 2010– Expected Policies suggest warming of +3.5˚C with 80% “locked-in”– To keep within +2˚C need 2035 emissions to be 40% less than expectedOECD/IEA, WEO 2011
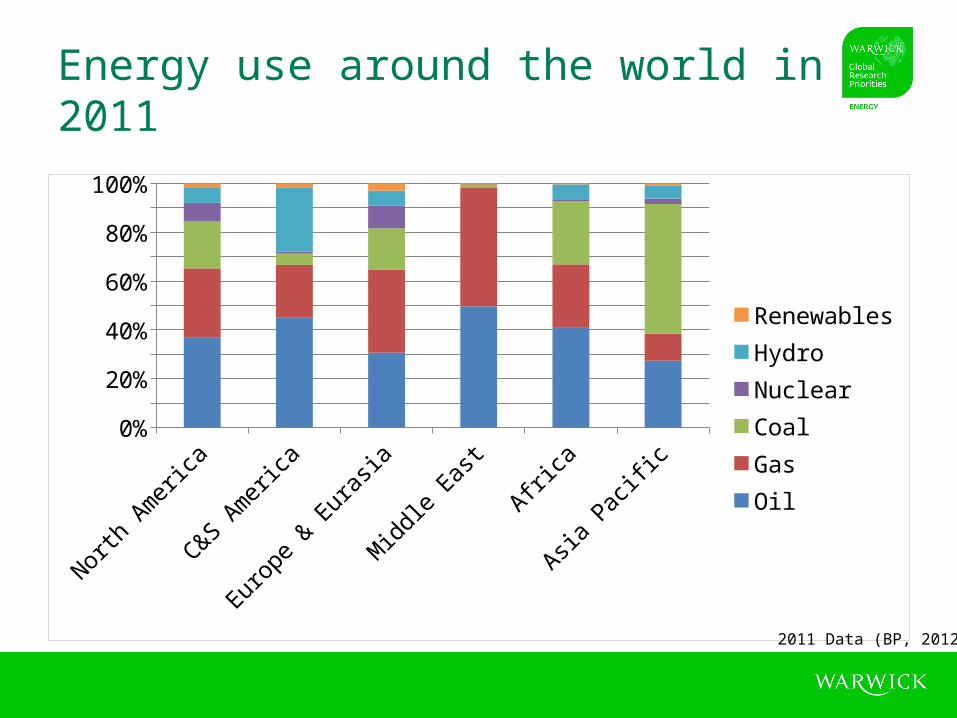
Energy use around the world in 2011
North America
C&S America
Europe & Eurasia
Middle East
Africa Asia Pacific
0%
10%
20%
30%
40%
50%
60%
70%
80%
90%
100%
RenewablesHydro Nuclear CoalGasOil
2011 Data (BP, 2012)

Energy transitions take time: historically 25 years or more
Retail consumer fuel prices in the UK 1800-2000 (p/kWh)
Fouquet and Pearson (2003)
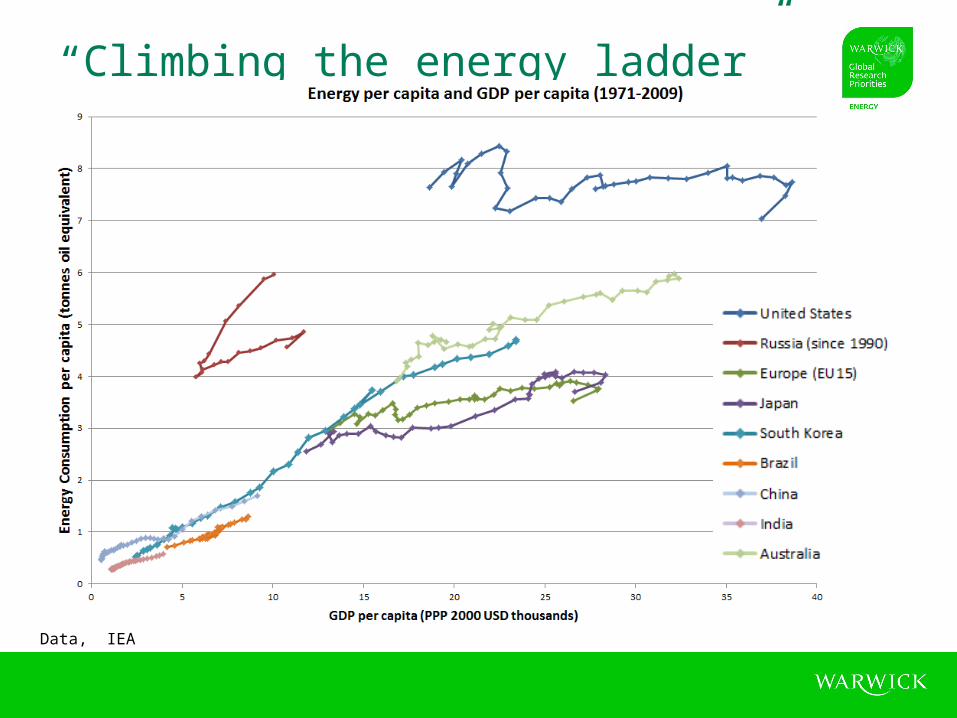
“Climbing the energy ladder”
Data, IEA

World Energy Flows
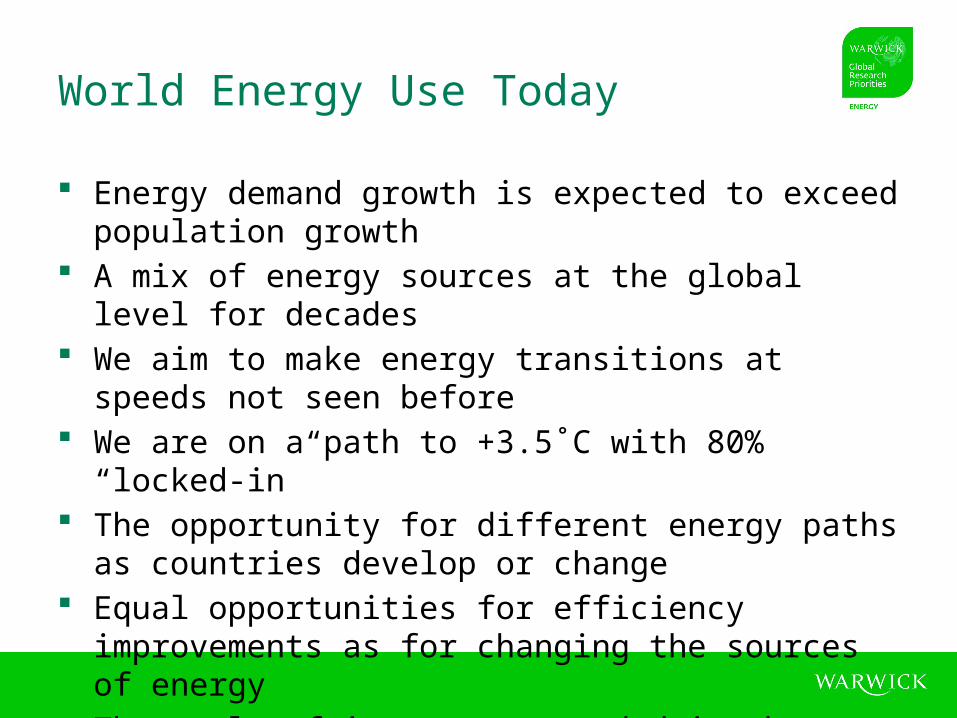
World Energy Use Today
Energy demand growth is expected to exceed population growth
A mix of energy sources at the global level for decades We aim to make energy transitions at speeds not seen before We are on a path to +3.5˚C with 80% “locked-in” The opportunity for different energy paths as countries
develop or change Equal opportunities for efficiency improvements as for
changing the sources of energy The scale of investment needed in the energy industry is at
least $1Trillion every year over the next 25 years

Scenarios used at Warwick to explore paths that companies might take. The Shell 2050 Scenarios
– An international company example
The UK Foresight “Powering our Lives” Scenarios– A government perspective
The Forum for the Future’s Climate Futures Scenarios– A sustainable development perspective
The Forum for the Future’s Climate for Development Scenarios– A sustainable development perspective for emerging economies
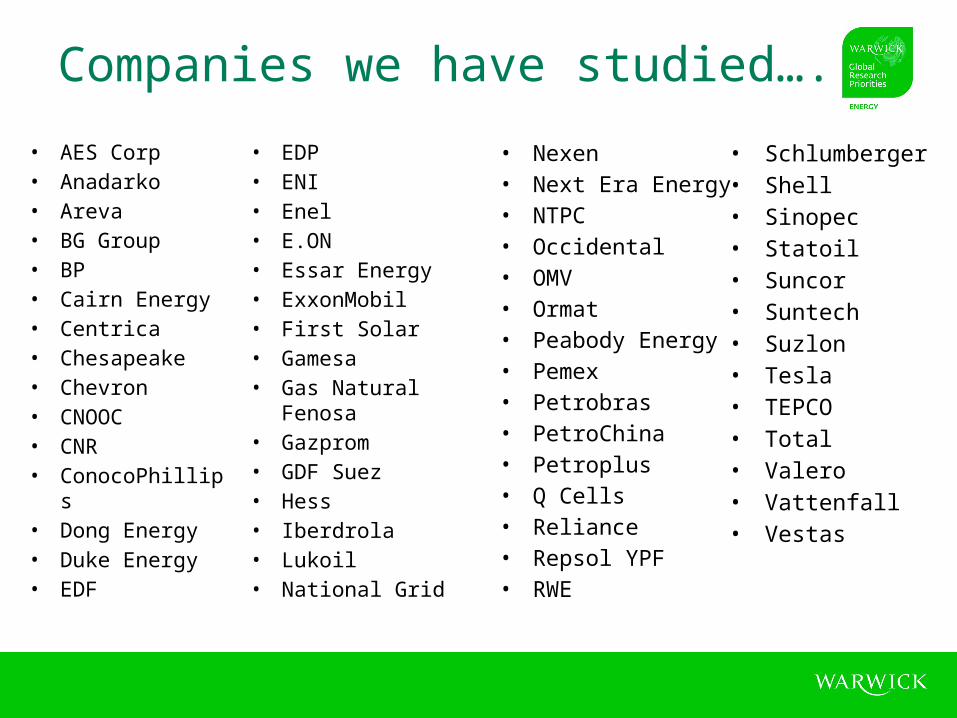
Companies we have studied….
• AES Corp• Anadarko • Areva • BG Group • BP • Cairn Energy• Centrica • Chesapeake• Chevron • CNOOC• CNR• ConocoPhillips• Dong Energy • Duke Energy• EDF
• EDP• ENI• Enel• E.ON• Essar Energy• ExxonMobil• First Solar • Gamesa • Gas Natural Fenosa• Gazprom• GDF Suez• Hess • Iberdrola• Lukoil• National Grid
• Nexen• Next Era Energy• NTPC• Occidental• OMV• Ormat• Peabody Energy• Pemex• Petrobras • PetroChina• Petroplus• Q Cells • Reliance• Repsol YPF• RWE
• Schlumberger • Shell • Sinopec• Statoil • Suncor• Suntech• Suzlon • Tesla• TEPCO• Total• Valero • Vattenfall • Vestas
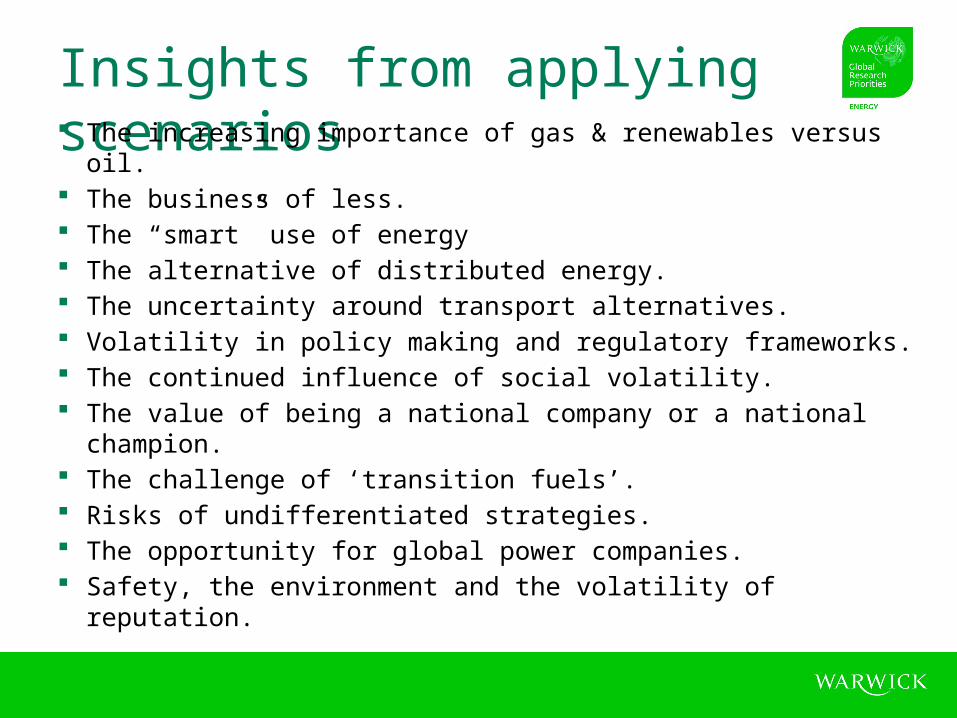
Insights from applying scenarios The increasing importance of gas & renewables versus oil. The business of less. The “smart” use of energy The alternative of distributed energy. The uncertainty around transport alternatives. Volatility in policy making and regulatory frameworks. The continued influence of social volatility. The value of being a national company or a national champion. The challenge of ‘transition fuels’. Risks of undifferentiated strategies. The opportunity for global power companies. Safety, the environment and the volatility of reputation.

UK Energy Futures
Richard SmithHead of Energy Strategy & Policy
October 2012
35
36
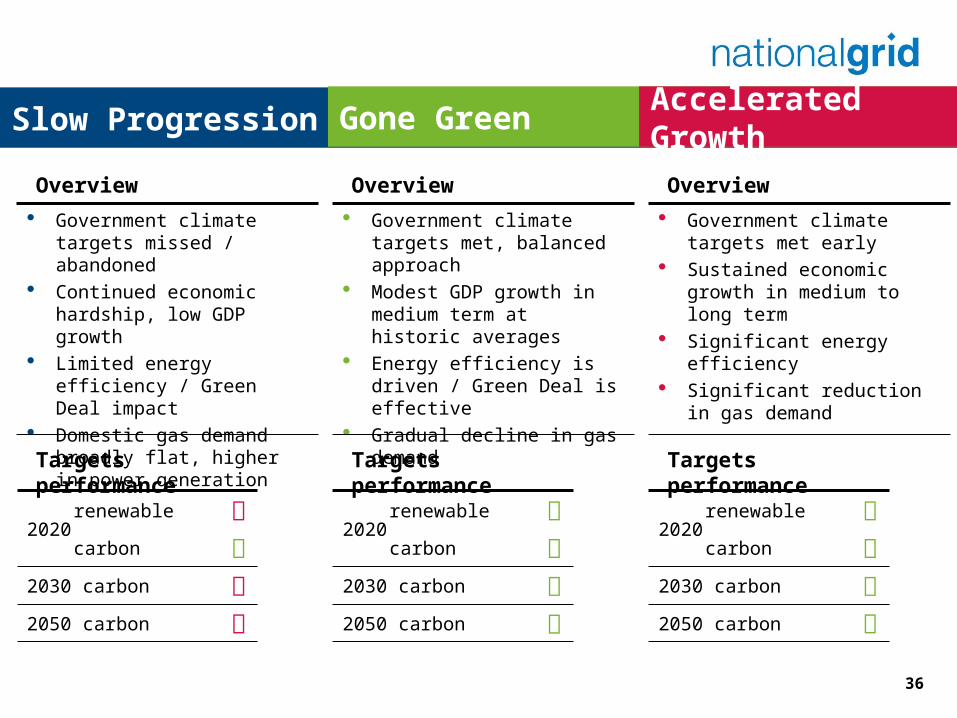
Slow Progression
Government climate targets missed / abandoned
Continued economic hardship, low GDP growth
Limited energy efficiency / Green Deal impact
Domestic gas demand broadly flat, higher in power generation
Overview
Government climate targets met, balanced approach
Modest GDP growth in medium term at historic averages
Energy efficiency is driven / Green Deal is effective
Gradual decline in gas demand
Overview
Targets performance
2020
2030 carbon
2050 carbon
renewable
carbon
Gone Green Accelerated Growth
Government climate targets met early
Sustained economic growth in medium to long term
Significant energy efficiency Significant reduction in gas
demand
Overview
Targets performance
2020
2030 carbon
2050 carbon
renewable
carbon
Targets performance
2020
2030 carbon
2050 carbon
renewable
carbon
37
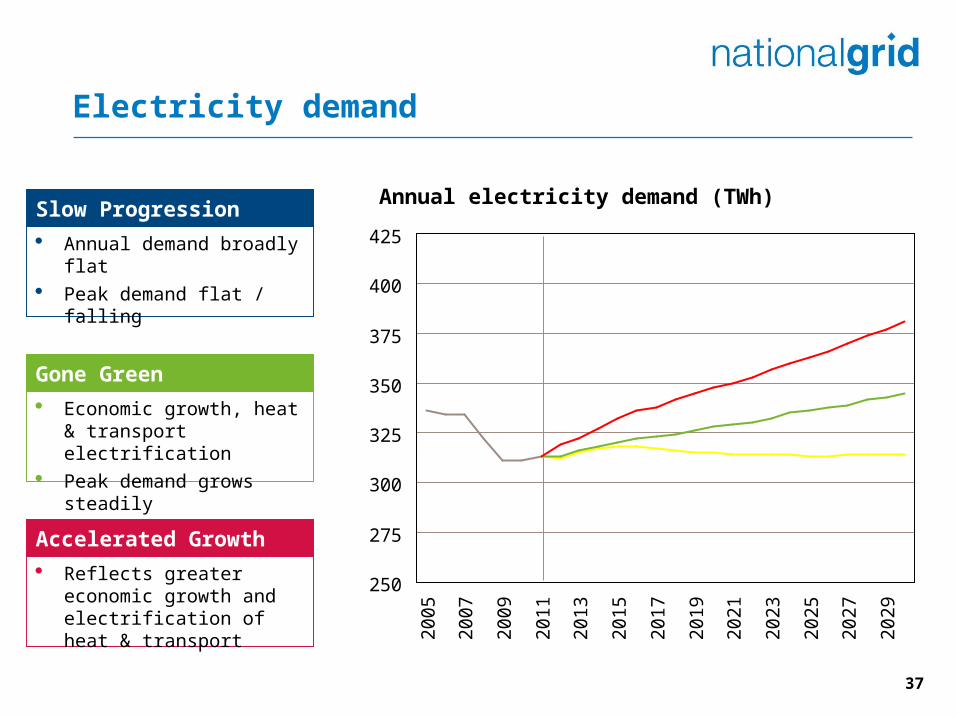
Electricity demand
Economic growth, heat & transport electrification
Peak demand grows steadily
Gone Green
Reflects greater economic growth and electrification of heat & transport
Accelerated Growth
Annual electricity demand (TWh)
Annual demand broadly flat Peak demand flat / falling
Slow Progression
250
275
300
325
350
375
400
425
20
05
20
07
20
09
20
11
20
13
20
15
20
17
20
19
20
21
20
23
20
25
20
27
20
29
38
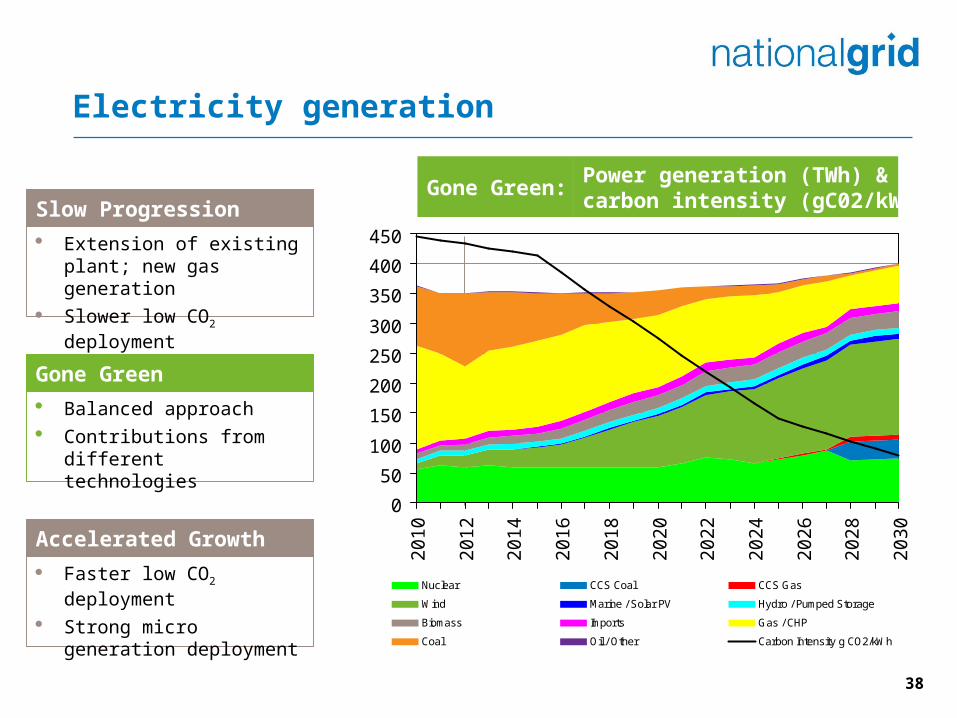
Electricity generation
Balanced approach Contributions from different
technologies
Gone Green
Faster low CO2 deployment
Strong micro generation deployment
Accelerated Growth
Extension of existing plant; new gas generation
Slower low CO2 deployment
Slow Progression
0
50
100
150
200
250
300
350
400
450
20
10
20
12
20
14
20
16
20
18
20
20
20
22
20
24
20
26
20
28
20
30
Nuclear CCS Coal CCS Gas
Wind Marine / Solar PV Hydro / Pumped Storage
Biomass Imports Gas / CHP
Coal Oil / Other Carbon Intensity g CO2/kWh
Power generation (TWh) &carbon intensity (gC02/kWh)
Gone Green:
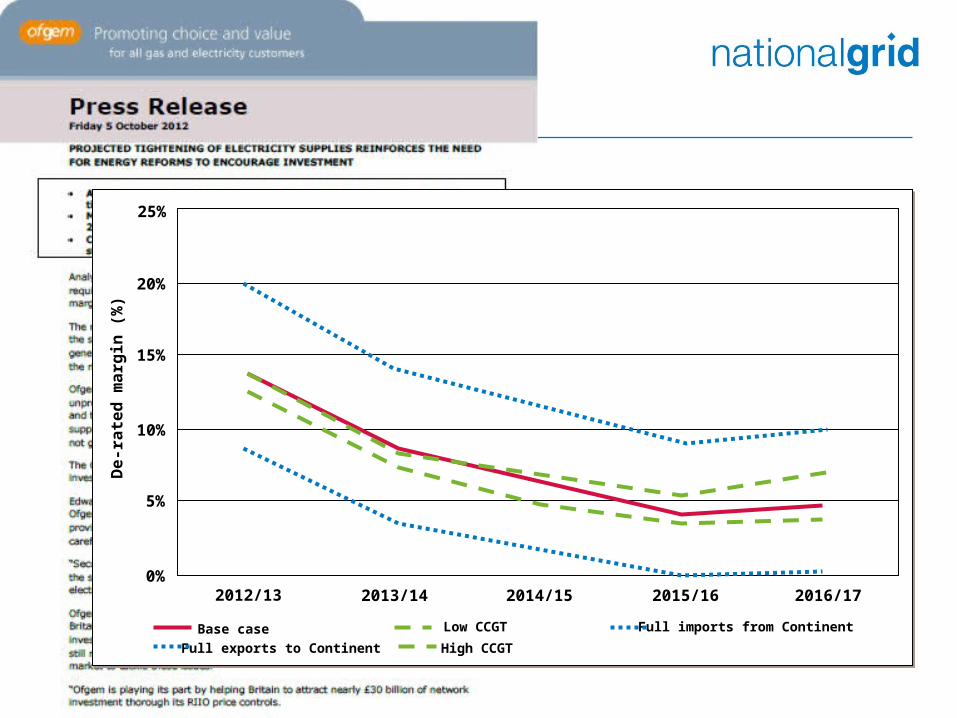
25%
20%
15%
10%
5%
0%2012/13 2013/14 2014/15 2015/16 2016/17
Base case
Full exports to Continent
Low CCGT
High CCGT
Full imports from Continent
De
-ra
ted
ma
rgin
(%
)
40
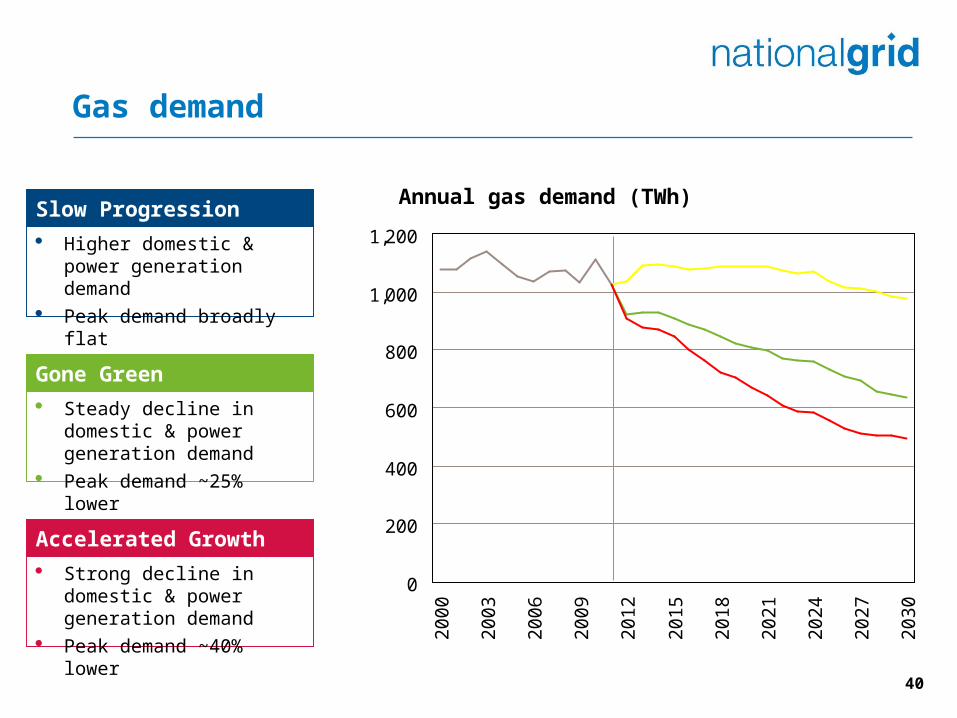
Gas demand
Steady decline in domestic & power generation demand
Peak demand ~25% lower
Gone Green
Strong decline in domestic & power generation demand
Peak demand ~40% lower
Accelerated Growth
Annual gas demand (TWh)
Higher domestic & power generation demand
Peak demand broadly flat
Slow Progression
0
200
400
600
800
1,000
1,200
20
00
20
03
20
06
20
09
20
12
20
15
20
18
20
21
20
24
20
27
20
30

41
Gas supply
Balanced approach Flexible storage driven by
market requirements
Gone Green
Lower UKCS & Norwegian supply; tight global LNG
Storage under construction
Accelerated Growth
Higher UKCS & Norwegian supply; higher global LNG
New seasonal storage
Slow Progression
0
20
40
60
80
100
120
20
01
20
03
20
05
20
07
20
09
20
11
20
13
20
15
20
17
20
19
20
21
20
23
20
25
20
27
20
29
0%
10%
20%
30%
40%
50%
60%
70%
80%
90%
100%
UKCS Norw ay Continent LNG Onshore Import Dependency Demand
Gas supply (bcm/year) &Import dependency (%)
Gone Green:

42

Professor Evan Parker (Department of Physics)
Is there an energy crisis?

“…….we will ultimately burn about 1% of the available fossil fuel over
the next few centuries”
Prof Ken Caldeira, StanfordScientific American Sept 2012
We have stacks of fossil fuel...
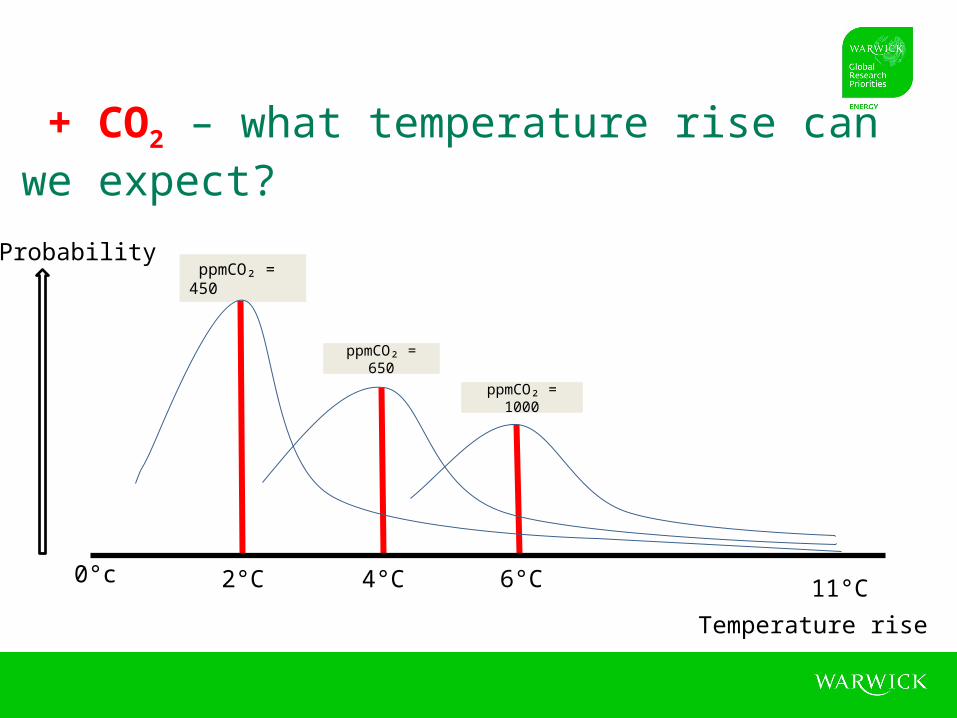
+ CO2 – what temperature rise can we expect?
despondency
Temperature rise
ppmCO₂ = 450
2°C 11°C
ppmCO₂ = 1000
0°c 4°C 6°C
ppmCO₂ = 650
Probability

Too risky to ignore
So let’s save energy?Jevon’s Paradox:In developed economies, saving energy (by improved efficiency) tends to lead to increased demand for energy, which in turn accelerates economic growth, further increasing demand!
….tendency for efficiency to merely displace!

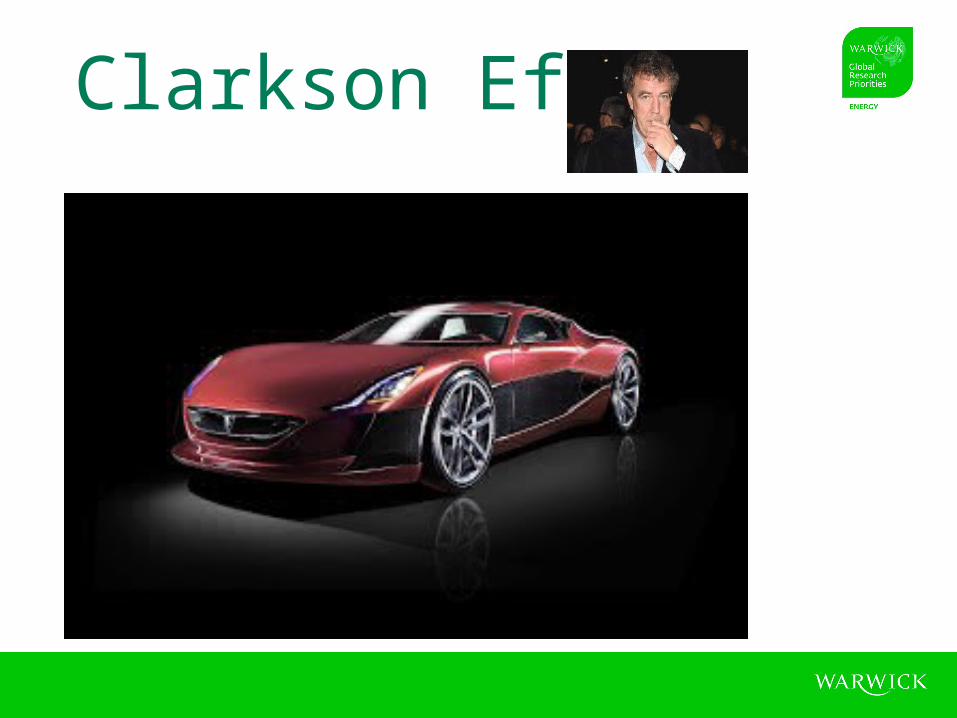
Clarkson Effect

Jan 2011
Courtesy of Lord Oxburgh
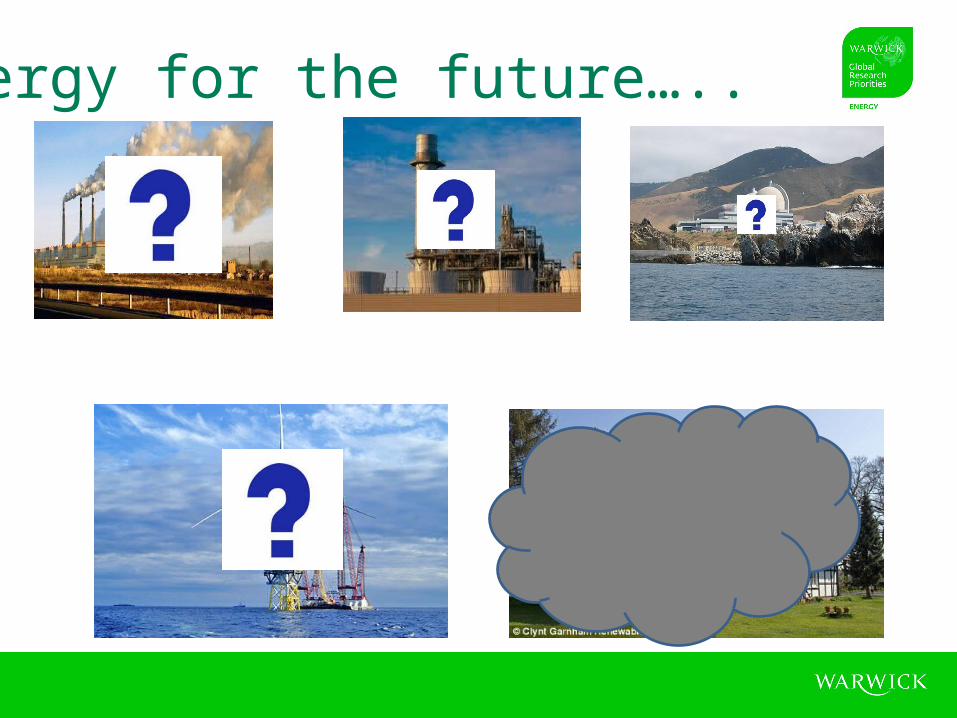
Energy for the future…..
Fixated on CO₂ emission reduction
targets
Wrong target?
More effective approachFocus on energy:
Clean, low cost, abundant, deployable and available 24/7

FUSION
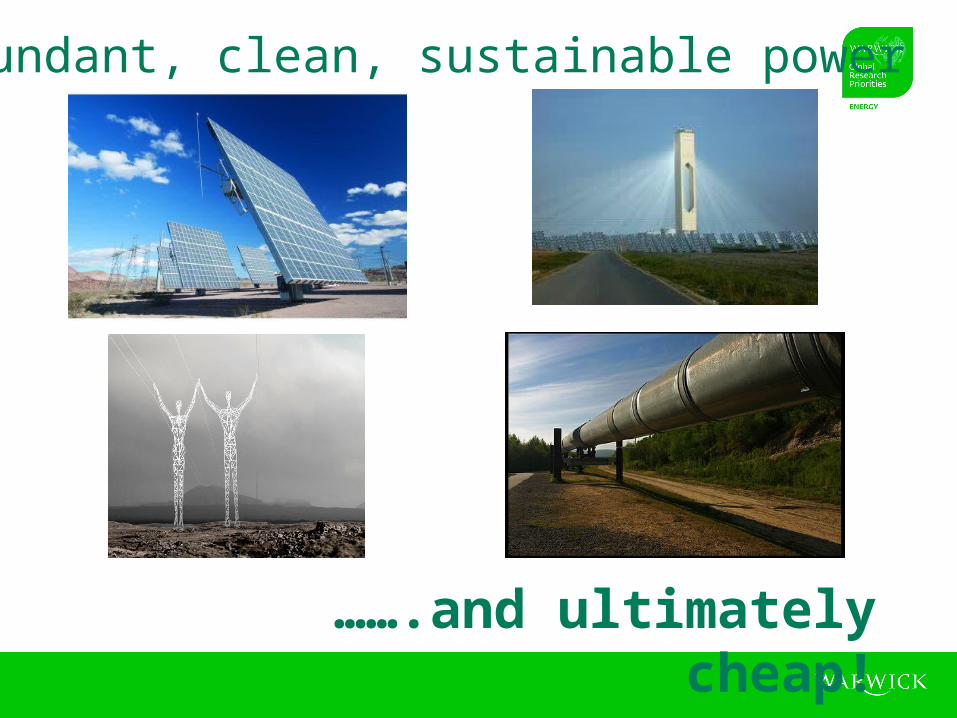
Abundant, clean, sustainable power
…….and ultimately cheap!
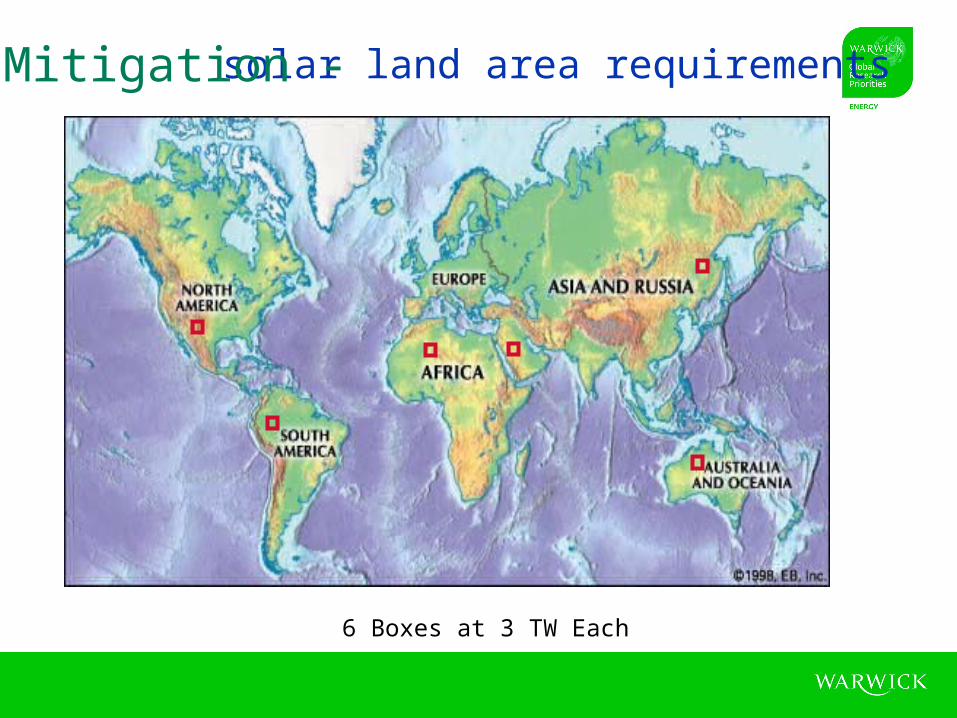
solar land area requirements
6 Boxes at 3 TW Each
Mitigation -

Geo-engineering solution – “Dream Particles” for the polar regions:
MEMS
Sirf
IC
“ The Dream Particle” (1μm x 1μm x 100nm)
PV Cell
Mirror surface
…….we cannot ignore the unthinkable?
Is there an energy crisis?
…..this is not the right question
What is the programme for rolling out clean energy across the world?There is a crisis in Energy Policy
Jon Price, Director Centre for Low Carbon [email protected]

Technologies alone are not enough
• Policies: Emission targets, technology road maps and policies often fail to deliver planned outcomes
• Politics: Social case for action as valid as the business case for investment of public funds
• Behaviours: Often wrongly assumed that humans prefer a neutral environment in buildings, and more than often building energy performance “in situ” has a vast performance gap between planned and delivered
• Public Perception: Talks of super critical CO2 in CCS pipelines, Carbon storage in saline aquifers, Shale Gas drilling, exploding sodium sulfur batteries, Nuclear
Uncertainty and lack of evidence slows the speed of the transition to a low carbon economy.

The Carbon Impact
Source: Economics of Low Carbon Cities,Centre for Low Carbon Futures Gouldson et al 2012
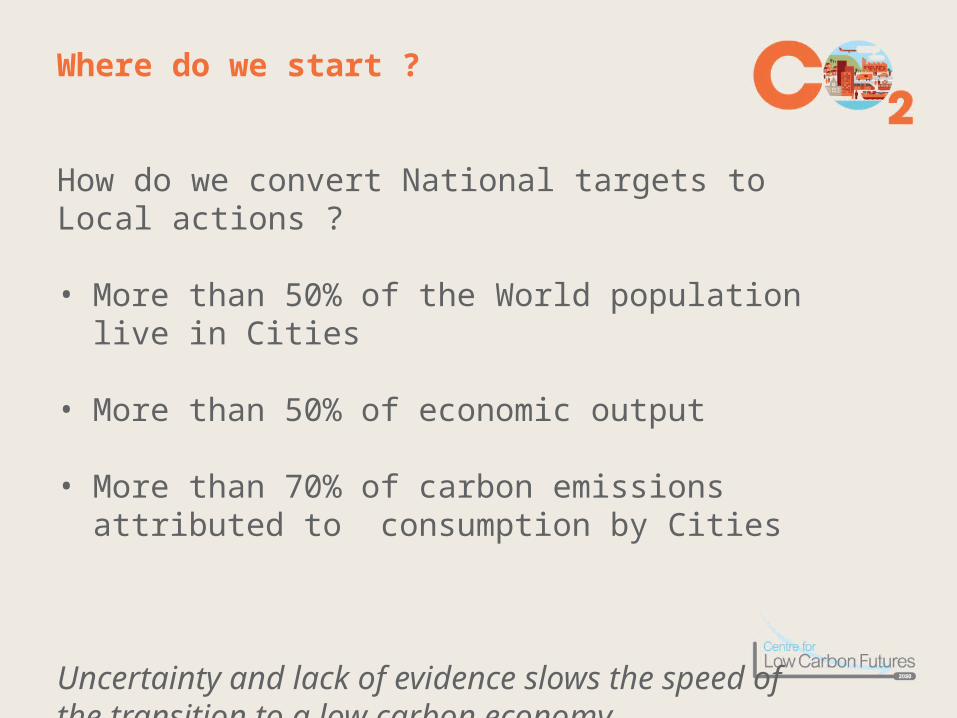
Where do we start ?
How do we convert National targets to Local actions ?
• More than 50% of the World population live in Cities
• More than 50% of economic output
• More than 70% of carbon emissions attributed to consumption by Cities
Uncertainty and lack of evidence slows the speed of the transition to a low carbon economy.
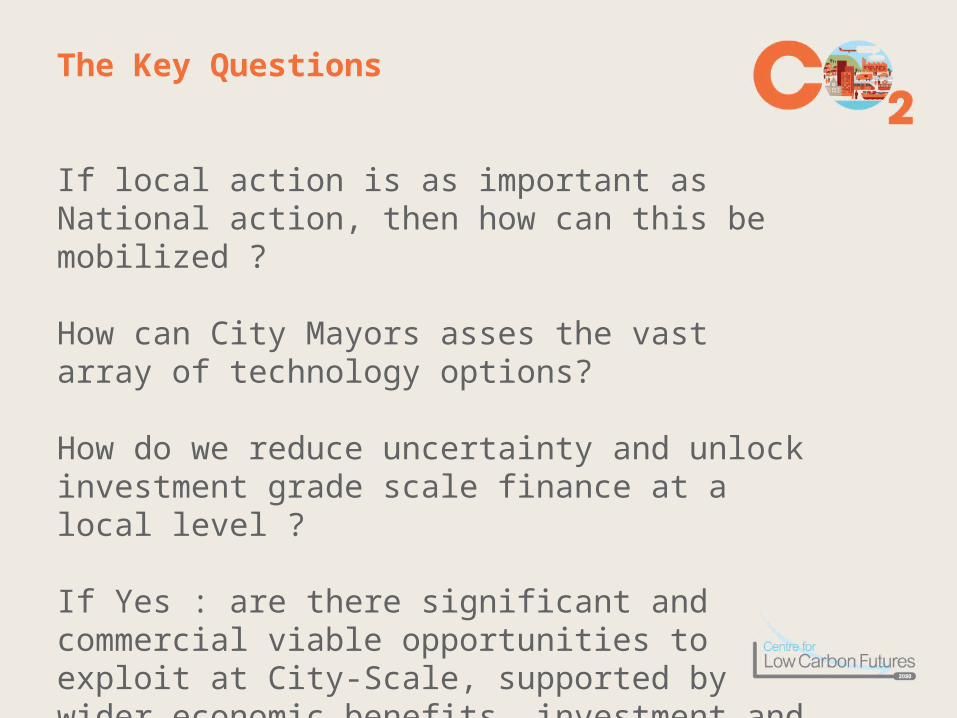
The Key Questions
If local action is as important as National action, then how can this be mobilized ?
How can City Mayors asses the vast array of technology options?
How do we reduce uncertainty and unlock investment grade scale finance at a local level ?
If Yes : are there significant and commercial viable opportunities to exploit at City-Scale, supported by wider economic benefits, investment and deliver vehicles ?
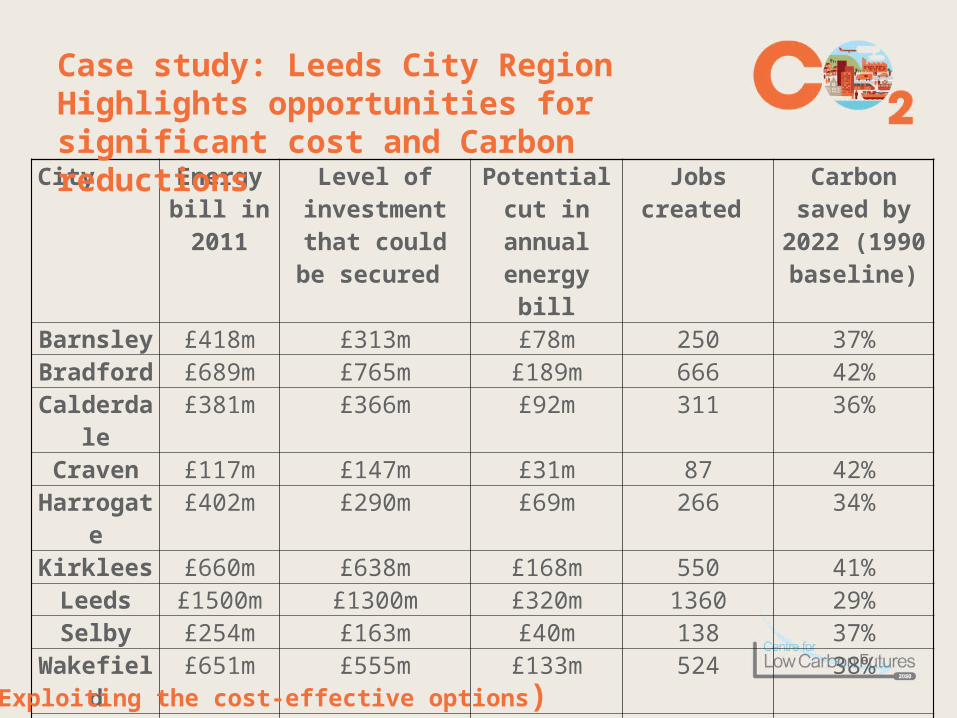
City Energy bill in 2011
Level of investment that
could be secured
Potential cut in annual
energy bill
Jobs created Carbon saved by 2022 (1990
baseline)
Barnsley £418m £313m £78m 250 37%Bradford £689m £765m £189m 666 42%
Calderdale £381m £366m £92m 311 36%Craven £117m £147m £31m 87 42%
Harrogate £402m £290m £69m 266 34%Kirklees £660m £638m £168m 550 41%
Leeds £1500m £1300m £320m 1360 29%Selby £254m £163m £40m 138 37%
Wakefield £651m £555m £133m 524 38%York £312m £314m £72m 300 40%
Total LCR £5.4 bn £4.9 bn £1.2bn 4,500 36%
Case study: Leeds City RegionHighlights opportunities for significant cost and Carbon reductions
( Exploiting the cost-effective options)

[email protected] www.lowcarbonfutures.org
Centre for Low Carbon Futures
University of Warwick October 2012
“An overview of alternative options for low carbon energy and the difficulties they present”

Questions?
Group Discussion1. Will we ever run out of oil? What would you
be prepared to pay for a litre of fuel?2. Why should we switch the lights out?3. Will Jeremy Clarkson ever own an electric
vehicle?4. Which is greener – Nuclear or Wind?5. How do we make solar work in the UK?
Pre Christmas
Date and venue tbc
Innovative Manufacturing
Next Ideas Cafe