Embed Size (px)
Citation preview
Energy is Always a Major Cost Factor
International Symposium on Energy Efficiency in
Pulp and Paper Industry, September 20, 2011
Jussi Manninen and Janne Poranen
VTT Technical Research Centre of Finland
2 27/10/2011
Contents
Why energy is a major cost factor and why energy prices are high
What are the targets for efficiency improvement
What can be done to increase energy efficiency
Operations
Monitoring
Technology (examples from Metso)
Research and development of future technologies for energy
efficient paper processes
Conclusions

3 27/10/2011
Why is energy a major cost factor
Pulp and paper making is energy-intensive
Cost of energy is on the rise
Oil and gas prices are rising
Diversification of energy supply due to energy security and
environmental concerns leads to increased use of renewables
=> leads to increased competition on wood
Other costs are introduced, like taxes and emission trading
4 27/10/2011
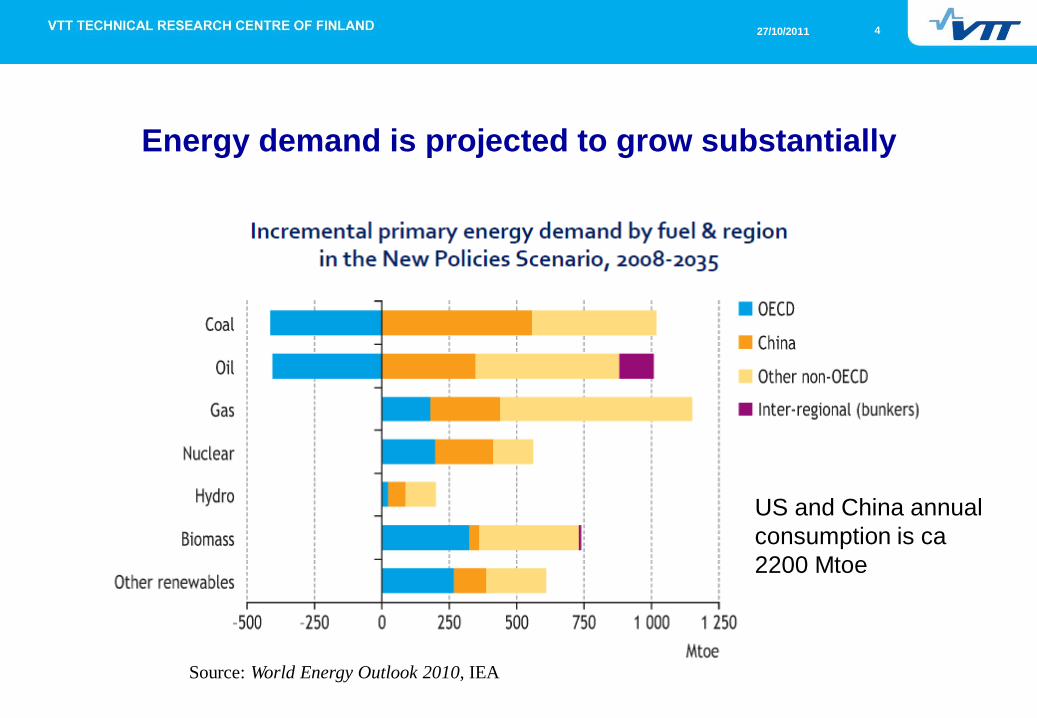
Energy demand is projected to grow substantially
Source: World Energy Outlook 2010, IEA
US and China annual
consumption is ca
2200 Mtoe

5 27/10/2011
Renewables need to be supported to accelerate their introduction
to market
Source: World Energy Outlook 2010, IEA
6 27/10/2011
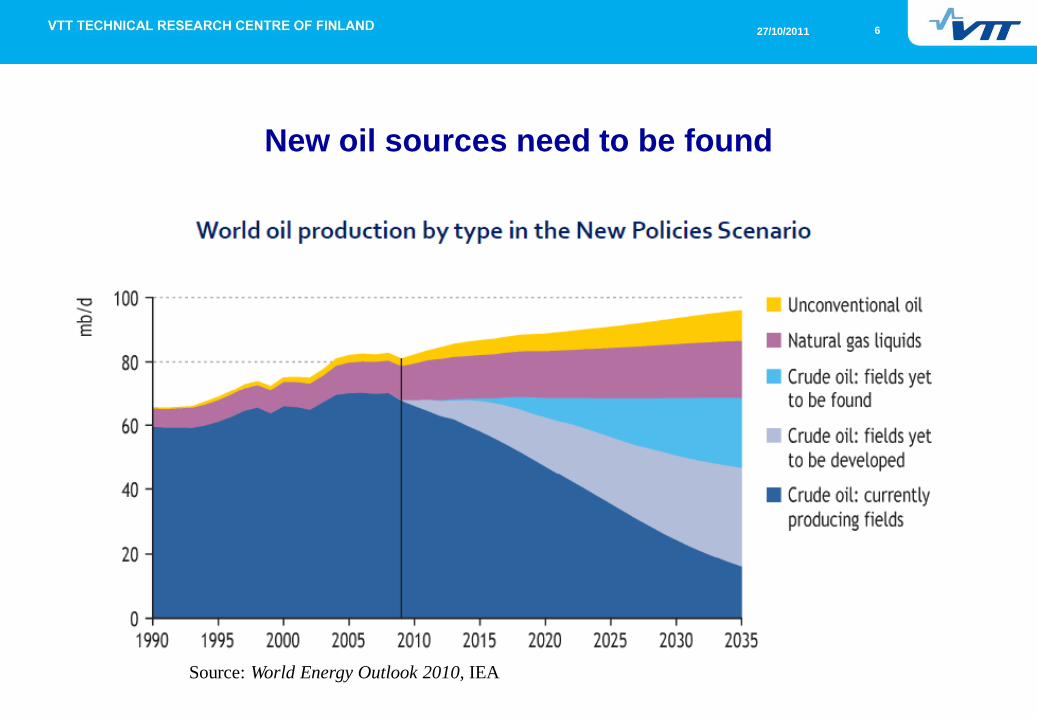
New oil sources need to be found
Source: World Energy Outlook 2010, IEA
7 27/10/2011
How to control cost and increase energy efficiency
Understand energy use
Monitor energy use and benchmark
Develop an energy strategy
Implement an energy management system
Implement energy efficiency measures
Optimise energy purchase

8 27/10/2011
How to start implementing energy management
Collect data on energy use and document data to get an energy balance
Production and energy reports
DCS and additional measurements
Process simulation
Establish baseline performance
Set target values to aim to
Benchmarking
BAT-values
Theoretical values
Analyse energy use patterns and trends to identify key factors that influence energy consumption
Evaluate the process performance and equipment to identify improvement potential and opportunities
Experience
Analysis
Process simulation
9 27/10/2011
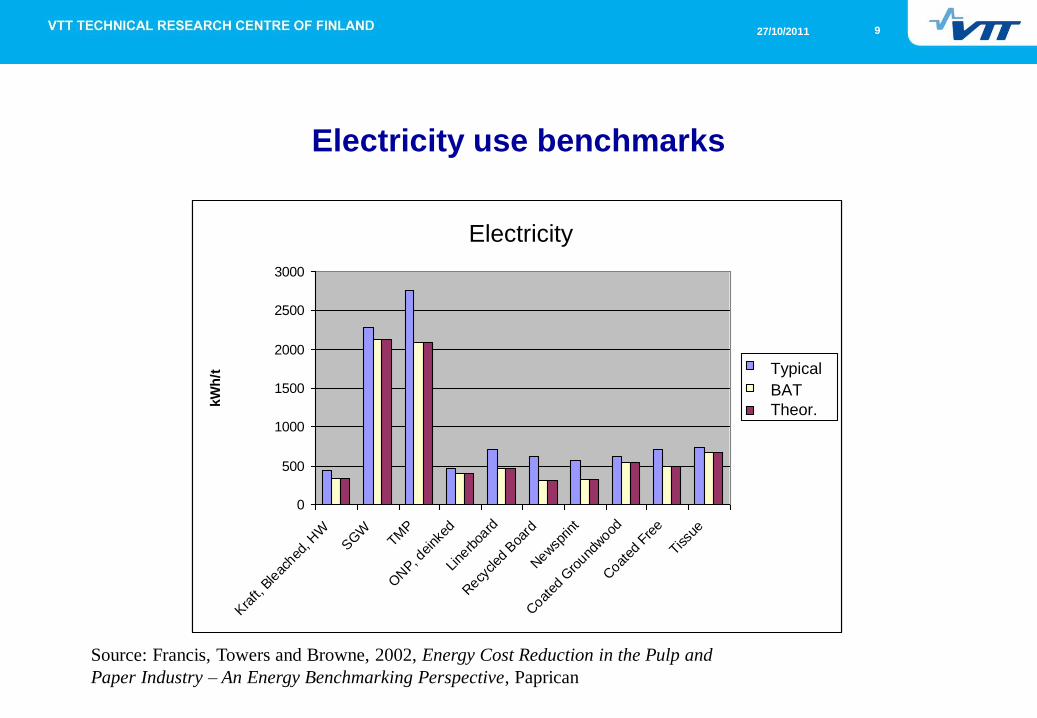
Electricity use benchmarks
Sähkönkulutus
0
500
1000
1500
2000
2500
3000
Kra
ft, B
leac
hed, H
WSGW
TMP
ONP, d
eink
ed
Line
rboa
rd
Recy
cled
Boa
rd
New
sprin
t
Coat
ed G
round
wood
Coat
ed F
ree
Tissu
e
kW
h/t
Tyypillinen
BAT
Teoreettinen
Typical
BAT
Theor.
ElectricitySähkönkulutus
0
500
1000
1500
2000
2500
3000
Kra
ft, B
leac
hed, H
WSGW
TMP
ONP, d
eink
ed
Line
rboa
rd
Recy
cled
Boa
rd
New
sprin
t
Coat
ed G
round
wood
Coat
ed F
ree
Tissu
e
kW
h/t
Tyypillinen
BAT
Teoreettinen
Typical
BAT
Theor.
Electricity
Source: Francis, Towers and Browne, 2002, Energy Cost Reduction in the Pulp and
Paper Industry – An Energy Benchmarking Perspective, Paprican

10 27/10/2011
Steam use benchmarks
Höyry
0.0
1.0
2.0
3.0
4.0
5.0
6.0
7.0
8.0
9.0
Kra
ft, B
leac
hed, H
WSGW
TMP
ONP, d
eink
ed
Line
rboa
rd
Recy
cled
Boa
rd
New
sprin
t
Coat
ed G
round
wood
Coat
ed F
ree
Tissu
e
GJ/t
Tyypillinen
BAT
Teoreettinen
Typical
BAT
Theor.
SteamHöyry
0.0
1.0
2.0
3.0
4.0
5.0
6.0
7.0
8.0
9.0
Kra
ft, B
leac
hed, H
WSGW
TMP
ONP, d
eink
ed
Line
rboa
rd
Recy
cled
Boa
rd
New
sprin
t
Coat
ed G
round
wood
Coat
ed F
ree
Tissu
e
GJ/t
Tyypillinen
BAT
Teoreettinen
Typical
BAT
Theor.
Steam
Source: Francis, Towers and Browne, 2002, Energy Cost Reduction in the Pulp and
Paper Industry – An Energy Benchmarking Perspective, Paprican

11 27/10/2011
Factors affecting consumption
INTERNAL FACTORS
•Loads
Load characteristics
•fast dynamic
•constant power etc.
Load (type, class etc.)
•individual device
•device group
•plant unit
Load groups
(load composition)
•drying
•wet end etc.
•Paper mill size and age
•Process arrangements
•Production type
•Product type
•etc.
LO
AD
MO
DE
LS
EXTERNAL FACTORS
• climate
• weather
• season
• day of the week
• time of the day etc.
Source: Alanen, R., 2000, Analysis of electrical energy consumption and neural network estimation
and forecasring of loads in a paper mill, VTT Publications 424.
12 27/10/2011
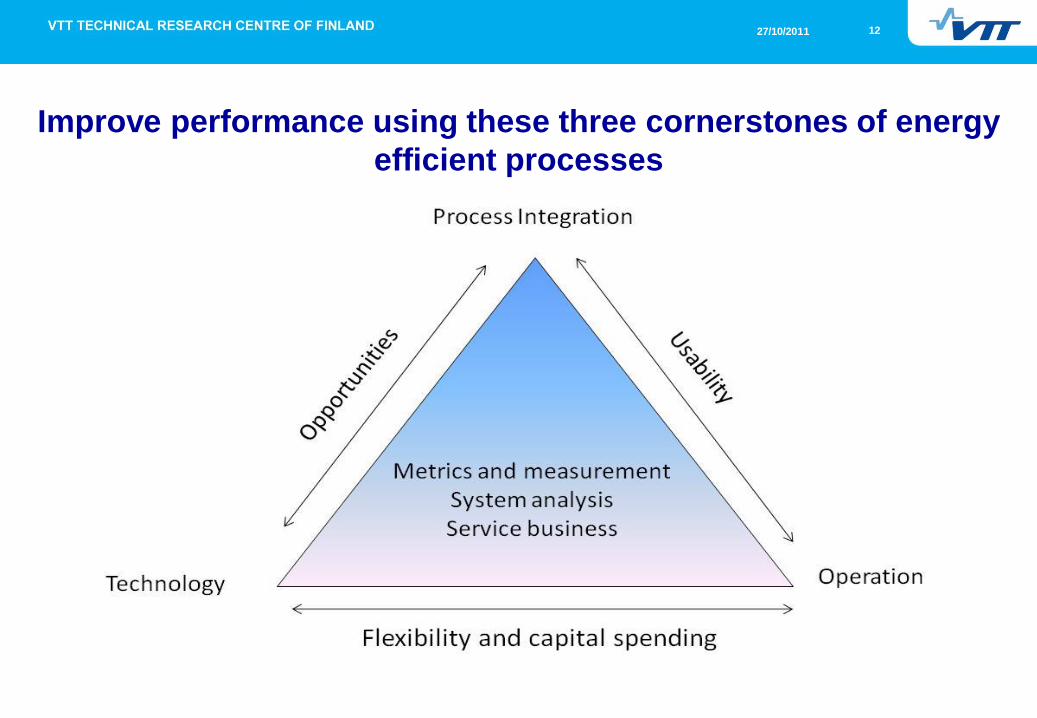
Improve performance using these three cornerstones of energy
efficient processes

13 27/10/2011
Energy cost have influence on the cost-optimum production rate
Source: Sivill, L. and Ahtila. P, 2009, Paper Machine Production Efficiency as a Key
Performance Indicator of Energy Efficiency, Proceedings of PRES-09

14 27/10/2011
Example of specific steam consumption as function of production
Source: Sivill, L. and Ahtila. P, 2009, Paper Machine Production Efficiency as a Key
Performance Indicator of Energy Efficiency, Proceedings of PRES-09

15 27/10/2011
Monitoring electricity consumption – a case study in the pulp and
paper industry
Goals
Estimate the impact of operational practices on energy consumption
Obtain information on the success of process design
Evaluate potential and economics of equipment re-sizing
Detect maintenance demands of process equipment in advance before any significant deterioration in performance occur
How it was done
Data acquisition system was installed and connected through standard interfaces to the process automation system, the energy control system, measurements of the electrical network and different equipment registers
30 kW or larger drives were selected for the monitoring, and sampling interval was 1 minute
A monitoring period of several months was used to capture all possible load situations
Power consumption measurement was estimated using either correlation methods or type-specific load curves of electric motors.
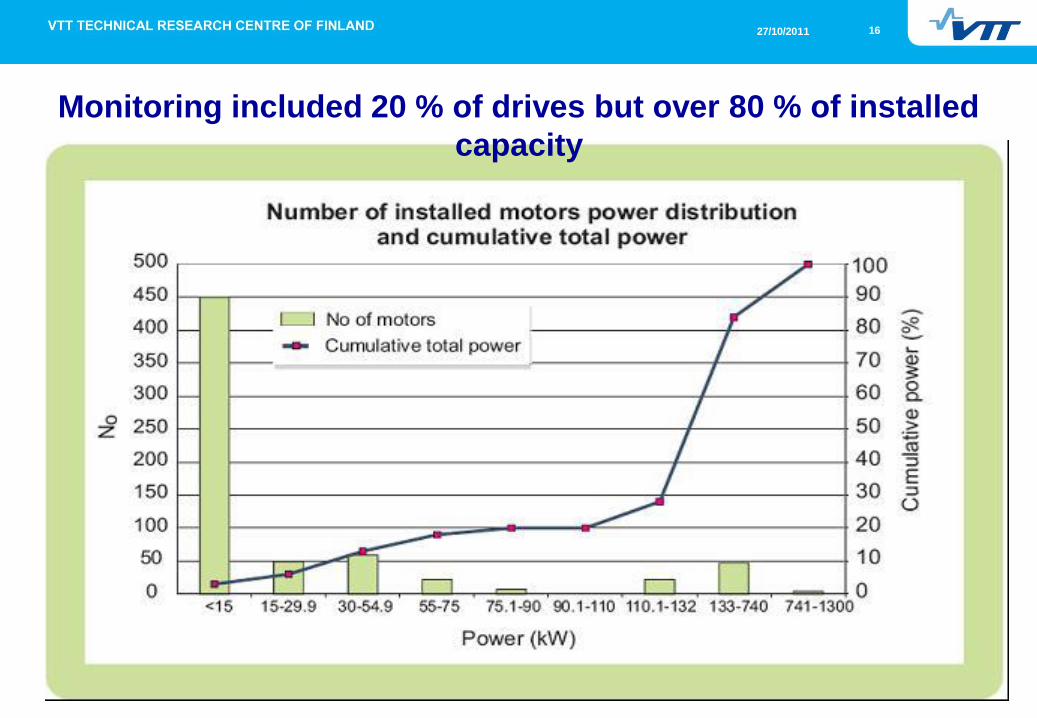
16 27/10/2011
Monitoring included 20 % of drives but over 80 % of installed
capacity

17 27/10/2011
Many drives are run at partial load
18 27/10/2011
Benefits from electricity load monitoring
Improved knowledge of electricity use helps to improve control and
forecasting
Surveillance of electricity use promotes best practices e.g.
between shifts
Provides long-term data for energy savings analyses for
drives
pumps, blowers
Points out maintenance needs for equipment
Gives feed-back to designers to improve dimensioning

Energy efficient solutions
© Metso
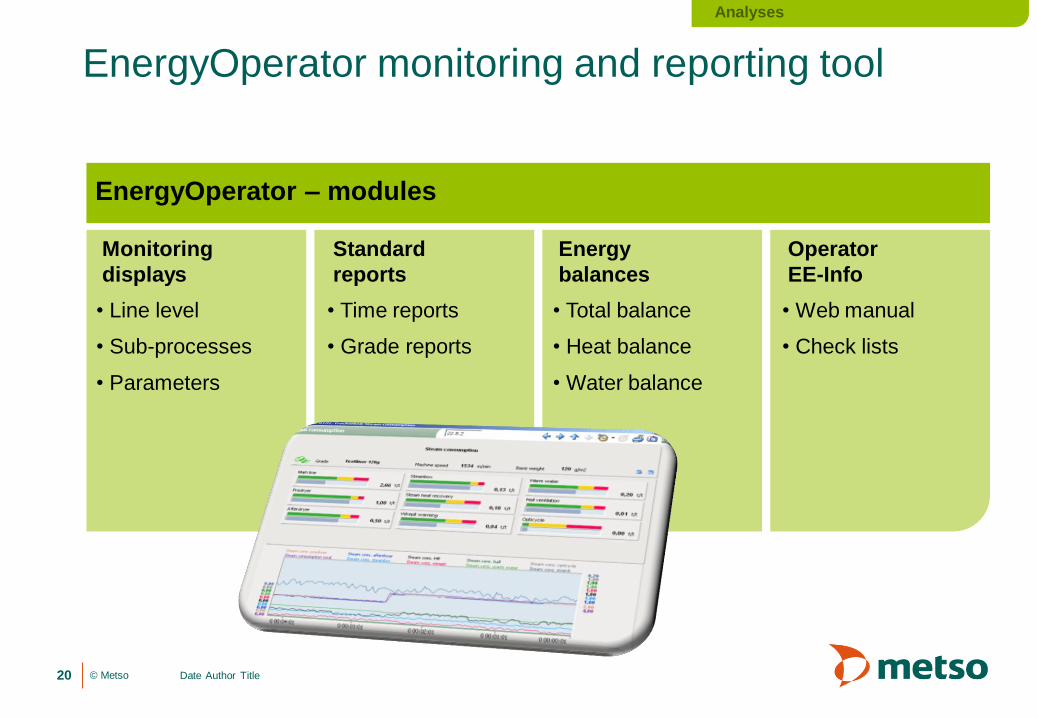
EnergyOperator monitoring and reporting tool
Date Author Title 20
Standard
reports
Energy
balances
Operator
EE-Info
• Total balance
• Heat balance
• Water balance
• Time reports
• Grade reports
• Line level
• Sub-processes
• Parameters
• Web manual
• Check lists
Monitoring
displays
EnergyOperator – modules
Analyses

© Metso
Energy savings at stock preparation Case: Eucaplyptus refining with OptiFiner Pro
Date Author Title 21
Solution
• Low consistency refining
technology
• One OptiFiner Pro replaces two
traditional refiners
Result
Stock manufacturing and handling
40% electrical energy savings
compared to traditional
refiners

© Metso
• Long dwell time in the vacuum
zone
• Increases felt dewatering at a lower
vacuum level than a slotted cover
• Decreases friction between the
cover and the felt
• Cost savings and benefits
- Increased dewatering
- Lower friction - lower press drive load
- Longer felt lifetime - longer felt change
interval
22
Cost-saving felt conditioning solution
Perforated uhle box cover based on SolidCoat technology
Wet end dewatering

© Metso
Dryer section energy savings through optimized doctoring
Low friction doctor blades
Date Author Title 23
Assumptions
Width 7 m
Machine speed 900 m/min
Load 300 N/m
Dryer cylinder radius 0.915 m
µ Glass fiber 0.5
µ Carbon fiber 0.2
Number of blades 50
Running days/year 300
Friction and drive powers
Relative power consumption of doctor
blade materials
Based on laboratory tests in simulated paper machine
environment
4
3
2
1
0
Carbon
fiber
Glass
fiber
Steel Bronze
Solution
• Doctor blade material with low
friction coefficient

© Metso
Energy savings and low maintenance costs PowerDry Plus air dryer
Results
• Lower web temperature
• Less water penetration
• Energy savings
• Lower maintenance costs
Date Author Title 24
Maintenance costs
Energy costs
PowerDry Plus Gas IR Electrical IR
600
500
400
300
200
100
0
Paper finishing
k €/a
700
Machine width 8 m
PowerDry Plus with 3 nozzles and IR dryers with
similar evaporation
Annual operating time 8,000 h/a
Energy source natural gas - natural gas 30 €/MWh
- electric power 55 €/MWh

25 27/10/2011
Some future directions for improving energy efficiency in paper
and boardmaking
Improved water removal from the web
Savings in steam 4 % per 1 %-unit of dry content
Material development to reduce friction
Savings in electricity consumption of drives
Process simplification
Thinner paper products
Considerable savings in raw material and energy per functionality of paper (i.e. per printing surface)
High consistency forming
Savings in short circulation pumping
Replacement of fiber by fillers
Savings in pulping and drying
Dry forming
Savings dependent on how much moisture is needed to form the web and how much energy is needed for fluidisation of fibers in air

26 27/10/2011
Drivers for new resource efficient technologies

27 27/10/2011
Technical specifications:
Forming unit Press
Gap/Hybrid/Fourdrinier
Web speed 2500 m/min Max line load 2000 kN/m
Headbox flowrate 240 l/s/m Web width ~210 mm
Web width 300 mm Belt width 700 mm
Fabric width 500 mm
New process and product concepts
• Fundamentals of web forming
• Paper structure
• Dewatering
• Wet end process development
• Mixing, deaeration, screening
• Wet-pressing
• Sensor development
• Papermachine clothing development
• Chemical and raw material studies
SUORA – Research environment
Running concepts
• Once-through (no circulation)
• Small volume circulation
• 15 m3 ~300 kg
• Large volume circulation
• 100 m3 ~3 000 kg

Research case: forming fabrics and energy consumption
• Target of study was to find out if forming fabrics can affect energy
consumption on forming section.
• On SUORA-former friction of forming fabric on vacuum box and
wattage of drive motor can be measured
• SUORA environment has
support a new forming
fabric type development
with lowered energy
consumption
– First product application has
been sold and the
installation in paper mill will
be done in 10/2009
Forming fabric designs can effect energy consumption
Difference in this case more than 10 %

29 27/10/2011
Conclusions
Energy prices are expected to stay high in the future and energy
prices can be reflected on the price of wood, too
You need to increase understanding on where and when energy is
used to improve operations and know where to invest
There is still room to improve energy efficiency with best available
technology
For more radical changes, we need to develop new technologies
that are based on better understanding of the phenomena taking
place in papermaking

30 27/10/2011
VTT creates business from
technology