Embed Size (px)
Citation preview
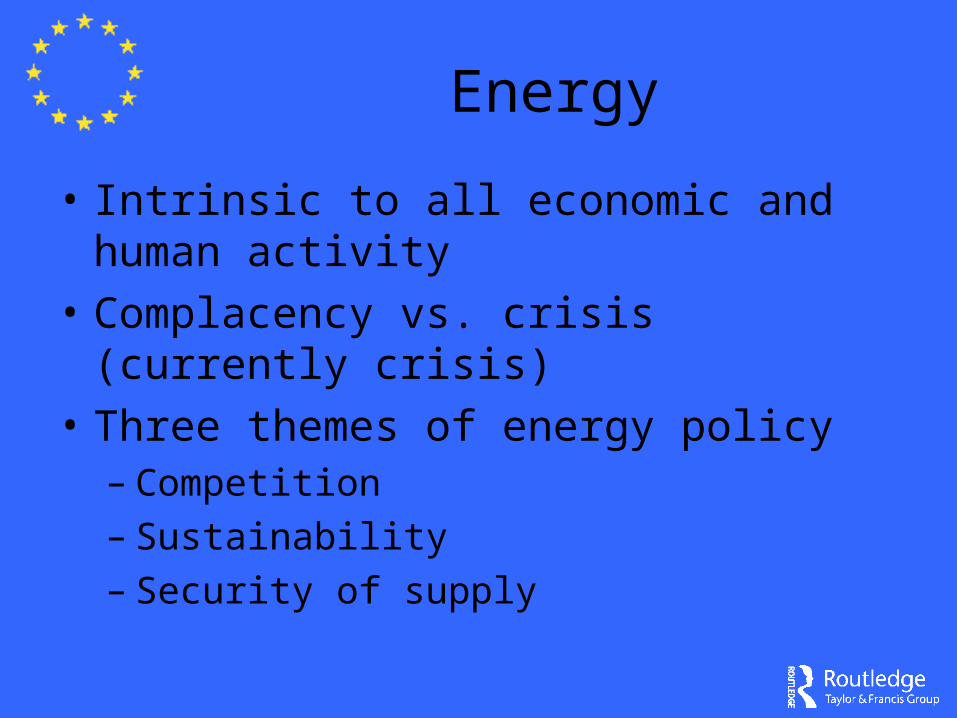
Energy
Energy
• Intrinsic to all economic and human activity
• Complacency vs. crisis (currently crisis)
• Three themes of energy policy– Competition– Sustainability – Security of supply
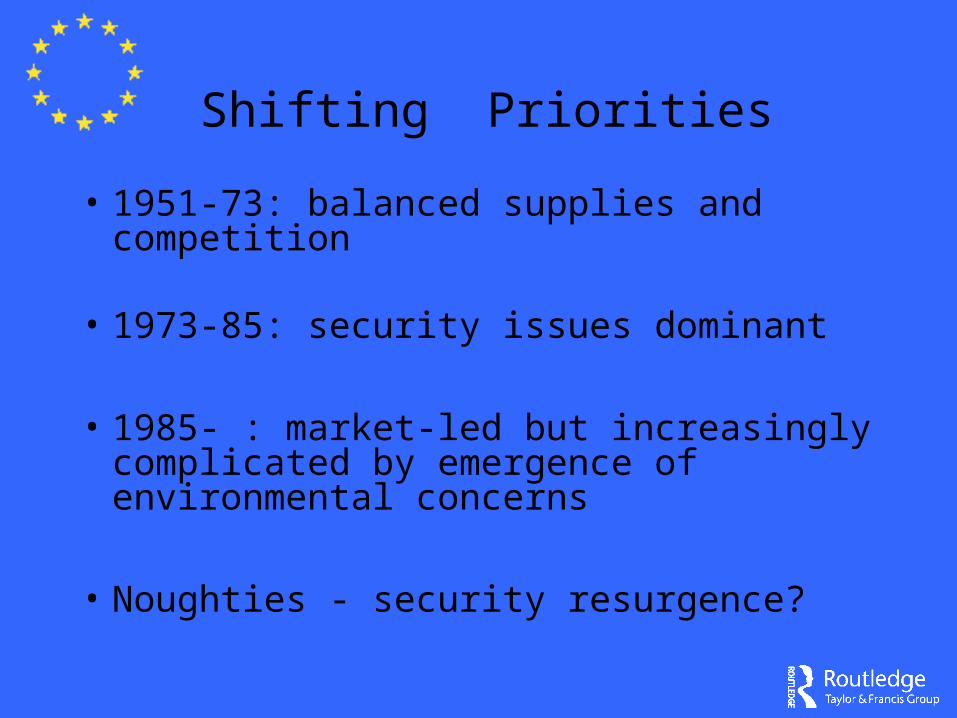
Shifting Priorities
• 1951-73: balanced supplies and competition
• 1973-85: security issues dominant
• 1985- : market-led but increasingly complicated by emergence of environmental concerns
• Noughties - security resurgence?
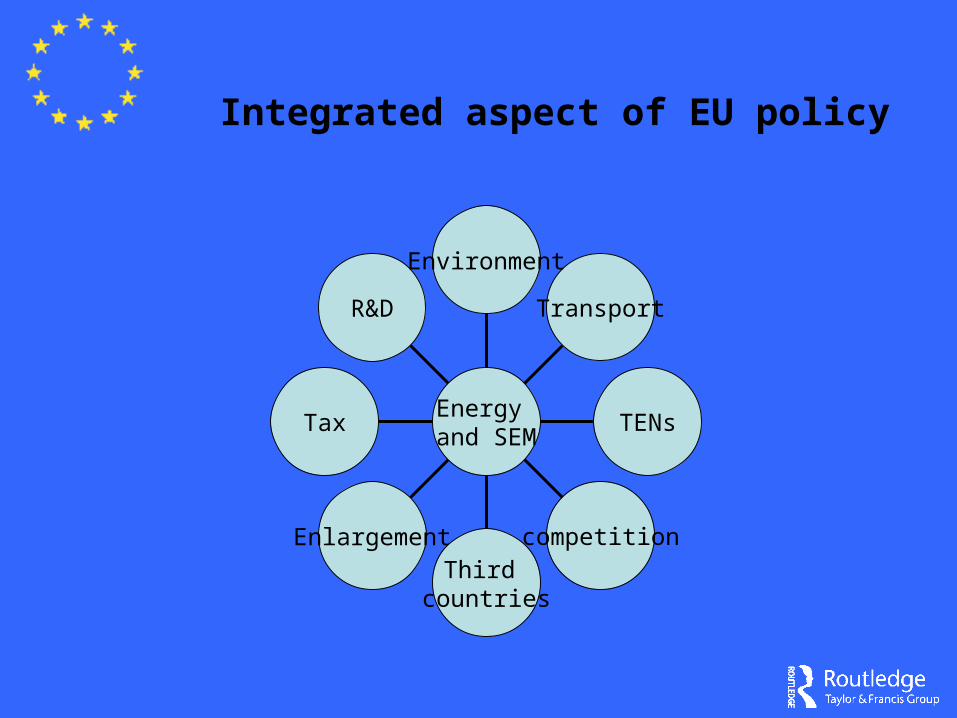
Integrated aspect of EU policy
R&D
Tax
EnlargementThird
countries
competition
TENs
Transport
Environment
Energy and SEM
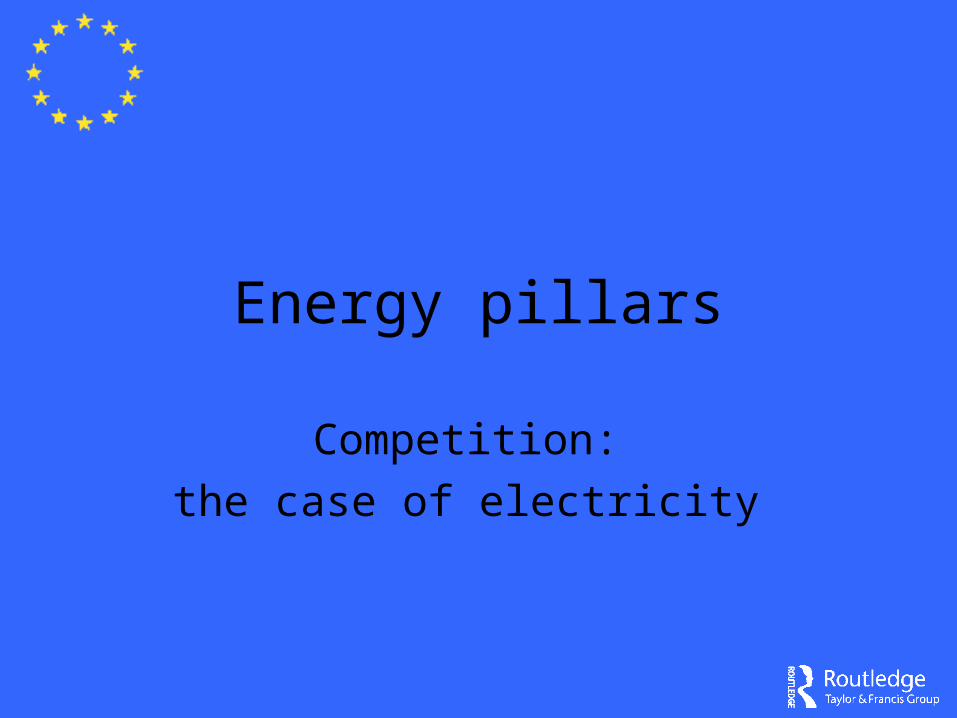
Energy pillars
Competition:
the case of electricity
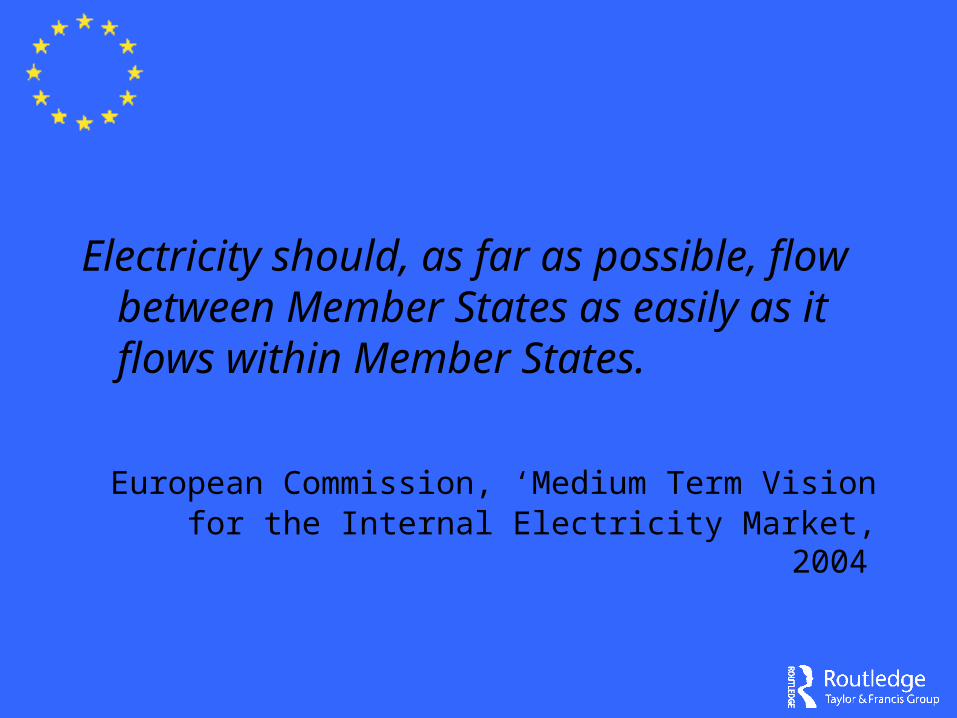
Electricity should, as far as possible, flow between Member States as easily as it flows within Member States.
European Commission, ‘Medium Term Vision for the Internal Electricity Market, 2004
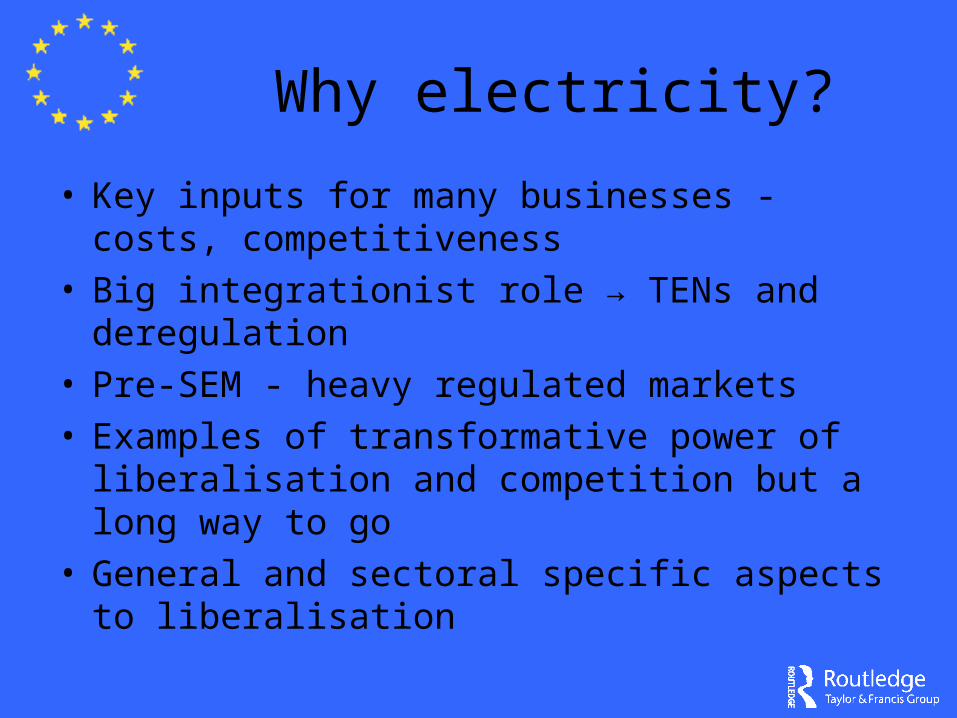
Why electricity?
• Key inputs for many businesses - costs, competitiveness
• Big integrationist role → TENs and deregulation • Pre-SEM - heavy regulated markets• Examples of transformative power of
liberalisation and competition but a long way to go
• General and sectoral specific aspects to liberalisation
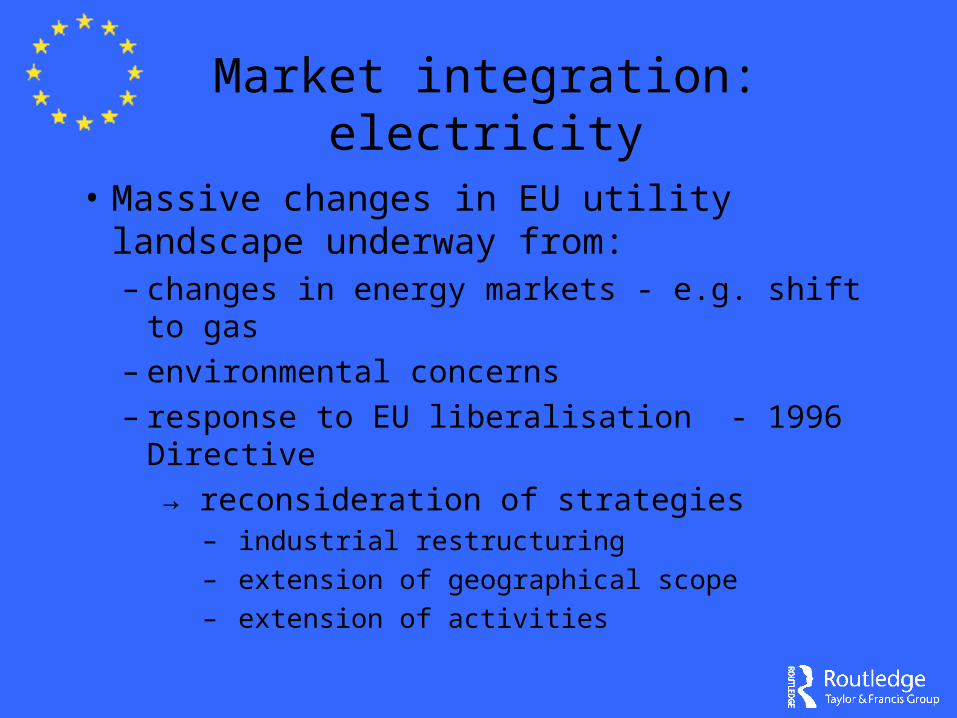
Market integration: electricity
• Massive changes in EU utility landscape underway from:– changes in energy markets - e.g. shift to gas– environmental concerns – response to EU liberalisation - 1996 Directive
→ reconsideration of strategies– industrial restructuring
– extension of geographical scope
– extension of activities
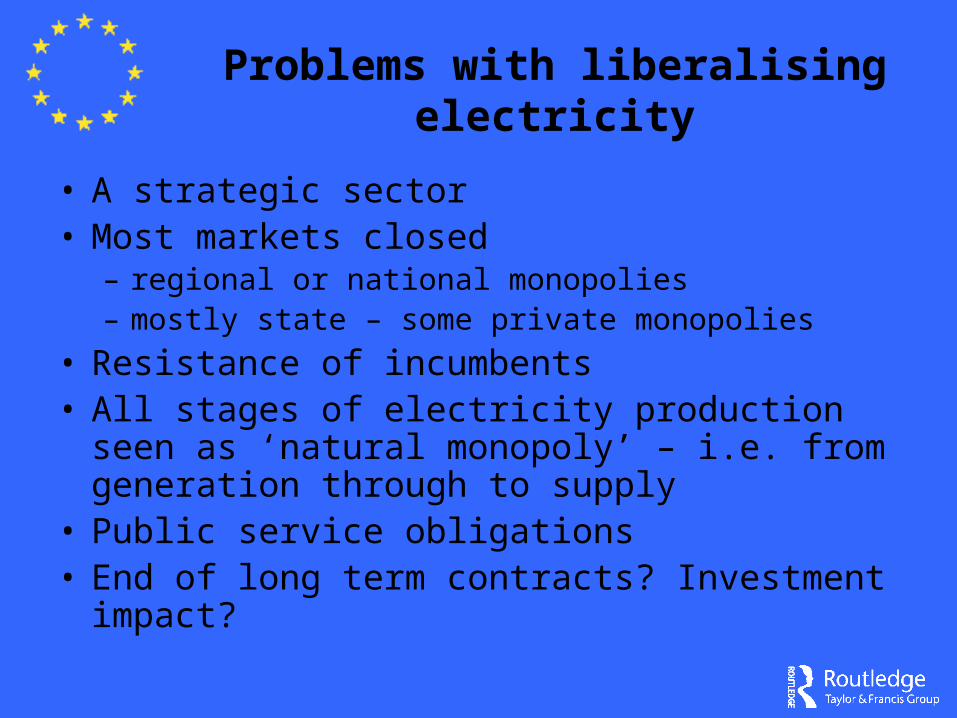
Problems with liberalising electricity
• A strategic sector• Most markets closed
– regional or national monopolies– mostly state – some private monopolies
• Resistance of incumbents• All stages of electricity production seen as
‘natural monopoly’ – i.e. from generation through to supply
• Public service obligations• End of long term contracts? Investment impact?
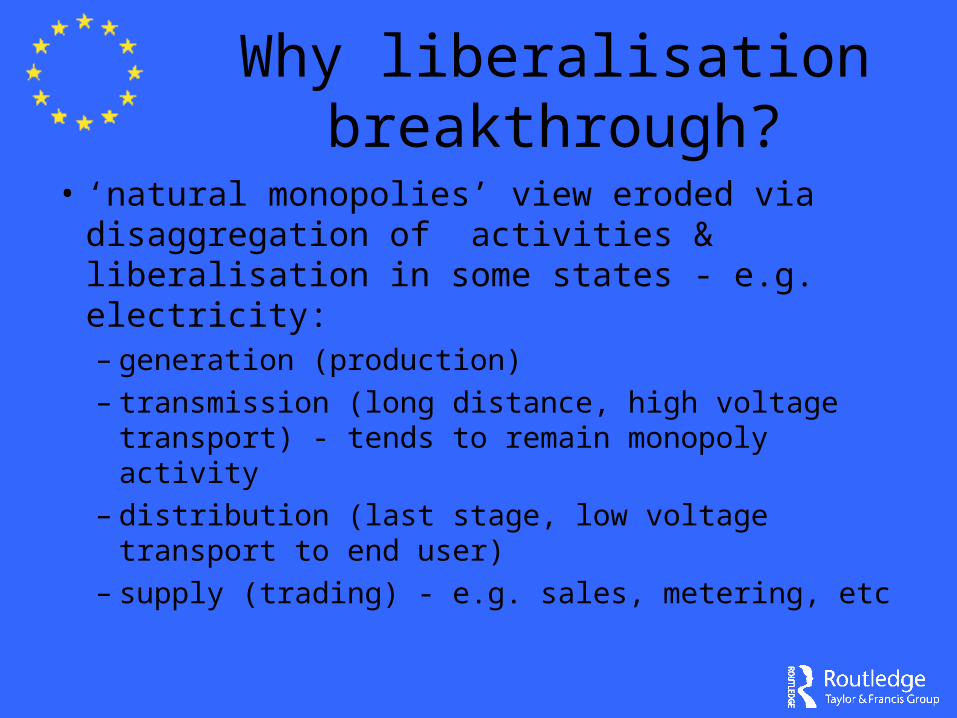
Why liberalisation breakthrough?
• ‘natural monopolies’ view eroded via disaggregation of activities & liberalisation in some states - e.g. electricity:– generation (production)– transmission (long distance, high voltage
transport) - tends to remain monopoly activity– distribution (last stage, low voltage transport
to end user)– supply (trading) - e.g. sales, metering, etc
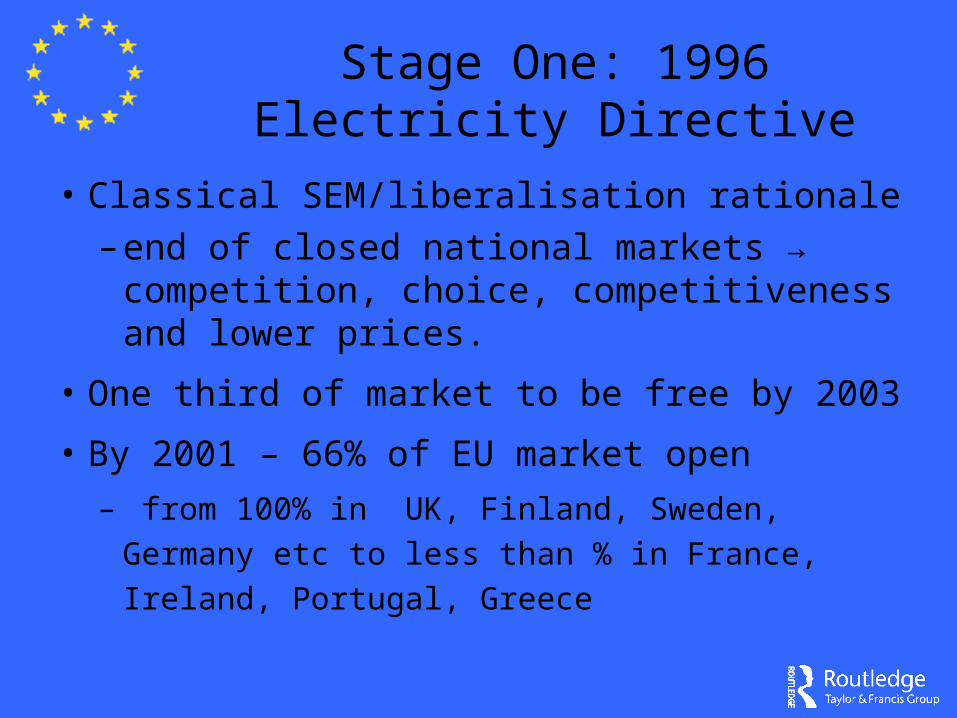
Stage One: 1996 Electricity Directive
• Classical SEM/liberalisation rationale
– end of closed national markets → competition, choice, competitiveness and lower prices.
• One third of market to be free by 2003
• By 2001 – 66% of EU market open
– from 100% in UK, Finland, Sweden, Germany etc
to less than % in France, Ireland, Portugal, Greece
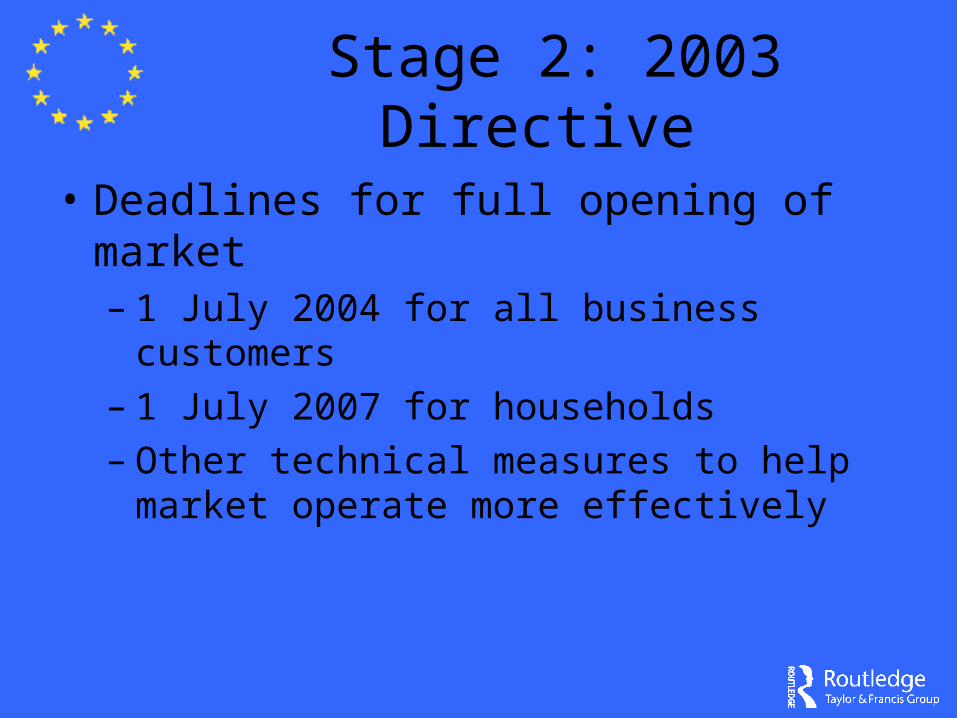
Stage 2: 2003 Directive
• Deadlines for full opening of market– 1 July 2004 for all business customers– 1 July 2007 for households– Other technical measures to help market
operate more effectively
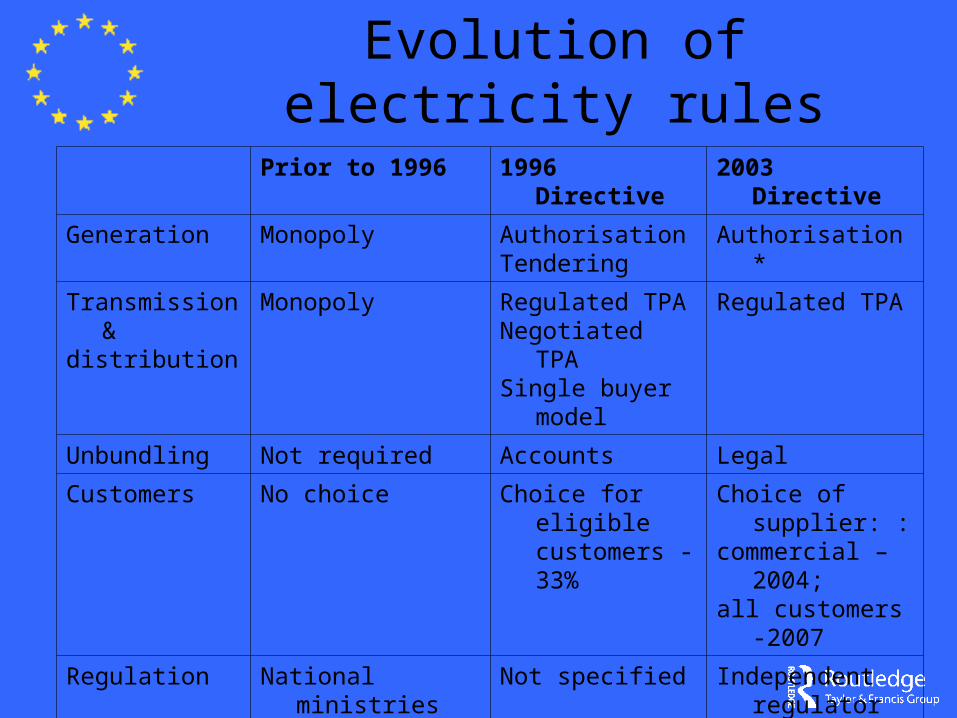
Prior to 1996 1996 Directive 2003 Directive
Generation Monopoly Authorisation Tendering
Authorisation*
Transmission &distribution
Monopoly Regulated TPANegotiated TPASingle buyer model
Regulated TPA
Unbundling Not required Accounts Legal
Customers No choice Choice for eligible customers -33%
Choice of supplier: :commercial – 2004;
all customers -2007
Regulation National ministries Not specified Independent regulator in each member state.
* Tendering still possible if insufficient capacity to ensure supply security or to promote new technology in the cause of environmental protection.
Evolution of electricity rules
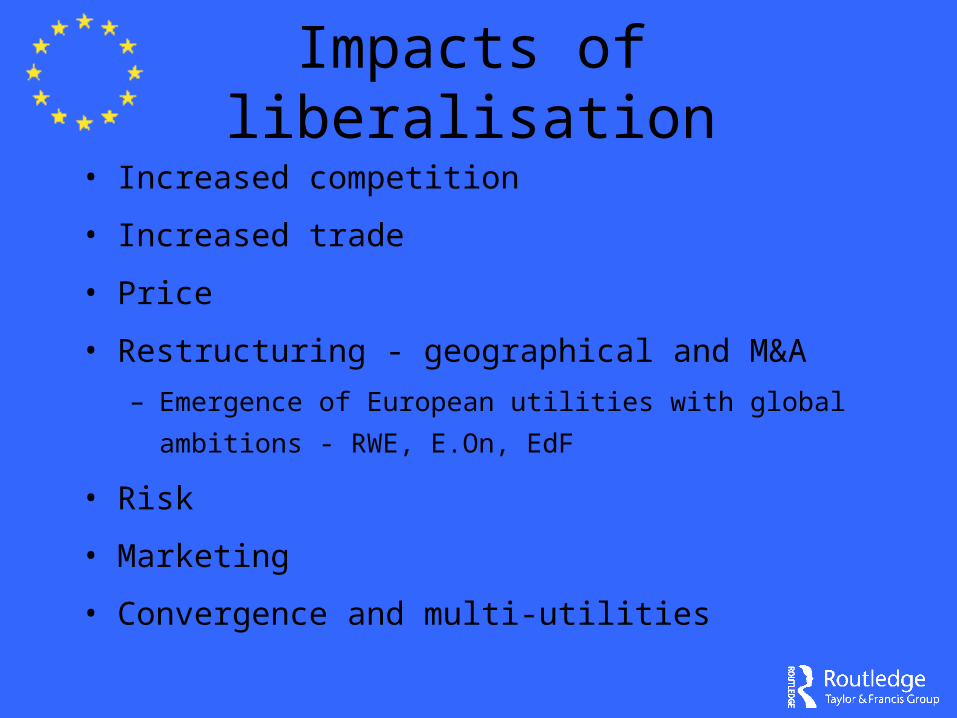
Impacts of liberalisation
• Increased competition
• Increased trade
• Price
• Restructuring - geographical and M&A
– Emergence of European utilities with global ambitions -
RWE, E.On, EdF
• Risk
• Marketing
• Convergence and multi-utilities
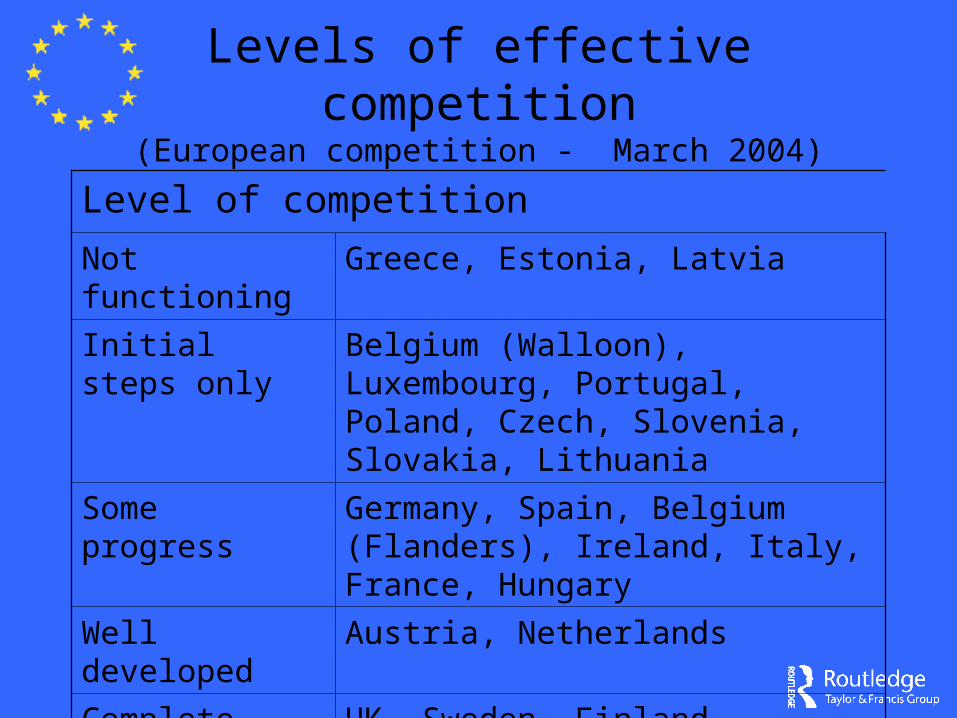
Levels of effective competition(European competition - March 2004)
Level of competition
Not functioning Greece, Estonia, Latvia
Initial steps only Belgium (Walloon), Luxembourg, Portugal, Poland, Czech, Slovenia, Slovakia, Lithuania
Some progress Germany, Spain, Belgium (Flanders), Ireland, Italy, France, Hungary
Well developed Austria, Netherlands
Complete UK, Sweden, Finland, Norway, Denmark
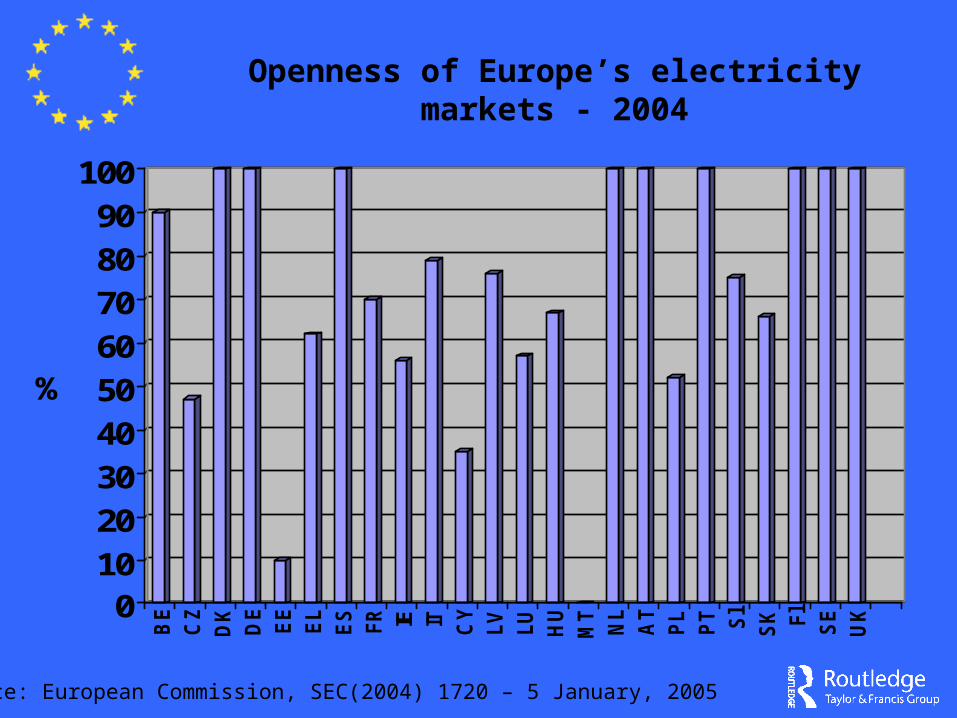
010
20
30
40
50
60
70
80
90
100
%
BE
CZ
DK
DE
EE
EL
ES
FR IE IT CY
LV
LU
HU
MT
NL
AT
PL
PT Sl
SK Fl
SE
UK
Source: European Commission, SEC(2004) 1720 – 5 January, 2005
Openness of Europe’s electricity markets - 2004
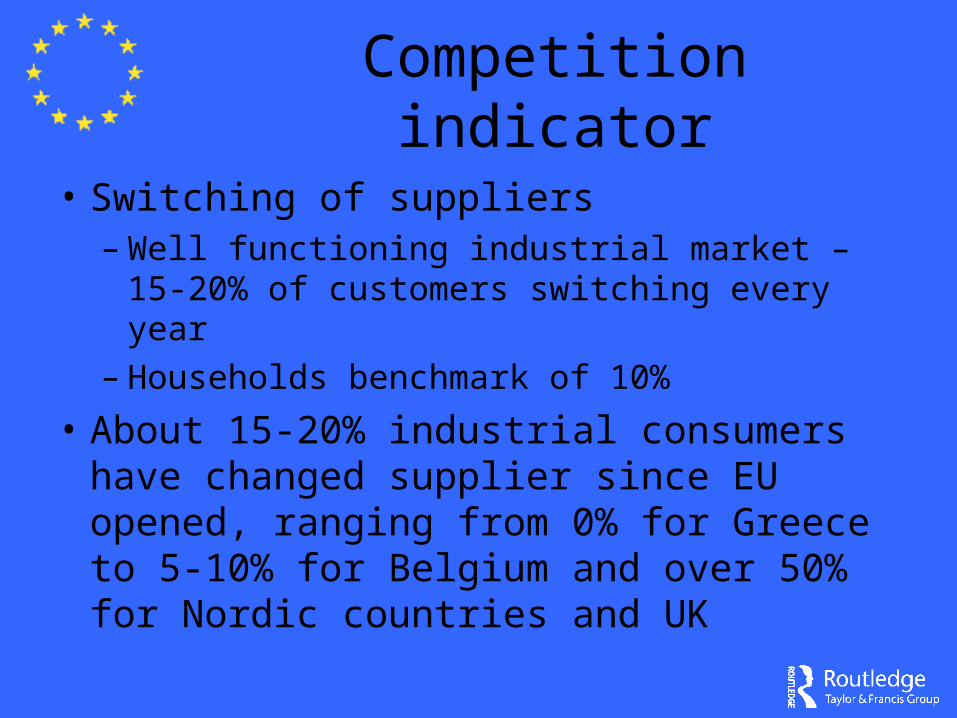
Competition indicator
• Switching of suppliers – Well functioning industrial market – 15-20% of
customers switching every year– Households benchmark of 10%
• About 15-20% industrial consumers have changed supplier since EU opened, ranging from 0% for Greece to 5-10% for Belgium and over 50% for Nordic countries and UK
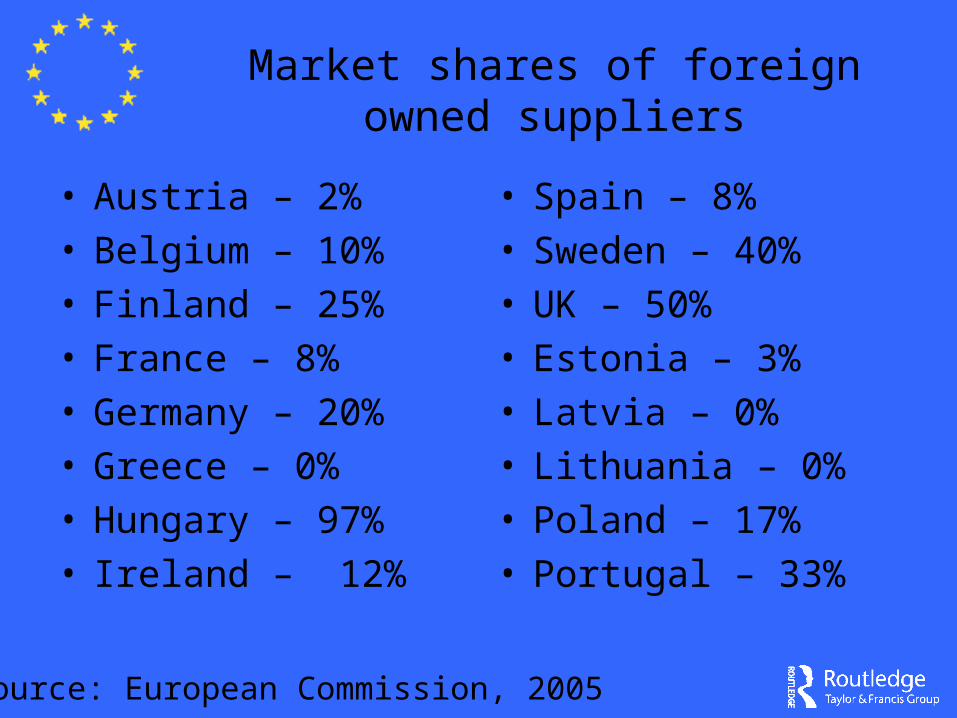
Market shares of foreign owned suppliers
• Austria – 2%• Belgium – 10% • Finland – 25%• France – 8%• Germany – 20% • Greece – 0%• Hungary – 97%• Ireland – 12%
• Spain – 8%• Sweden – 40%• UK – 50%• Estonia – 3%• Latvia – 0%• Lithuania – 0%• Poland – 17%• Portugal – 33%
Source: European Commission, 2005
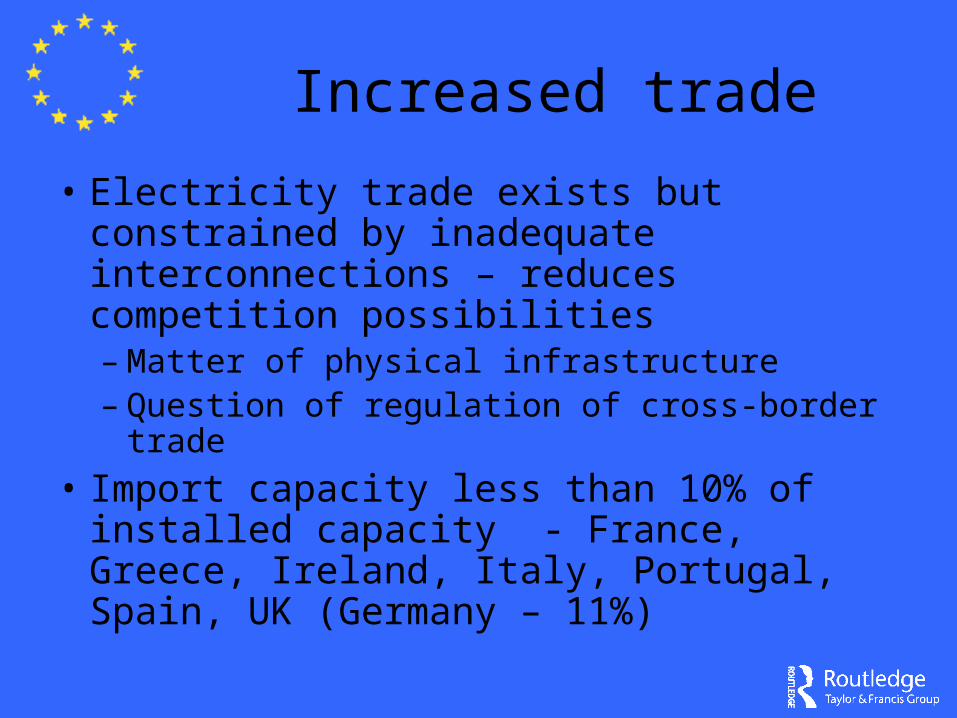
Increased trade
• Electricity trade exists but constrained by inadequate interconnections – reduces competition possibilities– Matter of physical infrastructure– Question of regulation of cross-border trade
• Import capacity less than 10% of installed capacity - France, Greece, Ireland, Italy, Portugal, Spain, UK (Germany – 11%)
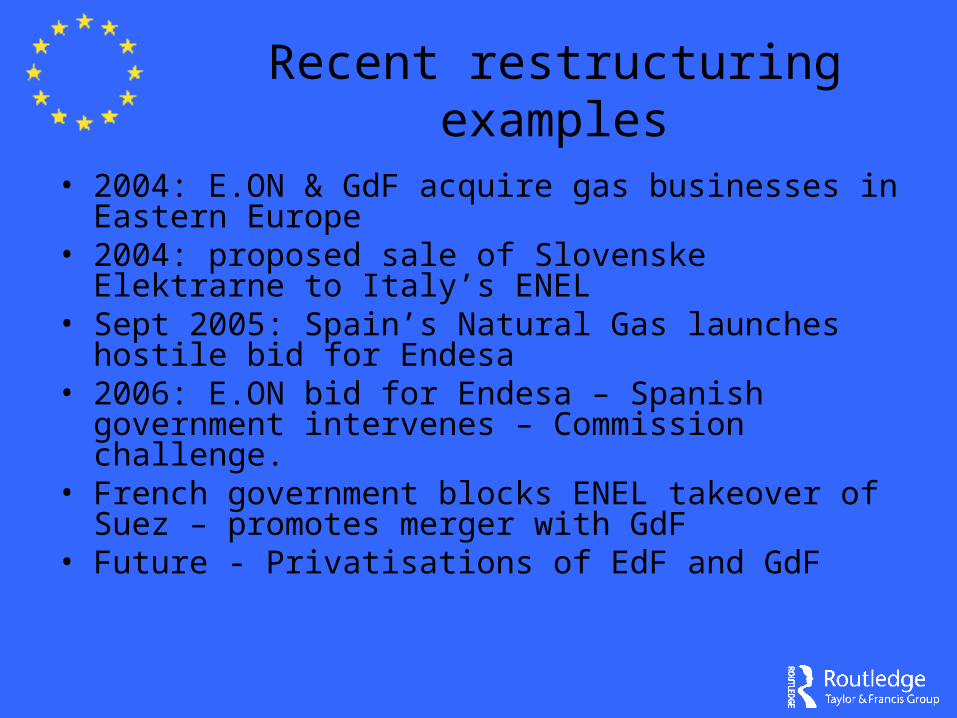
Recent restructuring examples
• 2004: E.ON & GdF acquire gas businesses in Eastern Europe
• 2004: proposed sale of Slovenske Elektrarne to Italy’s ENEL
• Sept 2005: Spain’s Natural Gas launches hostile bid for Endesa
• 2006: E.ON bid for Endesa – Spanish government intervenes – Commission challenge.
• French government blocks ENEL takeover of Suez – promotes merger with GdF
• Future - Privatisations of EdF and GdF
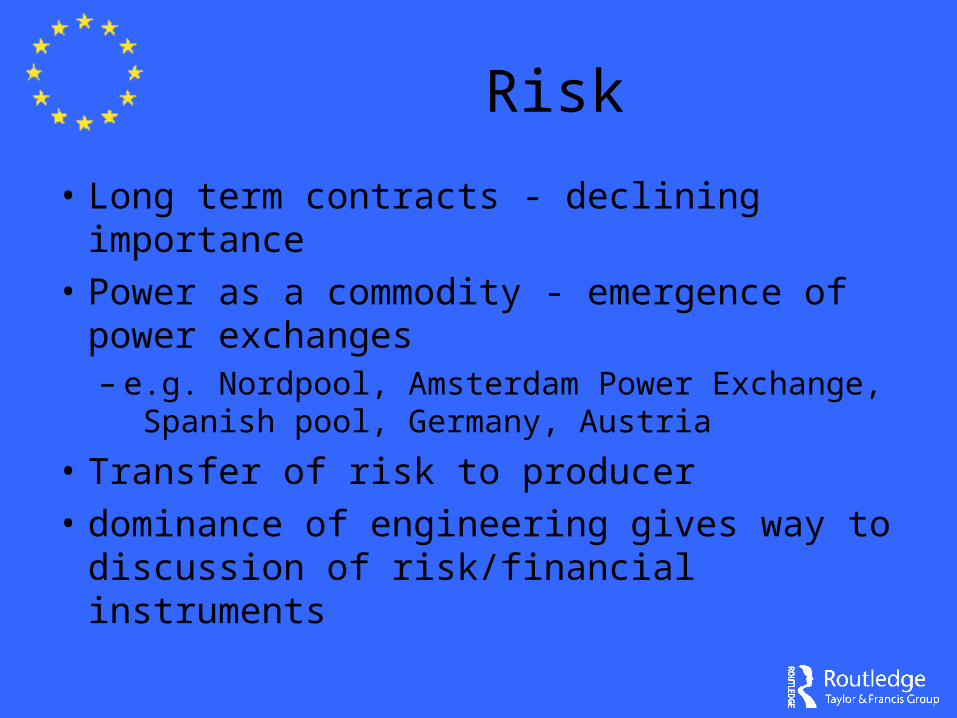
Risk
• Long term contracts - declining importance
• Power as a commodity - emergence of power exchanges– e.g. Nordpool, Amsterdam Power Exchange,
Spanish pool, Germany, Austria
• Transfer of risk to producer
• dominance of engineering gives way to discussion of risk/financial instruments
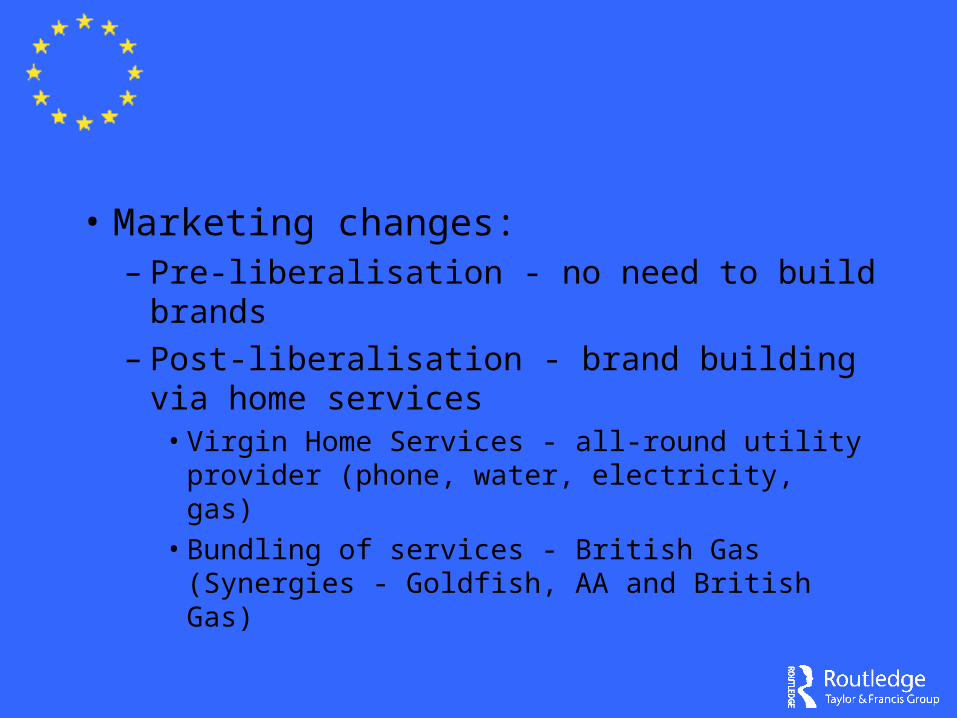
• Marketing changes:– Pre-liberalisation - no need to build brands– Post-liberalisation - brand building via
home services• Virgin Home Services - all-round utility provider
(phone, water, electricity, gas)• Bundling of services - British Gas (Synergies -
Goldfish, AA and British Gas)
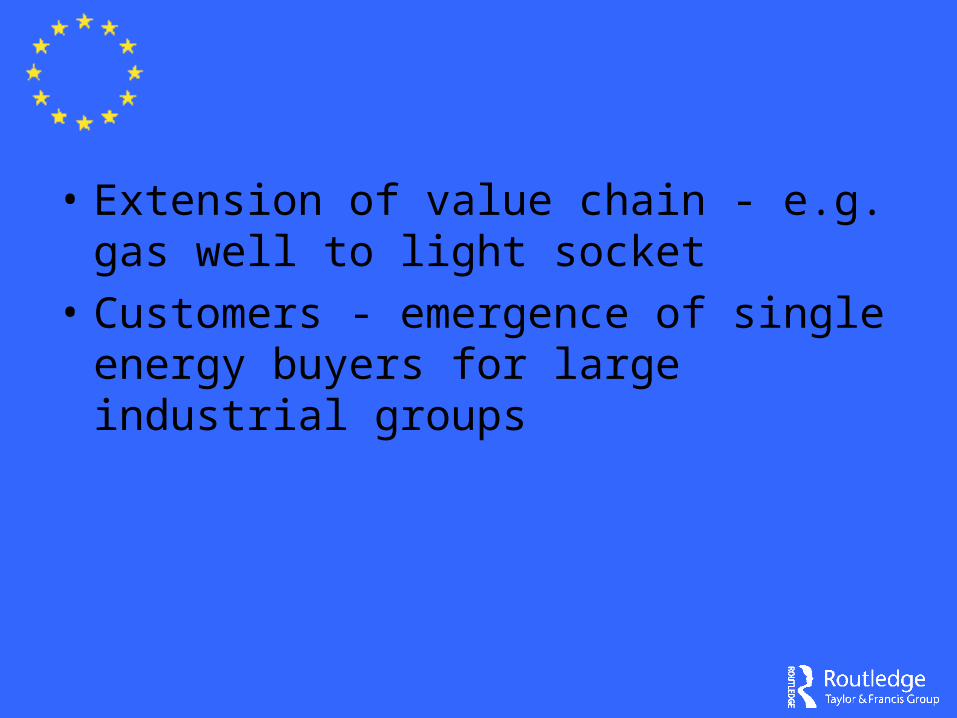
• Extension of value chain - e.g. gas well to light socket
• Customers - emergence of single energy buyers for large industrial groups
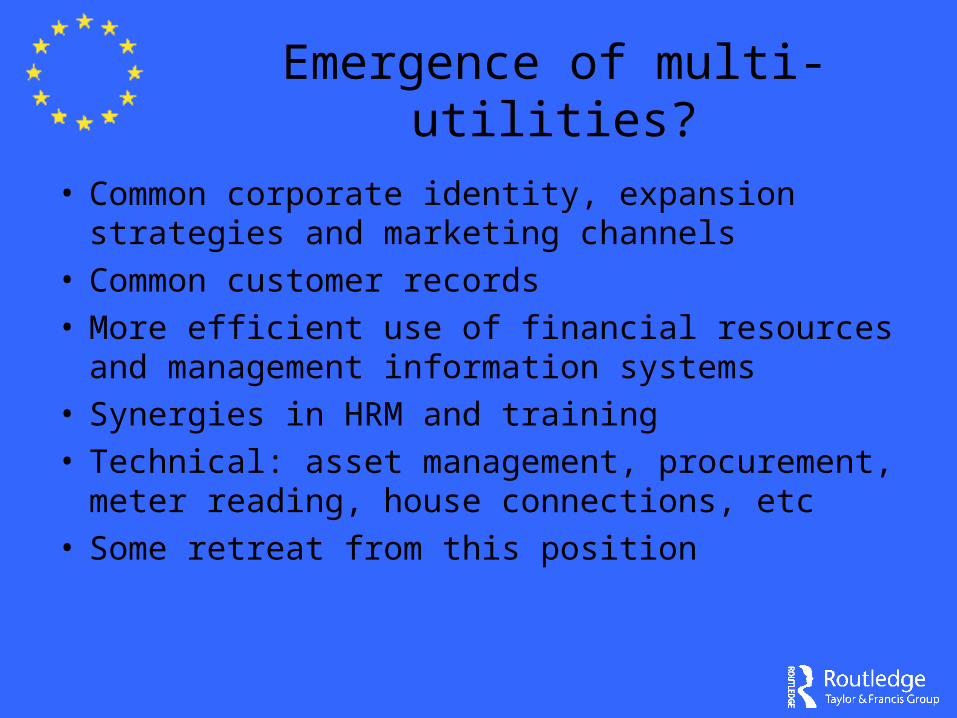
Emergence of multi-utilities?
• Common corporate identity, expansion strategies and marketing channels
• Common customer records• More efficient use of financial resources and
management information systems• Synergies in HRM and training• Technical: asset management, procurement,
meter reading, house connections, etc• Some retreat from this position
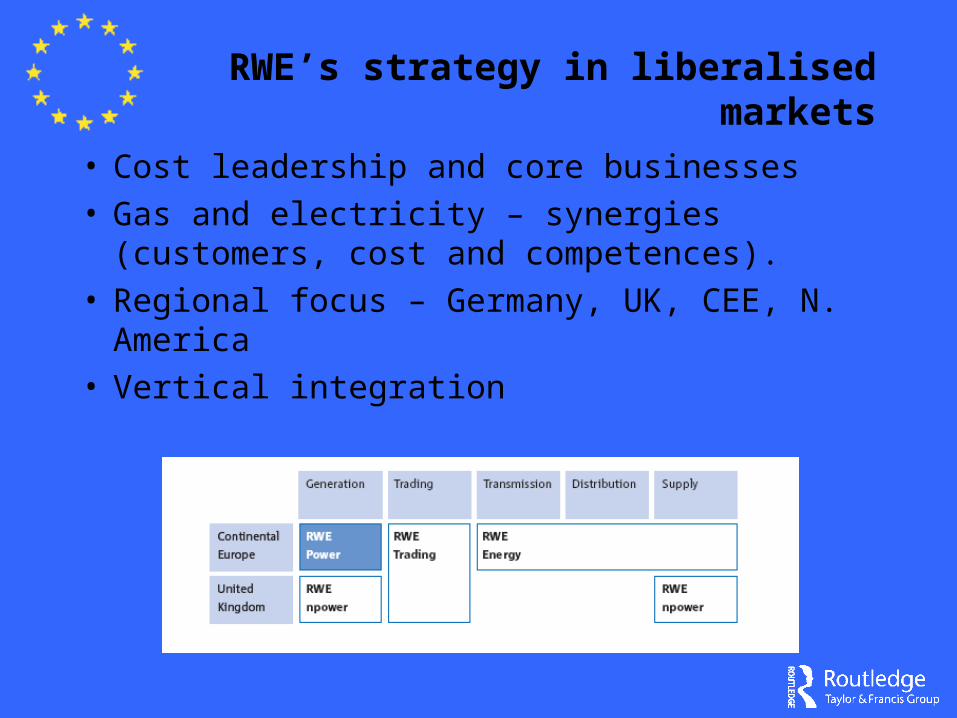
RWE’s strategy in liberalised markets
• Cost leadership and core businesses• Gas and electricity – synergies (customers, cost
and competences). • Regional focus – Germany, UK, CEE, N. America• Vertical integration
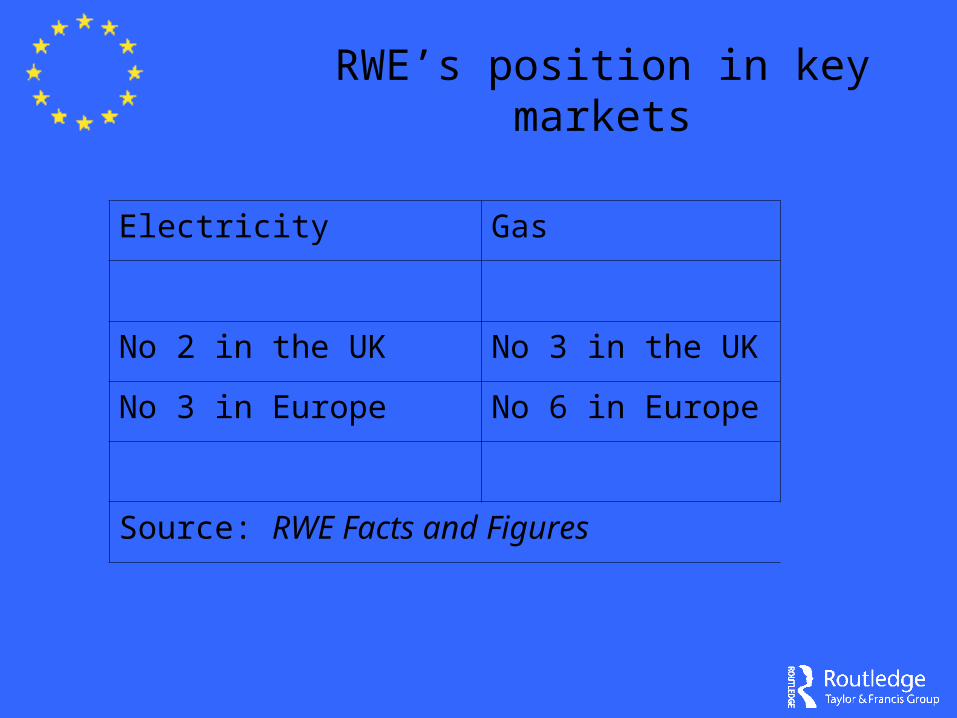
RWE’s position in key markets
Electricity Gas
No 2 in the UK No 3 in the UK
No 3 in Europe No 6 in Europe
Source: RWE Facts and Figures
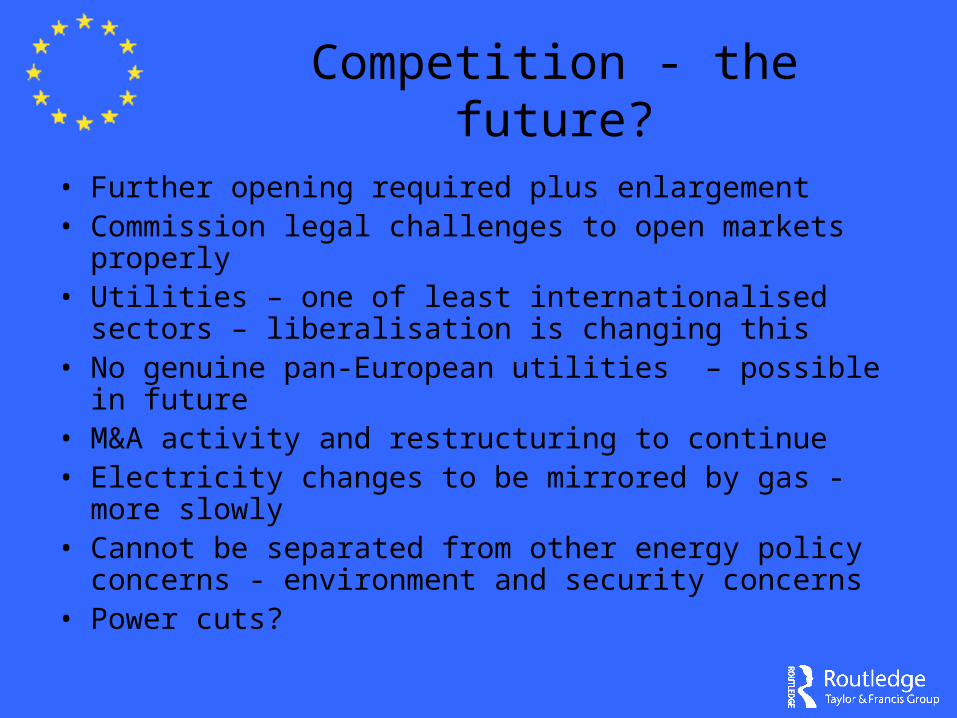
Competition - the future?
• Further opening required plus enlargement • Commission legal challenges to open markets properly• Utilities – one of least internationalised sectors –
liberalisation is changing this• No genuine pan-European utilities – possible in future• M&A activity and restructuring to continue• Electricity changes to be mirrored by gas - more slowly • Cannot be separated from other energy policy concerns
- environment and security concerns• Power cuts?
Environment
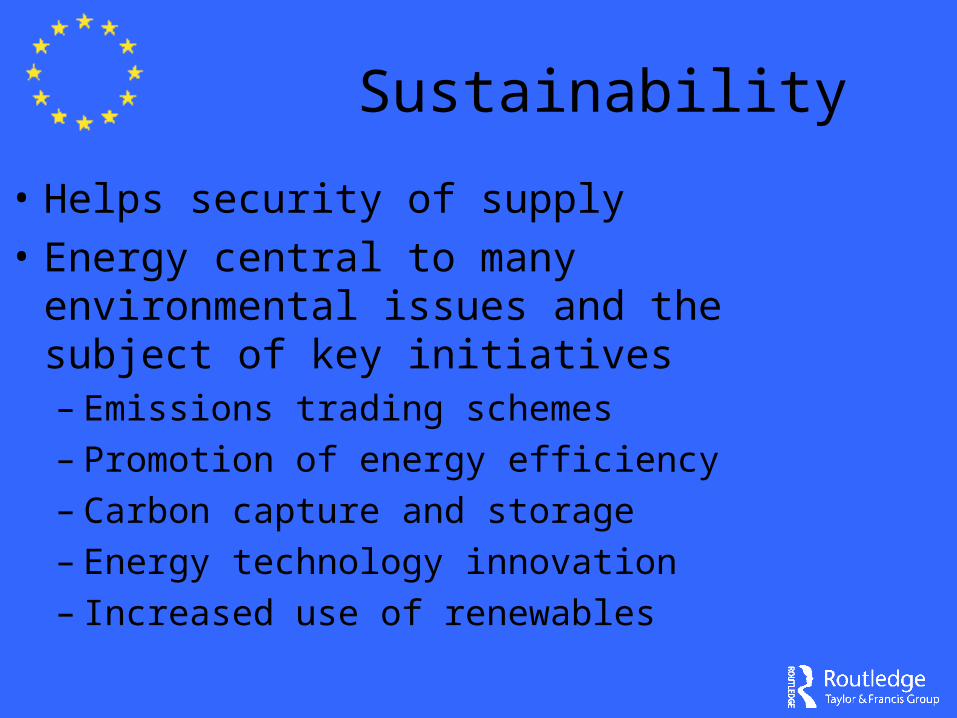
Sustainability
• Helps security of supply
• Energy central to many environmental issues and the subject of key initiatives– Emissions trading schemes– Promotion of energy efficiency– Carbon capture and storage– Energy technology innovation– Increased use of renewables
0 5 10 15 20 25 30 35
Austria
Belgium
Denmark
Finland
France
Germany
Greece
Ireland
Italy
Luxembourg
Netherlands
Portugal
Spain
Sweden
UK
EU-15
1990 1995 2000 2003
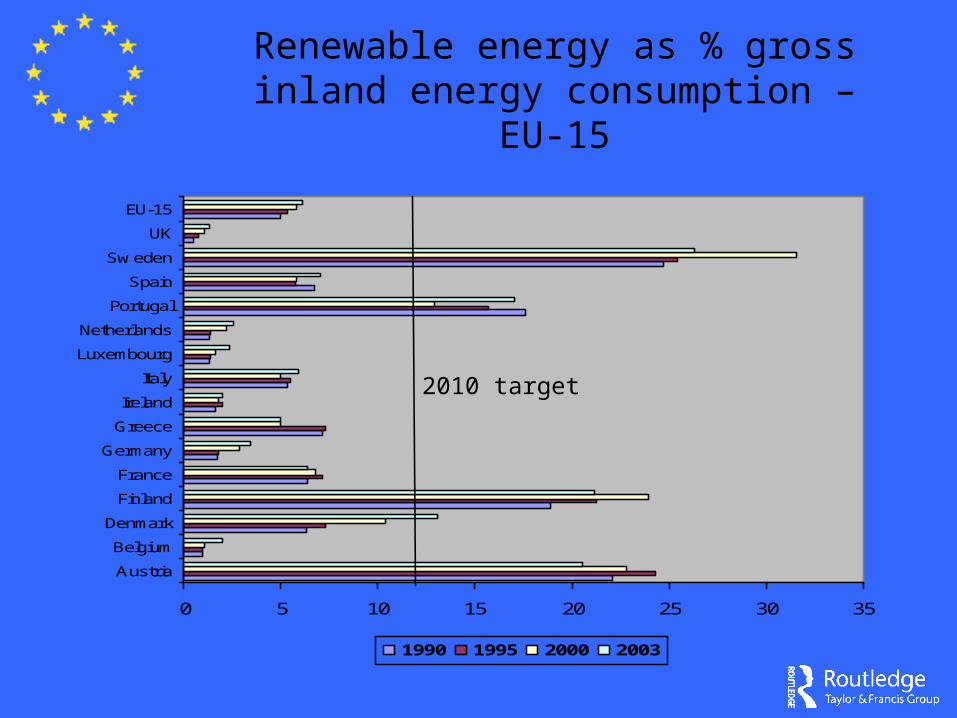
Renewable energy as % gross inland energy consumption – EU-15
2010 target
Security of supply
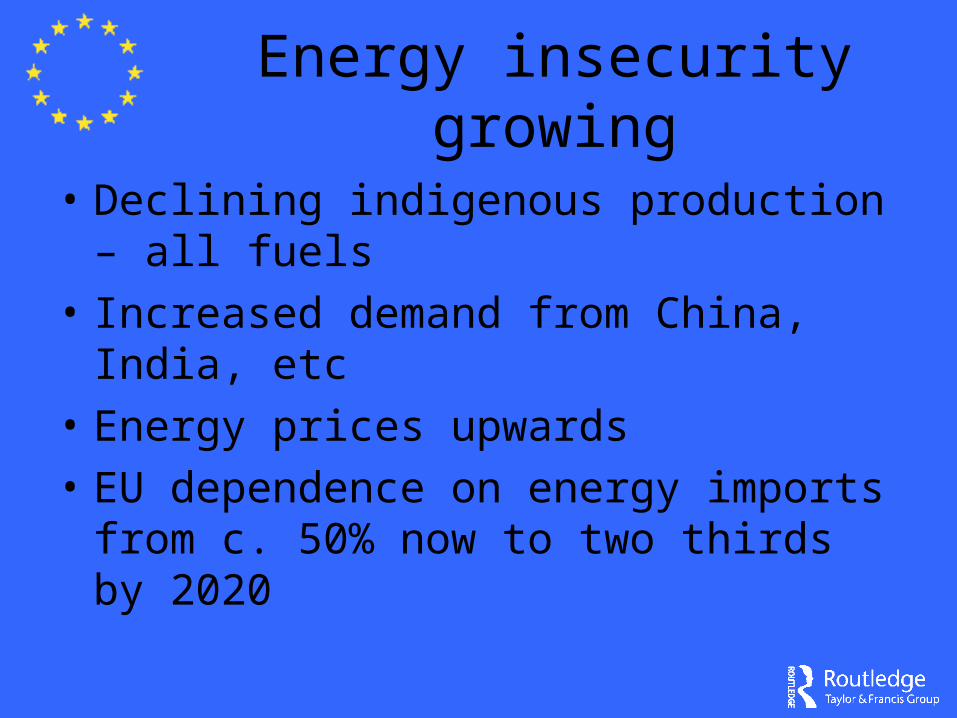
Energy insecurity growing
• Declining indigenous production – all fuels
• Increased demand from China, India, etc
• Energy prices upwards
• EU dependence on energy imports from c. 50% now to two thirds by 2020
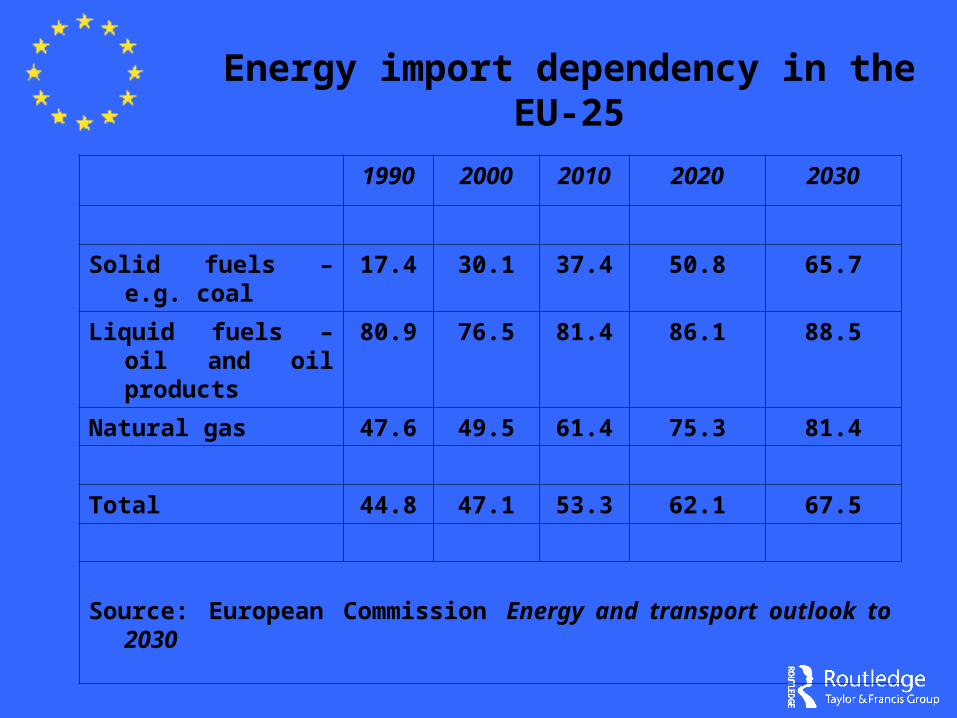
1990 2000 2010 2020 2030
Solid fuels – e.g. coal 17.4 30.1 37.4 50.8 65.7
Liquid fuels – oil and oil products
80.9 76.5 81.4 86.1 88.5
Natural gas 47.6 49.5 61.4 75.3 81.4
Total 44.8 47.1 53.3 62.1 67.5
Source: European Commission Energy and transport outlook to 2030
Energy import dependency in the EU-25
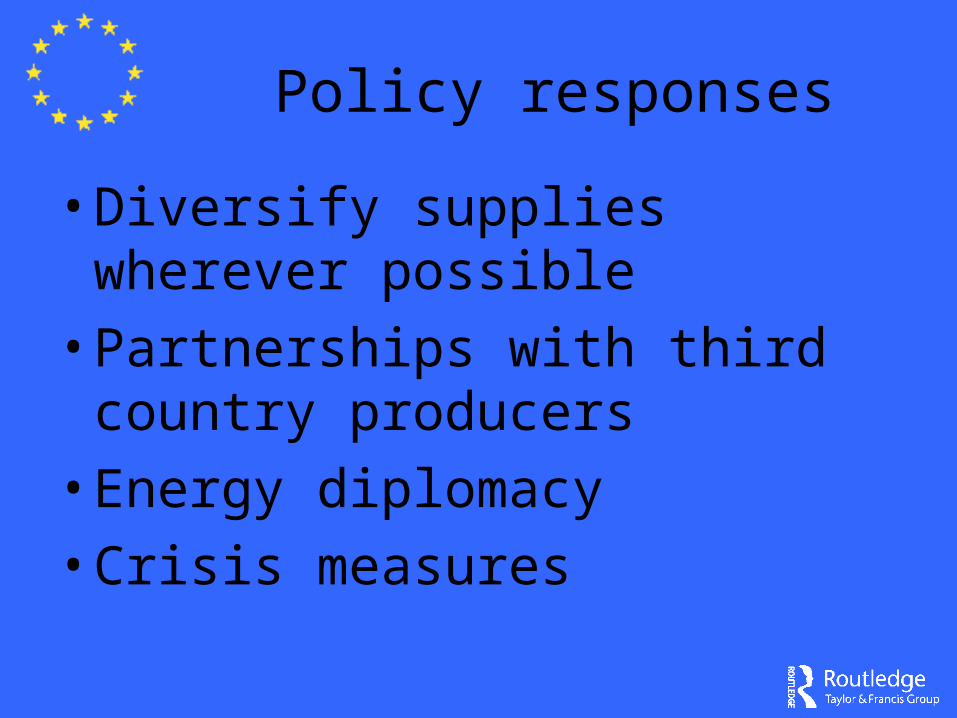
Policy responses
• Diversify supplies wherever possible
• Partnerships with third country producers
• Energy diplomacy
• Crisis measures