Embed Size (px)
Citation preview
Energy ForumGlobal Competitiveness in a Liberalised EU Energy Market
Study on Renewable Electricityin EU Member States
IFIEC Working Parties Climate & Efficiency and Electricity
Dr Annette LoskeBrussels, 22 November 2011
2
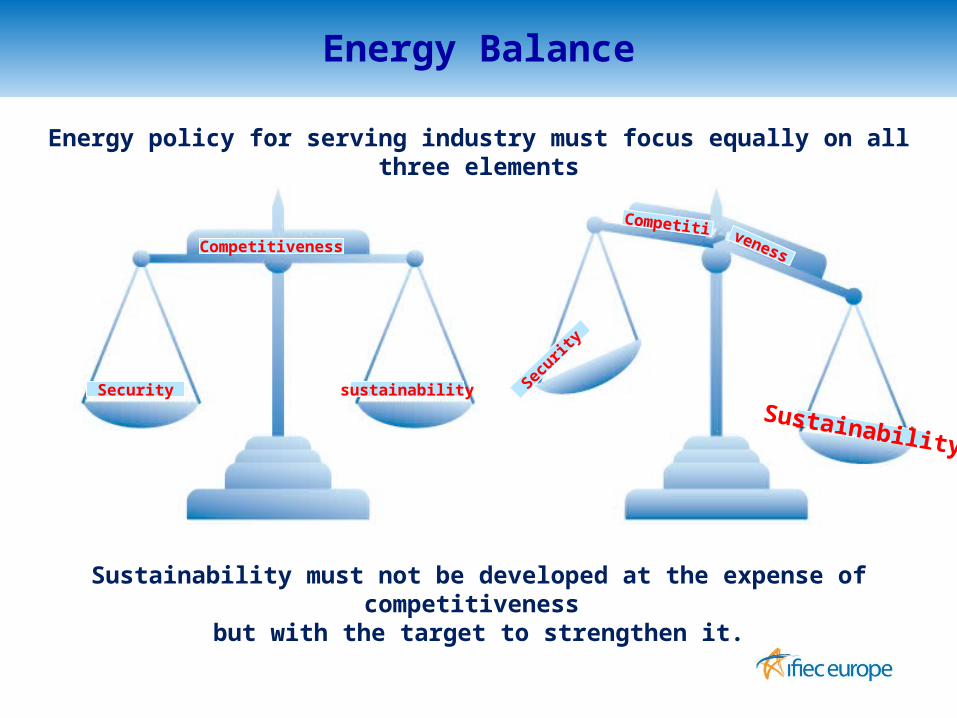
Energy Balance
Competitiveness
Security sustainability
Competiti
Securit
y
Sustainability
veness
Energy policy for serving industry must focus equally on all three elements
Sustainability must not be developed at the expense of competitiveness but with the target to strengthen it.
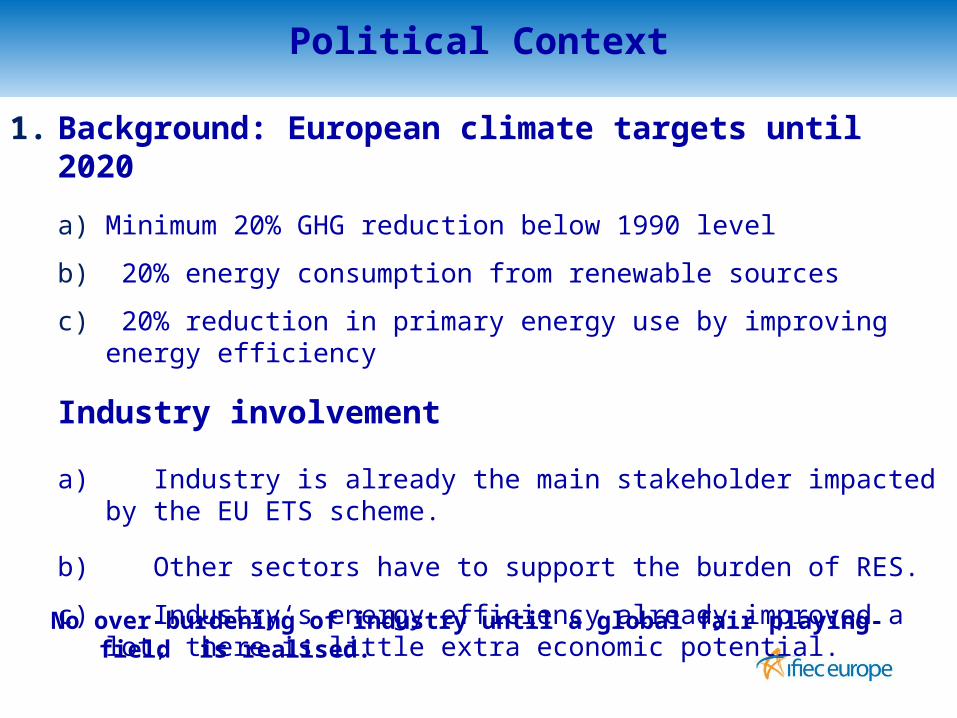
1. Background: European climate targets until 2020
a) Minimum 20% GHG reduction below 1990 level
b) 20% energy consumption from renewable sources
c) 20% reduction in primary energy use by improving energy efficiency
Industry involvement
a) Industry is already the main stakeholder impacted by the EU ETS scheme.
b) Other sectors have to support the burden of RES.
c) Industry‘s energy efficiency already improved a lot, there is little extra economic potential.
Political Context
3
No over-burdening of industry until a global fair playing-field is realised.
4
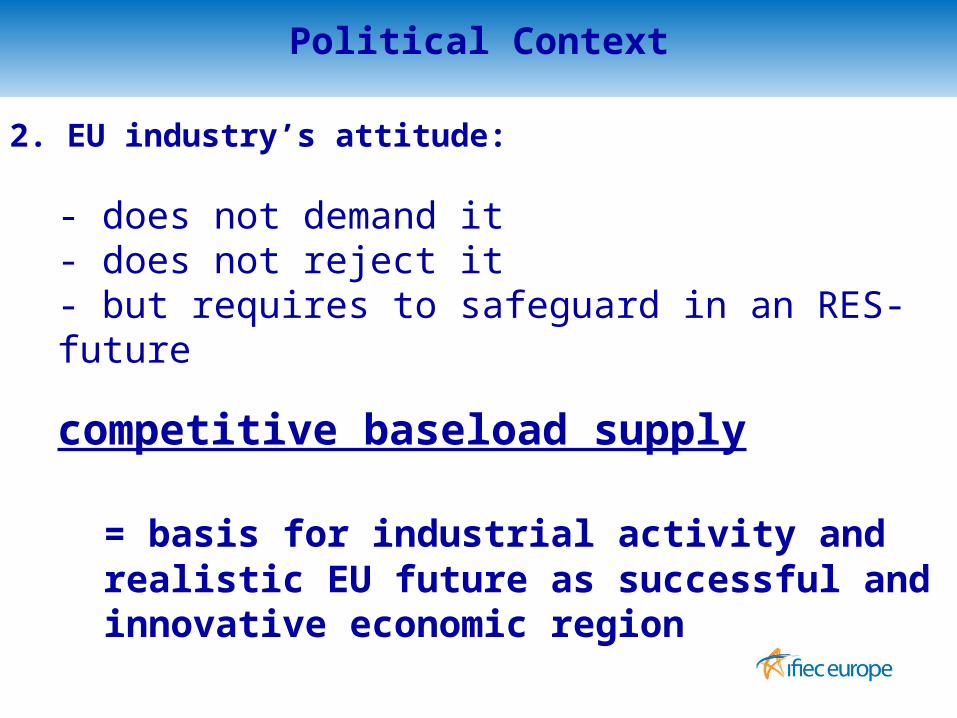
2. EU industry’s attitude:
- does not demand it- does not reject it- but requires to safeguard in an RES-future
competitive baseload supply
= basis for industrial activity and realistic EU future as successful and innovative economic region
Political Context
5
3. Renewable measures must be coordinated with energy efficiency measures: Uncoordinated political measures lead to suboptimal solutions.
- Energy efficiency can soften the challenge of 20% RES and GHG reduction (less consumption 20% rest
share decreased).
- Energy efficiency is industry’s strategy for growth and competitiveness over last few decades.
- Energy efficiency should be the focus.
- Industries past efforts must be kept in mind while focussing on energy efficiency in future.
- Industry already did its share of work.
Political Context

Belgium Czech Rep. Denmark France Germany Hungary Italy Netherlands Spain UK0
20
40
60
80
100
120
106.79
45.91
31.2136.83
74.85
39.07
103.00
73.3776.27
61.34
€/MWh
6
Average RES support levels in € / MWh
Financial Context
Source: CEER Report on Renewable Energy Support in Europe.
Belgium Bulgaria Czech Republic Denmark France Germany Italy UK0
5
10
15
20
25
30
35
40
2007 2008 2009 2010 2011 2012 2013 2014 2020
7
€/M
Wh
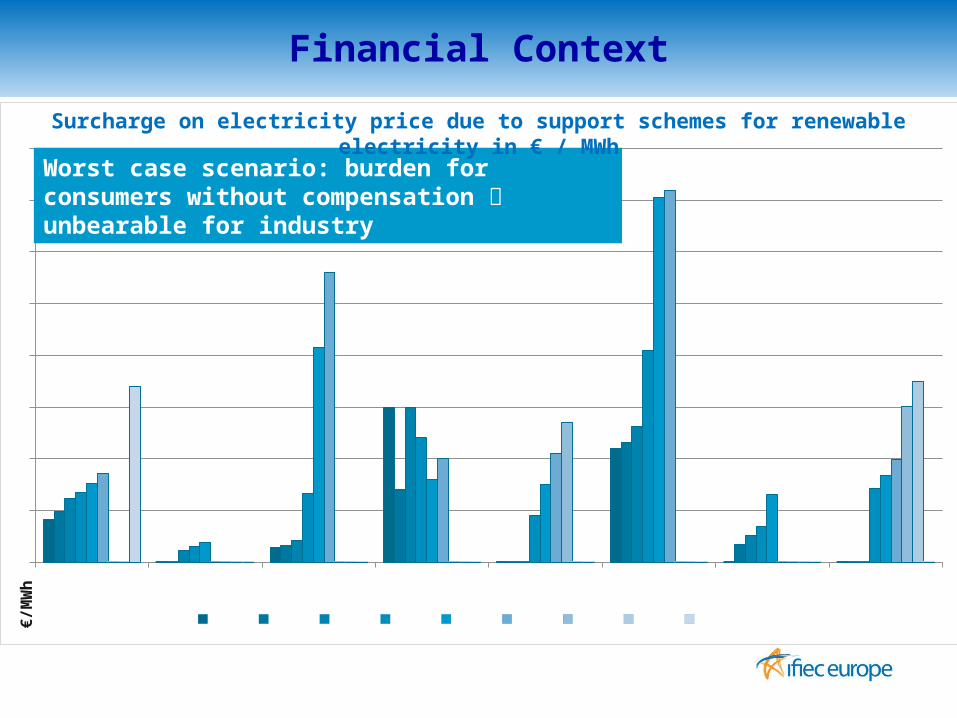
Worst case scenario: burden for consumers without compensation unbearable for industry
Surcharge on electricity price due to support schemes for renewable electricity in € / MWh
Financial Context

EU (27 countries)
Belgium Bulgaria Czech Rep. Denmark Finland France Germany Hungary Italy Netherlands Spain UK0
10
20
30
40
50
60
2005 (EUROSTAT) 2006 (EUROSTAT) 2007 (EUROSTAT) 2008 (EUROSTAT) 2010 (NREAP) 2020 (NREAP)
8
% of electricity in renewable production: Development until 2008 vs. targets until 2020
%
Source: EUROSTAT, NREAP
Red column targets mean: much more action is needed very quickly. Trend: Even higher support needed!
Financial Context
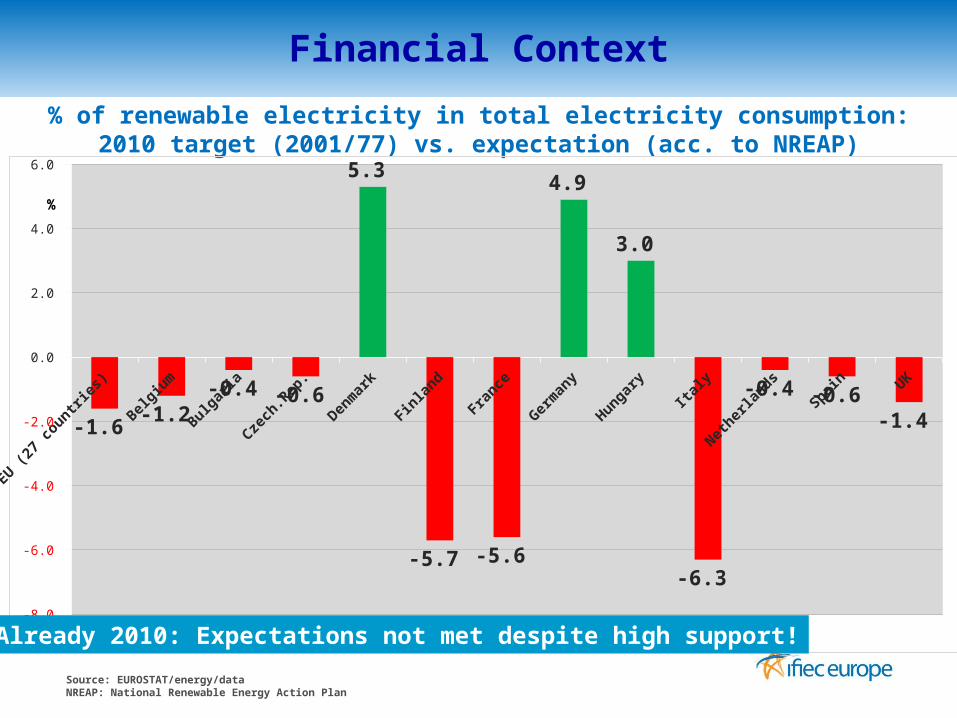
% of renewable electricity in total electricity consumption:2010 target (2001/77) vs. expectation (acc. to NREAP)
Source: EUROSTAT/energy/dataNREAP: National Renewable Energy Action Plan
EU (27
countri
es)
Belgiu
m
Bulgar
ia
Czech
.Rep
.
Denm
ark
Finla
nd
France
Ger
man
y
Hungary
Italy
Nether
lands
Spain
UK
-8.0
-6.0
-4.0
-2.0
0.0
2.0
4.0
6.0
-1.6 -1.2
-0.4 -0.6
5.3
-5.7 -5.6
4.9
3.0
-6.3
-0.4 -0.6 -1.4
%
Already 2010: Expectations not met despite high support!
Financial Context
*Based on 2009 new added capacity
0%
1%
2%
3%
4%
5%
6%
Total Europe Australia Brazil Canada China India USA Rest of theworld
193 GW
-19 yrs
360 GW
-234 yrs
32 GW
-25 yrs
199 GW
-14 yrs
30 GW
-31 yrs
17 GW
-64 yrs
2020
16%
*2.5GW
-6 Yrs 158
GW-
103 Yrs
47GW
-4.7 Yrs
9GW
-7 Yrs
60GW
-4.5 Yrs
10GW
-10.5 Yrs
10GW
-38 Yrs
10 GW
-25 yrs
Level to achieve for a fair level playing field
**
Wind Target EU27
0%
1%
2%
3%
4%
5%
6%
Total Europe Australia Brazil Canada China India USA Rest of theworld
193 GW
-19 yrs
360 GW
-234 yrs
32 GW
-25 yrs
199 GW
-14 yrs
30 GW
-31 yrs
17 GW
-64 yrs
2020
16%
*2.5GW
-6 Yrs 158
GW-
103 Yrs
47GW
-4.7 Yrs
9GW
-7 Yrs
60GW
-4.5 Yrs
10GW
-10.5 Yrs
10GW
-38 Yrs
10 GW
-25 yrs
Level to achieve for a fair level playing field
**193 GW
-19 yrs
360 GW
-234 yrs
32 GW
-25 yrs
199 GW
-14 yrs
30 GW
-31 yrs
17 GW
-64 yrs
2020
16%
*2.5GW
-6 Yrs 158
GW-
103 Yrs
47GW
-4.7 Yrs
9GW
-7 Yrs
60GW
-4.5 Yrs
10GW
-10.5 Yrs
10GW
-38 Yrs
10 GW
-25 yrs
Level to achieve for a fair level playing field
**
Wind Target EU27
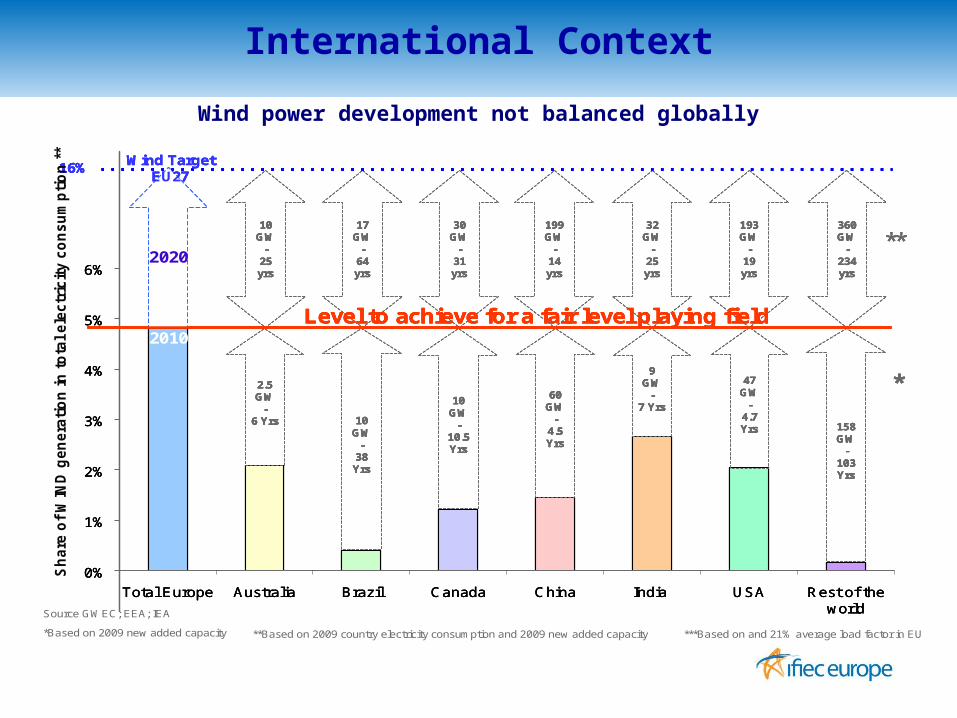
**Based on 2009 country electricity consumption and 2009 new added capacity
Source GWEC; EEA; IEA
Sh
are
of
WIN
D g
en
era
tio
n i
n t
ota
l e
lec
tric
ity c
on
su
mp
tio
n *
**
2010
***Based on and 21% average load factor in EU
International Context
Wind power development not balanced globally
11
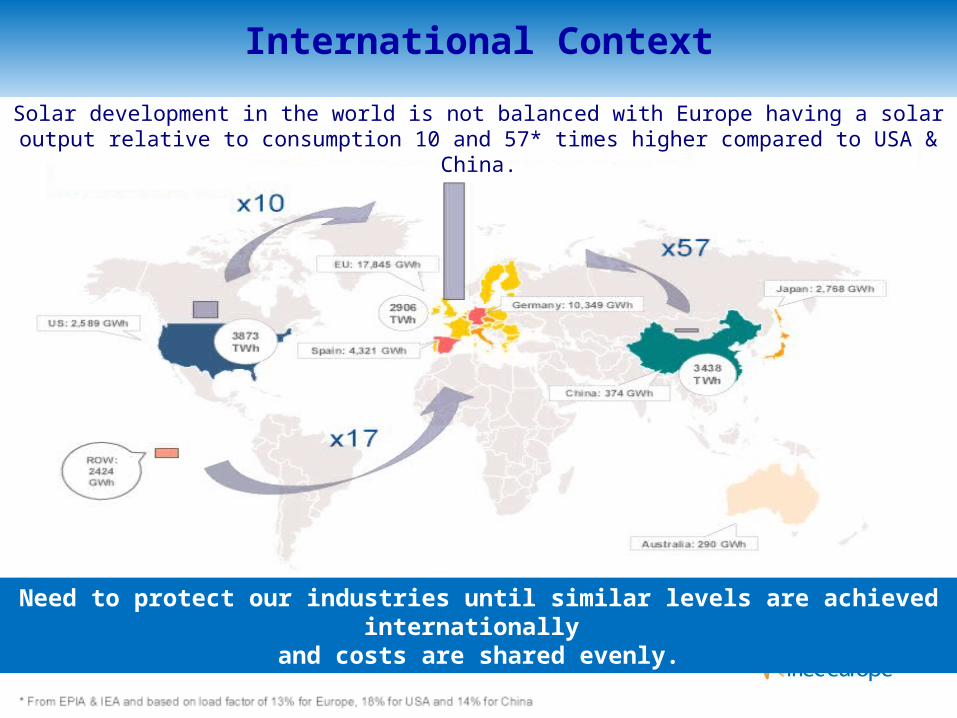
Need to protect our industries until similar levels are achieved internationally and costs are shared evenly.
International Context
Solar development in the world is not balanced with Europe having a solar output relative to consumption 10 and 57* times higher compared to USA & China.
Why is a support scheme necessary? - RES is not competitive with conventional generation. - Therefore support unavoidable, but must be
proportionate (budgeted). - Bridge the gap between RES and non-RES.
Why in favour of one EU-wide system? - To avoid competitiveness distortions for industry within Europe.- To optimize geographical benefits in order to achieve most cost-efficient mix.- To achieve EU target while safeguarding global competitiveness.- To be as much as possible compatible with the target of an internal market.
EU Support Scheme: IFIEC View

Source: CEER; Ref. C11-SDE-25-04. Adapted from EU COM Report „Renewable Energy“, Jan. 2011.
EU MS‘s Support Schemes Diversity of approaches as an obstacle to come to the most efficient solutions

EU Support Scheme: IFIEC Principles
Several principles should apply to this support system: Technology-specific support
– To reflect the highly differing costs of the different types of RES technologies– Rejection of a one price-system for all technologies (prevent windfall profits)
Based upon electricity market price– Difference between technology-specific guaranteed tariff and average electricity price paid
directly to producer of green electricity
Decreasing support for new projects over time – Support only for non-depreciated installations– To reflect technological progress – To avoid over/compensation
Extra incentives for superior CO2 abatement technologies– For more mature technologies based on CO2 saving/euro support– For competition between technologies in order to achieve competitiveness– To realize least abatement costs
Specific grid connection cost financed through support scheme
Guarantee of origin system used for tracking and trading
IFIEC Conclusions
Overall climate policy should be optimised in cost efficiency– E.g. optimization between renewables & energy efficiency
measures
Budgeted support R&D first: Immature technologies should be
supported by R&D and reach an acceptable level of cost before massive roll-out and exploitation support
Support scheme financing also through state budget in order to attain more consciousness on cost impact of support policies
Transparency of any direct and indirect costs Cost for grid extensions and balancing must be borne
by producers
IFIEC accepts and contributes significantly to the political 20-20-20 decision but emphasizes the need for a smart roll-out that safeguards international competition of energy intensive industry.
IFIEC does not oppose RES development policy because it’s supposed to lead to improved competitiveness in the long run.
But RES does not correspond to our needs(secure and competitive power supply) and their development cost are far too high to be shared by industry. Overall costs need to be lowered via a harmonized and cost-efficient EU wide support system under a strict budget policy including special treatment for industrial consumers.
IFIEC Position