Embed Size (px)
Citation preview
Sustainability and social impact
Energy for Smart Cities Conference
Mario Abis
Estoril, November 30th, 2012
VALORI
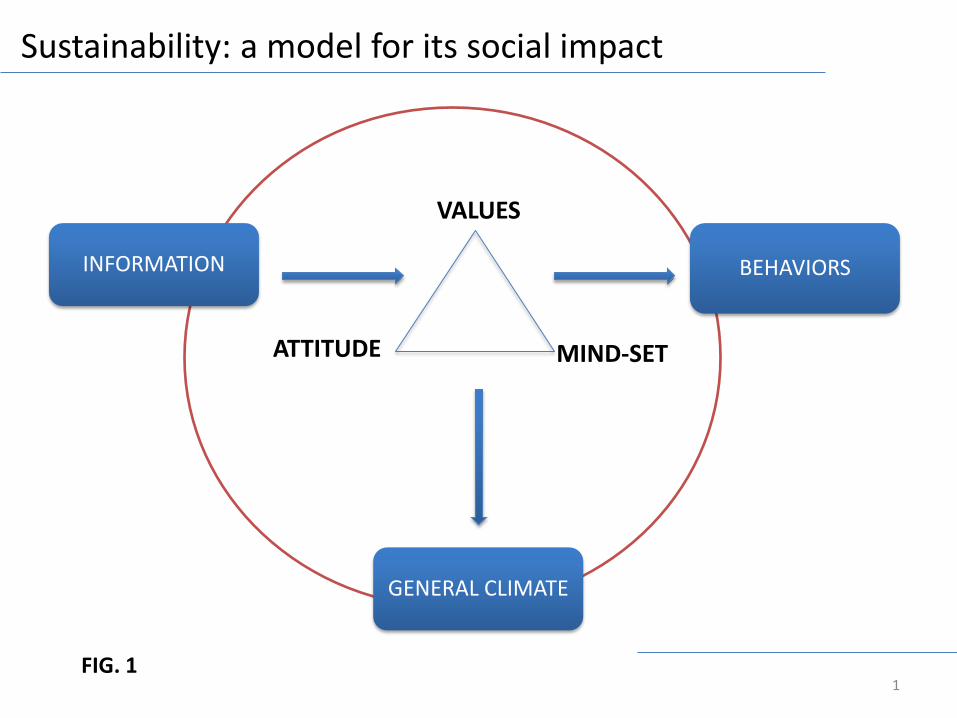
Sustainability: a model for its social impact
1
ATTITUDE MIND-SET
FIG. 1
VALUES
BEHAVIORS
GENERAL CLIMATE
INFORMATION
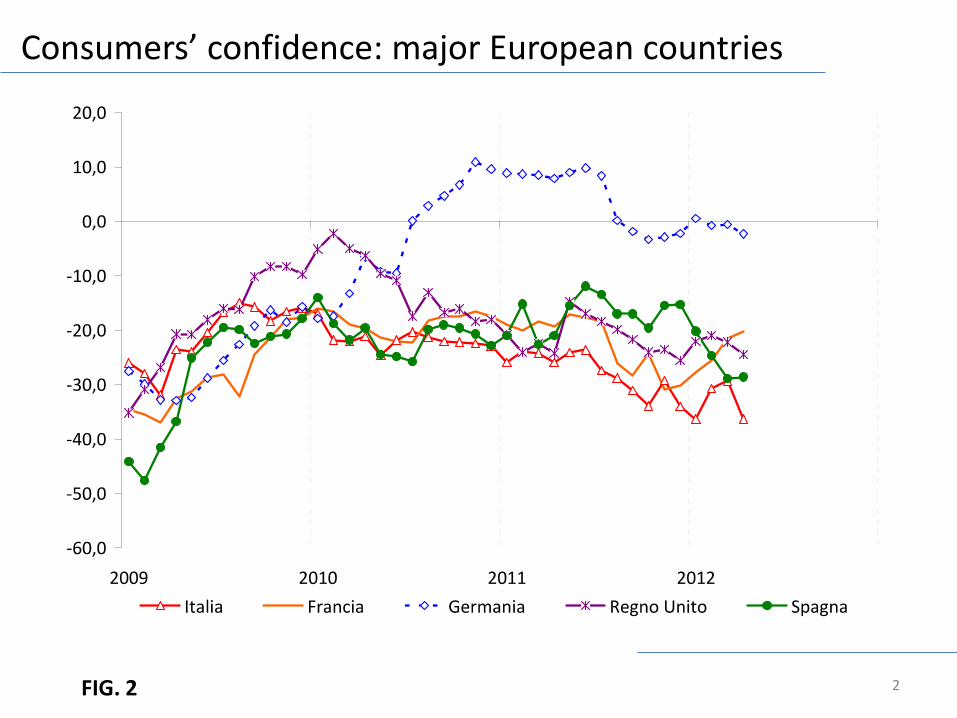
Consumers’ confidence: major European countries
2 FIG. 2
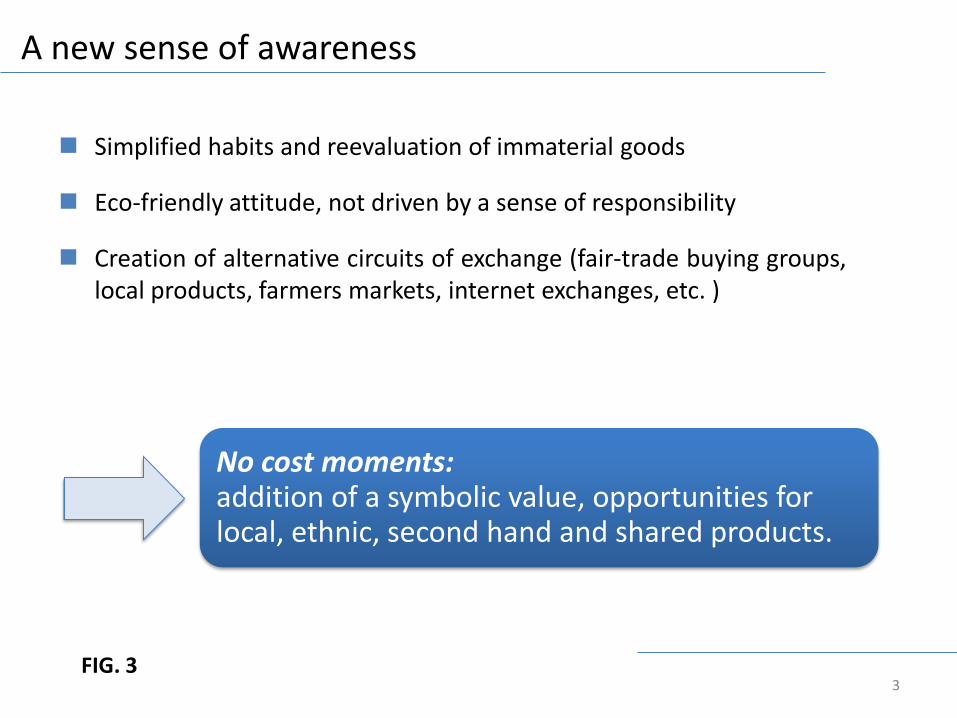
A new sense of awareness
3
Simplified habits and reevaluation of immaterial goods
Eco-friendly attitude, not driven by a sense of responsibility
Creation of alternative circuits of exchange (fair-trade buying groups, local products, farmers markets, internet exchanges, etc. )
No cost moments: addition of a symbolic value, opportunities for local, ethnic, second hand and shared products.
FIG. 3
4
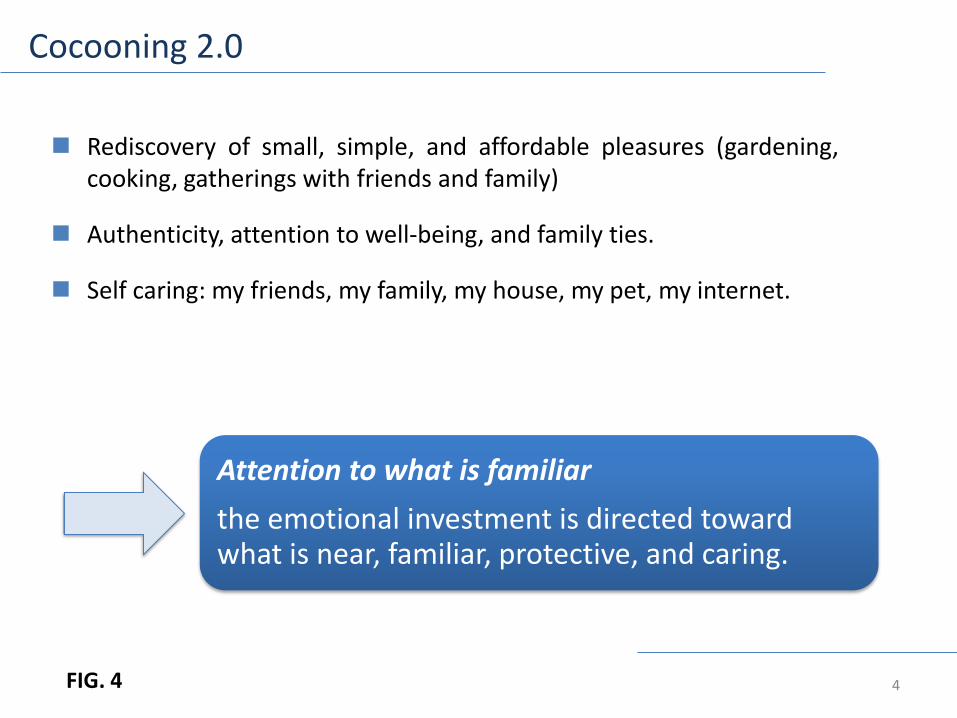
Rediscovery of small, simple, and affordable pleasures (gardening, cooking, gatherings with friends and family)
Authenticity, attention to well-being, and family ties.
Self caring: my friends, my family, my house, my pet, my internet.
Cocooning 2.0
Attention to what is familiar
the emotional investment is directed toward what is near, familiar, protective, and caring.
FIG. 4
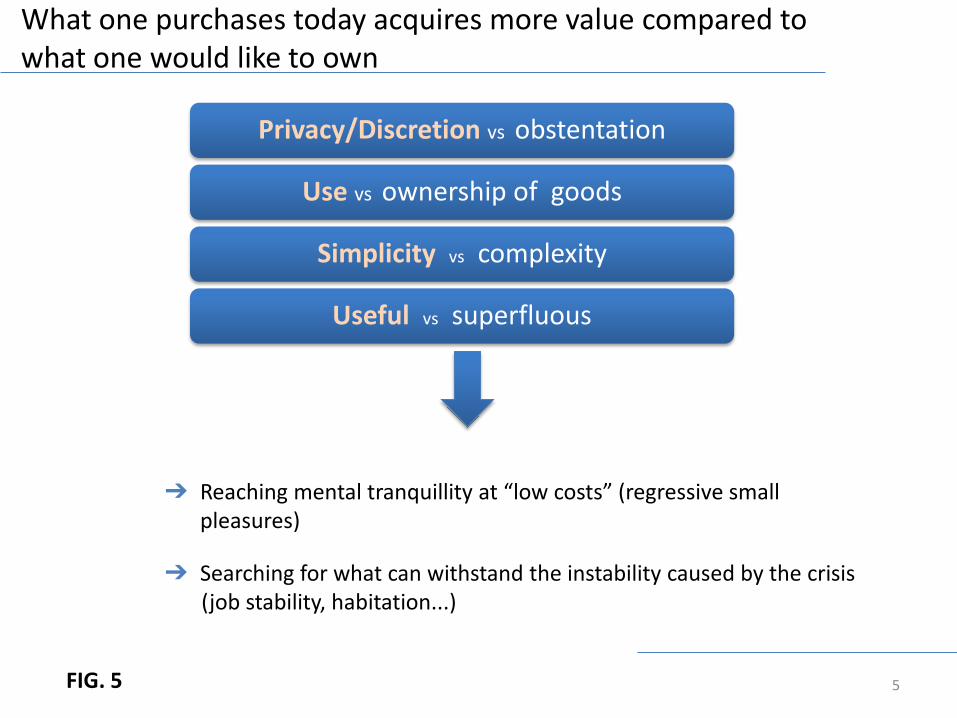
What one purchases today acquires more value compared to what one would like to own
5
Privacy/Discretion vs obstentation
Use vs ownership of goods
Simplicity vs complexity
Useful vs superfluous
➔ Reaching mental tranquillity at “low costs” (regressive small pleasures)
➔ Searching for what can withstand the instability caused by the crisis (job stability, habitation...)
FIG. 5
Consumers’ choices tend to be “elective” and not “exclusive”
6
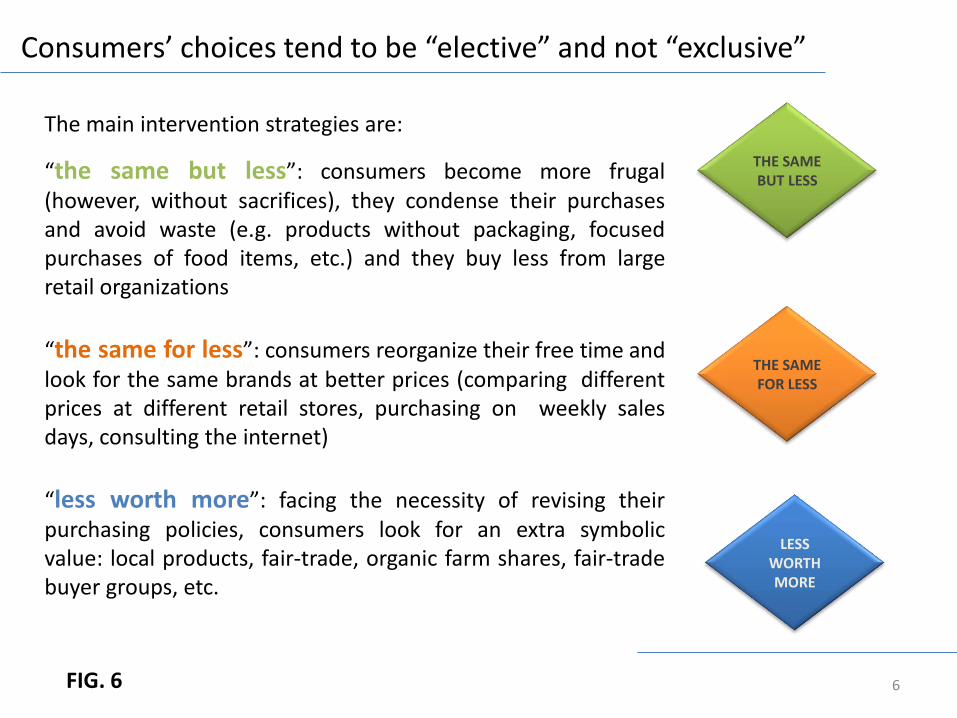
The main intervention strategies are:
“the same but less”: consumers become more frugal (however, without sacrifices), they condense their purchases and avoid waste (e.g. products without packaging, focused purchases of food items, etc.) and they buy less from large retail organizations
“the same for less”: consumers reorganize their free time and look for the same brands at better prices (comparing different prices at different retail stores, purchasing on weekly sales days, consulting the internet)
“less worth more”: facing the necessity of revising their purchasing policies, consumers look for an extra symbolic value: local products, fair-trade, organic farm shares, fair-trade buyer groups, etc.
THE SAME BUT LESS
THE SAME FOR LESS
LESS WORTH MORE
FIG. 6
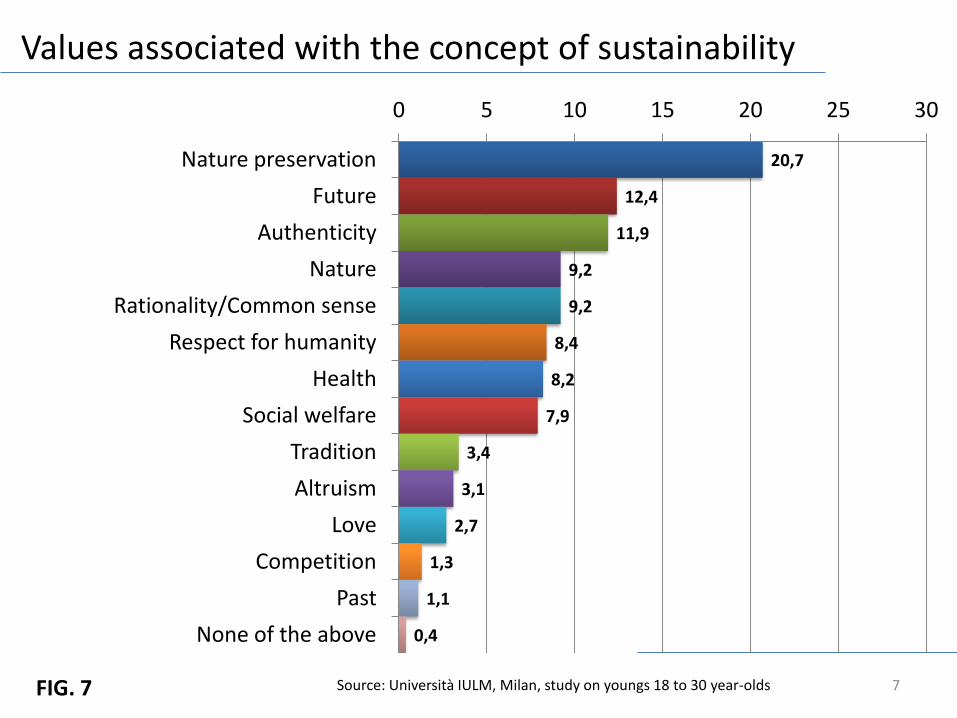
Values associated with the concept of sustainability
7 FIG. 7
20,7
12,4
11,9
9,2
9,2
8,4
8,2
7,9
3,4
3,1
2,7
1,3
1,1
0,4
0 5 10 15 20 25 30
Nature preservation
Future
Authenticity
Nature
Rationality/Common sense
Respect for humanity
Health
Social welfare
Tradition
Altruism
Love
Competition
Past
None of the above
Source: Università IULM, Milan, study on youngs 18 to 30 year-olds
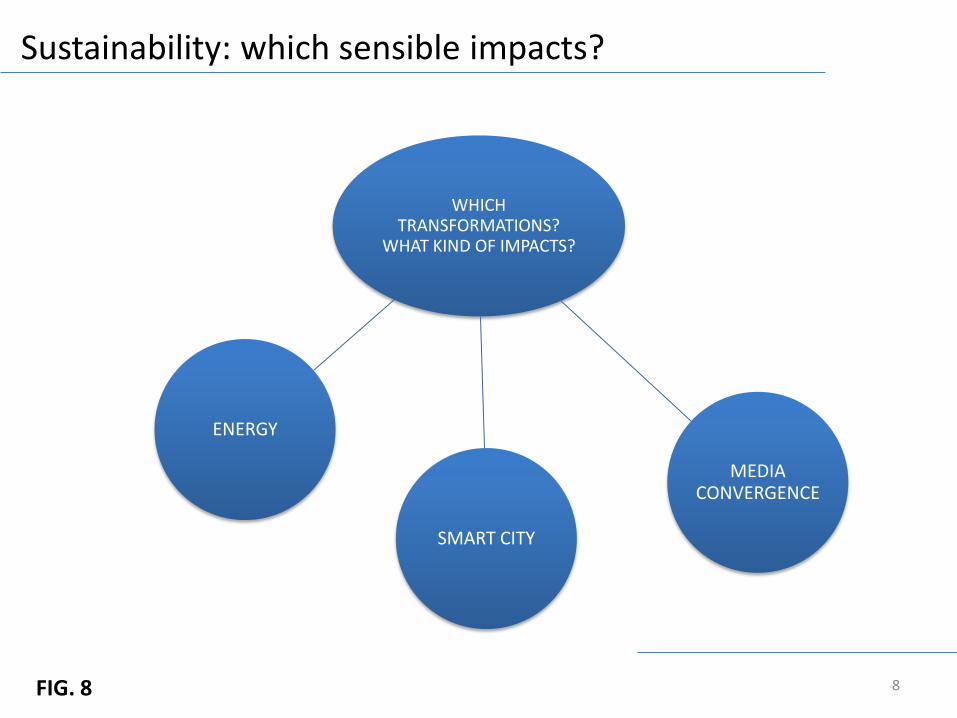
Sustainability: which sensible impacts?
WHICH TRANSFORMATIONS?
WHAT KIND OF IMPACTS?
MEDIA CONVERGENCE
SMART CITY
ENERGY
8 FIG. 8
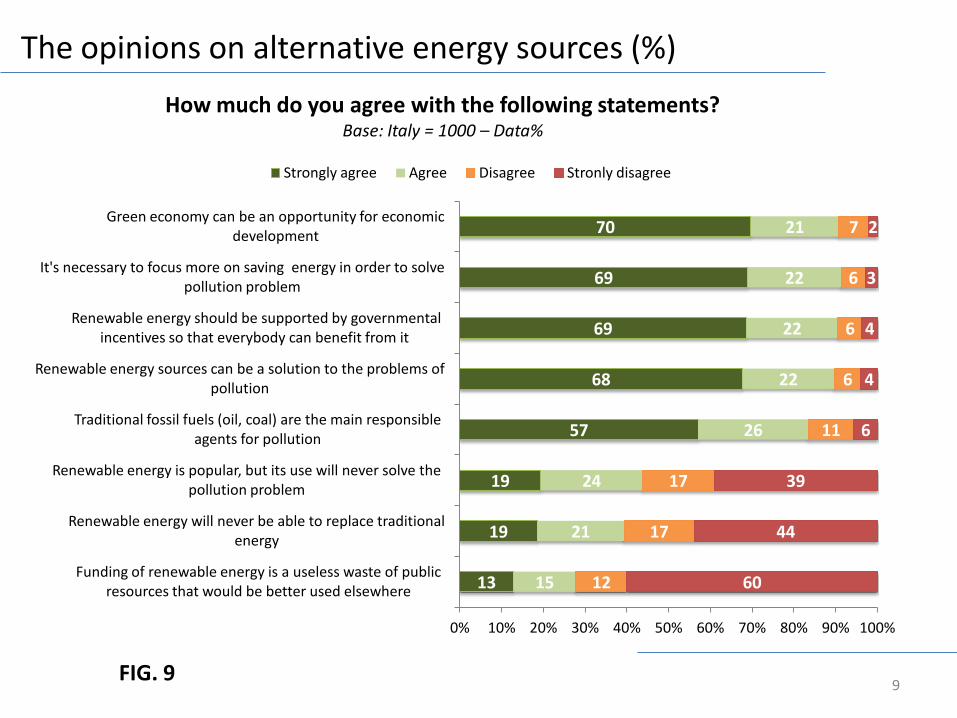
The opinions on alternative energy sources (%)
13
19
19
57
68
69
69
70
15
21
24
26
22
22
22
21
12
17
17
11
6
6
6
7
60
44
39
6
4
4
3
2
0% 10% 20% 30% 40% 50% 60% 70% 80% 90% 100%
Funding of renewable energy is a useless waste of public resources that would be better used elsewhere
Renewable energy will never be able to replace traditional energy
Renewable energy is popular, but its use will never solve the pollution problem
Traditional fossil fuels (oil, coal) are the main responsible agents for pollution
Renewable energy sources can be a solution to the problems of pollution
Renewable energy should be supported by governmental incentives so that everybody can benefit from it
It's necessary to focus more on saving energy in order to solve pollution problem
Green economy can be an opportunity for economic development
How much do you agree with the following statements? Base: Italy = 1000 – Data%
Strongly agree Agree Disagree Stronly disagree
9 FIG. 9
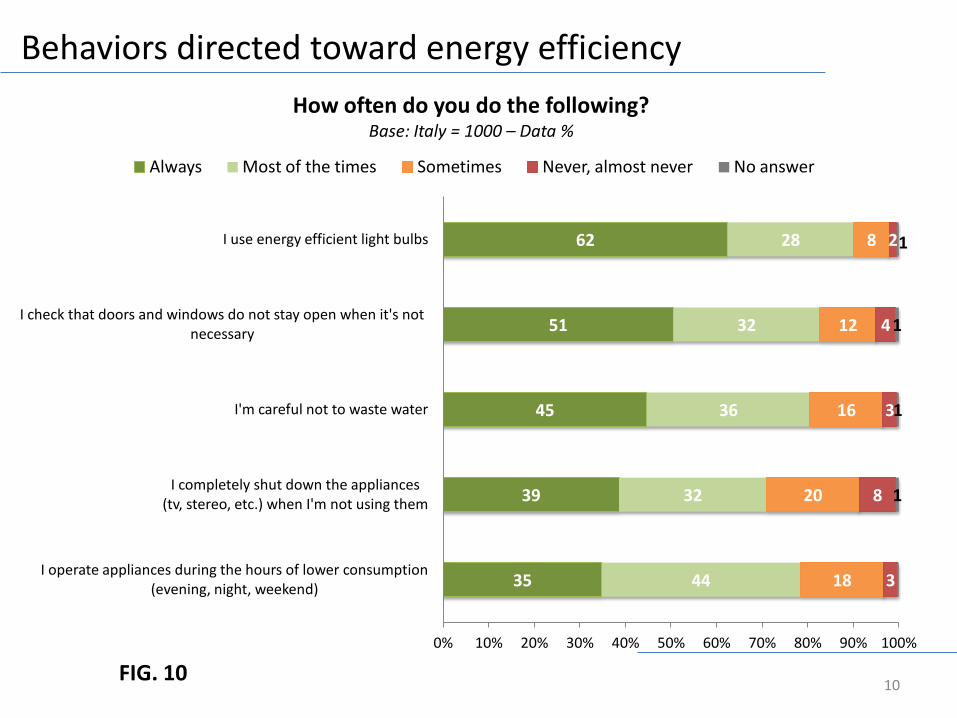
Behaviors directed toward energy efficiency
35
39
45
51
62
44
32
36
32
28
18
20
16
12
8
3
8
3
4
2
1
1
1
1
0% 10% 20% 30% 40% 50% 60% 70% 80% 90% 100%
I operate appliances during the hours of lower consumption (evening, night, weekend)
I completely shut down the appliances (tv, stereo, etc.) when I'm not using them
I'm careful not to waste water
I check that doors and windows do not stay open when it's not necessary
I use energy efficient light bulbs
How often do you do the following? Base: Italy = 1000 – Data %
Always Most of the times Sometimes Never, almost never No answer
10 FIG. 10
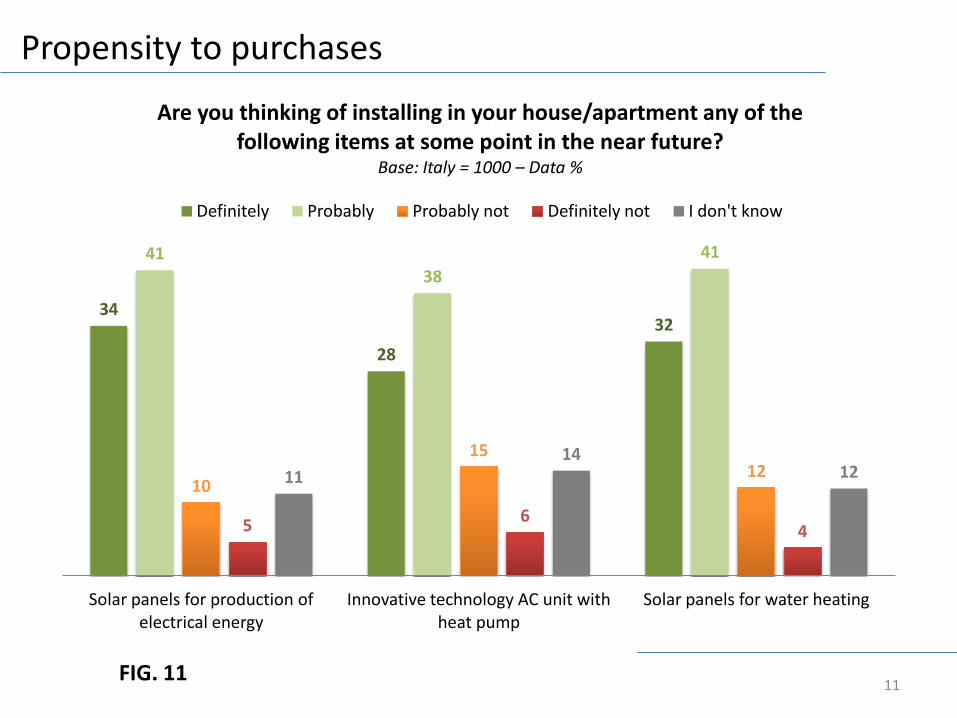
Propensity to purchases
34
28
32
41 38
41
10
15 12
5 6
4
11 14
12
Solar panels for production of electrical energy
Innovative technology AC unit with heat pump
Solar panels for water heating
Are you thinking of installing in your house/apartment any of the following items at some point in the near future?
Base: Italy = 1000 – Data %
Definitely Probably Probably not Definitely not I don't know
11 FIG. 11
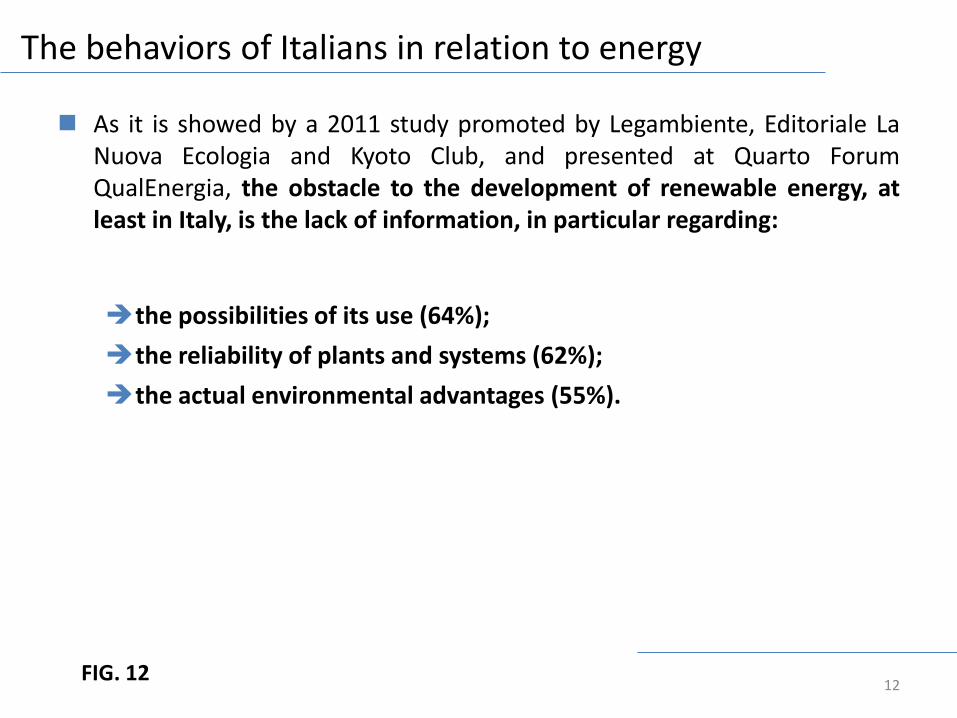
The behaviors of Italians in relation to energy
As it is showed by a 2011 study promoted by Legambiente, Editoriale La Nuova Ecologia and Kyoto Club, and presented at Quarto Forum QualEnergia, the obstacle to the development of renewable energy, at least in Italy, is the lack of information, in particular regarding:
the possibilities of its use (64%);
the reliability of plants and systems (62%);
the actual environmental advantages (55%).
12 FIG. 12
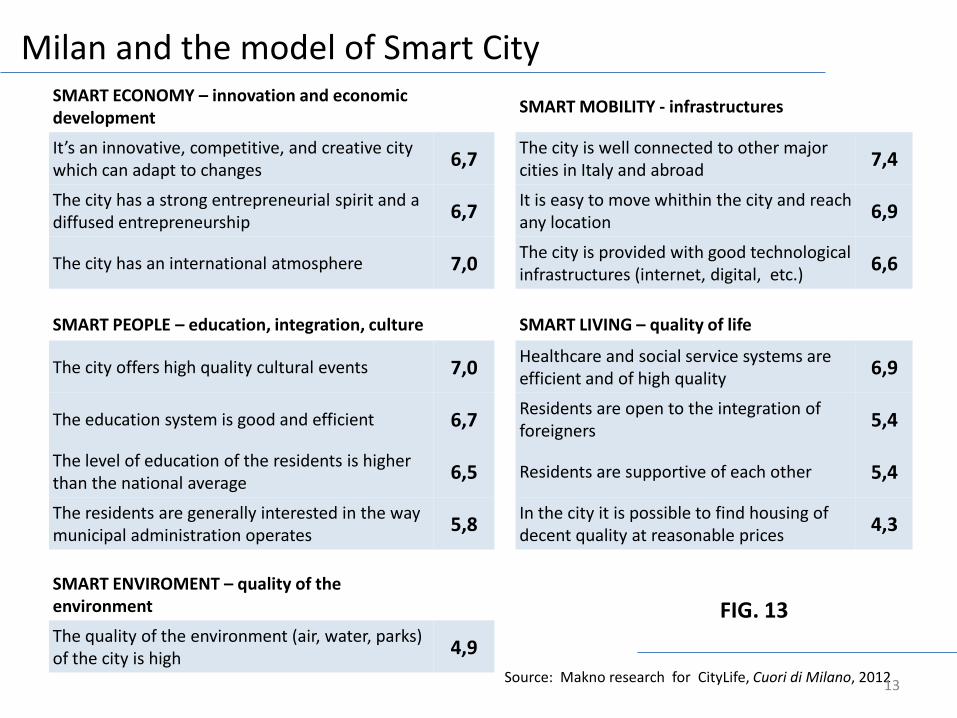
Milan and the model of Smart City SMART ECONOMY – innovation and economic development
SMART MOBILITY - infrastructures
It’s an innovative, competitive, and creative city which can adapt to changes
6,7 The city is well connected to other major cities in Italy and abroad
7,4
The city has a strong entrepreneurial spirit and a diffused entrepreneurship
6,7 It is easy to move whithin the city and reach any location
6,9
The city has an international atmosphere 7,0 The city is provided with good technological infrastructures (internet, digital, etc.)
6,6
SMART PEOPLE – education, integration, culture SMART LIVING – quality of life
The city offers high quality cultural events 7,0 Healthcare and social service systems are efficient and of high quality
6,9
The education system is good and efficient 6,7 Residents are open to the integration of foreigners
5,4
The level of education of the residents is higher than the national average
6,5 Residents are supportive of each other 5,4
The residents are generally interested in the way municipal administration operates
5,8 In the city it is possible to find housing of decent quality at reasonable prices
4,3
SMART ENVIROMENT – quality of the environment
The quality of the environment (air, water, parks) of the city is high
4,9
Source: Makno research for CityLife, Cuori di Milano, 2012
FIG. 13
13
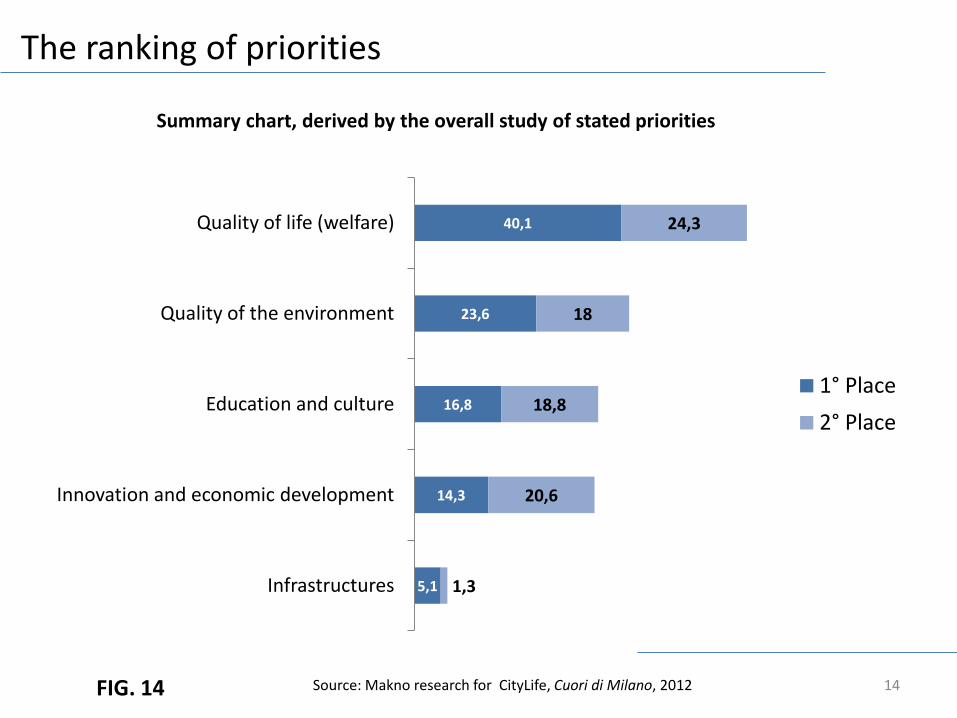
The ranking of priorities
40,1
23,6
16,8
14,3
5,1
24,3
18
18,8
20,6
1,3
Quality of life (welfare)
Quality of the environment
Education and culture
Innovation and economic development
Infrastructures
1° Place
2° Place
Summary chart, derived by the overall study of stated priorities
Source: Makno research for CityLife, Cuori di Milano, 2012 FIG. 14 14
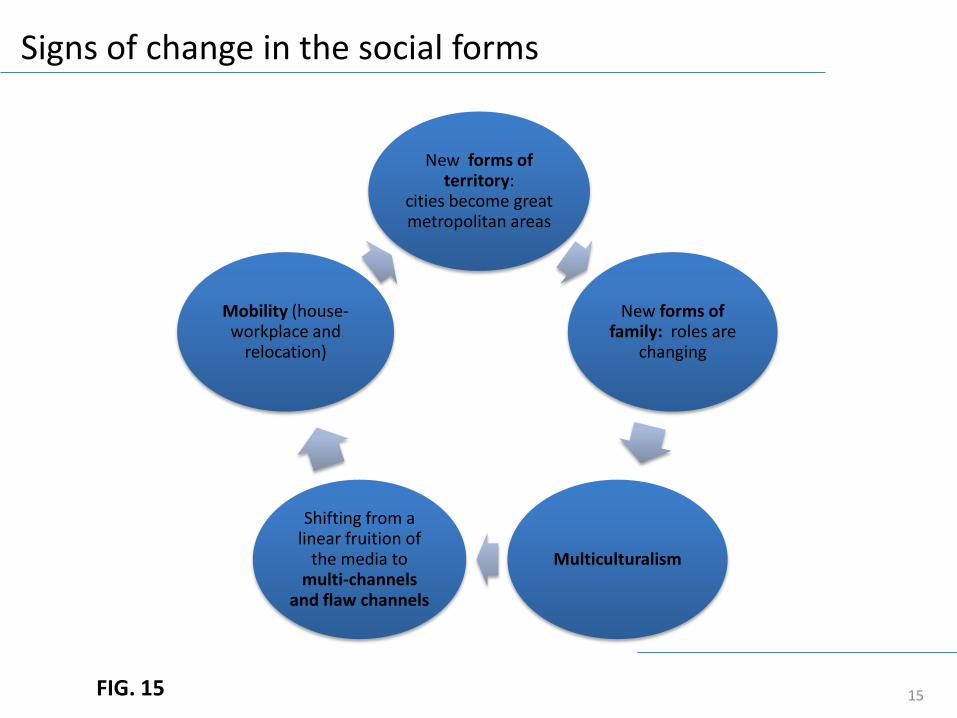
Signs of change in the social forms
FIG. 15
New forms of territory:
cities become great metropolitan areas
New forms of family: roles are
changing
Multiculturalism
Shifting from a linear fruition of
the media to multi-channels
and flaw channels
Mobility (house-workplace and
relocation)
15
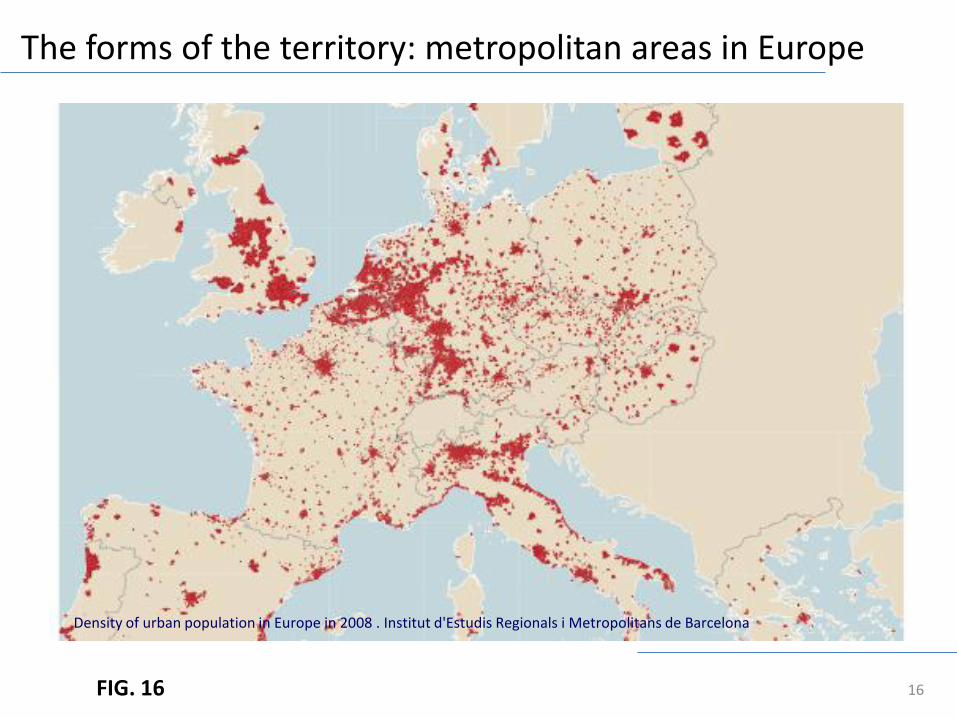
The forms of the territory: metropolitan areas in Europe
Density of urban population in Europe in 2008 . Institut d'Estudis Regionals i Metropolitans de Barcelona
16 FIG. 16
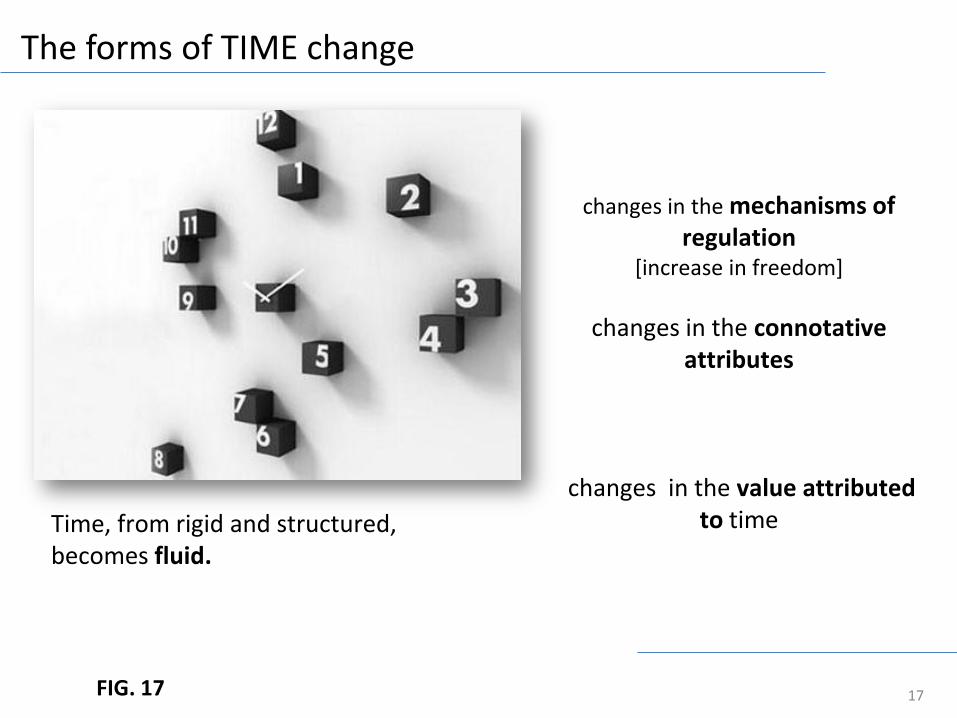
The forms of TIME change
Time, from rigid and structured, becomes fluid.
changes in the mechanisms of regulation
[increase in freedom]
changes in the connotative attributes
changes in the value attributed
to time
17 FIG. 17
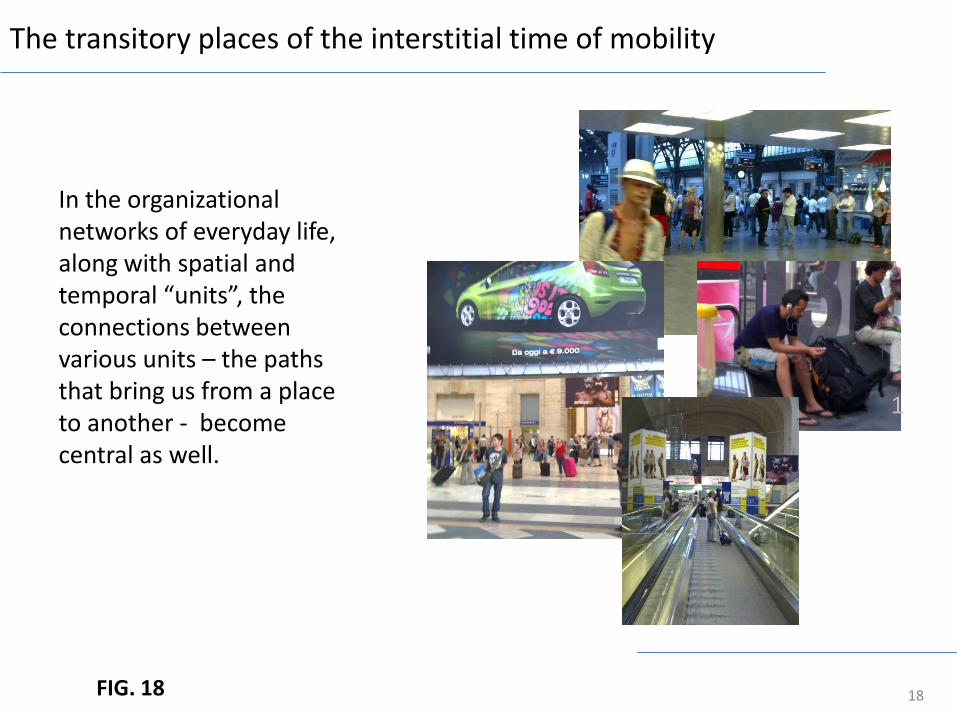
The transitory places of the interstitial time of mobility
In the organizational networks of everyday life, along with spatial and temporal “units”, the connections between various units – the paths that bring us from a place to another - become central as well.
1
FIG. 18 18
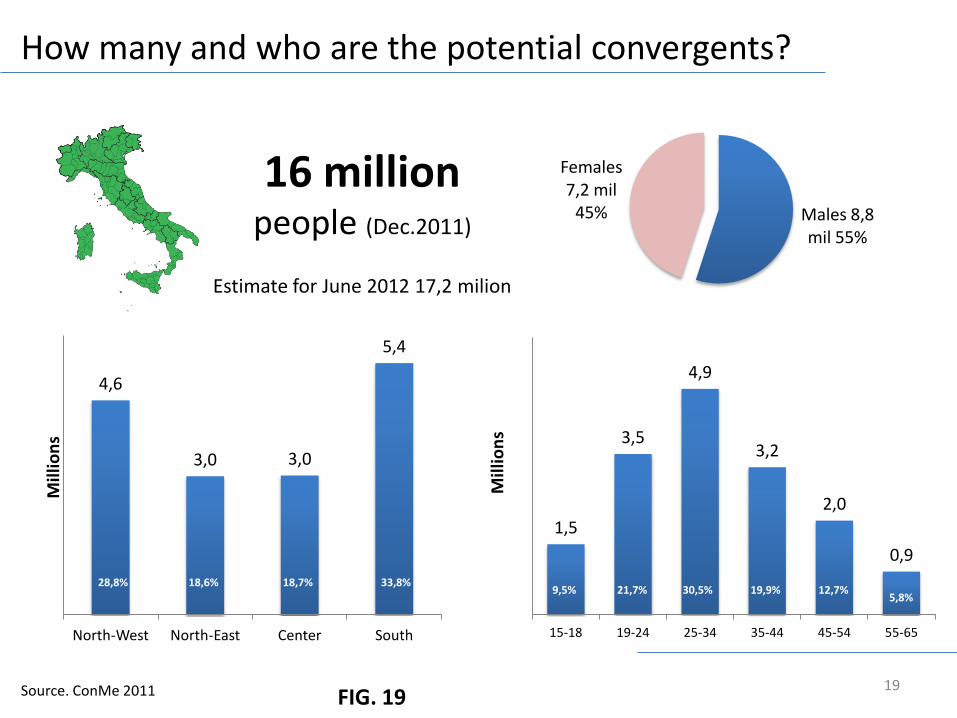
How many and who are the potential convergents?
19
16 million people (Dec.2011)
Estimate for June 2012 17,2 milion
Males 8,8 mil 55%
Females 7,2 mil
45%
4,6
3,0 3,0
5,4
North-West North-East Center South
Mill
ion
s
1,5
3,5
4,9
3,2
2,0
0,9
15-18 19-24 25-34 35-44 45-54 55-65
Mill
ion
s
Source. ConMe 2011
28,8% 18,6% 18,7% 33,8% 9,5% 21,7% 30,5% 19,9% 12,7%
5,8%
FIG. 19
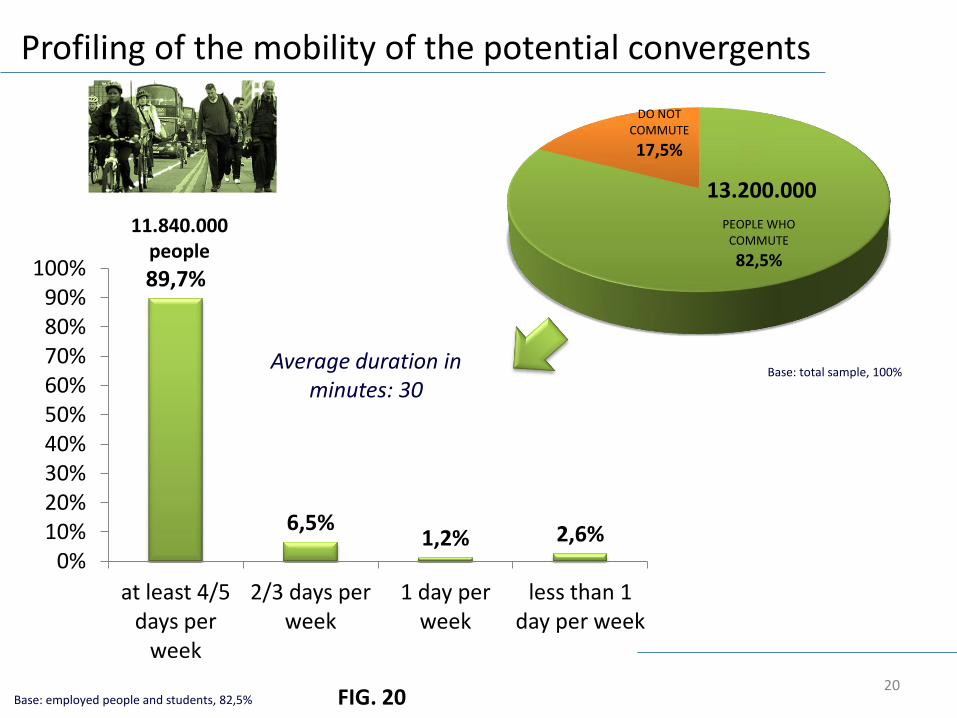
20 Base: employed people and students, 82,5%
Average duration in minutes: 30
PEOPLE WHO COMMUTE
82,5%
DO NOT COMMUTE
17,5%
13.200.000
Profiling of the mobility of the potential convergents
Base: total sample, 100%
FIG. 20
89,7%
6,5% 1,2% 2,6%
0% 10% 20% 30% 40% 50% 60% 70% 80% 90%
100%
at least 4/5 days per
week
2/3 days per week
1 day per week
less than 1 day per week
11.840.000 people
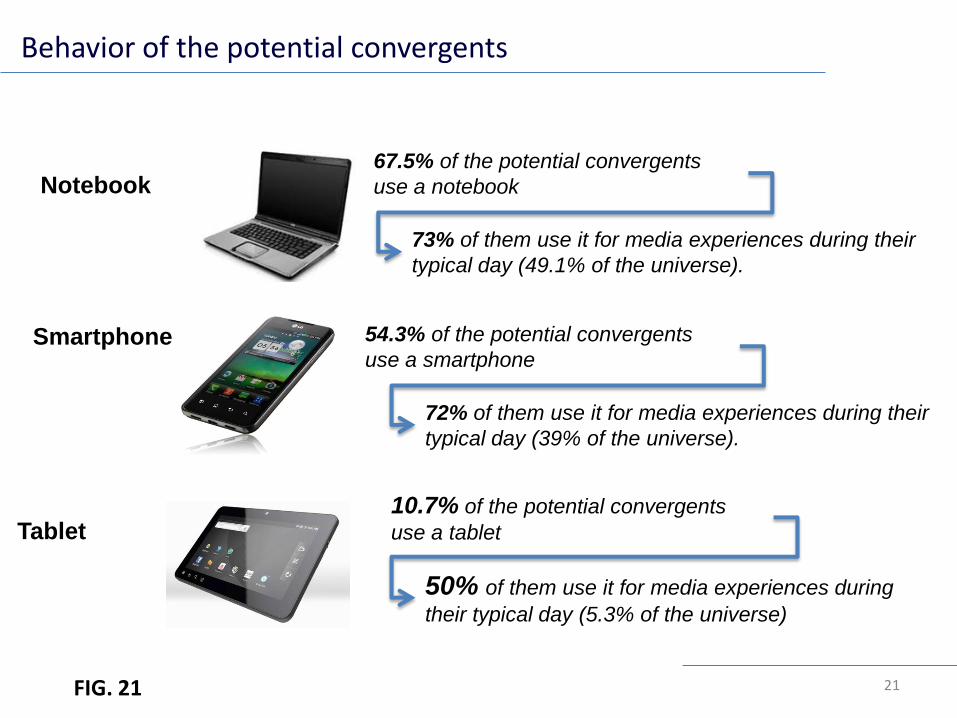
Behavior of the potential convergents
21
54.3% of the potential convergents
use a smartphone
72% of them use it for media experiences during their
typical day (39% of the universe).
10.7% of the potential convergents
use a tablet
50% of them use it for media experiences during
their typical day (5.3% of the universe)
Smartphone
Tablet
67.5% of the potential convergents
use a notebook
73% of them use it for media experiences during their
typical day (49.1% of the universe).
Notebook
FIG. 21

Sustainability: which sensible impacts?
WHICH TRANSFORMATIONS?
WHAT KIND OF IMPACTS?
MEDIA CONVERGENCE
SMART CITY
ENERGY
22 FIG. 8
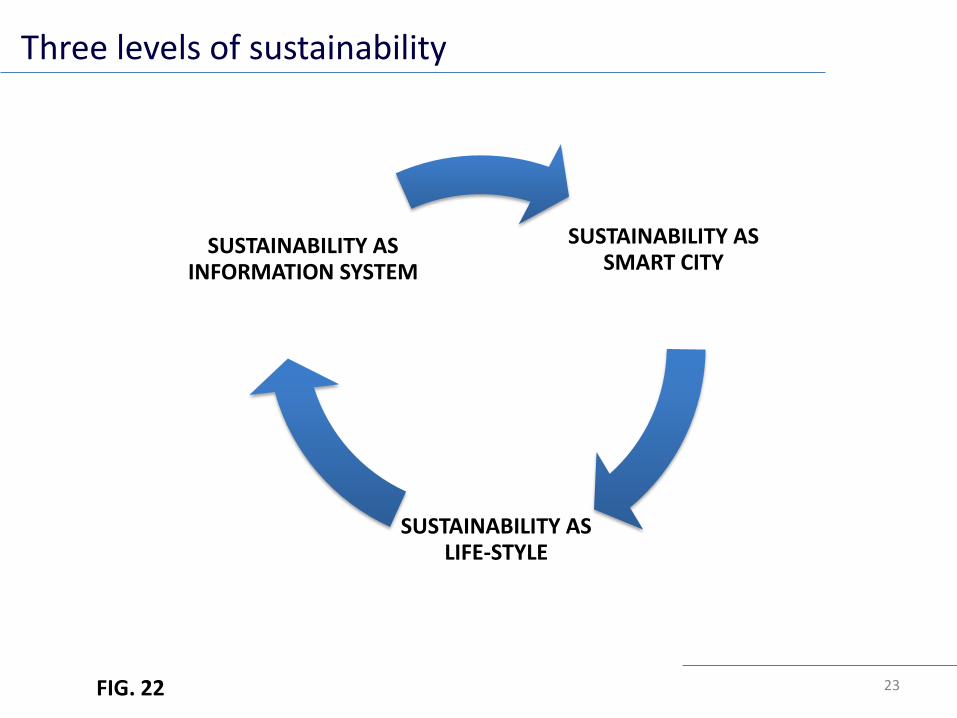
Three levels of sustainability
FIG. 22
SUSTAINABILITY AS SMART CITY
SUSTAINABILITY AS LIFE-STYLE
SUSTAINABILITY AS INFORMATION SYSTEM
23