Embed Size (px)
Citation preview
This journal is©The Royal Society of Chemistry 2017 Energy Environ. Sci.
Cite this:DOI: 10.1039/c7ee01764b
Efficient solar-driven electrochemical CO2
reduction to hydrocarbons and oxygenates†
Gurudayal, abc James Bullock,de David F. Sranko, af Clarissa M. Towle, ce
Yanwei Lum, ace Mark Hettick, de M. C. Scott,cg Ali Javey de andJoel Ager *abce
Solar to chemical energy conversion could provide an alternative to mankind’s unsustainable use of
fossil fuels. One promising approach is the electrochemical reduction of CO2 into chemical products, in
particular hydrocarbons and oxygenates which are formed by multi-electron transfer reactions. Here, a
nanostructured Cu–Ag bimetallic cathode is utilized to selectively and efficiently facilitate these
reactions. When operated in an electrolysis cell, the cathode provides a constant energetic efficiency
for hydrocarbon and oxygenate production. As a result, when coupled to Si photovoltaic cells, solar
conversion efficiencies of 3–4% to the target products are achieved for 0.35 to 1 Sun illumination. Use
of a four-terminal III–V/Si tandem solar cell configuration yields a conversion efficiency to hydrocarbons
and oxygenates exceeding 5% at 1 Sun illumination. This study provides a clear framework for the future
advancement of efficient solar-driven CO2 reduction devices.
Broader contextThe continuing rise in Earth’s atmospheric CO2 levels, which is primarily due to anthropogenic combustion of fossil fuels, may be mankind’s most enduringlegacy on the planet. A number of technologies would need to be developed to reverse this trend. Among them, the conversion of CO2 to fuels and chemicalsusing sustainable power sources, analogous to but more efficient than photosynthesis, could directly reduce the rate of CO2 emission into the atmosphere andas such is a key component of any strategy to stabilize the Earth’s atmospheric CO2 concentration. Reported here is a solar-driven CO2 reduction system whichgenerates hydrocarbon and oxygenate products with an efficiency far higher than natural photosynthesis, and which also operates capably over the course of asolar day.
Introduction
The development of sustainable energy sources is critical forcontinued human progress amid rising populations and climbingenergy demand. The direct conversion of the abundant solarresource into chemical energy is an attractive approach to meetthis challenge.1,2 The coupling of photovoltaic (PV) and electro-chemical (EC) components provides a means to convert solarenergy into fuels and chemicals.3,4 While solar-assisted watersplitting has been widely studied for hydrogen production,3,5,6
there are comparatively few reports of solar-driven electro-chemical CO2 reduction to carbon-containing products.3,7–9
Notably, prior to 2015, reported overall conversion efficienciesfor solar driven CO2 reduction did not exceed 1%.3
Recently, a number of devices which perform solar-drivenCO2 reduction have been reported.9–12 Arai et al. reported anintegrated device based on a triple-junction amorphous Si cellwith a semitransparent IrOx anode and polymeric Ru cathodewhich produced formate with a 4.5% overall energy conversion
a Joint Center for Artificial Photosynthesis, Lawrence Berkeley National Laboratory,
1 Cyclotron Road, Berkeley, CA 94720, USA. E-mail: [email protected] Chemical Sciences Division, Lawrence Berkeley National Laboratory,
1 Cyclotron Road, Berkeley, CA 94720, USAc Department of Materials Science and Engineering, University of California
Berkeley, Berkeley, CA 94720, USAd Department of Electrical Engineering and Computer Science, University of
California Berkeley, Berkeley, CA 94720, USAe Materials Sciences Division, Lawrence Berkeley National Laboratory,
1 Cyclotron Road, Berkeley, CA 94720, USAf Hungarian Academy of Sciences Centre for Energy Research, Surface Chemistry
and Catalysis Department, Konkoly-Thege Miklos ut 29-33, H-1121 Budapest,
Hungaryg National Center for Electron Microscopy, Molecular Foundry,
Lawrence Berkeley National Laboratory, Berkeley, CA 94720, USA
† Electronic supplementary information (ESI) available: Methods, calculation ofstandard potentials, device efficiency calculations, SEM-EDX, XRD and XPSanalysis, ICP-MS analysis, in situ Raman spectroscopy, HR-TEM, stability analysis,supplementary electrochemical data, optimization data, techno-economic analysis. SeeDOI: 10.1039/c7ee01764b
Received 24th June 2017,Accepted 31st August 2017
DOI: 10.1039/c7ee01764b
rsc.li/ees
Energy &EnvironmentalScience
PAPER
Publ
ishe
d on
31
Aug
ust 2
017.
Dow
nloa
ded
by U
nive
rsity
of
Cal
ifor
nia
- B
erke
ley
on 2
0/09
/201
7 16
:52:
33.
View Article OnlineView Journal
Energy Environ. Sci. This journal is©The Royal Society of Chemistry 2017
efficiency.8 Schreier et al. used three series-connected halideperovskite solar cells in combination with an electrochemicalcell containing an Au cathode and an IrO2 anode to producecarbon monoxide with a conversion efficiency of 6.5%.7 Zhouet al. coupled a TiO2-protected III–V photoanode, a Pd/C cathode,and a bipolar membrane to achieve a solar-to-formate conversionefficiency of 10%.9 Very recently, Schreier et al. coupled a GaInP/GaInAs/Ge tandem solar cell to a cell equipped with a bipolarmembrane to produce CO at a 1 Sun efficiency of 13.4%.12
While these reports are encouraging, achieving solar-drivenCO2 reduction reaction (CO2 RR) efficiencies comparable to thoseobtained for water splitting in similar devices (B8–20%),5,13,14
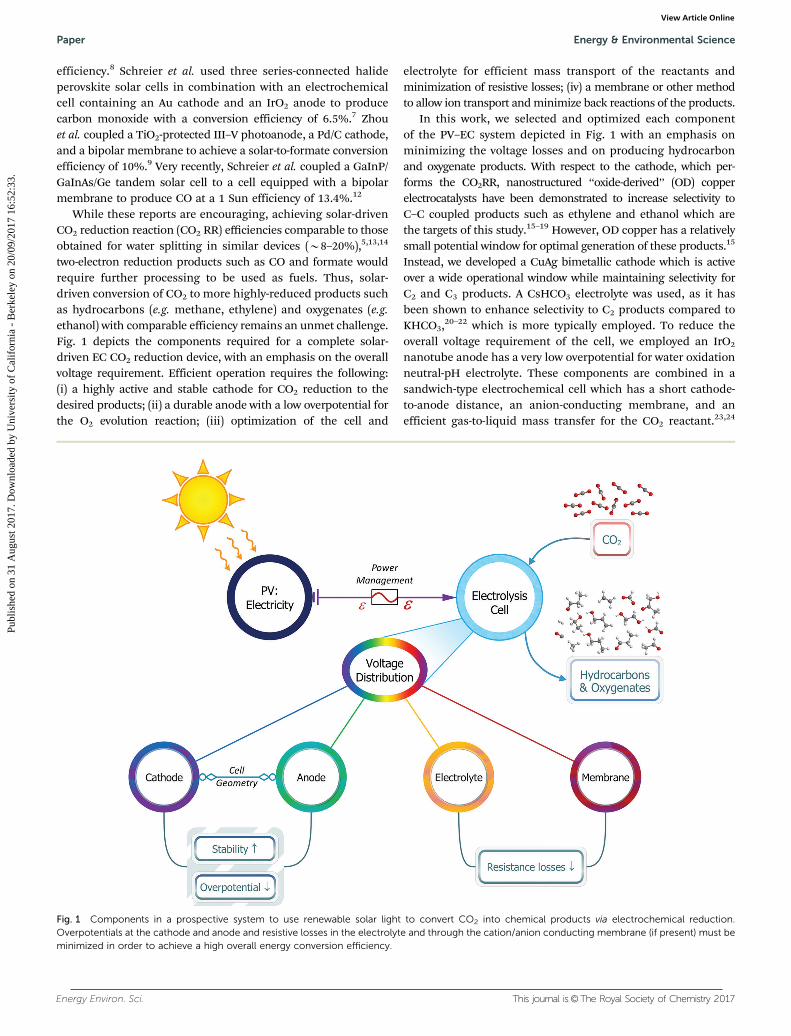
two-electron reduction products such as CO and formate wouldrequire further processing to be used as fuels. Thus, solar-driven conversion of CO2 to more highly-reduced products suchas hydrocarbons (e.g. methane, ethylene) and oxygenates (e.g.ethanol) with comparable efficiency remains an unmet challenge.Fig. 1 depicts the components required for a complete solar-driven EC CO2 reduction device, with an emphasis on the overallvoltage requirement. Efficient operation requires the following:(i) a highly active and stable cathode for CO2 reduction to thedesired products; (ii) a durable anode with a low overpotential forthe O2 evolution reaction; (iii) optimization of the cell and
electrolyte for efficient mass transport of the reactants andminimization of resistive losses; (iv) a membrane or other methodto allow ion transport and minimize back reactions of the products.
In this work, we selected and optimized each componentof the PV–EC system depicted in Fig. 1 with an emphasis onminimizing the voltage losses and on producing hydrocarbonand oxygenate products. With respect to the cathode, which per-forms the CO2RR, nanostructured ‘‘oxide-derived’’ (OD) copperelectrocatalysts have been demonstrated to increase selectivity toC–C coupled products such as ethylene and ethanol which arethe targets of this study.15–19 However, OD copper has a relativelysmall potential window for optimal generation of these products.15
Instead, we developed a CuAg bimetallic cathode which is activeover a wide operational window while maintaining selectivity forC2 and C3 products. A CsHCO3 electrolyte was used, as it hasbeen shown to enhance selectivity to C2 products compared toKHCO3,20–22 which is more typically employed. To reduce theoverall voltage requirement of the cell, we employed an IrO2
nanotube anode has a very low overpotential for water oxidationneutral-pH electrolyte. These components are combined in asandwich-type electrochemical cell which has a short cathode-to-anode distance, an anion-conducting membrane, and anefficient gas-to-liquid mass transfer for the CO2 reactant.23,24
Fig. 1 Components in a prospective system to use renewable solar light to convert CO2 into chemical products via electrochemical reduction.Overpotentials at the cathode and anode and resistive losses in the electrolyte and through the cation/anion conducting membrane (if present) must beminimized in order to achieve a high overall energy conversion efficiency.
Paper Energy & Environmental Science
Publ
ishe
d on
31
Aug
ust 2
017.
Dow
nloa
ded
by U
nive
rsity
of
Cal
ifor
nia
- B
erke
ley
on 2
0/09
/201
7 16
:52:
33.
View Article Online

This journal is©The Royal Society of Chemistry 2017 Energy Environ. Sci.
We investigated in detail the effect of the electrolyte concen-tration on the cell current and the resultant product distributionto find optimal values. The power-matching electronics couplingthe PV and EC components were selected to achieve high overallefficiency under the varying illumination conditions (0.35 to1 Sun) which occur over the course of a solar day due to Sunangle and cloud shading. We also developed a power-matchingstrategy to couple a high-efficiency 4-terminal PV device to the ECcell, and it with this configuration that our highest solar-to-hydrocarbon and oxygenate efficiency is achieved, 5.6%.
Results and discussionNanocoral bimetallic cathode with wide window of efficientCO2RR operation
A selective and active cathode is essential for the efficientoperation of the overall device. Although an oxide-derived Cucatalyst was also evaluated in this study (see ESI† for electro-chemical data), we found that a Cu-rich nanostructured bimetallicCuAg catalyst is better suited for our overall operating conditions.It provides superior selectivity and current density over the rangeof voltages expected for variable solar illumination and under theelectrolyte conditions required to reduce resistive losses in the cell.A false-color EDX SEM image of this cathode is shown in Fig. 2aand reveals a ‘‘nanocoral’’ morphology formed by dendrites
50–100 nm in length (see also Fig. S1 and S2, ESI†). XPS analysisshows that Ag is present at about 1% atomic concentration andXRD analysis indicates that both metals are polycrystalline(Table S1 and Fig. S3–S5, ESI†). The HRTEM measurements andcorresponding HAADF-STEM-EDS mapping of CuAg cathode clearlyshows the distribution of copper and silver (Fig. S7 and S8, ESI†).
We performed extensive measurements on the CuAg cathode inthe three-electrode geometry to benchmark its performance. Fig. 2bshows the effect of electrolyte concentration (0.1–0.5 M CsHCO3) onthe current density. The current density increases with increasingelectrolyte concentration, and the potential required to operate atour target current density of 10 mA cm�2 is reduced by 170 mVover this range. A higher electrolyte concentration results in adrop in resistive losses across the cell; however, an electrolyteconcentration higher than 0.5 M diminishes the C2–C3 productselectivity (see ESI† for optimization discussion). A typical productdistribution is shown in Fig. 2c for a cathode potential of �1 V vs.RHE (see also Fig. S13b, ESI†). The CuAg cathode showsexcellent activity with respect to CO2 reduction to hydrocarbonsand oxygenates and shows only a 30–35% Faradaic efficiency(FE) of hydrogen generation (Fig. 2c), which is less than ODcopper at this potential (Fig. S13b, ESI†). The CuAg cathodeshows a high faradaic efficiency for ethylene, ethanol, andpropanol formation, which is substantially higher than for theoxide-derived catalyst (Fig. 2c and Fig. S13b, ESI†) at the sameconditions. We performed a stability assessment for three days
Fig. 2 Structural and electrochemical properties of CuAg cathode and IrO2 nanotube anode. (a) EDX elemental mapping of CuAg nanocoral cathode.(b) J–V curves of CuAg nanocoral cathode under various electrolyte conditions. (c) CO2 RR product distribution at �1 V vs. RHE (B10 mA cm�2) in0.2 M CsHCO3 electrolyte. Error bars are standard deviations based on replicate experiments. (d) SEM surface view of IrO2 nanotubes on iridium foil.(e) J–V curves of IrO2 nanotube anode on FTO, Ti foil and Ir foil substrates in 0.2 M CsHCO3 electrolyte. (f) J–V curve of Ir foil-IrO2 anode under variouselectrolyte conditions. Electrochemical measurements were performed under constant CO2 bubbling (the condition used in the electrolysis cell).
Energy & Environmental Science Paper
Publ
ishe
d on
31
Aug
ust 2
017.
Dow
nloa
ded
by U
nive
rsity
of
Cal
ifor
nia
- B
erke
ley
on 2
0/09
/201
7 16
:52:
33.
View Article Online
Energy Environ. Sci. This journal is©The Royal Society of Chemistry 2017
in 0.1 M CsHCO3 at �1 V vs. RHE and found that the currentdensity and product selectivity were generally stable over thisperiod (Fig. S11, ESI†).
Anode with low overpotential in neutral pH
Selection of an anode material which produces the lowestpossible overpotential for the oxygen evolution reaction (OER)is crucial for achieving an overall efficient device. The anodemust be stable and operate at near-neutral pH (6.8–7.6) for therange of electrolyte concentrations used here. To this end, wemodified a templated electrodeposition procedure for nano-structured IrO2.25 Notable modifications include the use ofhydrothermal growth to make the sacrificial ZnO nanotubetemplate, allowing for deposition on arbitrary substrates, andthe use of different electrodeposition conditions (see Methods).As a result, IrO2 nanotubes with a high surface area morphol-ogy are produced as shown in Fig. 2d. Energy dispersive X-rayspectroscopy (EDX) line scan measurements indicate uniformdistribution of iridium and oxygen, with no observation of Znfrom the template (Fig. S10, ESI†).
Fig. 2e shows the three-electrode J–V curves for IrO2 nano-tubes grown on FTO, Ti, and Ir. The lowest overpotential at ourtarget current density of 10 mA cm�2, 340 mV in 0.2 M CsHCO3,is found for the IrO2/Ir anode, and we employed this configurationfor all subsequent device work. Fig. 2f shows that the use of amore concentrated electrolyte further improves the OER activityas evidenced by an additional decrease in the overpotential, toonly 300 mV in 0.5 M CsHCO3. Multiday stability of the anodewas also demonstrated as detailed in the ESI† (see IrO2 stabilitymeasurements in ESI†).
Electrochemical energy conversion efficiency measurements
The electrochemical conversion efficiency was evaluated byoperating the cell in a two-electrode mode with a CuAg nano-coral cathode and IrO2 nanotubes on an Ir foil as the anode.The anode and cathode chambers were separated by an anionexchange membrane (Selemion) in a sandwich-type electro-chemical cell.24 The energy conversion efficiency was calculatedfor each product (H2, CO, CH4, C2H4, C2H6, C2H5OH, C3H7OH,etc.) using their standard thermodynamic potential, their Faradaicefficiency, and the total input cell voltage (see energetic efficiencycalculation in ESI† for more details); below is an examplecalculation for ethylene:
Zenergetic;C2H4¼
E0C2H4
FEC2H4
Vin(1)
where E0C2H4
is the standard thermodynamic potential of ethylene,
FEC2H4is the faradaic efficiency of ethylene, and Vin is the total
cell voltage. The total energetic efficiency of an electrochemicalcell is the sum of the individual energetic efficiencies of allCO2 RR products. Hydrocarbons (HCs) and oxygenates refer toethylene, methane, ethanol, propanol, allyl alcohol, propionalde-hyde, acetaldehyde, glycolaldehyde, ethylene glycol, hydroxyacetone,acetate and formate (see Table S7, ESI† for details). It isimportant to stress that this measurement mode accounts for
the potential losses of each component of the electrochemical cell(overpotentials of electrodes and resistance losses) and accuratelydefines the overall electrochemical cell efficiency. Importantly,electrochemical cell efficiency calculations should be done in atwo-electrode configuration because the voltage drop at the counterelectrode is unknown in three-electrode measurements.26
Both the total cell voltage (3.1–4.1 V) and the electrolyteconcentration (0.1–0.5 M) were varied to assess their effect onthe conversion efficiency. Fig. 3a shows that the target currentdensity can be achieved in the tested voltage range for electro-lyte concentrations of 0.1 M and above. We operated theelectrochemical cell over a range of conditions to find a workingwindow in which the cell produces an operating current densityof 10 � 5 mA cm�2. The shaded part of the J–V curve in Fig. 3ademarcates the employed working window. Fig. 3d and eillustrate the product distributions obtained by varying thevoltage and the electrolyte concentration, respectively. Notably,in this two-electrode configuration, raising the voltage and/orelectrolyte concentration reduces the FE to hydrogen, therebyincreasing the selectivity to hydrocarbons. We compared theseresults with those of oxide-derived copper and found theopposite behavior: the hydrogen FE increases with voltage aswell as with electrolyte concentration, reducing the selectivity tohydrocarbons (Fig. S15b, ESI†). As a result, as shown in Fig. 3band c, the overall energetic efficiency to the target products ofthis study, hydrocarbons and oxygenates, is relatively constantat nearly 20% over a wide range of applied voltages andelectrolyte concentrations. Also, most of these products areC2+ species such as ethylene, ethanol, propanol, etc. (refer toTable S7, ESI† for all CO2 RR products observed in this study).We also compared this data with OD copper at same electrolyteconcentrations and again found comparatively better selectivityfor HCs and oxygenates for the CuAg nanocoral cathode (Fig. S11and S12, ESI†). Minimizing the overall cell voltage while main-taining overall efficiency is essential for operating the system asa whole. We evaluated the cell performance at low voltage byoperating the cell at 2.5 V in 0.5 M CsHCO3 (below 2.5 V,hydrogen generation dominates), shown in Fig. S17 (ESI†).These conditions correspond to low light illumination in thecoupled system as discussed below. A total energetic efficiencyof 50.3% (Table S9, ESI†) and an energetic efficiency forhydrocarbons and oxygenates of 24% were obtained.
Solar-driven CO2 reduction efficiency measurements
The output voltage of most practical photovoltaic (PV) cells issignificantly lower than the voltage required the electrochemicalcell. Current-matched PV cells can be connected in series toincrease the overall voltage,11 but such a configuration wouldhave a time-varying voltage outside the operational windowunder variable illumination, which would affect selectivity.Instead, in this study, to achieve a potential in the windowrequired for the electrochemical cell operation, and to maintainthose conditions under variable illumination levels, we employedmaximum power point (MPP) tracking circuits with boostconverters as represented in Fig. 4a (see Methods for further details).Such MPP circuits can step up an initial voltage below 1 V into the
Paper Energy & Environmental Science
Publ
ishe
d on
31
Aug
ust 2
017.
Dow
nloa
ded
by U
nive
rsity
of
Cal
ifor
nia
- B
erke
ley
on 2
0/09
/201
7 16
:52:
33.
View Article Online

This journal is©The Royal Society of Chemistry 2017 Energy Environ. Sci.
required range with efficiencies of 90% and above. Details of the PVcells, MPP tracking circuits, and electrical configuration are in the‘‘Solar-Driven CO2 Data’’ section of the ESI.†
As shown schematically in Fig. 2a, two commercially-availablesilicon solar cells were used to form a complete solar-to-hydrocarbonsystem (TD1). A second configuration was assembled utilizingtwo laboratory-fabricated high-efficiency III–V/silicon tandemcells connected in series to two maximum power point (MPP)trackers, which were in turn connected in parallel (TD2).27 Thetotal illumination areas of the solar cells were set based onpower matching to the electrochemical cell: 3.198 cm2 and2.0 cm2 for TD1 and TD2, respectively. In the case of TD1, theilluminated area was chosen to be sufficiently large to drive theEC cell even at low illumination conditions (0.35 Sun). Adetailed characterization of the solar elements of TD1 andTD2 is in the ESI.† At 1 Sun, the two series-connected Si cellsprovide an open circuit voltage (Voc) of 1.1 V and a short circuitcurrent (Isc) of 61.3 mA. For TD2 at 1 Sun, the top III–V cellsprovide a Voc of 1.44 V and 1.46 V, and an Isc of 33.4 mA and30.4 mA; the bottom silicon solar cells provide a Voc of 0.7 Veach and an Isc of 49.8 mA and 49.4 mA (Fig. S20, ESI†).
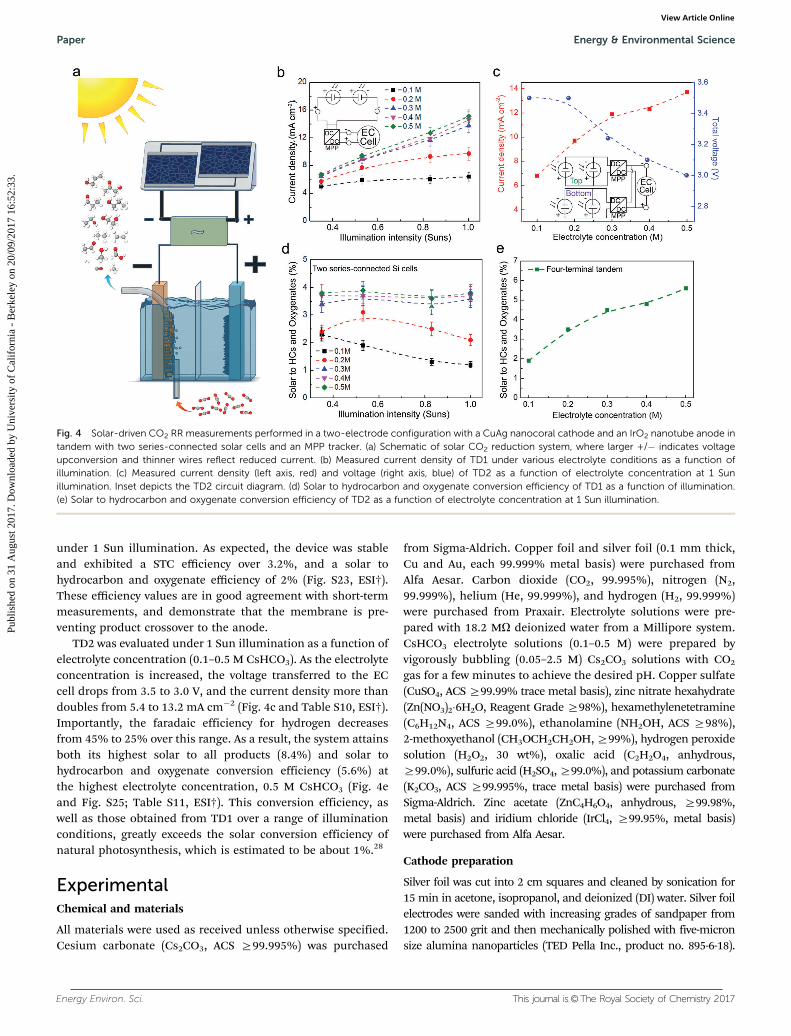
The solar-to-chemical (STC) conversion efficiency and devicestability of TD1 was measured as a function of illuminationintensity (0.35 to 1.0 Sun) and electrolyte concentration (0.1–0.5 MCsHCO3). Under these conditions, the MPP output voltage (which
is the electrochemical cell input) was in the range of 2.5–3.6 Vwith corresponding current densities in the range of 4.95–15.11 mA cm�2 (see ESI† for details on each experiment, Table S8)(Fig. 4b). The current increases with electrolyte concentrationdue to higher ionic conductivity. Notably, the system yields aconsistent product distribution over this range of conditions, ascould be anticipated from the two-electrode EC measurementsdiscussed above. The faradaic efficiency of hydrogen decreaseswith the electrolyte concentration, whereas that of methaneincreases, which is similar to our previous observation (Fig. S21,ESI†). Ethylene, ethanol and propanol are the major hydrocarbonproducts with a total Faradaic efficiency of 30–40% at 0.35 to 1 Sunillumination (Fig. S21, ESI†).
For the TD1 configuration, the total solar-to-chemical conversionefficiency is a maximum of 7.5% at 0.35 Sun illumination and in0.5 M CsHCO3 electrolyte concentration, which reduces to aminimum of 2.4% with 1 Sun and 0.1 M CsHCO3 (Fig. S17,ESI†). The solar to hydrocarbon and oxygenate conversionefficiency is a maximum of 3.9% at 0.53 Sun illumination and0.5 M CsHCO3 electrolyte (Fig. 4d). Interestingly, we attained highersolar-to-chemical conversion efficiency at lower illuminationbecause the input power decreases with illumination by agreater proportion than the current density, which is moder-ated by the MPP tracker (eqn (S7), ESI†). Device stability wasdemonstrated by a 6 h measurement of TD1 in 0.2 M CsHCO3
Fig. 3 CO2 reduction performed in a two-electrode configuration with a CuAg nanocoral cathode and an IrO2 nanotube anode. (a) Linear scanvoltammetry curve of a CuAg nanocoral cathode in a two-electrode configuration with an IrO2 nanotube anode in different electrolyte concentrations(0.1–0.5 M CsHCO3) during CO2 RR. The determined working window is depicted by blue shading. (b) Energetic efficiency (overall electrochemical cellconversion efficiency) as a function of applied voltage in 0.2 M CsHCO3. (c) Energetic efficiency as a function of electrolyte concentration at a fixedapplied voltage of 3.5 V. (d) CO2 RR product distribution as a function of applied voltage in 0.2 M CsHCO3. (e) CO2 RR product distribution as a function ofelectrolyte concentration (0.1–0.5 M CsHCO3) at a fixed applied voltage of 3.5 V.
Energy & Environmental Science Paper
Publ
ishe
d on
31
Aug
ust 2
017.
Dow
nloa
ded
by U
nive
rsity
of
Cal
ifor
nia
- B
erke
ley
on 2
0/09
/201
7 16
:52:
33.
View Article Online
Energy Environ. Sci. This journal is©The Royal Society of Chemistry 2017
under 1 Sun illumination. As expected, the device was stableand exhibited a STC efficiency over 3.2%, and a solar tohydrocarbon and oxygenate efficiency of 2% (Fig. S23, ESI†).These efficiency values are in good agreement with short-termmeasurements, and demonstrate that the membrane is pre-venting product crossover to the anode.
TD2 was evaluated under 1 Sun illumination as a function ofelectrolyte concentration (0.1–0.5 M CsHCO3). As the electrolyteconcentration is increased, the voltage transferred to the ECcell drops from 3.5 to 3.0 V, and the current density more thandoubles from 5.4 to 13.2 mA cm�2 (Fig. 4c and Table S10, ESI†).Importantly, the faradaic efficiency for hydrogen decreasesfrom 45% to 25% over this range. As a result, the system attainsboth its highest solar to all products (8.4%) and solar tohydrocarbon and oxygenate conversion efficiency (5.6%) atthe highest electrolyte concentration, 0.5 M CsHCO3 (Fig. 4eand Fig. S25; Table S11, ESI†). This conversion efficiency, aswell as those obtained from TD1 over a range of illuminationconditions, greatly exceeds the solar conversion efficiency ofnatural photosynthesis, which is estimated to be about 1%.28
ExperimentalChemical and materials
All materials were used as received unless otherwise specified.Cesium carbonate (Cs2CO3, ACS Z99.995%) was purchased
from Sigma-Aldrich. Copper foil and silver foil (0.1 mm thick,Cu and Au, each 99.999% metal basis) were purchased fromAlfa Aesar. Carbon dioxide (CO2, 99.995%), nitrogen (N2,99.999%), helium (He, 99.999%), and hydrogen (H2, 99.999%)were purchased from Praxair. Electrolyte solutions were pre-pared with 18.2 MO deionized water from a Millipore system.CsHCO3 electrolyte solutions (0.1–0.5 M) were prepared byvigorously bubbling (0.05–2.5 M) Cs2CO3 solutions with CO2
gas for a few minutes to achieve the desired pH. Copper sulfate(CuSO4, ACS Z99.99% trace metal basis), zinc nitrate hexahydrate(Zn(NO3)2�6H2O, Reagent Grade Z98%), hexamethylenetetramine(C6H12N4, ACS Z99.0%), ethanolamine (NH2OH, ACS Z98%),2-methoxyethanol (CH3OCH2CH2OH, Z99%), hydrogen peroxidesolution (H2O2, 30 wt%), oxalic acid (C2H2O4, anhydrous,Z99.0%), sulfuric acid (H2SO4, Z99.0%), and potassium carbonate(K2CO3, ACS Z99.995%, trace metal basis) were purchased fromSigma-Aldrich. Zinc acetate (ZnC4H6O4, anhydrous, Z99.98%,metal basis) and iridium chloride (IrCl4, Z99.95%, metal basis)were purchased from Alfa Aesar.
Cathode preparation
Silver foil was cut into 2 cm squares and cleaned by sonication for15 min in acetone, isopropanol, and deionized (DI) water. Silver foilelectrodes were sanded with increasing grades of sandpaper from1200 to 2500 grit and then mechanically polished with five-micronsize alumina nanoparticles (TED Pella Inc., product no. 895-6-18).
Fig. 4 Solar-driven CO2 RR measurements performed in a two-electrode configuration with a CuAg nanocoral cathode and an IrO2 nanotube anode intandem with two series-connected solar cells and an MPP tracker. (a) Schematic of solar CO2 reduction system, where larger +/� indicates voltageupconversion and thinner wires reflect reduced current. (b) Measured current density of TD1 under various electrolyte conditions as a function ofillumination. (c) Measured current density (left axis, red) and voltage (right axis, blue) of TD2 as a function of electrolyte concentration at 1 Sunillumination. Inset depicts the TD2 circuit diagram. (d) Solar to hydrocarbon and oxygenate conversion efficiency of TD1 as a function of illumination.(e) Solar to hydrocarbon and oxygenate conversion efficiency of TD2 as a function of electrolyte concentration at 1 Sun illumination.
Paper Energy & Environmental Science
Publ
ishe
d on
31
Aug
ust 2
017.
Dow
nloa
ded
by U
nive
rsity
of
Cal
ifor
nia
- B
erke
ley
on 2
0/09
/201
7 16
:52:
33.
View Article Online
This journal is©The Royal Society of Chemistry 2017 Energy Environ. Sci.
The mechanically-polished silver foils were degreased in 0.1 M HClfor 5 min to remove the undesired oxide layer and finally washed inDI water for 45 min. An aqueous solution of 0.1 M copper sulfatewas prepared and maintained at pH 1 by adding sulfuric acid priorto electrodeposition. The nanocoral CuAg bimetallic cathode wasfabricated by a two-electrode electrodeposition method. A Tefloncell was used for electrodeposition, in which the silver foil was theworking electrode and a Pt mesh was used as the counter electrode.The electrodeposition process was performed at a high constantcurrent of 400 mA for 10 s. After electrodeposition, the CuAgcathode was washed in DI water and dried with a gentle nitrogenstream. Under high current density conditions, the competitivereaction of hydrogen evolution forms a bubble template, whichdefines the nanocoral morphology and also controls the amountof silver deposited at the surface.
For comparison, we synthesized an oxide-derived coppercathode following the method of Li et al.29 Copper foil wascut into 2 cm squares and cleaned by degreasing for 30 min inacetone, isopropanol, and DI water. The electrodes were thenelectropolished in concentrated phosphoric acid at a potentialof 2.0 V for 5 min with a copper-foil counter electrode. Theelectro-polished Cu foils were rinsed with DI water and driedwith a stream of nitrogen. Finally, the Cu foils were annealed at500 1C for 2 h to obtain oxide-derived copper cathodes.
IrO2 anode preparation
We prepared high surface area IrO2 by adapting and modifyingthe procedure of Zhao et al.25 Instead of drop casting, we grewthe sacrificial template with hydrothermal synthesis, whichproduced better uniformity. We performed hydrothermal growthof both TiO2 and ZnO templates. However, we found that we werenot able to completely remove the TiO2 template after IrO2
deposition whereas the ZnO nanorods could be etched easilywith dilute perchloric acid. We prepared iridium foil and FTO-coated glass substrates by sonication for 15 min in acetone,isopropanol, and DI water. Iridium foil was prepared by sandingwith increasing grades of sandpaper from 1200 to 2500 grit andthen degreased in 0.1 M HCl for 5 min to remove the undesiredoxide layer and finally rinsed in DI water for 45 min. FTO-coatedglass substrates were ultrasonicated for 15 min in soap solution,decon solution, DI water, acetone, and 2-methoxyethanol. Thesesubstrates were dried with a nitrogen stream. The ZnO templatewas prepared by adapting a previously-reported two-stepmethod.30 First, a seed layer of ZnO was deposited by spincoating a solution of 0.1 M zinc acetate, 0.05 M ethanolamine,and 2-methoxyethanol. Two spin-coating depositions were per-formed: first at 500 rpm for 5 s and then at 3000 rpm for 30 s,followed by annealing at 350 1C for 5 min. This procedure wasrepeated three times to obtain the desired thickness of the ZnOseed layer. Finally, ZnO nanorods were grown on seed layercoated substrates via hydrothermal synthesis. In short, anaqueous solution of 30 mM zinc nitrate and 15 mM hexam-ethylenetetramine were poured into a Teflon liner with the FTOsubstrates and Ir foil and then heated at 95 1C for 6 h. After-wards, the hydrothermally-grown ZnO nanorod samples wererinsed with DI water and blow dried with nitrogen.
The iridium oxide precursor solution was prepared in 4 steps:(i) 50 mL of 0.005 M iridium chloride aqueous solution (darkbrown) was stirred for 30 min; (ii) 0.5 mL hydrogen peroxide(30 wt%) was added slowly and stirred for 15 min until thesolution color turned from light brown to yellowish; (iii) 250 mgoxalic acid was mixed in the solution while, over 15 minutes, thesolution turned to a light yellowish color; (iv) potassium carbonatewas slowly added to change the pH to B10. We aged the solutionfor three days until the solution turned a purple or blueish color.Electrodeposition of IrO2 was performed in a three-electrodeconfiguration, with FTO/Ir foil used as the working electrode,Ag/AgCl as the reference electrode, and Pt wire as the counterelectrode. A cyclic voltammetry scan from 0 to 0.6 V vs. Ag/AgClwas repeated 30 times at a rate of 50 mV per second. Afterelectrodeposition, the samples were soaked for 10 min in0.01 M perchloric acid to etch the ZnO layer. Finally, theiridium oxide (IrO2) nanotube array was washed with DI waterand blow dried with nitrogen. The morphology of the IrO2 and theabsence of ZnO was confirmed with SEM and EDX measurements.
Testing of cathodes and anodes
The CO2 RR activity of CuAg cathode was tested in a three-electrode configuration at a fixed potential of �1.0 V vs. RHE in0.2 M CsHCO3 electrolyte (pH = 7.1) in a sandwich-type polyetherether ketone (PEEK) cell purged with CO2 at 5 sccm. IrO2 andAg/AgCl were used as counter and reference electrodes, respectively.The �1.0 V vs. RHE potential was chosen based on literature valuesin order to optimize the C2+ product selectivity.16,31,32
Current–voltage measurements were carried out for IrO2
nanotube anodes in a three-electrode configuration, with platinumfoil as the counter electrode, Ag/AgCl as the reference electrodeand IrO2 nanotubes as the working electrode. The three-electrodeJ–V measurements were performed in different concentrationsof CsHCO3 electrolyte (0.1–0.5 M). Applied voltages vs. Ag/AgClwere converted to RHE scale using the Nernst equation. TheIrO2 nanotubes on Ir foil (Ir/IrO2) exhibit superior performanceto IrO2 nanotubes on Ti foil (Ti/IrO2) and to IrO2 nanotubes on aFTO substrate.
Electrochemical cell and measurement of gas and liquidproducts
The compression cell and product measurement protocol usedin this work have been described in detail previously;24 therefore, asummary will be given here. We cleaned the sandwich cell in aquaregia or nitric acid and DI water before every measurement andeach measurement was repeated several times. All the gaseousproducts were measured with an inline GC (SRI 8610C) and liquidsamples were collected after GC measurements and fed to thehigh-performance liquid chromatograph (HPLC) for liquidproducts analysis.
Power matching electronics
Coupling of two Si PV cells in series to the electrochemical cellwas accomplished with an MPP tracker (Texas InstrumentsBQ25504EVM-674 board with integrated inductive boost converter)which, as received, can supply voltages up to 2.9 V from a minimum
Energy & Environmental Science Paper
Publ
ishe
d on
31
Aug
ust 2
017.
Dow
nloa
ded
by U
nive
rsity
of
Cal
ifor
nia
- B
erke
ley
on 2
0/09
/201
7 16
:52:
33.
View Article Online
Energy Environ. Sci. This journal is©The Royal Society of Chemistry 2017
0.9 V input. The output voltage was adjusted to suit our targetvoltage range by replacing the fixed feedback resistor (5.9 MO)on the board with an adjustable potentiometer (3–7 MO).
The four terminal III–V/Si tandem solar cells were interfacedto two modified MPP trackers. One MPP tracker was connectedwith two outer (top) series-connected III–V absorbers, whileother MPP tracker was connected to the two bottom Si absorbers.These two MPP circuits were connected in parallel to each otherand to the electrochemical cell to provide constant voltage. Weused two MPP trackers to avoid spectrum mismatch between thetop and bottom absorbers (see solar to hydrocarbons discussionin the ESI† for details).
Solar-driven CO2 reduction cell
Solar-driven measurements of TD1 and TD2 were conducted bya calibrated xenon lamp equipped with AM 1.5G and AM0filters. Optical neutral density filters were used to control theillumination intensities (see solar to hydrocarbons in ESI† fordetails). A pyranometer (SolarLight Co. Inc., Model: PMA2144)was used to calibrate the power density for different opticaldensity filter configurations. A certified silicon solar cell (New-port, Model: 91150V) was used to calibrate the light intensity.CO2 was purged continuously at a rate of 5 sccm during themeasurement.
Conclusions
The large overpotential requirements for electrochemical CO2
reduction into multi-electron products had limited the overallconversion efficiency of EC and PV–EC devices. Here, we havecritically evaluated all components of the EC cell to minimizethe voltage losses while maintaining selectivity. An electrode-posited CuAg nanocoral cathode is shown to exhibit superiorselectivity (B70%) to C1–C3 products over a wide potential andelectrolyte concentration range. A highly-active IrO2 nanotubeanode is used to reduce the overpotential required for wateroxidation. Use of MPP tracker electronics is used to keep thePV-connected EC cell within its operational window over arange of illumination conditions. Two series-connected siliconsolar cells, an MPP tracker, and an electrochemical cell incombination result in a stabilized power output and reduceCO2 into hydrocarbons and oxygenates with a maximumconversion efficiency of 3.9%, while a four-terminal tandemcell assisted device achieved a peak solar to hydrocarbon andoxygenate conversion efficiency of 5.6%. Both conversionefficiencies far exceed that for natural photosynthesis. Themodular nature of the approach we employed will allow forfurther improvements in efficiency, particularly if a cathodewhich can selectively produce hydrocarbons and oxygenates atlower overpotentials can be discovered.
Conflicts of interest
There are no conflicts to declare.
Acknowledgements
We thank Jeffrey Beeman for technical assistance with thepower-matching electronics and James Wu for providing highpurity Ir foils. This material is based on the work supported bythe Joint Center for Artificial Photosynthesis (JCAP), a DOEEnergy Innovation Hub, supported through the Office ofScience of the U.S. Department of Energy under Award NumberDE-SC0004993. The PV device selection and testing and thedesign and assembly of the power matching electronics wassupported by the Bay Area Photovoltaic Consortium underAward Number DE-EE0004946. Transmission electron microscopywas performed at the Molecular Foundry, Lawrence BerkeleyNational Laboratory, and was supported by the Office of Science,Office of Basic Energy Sciences, of the U.S. Department of Energyunder Contract No. DE-AC02-05CH11231. We thank StephanieEssig and Adele Tamboli for providing the III–V/Si tandem solarcell, which was developed as part of a collaboration between theNational Renewable Energy Laboratory (NREL), Swiss Center forElectronics and Microtechnology (CSEM) and Ecole polytechniquefederale de Lausanne (EPFL). DS acknowledges fellowship supportfrom the Hungarian American Enterprise Scholarship Fund(HAESF CIEE) and the National Research, Development andInnovation Office (NKFIH PD 121318). YL acknowledges thesupport of an A*STAR National Science Scholarship.
References
1 C. Graves, S. D. Ebbesen, M. Mogensen and K. S. Lackner,Renewable Sustainable Energy Rev., 2011, 15, 1–23.
2 S. Chu, Y. Cui and N. Liu, Nat. Mater., 2016, 16, 16–22.3 J. Ronge, T. Bosserez, D. Martel, C. Nervi, L. Boarino,
F. Taulelle, G. Decher, S. Bordiga and J. A. Martens, Chem.Soc. Rev., 2014, 43, 7963–7981.
4 J. H. Montoya, L. C. Seitz, P. Chakthranont, A. Vojvodic,T. F. Jaramillo and J. K. Nørskov, Nat. Mater., 2016, 16, 70–81.
5 J. W. Ager, M. R. Shaner, K. A. Walczak, I. D. Sharp andS. Ardo, Energy Environ. Sci., 2015, 8, 2811–2824.
6 M. A. Modestino and S. Haussener, Annu. Rev. Chem. Biomol.Eng., 2015, 6, 13–34.
7 M. Schreier, L. Curvat, F. Giordano, L. Steier, A. Abate,S. M. Zakeeruddin, J. Luo, M. T. Mayer and M. Gratzel,Nat. Commun., 2015, 6, 7326.
8 T. Arai, S. Sato and T. Morikawa, Energy Environ. Sci., 2015,8, 1998–2002.
9 X. Zhou, R. Liu, K. Sun, Y. Chen, E. Verlage, S. A. Francis,N. S. Lewis and C. Xiang, ACS Energy Lett., 2016, 1, 764–770.
10 T. Arai, S. Tajima, S. Sato, K. Uemura, T. Morikawa andT. Kajino, Chem. Commun., 2011, 47, 12664.
11 M. Schreier, L. Curvat, F. Giordano, L. Steier, A. Abate, S. M.Zakeeruddin, J. Luo, M. T. Mayer and M. Gratzel, Nat.Commun., 2015, 6, 7326.
12 M. Schreier, F. Horeguel, L. Steier, S. Ahmad, J. S.Luterbacher, M. T. Mayer, J. Luo and M. Grotzel, Nat.Energy, 2017, 2, 17087.
Paper Energy & Environmental Science
Publ
ishe
d on
31
Aug
ust 2
017.
Dow
nloa
ded
by U
nive
rsity
of
Cal
ifor
nia
- B
erke
ley
on 2
0/09
/201
7 16
:52:
33.
View Article Online

This journal is©The Royal Society of Chemistry 2017 Energy Environ. Sci.
13 J. L. Young, M. A. Steiner, H. Doscher, R. M. France,J. A. Turner and T. G. Deutsch, Nat. Energy, 2017, 2, 17028.
14 S. A. Bonke, M. Wiechen, D. R. MacFarlane and L. Spiccia,Energy Environ. Sci., 2015, 8, 2791–2796.
15 C. W. Li and M. W. Kanan, J. Am. Chem. Soc., 2012, 134,7231–7234.
16 Y. Hori, A. Murata and R. Takahashi, J. Chem. Soc., FaradayTrans. 1, 1989, 85, 2309.
17 Y. Hori, in Modern Aspects of Electrochemistry, ed.C. G. Vayenas, R. E. White and M. E. Gamboa-Aldeco,Springer, New York, New York, NY, 2008, pp. 89–189.
18 X. Feng, K. Jiang, S. Fan and M. W. Kanan, J. Am. Chem. Soc.,2015, 137, 4606–4609.
19 J. J. L. Humphrey, D. Plana, V. Celorrio, S. Sadasivan, R. P.Tooze, P. Rodrıguez and D. J. Fermın, ChemCatChem, 2016,8, 952–960.
20 A. Murata and Y. Hori, Bull. Chem. Soc. Jpn., 1991, 64, 123–127.21 M. R. Singh, Y. Kwon, Y. Lum, J. W. Ager and A. T. Bell,
J. Am. Chem. Soc., 2016, 138, 13006–13012.22 Y. Lum, B. Yue, P. Lobaccaro, A. T. Bell and J. W. Ager,
J. Phys. Chem. C, 2017, 121, 14191–14203.23 M. R. Singh, E. L. Clark and A. T. Bell, Phys. Chem. Chem.
Phys., 2015, 17, 18924–18936.
24 P. Lobaccaro, M. R. Singh, E. L. Clark, Y. Kwon, A. T. Bell andJ. W. Ager, Phys. Chem. Chem. Phys., 2016, 18, 26777–26785.
25 C. Zhao, H. Yu, Y. Li, X. Li, L. Ding and L. Fan, J. Electroanal.Chem., 2013, 688, 269–274.
26 D. T. Whipple and P. J. A. Kenis, J. Phys. Chem. Lett., 2010, 1,3451–3458.
27 S. Essig, M. A. Steiner, C. Allebe, J. F. Geisz, B. Paviet-Salomon, S. Ward, A. Descoeudres, V. LaSalvia, L. Barraud,N. Badel, A. Faes, J. Levrat, M. Despeisse, C. Ballif, P. Stradinsand D. L. Young, IEEE J. Photovoltaics, 2016, 6, 1012–1019.
28 R. E. Blankenship, D. M. Tiede, J. Barber, G. W. Brudvig,G. Fleming, M. Ghirardi, M. R. Gunner, W. Junge, D. M. Kramer,A. Melis, T. A. Moore, C. C. Moser, D. G. Nocera, A. J. Nozik,D. R. Ort, W. W. Parson, R. C. Prince and R. T. Sayre, Science,2011, 332, 805–809.
29 C. W. Li, J. Ciston and M. W. Kanan, Nature, 2014, 508,504–507.
30 Y. F. Hsu, Y. Y. Xi, A. B. Djurisic and W. K. Chan, Appl. Phys.Lett., 2008, 92, 133507.
31 A. S. Varela, M. Kroschel, T. Reier and P. Strasser, Catal.Today, 2016, 260, 8–13.
32 S. Rasul, D. H. Anjum, A. Jedidi, Y. Minenkov, L. Cavallo andK. Takanabe, Angew. Chem., Int. Ed., 2015, 54, 2146–2150.
Energy & Environmental Science Paper
Publ
ishe
d on
31
Aug
ust 2
017.
Dow
nloa
ded
by U
nive
rsity
of
Cal
ifor
nia
- B
erke
ley
on 2
0/09
/201
7 16
:52:
33.
View Article Online