Embed Size (px)
Citation preview

Energy, Environment and Global Impacts
Tai-Ran Hsu, Ph.D. ASME Fellow and Professor
Department of Mechanical and Aerospace EngineeringSan Jose State University
San Jose, California
Presented toSJSU-Classes without Quizzes
October 3, 2009

ENERGY
ENVIRONMENT& ECOLOGY
PLANET &LIVING SPECIES
SUNThe primary energy source for photosynthesis -sustaining lives
Freshair
CleanWater
Quality ofLives
Sustainable Energy and Environment
Over consumption of energy at the cost of environment and ecology will lead to the inevitable destruction of the planet – and the entire human race.

The Drastic Increase of Energy Consumers- World population explosion
The industrial revolution in 18th Century
(Machine power replacedanimal power)

Available Energies in Different Forms
● Traditional energy sources:
● Fossil Fuels:● Coal: Cheapest energy source but pollute air
- Irreversible harm to ecology (e.g., acid rain); Cost and hazard in mining.● Natural gas: Limited supply; High shipping costs; Hazard in handling.● Petroleum: Limited supply; Costly refinery; Growing demand by economically
emerging countries; Air pollution; National security concerns.
● Nuclear power: Heavy capital costs; Safety; Waste fuel treatments.
● Hydro power: Very heavy cost in construction; Limited to few sites;Socio-ecological consequences
All forms of traditional energy cause environmental and/or ecological damages.

Available Energies in Different Forms – Cont’d
● Alternative energy sources: -environmentally friendly, and some are ecologically sustainable
● Wind energy:● Current “winner” of renewable energy source● Small unit capacity, need large land area ● Unreliable and unpredictable.
● Tidal wave energy: Very small unit capacity. Limited to coastal regions.
● Solar power:● Viable with advancing technology, e.g., silicon solar PV ● About 80% of Earth surface is favorable for solar energy ● It is primarily used for heating, with fast growing application in electric power
generations (solar PV)● Current costs are NOT compatible with fossil fuels or nuclear power generations
● Fuel cells: Viable but require production and storage of hydrogen gas.
● Biofuels: Viable but requires mixing with gasoline for transportation – it is renewable, but not a clean energy source.
● Geothermal energy: Small unit capacity; Limited to certain regions on Earth.
In practice, all alternative energy can only be used as supplement to traditional energy

World Energy Consumption by Energy Sources in 2005(Including renewable energy sources)

World
Source: http://www.eia.doe.gov/oiaf/ieo/world.html
Projection of
Hea
ding
to d
isas
trou
s ec
o-en
viro
nmen
tal c
onse
quen
ces

Note: 1 quad = 1015 BTU = 2.931x10¹¹ kW-h
● Industrial sector includes electric power generation (major energy user)● Residential & commercial sector includes consumption of electricity● Significant energy consumption on transportation using mainly fossil fuels
US Energy Consumption by Sectors in 2008
(Total consumption: 99.2 quadrillion BTU)
Transportation28%
Commercial19%
Residential 22%
Industrial 31%
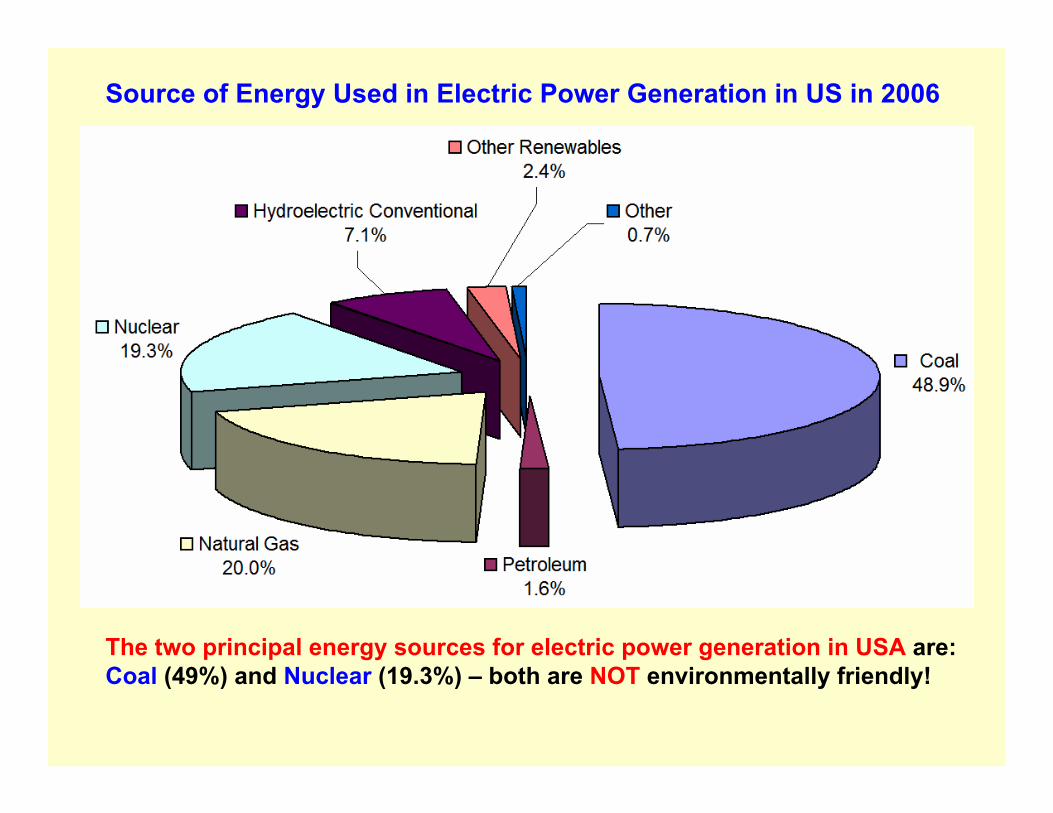
Source of Energy Used in Electric Power Generation in US in 2006
The two principal energy sources for electric power generation in USA are: Coal (49%) and Nuclear (19.3%) – both are NOT environmentally friendly!

Steam Generator
(10-storytall for 500 MW plants)
GeneratorHP LP
Condenser
FeedWaterHeater
ENERGY
Nuclear power(Nuclear fission)
Coal, oil, gas fired plant
A typical 500 MW power plant produces 1,000,000 lb/h superheated steam @ 1000oF and 2000 psi
LargeSteam Turbine
Typical Electric Power Generating Plants
WaterPumpWater
Pump
Power TransmissionGrids

Electricity Generation by Nuclear Energyusing pressurized water reactor (PWR)
NuclearReactor
Stea
m G
ener
ator Generator
Fuel and Control rods
Steam Turbine

Environmental Impacts from Electric Power Generations
Power Plants Intake Fuels Waste Emission**
Coal-fired plants Pulverized coal Residue (soot and ashes)
Flue gas withCO2, SO2, NOx
Nuclear power plants
U-238 (natural uranium for heavy water reactors)
U-235 (enriched uranium for light orpressurized waterreactors
● Spent fuels● Contaminate water
& soil by buried spent fuel storage.
● Shortest half-lifeof spent fuel is >50 years.
● Safe to public after 200+ yrs.
● May contaminate deep ground water.
Virtually none
** CO2 induce “green house effect” in Earth atmosphere Global warmingSO2 and NOx Air pollution Respirator diseases, lung cancers
and acid rain

Emissions from Energy Consumption @ Conventional Power & Combined Heat-and-Power Plants in the World (1000 metric tons)
Emission 1995 2005 % Change
CO2 2,079,761 2,513,609 +20.86
SO2 11,896 10,340 - 13.08
NOx 7,885 3,961 - 49.76
CO2 is the only gas emission that increases in an alarming rate!!
(source: Electric Power Annual, October 2006)

Human Created Air Pollution
Flue gas from a smelt plant
Smoke from chemical processing plants
Emissions from congested urban traffics

Human Created Air Pollution
Smog in Cairo, Egypt
Smog in Los Angeles, California
Smog in Beijing, China

The Deadly Air PollutionThe horrible statistics:● 310,000 premature deaths in Europe from air pollution annually
(Wikipedia encyclopedia)● 2 million premature deaths in the world from air pollution annually
(WHO, October 2006)
Sources of air pollution:● Emission from combustion of fossil fuels● Emissions consisting of:● Suspended particles (soot, smoke, dust and liquid droplets)● CO2 and CO● SO2 , NO2 and NO
Diseases caused by polluted air:● Asthma● Bronchitis● Emphysema● Lung and heart diseases● Respiratory allergies● Birth defects

Global Warming
Induced by greenhouse gas emitted by combusting fossil fuels with:
CO2, CH4, NOx, Sulfurhexa fluouride HFCs and PFGs
CO2 is the main contributing emission to global warming
Coal Oil Natural Gas Nuclear
CO2 2249 1672 1135 0
SO2 13 12 0.1 0
NOx 6 4 1.7 0
Emission levels in production of electricity by different fuels in 2005 (lb/MWh)
Source: www.epa.gov/clean energy/impact
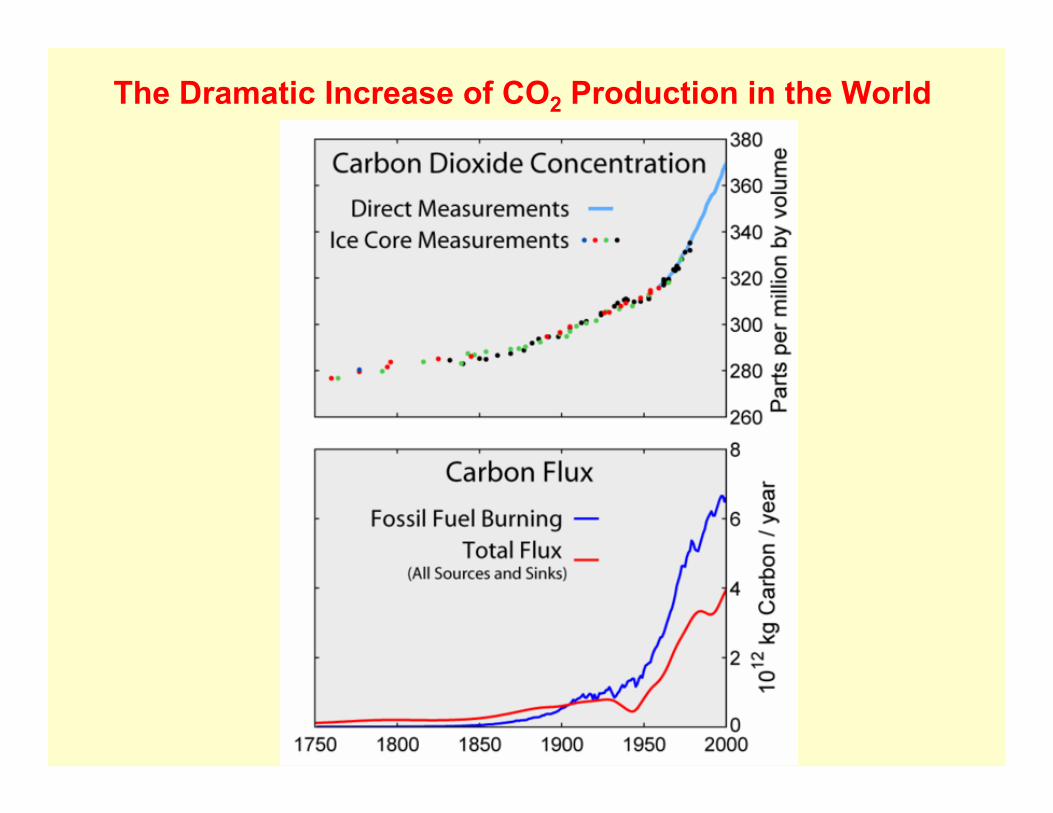
The Dramatic Increase of CO2 Production in the World

CO2 Emission by Sectors in USA in 2006(Total emission: 6,000x106 metric tons)
Transportation32%
Commercial4%
Electric generation
39%
Industrial18%
Residential7%
● Electricity generation and transportation emit most of the CO2 produced in USA

Climate models referenced by the IPCC (Intergovernmental Panel on Climate Change) projects that global surface temperatures are likely to increase by 1.1 to 6.4 °C (2.0 to 11.5 °F) between 1990 and 2100.
Global Warming by CO2 Emission

Devastating Consequences of Global Warming
● Sea level rise: ● Flood coastal regions and islands sinking.● Sea level has risen 130 mm since last
ice age (18000 yrs ago). Rises 1 to 2 mm/yr since 1900, increased to 3.1+0.7 mm/yr since 1993!
● Extreme weather with dramatic increase in tropical cyclones
● Significant change of precipitations: freezing rain, drizzle, snow and hailresult in irregular fresh water supply in the World
● Crop yield with reduced agricultural output
● Glacier retreat with destroying ecological balance
● Species extinction: 15-37% of known species will be extinct by 2050
● Dramatic increase in diseases and epidemics: e.g., malaria spread byanopheles mosquitoes
The melting of polar ice caps

● USA is the leader in contributing to CO2 release among developed countries● China now is the leading country in emitting CO2 to atmosphere causing
global warming
Top 10 CO2 Emitting Countries in the World (2006)
01000200030004000500060007000
China USARuss
iaInd
iaJa
pan
German
y
UKCana
daKore
aIta
lyCO2 E
mis
sion
s (1
06 met
ric
tons
)
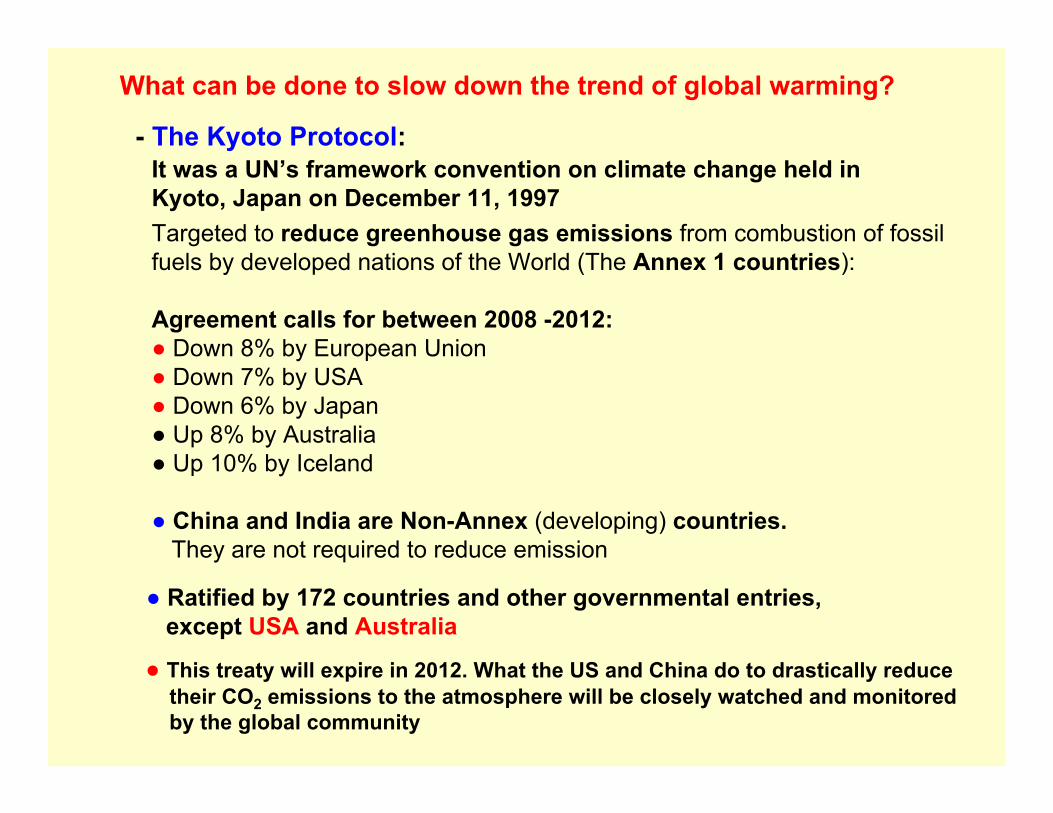
What can be done to slow down the trend of global warming?
- The Kyoto Protocol:It was a UN’s framework convention on climate change held in Kyoto, Japan on December 11, 1997 Targeted to reduce greenhouse gas emissions from combustion of fossil fuels by developed nations of the World (The Annex 1 countries):
Agreement calls for between 2008 -2012:● Down 8% by European Union● Down 7% by USA● Down 6% by Japan● Up 8% by Australia● Up 10% by Iceland
● China and India are Non-Annex (developing) countries. They are not required to reduce emission
● Ratified by 172 countries and other governmental entries, except USA and Australia
● This treaty will expire in 2012. What the US and China do to drastically reducetheir CO2 emissions to the atmosphere will be closely watched and monitoredby the global community

Another way to slow down the trend of global warming:- Use biofuels over fossil fuels
Biofuels: Converting biomass, e.g., corns, soy beans or sugar canes into liquid fuels for electric power generations and transportation
Types of biofuels:
● Ethanol: Extracted from corn or soybeans. Mixture of 80% ethanol with 20% gasoline for transportationEnvironmental impacts: Reduced emission but disturbing food supply chains. Annual disappearance of rain-forests in Brazil (the leader in biofueluser in the world) for producing biofuel is equivalent to the landarea of the state of New Jersey – a major ecological concern.
● Biodiesel: Extracted from combined alcohol (methanol) with vegetableoil, animal fat and recycled cooking grease.Positive environmental impact: Reduced but not eliminating emissions
● Biofuels emit very little CO2 but with CO, SO2 and NOx in their emissions.They contribute little in greenhouse gases, but pollute air.

Ultimate solution to global warming:
Substitute energy usage from fossil fuels with clean, green and renewable energies
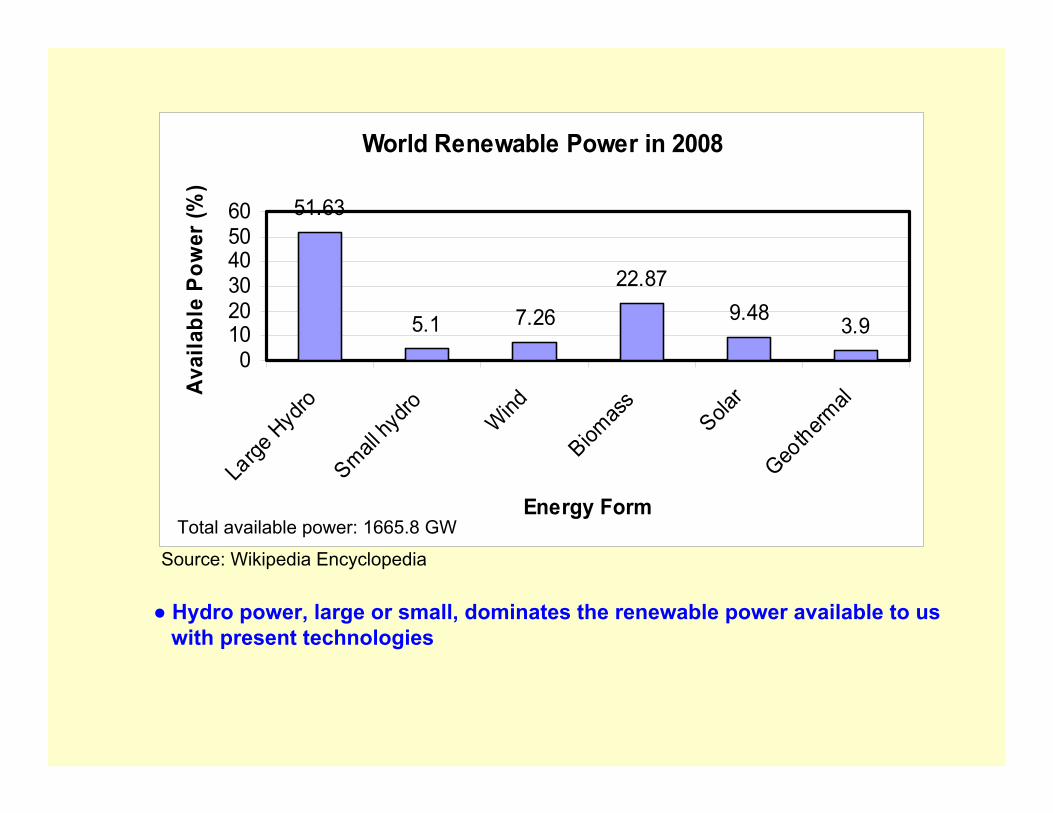
Source: Wikipedia Encyclopedia
World Renewable Power in 2008
51.63
5.1 7.26
22.879.48 3.9
0102030405060
Large
Hyd
roSmall
hydro Wind
Biomas
s
Solar
Geotherm
al
Energy Form
Avai
labl
e P
ower
(%)
Total available power: 1665.8 GW
● Hydro power, large or small, dominates the renewable power available to uswith present technologies

World Electric Power Generation by Renewable Sources in 2008
81.42
11.5 8 4.9 1.23 0.950
20406080
100
Large
hydro Wind
Small
hydro
Biomas
s
Solar P
VGeo
thermal
Energy Form
Pow
er G
ener
atio
n (%
)
Total power generation: 1056.3 GWSource: Wikipedia
● Clean renewable solar and wind power have a long way to become significantpower sources

Economics of Electricity Generation by Renewable Energy (c/kWh)Cost in 2001 Cost in Future (?)
Wind 4 to 8 3 to 10
Solar PV 25 to 160 5 to 25
Large Hydro 2 to 10 2 to 10
Small Hydro 2 to 12 2 to 10
Geothermal 2 to 10 1 to 8
Biomass 3 to 12 4 to 10
Coal 4
● “Dirty” coal still is by far the cheapest energy source ● Hydro energy is clean and cheap, but requires enormous capital to build
and it has significant impact on ecology (e.g., the Mega 3-gorge of Yangtze River hydro station in China). It is available in certain parts of the world
● Biomass emits to atmosphere, and geothermal is limited to geographical locations● The only Clean and green (ecologically sustainable) energy sources: Sun and Wind

Source: Wikipedia
“Wind 2030” – a noble US national goal:To generate 20% of electricity by windpower by Year 2030
121 GW in world29 GW in USA
● The potential for wind power generations on high rise buildings has been advocated by: Mayor Bloomberg of New York (2008) and Mayor Newson of San Francisco (2009)
● The required technology is currently being developed by Prof. T.R. Hsu and his students at the San Jose State University

Silicon Solar Photovoltaic for Electric Power Generation
The PV Cells are made of:
n-silicon wafer
p-silicon waferJunction (dielectric)
-+ +++++++ + + + +------- - - - - -
Electric field with 2 electrodes (like a battery):
- -- - - - - -- -Extra electrons:
(with excessive electrons)
(atoms with “holes” createdby the deficit in electrons)
The p- and n- silicon wafers (≈ 160 µm thick) are produced by “doping”processes, e.g., ion implantation or diffusion, as in semiconductor industry
Another US noble Goal:10% of electricity in the US will be generated by solar PV by 2030

Electricity Generation by Silicon Photovoltaic
-+ +++++++ + + + +------- - - - - -- -- - - - - -- -Extra electrons:
Photons from the SUN provide the input energy that drives the flow of electrons
POWER
(Flow ofelectrons= electric
current)
PV Panels for Power Generation

Recent development of solar PV Power Generations:Solar PV Power Generation by Two Silicon Valley Companies
At Google Inc. At Applied Materials, Inc.
Google Inc. Applied Materials Inc.Location Mountain View, CA Santa Clara, CA
Business line Internet servers Semiconductor and solar PV manufacturing equipment
Date of solar power installation October 2006 September 2008
Generating capacity 1.6 MW 2.1 MW
Installer Sharp Electronics SunPower Corporation
Power consumption Up to 30% power requirement
Up to 10% of power requirement
● Top US solar power generating facility in Nilles AFB in Nevada @ 14 MW with 72,000 panels

A glance at solar PV technology ● Electric power generation by solar PV in the world has shown significant increase in recent years:
● A clear trend: Generating capacity of single solar PV power plants has increased dramatically too: ● The PG&E’s Majave Park project will generate 553 MW in 2011● The First Solar’s plant in Inner Mongolia in China will generate 2 GW power in 2019
● Price for solar PV generated electricity is low, but capital and construction costs are extremely high (e.g., $100 million to produce 14 MW power at the Nellis AFB Station)
Electric Power Generation by Silicon Solar PV
0
1000
2000
3000
4000
5000
6000
7000
1975 1980 1985 1990 1995 2000 2005 2010
Year
Pow
er G
ener
atio
n, M
W
6 GW in 2008

Water – A vital resource to all species on Earth
● 41% of the world's 6.3 billion population, or 2.4 billion people, live in river basins under "water stress," meaning they are subject to frequent water shortages.
● Some 1.7 billion of these people live in "highly stressed" water basins where problems with local food production and economic development abound.
● Agriculture is society's major user of water, consuming some 70% of all water.
● Global estimates of irrigation efficiency show that around 60% of irrigation water never reaches the crop and is lost to evaporation and runoff.
● Water pollution adds enormously to existing problems of local and regional water scarcity by removing large volumes of water from the available supply.
The Chilling Facts
● Inefficient use of water in agricultural irrigation, and the worsening water pollution have resulted in fast depletion of water resource in our civilized society.

A steady decline of fresh water supply to world population:
World Renewable Fresh Water Per Capita
25000 23750 2250020000
18000 1653813571
114298929 7750 6786
05000
1000015000200002500030000
Yr 199
0Yr19
10Yr 1
920
Yr 193
0Yr 1
940
Yr 195
0Yr 1
960
Yr 197
0Yr 1
980
Yr 199
0Yr 2
000
Ava
ilabl
e Q
uant
ity (m
3 )

Water Pollution – A serious threat to environment
Major Contributors
● Industrial:● Toxic chemicals● Offensive drilling● Radioactive from discharged
water ● Domestic:● Untreated sewages● Septic tanks
● Community:● Storm drains
● Agriculture:● Runoff from farms● Fertilizers● Pesticides
● Accidents:● Spill of oil and chemicals
Heath-threatening contents
Bacteria, viruses, protozoon,microorganisms
Diseases
Typhoid and dysenteryDiarrhea and dehydrationRespiratory and skin diseases

Sustainable DevelopmentIt is a universally accepted solution to economic development of humankindfor the present and future generationsIt is a socio-economical process characterized by the fulfillment of human needs while maintaining the quality of the natural environment indefinitely
The concept came to general usage following thepublication of a 1987 report of the BrundtlandCommission established by the UN general assembly in 1983
Gro Harlem BrundtlandFormer Prime Minister of Norway
The delicatebalance of:

Sustainable Development – Cont’d
The Essence
Consumption ofRenewableResources
= Nature’s abilityto replenish
(Environmentalequilibrium)
=Steady-stateSustainability
-Good, but NOTGood enough
Consumption ofRenewableResources
< Nature’s abilityto replenish
(Environmentalrenewal)
=Desired
SustainableDevelopment
Renewable Resources
● Energy ● Air ● Water ● Soil ● Ecoforestry ● Marine lives ● Biospecies
Some Green Technologies
● Energy ● Air quality ● Water (waste treatment, recycling, management)● Reforestration and management ● Solid waste treatment and management● Sanitation ● Toxic chemical treatment and management ● Transportation● Green buildings and sustainable architecture ● Environment preservation● Renewable technology development and management ● Conservation
technologies ● Recycling

The ultimate Unlimited,
Clean and green, Renewable,
Zero-emission Energy Sources:
NUCLEAR FUSION ENERGY
or/and
HYDROGEN FUEL
An evergreen, and ever lasting
clean environment
We can do it, if we will!