Embed Size (px)
Citation preview
Energy – Page 1
Energy - Electricity & Fuel Assessment Area Twenty-four seven access to reliable energy is critical to support the power consuming buildings, equipment and vehicles that we depend upon every day. Sustaining our ability to use energy the way we do, absent a critical and deliberate effort to increase efficiency and use alternative sources, is growing ever more challenging, due to the costs to our economy, geo-political stability, and the natural environment (e.g. climate change, air pollution, natural resources extraction). These costs have long-term ramifications on the quality of life we want to maintain and pass along to future generations. Electricity and transportation together account for roughly 90 percent of Greenhouse Gas (GHG) emissions in the County. A majority of the fuels used to power homes, businesses and transport are imported either from foreign producers (oil) or other states/neighboring countries (coal and natural gas). Fossil fuel extraction, transport and combustion have an impact or can be hazardous to the health of natural systems, as well as human health. Nuclear energy, while having a small GHG footprint, has environmental impacts including water consumption and water quality, as well as the long-term contamination liability associated with nuclear waste. To realistically achieve existing sustainability goals and aspirations around climate change, local and regional economic diversification and growth and reducing demand for energy, targets and initiatives to achieve those targets will have to be determined and stakeholders will have to work together to meet those targets. SUMMARY OF KEY SUSTAINABILITY CHALLENGES Main challenges identified through collaborative stakeholder analysis of assessment data & indicators
• Ensure adequate energy supply to meet current and expected growth in demand. • Improve energy efficiency in a cost-effective manner. • Decrease peak load to reduce our reliance on relatively dirtier and less efficient power
generating fuels. • Increase the use of renewable energy resources, with a preference for local and regional
sources to support both long-term and sustainable economic development and climate-friendly energy generation.
• Obtain a breakdown of energy consumption by industry types to understand and target energy consumption reductions from the commercial sector, which is increasing at the highest rate.
• Minimize the potential environmental impacts from nuclear power generation, including water consumption and water quality as well as the long-term contamination associated with nuclear waste.
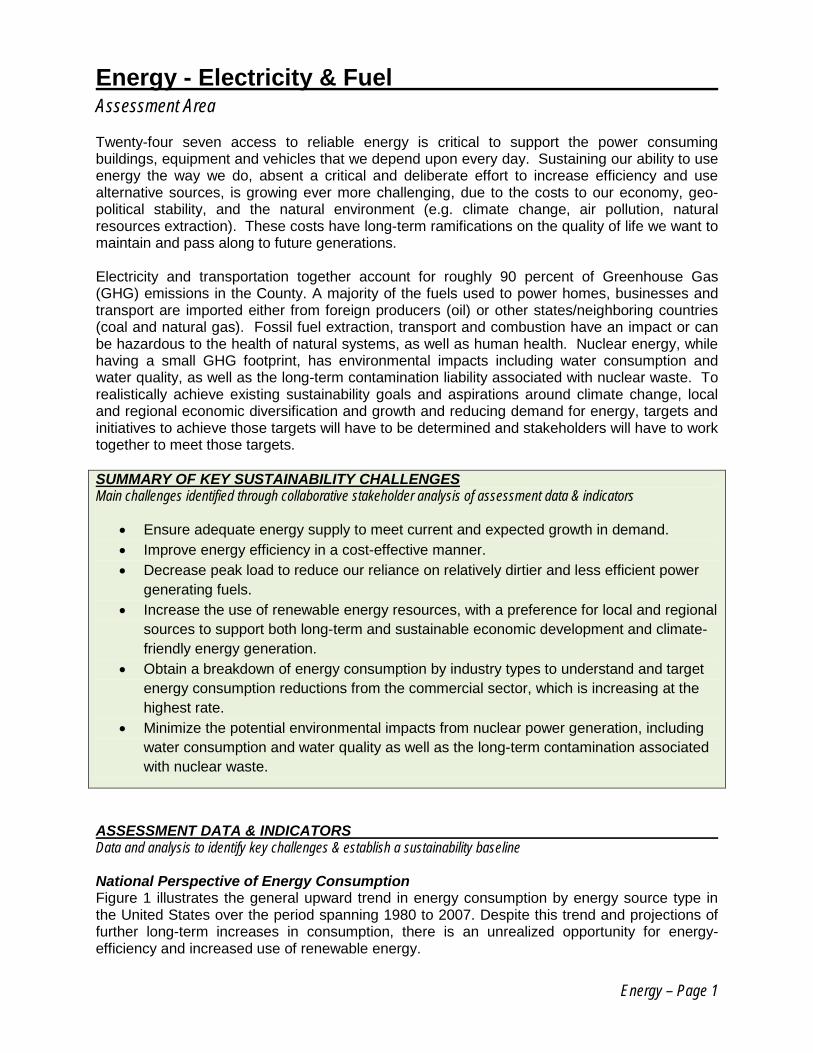
ASSESSMENT DATA & INDICATORS Data and analysis to identify key challenges & establish a sustainability baseline National Perspective of Energy Consumption Figure 1 illustrates the general upward trend in energy consumption by energy source type in the United States over the period spanning 1980 to 2007. Despite this trend and projections of further long-term increases in consumption, there is an unrealized opportunity for energy-efficiency and increased use of renewable energy.
Energy – Page 2
In a recent report by the consulting firm McKinsey, the implementation of a variety of end-use energy efficiency measures from now until 2020 is evaluated. The result is that through a $520 billion investment in energy efficiency, $1.2 trillion in savings could be accrued – for every dollar spent we gain roughly $2 in savings.i
This is a critical message to apply locally; the investing in energy efficiency and renewables now will return significant economic savings in the future, in addition to improving our economic development potential, furthering energy independence, and significantly curbing our greenhouse gas emissions. The latter is of particular importance with regards to sustainability, given that electricity and transportation together account for roughly 90 percent of our greenhouse gas emissions in the County.
State Perspective - Electricity The regional utility provider, Florida Power and Light (FPL), has indicated in its “Ten Year Power Site Plan, 2009-2018” recently filed with the State Public Services Commission (PSC), a decreased projection of electricity load growth relative to the previous year’s Site Plan due to: (1) lower forecasted rates of population growth, (2) the multi-year economic downturn, and (3) increased energy efficiency resulting from federal appliance and lighting efficiency standards. The projected increases, however, are still being characterized by the utility as “substantial” and are described in Table 1. In the long-run it can be expected that increasing funding for energy-efficiency from the federal and state government and policies that continue to increase minimum standards for energy efficiency will continue to decrease load projections. This in turn could impact the magnitude and timing of anticipated additional generation capacity.
Table 1: FPL 2008 Florida Service Area Electricity Load Summary & 2018 Projections
Source: FPL’s “Ten Year Power Site Plan, 2009-2018” filed with the State PSC
Consumption Measure 2008 Actual 2018 projection Summer Peak 21,077 MW 26,143 MW Net Energy for Load (NEL) 90,784 GW 132,136 GWH
Figure 1: US Energy Consumption: Historical Use and Projections (Quadrillion British Thermal Units (BTUs)

Energy – Page 3
A critical variable in determining load projections and generation capacity planning is the “peak” load. Peak load is defined as the maximum instantaneous load or the maximum average load over a designated time interval. Naturally, peak electricity use sets the upper boundary of energy generation capacity the utility has to be prepared to provide. According to FPL, “the rate of absolute growth in FPL system peak load has been a function of a growing customer base, varying weather conditions, projected economic growth, changing patterns of customer behavior (including an increased stock of electricity-consuming appliances), and more efficient appliances and lighting.”
The bottom line for county residents, industry and businesses is that we have to collectively look at not only our total electricity consumption, but the peak demand pressure placed on the electricity grid. Peak load also has a significant impact on electricity costs as the Utility has to transfer its increased cost of provision of peak power onto customers. Less efficient and higher polluting sources of peak power contributes to increased health and environmental impacts. FPL does utilize demand-side management (DSM) programs to help “shave” peak load and the impact of these programs are reflected in their projections. We have identified as a data gap the participation rate and energy consumption reduction information associated with FPL’s DSM programs for residential and commercial/industrial clientele and are currently pursuing the collection and compilation of this information.
Load projections are behind the specific generation capacity increases that FPL has planned. While the Utility is seeking approval for two additional nuclear plants at Turkey Point to be online by 2018, in the near term, additional power plants and expanded capacity in the Southeastern part of the state are in the works due to what FPL characterizes as the “Southeastern Imbalance” (load – generation imbalance). Essentially during peak load periods, transmission systems from outside the region have been providing a significant amount of energy capacity. This transmission of electricity from outside the region adds additional inefficiency (e.g. transmission loss) and cost for to the utility provider and ultimately to customers. FPL’s strategy to ameliorate this “imbalance” situation includes:
• Recent capacity additions at Turkey Point Unit 5, and WCEC Units 1, 2, & 3: provides lower transmission related costs,
• 2011/2012 increased nuclear generation capacity at Turkey Point, and • Riviera Plant planned capacity increases.
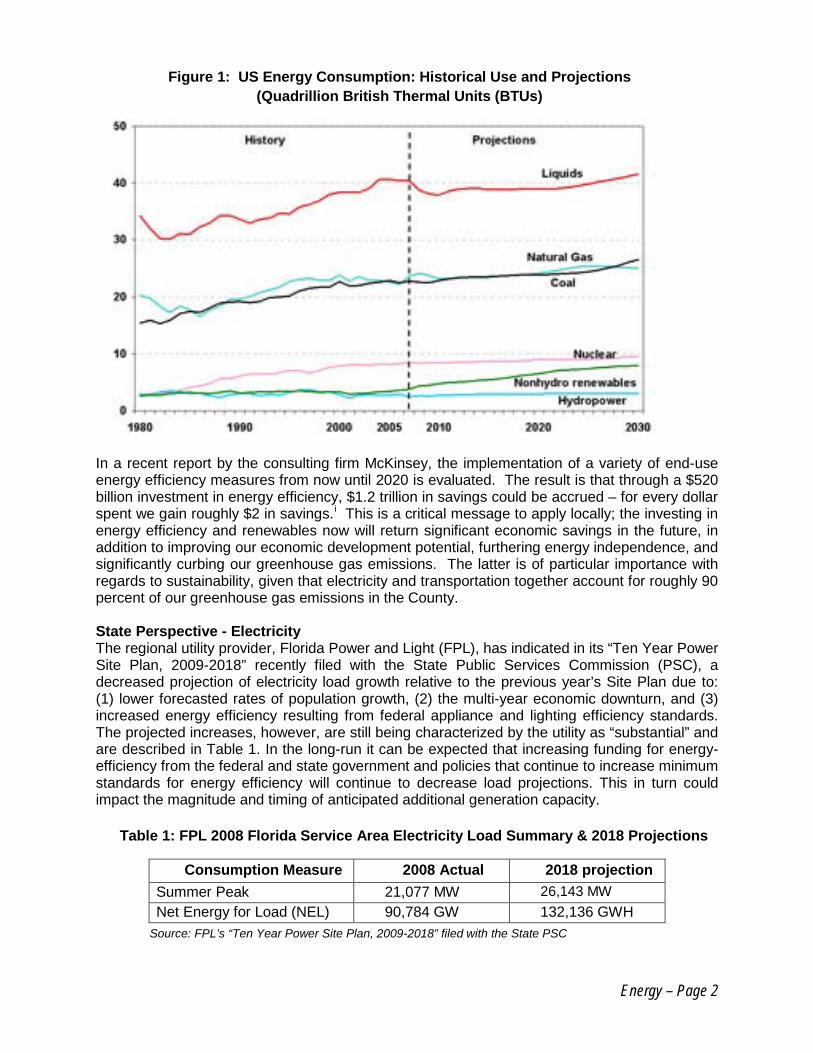
Fuel Mix, Sourcing and Energy Supply Management The electric energy relied upon results from the operation of various power plants that are themselves powered by fuels. Relative to the rest of the nation, the fuel mix (see Figure 2) that drives FPL’s energy generation activities is much less carbon intensive (referring to the carbon content of fossil fuels) with only a six percent reliance on coal versus the national average of 50 percent, and a significant reliance on natural gas, a relatively low carbon content fuel. While this fuel mix is more “climate friendly” than other fuel mix portfolios, it is still comprised of over 70 percent fossil fuels. Nuclear energy generation, while being low-carbon, has other impacts with respect to water use (quality and quantity) and the environmental impacts from the mining of uranium ore and the re-depositing of radioactive tailings. Radioactive waste is a production externality that represents a liability for humans and the natural environment now and well into the future.
Energy – Page 4
Figure 2: 2008 Florida Power and Light Fuel Mix
Our reliance on a grid-based and centralized public utility provider model for electricity supply makes us dependent on the utility for determining the fuel supply utilized in the generation of electricity.1
While efficiency is first priority in decreasing the environmental impacts and economic risk associated with electricity use, the use of distributed renewable energy systems (e.g. rooftop solar photovoltaic systems) can enable more control over what fuels energy generation at the home, business, municipality and regional levels. Many states have passed Renewable Portfolio Standards (RPS) that require a state’s fuel mix to made up of a particular percentage of renewable energy. Florida has been considering this as well. Naturally, the level of renewable energy generation activity that occurs at the home, business and local levels vs. centralized solutions impacts the extent of a community’s or individual household or business’ “energy independence”, economic diversification and share of economy that is associated with the sustainable or “green” economy.
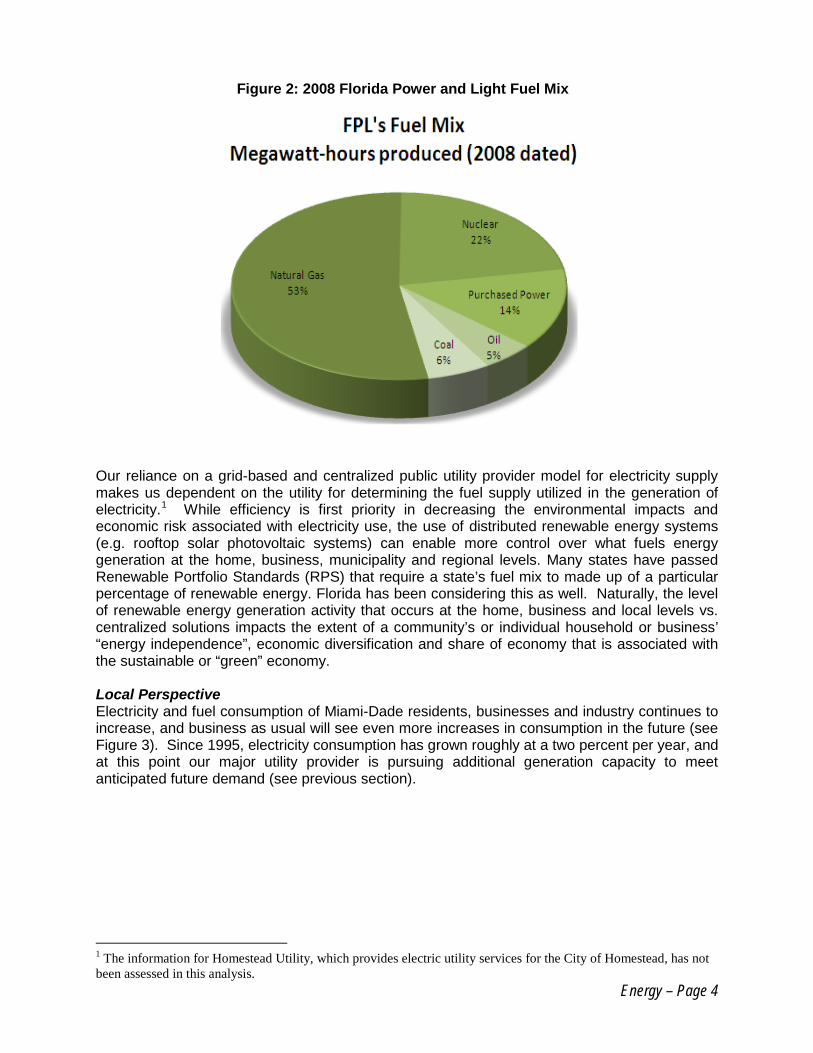
Local Perspective Electricity and fuel consumption of Miami-Dade residents, businesses and industry continues to increase, and business as usual will see even more increases in consumption in the future (see Figure 3). Since 1995, electricity consumption has grown roughly at a two percent per year, and at this point our major utility provider is pursuing additional generation capacity to meet anticipated future demand (see previous section).
1 The information for Homestead Utility, which provides electric utility services for the City of Homestead, has not been assessed in this analysis.
Energy – Page 5
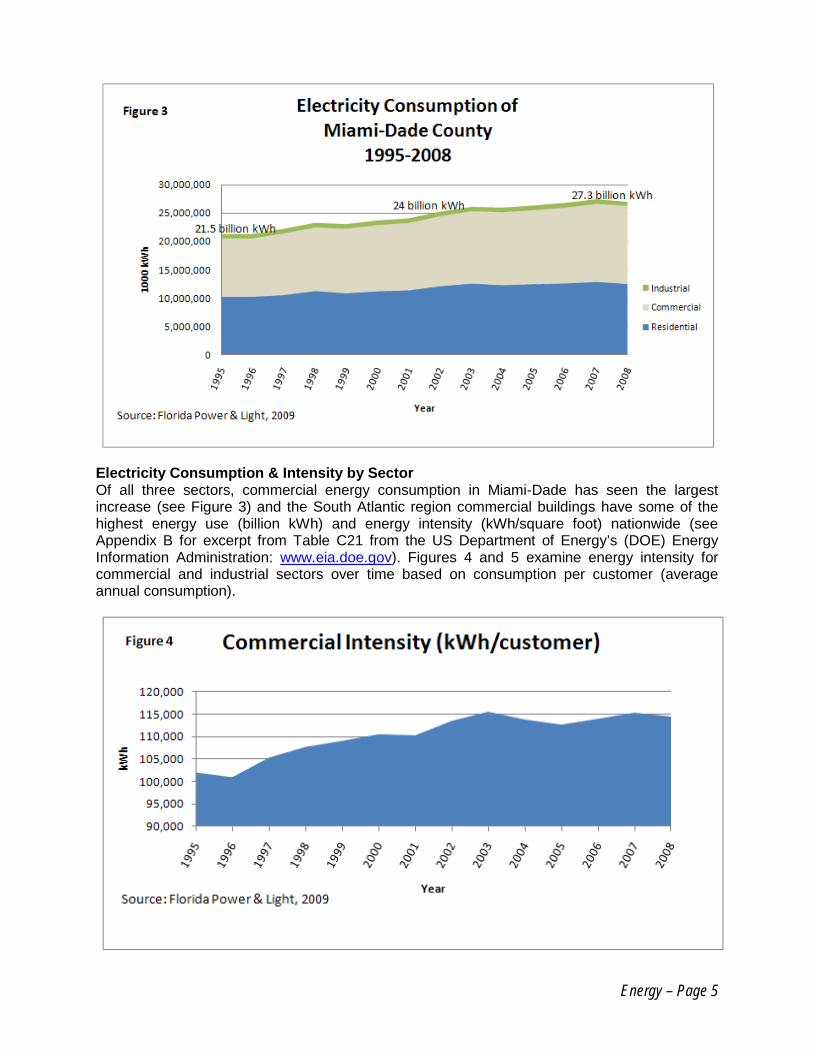
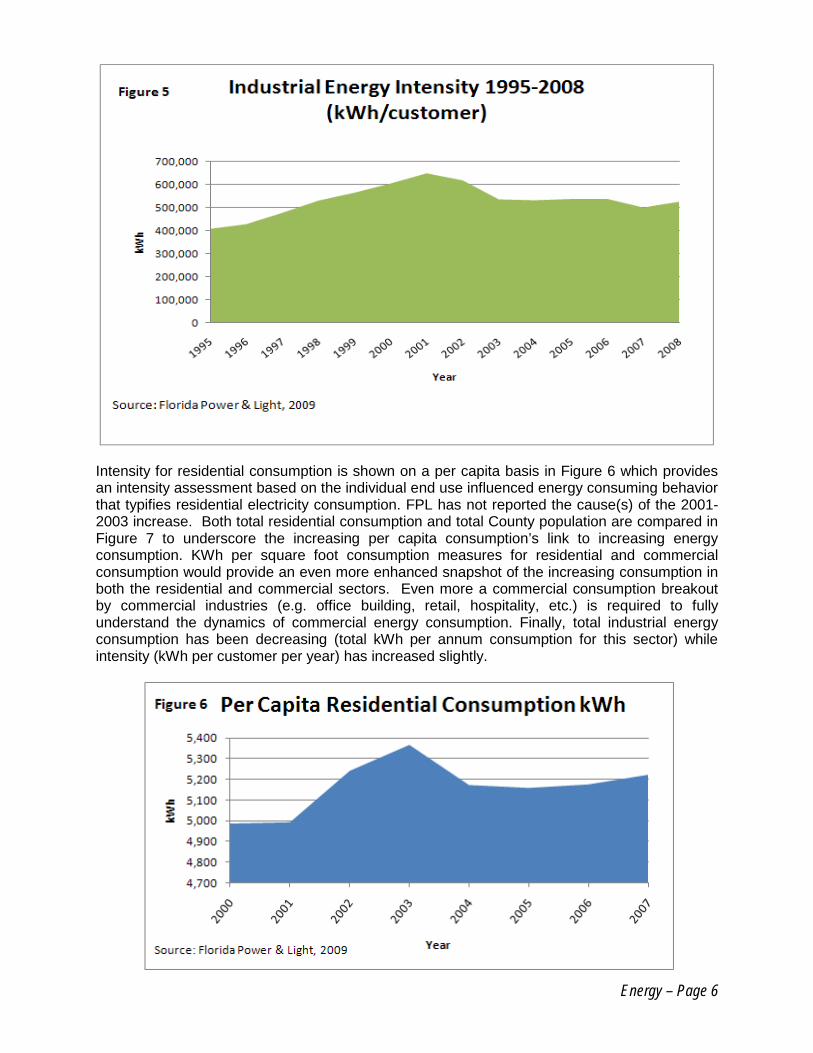
Electricity Consumption & Intensity by Sector Of all three sectors, commercial energy consumption in Miami-Dade has seen the largest increase (see Figure 3) and the South Atlantic region commercial buildings have some of the highest energy use (billion kWh) and energy intensity (kWh/square foot) nationwide (see Appendix B for excerpt from Table C21 from the US Department of Energy’s (DOE) Energy Information Administration: www.eia.doe.gov). Figures 4 and 5 examine energy intensity for commercial and industrial sectors over time based on consumption per customer (average annual consumption).
Energy – Page 6
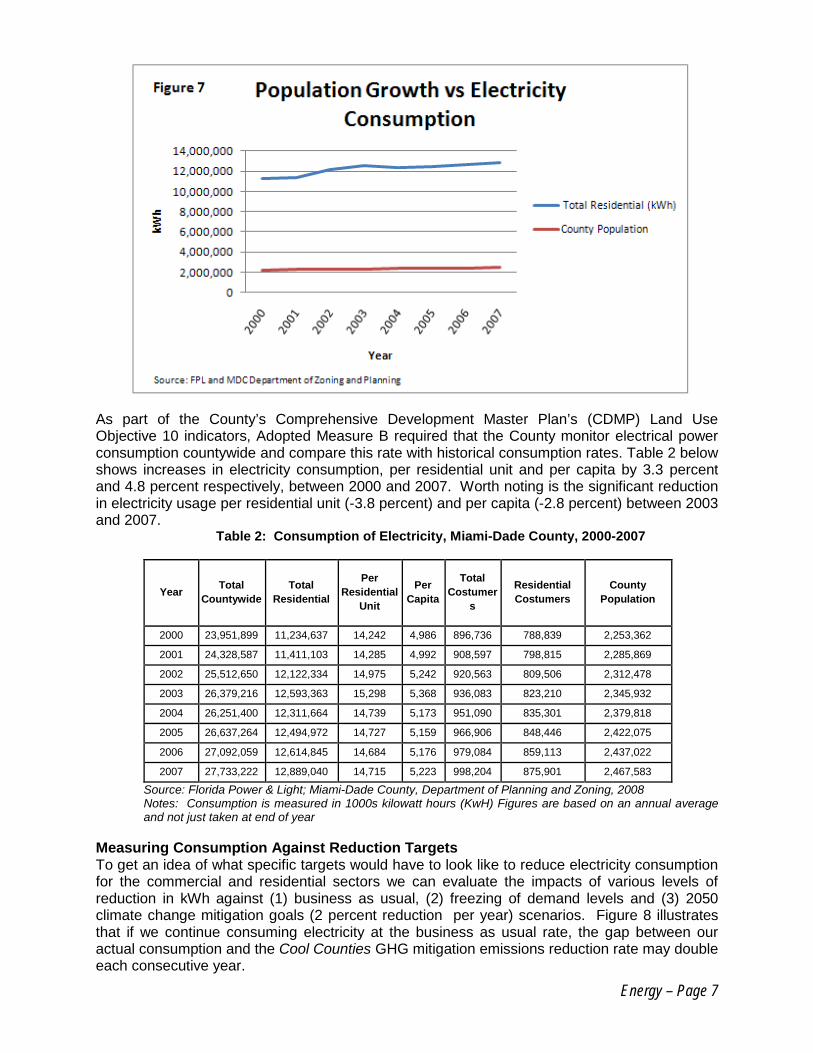
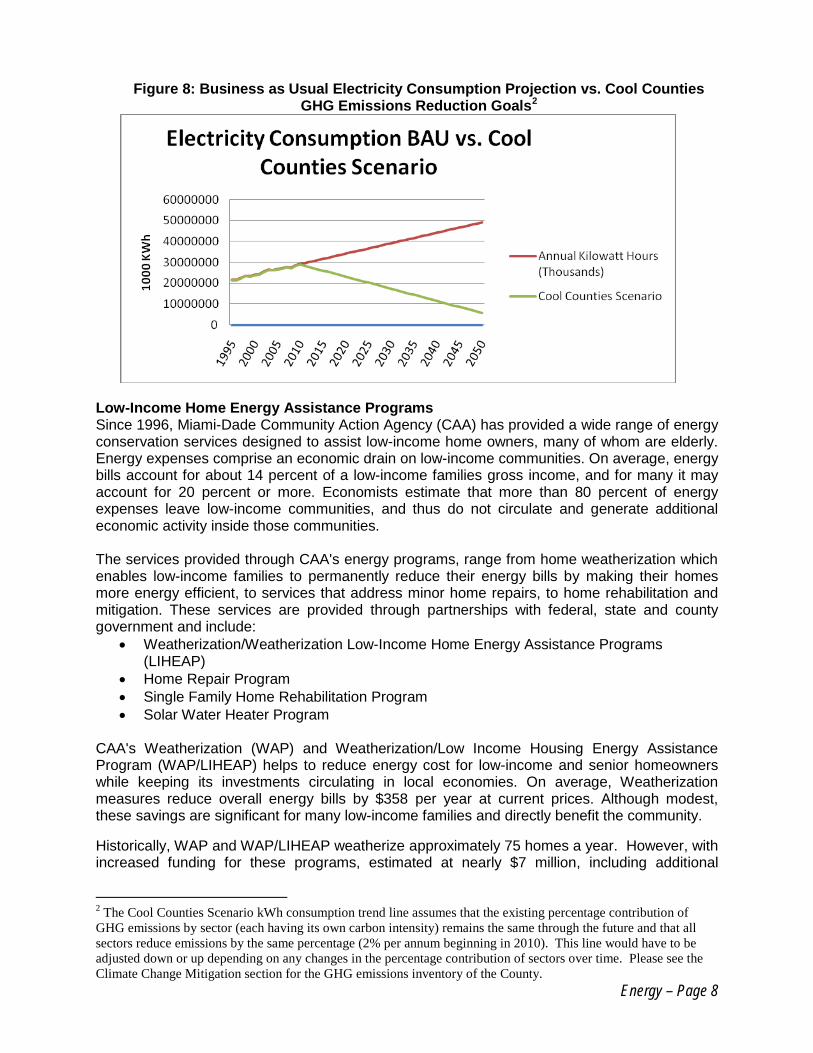
Intensity for residential consumption is shown on a per capita basis in Figure 6 which provides an intensity assessment based on the individual end use influenced energy consuming behavior that typifies residential electricity consumption. FPL has not reported the cause(s) of the 2001- 2003 increase. Both total residential consumption and total County population are compared in Figure 7 to underscore the increasing per capita consumption’s link to increasing energy consumption. KWh per square foot consumption measures for residential and commercial consumption would provide an even more enhanced snapshot of the increasing consumption in both the residential and commercial sectors. Even more a commercial consumption breakout by commercial industries (e.g. office building, retail, hospitality, etc.) is required to fully understand the dynamics of commercial energy consumption. Finally, total industrial energy consumption has been decreasing (total kWh per annum consumption for this sector) while intensity (kWh per customer per year) has increased slightly.
Energy – Page 7
As part of the County’s Comprehensive Development Master Plan’s (CDMP) Land Use Objective 10 indicators, Adopted Measure B required that the County monitor electrical power consumption countywide and compare this rate with historical consumption rates. Table 2 below shows increases in electricity consumption, per residential unit and per capita by 3.3 percent and 4.8 percent respectively, between 2000 and 2007. Worth noting is the significant reduction in electricity usage per residential unit (-3.8 percent) and per capita (-2.8 percent) between 2003 and 2007.
Table 2: Consumption of Electricity, Miami-Dade County, 2000-2007
Year Total Countywide
Total Residential
Per Residential
Unit
Per Capita
Total Costumer
s
Residential Costumers
County Population
2000 23,951,899 11,234,637 14,242 4,986 896,736 788,839 2,253,362
2001 24,328,587 11,411,103 14,285 4,992 908,597 798,815 2,285,869
2002 25,512,650 12,122,334 14,975 5,242 920,563 809,506 2,312,478
2003 26,379,216 12,593,363 15,298 5,368 936,083 823,210 2,345,932
2004 26,251,400 12,311,664 14,739 5,173 951,090 835,301 2,379,818
2005 26,637,264 12,494,972 14,727 5,159 966,906 848,446 2,422,075
2006 27,092,059 12,614,845 14,684 5,176 979,084 859,113 2,437,022
2007 27,733,222 12,889,040 14,715 5,223 998,204 875,901 2,467,583
Source: Florida Power & Light; Miami-Dade County, Department of Planning and Zoning, 2008 Notes: Consumption is measured in 1000s kilowatt hours (KwH) Figures are based on an annual average and not just taken at end of year
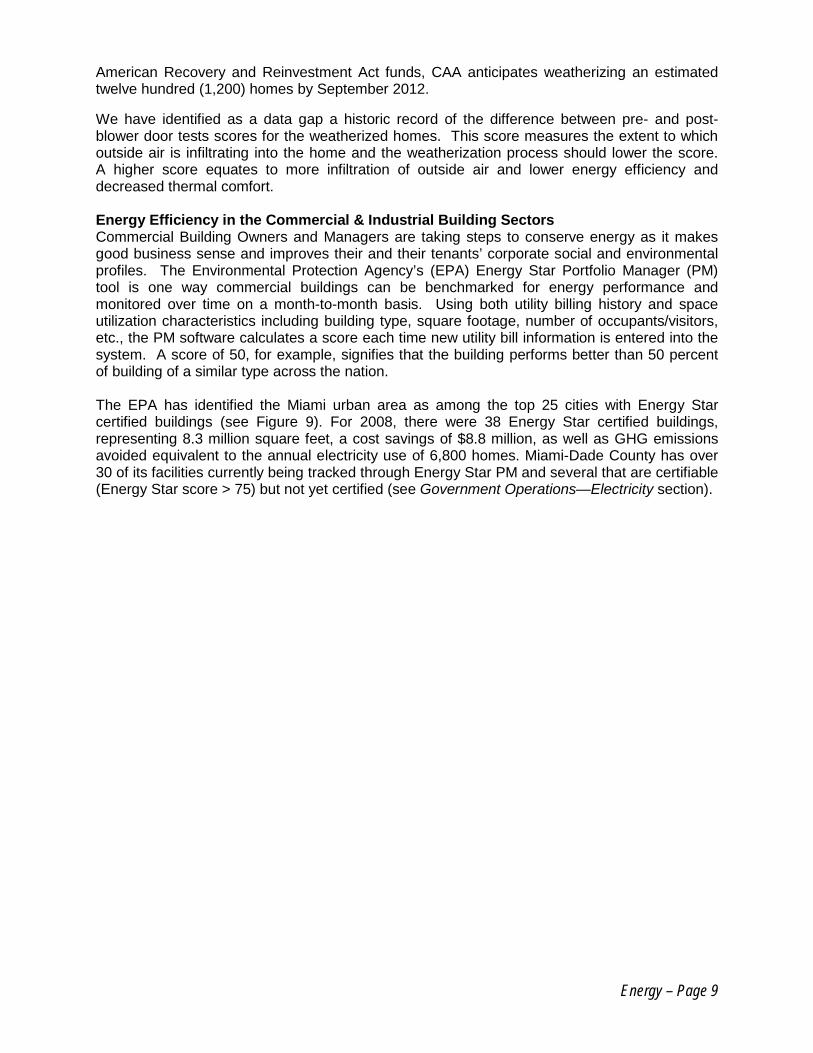
Measuring Consumption Against Reduction Targets To get an idea of what specific targets would have to look like to reduce electricity consumption for the commercial and residential sectors we can evaluate the impacts of various levels of reduction in kWh against (1) business as usual, (2) freezing of demand levels and (3) 2050 climate change mitigation goals (2 percent reduction per year) scenarios. Figure 8 illustrates that if we continue consuming electricity at the business as usual rate, the gap between our actual consumption and the Cool Counties GHG mitigation emissions reduction rate may double each consecutive year.
Energy – Page 8
Figure 8: Business as Usual Electricity Consumption Projection vs. Cool Counties
GHG Emissions Reduction Goals2
Low-Income Home Energy Assistance Programs Since 1996, Miami-Dade Community Action Agency (CAA) has provided a wide range of energy conservation services designed to assist low-income home owners, many of whom are elderly. Energy expenses comprise an economic drain on low-income communities. On average, energy bills account for about 14 percent of a low-income families gross income, and for many it may account for 20 percent or more. Economists estimate that more than 80 percent of energy expenses leave low-income communities, and thus do not circulate and generate additional economic activity inside those communities. The services provided through CAA's energy programs, range from home weatherization which enables low-income families to permanently reduce their energy bills by making their homes more energy efficient, to services that address minor home repairs, to home rehabilitation and mitigation. These services are provided through partnerships with federal, state and county government and include:
• Weatherization/Weatherization Low-Income Home Energy Assistance Programs (LIHEAP)
• Home Repair Program • Single Family Home Rehabilitation Program • Solar Water Heater Program
CAA's Weatherization (WAP) and Weatherization/Low Income Housing Energy Assistance Program (WAP/LIHEAP) helps to reduce energy cost for low-income and senior homeowners while keeping its investments circulating in local economies. On average, Weatherization measures reduce overall energy bills by $358 per year at current prices. Although modest, these savings are significant for many low-income families and directly benefit the community.
Historically, WAP and WAP/LIHEAP weatherize approximately 75 homes a year. However, with increased funding for these programs, estimated at nearly $7 million, including additional
2 The Cool Counties Scenario kWh consumption trend line assumes that the existing percentage contribution of GHG emissions by sector (each having its own carbon intensity) remains the same through the future and that all sectors reduce emissions by the same percentage (2% per annum beginning in 2010). This line would have to be adjusted down or up depending on any changes in the percentage contribution of sectors over time. Please see the Climate Change Mitigation section for the GHG emissions inventory of the County.
Energy – Page 9
American Recovery and Reinvestment Act funds, CAA anticipates weatherizing an estimated twelve hundred (1,200) homes by September 2012.
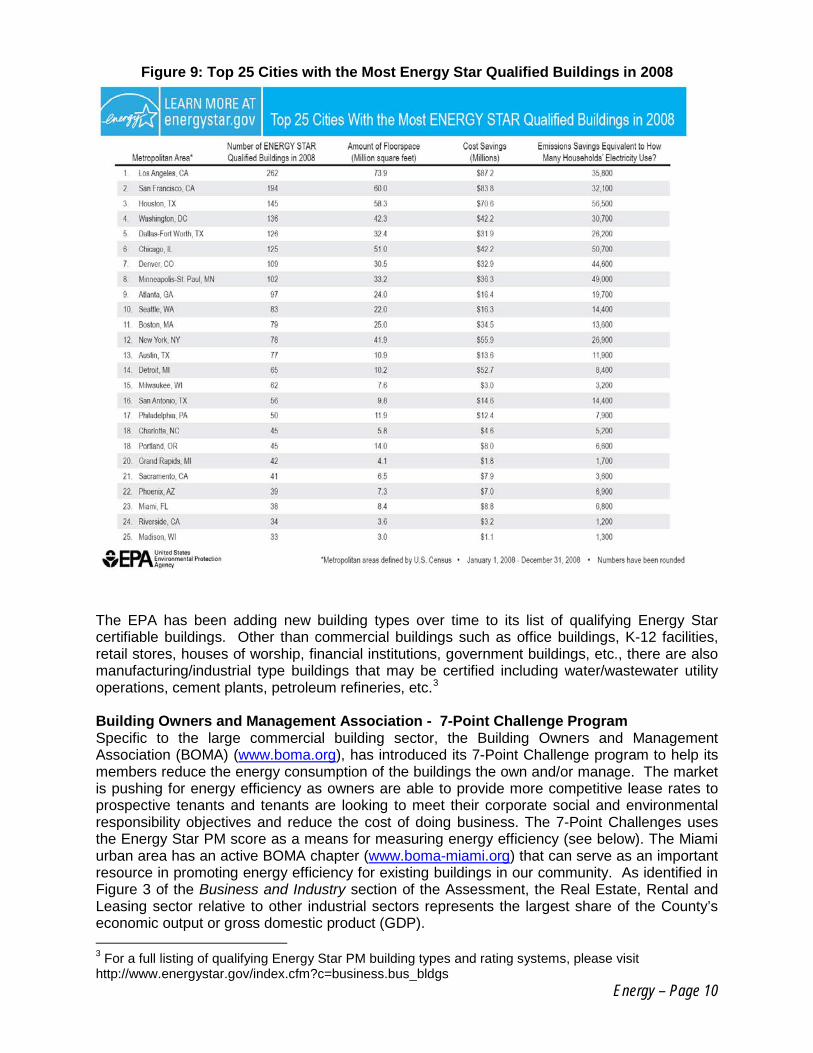
We have identified as a data gap a historic record of the difference between pre- and post-blower door tests scores for the weatherized homes. This score measures the extent to which outside air is infiltrating into the home and the weatherization process should lower the score. A higher score equates to more infiltration of outside air and lower energy efficiency and decreased thermal comfort. Energy Efficiency in the Commercial & Industrial Building Sectors Commercial Building Owners and Managers are taking steps to conserve energy as it makes good business sense and improves their and their tenants’ corporate social and environmental profiles. The Environmental Protection Agency’s (EPA) Energy Star Portfolio Manager (PM) tool is one way commercial buildings can be benchmarked for energy performance and monitored over time on a month-to-month basis. Using both utility billing history and space utilization characteristics including building type, square footage, number of occupants/visitors, etc., the PM software calculates a score each time new utility bill information is entered into the system. A score of 50, for example, signifies that the building performs better than 50 percent of building of a similar type across the nation. The EPA has identified the Miami urban area as among the top 25 cities with Energy Star certified buildings (see Figure 9). For 2008, there were 38 Energy Star certified buildings, representing 8.3 million square feet, a cost savings of $8.8 million, as well as GHG emissions avoided equivalent to the annual electricity use of 6,800 homes. Miami-Dade County has over 30 of its facilities currently being tracked through Energy Star PM and several that are certifiable (Energy Star score > 75) but not yet certified (see Government Operations—Electricity section).
Energy – Page 10
Figure 9: Top 25 Cities with the Most Energy Star Qualified Buildings in 2008
The EPA has been adding new building types over time to its list of qualifying Energy Star certifiable buildings. Other than commercial buildings such as office buildings, K-12 facilities, retail stores, houses of worship, financial institutions, government buildings, etc., there are also manufacturing/industrial type buildings that may be certified including water/wastewater utility operations, cement plants, petroleum refineries, etc.3
Building Owners and Management Association - 7-Point Challenge Program Specific to the large commercial building sector, the Building Owners and Management Association (BOMA) (www.boma.org), has introduced its 7-Point Challenge program to help its members reduce the energy consumption of the buildings the own and/or manage. The market is pushing for energy efficiency as owners are able to provide more competitive lease rates to prospective tenants and tenants are looking to meet their corporate social and environmental responsibility objectives and reduce the cost of doing business. The 7-Point Challenges uses the Energy Star PM score as a means for measuring energy efficiency (see below). The Miami urban area has an active BOMA chapter (www.boma-miami.org) that can serve as an important resource in promoting energy efficiency for existing buildings in our community. As identified in Figure 3 of the Business and Industry section of the Assessment, the Real Estate, Rental and Leasing sector relative to other industrial sectors represents the largest share of the County’s economic output or gross domestic product (GDP). 3 For a full listing of qualifying Energy Star PM building types and rating systems, please visit http://www.energystar.gov/index.cfm?c=business.bus_bldgs

Energy – Page 11
BOMA 7-POINT CHALLENGE
1. Continue to work towards a goal to decrease energy consumption by 30 percent across your portfolios by 2012 – as measured against an “average building” measuring a 50 on the ENERGY STAR® benchmarking tool in 2007.
2. At least once a year, benchmark your energy performance and water usage through EPA's ENERGY STAR benchmarking tool (and share your results with BOMA);
3. Provide education to your managers, engineers, and others involved in building operations, to ensure that equipment is properly maintained and utilized;
4. Perform an energy audit and/or retro-commissioning of your building, and implement low-risk, low-cost and cost effective strategies to improve energy efficiency with high returns;
5. Extend equipment life by improving the operations and maintenance of building systems and ensure equipment is operating as designed;
6. Through leadership, positively impact your community and your planet by helping to reduce your industry's role in global warming; and
7. Position yourself and the industry as leaders and solution providers to owners and tenants seeking environmental and operational excellence.
(Source: http://www.boma.org/getinvolved/7pointchallenge/Pages/default.aspx)
Energy – Page 12
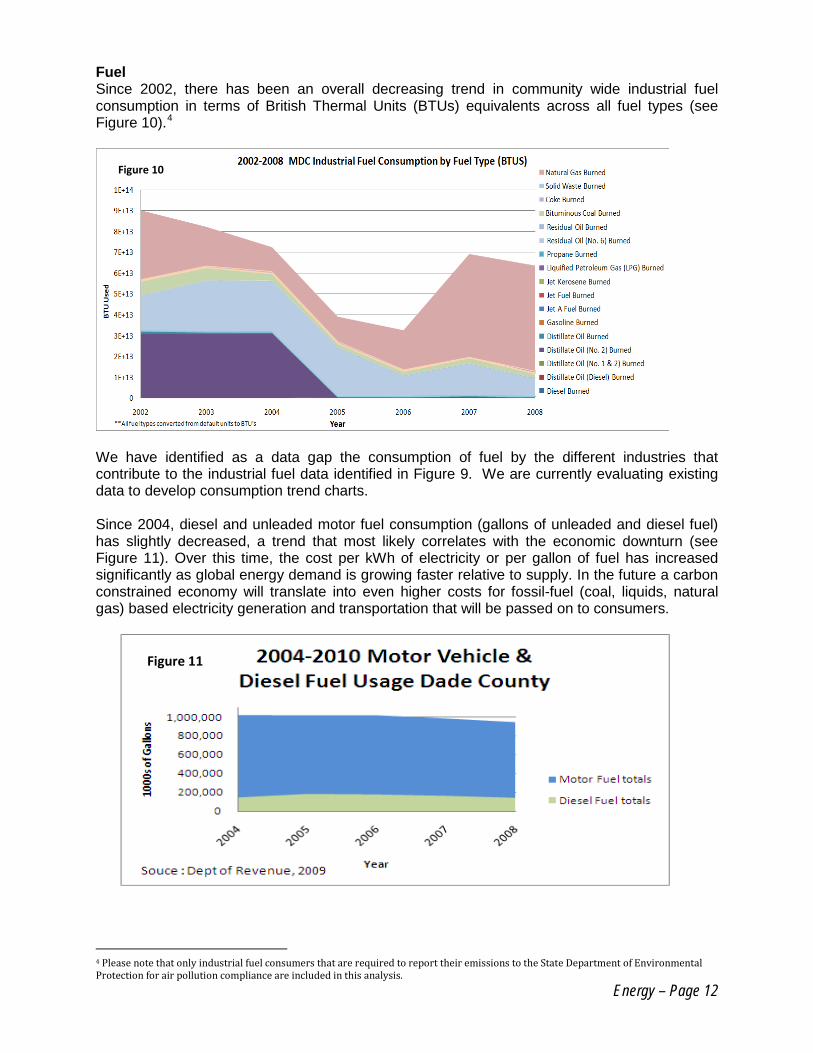
Fuel Since 2002, there has been an overall decreasing trend in community wide industrial fuel consumption in terms of British Thermal Units (BTUs) equivalents across all fuel types (see Figure 10).4
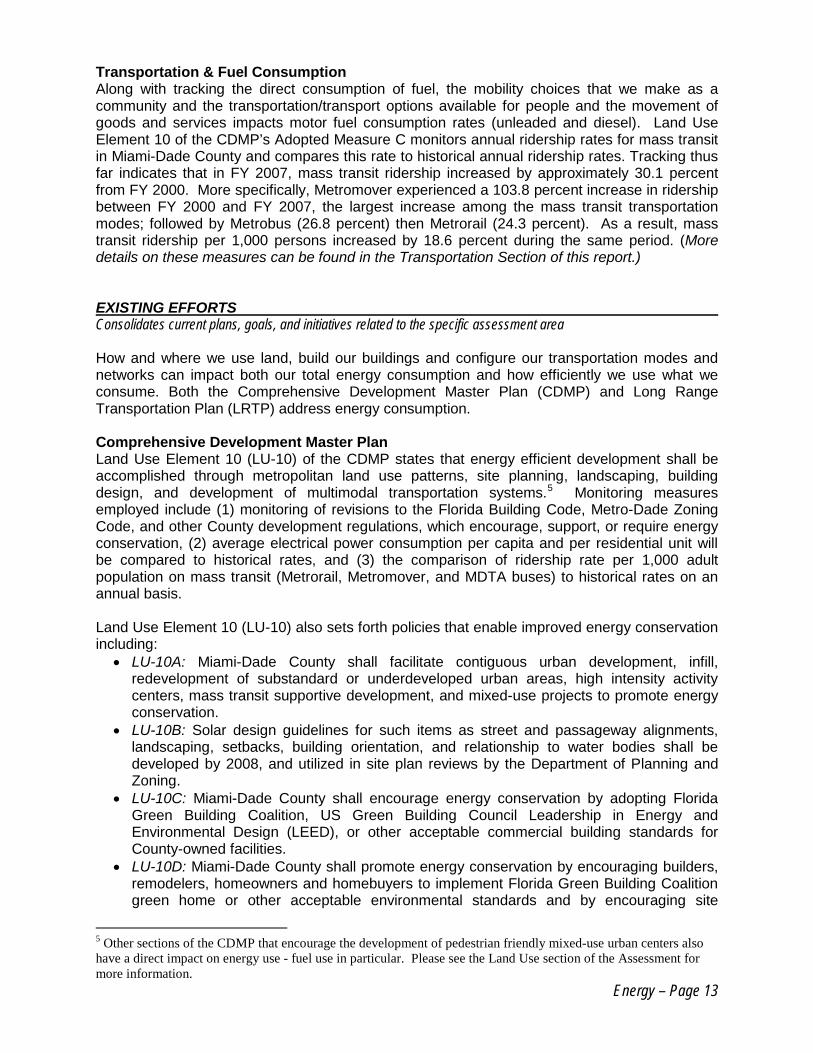
We have identified as a data gap the consumption of fuel by the different industries that contribute to the industrial fuel data identified in Figure 9. We are currently evaluating existing data to develop consumption trend charts. Since 2004, diesel and unleaded motor fuel consumption (gallons of unleaded and diesel fuel) has slightly decreased, a trend that most likely correlates with the economic downturn (see Figure 11). Over this time, the cost per kWh of electricity or per gallon of fuel has increased significantly as global energy demand is growing faster relative to supply. In the future a carbon constrained economy will translate into even higher costs for fossil-fuel (coal, liquids, natural gas) based electricity generation and transportation that will be passed on to consumers.
4 Please note that only industrial fuel consumers that are required to report their emissions to the State Department of Environmental Protection for air pollution compliance are included in this analysis.
Figure 11
Figure 10
Energy – Page 13
Transportation & Fuel Consumption Along with tracking the direct consumption of fuel, the mobility choices that we make as a community and the transportation/transport options available for people and the movement of goods and services impacts motor fuel consumption rates (unleaded and diesel). Land Use Element 10 of the CDMP’s Adopted Measure C monitors annual ridership rates for mass transit in Miami-Dade County and compares this rate to historical annual ridership rates. Tracking thus far indicates that in FY 2007, mass transit ridership increased by approximately 30.1 percent from FY 2000. More specifically, Metromover experienced a 103.8 percent increase in ridership between FY 2000 and FY 2007, the largest increase among the mass transit transportation modes; followed by Metrobus (26.8 percent) then Metrorail (24.3 percent). As a result, mass transit ridership per 1,000 persons increased by 18.6 percent during the same period. (More details on these measures can be found in the Transportation Section of this report.) EXISTING EFFORTS Consolidates current plans, goals, and initiatives related to the specific assessment area How and where we use land, build our buildings and configure our transportation modes and networks can impact both our total energy consumption and how efficiently we use what we consume. Both the Comprehensive Development Master Plan (CDMP) and Long Range Transportation Plan (LRTP) address energy consumption. Comprehensive Development Master Plan Land Use Element 10 (LU-10) of the CDMP states that energy efficient development shall be accomplished through metropolitan land use patterns, site planning, landscaping, building design, and development of multimodal transportation systems.5
Monitoring measures employed include (1) monitoring of revisions to the Florida Building Code, Metro-Dade Zoning Code, and other County development regulations, which encourage, support, or require energy conservation, (2) average electrical power consumption per capita and per residential unit will be compared to historical rates, and (3) the comparison of ridership rate per 1,000 adult population on mass transit (Metrorail, Metromover, and MDTA buses) to historical rates on an annual basis.
Land Use Element 10 (LU-10) also sets forth policies that enable improved energy conservation including:
• LU-10A: Miami-Dade County shall facilitate contiguous urban development, infill, redevelopment of substandard or underdeveloped urban areas, high intensity activity centers, mass transit supportive development, and mixed-use projects to promote energy conservation.
• LU-10B: Solar design guidelines for such items as street and passageway alignments, landscaping, setbacks, building orientation, and relationship to water bodies shall be developed by 2008, and utilized in site plan reviews by the Department of Planning and Zoning.
• LU-10C: Miami-Dade County shall encourage energy conservation by adopting Florida Green Building Coalition, US Green Building Council Leadership in Energy and Environmental Design (LEED), or other acceptable commercial building standards for County-owned facilities.
• LU-10D: Miami-Dade County shall promote energy conservation by encouraging builders, remodelers, homeowners and homebuyers to implement Florida Green Building Coalition green home or other acceptable environmental standards and by encouraging site
5 Other sections of the CDMP that encourage the development of pedestrian friendly mixed-use urban centers also have a direct impact on energy use - fuel use in particular. Please see the Land Use section of the Assessment for more information.
Energy – Page 14
planners and land developers to implement Florida Green Building Coalition development standards.
• LU10-E: Miami-Dade County shall investigate incentives for developers and building owners to incorporate energy efficiency and other conservation measures that meet recognized green building standards into the design, construction or rehabilitation of their buildings.
Long Range Transportation Plan (LRTP) The County’s Long-Term Transportation Planning process has as a goal to protect and preserve the environment and quality of life and promote energy conservation. Specific objectives to meet the energy conservation goal include:
• Reduce fossil fuels use • Promote projects that support urban infill and densification • Promote transportation improvements that are consistent with adopted comprehensive
development master plans • Prioritize funding to favor intra-urban (within UDB) improvements • Promote the use of alternative vehicle technologies • Apply transportation and land use planning techniques, such as transit-oriented
development, that support intermodal connections and coordination Existing Legislation Federal, state and local legislative efforts all have and will continue to impact energy supply and demand. The general direction of this legislation in the recent past as well as immediately following the energy crisis of the 1970s has been to promote increased energy efficiency and conservation. Except for land use policy, energy policy at this moment is still separated in government bureaucracies with certain departments/divisions that address building and infrastructure energy use and others that address energy use in the transportation sector. At the federal level, legislative efforts can be directed towards both how we source and generate our energy, as well as how we use energy vis-a-vis the energy consuming products that we utilize through policies, incentives and direct funding of energy efficiency and other efforts (e.g. Energy Star Portfolio Manager, Energy Efficiency and Conservation Block Grants). At the state level, the Public Safety Commission (PSC) regulates public utilities that provide a majority of Florida and Miami-Dade County’s energy and related services including the demand-side management incentive and rebate programs that we as energy consumers utilize. In addition, the Florida Department of Community Affairs oversees and approves the land use planning that local governments undertake through the comprehensive development master planning processes as well as the Florida Building Code. The state also has in place a Climate and Energy Commission to help generate robust energy management policies. It has a supporting Energy Office for implementing policies, programs and incentives that enable energy consumers to improve their efficiency. This includes the provision of rebates for residential and small commercial renewable energy installations. Locally, municipal governments can implement policies, programs and incentives that impact energy supply sources (e.g. use of off-grid renewable energy sources), promote increased efficiency and reduce demand but within the limitations of state-level utility regulations (e.g. current 2MW limit on renewable energy returned back to the grid that a non-utility energy generator can be compensated for). Provided below are legislative highlights that reflect the energy conservation trend described above. State Florida State House Bill 7135 (2008): Comprehensive energy bill with economy-wide impacts including utilities, construction and transportation industries, renewable energy developers,
Energy – Page 15
biofuel companies, solid waste and recycling companies and local governments. The bill includes the following provisions:
• State government to “lead-by-example” in energy conservation and efficiency; • Authorizes the Florida Department of Environmental Protection (FDEP) to develop a
market-based regulatory program to reduce greenhouse gas (GHG) emissions from electric utilities;
• Amends the Florida Energy Efficiency and Conservation Act, requiring the PSC to adopt rules that encourage electric utilities to increase energy efficiency and demand-side renewable energy systems;
• Establishes a preference for climate-friendly products and “green” facilities for in the awarding of state contracts;
• Establishes a schedule to increase energy efficiency in buildings subject to the Florida Energy Efficiency Code for building construction
• Establishes increased energy efficiency standards for water heaters, dishwashers and swimming pools; establishes a renewable fuel standard for Florida and requires that by 2010, with limited exceptions, all gasoline sold in this state must contain at least 10 percent ethanol;
• And creates the new 12-member Florida Energy and Climate Commission that is charged with developing, coordinating and implementing energy policies for the state.6
• Provides for State funded solar energy rebates ($10 million in 2009)
• Provides for State funding of R&D for renewable energy
Florida State House Bill 697 (2008): HB 697 establishes new local planning requirements relating to energy efficient land use patterns, transportation strategies to address greenhouse gas reductions, energy conservation, and energy efficient housing. These new requirements became effective on July 1, 2008. Implementation of these requirements presents the Department and local governments with new challenges and opportunities.7
Local The following list includes some of the Board’s adopted legislation related to energy or climate change. A complete inventory of sustainability related legislation is provided as an appendix.
• R-737-96 : DOE Funding for Rebuild Miami Resolution (1996) Resolution accepting grant from US Department of Energy that will provide funding for the "Rebuild Miami" program that will allow Dade County to develop, participate in, and implement energy efficient programs to reduce energy consumption in residential households and local businesses. The grant was administered by the Department of Environmental Resources Management (DERM).
• R-872-98: MOU for County-US EPA Green Lights Program (1998)
Authorizes County to enter into a voluntary agreement with the EPA for the EPA’s Green Lights program. This program encourages corporations and local governments to install cost-effective, energy efficient lighting in their facilities thereby reducing operating costs and emissions of greenhouse gases.
• R-756-01: ICLEI Energy Star Program for Businesses Grant Acceptance (2001)
Resolution accepting grant from the International Council for Local Environmental Initiatives for the promotion of County’s Energy Star program for businesses
• R-1341-06: Urge Natural Gas Utilities to Extend Service in Miami-Dade (2006)
6 Summary adapted from Holland and Knight summary of HB 7135 7 Source: Florida State Department of Community Affairs website
Energy – Page 16
• R-324-07: Membership in Chicago Climate Exchange (2007)
County has to reduce direct fuel-based GHG emissions to six percent below 2000 levels by 2010 over a four year compliance period of 2007-2010 (1.5 percent annual reduction)
• R-190-07: Solar Water Heater Installation for Low-Income Homeowners (2008)
Resolution urging the Florida State Legislature to provide matching funds to low-income homeowners for solar and other energy saving water heater installations
• R-1431-08: Miami-Dade’s Commitment through the Cool Counties (2009)
Commits to region-wide goal of reducing greenhouse gas emissions by 80 percent by 2050, and a 2 percent reduction each year beginning in 2010
• R-228-09: Reduce Electrical Energy Consumption (2009) Reduce electricity consumption from government operations by 20 percent over the 2007-2014 time period
• R-928-09: Campaign Informing People of the New Energy-Savings Rebates (2009) Mayor or Mayor’s designee to prepare and implement an education campaign informing people of the new energy savings rebates
• Signatory to US Conference of Mayor’s Climate Protection Agreement
Community-wide emissions reduction 7 percent below 1990 levels by 2012 Energy Efficiency & Conservation Block Grant Program The US DOE Energy Efficiency & Conservation Block Grant (EECBG) formula allocation in the amount of $12.5 million awarded to the County in September 2009 is currently spurring new activities addressed at the larger community. Federal grant dollars will go toward energy management and construction projects, citizen outreach and education, pilot programs and more. Funds from the grant will also help create local green jobs. The County’s integrated Energy Efficiency Conservation Strategy combines projects such as:
• Community-wide Energy-Efficiency Behavior Change Campaign • Community-based Organization Energy-Efficiency Re-Granting Program • Targeted Industry Energy-Efficiency Revolving Loan Program
Other Initiatives Per the adoption of Ordinance 05-91, Targeted Jobs Incentive Fund (TJIF) for stimulating a healthy economy and revitalization with a focus on green buildings and the renewable energy industry was created. Please see the Business and Industry Section for more information. FPL is initiating a smart-metering retrofit for all of its customers in its Florida Service Area. This system will provide real-time energy consumption information to households and businesses which can instigate the increased long-term adoption of energy conserving behaviors and more effective energy use management. This effort should complement well the County’s energy-efficiency efforts both in-house and across the larger community. COMMUNITY FEEDBACK Feedback & results gathered though the planning process or surveys No feedback is available at this point.