Embed Size (px)
Citation preview

Energy-efficient Wastewater Treatment by Microbial Fuel Cells:
Scaling Up and Optimization
Zheng Ge
Dissertation submitted to the faculty of the Virginia Polytechnic Institute and
State University in partial fulfillment of the requirements for the degree of
Doctor of Philosophy
In
Civil Engineering
Zhen He
Gregory D. Boardman
Amy Pruden
Jactone Arogo Ogejo
October 12, 2015
Blacksburg, VA
Keywords: microbial fuel cells, wastewater, energy recovery, optimization,
scaling up

Energy-efficient Wastewater Treatment by Microbial Fuel Cells:
Scaling Up and Optimization
Zheng Ge
ABSTRACT
Microbial fuel cells (MFCs) are potentially advantageous as an energy-efficient approach
to wastewater treatment. For single-chamber tubular MFCs, anode effluent is used as
catholyte instead of tap water or buffer solutions. Therefore, exposing cathode electrode to
atmosphere could be also considered as a passive aeration for further aerobic oxidation of
organics and nitrification. Based on several bench-scale studies, a 200-L scale MFC system
with passive aeration process has been developed for treating actual municipal wastewater
after primary clarification. The integrated system was able to remove over 80% organic
contaminants and solid content from primary effluent. Through parallel and serial
electricity connection, the power output of ~200 mW and the conversion efficiency of
∼80% for charging capacitors were achieved by using commercially available energy
harvesting device (BQ 25504). The treatment system is energy-efficient for the energy
saving from aeration and sludge treatment while partial energy recovery as direct electricity
can be utilized on site to power small electric devices. However, the post treatments are
required to polish the effluent for nutrients removal.

iii
ACKNOWLEDGEMENTS
First of all, I would like to thank my advisor, Dr. Zhen He, for offering me such a precious
opportunity of doing interesting research in microbial fuel cells and related wastewater
technologies. Dr. He is a kind and knowledgeable mentor and he cares about us for the life,
study, and career. Doing something about water seems to be my destiny that I love what I
have chosen and I enjoy what I have been doing from deep down in my heart. Fortunately,
I have a chance to work with Dr. He for my Ph.D study, and finally for being clear about
what I will pursuer as my lift-time goal. I’m grateful to have Dr. He as my advisor during
my graduate study. I would also like to thank my committee, Dr. Gregory D. Boardman,
Dr. Amy Pruden, and Dr. Jactone Arogo Ogejo for their time and support in the research
efforts.
Meanwhile, I would like to thank all of EBBL members, Dr. Zhenhai Wen, Dr. Cunyu
Zhao, Dr. Yaobin Lu, Zeying Yuan, Zhemin Zhang, and Liao Wu for their support and
assistance during my research journey, and especially our big brother Dr. Fei Zhang, who
was always there to help me out with messy problems and encourage me to move forward.
I would like to thank my parents, for their unconditional support and constructive
suggestions throughout the time of my graduate study in United States. The trust and
believe on me are the most motivation of my efforts. I need thank my uncle’s for their
advices with a future vision from the aspect of a successful businessman. Also, a special
thanks to my girlfriend Aili, for being with me during the last stressful year.

iv
CONTENTS
ABSTRACT ........................................................................................................................ ii
ACKNOWLEDGEMENTS ............................................................................................... iii
CONTENTS ....................................................................................................................... iv
TABLES .......................................................................................................................... viii
FIGURES ........................................................................................................................... ix
ATTRIBUTION ............................................................................................................... xiii
CHAPTER 1 ....................................................................................................................... 1
Introduction ......................................................................................................................... 1
1.1 Energy Demand and Wastewater Treatment ................................................................ 1
1.2 Principles and Applications of Microbial Fuel Cell ..................................................... 2
1.3 Scaling-up of MFC ....................................................................................................... 5
1.4 Research Objectives ...................................................................................................... 6
CHAPTER 2 ....................................................................................................................... 9
Recovery of Electrical Energy in Microbial Fuel Cells: Brief Review .............................. 9
2.1 Introduction ............................................................................................................... 9
2.2 Recovery of Electrical Energy in MFCs with Different Scales .............................. 12
2.3 Recovery of Electrical Energy from Different Substrates ...................................... 15
2.4 Recovery of Electrical Energy in MFCs with or without Separators ..................... 18
2.5 Perspectives............................................................................................................. 19
CHAPTER 3 ..................................................................................................................... 23
Effects of Draw Solutions and Membrane Conditions on Electricity Generation and
Water Flux in Osmotic Microbial Fuel Cells .................................................................... 23
3.1 Introduction ............................................................................................................. 23
3.2 Materials and Methods ............................................................................................ 26
3.2.1 OsMFC setup and general operation ................................................................ 26
3.2.2 General measurement and analysis .................................................................. 27
3.2.3 Specific testing conditions ............................................................................... 27
3.3 Results and Discussion ........................................................................................... 30
3.3.1 Effects of draw solutions on the OsMFC performance ................................... 30

v
3.3.2 Effects of membranes on the OsMFC performance ........................................ 38
3.4 Conclusions ............................................................................................................. 42
CHAPTER 4 ..................................................................................................................... 43
Reducing Effluent Discharge and Recovering Bioenergy in an Osmotic Microbial Fuel
Cell Treating Domestic Wastewater ................................................................................. 43
4.1 Introduction ............................................................................................................. 43
4.2 Materials and Methods ............................................................................................ 45
4.2.1 OsMFC setup ................................................................................................... 45
4.2.2 OsMFC startup ................................................................................................. 47
4.2.3 OsMFC fed on acetate solution ........................................................................ 47
4.3.4 OsMFC fed on domestic wastewater ............................................................... 48
4.2.5 Measurement and analysis ............................................................................... 48
4.3 Results and Discussion ........................................................................................... 50
4.3.1 OsMFC fed on acetate solution ........................................................................ 50
4.3.2 OsMFC fed on domestic wastewater ............................................................... 53
4.3.3 FO membrane fouling ...................................................................................... 60
4.4 Conclusions ............................................................................................................. 62
CHAPTER 5 ..................................................................................................................... 63
Hollow-fiber Membrane Bioelectrochemical Reactor for Domestic Wastewater
Treatment .......................................................................................................................... 63
5.1 Introduction ............................................................................................................. 63
5.2 Materials and Methods ............................................................................................ 65
5.2.1 MBER construction ......................................................................................... 65
5.2.2 Operating condition ......................................................................................... 67
5.2.3 Measurement and analysis ............................................................................... 68
5.2.4 Energy estimation ............................................................................................ 70
5.3 Results ..................................................................................................................... 70
5.3.1 The MBER treating synthetic solution ............................................................ 70
5.3.2 The MBER treating wastewater ....................................................................... 72
5.3.3 Energy balance ................................................................................................. 76
5.3.4 Membrane fouling ............................................................................................ 77

vi
5.4 Conclusions ............................................................................................................. 82
CHAPTER 6 ..................................................................................................................... 83
Long-Term Investigation of Microbial Fuel Cells Treating Primary Sludge or Digested
Sludge ............................................................................................................................... 83
6.1 Introduction ............................................................................................................. 83
6.2 Materials and Methods ............................................................................................ 85
6.2.1 MFC setup ........................................................................................................ 85
6.2.2 MFC operation ................................................................................................. 86
6.2.3 Measurement and analysis ............................................................................... 87
6.3 Results and Discussion ........................................................................................... 88
6.3.1 MFCs treating primary sludge or digested sludge ........................................... 88
6.3.2 Two-stage MFC system treating primary sludge ............................................. 92
6.3.3 Biogas and energy production ......................................................................... 96
6.4 Conclusions ........................................................................................................... 100
CHAPTER 7 ................................................................................................................... 101
An Effective Dipping Method for Coating Activated Carbon Catalyst on The Cathode
Electrodes of Microbial Fuel Cells ................................................................................. 101
7.1 Introduction ........................................................................................................... 101
7.2 Materials and Methods .......................................................................................... 103
7.3 Results and Discussion ......................................................................................... 104
7.4 Conclusions ........................................................................................................... 113
CHAPTER 8 ................................................................................................................... 114
Energy Extraction from A Large-Scale Microbial Fuel Cell System Treating Municipal
Wastewater ...................................................................................................................... 114
8.1 Introduction ........................................................................................................... 114
8.2 Materials and Methods .......................................................................................... 117
8.2.1 The MFC system ............................................................................................ 117
8.2.2 Electronic connections and energy harvesting device ................................... 117
8.2.3 Measurement and analysis ............................................................................. 118
8.3 Results and Discussion ......................................................................................... 119
8.3.1 Performance of the MFC system ................................................................... 119
8.3.2 Energy extraction and conversion efficiency by using BQ 25504 ................ 120

vii
8.3.3 Charging and discharging .............................................................................. 124
8.4 Conclusions ........................................................................................................... 125
CHAPTER 9 ................................................................................................................... 126
Perspectives..................................................................................................................... 126
Reference ........................................................................................................................ 128
Appendices ...................................................................................................................... 140
Appendix A Supplemental Information to Chapter 4 ..................................................... 140
Appendix B Supplemental Information to Chapter 5 ..................................................... 144
Appendix C Supplemental Information to Chapter 6 ..................................................... 149
Appendix D Supplemental Information to Chapter 8 ..................................................... 152
viii
TABLES
Table 1.1 Standard potentials E0 and theoretical potentials for typical condition in MFCs
(Logan et al., 2006) ............................................................................................................. 4
Table 4.1. The OsMFC performance with acetate solution or actual wastewater (WW) . 52
Table 4.2 The OsMFC performance during the step-decrease of wastewater HRT ......... 55
Table 5.1. Characterization of the influent and the effluent of the MBER with different
substrates and HRTs ......................................................................................................... 73
Table 6.1 Characteristics of the primary sludge (PS) and the digested sludge (DS) in the
Phase I. .............................................................................................................................. 90
Table 6.2 Characteristics of the primary sludge (PS) and the treatment performance of the
two MFCs in the Phase II.................................................................................................. 94
Table 6.3 Energy production (kWh/m3) from the two-stage MFC system in the Phase II
and energy production from biogas at South Shore Water Reclamation Facility. ............ 98
Table 7.1 Exchange current generated with the cathode electrodes with different initial
AC input and multiple dipping times .............................................................................. 109
Table 8.1 Performance of the MFC system (four groups in serial connection) in
contaminants removal and current production. ............................................................... 121
Table A1 The composition of the scaling compounds on the side of the FO membrane
facing the anode (wastewater) ........................................................................................ 142
Table A2 The composition of the scaling compounds on the side of the FO membrane
facing the cathode (draw solution) .................................................................................. 142
Table B1 Power consumption by the pumping system at different HRTs. .................... 144
TABLE B2 Analysis of energy production and consumption of the MBER with different
substrates and HRTs. ...................................................................................................... 144
Table B3 Membrane cleaning methods and water flux during treatment of primary
effluent. ........................................................................................................................... 145
Table B4 The mass ratio of the new and the fouled membrane. ..................................... 145
ix
FIGURES
Figure 1.1 Schematic of two-chamber microbial fuel cell .................................................. 3
Figure 1.2 Schematic of electron transport from substrate to electrode in G.
sulfurreducens biofilm (Sun et al., 2014) ............................................................................ 4
Figure 2.1 Electricity generation in MFCs with different anode liquid volumes: (A)
power density, (B) normalized energy recovery, and (C) normalized energy recovery. .. 14
Figure 2.2 Normalized energy recovery (A) and power density (B) of the MFCs treating
different types of substrates. WW means wastewater. Error bars represent the standard
deviation. ........................................................................................................................... 15
Figure 2.3 Comparison of normalized energy recovery from acetate between two
concentration ranges. ........................................................................................................ 17
Figure 2.4 Normalized energy recovery of the MFCs with or without separators and/or
membranes. Error bars represent the standard deviation. ................................................. 17
Figure 3.1 Experimental setup of an osmotic microbial fuel cell. .................................... 27
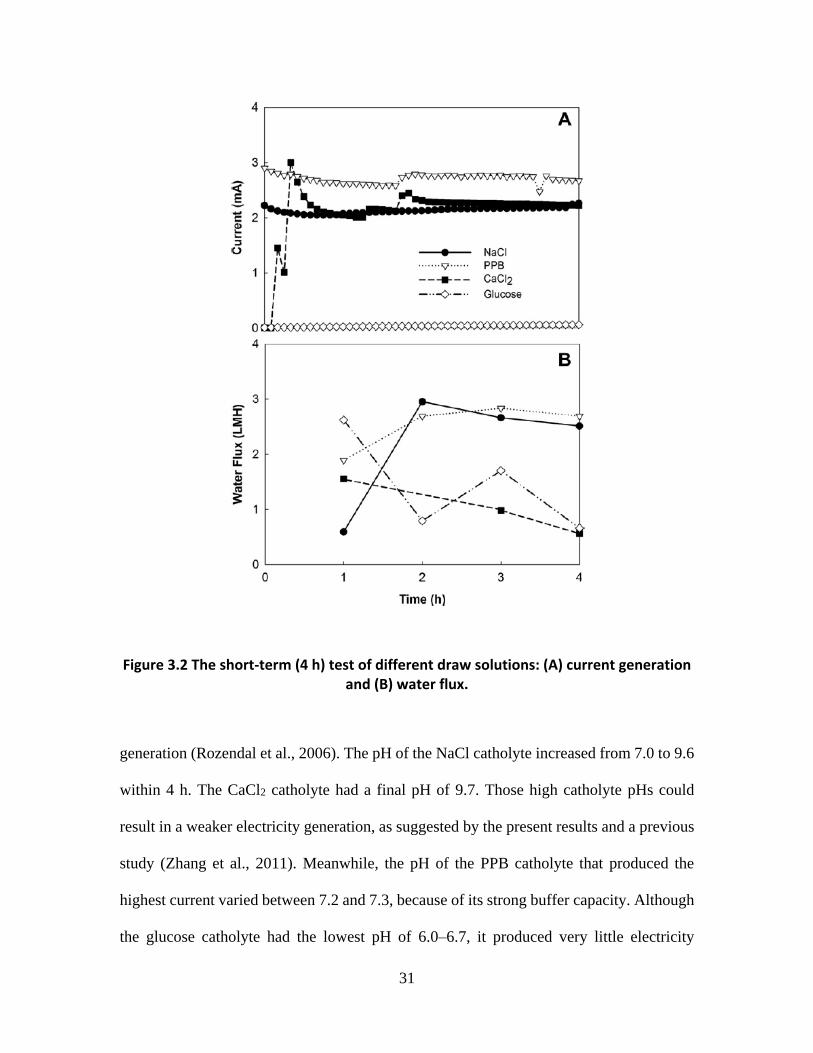
Figure 3.2 The short-term (4 h) test of different draw solutions: (A) current generation
and (B) water flux. ............................................................................................................ 31
Figure 3.3 The effect of PPB concentrations on the OsMFC performance: (A) current
generation and (B) water ................................................................................................... 34
Figure 3.4 Buffering the pH of the NaCl solution with dosing acid. The arrows indicate
the addition of acid to the draw solution. .......................................................................... 35
Figure 3.5 Current generation in the OsMFC with FO membranes (an a CEM) under
different conditions (A) and the 1-h test of the fouled & dried FO membrane (B). ......... 37
Figure 3.6 Water flux (A) and current generation (B) during the test of backwash. The
arrows indicate the addition of NaCl into the anode compartment. ................................. 40
Figure 4.1 Schematic of experimental setup of an osmotic microbial fuel cell. ............... 46
Figure 4.2 Polarization curves of the OsMFC treating acetate solution. .......................... 51
Figure 4.3 Batch operation of the OsMFC treating acetate solution: (A) the profile of
current generation; and (B) the increase in water mass in a batch. ................................... 52
Figure 4.4 Batch operation of the OsMFC treating wastewater: (A) the profile of current
generation; and (B) the increase in water mass in a batch. ............................................... 55

x
Figure 4.5 Current generation of the OsMFC treating wastewater: (A) continuous
operation; and (B) the step-decrease of wastewater HRTs. .............................................. 56
Figure 4.6 Polarization curves of the OsMFC treating wastewater in continuous operation
and at HRT 24 h. ............................................................................................................... 56
Figure 4.7 Comparison between clean and fouled FO membranes: (A) Bode plot of
electrochemical impedance spectroscopy; and (B) short-term water flux test (in a U-shape
reactor shown in Fig. A1) ................................................................................................. 58
Figure 4.8 SEM pictures of the fouled FO membrane (A — active side; B — support
side; C — cross-section) and a clean FO membrane (D — active side; E — support side;
F — cross-section). ........................................................................................................... 61
Figure 5.1. Schematic of a membrane bioelectrochemical reactor (MBER): 1 – influent
reservoir, 2 – electric circuit, 3 – cathode electrode (carbon cloth), 4 – anode electrode
(carbon brush), 5 – cation exchange membrane (CEM), 6 – gas collection, 7 – hol ........ 66
Figure 5.2. Polarization curves (power and voltage) of the MBER with acetate solution
(A) and wastewater (B). The wastewater polarization tests were conducted at two
different organic loading rates: 0.04 and 0.28 kg TCOD m-3 d-1. ..................................... 68
Figure 5.3 MBER performance with synthetic solution: (A) current generation, (B)
transmembrane pressure (TMP), and (C) COD concentrations in the influent and the
effluent. Arrow a: physical cleaning; arrow b: chemical cleaning. .................................. 74
Figure 5.4 MBER performance with wastewater (primary effluent): (A) current
generation and COD loading rates; (B) transmembrane pressure (TMP); and (C) COD
concentrations in the influent and the effluent. Arrow a: extremely low COD after a
major storm; arrow b: the catholyte changed from tap water to the anode effluent. ........ 75
Figure 5.5. Energy consumption and production in the MBER with different anode
effluents at different HRTs. AS: acetate solution. PE: primary effluent. The number in
parentheses indicates the HRT. ......................................................................................... 78
Figure 6.1 Schematic of the tubular MFC used for sludge treatment. .............................. 86
Figure 6.2 Current generation of individual MFC in Phase I with an HRT of 9 days in
each reactor: (A) MFC-1 fed with primary sludge and (B) MFC-2 fed with digested
sludge. ............................................................................................................................... 89
Figure 6.3 Current generation in the two-stage MFC system fed on primary sludge in
Phase II with an HRT of 7 days in each reactor: (A) MFC-1 and (B) MFC-2. ................ 93
Figure 6.4 Biogas production in the MFCs during Phase II. ............................................ 97
Figure 7.1 The actual AC loading rates (Y axis) on the electrodes with different initial
AC input of 2, 4, 8, and 12 g per 100 mL ethanol, and multiple dipping times. ............ 106

xi
Figure 7.2 Tafel plots of the cathode electrodes with different initial loading AC load (A)
and different coating layers (CLs) by dipping (B). ......................................................... 108
Figure 7.3 Variation of voltage and power density with current density in the MFC
containing cathode electrode prepared in different ways: (A and B) cathode electrode
coated with different initial AC input and one prepared by the brushing method for comp
......................................................................................................................................... 109
Figure 7.4 Current generation during batch operation (A) and the production of total
charge in a batch (B) with different initial AC inputs in a tubular MFC. ....................... 112
Figure 8.1 Polarization curves of the MFCs with four types of serial connection: (A) S4
(R1357), (B) S3 (R 357), (C) S2 (R57), and (D) S1 (R5)............................................... 120
Figure 8.2 Charging profiles of the ultracapacitors by the MFCs with four types of serial
connection using BQ 25504. ........................................................................................... 121
Figure 8.3 The efficiency of the BQ25504 with different voltage input under four types of
connection: (A) S4 (R1357), (B) S3 (R 357), (C) S2 (R57), and (D) S1 (R5). .............. 122
Figure 8.4 Charging and discharging of the ultracapacitors by the MFC system (S3
connection) and BQ25504. ............................................................................................. 124
Figure A1. The U-shape reactor used for the water flux test. ......................................... 141
Figure A2 EDS spectrum of the scaling compounds on the side of the FO membrane
facing the anode (wastewater). ....................................................................................... 143
Figure A3 EDS spectrum of the scaling compounds on the side of the FO membrane
facing the cathode (draw solution). ................................................................................. 143
Figure B1 Current generation in the MBER fed with the acetate solution at HRT 19 h. 146
Figure B2 The TMP increase in the MBER fed with the acetate solution at HRT 19 h . 146
Figure B3 Hollow-fiber membranes before (left) and after (right) chemical cleaning (day
202). ................................................................................................................................ 147
Figure B4 The weight percentages (WT%) of the elements in the new and the fouled
membrane from EDS analysis: A) the interior and B) the exterior. ............................... 147
Figure B5 FTIR spectra of the new and the fouled membranes. .................................... 148
Figure C1 Power and voltage curves of the two MFCs during Phase I. MFC-1 was fed
with the primary sludge and MFC-2 was supplied with the digested sludge. The scan rate
was 0.1 mV/s. .................................................................................................................. 149
Figure C2 Current generation of MFC-1 with different recirculation rates in Phase I. .. 150

xii
Figure C3 Current generation of MFC-1 buffered with two different solutions in Phase I.
......................................................................................................................................... 150
Figure C4 Power and voltage curves of the two MFCs during Phase II: (A) using
acidified water as a catholyte; and (B) using neutralized water as a catholyte. The scan
rate was 0.1 mV/s. ........................................................................................................... 151
Figure D1 Schematic of MFCs system. .......................................................................... 152
Figure D2 Schematic of electric connections: serial connections (top) and
charging/discharging circuit connection (bottom). ......................................................... 153
Figure D3 Polarization curves of MFCs with various serial connections. ..................... 156

xiii
ATTRIBUTION
Each coauthor is duly credited for his or her contribution to this work, both in their
sharing of ideas and technical expertise.
Zhen He, Ph.D. Associate Professor of Civil and Environmental Engineering
(Principal Investigator)
Department of Civil and Environmental Engineering, Virginia Polytechnic Institute
and State University. Blacksburg, VA 24061
Coauthor of chapters 2, 3, 4, 5, 6, 7, 8
Jian Li, M.S., Doctoral Student
Department of Civil and Environmental Engineering, Virginia Polytechnic Institute
and State University. Blacksburg, VA 24061
Coauthor of chapters 2
Yiran Tong, M.S., Doctoral Student
Department of Civil, Construction and Environmental Engineering, Marquette
University. Milwaukee, WI 53233
Coauthor of chapters 2
Li Xiao, Ph.D.
Coauthor of chapters 2, 4
Qingyun Ping, Doctoral Student
Department of Civil and Environmental Engineering, Virginia Polytechnic Institute
and State University. Blacksburg, VA 24061
Coauthor of chapters 4, 5
xiv
Fei Zhang, Ph.D., Research Scientist
Cell-Free Bioinnovations, Inc. Blacksburg, VA 24061
Coauthor of chapters 6, 8
Julien Grimaud,
Veolia Water North America, Indianapolis, IN 46204
Coauthor of chapters 6
Jim Hurst, P.E., Chief Technical Officer
Veolia Water North America, Indianapolis, IN 46204
Coauthor of chapters 6
Liao Wu, Ph.D. student,
College of Computer Science and Electronic Engineering, Hunan University,
Changsha 410082, China
Coauthor of chapters 8

1
CHAPTER 1
Introduction
1.1 Energy Demand and Wastewater Treatment
Currently, wastewater treatment technologies applied in many areas and countries are
based on activated sludge process, an old but effective method for reducing pollutants in a
short period. Although this century-old technology and its various modifications have been
serving human society for environmental protection and pollution control successfully, a
serious concern is the energy consumption that the energy demands keep increasing for the
explosion of population and fast economic development. It may not be possible to reduce
the generation of wastewater from human activities because of unsustainable utilization of
raw materials and continuous growth of population, but more renewable energy sources
can be explored for water treating and reusing. In U.S., about 3-4% of the electrical energy
is consumed for wastewater treatment (Smith, 2002), however, domestic wastewater, itself,
could be considered as an alternative renewable energy source for the high content of
biodegradable organics. It was estimated that twice more energy could be recovered from
organics in municipal solid waste than the operation (Mata-Alvarez et al., 2000).
Therefore, theoretically it should be possible to achieve energy-positive for wastewater
treatment, or at least energy-neutral. Generally, 0.6 kWh per cubic meter treated
wastewater is typically needed for a treatment facility employing aerobic activated sludge
and anaerobic digestion process (McCarty et al., 2011). Such an energy-intensive process
is mainly the result of the aeration for organic oxidation and nitrification in aeration tank,
2
and the following disposal of wasted sludge. Comparing with aerobic biological treatment,
two distinguished advantages from anaerobic process are low energy consumption (no
aeration) and less sludge production. To remove nitrogen, the subsequent ANAMMOX
(anaerobic ammonium oxidation) would be an excellent alternative with low energy
consumption as well as little sludge production (Lackner et al., 2014). In consequence,
conventional aerobic biological treatment is completely replaceable by anaerobic process
for organics degradation.
1.2 Principles and Applications of Microbial Fuel Cell
Conventional anaerobic process (such as anaerobic digestion) is widely known for its
capability of treating high concentration organic wastewater with positive energy recovery.
However, for domestic wastewater treatment, low methane yield (0.16-0.25 L CH4 g-1
COD) and high methane loss (28-39%) under ambient temperature conditions would be a
challenging environmental issue (Kim et al., 2010; Plappally & Lienhard V, 2012).
Different from classic anaerobic process, as an emerging and promising technology of
sustainable energy-efficient method for wastewater treatment, microbial fuel cell (MFC) is
a device that degrades organics and simultaneously generates direct electricity with
catalysis through bacteria (Logan et al., 2006). To distinguish from chemical fuel cell
which is based on pure chemical reaction for the whole cell, a bio-anode in MFC is able to
oxidize organics to obtain electrons, and then transfer the electrons to cathode to complete
cathodic reduction reaction (Fig. 1.1). In most MFCs for treating wastewater, anode
functions as a anaerobic bioreactor to degrade organic contaminants while anode electrode,

3
as electron acceptor, collect electrons and conduct them to cathode, which can be express
as procedure in Fig. 1.2 (oxygen is final electron acceptor in cathode). The electrons
obtained from substrate oxidation can be transported through NADH/NAD+ and then to
serial cytochrome agents in the outer cell membrane, and finally to anode electrode. The
next step is electricity generation that the electrons from anode electrode will move toward
high potential direction to cathode. Some typical half-cell reactions for anode and cathode
in MFC are shown in Table 1.1. Therefore, the major difference between exoelectrogenic
bacteria and other microorganisms is the pathway of electrons transport. In conventional
definition, either anaerobic or aerobic respiration involves electron movement within the
cells while the electron acceptors participate in metabolic activities which happen inside of
the cells. However, for exoelectrogenic bacteria, electron reception is completed outside of
the cells and the types of electron acceptors do not affect the metabolic pathway because
the extracellular reception of electrons. It could be more accurate to understand
exoelectrogens as anaerobic biological process with electrode respiration.
Figure 1.1 Schematic of two-chamber microbial fuel cell

4
Figure 1.2 Schematic of electron transport from substrate to electrode in G. sulfurreducens biofilm (Sun et al., 2014)
Electrode Reaction E0 (V) Conditions EMFC
(V)
Anode
2 HCO3- + 9 H+ + 8 e-
→ CH3COO- + 4 H2O
0.187 HCO3
- = 5 mM, CH3COO- = 5 mM,
pH = 7 -0.296
Cathode
O2 + 4 H+ + 4 e-
→ 2 H2O
1.229 pO2 = 0.2, pH = 7 0.805
O2 + 2 H2O + 4 e-
→ 4 OH- 1.229 pO2 = 0.2, pH = 7 0.805
An MFC oxidizing acetate in anode (HCO3- = 5 mM, CH3COO- = 5 mM, pH = 7) and reducing
oxygen in cathode (pO2 = 0.2, pH = 7) has a cell emf of 1.101 V.
No matter what mechanisms are for MFCs, researchers have developed various
engineering systems, such as small cylinder (Liu & Logan, 2004; Rabaey et al., 2005a), H-
shape bottle (Logan et al., 2005), MFC stacks (Aelterman et al., 2006), tubular MFC
(Rabaey et al., 2005b), and etc., to achieve wastewater treatment and energy recovery based
upon this innovative concept. Multiple studies have reported the applications of MFCs for
wastewater treatment, including both domestic and industrial wastewater (Çetinkaya et al.,
2015; Choi & Ahn, 2013; Fang et al., 2015; Feng et al., 2014a; Samsudeen et al., 2015; Ye
et al., 2014). The long-term study also demonstrated the technical feasibility and reliability
of MFC technology when dealing with real wastewater (Zhang et al., 2013). Meanwhile,
Table 1.1 Standard potentials E0 and theoretical potentials for typical condition in MFCs (Logan et al., 2006)

5
the technologies have been reviewed as one of the most promising alternatives to replace
old-fashion activated sludge system by many researchers (Douglas C. Montgomery, 2011;
Heidrich et al., 2011; Kim et al., 2011; Li et al., 2014). MFCs can be positioned as center
unit for biological treatment instead of activated sludge process, functioning with necessary
pretreatment and post polish treatment (Li et al., 2014).
1.3 Scaling-up of MFC
One of the challenges in MFC development is the scaling-up of MFCs for practical
applications, which includes increasing capacity of wastewater treatment and transferring
energy from multiple cells in one MFCs system. To date, the most popular method to size
up the reactor is to modularized single MFC unit. Tubular MFCs from Zhang (Zhang et al.,
2013) and Ge’s (Ge et al., 2015) studies have been demonstrated as reliable approach for
treating municipal wastewater. Meanwhile, Dong has successfully developed stackable
MFC modules with 90 L liquid capacity in total for brewery wastewater treatment (Dong
et al., 2015). There are also three other reported work using similar configuration but
applied in microbial electrolysis cells (MECs). However, comparing with thousands of
publications from bench-scale MFC studies, few example over 50 L can be found till now.
Even though some large MFCs (> 100 L) were reported but the performance was poor that
neither organic removal nor energy recovery from organics were comparable with other
small-scale studies (Feng et al., 2014b).
Generally, the power output decreases as the size of MFCs increases as reviewed in Chapter
2, probably due to the limitation of mass transfer in larger anode and cathode. Such “fuel

6
cell” concept determines that it requires more consideration on reactor design to reduce the
mass transfer limits. Unlike a typical bioreactor with one chamber, MFCs require more
attentions on balancing among anode, cathode, biofilm formation, and electricity
production that any defects would limit the performance of the whole system because of
interconnection between each components. Therefore, in MFCs, scaling-up does not only
mean volume of anode (liquid capacity), but also involves the appropriate amplification of
electrodes, separators, and catalyst coating.
1.4 Research Objectives
The overall goal of this study is to develop a large-scale MFCs based on the understanding
of small bench-scale studies to examine and optimize the performance of the compacted
MFCs system on municipal wastewater treatment and energy recovery/utilization from
organic degradation.
The first objective is to construct a MFCs platform with the effective anodic liquid volume
of ~200 L, following by a post polish treatment with passive aeration. How to make MFC
technology practical for dealing with large amount of influent flow is probably the most
urgent challenge to date that most studies are still based on bench-scale reactors. Even
though the liquid volume has been increased from milliliter to liter scale, there is few study
reporting the performance of MFCs with larger scale (hundred liters to cubic meters) that
conclusions from those studies may not work for large-scale system, or in another word,
strategies successfully applied in small-scale system would not fit due to variance of reactor
configuration. The three reported work based on large volume over 50 L were developed

7
based on two-chamber or membraneless air-cathode configurations (Dong et al., 2015;
Feng et al., 2014b; Liang et al., 2013) but the complexity of “fuel cell” concept also enables
the more potential alternatives for scaling-up that tubular reactor would also be one of
potential candidate for future large-scale application. Therefore, it is important to evaluate
the feasibility of large MFCs system with multiple tubular cells.
The second objective is the evaluation of treatment performance and electricity production
based on the integrated MFCs system. The operation parameters such as hydraulic retention
time (HRT) and catholyte distribution frequency would be two critical control factors
regarding the organics removal and electricity generation. A general negative tendency
observed is that large-scale MFCs produce lower power density normalized on effective
liquid volume than that in small bench-scale reactors. For millimeter-scale MFCs, power
density could reach kW m-3 level but for cells larger than 1 liter, power output is usually
less than 30 W m-3 (Ge et al., 2013). The operation strategies could be quite different due
to the high concentration gradient and limitation of mixing and mass transfer in larger
reactors. In addition, buffer solution and other chemicals used under lab condition should
be avoided for practical application but pH in final effluent has to be maintained neutral
for either discharge or reuse.
Thirdly, energy recovery and utilization on site will be the final goal of the project. Actual
electricity generation and energy balance analysis in large-scale system can give more
reliable information regarding energy aspect than the results based on theoretical
calculation from small MFCs, making steps towards developing pilot-scale tests and

8
commercial products more reasonable and confident. Although MFC is considered as a
promising technology that is able to recovery direct electricity while treating wastewater,
most studies did theoretical calculation based on lab conditions with small energy output
which could not be able to power real utilities used in treatment process (such as pumps,
mixers, or blowers). There are some publications reporting practical charging application
in MFC and MDC systems (Dong et al., 2015; Ledezma et al., 2013; Zhang & He, 2012),
which excited people about future of MFC and its possibility to use wastewater as energy
source, however, it could be another challenge to power large appliances by extracting and
managing energy from large-scale MFC system with multiple cells. In consequence, proper
approach should be developed and investigated to transfer energy from MFCs to any
energy storage media, which can be used further to power electronics and large utilities.

9
CHAPTER 2
Recovery of Electrical Energy in Microbial Fuel Cells: Brief Review
(This section has been published as: Ge, Z., Li, J., Xiao, L., Tong, Y. and He, Z.* (2014)
Recovery of electrical energy in microbial fuel cells. Environmental Science &
Technology Letters. Vol 1, pp 137-141.)
2.1 Introduction
One of the potential applications of microbial fuel cell (MFC) technology is to recover
bioenergy from low-grade substrates such as wastewater (Logan & Rabaey, 2012). The
electrical effects in a biological system were observed ∼100 years ago, leading to the
development of the MFC concept with intensive research conducted in the past decade
(Arends & Verstraete, 2012). We have obtained a substantial amount of fundamental
information about the microbiology, electrochemistry, and materials of MFCs. To examine
the technical viability of MFCs, it is critical to understand their application niche, which is
strongly related to their energy performance. It is widely acknowledged that the advantage
of MFC technology is direct electricity generation; however, there is a lack of proper
presentation of the energy data (He, 2013), and we are still not clear about how much
energy MFCs can actually recover from wastewater.
There have been very few studies showing the data of energy recovery in reactor-type
MFCs (excluding sediment and plant MFCs), although energy efficiency has been defined
and reported in the literature (Liu & Logan, 2004; Logan et al., 2006; Rabaey et al., 2003).
An early example reporting energy data in normalized energy recovery (NER) was a
modular tubular MFC with an NER as high as 1.75 kWh/kg of the removed chemical
oxygen demand (COD) (Kim et al., 2010a). In another study, by using a maximal power
10
point circuit, the researchers were able to extract 2.13 × 10⁻⁵ kWh from an MFC, much
higher than 2.77 × 10⁻⁷ kWh when using a charge pump (Wang et al., 2012). In a novel
osmotic MFC that extracted water from the anode through forward osmosis, energy
recovery varied between 0.02 and 0.11 kWh/m3 of treated wastewater, depending on the
hydraulic retention time (Ge et al., 2013b). An MFC containing hollow-fiber ultrafiltration
membranes for improved effluent quality generated much more energy from an acetate
solution than from domestic wastewater (Ge et al., 2013a). During a long-term operation,
the MFCs installed in a municipal wastewater treatment facility recovered less than 0.03
kWh/m3 of the treated wastewater from the primary effluent (Zhang et al., 2013).
Those prior studies show the initial effort to understand the energy recovery in MFCs and
also reveal the urgency of further studying this issue. To extract more information about
energy recovery from previous MFC studies, we have examined and analyzed the MFC
publications that have appeared in the past 12 years and used the reported data on power,
flow rates, and organic concentrations to calculate the NER in various MFCs. By searching
“microbial fuel cell” as a keyword in article titles in Web of Science (sediment-type or
plant MFCs were excluded), we found 1412 MFC publications between 2000 and May
2013 and examined 840 papers for which we had access to the full text. Of the 194 papers
reporting continuously operated MFCs, 128 papers were analyzed for NER because they
contain sufficient information for energy analysis. Those papers are only a portion of the
MFC-related publications (many of which could be missing because of the searching
method, the available database, or the lack of data for energy analysis), but we think those
that are analyzed can represent MFC research on continuously operated systems to a certain

11
degree for the past decade. Because of the difference in the presentation of data in the
selected papers, in which some show the maximal power values (usually obtained from a
polarization curve), some introduce the operating power data (with an external resistor),
and some report both, we decided to use the operating power data for energy analysis or
the maximal power values if no operating power data were reported. The concentrations of
pure substrates such as acetate or glucose were converted into COD.
The NER is expressed in kilowatt hours per cubic meter [based on the volume of the water
treated, or power divided by wastewater flow rate (eq. 2.1)], a common unit for discussing
energy issues in wastewater treatment (Plappally & Lienhard V, 2012a), or kilowatt hours
per kilogram of COD [based on organic removal, or power divided by wastewater flow
rate and the difference in COD concentration (eq. 2.2)]. An MFC can achieve the maximal
NER, which is affected by power output, wastewater flow rate, organic loading rate, and
removal efficiency:
NER =power×time t
[wastewater volume (treated within time t)]
= (𝑝𝑜𝑤𝑒𝑟)/(𝑤𝑎𝑠𝑡𝑒𝑤𝑎𝑡𝑒𝑟 𝑓𝑙𝑜𝑤 𝑟𝑎𝑡𝑒) (2.1)
NER =power×time t
[COD (removed within time t)]
= (𝑝𝑜𝑤𝑒𝑟)/(𝑤𝑎𝑠𝑡𝑒𝑤𝑎𝑡𝑒𝑟 𝑓𝑙𝑜𝑤 𝑟𝑎𝑡𝑒 × ∆𝐶𝑂𝐷) (2.2)
We focus on the studies of continuously operated MFCs because those with batch-operated
MFCs usually report only the peak power values, which do not reflect the power production
of a whole batch profile and cannot be used to estimate energy recovery in the absence of
the raw data of the power–time profile. The energy data were statistically analyzed for
comparison by using a two-sample t test (Douglas C. Montgomery, 2011). It must be noted
12
that, because of significant variations in MFC construction and operation among different
studies, the conclusions drawn from the data may need further verification with strictly
designed experiments. The objective of this brief review is to conduct initial literature
analysis of energy performance of MFCs and encourage further investigation of this issue.
Our analyses reveal a rough picture of energy recovery in MFCs affected by several factors,
which has not been demonstrated before.
2.2 Recovery of Electrical Energy in MFCs with Different Scales
The scale of MFC reactors has been a critical factor to MFC development, because it
requires large-scale systems to demonstrate the technical and economical viability of MFC
technology; however, most MFC studies were conducted in small reactors at milliliter
levels. The desired scale for a successful demonstration will be from several hundreds to
thousands of liters.
The prior studies usually use power density as a parameter to describe the “performance of
electricity generation” in an MFC. The commonly used calculation of power density (eq.
3) is based on the anode liquid volume (or anodic net volume) and does not reflect either
the volume of the treated wastewater or the removed COD like NER. The power densities
of the selected studies are shown in Fig. 2.1A, in which the high power densities (>500
W/m3) are obtained from the MFCs with volumes of <50 mL, and the highest (operating)
power density of 2150 W/m3 was reported in a 0.34 mL MFC. The MFCs producing 100–
500 W/m3 generally have an anode liquid volume of <2000 mL. When the MFC size
is >2000 mL, the power density is usually <30 W/m3. The power density of the <100 mL

13
MFC is significantly higher than the power density of those between 100 and 1000 mL and
the power density of those larger than 1000 mL (p < 0.01); the 100–1000 mL MFCs
produce higher power densities than >1000 mL MFCs (p < 0.05). Therefore, it seems that
power densities decrease with an increase in MFC size.
power density = (power)/(anode liquid volume) (2.3)
However, the NER data exhibit different profiles. The high NER based on the volume of
the treated water is more than 2.0 kWh/m3 and achieved in MFCs with volumes ranging
from 30 mL to 20 L (Fig. 2.1B). Most studies have NERs smaller than 0.3 kWh/m3. When
expressing the NER based on organic removal (Fig. 2.1C), the highest NER of 1.95
kWh/kg of COD was obtained from a 230 mL MFC (Tugtas et al., 2011), which is 51% of
the theoretical energy content (3.86 kWh/kg of COD) from COD oxidation to carbon
dioxide and water (McCarty et al., 2011). Approximately 27% of the studies have an NER
higher than 0.2 kWh/kg of COD, with reactor sizes ranging from 5 to 5800 mL. There is
no statistical difference in NERs between the MFCs with different scales (p > 0.05).
We have observed some discrepancies between the two NERs. For example, one study
reported a very high NER based on the treated volume (2.25 kWh/m3) but had a medium
value of 0.70 kWh/kg of COD; on the other hand, the study with a high NER based on
COD removal (1.76 kWh/kg of COD) had a low NER based on the treated volume (0.026
kWh/m3). This may be caused by the different feeding rates and organic removal
efficiencies and/or rates in those studies. We suggest that future studies that focus on
energy recovery from wastewater should report NER values based on both the treated
volume and the removed COD.

14
Figure 2.1 Electricity generation in MFCs with different anode liquid volumes: (A) power density, (B) normalized energy recovery, and (C) normalized energy recovery.

15
2.3 Recovery of Electrical Energy from Different Substrates
Anode substrates, mostly organic compounds, are electron sources for electricity
generation in MFCs. Substrates can significantly affect the anode potential, the microbial
community, and the quality of the treated effluent, as well as the energy recovery. A wide
range of substrates, including acetate, glucose, wastewater, and petroleum compounds,
have been studied in MFCs for electricity generation (Pant et al., 2010).
Figure 2.2 Normalized energy recovery (A) and power density (B) of the MFCs treating different types of substrates. WW means wastewater. Error bars represent the
standard deviation.

16
Simple substrates such as acetate are expected to result in more electricity generation than
complex ones, because of (relatively) simpler degradation pathways that could have less
energy loss, which is demonstrated well in power production (Fig. 2.2B). For example,
acetate, which may be the most often used substrate in MFC research, leads to much higher
power densities than glucose (p < 0.03), sucrose (p < 0.01), or actual wastewaters (p < 0.01)
that are more complex. For energy recovery, acetate still exhibits a better performance than
actual wastewaters (p < 0.05), while the NERs from glucose are statistically similar to those
from wastewater (p > 0.05). The average NER with acetate is 0.25 kWh/m3 or 0.40 kWh/kg
of COD, and that with glucose is 0.18 kWh/m3 or 0.12 kWh/kg of COD; the average NER
with domestic wastewater is 0.04 kWh/m3 or 0.17 kWh/kg of COD, and industrial
wastewater results in a value of 0.10 kWh/m3 or 0.04 kWh/kg of COD (Fig. 2.2A). Large
variations associated with those values indicate the existence of some exceptional
performances (either extremely high or low) in a few studies. Domestic wastewater
generally has a low energy output based on the treated volume because of its low
concentration, which, however, may also lead to an NER based on COD removal
comparable to that of the pure organics, likely because of a better conversion of organics
into electrical energy with low-concentration organics compared to that of a high-
concentration organic stream.
To further examine the effect of substrate concentration on energy recovery, we plot NER
versus acetate in two different concentration ranges (expressed in COD), <500 and >500
mg/L (Fig. 2.3). Acetate was chosen because of the availability of a large sample size for
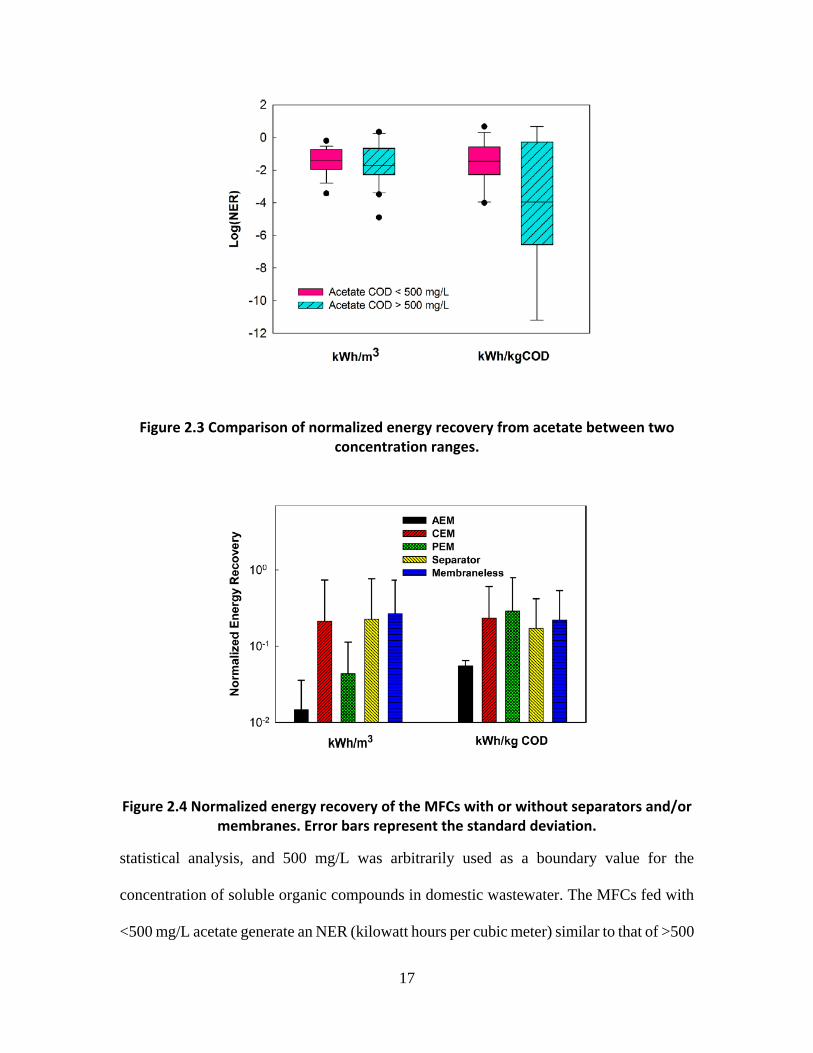
17
statistical analysis, and 500 mg/L was arbitrarily used as a boundary value for the
concentration of soluble organic compounds in domestic wastewater. The MFCs fed with
<500 mg/L acetate generate an NER (kilowatt hours per cubic meter) similar to that of >500
Figure 2.3 Comparison of normalized energy recovery from acetate between two concentration ranges.
Figure 2.4 Normalized energy recovery of the MFCs with or without separators and/or membranes. Error bars represent the standard deviation.

18
mg/L acetate, but the NER expressed in kilowatt hours per kilogram of COD from <500
mg/L acetate is significantly higher than that from the higher range. The implication of
these data may be that MFCs could be more suitable for treating low-strength wastewater,
in terms of energy recovery efficiency; in particular, there have not been effective methods
for recovering energy from low-strength wastewater, and anaerobic treatments are
generally not applied. High-strength wastewater, however, should still be treated by the
existing methods such as anaerobic digestion for the purpose of energy recovery, and
MFCs are generally not applicable because of the low efficiency of energy conversion from
high-strength substrates, for instance, compared with the efficiency of anaerobic digesters
(Ge et al., 2013c), unless there are some economic advantages of using MFCs (e.g.,
eliminating gas collection and generator), which requires precise assessment, or in the
places where the existing methods are not suitable (because of land use, operation, or other
issues).
2.4 Recovery of Electrical Energy in MFCs with or without Separators
Because of different reactions conducted in the anode and the cathode of an MFC, a good
separation between the two is required to prevent them from interfering with each other by
the diffusion of oxygen, organic compounds, and other compounds. This separation is
usually accomplished by using a solid electrolyte or oxygen gradient (e.g., in membrane-
less MFCs). The commonly used solid electrolytes include ion exchange membranes
[cation exchange membrane (CEM), anion exchange membrane (AEM), or proton
exchange membrane (PEM)] and other materials like textiles, woven fabrics, and glass
wool/beads as a separator (Li et al., 2011). The use of a separator may greatly affect an

19
MFC’s structure and capital cost, as well as its performance in contaminant removal and
energy recovery. Our analysis shows that, in general, the MFCs containing ion exchange
membranes (including AEM, CEM, and PEM) have a lower NER based on the treated
volume (0.14 ± 0.40 kWh/m3) than the membrane-less MFCs (0.23 ± 0.46 kWh/m3) (p <
0.05), while they have similar NERs based on the removed COD (0.29 ± 0.46 kWh/kg of
COD in the membrane-based MFCs vs 0.17 ± 0.30 kWh/kg of COD in the membrane-less
MFCs). We further analyzed the energy recovery with different separators, grouped into
AEM, CEM, PEM (Nafion membrane), separators (non-ion exchange membranes), and
membrane-less (Fig. 2.4). The MFCs with AEM exhibit lower energy recovery in both
units, in contrast to the level of power production in the AEM MFCs that was found to be
higher than that in the CEM MFCs (Li et al., 2011). However, the data from the AEM
MFCs were excluded from statistical analysis because of a small sample size. The PEM
MFCs have low energy recovery based on the treated volume, but comparable NER when
COD removal is used for data expression. The CEM, separator, and membrane-less MFCs
have similar energy performances.
2.5 Perspectives
Our analysis has exhibited a rough picture of the amount of energy that MFCs can recover.
We did not extend our analysis to other factors such as bacterial culture, different electron
acceptors, or cathode catalysts because of the significant fluctuation in energy data due to
the difference in reactor configuration, operation, bacterial culture, substrates, and other
factors. There is only one small step from power calculation to energy calculation, but it
really translates the research results into a language that the water/wastewater industry can

20
understand. NER may be a better parameter for comparison between different studies of
MFCs that focus on energy recovery than other parameters that are commonly reported in
MFC publications.
NER versus Power Density. Power density is the most widely reported parameter for
describing the performance of MFCs with respect to electricity generation. It does not show
energy recovery and does not involve factors such as the wastewater flow rate or the
organic loading/removal rate, thereby making it nearly impossible to compare between
different studies. In contrast, NER shows energy information and is based on wastewater
characteristics that are not directly dependent on MFC dimensions. Of course, power
production is still a critical factor and an essential parameter for calculating NER, and a
higher power output generally results in a higher NER. Future studies focusing on energy
recovery should work to improve NER, in addition to further improving power density.
NER versus Coulombic Efficiency (CE). CE is another parameter that is often used for
comparison, and it represents the conversion of organics into electrical charge. However,
a high CE does not necessarily mean a high energy recovery, because the CE calculation
is related to electrical current, and a high current (e.g., close to short-circuit current) results
in a high CE but very low power production (and thus a low energy recovery). Therefore,
for MFCs with energy recovery as a major objective, NER will be a better parameter than
CE for the purpose of comparison.
NER versus Energy Efficiency (EE). EE is the ratio of recovered energy to the heat of
combustion of the organic substrates supplied within the time frame (Logan et al., 2006).

21
Because the heat of combustion of wastewater is hard to measure or estimate (Heidrich et
al., 2011), EE is usually calculated for a synthetic solution with a known composition
(Logan et al., 2006). Thus, for wastewater-fed MFCs, NER will allow a cross-wise
comparison.
It should be noted that NER is a parameter with an emphasis on energy performance.
Because of the complexity of MFCs, a thorough comparison between different MFCs
should evaluate multiple parameters such as NER, Coulombic efficiency, power output,
hydraulic retention time, organic loading rate, removal efficiency, and even economic
factors (especially in future scaled-up systems).
The information about energy recovery helps to establish an energy balance, which can
show us how far we are from an energy-neutral (or energy-positive) treatment process by
using MFC technology. A precise estimation of energy consumption then becomes
important. In a continuously operated MFC, the major energy consumers are pumps (e.g.,
feeding and recirculation), and there are approaches for the theoretical estimation of the
energy requirement by pumps as described in the previous work (Kim et al., 2011b). As
we can see from the analysis, MFCs do not recover much energy. For example, the
theoretical energy content in organic compounds is ∼3.86 kWh/kg of COD, and MFCs
recover less than 2.0 kWh/kg of COD (most studies have NER values of <1.0 kWh/kg of
COD). Further improvement of energy recovery through optimizing configuration,
operation, microbiology, and materials will make MFCs more attractive. On the other hand,
adopting proper strategies to reduce the energy requirement of MFC operation may

22
compensate for low energy recovery; for example, a batch mode (e.g., a sequence batch
reactor) or intermittent mixing in a continuous mode may decrease the extent of energy
consumption by recirculation pumps. In addition, we may maximize the benefits of MFC
technology by incorporating it with other energy-producing processes such as anaerobic
digestion (Pham et al., 2006) and algal bioreactors (Xiao et al., 2012) or modifying it for
producing other energy carriers like hydrogen gas (Logan et al., 2008) or for creating
additional functions such as desalination (Kim & Logan, 2013), nutrient recovery (Kuntke
et al., 2012), and production of valuable chemicals (Rozendal et al., 2009).

23
CHAPTER 3
Effects of Draw Solutions and Membrane Conditions on Electricity Generation and Water Flux in Osmotic Microbial Fuel Cells
(This section has been published as: Ge, Z. and He, Z.* (2012) Effects of draw solutions
and membrane conditions on electricity generation and water flux in osmotic microbial
fuel cells. Bioresource Technology. Vol 109, pp 70-76.)
3.1 Introduction
The mission of wastewater treatment has transformed from simple contaminant removal to
a more sustainable task with a goal of less energy consumption and more water recovery.
‘‘Less energy consumption’’ requires a more efficient treatment process, and/or recovery
of energy from contaminants. Bioenergy can be produced from wastewater by means of
anaerobic digestion, microbial fuel cells, or photo-algal bioreactors (Angenent et al., 2004),
but none of those technologies can extract high-quality water from wastewater for water
reuse. ‘‘More water recovery’’ employs extensive post-treatments, usually through
membrane processes, to extract clean water for reuse. Those membrane processes such as
microfiltration, ultrafiltration, nanofiltration, and reverse osmosis consume intensive
energy due to the requirement of high hydraulic pressures and they encounter rapid
membrane fouling because of complex constituents present in wastewater (Shannon et al.,
2008). The energy contents in organic compounds are not harvested during those
membrane processes. Therefore, there is a strong need to develop a technology that can
take advantage of both energy-producing and water-extracting processes and integrate
them into a single process. A novel osmotic microbial fuel cell (OsMFC) has been
developed to simultaneously treat wastewater, extract clean water, and produce
bioelectricity (Zhang et al., 2011). To better understand OsMFCs, two important

24
components – forward osmosis and microbial fuel cells – are briefly introduced in the
following. Forward osmosis (FO) is water movement through a semi-permeable membrane
(e.g., FO membrane) from high water potential (feed solution) to low water potential (draw
solution) (Cath et al., 2006). Draw solution is a concentrated solution that has a high
osmotic pressure. Such a water movement does not require external energy input like that
in reverse osmosis; thus, FO is a low-energy process. FO has been studied and applied to
treat industrial wastewater and landfill leachate (Chung et al., 2011). Low membrane
fouling was observed with an FO membrane in an osmotic membrane bioreactor treating
the synthetic feed solution (Achilli et al., 2009). Microbial fuel cells (MFCs) are
bioelectrochemical reactors that can use microbial metabolisms to produce bioelectricity
(Logan et al., 2006). Anaerobic organisms in the anode of an MFC oxidize contaminants
and produce protons and electrons. Electrons transfer through an external circuit to the
cathode where they reduce oxygen to water; meanwhile, ions move across an ion exchange
membrane to keep a charge balance. MFCs have been investigated to treat various
wastewaters (Pant et al., 2010) or modified for beneficial functions such as hydrogen
production (Logan et al., 2008), caustic soda production (Rabaey et al., 2010) or
desalination (Cao et al., 2009).
OsMFCs integrate both FO and MFCs into one bioreactor by replacing ion exchange
membranes with FO membranes. This change helps to realize the extraction of high-quality
water from the wastewater during the electricity-generating process. The previous study
examined the feasibility of the OsMFC concept and found that OsMFCs could extract water
using either NaCl or seawater as a draw solution while still producing electricity (Zhang et
25
al., 2011). Electricity generation in OsMFCs was actually higher than that in conventional
MFCs, because of active proton movement with water flux. OsMFCs hold great promise
as a sustainable wastewater treatment technology. The key to developing an OsMFC
system is to combine FO (e.g., water flux) and MFC (e.g., electricity generation) into a
robust process. Before stepping into practical issues such as reactor configuration and
scaling up, it is necessary to understand the fundamental problems associated with this
combination, for instance, whether draw solutions that are commonly used in FO processes
can function as catholytes for electricity generation, how FO membrane fouling is affected
by the anolyte and affects OsMFC performance, and how the membrane can be cleaned
without much influence on microbial activities in the anode. It also should be noted that
the condition of an OsMFC is more complex than a conventional FO process because of
microorganisms, electrode installation, cathode aeration and electricity generation;
therefore, the difference is expected between the two processes in issues such as membrane
fouling and reversal salt flux, which require an extensive research investigation.
In this study, several representative draw solutions were examined in an OsMFC for both
electricity generation and water flux. The effect of draw solutes’ concentrations and pH
controlling via acid addition was also investigated. FO membranes under different
conditions (new, fouled, and/or dried) were tested in the OsMFC. Backwash of FO
membrane was conducted by dosing NaCl into the anolyte.

26
3.2 Materials and Methods
3.2.1 OsMFC setup and general operation
The OsMFC system consisted of two equal-size compartments of anode and cathode (Fig.
3.1). The total liquid volume of each compartment was 140 mL. The liquid volume of the
catholyte was 240 mL, including the cathode compartment and a flask attached to the
cathode. The compartments were glass bottles connected by an FO membrane (Hydration
Technology Innovations, LLC, Albany, OR, USA). Before use, FO membranes were
soaked in deionized water for 30 min according to the manufacturer’s instructions. For
comparison, some studies replaced the FO membrane with a cation exchange membrane-
CEM (Membrane International Inc., Ringwood, NJ, USA) to form a conventional MFC.
The surface area of each membrane was about 6.4 cm2. More details of the anode and
cathode electrodes can be found in a previous publication (Zhang et al., 2011). The
electrodes were connected by copper wires to an external resistor of 10 Ω. Both
compartments were continuously stirred with magnetic bars. A 100 mL flask placed on a
digital balance was used to scale the water moved through the FO membrane into the
cathode compartment. The OsMFC was operated under a room temperature of ~20 ºC.
The anode was fed continuously with a solution that was prepared containing (per L of
deionized water): sodium acetate, 2 g; NH4Cl, 0.15 g; MgSO4, 0.015 g; CaCl2, 0.02 g;
NaHCO3, 0.1 g; KH2PO4, 0.53 g; K2HPO4, 1.07 g; and trace element, 1 mL (He et al.,
2006). The cathode was operated in batch mode in all experiments and the catholyte was
recirculated at 20 mL/min. The cathode compartment was aerated with the air at a flow rate
of 30 mL/min. This aeration could reduce water production via evaporation but the loss
was not significant in the present study.

27
3.2.2 General measurement and analysis
The cell voltage was recorded every 5 min by a digital multimeter (2700, Keithley
Instruments Inc., Cleveland, OH, USA). The pH was measured using a benchtop pH meter
(Oakton Instruments, Vernon Hills, IL, USA). The conductivity was measured by a
benchtop conductivity meter (Mettler-Toledo, Columbus, OH, USA). The concentration of
chemical oxygen demand (COD) was measured using a colorimeter (Hach DR/890, Hach
Company, Loveland, CO, USA). Water flux into the cathode (L m-2 h-1 – LMH) was
calculated by the change of weight recorded on the balance.
3.2.3 Specific testing conditions
3.5.3.1 Draw solutions test
Figure 3.1 Experimental setup of an osmotic microbial fuel cell.

28
Four draw solutions at a concentration of 1 M each, including NaCl, potassium phosphate
buffer (PPB), CaCl2 and glucose, were tested individually. One mole of PPB contained 53
g of KH2PO4 and 107 g of K2HPO4. The anode was continuously fed at a hydraulic
retention time (HRT) of 2 h. The data were collected from the short-term (4 h) tests of both
water flux and electricity generation and the change of catholyte weight was recorded
hourly. The pH and conductivity of the catholyte was measured before and after each test.
3.5.3.2 PPB concentrations
Four PPB solutions (50, 100, 200 and 500 mM) were tested to investigate the effect of
solute concentrations. The initial pH of those buffer solutions was about 7. The HRT of the
anolyte was adjusted to 10 h for this test. The data of electricity generation were collected
in a 24 h testing period. The weight of the catholyte was recorded hourly in the first 4 h
duration and the last 2 h duration and the pH and conductivity of catholyte were collected
at hours 0, 4, and 24.
3.5.3.3 pH controlling with acid addition
To control the pH of the NaCl catholyte, 5 mL of 50-fold dilution of 37% HCl was dosed
into the catholyte every 12 h. The pH and conductivity of catholyte were recorded every
12 h. The total volume of the catholyte was kept at about 240 mL after HCl dosing. The
initial NaCl concentration in the cathode of this test was 0.8 M. The HRT of the anolyte
was 10 h.
3.5.3.4 Membrane conditions

29
The FO membranes were tested under several conditions, including new membrane, new
membrane that was dried after soaking (‘‘new & dried’’), fouled membrane, and fouled
membrane that was dried (‘‘fouled & dried’’). For comparison, a new CEM also was
evaluated in the OsMFC. The performance of the OsMFC with those membranes was
monitored for 22 h. A 1 h short-term experiment was carried out to investigate the fouled
and dried membrane. Electricity generation, conductivity of anolyte and catholyte, weight
of overflow catholyte and pH were measured. The HRT of the anolyte was 10 h in those
tests.
3.5.3.5 FO membrane backwash
In the backwash test, NaCl was dosed into the anode compartment acting as a draw solute
and deionized water was fed into the cathode compartment as a feed solution. The OsMFC
was operated for 24 h before the first backwash. Five backwash cycles (6 operation cycles
for the OsMFC) were conducted using 0.2, 0.3, 0.3, 0.5, and 0.5 M of NaCl for the
backwash period of 1, 1, 2, 1 and 1 h, respectively. The anode operation was switched to
batch during the backwash and then resumed to continuous operation after the backwash.
When adding 0.5 M NaCl, the anolyte was replaced with a fresh feeding solution after the
backwash. During the backwash electricity generation and water flux were measured. The
digital balance was connected to a PC through a USB cable controlled by software (Logger
Pro, Vernier Software & Technology, Portland, OR, USA) to record the change of
catholyte weight. The recording rate was one data point/min and two data points/min for
the OsMFC operation and the backwash, respectively.

30
3.3 Results and Discussion
3.3.1 Effects of draw solutions on the OsMFC performance
3.3.1.1 Types of draw solutions
Four representative draw solutions (1 M each) were tested as catholytes in the OsMFC.
Sodium chloride (NaCl) is the most commonly used draw solute in FO processes (Achilli
et al., 2010); PPB is widely applied in MFC operations (Logan et al., 2006); calcium
chloride (CaCl2) is a divalent chemical that has exhibited a high osmotic pressure compared
with other draw solutes (Cath et al., 2006); and glucose represents sugar-based draw solutes
that can be applied to the food industry without the need of being re-concentrated.
Electricity generation was observed with three draw solutes but not with glucose (Fig.
3.2A). The highest current (>2.5 mA) was generated from the PPB catholyte, while the
NaCl and CaCl2 catholytes produced a slightly lower electric current. Water flux, on the
other hand, behaved differently from electricity generation (Fig. 3.2B). An increasing water
flux was obtained with the PPB and NaCl catholytes and at the end of the 1 h testing period,
both achieved water flux of 2.51–2.69 LMH. However, the opposite trend of water flux
occurred with the CaCl2 and glucose catholytes, dropping to ~0.56 LMH after 4 h. An
extended test to 20 h showed that water flux with the CaCl2 and glucose catholytes
remained below 0.45 LMH. During the same period, the PPB catholyte maintained a water
flux of ~2.42 LMH and the NaCl catholyte had a decreased water flux to 1.82 LMH. To
understand why those draw solutions (catholytes) produced different results of electricity
generation and water flux, the variation of catholyte pH and conductivity during the testing
period was monitored. The oxygen reduction in the cathode of an MFC can elevate pH and
a higher catholyte pH will cause a larger overpotential, thereby reducing electricity
31
generation (Rozendal et al., 2006). The pH of the NaCl catholyte increased from 7.0 to 9.6
within 4 h. The CaCl2 catholyte had a final pH of 9.7. Those high catholyte pHs could
result in a weaker electricity generation, as suggested by the present results and a previous
study (Zhang et al., 2011). Meanwhile, the pH of the PPB catholyte that produced the
highest current varied between 7.2 and 7.3, because of its strong buffer capacity. Although
the glucose catholyte had the lowest pH of 6.0–6.7, it produced very little electricity
Figure 3.2 The short-term (4 h) test of different draw solutions: (A) current generation and (B) water flux.

32
because of extremely low conductivity. It is known that increasing catholyte conductivity
can improve electricity generation in MFCs (Gil et al., 2003). The current generation with
the glucose catholyte actually increased slightly from 0.01 to 0.06 mA within 4 h, possibly
because water flux from the anode compartment introduced ions into the catholyte and thus
added a little conductivity. Due to this water flow, the glucose concentration in the cathode
was reduced by about 5.4% (from 1230 to 1163 mg COD/L). With the dilution effect from
water flux, the conductivities of the other three draw solutions also decreased (data not
shown).
It was unexpected that the CaCl2 catholyte had much less water flux than the NaCl
catholyte while producing a similar amount of electricity (Fig. 3.2). Previous FO studies
found that CaCl2 has a higher osmotic pressure than NaCl at the same concentration (Cath
et al., 2006). When using the CaCl2 catholyte, chemical precipitation appeared (in gray) on
the FO membrane facing the anode. It is likely that calcium ions migrated from the cathode
compartment into the anode compartment and combined with phosphate or carbonates in
the anolyte to form precipitation on the membrane surface. Such reverse salt flux has been
reported in FO processes (Phillip et al., 2010). In addition, the CaCl2 catholyte had a high
initial pH of 10, which should be unfavorable for oxygen reduction. However, this high
initial pH did not obviously impede electricity generation, compared with the NaCl
catholyte, likely due to the higher conductivity of the CaCl2 catholyte. One mole of the
CaCl2 catholyte had a conductivity of 120.1 mS/cm; at the end of the 4 h test, its
conductivity was still 116.8 mS/cm. Meanwhile, one mole of the NaCl catholyte had a
conductivity of 83.5 mS/cm, which dropped to 77.7 mS/cm after the 4 h test. Those results

33
suggested that CaCl2, although a good draw solution for FO processes, may not be suitable
as a catholyte chemical in OsMFCs.
The study demonstrated that an ideal draw solution (catholyte) for OsMFC application
should possess a certain ability of pH buffering, have a high conductivity, and not form
membrane scaling. Another important criterion (in some applications) is how efficiently it
can be reconcentrated after dilution in FO processes. The common approach for
reconcentration is to use reverse osmosis, which consumes intensive energy (Chung et al.,
2011). Researchers have discovered new solutes such as ammonia–carbon dioxide
(McCutcheon et al., 2005) and soluble magnetic nanoparticles (Ling et al., 2010) that can
be recovered through low-energy processes. Ammonia–carbon dioxide was not tested in
the OsMFC because the high pH due to cathode reactions and aeration with air bubbles
would drive ammonia out of the solution, similar to ammonia stripping (Quan et al., 2009).
The loss of ammonia will decrease ammonium concentration and thus water flux. It
remains to be explored whether soluble magnetic nanoparticles can be applied as cathode
solutes in OsMFCs. The draw solution that does not require reconcentration, such as
seawater and fertilizer (Phuntsho et al., 2011), will also be of strong interest to OsMFC
development.
3.6.1.2 PPB concentrations
The PPB catholyte exhibited an advantage in both electricity generation and water flux.
Thus, the PPB catholyte was further investigated at different concentrations varying from
50 to 500 mM. Clearly, the PPB concentrations affected the OsMFC performance, and a

34
higher PPB concentration led to a better result of both current generation and water flux
(Fig. 3.3). It was also found that current generation, compared with water flux, received
less influence from the PPB concentration. The pHs of the PPB catholytes that were
between 100 and 500 mM remained about 7.3 during the 24 h testing period. The 50 mM
Figure 3.3 The effect of PPB concentrations on the OsMFC performance: (A) current generation and (B) water

35
PPB had a slightly higher final pH of 7.6, because of a weaker buffering capacity. Although
the 500 mM PPB catholyte contained conductivity more than twice that of the 200 mM
PPB catholyte, the two catholytes produced a similar amount of electricity, indicating that
increasing catholyte conductivity beyond a certain point would not help to increase
electricity generation. Water flux was affected more significantly by the PPB concentration,
as a higher concentration can create a larger osmotic pressure, which is the driving force
of water flux. The 50 mM PPB catholyte had the lowest water flux because of its low
conductivity of 7.7 mS/cm that created the smallest difference of osmotic pressure between
the anolyte and the catholyte among the tested PPB concentrations. This low conductivity
could also contribute to low electricity generation. The results indicated that when
determining the concentration of draw solution for OsMFCs, the anolyte conductivity
should be considered. Some special wastewaters such as food wastewater contain high
salinity and will require a much higher conductivity in the draw solution.
Figure 3.4 Buffering the pH of the NaCl solution with dosing acid. The arrows indicate the addition of acid to the draw solution.

36
3.3.1.3 Acidified NaCl catholyte
As a simple and low cost chemical, NaCl is the most commonly used draw solute in FO
processes. However, the lack of pH buffering capacity hinders its application in OsMFCs.
To overcome this problem, the pH of the NaCl catholyte was adjusted with hydrochloric
acid (HCl). When the pH of the NaCl catholyte increased to above 9.0, HCl was added to
reduce the pH to 2.5. This action increased the current generation by almost 50% in a short
period and then the current decreased because of increased pH caused by oxygen reduction
(Fig. 3.4). However, water flux was not significantly affected by HCl addition. The
decreased water flux was likely a result of both the decreased conductivity (from 65.1 to
50.7 mS/cm) and membrane fouling. Adding HCl would increase conductivity, but this
increase was negligible compared with conductivity reduction by water dilution, because
of the small volume of HCl added.
Although adding HCl to neutralize the alkalinity may complicate the OsMFC operation,
the NaCl–HCl combination has some advantages compared with the PPB catholyte. First,
the cost of the NaCl–HCl combination is much lower than that of the PPB catholyte. Based
on the price information from Sigma–Aldrich (St. Louis, MO, USA) from whom the
chemicals were purchased and the quantities used in this study, it is estimated that the
chemicals cost $0.25/day for the NaCl–HCl combination and $1.76/day for the PPB
catholyte for operating the present OsMFC. If HCl is added more frequently, for instance
10 times the current frequency, to maintain a constantly high current generation, the cost
will increase to $0.36/day, still significantly lower than the cost of the PPB. This cost
difference will substantially affect operating expense at full scale applications. Second, the

37
use of the NaCl–HCl combination is more environmentally friendly than the PPB catholyte.
Because of reverse salt flux during FO processes, phosphate could migrate into the anode
compartment and be discharged with the anode effluent (treated wastewater). Phosphorous
is a key inorganic contaminant and its concentration must be maintained at a low level in
wastewater effluent. An overload of phosphorous (with other nutrients) can cause
eutrophication that deteriorates natural water bodies.
Figure 3.5 Current generation in the OsMFC with FO membranes (an a CEM) under different conditions (A) and the 1-h test of the fouled & dried FO membrane (B).

38
3.3.2 Effects of membranes on the OsMFC performance
3.3.2.1 Membrane conditions and types
The OsMFC performance was investigated with FO membranes under different conditions
that were compared with cation exchange membrane (CEM) (Fig. 3.5A). The NaCl
solution was used as the draw solution in those tests. The electricity production with a new
FO membrane was higher than that with a new CEM, confirming the finding in a previous
study (Zhang et al., 2011). This difference was attributed to a proactive proton transport
with water flux through the FO membrane. Increasing electricity generation in MFCs via
the improved proton movement has also been realized by using ammonium ions as a proton
shuttle (Cord-Ruwisch et al., 2011). No obvious water flux was observed with the CEM
(data not shown). It was expected that the OsMFC operation would cause FO membrane
fouling, but the fouled FO membrane led to higher electricity generation (50% more) than
the new FO membrane. When the fouled membrane was dried in the air and then reused in
the OsMFC, the current generation was further increased to ~4 mA. For comparison, a new
FO membrane was soaked in water, dried and then used in the OsMFC. This new and dried
FO membrane resulted in lower electricity production than a new FO membrane (soaked
in water and then used in the OsMFC). Water flux with the new and dried membrane was
about 0.39 LMH after 22 h operation, much lower than 2–3 LMH with a new FO membrane.
Those results demonstrated that a soak-dry process would seriously damage the FO
membrane, which is in agreement with the manufacturer’s suggestion that FO membranes
should be stored in water after the first-time soaking.
No water flux was observed with the fouled FO membranes, although they had more
electricity generation. On the contrary, water loss occurred in the cathode compartment in

39
the presence of the fouled and dried membrane. To further confirm and understand this
phenomenon, electricity, conductivity and water loss was monitored with the fouled and
dried FO membrane (Fig. 3.5B). During the 1 h test, current generation was mostly above
3.5 mA, similar to the 22 h test shown in Fig. 3.5A. The conductivity of the catholyte (85.1
mS/cm) did not obviously change, but the conductivity of the anolyte clearly increased
from 8.6 to 38.0 mS/cm. Meanwhile, the weight of the catholyte decreased from 269 to
193 g. Those results indicated that the fouled and dried FO membrane had completely lost
FO function; it allowed the catholyte to intrude into the anode compartment and this high-
salinity flux increased the conductivity of the anolyte, which explained why higher
electricity was produced with the fouled and dried FO membrane. The results also indicated
that the anode (freshwater) microbes could tolerate salt flux to a certain degree and
maintained a stable performance of electricity generation under a saline condition (a
conductivity of 38.0 mS/cm is equivalent to about 22 g NaCl/L). This could be an important
implication for the future application of OsMFCs, because reverse salt flux often happens
during the FO process. This feature might also help conduct membrane backwash, which
is addressed in the following.
3.3.2.2 Membrane backwash
The fouling of the FO membrane occurred during OsMFC operation, revealed by both
direct observation of the membrane condition and a decrease in water flux. Backwash was
employed to reduce membrane fouling. Unlike a conventional FO reactor that can apply a
high-salinity solution in its feeding side for backwash, OsMFCs contain a microbial
community in the anode (the feeding side) that would be adversely affected by a shock

40
from a high salt solution. Thus, a low concentration of NaCl (0.2–0.5 M) was added to the
anolyte as draw solution and deionized water in the cathode as feed solution. As shown in
Fig. 3.6, backwash did not obviously alleviate the decrease in water flux. A longer
backwash time (e.g., 2 h backwash during the second addition of 0.3 M NaCl) led to a
faster decrease after backwash. A higher concentration of NaCl (0.5 M) did not result in a
better water flux, compared with 0.2 and 0.3 M of NaCl. As expected, the overall trend of
water flux decreased, likely due to the accumulated fouling (Fig. 3.6A). The generation of
electric current was clearly improved after each backwash (Fig. 3.6B), possibly because of
the increased conductivity of the anolyte with the additional salt.
Figure 3.6 Water flux (A) and current generation (B) during the test of backwash. The arrows indicate the addition of NaCl into the anode compartment.

41
This study was an early attempt to reduce FO membrane fouling in OsMFCs and the results
demonstrated the challenge of cleaning an FO membrane in OsMFCs because of the need
to maintain microbial functions during the cleaning process. A strong acid/base solution
that is commonly used to clean membranes is not appropriate in OsMFCs because of the
severe effect on microbes, unless FO membranes can be removed from the reactor. Future
approaches to clean FO membranes in OsMFCs may consider the use of chemicals that are
less harmful to microbes at high concentrations, improved membrane design for anti-
fouling, recirculation of biogas in the anode to reducing fouling (similar to that in anaerobic
membrane bioreactors), and/or design of removable anode electrodes to accommodate the
cleaning process. In addition, a reliable FO membrane is one of the key factors to the
successful application of OsMFCs. The membrane used in this study is sensitive to fouling
and dehydration. The CEM, on the other hand, is more durable. A stable performance of
electricity generation in MFCs could be achieved with a CEM that was soaked and dried
multiple times (unpublished data). Moreover, membrane fouling is also less serious with
CEM because of the mechanism of ion exchange. MFCs with CEM could be continuously
operated for 1 year and no significant decrease in electricity production was observed
(Zhang et al., 2010). However, CEM does not have the function of extracting clean water
from the anolyte (e.g., wastewater). The cost of FO membranes ($30/m2 according to the
manufacturer) is also significantly lower than that of CEM ($97/m2). Therefore, FO
membranes have both functional and economic advantages over CEM and will be
applicable in OsMFCs if an effective strategy can be developed to reduce membrane
fouling.

42
3.4 Conclusions
This study demonstrated that an optimal catholyte for OsMFCs should meet several criteria,
including low cost, high conductivity for both water flux and electricity generation, and be
environmentally friendly. A good draw solution used in an FO or a good catholyte applied
in an MFC does not always work well in an OsMFC and must be examined for its suitability
for OsMFCs. The FO membrane fouling adversely affected water flux; adding salt into the
anode for backwash did not obviously alleviate membrane fouling. Those findings will
help to understand the critical factors towards developing a practical OsMFC system.

43
CHAPTER 4
Reducing Effluent Discharge and Recovering Bioenergy in an Osmotic Microbial Fuel Cell Treating Domestic Wastewater
(This section has been published as: Ge, Z., Ping, Q., Xiao, L. and He, Z.* (2013) Reducing
effluent discharge and recovering bioenergy in an osmotic microbial fuel cell treating
domestic wastewater. Desalination. Vol 312, pp 52-59.)
4.1 Introduction
Development of sustainable wastewater treatment aims to recover energy and useful
resource from wastewater with more efficient contaminant removal (McCarty et al., 2011).
Among the emerging developments, microbial fuel cells (MFCs) is a promising technology
for direct electricity production from wastewater through microbial oxidation of organic
contaminants (Logan et al., 2006). MFCs can effectively treat various
contaminants/substrate (Pant et al., 2010) and generate bioelectricity that is potentially
useful (McCarty et al., 2011); research has moved toward scaling up the MFC system for
examining its feasibility of practical application (Logan, 2010). In addition to MFCs’
conventional functions of contaminant removal and bioelectricity generation, a new
function is proposed regarding effluent discharge: recovering high-quality water for water
reuse (He, 2012). Membrane separations are usually considered for this type of application
but they are energy intensive because of high hydraulic pressures; membrane fouling is
another major concern. Forward osmosis (FO), as a low-energy and low-fouling
technology (Cath et al., 2006; Chung et al., 2012; Hoover et al., 2011), is of special interest
to MFC development, and in fact, FO has been integrated into an MFC for simultaneous
bioenergy production and water extraction (Zhang et al., 2011).

44
The MFC using an FO membrane as a separator between its anode and cathode is called
osmotic microbial fuel cell (OsMFC) (Zhang et al., 2011). Such cooperation between
MFCs and FO takes advantages of both processes and can accomplish multiple functions
within one system. The use of FO membrane improved electricity generation in an OsMFC,
compared with a conventional MFC that contained a cation exchange membrane. It was
found that active movement of water due to osmosis promoted proton transport and
buffered the pH of the catholyte, both of which are important to electricity generation in
MFCs (Rozendal et al., 2006). A higher salinity of the catholyte (and thus a higher osmotic
pressure) benefited both electricity generation and water flux (Zhang et al., 2011). The
OsMFC worked with both sodium chloride and artificial seawater. Further investigation
demonstrated that, among four draw solutes that were tested, sodium chloride resulted in
the best performance of both electricity generation and water flux (Ge & He, 2012).
Phosphate buffer solution that is commonly used in the MFC studies did not appear to be
a suitable draw solute because of high cost and potential release of phosphorus due to
reverse salt flux; neither calcium chloride nor glucose led to a good electricity production,
because of fouling or low conductivity. The concept of OsMFCs is also applied to
microbial desalination cells (MDCs) (Cao et al., 2009; Jacobson et al., 2011), creating an
osmotic MDC (OsMDC) (Zhang & He, 2012). The OsMDC achieved a better salinity
reduction in saline water than an FO process, because of the combined water flux (dilution)
and electricity generation (salt removal). Compared with a conventional MDC, the OsMDC
can recover more water for the purpose of water reuse.

45
While the OsMFCs appear promising, we must understand the challenges associated with
its development. Compared with an FO process, it is more difficult to clean the membrane
fouling in an OsMFC because of the presence of electrodes and biofilm that complicates
its structure and raises the issue of microbial effects (Ge & He, 2012). The requirement of
aeration (or a terminal electron acceptor) to complete the cathode reaction restricts the
application of some popular draw solutes such as ammonia-carbon dioxide (McCutcheon
et al., 2005). Reverse salt flux (Phillip et al., 2010) could introduce undesired ions into
wastewater effluent, which will affect the receiving water body. Nevertheless, those
challenges and others warrant further investigation.
Our previous studies of OsMFCs (or OsMDCs) adopted synthetic organic solution as the
anode feeding solution. To examine OsMFCs’ compatibility with more complex substrates,
we tested actual domestic wastewater in this study. A synthetic acetate solution was still
used to start up the OsMFC and to investigate the effect of recirculation rates. After a stable
performance was achieved with acetate solution, the anode feeding solution was switched
to domestic wastewater. We monitored both electricity generation and water flux with the
wastewater and studied the influence of hydraulic retention time. Membrane fouling was
characterized using electrochemical techniques and chemical analysis.
4.2 Materials and Methods
4.2.1 OsMFC setup
The OsMFC consisted of two equal-size compartments (14 x 7 x 3.7 cm3/each) as the anode
and the cathode, separated by an FO membrane (Fig. 4.1). The liquid volume of each
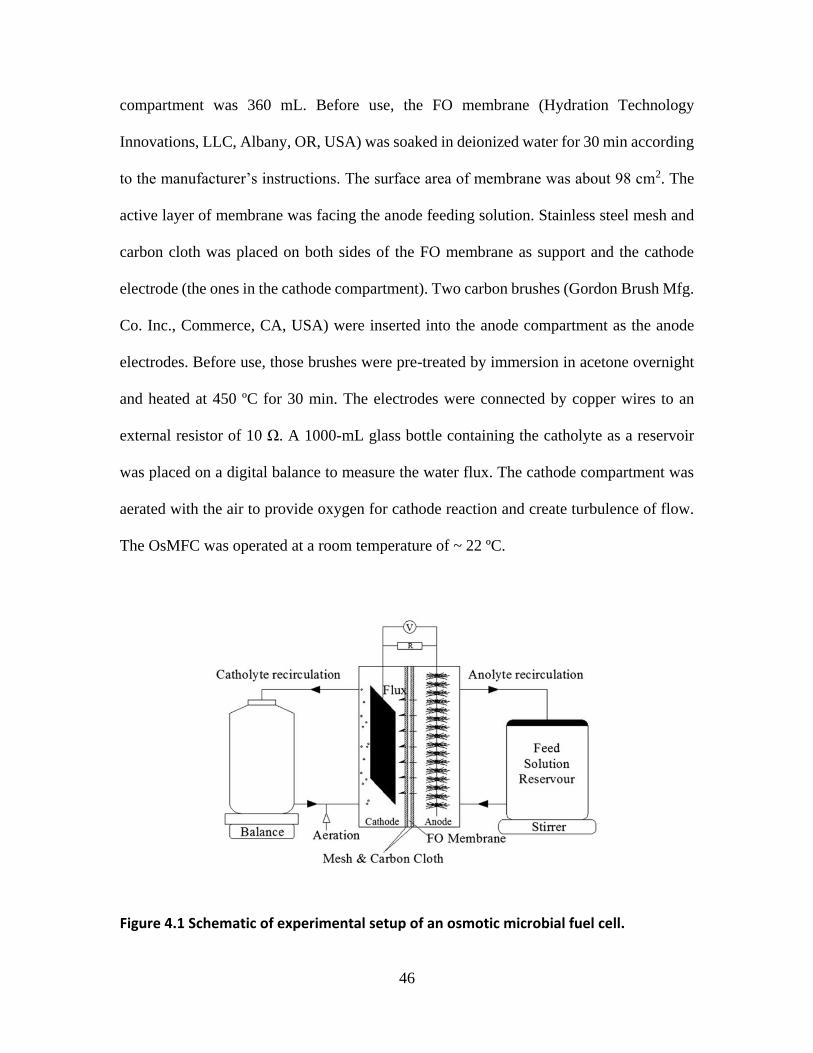
46
compartment was 360 mL. Before use, the FO membrane (Hydration Technology
Innovations, LLC, Albany, OR, USA) was soaked in deionized water for 30 min according
to the manufacturer’s instructions. The surface area of membrane was about 98 cm2. The
active layer of membrane was facing the anode feeding solution. Stainless steel mesh and
carbon cloth was placed on both sides of the FO membrane as support and the cathode
electrode (the ones in the cathode compartment). Two carbon brushes (Gordon Brush Mfg.
Co. Inc., Commerce, CA, USA) were inserted into the anode compartment as the anode
electrodes. Before use, those brushes were pre-treated by immersion in acetone overnight
and heated at 450 ºC for 30 min. The electrodes were connected by copper wires to an
external resistor of 10 Ω. A 1000-mL glass bottle containing the catholyte as a reservoir
was placed on a digital balance to measure the water flux. The cathode compartment was
aerated with the air to provide oxygen for cathode reaction and create turbulence of flow.
The OsMFC was operated at a room temperature of ~ 22 ºC.
Figure 4.1 Schematic of experimental setup of an osmotic microbial fuel cell.

47
4.2.2 OsMFC startup
To develop the desired biofilm on the anode electrodes, the OsMFC began as a
conventional MFC using a cation exchange membrane (CEM, Membrane International Inc.,
Ringwood, NJ, USA) between the anode and the cathode compartments. The anode was
inoculated by using raw sludge from a primary sedimentation and digestion sludge
(Southshore Wastewater Treatment Plant, Milwaukee, WI, USA). To increase current
generation, the external resistance was adjusted gradually from 2000 to 10 Ω. The catholyte
was 50–100 mM of phosphate buffer solution. Once a stable current output was achieved,
the MFC reactor was opened and the CEM was replaced by the FO membrane while
keeping the anode and the cathode electrodes intact. In that way, the MFC was converted
to an OsMFC.
4.2.3 OsMFC fed on acetate solution
The OsMFC was first operated on an acetate solution to examine the system performance
and the effect of recirculation rates. The anode was fed in a batch mode with an acetate
solution containing (per L of DI water): sodium acetate, 2 g; NH4Cl, 0.15 g; MgSO4, 0.015
g; CaCl2, 0.02 g; NaHCO3, 0.1 g; KH2PO4, 0.53 g; K2HPO4, 1.07 g; and trace element, 1
mL (He et al., 2006). Sodium chloride solution (2 M) was used as the catholyte and
supplied in a batch mode. Both anolyte and catholyte were recirculated by peristaltic pumps
at the same rate ranging from 100 mL/min to 400 mL/min. At the end of a cycle (22–24 h),
the anolyte and catholyte remaining in the reservoir bottles were replaced with 500 mL
fresh acetate solution and fresh 2 M NaCl solution, respectively. The cathode compartment

48
was filled with DI water for 2 h to rest the FO membrane before refilling with the new
catholyte.
4.3.4 OsMFC fed on domestic wastewater
Domestic wastewater (primary effluent) was collected from Southshore Wastewater
Treatment Plant (Milwaukee, WI, USA) and used as the anode feed solution. The OsMFC
was first operated in a batch mode: the anolyte (wastewater) was replaced every 24 h and
the cathode (2 M NaCl) solution was completely replaced after a 46-h cycle. After several
cycles, the reactor was then operated in continuous flow mode. The HRT of the anode feed
was 10 h (based on the anode liquid volume) for the first 10-day duration and then adjusted
to 24 h for 9 days by changing the anode feeding flow rate. The recirculation rates for both
the anolyte and catholyte were 100 mL/min. To examine the effect of recirculation rate on
water flux, the catholyte recirculation rate was raised to 3000 mL/min without aeration for
several hours. At the same time, the anolyte HRT was adjusted to about 3 h to ensure a
sufficient supply of the anode feed solution. The tests of high catholyte recirculation rate
were conducted with and without the carbon cloth that was initially installed on both sides
of the FO membrane (Fig. 4.1).
4.2.5 Measurement and analysis
The cell voltage was recorded every 3 min by a digital multimeter (2700, Keithley
Instruments Inc., Cleveland, OH, USA). The pH was measured using a benchtop pH meter
(Oakton Instruments, Vernon Hills, IL, USA). The conductivity was measured by a
benchtop conductivity meter (Mettler-Toledo, Columbus, OH, USA). The polarization

49
curve was performed by a potentiostat (Reference 600, Gamry Instruments, Warminster,
PA, USA) at a scan rate of 0.2 mV/s. The volumetric densities of power and current were
calculated based on the liquid volume of the anode compartment, according to a previous
study (Zhang et al., 2010). The concentration of chemical oxygen demand (COD) was
measured using a colorimeter (Hach DR/890, Hach Company, Loveland, CO, USA). Water
flux into the cathode (L·m−2·h−1, LMH) was calculated by the change of weight recorded
on the balance. The water flux test procedures and the measurements using energy
dispersive spectrometer (EDS), electrochemical impedance spectroscopy (EIS), and
scanning electron microscopy (SEM) can be found in the supplementary data. The
efficiency of organic-to-electricity was expressed by coulombic recovery (CR) and
coulombic efficiency (CE), calculated as follows:
𝐶𝑅 =𝑄𝑜𝑢𝑡𝑝𝑢𝑡
𝑄𝑖𝑛𝑝𝑢𝑡=
∑ 𝐼(𝐴)𝑡(𝑠)
96485(𝐶
𝑚𝑜𝑙 𝑒− )×𝐶𝑂𝐷𝑡𝑜𝑡𝑎𝑙(𝑚𝑜𝑙)×4(𝑚𝑜𝑙 𝑒−
𝑚𝑜𝑙 𝑂2) (4.1)
𝐶𝐸 =𝑄𝑜𝑢𝑡𝑝𝑢𝑡
𝑄𝑖𝑛𝑝𝑢𝑡−𝑟=
∑ 𝐼(𝐴)𝑡(𝑠)
96485(𝐶
𝑚𝑜𝑙 𝑒− )×𝐶𝑂𝐷𝑟𝑒𝑚𝑜𝑣𝑒𝑑(𝑚𝑜𝑙)×4(𝑚𝑜𝑙 𝑒−
𝑚𝑜𝑙 𝑂2) (4.2)
where Qoutput is the produced charge, Qinput is the total charge available in the added organic
compounds, Qinput-r is the total charge available in the removed organic compounds, I is
electric current and t is time. CODtotal is the total COD input to the anode compartment in
the period of time t, and calculated based on the initial COD concentration multiplied by
the initial anolyte volume. CODremoved is the removed COD within time t. The removed
COD was also expressed in percentage as a ratio of initial COD input and final COD
remained.

50
Energy consumption in the OsMFC was mainly due to the recirculation of the anolyte and
the catholyte by pumps. The power required for the recirculation pump was estimated as
Eq. 4.3 (Kim et al., 2011):
𝑃 =𝑄𝛾𝐸
1000 (4.3)
where P is power requirement (kW), Q is flow rate (m3/s), γ is 9800 N/m3, and E is the
hydraulic pressure head (m). For the OsMFC, Q was 1.67 × 10− 6 m3/s (100 mL/min) for
both anode and cathode recirculation, and the measured hydraulic pressure head loss was
0.01 m; thus, the total power required for the recirculation pumps was 1.6 × 10⁻⁷ kW.
4.3 Results and Discussion
4.3.1 OsMFC fed on acetate solution
The OsMFC generated electricity and produced water flux with the acetate solution.
Polarization test demonstrated that the open circuit potential was 0.6 V (Fig. 4.2). The
maximum current density was 136.3 A/m3 and the maximum power density was 28.2 W/m3,
much higher than that of our previous OsMFC fed with the similar acetate solution (Zhang
et al., 2011). This increased performance of electricity generation resulted from an
optimized configuration of the present OsMFC, compared with the previous one that
consisted of two glass bottles with a small membrane surface area and was inefficient for
electricity generation. The batch operation exhibited a current profile affected by the
organic substrate: the current increased upon the replacement of the anode solution,
fluctuated (between 40 and 50 A/m3) for more than 20 h and decreased due to the depletion
of the organic substrates (Fig. 4.3A). The OsMFC removed 83.5 ± 8.5% of COD at an
initial COD loading rate of 0.6 ± 0.1 kg/m3/d, and achieved a CE of 28.9 ± 7.3% and a CR

51
of 23.8 ± 5.7% (Table 4.1). Increasing the recirculation rates of both the anolyte and the
catholyte from 100 to 200 mL/min clearly improved electricity generation with an
increased electric charge from 716.2 to 1222.8 C; however, further increase in the
recirculation rates to 300 and 400 mL/min did not obviously affect electricity generation,
suggesting that mixing intensity above 200 mL/min might be sufficient for substrate
distribution within the anode compartment. A similar result of recirculation rate was
observed in our previous studies of a conventional MFC (Zhang et al., 2010). The pH of
the catholyte increased to 9.9 ± 0.4, because of the cathodic oxygen reduction reaction
(Zhao et al., 2006); while the pH of the anolyte slightly decreased to 6.4 ± 0.3 in a cycle of
22-h operation (Table 4.1).
Figure 4.2 Polarization curves of the OsMFC treating acetate solution.

52
Operation Substrate pH SCOD
Removal
(%)
CE
(%)
CR
(%)
Average
Flux
(LMH)
Effluent
Reduction
(%) Anode Cathode
Batch
mode
Acetate
(22 h) 6.4±0.3 9.9±0.4 82.5±9.0 20.9±6.9 17.1±5.6 1.22±0.13 57.8±6.0
WW
(46 h) 7.6 8.4 N/A N/A N/A 1.30 64.2
Continuous
mode
WW
(10 h) N/A 8.6±0.1 50.0±18.1 83.8±38.2 37.3±8.0 1.26±0.07 34.2±2.0
WW
(24 h) 6.9±0.3 8.4±0.3 74.8±3.9 56.4±13.3 42.1±9.1 1.06±0.16 69.5±10.5
Table 4.1. The OsMFC performance with acetate solution or actual wastewater (WW)
Figure 4.3 Batch operation of the OsMFC treating acetate solution: (A) the profile of current generation; and (B) the increase in water mass in a batch.

53
Water movement across the FO membrane was observed with an increased water mass in
the cathode compartment (Fig. 4.3B). This water flux diluted the catholyte and resulted in
a lower conductivity of 84.1 ± 6.5 mS/cm at the end of an operation cycle. The anolyte
conductivity, on the other hand, was doubled to 15.2 ± 2.5 mS/cm, because of concentrated
effect from water loss (to the cathode compartment); reverse permeation of draw solute
into the anode compartment might also increase the conductivity of the anolyte (Hancock
& Cath, 2009; Phillip et al., 2010). The OsMFC achieved water flux of 1.22 ± 0.13 LMH,
much lower than those in previous FO studies (Achilli et al., 2009; Yang et al., 2009; Yip
et al., 2010). This low water flux could be due to a large concentration polarization (CP)
resulted from a low cross-flow velocity and FO membrane fouling. It is known that CP can
severely affect water flux and higher cross flow velocity helps to reduce external
concentration polarization (ECP). At a recirculation rate of 400 mL/min, the cross-flow
velocity in the OsMFC was about 0.26 cm/s, much lower than 2.3 - 58 cm/s employed in
FO studies (Cath et al., 2010; Lee et al., 2010; Li et al., 2012; Mi & Elimelech, 2008;
Phuntsho et al., 2011; Zou et al., 2011). Biofilm formation on the active layer of the FO
membrane facing the anode (feeding) side might also adversely affect water flux. We will
address those issues in more details in the following sections.
4.3.2 OsMFC fed on domestic wastewater
4.3.2.1 Batch mode
When the actual wastewater (primary effluent) was fed into the anode compartment in a
batch mode, the OsMFC exhibited a current profile with a sharp peak current of ~ 9 A/m3
followed by a quick decrease (Fig. 4.4A). The total charged accumulated in a cycle was

54
155.8 C. Within the similar operating cycle, electricity generation from the actual
wastewater was much lower than that of the acetate solution, most likely due to a lower
organic input. The wastewater contained soluble COD varying between 64 and 96 mg/L,
significantly lower than 1500 mg/L of the acetate solution. In addition, the organic
compounds in wastewater are more complex than acetate and thus more difficult to be
biologically degraded. Water flux, however, was not obviously affected by the change of
the acetate solution to the wastewater, and the increase in water mass in the cathode
compartment was slightly more than that with the acetate solution (Fig. 4.4B). The OsMFC
achieved water flux of 1.30 LMH (Table 4.1). The improved water flux was because of a
lower conductivity of the wastewater, thereby creating larger osmotic difference across the
FO membrane and thus a higher osmotic pressure to drive water movement. Water flux
from the anode into the cathode decreased the volume of wastewater from 1000 to 358 mL,
64.2% reduction in effluent discharge.
4.6.2.2 Continuous operation
The continuous supply of wastewater to the OsMFC constantly produced electricity;
because of complicated composition and the low organic concentration of the wastewater,
the current generation fluctuated at a low level around 2 A/m3 (Fig. 4.5A). Extending the
HRT from 10 to 24 h slightly decreased the current production. Similar to current
generation, the polarization curve showed some unstable responses during the voltage
scanning, but useful information could still be extracted: the open circuit voltage was 0.63
V, the maximum power density was about 4.5 W/m3 and the maximum current density
reached 37 A/m3 (Fig. 4.6). During a short-period test of step increase in the organic
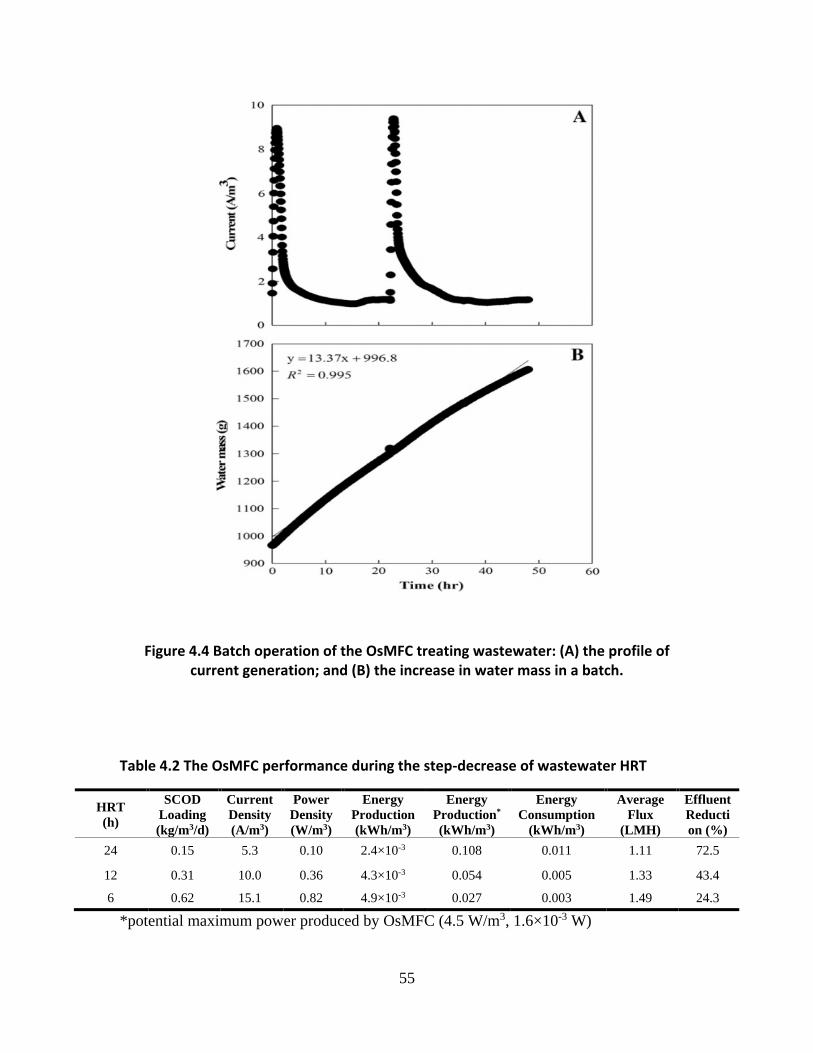
55
HRT
(h)
SCOD
Loading
(kg/m3/d)
Current
Density
(A/m3)
Power
Density
(W/m3)
Energy
Production
(kWh/m3)
Energy
Production*
(kWh/m3)
Energy
Consumption
(kWh/m3)
Average
Flux
(LMH)
Effluent
Reducti
on (%)
24 0.15 5.3 0.10 2.4×10⁻³ 0.108 0.011 1.11 72.5
12 0.31 10.0 0.36 4.3×10⁻³ 0.054 0.005 1.33 43.4
6 0.62 15.1 0.82 4.9×10⁻³ 0.027 0.003 1.49 24.3
*potential maximum power produced by OsMFC (4.5 W/m3, 1.6×10⁻³ W)
Figure 4.4 Batch operation of the OsMFC treating wastewater: (A) the profile of current generation; and (B) the increase in water mass in a batch.
Table 4.2 The OsMFC performance during the step-decrease of wastewater HRT

56
Figure 4.5 Current generation of the OsMFC treating wastewater: (A) continuous operation; and (B) the step-decrease of wastewater HRTs.
Figure 4.6 Polarization curves of the OsMFC treating wastewater in continuous operation and at HRT 24 h.

57
loading rate (decrease in HRT from 24 to 12 and then 6 h), it was clearly observed that
electricity generation increased with the increasing organic loading, indicating that current
generation was limited by organic supply (Fig. 4.5B and Table 4.2). The average SCOD
concentration in wastewater during the step-increase test was about 154 mg/L, resulting in
a higher current generation at HRT 12 h (Fig. 4.5B) than that at HRT 10 h (Fig. 4.5A).
Higher organic loading rates also improved energy production: at HRTs 12 and 6 h, the
total energy production was 0.004 kWh/m3 and 0.005 kWh/m3, respectively, both of which
are close to the energy consumed by the pumps, suggesting the possibility of a self-
sustained OsMFC system in terms of energy. It must be noted that the OsMFC was not
operated at its maximum power output during those tests; according to Fig. 4.6, the
maximum power output at HRT 24 h was about 4.5 W/m3, which could be even higher at
a shorter HRT because of the larger substrate supply. Assuming the OsMFC runs at 4.5
W/m3, the energy production will be much higher than the energy consumed (Table 4.2).
The key factors to accomplish such an energy-neutral system include energy production
that can be further improved through optimizing OsMFC configuration and increasing
organic supply, and energy consumption that is mainly determined by the recirculation of
electrolytes. We must understand that it is very difficult to establish a precise energy
balance for bench-scale OsMFCs, especially energy consumption by the pumping system.
Our effort of energy analysis was to obtain a rough picture of energy production and
requirement involved in the OsMFC at a small scale, which would guide further
development of this system.

58
Figure 4.7 Comparison between clean and fouled FO membranes: (A) Bode plot of electrochemical impedance spectroscopy; and (B) short-term water flux test (in a U-
shape reactor shown in Fig. A1)

59
Water flux increased slightly with decreasing HRTs (Table 4.1 and Table 4.2), possibly
because the faster supply of low-salinity wastewater at a lower HRT reduced concentration
polarization on the active layer of FO membrane facing the anode, compared with a high
HRT that had a slower wastewater influent and accumulated salts due to water loss and
reverse salt flux. However, the reduction in wastewater effluent decreased with decreasing
HRTs, because more wastewater was fed into the anode at a lower HRT. At HRT 10–12 h,
which is similar to that of aerobic biological wastewater treatment, the OsMFC reduced
30–40% of wastewater effluent (Table 4.1 and Table 4.2). This reduction, or increased
water reuse, will help accomplish sustainable water management while reducing freshwater
use, achieving both environmental and economic benefits (Anderson, 2003).
The recirculation rates of electrolytes could affect the shear condition on the surface of the
FO membrane and concentration polarization, thereby influencing water flux. The OsMFC
achieved low water flux (< 1.50 LMH) in both batch and continuous operation; to explore
whether water flux can be improved by a higher recirculation rate, the recirculation rate of
catholyte was increased to 3000 mL/min. The recirculation rate of anolyte was maintained
unchanged, because a high rate could disturb the biofilm that formed on the anode electrode
and thus affect the anode performance. In addition, it was found that a better mixture on
the drawing side may reduce concentration polarization (Gruber et al., 2011).
Unfortunately, we did not observe a significant increase in water flux to a level comparable
to that in previous FO studies. The OsMFC achieved 1.97 LMH at high recirculation of the
catholyte, which increased to 2.15 LMH when the carbon cloths on both sides of the FO
membrane were removed. The low water flux was likely due to an inefficient configuration

60
(large and thick compartment) of the OsMFC that did not create a high cross-flow velocity.
At 3000 mL/min, the cross-flow velocity was only 2 cm/s; adding mesh on both sides of
the FO membrane did not help improve flow turbulence, possibly due to its small pore size.
In addition, it is well known that internal concentration polarization (ICP), which is hardly
reduced by increasing flow rate or turbulence, can greatly reduce water flux (Zhao et al.,
2012).
4.3.3 FO membrane fouling
After operating the OsMFC for more than 100 days (about 50% of the time on wastewater
and the other 50% on acetate solution), the FO membrane was removed to analyze any
fouling. The EIS data showed an increase in impedance of the fouled membrane compared
with the clean membrane (Fig. 4.7A), suggesting the appearance of the fouling (Gao et al.,
2013). The 4-h water flux test revealed that the fouled membrane achieved a lower average
water flux of 5.2 LMH than 7.1 LMH of a clean membrane (Fig. 4.7B). It was observed in
the SEM pictures that the anode side of the FO membrane contained a large number of
microorganisms (Fig. 4.8A), while the cathode side of the membrane was covered by
abiotic scaling (Fig. 4.8B). The cross-section of the fouled membrane was filled with
fouling compounds (Fig. 4.8C). EDS analysis showed that various compounds, including
phosphate, iron, and calcium, were detected on both sides of the membrane (Fig. A2 and
S4.3) and the dominant species (by weight) were phosphate, nitrogen, oxygen, sulfur, and
calcium (Table A1 and A2). The weight percentages of those compounds differed between
the two sides of the membrane.

61
A major challenge of applying FO membranes in wastewater treatment is membrane
fouling. Our results clearly showed both biofouling and abiotic scaling caused by
microorganisms and organic/inorganic compounds in wastewater, which adversely
affected the membrane performance. Unlike an osmotic membrane bioreactor that can take
advantage of aeration to alleviate fouling, the anode of an OsMFC is anaerobic and has no
gas bubbling; therefore, the fouling can be more serious. Our previous study suggested that
backwash has a limited effect on reducing the fouling in an OsMFC (Zhang et al., 2011).
Therefore, a suitable method for membrane cleaning is critical for application of OsMFCs.
The possible approaches include recirculating biogas produced in the anode to remove
fouling, optimizing the anode compartment to improve the shear effect of water flow, and
designing a removable membrane for external cleaning. On the other hand, our results also
Figure 4.8 SEM pictures of the fouled FO membrane (A — active side; B — support side; C — cross-section) and a clean FO membrane (D — active side; E — support side;
F — cross-section).

62
demonstrated the durability of the FO membrane. Without major cleaning (except for
periodic, short-term soaking of one side of the membrane in DI water), the FO membrane
worked for more than 100 days under a tough condition (in the presence of microorganisms
and various organic and inorganic compounds), which proves that FO membranes are low-
fouling membranes.
4.4 Conclusions
The results of this study demonstrated that an OsMFC can recover bioenergy from
domestic wastewater through bioelectrochemical reactions and reduce wastewater effluent
via water extraction by forward osmosis. Electricity generation was affected by organic
loading rates (both organic concentration and hydraulic retention time). Water flux was
influenced by recirculation rate (e.g., low shear effect due to inefficient reactor
configuration), membrane fouling, and concentration polarization. Reduction of the
effluent could increase the concentrations of nutrients such as nitrogen and phosphorus
(while the total amount of nutrients will not be changed); therefore, a post-treatment step
to polish the effluent by removing nutrients will be required. To implement OsMFCs'
environmental and energy sustainability (e.g., water reuse and energy neutral), future
studies will optimize the reactor configuration, examine anti-fouling or membrane cleaning
methods, and scale-up the system.

63
CHAPTER 5
Hollow-fiber Membrane Bioelectrochemical Reactor for Domestic Wastewater Treatment
(This section has been published as: Ge, Z., Ping, Q. and He, Z.* (2013) Hollow-fiber
membrane bioelectrochemical reactor for domestic wastewater treatment. Journal of
Chemical Technology & Biotechnology. Vol 88, pp 1584-1590.)
5.1 Introduction
Microbial fuel cells (MFCs) have been widely studied as a potential approach for
simultaneous wastewater treatment and bioenergy production (Rinaldi et al., 2008). The
research has been focused on improving electricity generation in MFCs via investigating
their architecture and operation, electrode and membrane materials, substrates,
electrochemistry, microbiology and new functions (Logan & Regan, 2006; Logan, 2010;
Pant et al., 2010; Zhao et al., 2009; Zhou et al., 2011). The primary function of an MFC is
wastewater treatment; however, the issues about the MFC effluent quality are not
sufficiently addressed, possibly because most studies fed the MFCs using synthetic
solutions that are “purer” than actual wastewater. A few studies that adopted actual
wastewater have demonstrated an effective organic removal by MFCs (Pant et al., 2010),
but the information of the treated effluent quality such as turbidity is very limited. MFCs
are designed to replace the secondary treatment (Rabaey & Verstraete, 2005), which
usually requires a tertiary treatment such as filtration and/or disinfection for further
purifying the treated effluent (Masters & Ela, 2008). To produce a high-quality effluent for
either direct discharge or water reuse will make MFCs more competitive as a wastewater
treatment technology.

64
The existing wastewater treatment can achieve high-quality effluents using membrane
bioreactors (MBR), which integrate membrane filtration using microfiltration (MF) or
ultrafiltration (UF) membranes with suspended growth bioreactors. The MBR technology
has been commercialized for municipal or industrial wastewater treatment (Marrot et al.,
2004; van Nieuwenhuijzen et al., 2008). The filtration elements can be either submerged
(internal) in a bioreactor such as an activated sludge tank, or installed as a sidestream
(external). To recover energy from wastewater, anaerobic MBR (AnMBR) is developed
with the production of methane gas (Smith et al., 2012). More details about the MBR
technology can refer to several in-depth review publications (Brindle & Stephenson, 1996;
Gander et al., 2000; Judd, 2008; Liao et al., 2006; Yang et al., 2006).
Filtration membranes have also been studied in MFCs, mostly as separators between the
anode and the cathode, instead of filtration media (Li et al., 2011). Because the larger pore
size of filtration membranes facilitates ion transport, the use of filtration membranes such
as MF/UF membranes greatly improved power production (Sun et al., 2009; Zuo et al.,
2007). However, the increased permeation of oxygen and the loss of substrate across
filtration membranes constrain their applications in MFCs (Li et al., 2011). Recent
development of osmotic MFCs use forward osmosis membrane as both the separator for
electrodes and the medium for water filtration (driven by an osmotic pressure) (Ge & He,
2012; Zhang et al., 2011), but the recovered water needs post-treatment such as reverse
osmosis.

65
A possible strategy to involve filtration membranes in MFCs is to use MF/UF membranes
as filtration media, installed either inside or outside the anode compartment similarly to
that in MBRs. Ion exchange membranes are still required to separate the electrodes, unless
a membrane-less MFC is employed. In this study, we developed a membrane
bioelectrochemical reactor (MBER) by installing hollow-fiber membranes inside a tubular
MFC. The MBER is expected to produce high-quality water while generate electric energy
from organic oxidation. The MBER is significantly different from recent studies of
bioelectrochemical membrane reactors using biofilm formed on stainless steel mesh or
nylon mesh as the filtration material in MFCs with aerated cathodes (Wang et al., 2011;
Wang et al., 2012). We have operated the MBER with both synthetic solution and actual
wastewater for more than 200 days, and examined electricity generation, trans-membrane
pressure and the effluent quality.
5.2 Materials and Methods
5.2.1 MBER construction
The MBER was constructed based on a tube made of cation exchange membrane (CEM -
Ultrex CMI7000, Membranes International, Inc., Glen Rock, NJ) (Fig. 5.1). Ten 20-cm
long PVDF hollow-fiber (HF) membranes (150,000 Dalton, Litree Purifying Technology
Co., Ltd, China) was installed around the carbon brush (Gordon Brush Mfg. Co., Inc.,
Commerce, CA), which was used as the anode electrode materials and pretreated by being
heated at 450 ºC for 30 min (Wang et al., 2009). The HF membranes have pore size of 0.2
µm and a surface area of about 0.011 m2 in total. The cathode electrode consisted of one
layer of carbon cloth (PANEX®30-PW03, Zoltek, Corporation, St Louis, MO) and catalyst

66
layers (0.3 mg Pt / cm2). The powder of Pt/C (10%, Etek, Somerset, NJ, USA) was mixed
with Nafion binder and deionized water, and applied to the surface (the side facing CEM)
of carbon cloth using a brush. The cathode catalysts were air-dried for 24 hours at room
temperature before operation. Both anode and cathode electrodes were connected by
copper wires to an external circuit across a resistance decade box (Tenma 7270,
Springboro, OH, USA). The resistance was adjusted according to polarization curve. The
anode liquid volume was ~ 920 mL.
Figure 5.1. Schematic of a membrane bioelectrochemical reactor (MBER): 1 – influent reservoir, 2 – electric circuit, 3 – cathode electrode (carbon cloth), 4 – anode electrode
(carbon brush), 5 – cation exchange membrane (CEM), 6 – gas collection, 7 – hol

67
5.2.2 Operating condition
The MBER was inoculated using anaerobic digester sludge from a local wastewater
treatment facility (South Shore, Oak Creek, WI), and operated under a room temperature
of ~ 20 ºC. The MBER operation started with a synthetic solution that was fed into the
anode compartment from the bottom of the MBER and the permeated water (effluent) was
sucked by peristaltic pump. The synthetic wastewater contained (per L of tap water):
sodium acetate, 0.75 g; NH4Cl, 0.15 g; NaCl, 0.5 g; MgSO4, 0.015 g; CaCl2, 0.02 g;
NaHCO3, 0.1 g; KH2PO4, 0.53 g; K2HPO4, 1.07 g; and trace element, 1 mL (He et al.,
2006). The HF membrane was operated intermittently to minimize membrane fouling (4
min suction and 1 min rest). The flow rate was 0.7-1.4 mL/min, resulting in a hydraulic
retention time (HRT) of ∼27-15 h. The anode solution was recirculated at 50 mL/min.
After about 70 days, the synthetic solution was changed to the primary effluent collected
from the South Shore Wastewater Treatment Plant. Tap water was used to rinse the cathode
electrode from the top to the bottom for 110 days and then the catholyte was changed to
the anode effluent.
During the operation, the permeation flux was kept constant while the trans-membrane
pressure (TMP) across the membrane was measured by a vacuum pressure meter.
According to the instruction of HF membrane manufacturer, the operation TMP should be
kept below 30 kPa. Therefore, Off-line cleaning was carried out when TMP exceeded 30
kPa. The membrane were removed and soaked in pH 12 solution (500 ppm NaOH and 100-
500 ppm NaOCl) for 30 min, and then backwashed for 30 min using the same chemical
solution.

68
5.2.3 Measurement and analysis
The cell voltage was recorded every 3 min by a digital multimeter (2700, Keithley
Instruments, Inc., Cleveland, OH). The pH was measured using a benchtop pH meter
(Oakton Instruments, Vernon Hills, IL, USA). The concentrations of chemical oxygen
demand (COD), ammonium, nitrite, and nitrate were measured using a colorimeter
according to the manufacturer's procedure (Hach DR/890, Hach Company, Loveland, CO,
USA). The turbidity was measured using turbidimeter (DRT 100B, HF Scientific, Inc., Fort
Figure 5.2. Polarization curves (power and voltage) of the MBER with acetate solution (A) and wastewater (B). The wastewater polarization tests were conducted at two
different organic loading rates: 0.04 and 0.28 kg TCOD m-3 d-1.

69
Myers, FL, USA). The polarization tests were performed by a potentiostat (Reference 600,
Gamry Instruments, Warminster, PA, USA) at a scan rate of 0.2 mV s-1. The power density
and current density were calculated based on the anode liquid volume. The water flux from
the HF membrane filtration was calculated through pumping flow rate and expressed as
liter per surface area of the membrane per hour (L m-2 h-1 - LMH). Elemental analysis was
performed on an X-ray energy dispersive spectrometer (EDS) (TopCon ABT-32). The EDS
was conducted with an accelerating voltage of 15 kV and a working distance of 30 mm.
The target elements included nitrogen, oxygen, sodium, magnesium, aluminum, silicon,
phosphate, calcium, and copper. Fourier transform infrared spectroscopy (FTIR)
measurements were conducted on an infrared spectrophotometer (Brucker Corp VECTOR
22) equipped with diamond Attenuated Total Reflection within a range 4000–600 cm-1.
The efficiency of organic-to-electricity was expressed by coulombic recovery (CR) and
coulombic efficiency (CE), which were calculated according to the following equations:
𝐶𝑅 =𝑄𝑜𝑢𝑡𝑝𝑢𝑡
𝑄𝑖𝑛𝑝𝑢𝑡
=∑ 𝐼(𝐴)𝑡(𝑠)
96485(𝐶
𝑚𝑜𝑙 𝑒−)×𝐶𝑂𝐷𝑡𝑜𝑡𝑎𝑙(𝑚𝑜𝑙)×4(𝑚𝑜𝑙 𝑒−
𝑚𝑜𝑙 𝑂2) (6.1)
𝐶𝐸 =𝑄𝑜𝑢𝑡𝑝𝑢𝑡
𝑄𝑖𝑛𝑝𝑢𝑡−𝑟
=∑ 𝐼(𝐴)𝑡(𝑠)
96485(𝐶
𝑚𝑜𝑙 𝑒−)×𝐶𝑂𝐷𝑟𝑒𝑚𝑜𝑣𝑒𝑑(𝑚𝑜𝑙)×4(𝑚𝑜𝑙 𝑒−
𝑚𝑜𝑙 𝑂2) (6.2)
where Qoutput is the produced charge, Qinput is the total charge available in the added organic
compounds, Qinput-r is the total charge available in the removed organic compounds, I is
electric current and t is time. CODtotal is the total COD input to the anode compartment in
the period of time t, and CODremoved is the COD removed within time t.

70
5.2.4 Energy estimation
Energy consumption in the MBER was mainly due to recirculation of the anolyte and the
catholyte by pumps. The power required for the recirculation pump was estimated as eq.
5.3 (Kim et al., 2013):
𝑃 =𝑄𝛾𝐸
1000 (5.3)
where P is power requirement (kW), Q is flow rate (m3 s-1), γ is 9800 N m-3, and E is the
hydraulic pressure head (m). For example, for the MBER treating the primary effluent at
HRT of 19 h, Q was 8.33×10⁻⁷ m3 s-1 (50 mL min-1) and 1.03×10⁻⁷ (6.2 mL min-1) m3 s-1
for anode and cathode recirculation, respectively, and the hydraulic pressure head loss was
assumed to be 0.098 m; thus, the total power required for the recirculation pumps was
9×10⁻⁷ kW. The energy for membrane filtration was calculated based on average vacuum
pressure (22 kPa) and permeate flow (2×10⁻⁸ m3 s-1), yielding a suction pumping power
requirement of 4.31×10⁻⁷ kW (Table B1). The influent pumping power requirement was
4.73×10⁻⁸ kW, according to the hydraulic head loss of 0.35 m and average inflow rate of
1.38×10⁻⁸ m3 s-1. In total, the power requirement for pumping was 1.38×10⁻⁶ kW. Divided
by influent flow rate, the total energy requirement was 2.78×10⁻² kWh m-3 (or 0.028 in
kWh m-3 in Table B2).
5.3 Results
5.3.1 The MBER treating synthetic solution
The MBER started as a conventional MFC in which a synthetic solution was actively fed
into the bottom of the reactor and flowed out from the top. In the first 20 days, the external

71
resistance was gradually decreased from 1000 to 10 Ω, and the current generation increased
to ∼16 mA. Then, the operation was switched to the ‘MBER’ mode and the hollow-fiber
membranes began water extraction. At an HRT of 19 h and water flux of 5.45 LMH, the
current generation varied mostly between 10 and 17 mA (Fig. B1) and the COD removal
was about 45% at a loading rate of 0.61 kg m-3 d-1. Depending on the current output, the
CE was between 30 and 40% and the CR was 14–20%. The TMP increased very rapidly to
40–50 kPa within 20 h, indicating the occurrence of membrane fouling (Fig. B2).
Backwash was conducted using the anode effluent for 1 h when the TMP was above 40–
50 kPa; however, the increasing trend was not obviously changed (Fig. B2).
To alleviate the TMP increase and membrane fouling, the HRT was increased to 27 h on
day 39, and thus water flux decreased to 3.82 LMH. Figure 5.2A shows the overall
electricity generation as a polarization curve. The operating current was maintained around
10 mA, lower than that at HRT 19 h because fewer organic compounds were supplied to
the anode (Fig. 5.3A). The pace of the TMP increase clearly slowed, and it took about 1
week to increase the TMP from 5 to 26 kPa (Fig. 5.3B). Then, the membranes were taken
out of the MBER and rinsed with DI water to remove the fouling layer. Before resuming
the operation, the MBER was backwashed for 1 h at water flux of 5.45 LMH (arrow a on
Fig. 5.3B). After physical cleaning, the TMP increased from zero to 37 kPa in six days.
Then, a chemical cleaning of the membranes was conducted (arrow b on Fig. 5.3B), in
which membranes were soaked in pH 12 NaOH solution for 2 h followed by a 30-min
backwash with DI water. When the operation resumed, the TMP increased from zero to 32
kPa in 8 days, indicating that chemical cleaning restored membrane function better than

72
physical cleaning. At an organic loading rate of 0.51 kg m-3 d-1, the MBER removed 58%
of the COD and produced an effluent containing 246 ± 39 mg COD L-1 (Fig. 5.3C and
Table 5.1). The CE and the CR were about 30% and 17%, respectively. The turbidity of
the effluent was 0.41 ± 0.19 NTU.
5.3.2 The MBER treating wastewater
The influent of the MBER was switched to real wastewater (primary effluent) on day 75,
and the operation consisted of four phases based on the HRTs: 36, 26, 19, and 15 h
(corresponding water flux of 3.82, 4.91, 6.55, and 7.75 LMH). The wastewater obtained
from the South Shore Wastewater Treatment Plant contained low organic concentration
varying with time, which significantly affected electricity generation (Fig. 5.2B). The
soluble COD concentration could be as low as 20 mg L-1 after major storms (arrow a in
Fig. 5.4C).
Phase 1 with an HRT 36 h was operated for 46 days. A strategy of integrated periodic
backwash and membrane relaxation was adopted to slow down TMP increase and
membrane fouling: the MBER was backwashed for 1 min at 4 mL min-1 every 29 min
forward operation, and water filtration was stopped for 1 min every 4 min. The MBER
produced a current of 1–1.5 mA (Fig. 5.4.A), significantly lower than that of the synthetic
solution, because of lower organic input (Fig. 5.4A and 5.4C). The influent wastewater

73
Substrate HRT
(h)
Rext
(Ω)
Influent Effluent RTCOD
(%)
CE
(%) TCOD
(mg/L)
SCOD
(mg/L)
NH4+-N
(mg/L)
TCOD
(mg/L)
NH4+-N
(mg/L)
Turbidity
(NTU)
Acetate
Solution 19 10 485±16 - - 265±10 - - 45.3 36.4
Acetate
Solution 27 10 583±5 - - 246±39 - 0.41±0.17 57.8 29.8
Primary
Effluent 36 60 152±38 83±22 20±6 20±7 17±3 0.75±0.31 86.9 10.8
Primary
Effluent 26 45 158 ±106 72±53 24±3 16±6 12±1 0.48±0.29 90.1 17.1
Primary
Effluent 19 45 235±122 105±71 20±9 23±8 18±3 0.45±0.03 90.2 13.6
Primary
Effluent 15 45 199±8 71±3 22±2 21±7 20±1 0.53±0.15 89.4 16.0
Rext : external resistance
RTCOD: TCOD removal efficiency
contained total COD (TCOD) of 152 ± 38 mg L-1 and SCOD of 83 ± 22 mg L-1 (Table 5.1).
The TCOD concentration in the MBER effluent was 20 ± 7 mg L-1. The CE was ∼11% and
the CR was about 9% (based on TCOD). On day 110, the catholyte was changed from tap
water (without any pH control) to the anode effluent, and current generation was not
obviously affected (arrow b in Fig. 5.4A). The MBER slightly decreased ammonium
concentration from 20 ± 6 to 17 ± 3 mg NH4+-N/L, probably due to the ammonia loss
through bacterial growth and/or cation exchange membrane (Kim et al., 2008). The nitrate
concentration in both the influent and effluent of the MBER remained low at ∼ 0.2 mg
NO3--N/L. The total phosphate was unchanged by the MBER operation. The turbidity of
the effluent was 0.75 ± 0.31 NTU, much lower than the 10–20 NTU of the effluent of the
MFCs without UF membranes when treating the same wastewater (unpublished data). It
took 43 days for the TMP to increase from zero to 15 kPa (Fig. 5.4B), much slower than
with the synthetic solution. This slow increase can be attributed to three reasons: first, a
Table 5.1. Characterization of the influent and the effluent of the MBER with different substrates and HRTs

74
lower water flux (longer HRT) slowed down the membrane fouling; second, a lower
organic concentration in the wastewater resulted in less microbial growth and thus less
microbial fouling of the membrane; and third, the strategy of both periodic backwash and
membrane relaxation greatly relieved membrane fouling.
Figure 5.3 MBER performance with synthetic solution: (A) current generation, (B) transmembrane pressure (TMP), and (C) COD concentrations in the influent and the
effluent. Arrow a: physical cleaning; arrow b: chemical cleaning.

75
In Phase 2, the HRT was reduced to 26 h. Before the new operation, the membranes were
removed from the MBER and cleaned using a pH 12 NaOH solution (Table B3). The TMP
increased from zero to 15 kPa in 28 days, faster than Phase I (Fig. 5.4B). The current was
generally higher than the previous phase due to higher organic loading in a shorter HRT,
Figure 5.4 MBER performance with wastewater (primary effluent): (A) current generation and COD loading rates; (B) transmembrane pressure (TMP); and (C) COD concentrations in the influent and the effluent. Arrow a: extremely low COD after a major storm; arrow b: the catholyte changed from tap water to the anode effluent.

76
and largely affected by the actual organic concentration in the wastewater. A high peak of
8 mA was observed, because of a high TCOD (300 mg L-1) and SCOD (152 mg L-1) in the
feed at day 130. Despite the higher organic influx, the MBER effluent contained a TCOD
concentration of about 20 mg L-1, indicating stable performance of the organic removal.
During this period, the CE and the CR based on TCOD was 17% and 15%, respectively.
The average turbidity was below 0.5 NTU (Table 5.1). In Phase 3, operation with a new
HRT of 19 h started on day 151 without cleaning the membrane. The TMP dramatically
increased from 15 to 24 kPa on day 152 and continued to rise to 39 kPa over the next 10
days. Then, the hollow-fiber membranes were removed for cleaning (Table B3). At restart
of the MBER TMP exhibited an increase to 45–50 kPa in 14–15 days. The effluent quality
(COD removal and turbidity) was similar to the previous operation (Table 5.1). A brief
Phase 4 was operated at an HRT of 15 h, and a quick increase of TMP to 45 kPa in 7 days
was observed; at this rate, the membrane would require frequent cleaning and thus make
this operation unsustainable.
5.3.3 Energy balance
The energy balance was estimated by analyzing energy consumption and production (kWh
m-3) in the MBER, as summarized in Table B2 and shown in Fig. 5.5. Energy consumption
in the MBER is mainly due to the pumping system, which consists of three parts: influent
feed, permeate (vacuum pumping), and recirculation of the anolyte and the catholyte. The
power required for the pumps shown in Table B1 was estimated according to a previous
study (Kim et al., 2011) and more details can be found in the Supporting Information. It
was found that recirculation consumed the most energy (Table B2), and a longer HRT

77
resulted in more energy consumption, because the recirculating pumps were operated for a
longer period of time to treat every cubic meter of wastewater. The estimated energy
requirement varied between 0.027 and 0.040 kWh m-3 at HRTs of 15–36 h (Table B2). The
energy produced in the MBER was calculated by integrating power over time and was
affected by organic loading rates. The MBER fed with the acetate solution that had a higher
COD produced 0.036–0.038 kWh m-3, much higher than 0.003–0.025 kWh m-3 with the
wastewater (Table B2). According to the estimation of energy consumption, the MBER
could theoretically produce enough energy to support the pumping system when treating
the acetate solution. The energy production from wastewater was lower than the energy
requirement, and at the shortest HRT of 15 h production was close to the consumption (Fig.
5.5). The low organic content in the wastewater used in this study led to low energy
production.
5.3.4 Membrane fouling
Due to the lack of active anti-fouling methods, reducing membrane fouling in an MBER is
important for successful operation. In this study, both high organic loading rates and high
water flux accelerated membrane fouling. Physical cleaning with DI water to remove
fouling layers had a limited effect on membranes when treating wastewater. Chemical
cleaning employing a high pH solution (pH 12), sodium hypochlorite, and backwash
generally restored the water flux (Table B3) and cleaned the membrane surface (Fig. B3).
The EDS spectrum revealed that the fouled membrane contained more elements, such as
nitrogen, calcium, magnesium, copper, aluminum, silicon, and chloride, than the new
membrane and there was almost no difference between the interior and the exterior

78
membranes, except that calcium was detected on the interior side of the membrane (Fig.
B4). The significant presence of nitrogen (16–18%) in the fouled membrane was possibly
due to protein and inorganic nitrogen contaminants in the wastewater.
The two main components of the PVDF membrane, carbon and fluoride, also changed in
weight. Using the mass of fluoride as a reference, the C/F ratio increased from 1.01 of the
new membrane to 1.16 of the fouled membrane for the exterior membrane, and from 0.83
to 0.88 for the interior membrane (Table B4). The ratio of oxygen-to-fluoride also
increased from 0.49–0.53 in the new membrane to 0.68 in the fouled membrane (Table B4).
The excessive carbon, nitrogen, and oxygen in the fouled membrane indicated biofouling
(Rabiller-Baudry et al., 2002); which was also confirmed by the FTIR spectra, which
Figure 5.5. Energy consumption and production in the MBER with different anode effluents at different HRTs. AS: acetate solution. PE: primary effluent. The number in
parentheses indicates the HRT.

79
showed a new peak on the fouled membrane at 1642 cm-1 (Fig. B5), related to the amide 1
(C=O and C–N stretching), suggesting the presence of proteins (Xu et al., 2012).
5.7 Discussion
This study has demonstrated the proof of concept of a membrane bioelectrochemical
reactor and provided an alternative approach to anaerobic treatment of domestic
wastewater. During membrane cleaning, the anode electrode was taken out from the MBER
and exposed to the air. It was observed that current generation was restored quickly after
the anode electrode was installed back in the MBER (Fig. 5.3A), suggesting that the anode
microbes could tolerate oxygen for a short period of time, which gives the MBER more
flexibility in response to operational fluctuation such as oxygen exposure due to either a
leak or system maintenance. The experiments with actual wastewater demonstrated that
the MBER could achieve good treatment performance with low COD concentration and
turbidity in the effluent; however, the results also revealed serious membrane fouling (more
details in the following section), which was affected by organic loading rates resulting from
both HRT and the COD concentration in the influent. In general, the MBER could maintain
good COD removal from primary effluent while producing bioelectricity.
A conventional MFC that treated similar wastewater produced an effluent with turbidity
10–20 NTU and 20–40 mg VSS L-1 (unpublished data); through integrating hollow-fiber
membranes, the MBER improved the effluent quality with low turbidity (∼ 1 NTU) and
almost no suspended solids. The concentration of pathogens was not examined in the

80
present system; however, with a pore size of 0.02 µm, the hollow-fiber membranes could
prevent the discharge of bacteria in the final effluent.
Limited nitrogen removal is one of the major barriers to the application of anaerobic
treatment (e.g. AnMBR (Kim et al., 2011)). Nitrogen, mainly ammonia, cannot be removed
under anaerobic conditions unless ANAMMOX is developed. In this study, the ammonium
concentration slightly decreased in the anode effluent, because of microbial growth and/or
ammonium diffusion through the CEM. However, after the anode effluent was used as
catholyte to rinse the cathode, an obvious reduction of ammonium concentration to 2 ± 1
mg L-1 was observed in the catholyte; meanwhile, the nitrate concentration increased to 10
± 6 mg L-1, indicating the presence of nitrification on the surface of the cathode electrode.
It is likely that nitrifying bacteria took advantage of oxygen and formed biofilm on the
cathode electrode. This ‘fixed-biofilm’ nitrification did not significantly increase the
suspended solids in the catholyte, and the turbidity of the catholyte was ∼1 NTU, slightly
higher than the 0.5 NTU of the anode effluent. Nitrate removal is critical to lowering the
concentration of total nitrogen, but bioelectrochemical denitrification is not expected on
the cathode because of the presence of oxygen. Previous denitrifying biocathode in MFCs
(Clauwaert et al., 2007) raises the possibility that the cathode of an MBER may be specially
designed to provide a partially anoxic condition to accomplish both nitrification and
denitrification; to achieve this, shortcut nitrification–denitrification (Gao et al., 2009) will
be more advantageous. Phosphorus, on the other hand, could not be removed in the MBER.
Like other anaerobic treatments of low-strength wastewater that are being studied, the
MBER would require post-processes to remove or recover nutrients (Kim et al., 2011).

81
It should be noted that a precise energy analysis for a bench-scale system is very difficult,
and the present information attempts to promote more (future) work related to energy
analysis, because of the lack of systematic analysis of energy balance in MFCs. The
accuracy of an energy balance in the present system is largely affected by the energy
required for the pumping system, and our theoretic calculation could underestimate the
energy consumption. If an AnMBR is used as a reference, because of the similarity between
AnMBR and MBER, our system (treating actual wastewater) produced less than 15% of
the energy that the pumping system consumes (0.2 kWh m-3) in a full-scale
AnMBR.( Prieto AL et al, 2011) The present MBER generated a low (operating) power
density < 2 W m-3 with the wastewater; it is possible to further improve its power output
by increasing organic loading rate and optimizing reactor configuration and operation. If
the power output can be improved by 10 times to 20 W m-3, an MBER will produce
sufficient energy to provide an energy-neutral treatment system.
Although the HRTs of 15–36 h applied to the MBER are within the range of AnMBRs
treating domestic wastewater (Smith AL et al., 2012), a shorter HRT (and higher organic
loading rate) will benefit wastewater treatment with less land footprint of the facility. To
maintain a short HRT, membrane fouling must be reduced; in future studies, one can
consider reducing sludge retention time (SRT) and involving active anti-fouling methods.
The SRT of the present MBER was more than 180 days, and the previous study found that
a short SRT (e.g. 30–60 days) could greatly slow down membrane fouling (Huang et al.,
2011). Using biogas to remove foulants is a common approach to control fouling in

82
AnMBRs; however, the use of a carbon brush electrode in an MBER isolated hollow-fiber
membranes from contact with gas bubbles and could also trap bubbles with carbon fibers.
Fluidized granular activated carbon (GAC) that has been used to control fouling (Kim et
al., 2011) will be considered to maintain a low TMP in a future MBER.
5.4 Conclusions
This study has demonstrated a proof of concept of an MBER for wastewater treatment.
Further MBER development must understand and address some key challenges. For
instance, the low CE and CR with real wastewater could be due to other electron sinks such
as sulfate reduction and methanogenesis, and constructing a carbon balance would help
understand the electron flow. It will be of strong interest to examine the treatment of
wastewater with high COD content and stability of the MBER system during long-term
operation. Membrane fouling must be effectively reduced. The results have suggested that
installing membranes within the anode compartment may not be an optimal approach to
integrate membranes with MFCs, due to the difficulty of membrane cleaning. Future
MBERs will consider fluidized GAC when membranes are inside the anode compartment,
or a side-stream membrane system that is placed sequentially to MFCs.

83
CHAPTER 6
Long-Term Investigation of Microbial Fuel Cells Treating Primary Sludge or Digested Sludge
(This section has been published as: Ge, Z., Zhang, F., Grimaud, J., Hurst, J. and He, Z.*
(2013) Long-term investigation of microbial fuel cells treating primary sludge or digested
sludge. Bioresource Technology. Vol 136, pp 509-514.)
6.1 Introduction
Sewage sludge is a byproduct of municipal wastewater treatment and generated from
primary and secondary sedimentation. In municipal wastewater treatment plants, the
treatment and disposal of sewage sludge can comprise up to 50% of the operation costs
(Appels et al., 2008). There are several approaches for treating sludge to reduce solid
contents and to stabilize biomass; however, anaerobic digestion (AD) is generally preferred
because of its cost-effectiveness and bioenergy production. Digested sludge can be further
composted for agriculture uses, and biogas can be converted into electricity and/or heat
through combustion and thus compensate for some energy use in a wastewater treatment
plant. Because of a large amount of organic contents, primary sludge contains about 66%
of the energy content of wastewater (Ting and Lee, 2007), and about 81% of biodegradable
organic energy may be converted to methane (McCarty et al., 2011). Despite the great
energy potential with biogas production, several issues limit successful AD application; for
instance, electric generators and their maintenance are costly, and biogas may need pre-
treatment to remove contaminants such as hydrogen sulfide (Appels et al., 2008). In
addition, energy will be lost during methane conversion, because the common efficiency
of methane-to-electricity is about 33%. Therefore, it is of great interest to explore
alternative technologies for sludge treatment and energy recovery.

84
The use of microbial fuel cells (MFCs) is a promising approach for direct production of
electric energy or other energy carriers such as hydrogen gas from various organic
substrates (Logan et al., 2006 and Pant et al., 2010). Sewage sludge has also been studied
in MFCs for electricity generation. A single-chamber MFC with a baffle inside its anode
compartment generated low power from anaerobic sludge due to a large internal resistance
caused by the baffle (Hu, 2008). Because hydrolysis is considered to be a limiting step in
AD (Halalsheh et al., 2011), appropriate pretreatment is expected to improve the contents
of soluble and small-particle organics that can be better used by microorganisms. The
ultrasonic and alkaline pretreatment of sludge improved its degradability and resulted in a
higher power output of 12.5 W/m3, with 61.0% and 62.9% reduction of total chemical
oxygen demand (TCOD) and volatile solids (VS), respectively (Jiang et al., 2009 and Jiang
et al., 2010). Likewise, improved power output and solid production was observed in an
MFC after pretreatment with sterilization and alkalization (Xiao et al., 2011). When an
MFC was linked to an anaerobic digester to form an integrated recirculation loop, it was
found that methane production was higher than the digester alone (Inglesby and Fisher,
2012), because a high concentration of ammonium/ammonia will inhibit methanogenic
activity (Sung and Liu, 2003). The improved biogas production, resulting from the use of
a recirculation loop, was likely due to the migration of ammonium ions from the digester
to the cathode compartment of the MFC driven by electricity generation in the MFC, which
was also demonstrated previously (Kim et al., 2008). A recent study reported the
performance of MFCs in treating a fermentation solution from primary sludge, in which
higher power production was obtained when treating a mixture of fermentation supernatant

85
and primary effluent, because of elevated concentrations of soluble COD and volatile fatty
acids after the fermentation process (Yang et al., 2013).
In general, previous research on using MFCs to treat sludge focused on the short-term
performance of power production and COD removal, and few studies have examined
biogas production and solid reduction in great detail. Furthermore, no studies have really
shown the production of electric energy (in kWh) from sludge; power is not an energy
parameter (He, 2013). In this study, we conducted a long-term (almost 500 days)
investigation of MFCs treating sewage sludge for energy production, organics removal,
and solid reduction. The experiment consisted of two phases: in Phase I, two tubular MFCs
were operated with primary sludge and digested sludge, respectively, for more than 10
months; in Phase II, both MFCs were operated as a two-stage system to treat primary sludge
for about 6 months. We examined biogas production in the MFCs and compared energy
production between MFCs and anaerobic digesters. The results helped to better understand
the application niche of MFC technology in wastewater treatment.
6.2 Materials and Methods
6.2.1 MFC setup
Two identical tubular MFCs were constructed based on a tube made of cation exchange
membrane (Ultrex CMI7000, Membranes International, Inc., Glen Rock, NJ, USA) (Fig.
6.1). The membrane tube had a diameter of 6 cm and a height of 70 cm. A carbon brush
(Gordon Brush Mfg. Co., Inc., Commerce, CA, USA) was used as an anode electrode and
installed inside the membrane tube, resulting in an anode liquid volume of 1.8 L. The
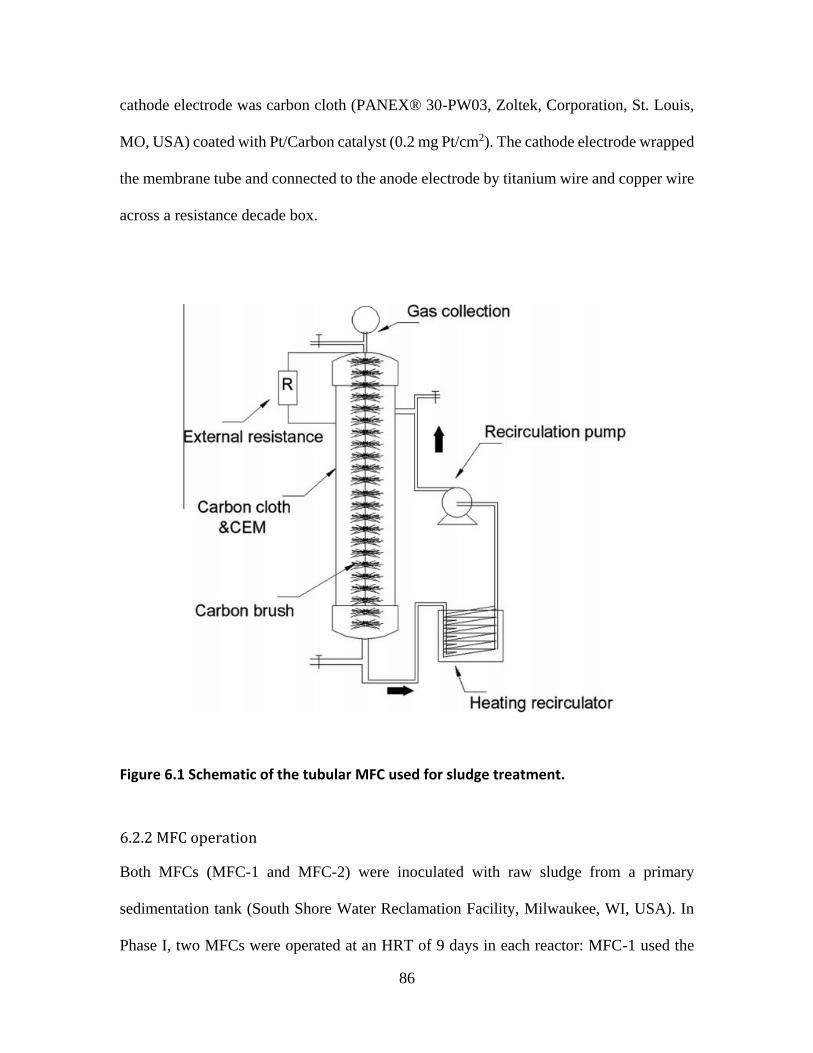
86
cathode electrode was carbon cloth (PANEX® 30-PW03, Zoltek, Corporation, St. Louis,
MO, USA) coated with Pt/Carbon catalyst (0.2 mg Pt/cm2). The cathode electrode wrapped
the membrane tube and connected to the anode electrode by titanium wire and copper wire
across a resistance decade box.
6.2.2 MFC operation
Both MFCs (MFC-1 and MFC-2) were inoculated with raw sludge from a primary
sedimentation tank (South Shore Water Reclamation Facility, Milwaukee, WI, USA). In
Phase I, two MFCs were operated at an HRT of 9 days in each reactor: MFC-1 used the
Figure 6.1 Schematic of the tubular MFC used for sludge treatment.

87
primary sludge as an anode substrate, while MFC-2 was fed with the digested sludge from
the anaerobic digesters at South Shore Water Reclamation Facility. In Phase 1, the large
particles in the sludge were removed using a 4-mm sieve before feeding. In Phase II, the
two MFCs formed a two-stage MFC system, in which the primary sludge was first fed into
MFC-1, and then the treated effluent of MFC-1 was transferred into MFC-2. Each MFC
had an HRT of 7 days, resulting in a total HRT of 14 days in the two-stage MFC system.
An electric blender was used to break the large particles in the primary sludge, and then
the sludge was screened through a 3.3-mm sieve. To buffer the pH of the anolytes in the
two MFCs, 1.68–3.36 g of NaHCO3 was added at the beginning of each feed cycle. The
anolytes were recirculated at 150 and 100 mL/min in Phase I and II, respectively. The
temperature of the anolytes was maintained around 35 °C by using a heating recirculator
(Model 1104; VWR International, LLC, USA), which heated a water bath housing the
recirculation of the anolyte. The acidified tap water (pH = 2, adjusted using sulfuric acid)
was recirculated at ∼45 mL/min as the catholyte for both MFCs.
6.2.3 Measurement and analysis
The MFC voltage across an external resistor was measured using a multimeter (Model
2700; Keithley Instruments, Inc.). Biogas was collected and measured by the water
replacement method. The composition of biogas (mainly CO2 and CH4) was analyzed by
using a gas chromatography (Focus GC, Thermo Fisher Scientific, Waltham, MA, USA).
TCOD concentrations were measured using a COD digester and colorimeter according to
the manufacturer’s instructions (Hach Company, Loveland, CO, USA). Total suspended
solids (TSS) and volatile suspended solids (VSS) were measured using standard methods

88
(Clesceri et al., 1998). The pH was measured using a Benchtop pH meter (UB-10, Denver
Instrument, Denver, CO, USA). Polarization curves were constructed using a Gamry
Reference 600 potentiostat (Gamry Instruments, Warminster, PA, USA). The power
density and current density were calculated based on the anode liquid volume. Coulombic
efficiency (CE) was calculated according to a previous study (Ge et al., 2013). The
calculation of energy from power can be found in the Supplementary data.
6.3 Results and Discussion
6.3.1 MFCs treating primary sludge or digested sludge
Both MFCs were acclimated for about 2 months at an initial external resistor of 2000 Ω
(which was changed to 40 Ω later) to reach a condition with stable electricity generation,
and then polarization analysis was carried out to determine the internal resistance.
Although the maximum power densities obtained from polarization curves were very
different, 6.4 and 3.2 W/m3 for MFC-1 and MFC-2, respectively (Fig. C1), the two MFCs
had a similar internal resistance of ∼20 Ω. These power densities were in the typical range
of 2.4–7.8 W/m3 from the MFCs using sludge as substrates (Wang et al., 2012).
Subsequently, the external resistance of both MFCs was adjusted to 20 Ω for the maximum
power output during the remaining period of Phase I. Fig. 6.2 shows the current generation
at an HRT of 9 days for more than 250 days. The fluctuation in current generation was due
to the large variation in the sludge characteristics of TCOD and the solid contents in the
feeding sludge (Table 6.1). The primary sludge contained more than 80% of volatile
organics, whereas about only half of the solid content was volatile in the digested sludge
because of the stabilization during anaerobic digestion. The pH of the primary sludge was

89
relatively acid because of hydrolysis and fermentation in the sedimentation tank, but the
digested sludge had a neutral pH, possibly due to the alkalinity addition during anaerobic
digestion.
Figure 6.2 Current generation of individual MFC in Phase I with an HRT of 9 days in each reactor: (A) MFC-1 fed with primary sludge and (B) MFC-2 fed with digested
sludge.

90
PS DS
TCOD (g/L) 14.2 ± 11.2 16.7 ± 11.4
TSS (g/L) 6.9 ± 5.5 5.8 ± 4.7
VSS (g/L) 6.1 ± 5.0 3.0 ± 2.9
pH 6.0 ± 0.4 7.1 ± 0.6
For sludge treatment, MFC-1 had a higher TCOD removal of 69.8 ± 24.1% from the
primary sludge compared with 36.2 ± 24.4% from the digested sludge in MFC-2. Because
of the high concentrations of organic matter in the sludge, both MFCs had relatively low
CEs of 7.2 ± 8.1% in MFC-1 and 2.6 ± 1.4% in MFC-2; MFC-1 also had greater solid
reduction than MFC-2. MFC-1 reduced 63.7 ± 19.6% of TSS and 68.4 ± 17.9% of VSS,
while MFC-2 achieved 42.8 ± 17.1% of TSS reduction and 46.1 ± 19.2% VSS reduction.
In Phase I, the main difference between the two MFCs fed with different sludge was in the
reduction of organics/solids, not in electricity generation, although polarization curves did
show some difference at the initial period. The primary sludge was better treated in the
MFC, because it contained a high fraction of readily degradable compounds; on the other
hand, the digested sludge had much less volatile solid and became more stable after
anaerobic digestion. Biogas production observed in MFC-1 but not in MFC-2 during the
Phase I also indicated the digested sludge had much fewer “useful” organic compounds;
even its higher pH than the primary sludge should have favored the growth of methanogens.
However, MFC-2 still extracted some electric energy from the digested sludge and further
reduced TCOD and VSS, suggesting that MFCs may be used as a post-treatment process
Table 6.1 Characteristics of the primary sludge (PS) and the digested sludge (DS) in the Phase I.

91
following anaerobic digesters (Pham et al., 2006). However, the high-solid sludge could
clog the MFC reactors that contain high surface-area materials as electrodes, and thus its
treatment in MFCs may require more maintenance. The supernatant of digested sludge
could be a more appropriate substrate for MFCs. In a wastewater treatment facility,
digested liquid (supernatant) from anaerobic digesters is usually returned to primary
treatment and will eventually be treated by aerobic processes (e.g., activated sludge). If this
digested liquid can be further polished in an MFC, the amount of energy needed to remove
organic materials will be reduced by eliminating or reducing aeration, and some organics
can be directly converted into electric energy in MFCs, thereby decreasing operating
expense.
We examined the effects of recirculation rates (mixing intensity) and electrolyte pH on
electricity generation in MFC-1. More current production was expected due to better
mixing by a higher recirculation rate; however, we did not observe any obvious
improvement when adjusting the recirculation rates from 150 to 400 mL/min (Fig. C2).
Therefore, to minimize energy consumption by the recirculation, the recirculation rate was
fixed at 150 mL/min for the remaining test period. The pH of the anolyte could significantly
affect electricity generation by affecting the growth of electrochemically-active bacteria.
The anolyte pH of MFC-1 decreased to 5.48 ± 0.43 at the end of each feeding cycle in the
absence of any buffering solutions, which was caused by concurrent reactions from
acidification process and proton accumulation in the anode compartment. The current
generation was not negatively affected by the pH until day 75. When we added phosphate
buffer solution (PBS) on day 80 to adjust the pH, the current recovered to ∼12 A/m3 (Fig.

92
C3). When NaHCO3 was dosed instead of PBS on day 100 to buffer the anolyte, the pH
was 6.5 ± 0.6 after each cycle while the electricity generation varied between 6 and 12
A/m3 (Fig. C3). Unlike the primary sludge, the digested sludge (in MFC-2) had sufficient
alkalinity to maintain a pH at 6.5 ± 0.4 at the end of the operating cycle so that no buffer
was added into MFC-2.
The limited effect of recirculation rates (mixing intensity) on electricity generation could
be due to a sufficient supply of organic compounds with the high-concentration sludge.
Previously, we observed a significant improvement in electricity generation at higher
recirculation rates with a low-strength anode feeding solution (Zhang et al., 2010 and
Zhang et al., 2013). In this study, a high concentration of TCOD was overly supplied to the
anode compartment, in which there was no zone with deficiency of organic substrates.
Therefore, improving the mixing did not obviously alter the substrate supply to the anode
electrode.
6.3.2 Two-stage MFC system treating primary sludge
After operating for about 300 days, the two MFCs were changed to a two-stage mode, in
which the primary sludge was fed into MFC-1, and then the MFC-1 effluent was transferred
into MFC-2. The HRTs were same at 7 days in both MFCs. It took about 50 days to reach
a condition of stable current generation due to system clogging, availability of substrate,
and other instrumental problems. Fig. 6.3 shows current generation in the two MFCs for
more than 120 days. During this phase, the primary sludge was blended and then screened,

93
resulting in a much higher content of both solids and organics supplied to the MFCs than
that of MFC-1 in Phase I (Table 6.2).
Initially, only MFC-1 was buffered by adding NaHCO3; its effluent pH was maintained at
around 6.5 and the current varied between 6 and 14 A/m3. On day 390, the current of the
Figure 6.3 Current generation in the two-stage MFC system fed on primary sludge in Phase II with an HRT of 7 days in each reactor: (A) MFC-1 and (B) MFC-2.

94
MFC-2 started to decrease below 6 A/m3. On day 415 we added NaHCO3 to the MFC-2
feeding, which gradually improved the peak current to 17 A/m3. In addition, biogas was
observed in MFC-2 following the addition of bicarbonate, which will be discussed in the
following section. Because of the changes in current generation, we conducted another
polarization test and obtained different internal resistances for both MFCs. As a result, the
external resistance was changed to 15 Ω for MFC-1 and 12 Ω for MFC-2 on day 467. We
also found that the acidified catholyte resulted in maximum power densities of 8.5 and 10.7
W/m3 for MFC-1 and MFC-2, respectively (Fig. C4A), almost twice the maximum power
densities when the catholytes were neutralized (Fig. C4B). The acidified catholytes also
resulted in a higher open-circuit voltage (0.2 V) than that with the neutralized catholytes.
PS MFC-1 MFC-2
Day 380-434 TCOD (g/L) 78.0±12.4 46.7±15.0 24.2±14.2
TSS (g/L) 58.4±12.0 28.0±5.9 10.4±7.2
VSS (g/L) 44.8±7.6 19.0±3.2 7.12±3.8
TCOD Reduction (%) 37.3±23.0 67.0±17.3
VSS Reduction (%) 54.4±10.5 82.1±9.0
Day 435-470 TCOD (g/L) 52.7±8.8 31.8±7.4 19.6±5.7
TSS (g/L) 31.8±14.0 19.1±7.6 8.4±4.5
VSS (g/L) 25.8±14.0 13.1±6.0 5.3±3.5
TCOD Reduction (%) 41.8±12.6 63.9±10.5
VSS Reduction (%) 57.4±12.9 79.6±16.3
Day 471-495 TCOD (g/L) 35.0±6.54 19.0±8.8 15.2±3.1
TSS (g/L) 23.8±4.6 12.4±6.5 8.3±3.6
VSS (g/L) 25.8±14.0 10.0±5.4 5.7±1.4
TCOD Reduction (%) 51.1±22.8 60.8±14.2
VSS Reduction (%) 51.1±27.8 71.7±9.1
pH 5.6±0.1 6.6±0.4 6.4±0.4
Table 6.2 Characteristics of the primary sludge (PS) and the treatment performance of the two MFCs in the Phase II.

95
The treatment performance of the MFC system in Phase II was divided into three periods:
days 380–434, days 435–470, and days 471–495, according to the difference in sludge
characteristics from different samplings (Table 6.2). The corresponding removal
efficiencies of TCOD in MFC-1 were 37.3 ± 23.0%, 41.8 ± 12.6%, and 51.1 ± 22.8%,
respectively; the total TCOD removal efficiencies after the MFC-2 treatment were 67.0 ±
17.3%, 63.9 ± 10.5%, and 60.8 ± 14.2%, respectively, during the three periods. In Phase
II, the columbic efficiency was generally low, as the CEs were only 2 ± 1% and 4 ± 1% for
MFC-1 and MFC-2, respectively. For solid reduction, the MFC-1 reduced 51.1–54.4% of
VSS; the use of MFC-2 as the second-stage treatment improved solid reduction by about
20% (Table 6.2). The two-stage MFC system had higher reduction efficiencies of both
TCOD and VSS at higher initial concentrations.
MFCs may be competitive to anaerobic digesters in terms of primary sludge treatment,
especially in reducing volatile solids (VS). A few examples of AD treatment reported in
the previous studies include a 56% reduction in VS at an HRT of 15 days (Tchobanoglous
et al., 2002), 35% reduction in VS from primary sludge at an HRT 20 days (Ghyoot and
Verstraete, 1997), 61.7% reduction in VS from waste-activated sludge at an HRT 15 days
(Liu et al., 2012), and 40–50% reduction in VS from sewage sludge (Cao and Pawłowski,
2012). In our study, MFC-1 could reduce 68% of VSS in 9 days in Phase I, and about 50%
of VSS in 7 days in Phase II. If we include MFC-2 in the Phase II, the two-stage MFC
system could reduce more than 70% of VSS in 14 days. Faster solid reduction in the MFCs
was possibly due to two factors: oxygen intrusion into the anode compartment through the

96
cation exchange membrane, and bioelectrochemical oxidation using oxygen as a terminal
electron acceptor that is an “indirect” aerobic reaction. The carbon brush anode electrode
with a high specific area provided sites for biofilm formation that could facilitate the
growth of robust organisms for organic oxidation; the carbon fibers of the carbon brush
might also help with solid–liquid separation that retained organic compounds for microbial
use in a longer period of time.
6.3.3 Biogas and energy production
Biogas production in the MFCs was observed and analyzed. In Phase I, biogas production
occurred only in MFC-1 with the primary sludge, ranging from 190 to 1467 mL/day. MFC-
2 was used to treat the digested sludge and did not generate any obvious biogas. During
Phase II, biogas was produced in both MFCs (Fig. 6.4). MFC-1 had increasing biogas
production that reached the highest rate of about 2200 mL/day during days 435–470. MFC-
2, on the other hand, did not produce any biogas at the initial period; after the bicarbonate
was added into MFC-2 to buffer the anolyte, biogas was produced subsequently, although
not as much as MFC-1. The highest production rate in MFC-2 was about 1175 mL/day.
The biogas contained 62.7 ± 3.6% and 51.4 ± 12.7% of methane from MFC-1 and MFC-2,
respectively.
Energy production was analyzed in Phase II as a sum of electric energy from direct
electricity generation in the MFCs, and electricity that could be generated from biogas
conversion. The direct electric energy was calculated using power production from either
a regular operation or the maximum power output from the polarization test. In a regular

97
operation, electric power was produced at external resistance of 20 Ω for both MFCs; the
average energy production in MFC-1 and MFC-2 was 0.78 and 0.95 kWh/m3, respectively,
resulting in a total electric energy production of 1.73 kWh/m3 in the two-stage MFC system
(Table 6.3). At the maximum power output obtained from the polarization curves (Fig.
C4A), the energy production will be 1.43 and 1.80 kWh/m3 from MFC-1 and MFC-2,
respectively (Table 6.3); thus, the total electric energy will be 3.23 kWh/m3.
The energy in biogas was calculated assuming that the methane percentage is 65%, the
heating value of methane is 30 J/mL, and the conversion efficiency of methane-to-
electricity is 34%. We used biogas production of 2000 mL/day from MFC-1 and 1000
Figure 6.4 Biogas production in the MFCs during Phase II.

98
mL/day from MFC-2 for the calculation, and obtained the energy production from biogas
as 21.49 kWh/m3 (sum of 14.33 kWh/m3 from MFC-1 and 7.16 kWh/m3 from MFC-2).
The results show that the electric energy from direct generation was only 8–15% of the
energy from biogas. The total energy production (sum of electric energy and biogas energy)
in the two-stage MFC system was 23.22 or 24.72 kWh/m3. The energy production in the
anaerobic digesters at South Shore Water Reclamation Facility was estimated to be 10.73–
38.06 kWh/m3. Therefore, the total energy production in the MFC system was comparable
with that of anaerobic digesters, but direct electricity generation had a minor contribution
(7–13%) to the total energy production.
MFC Energy Two-stage MFC system AD c
Electric energy Methane Methane
(Operation) a (Maximum) b
10.73-38.06 MFC-1 0.78 1.43 13.90
MFC-2 0.95 1.80 7.16
Total 1.73 3.23 21.06
Total energy (kWh/m3) d 22.79 24.29 10.73-38.06 a Electricity generation from regular operation of the MFC system with external resistance
of 20 Ω for both MFCs. b Electric energy from the maximum power output obtained from polarization tests. c The data of methane production were obtained from four anaerobic digesters at South
Shore Water Reclamation Facility. d The total energy is the sum of total electric energy (under one of the conditions) and total
energy from methane gas.
Although the MFCs achieved good sludge reduction that is important to sludge treatment,
energy production is a key parameter to evaluate whether MFC technology is suitable for
treating primary sludge, because primary sludge is usually treated for energy recovery in
Table 6.3 Energy production (kWh/m3) from the two-stage MFC system in the Phase II and energy production from biogas at South Shore Water Reclamation Facility.

99
anaerobic digesters. Energy production in MFCs, including those treating sludge, has not
been properly presented before. Most prior studies only showed power production, which
is not an energy parameter. In addition, methane production has not been well monitored
in the sludge-fed MFCs. In this study, we analyzed both electric energy and potential
energy production from methane gas and presented a better picture of energy production
in the sludge-fed MFCs. Although the total energy production in the two-stage MFC
system was comparable to that of anaerobic digesters, we do not think MFCs are efficient
energy producers from primary sludge at this moment. Our results show that direct
production of electric energy has a minor contribution to the overall energy production,
which is still dominated by methane gas. The low CEs also confirm that the majority of
organic removal was not associated with direct electricity generation; therefore, the MFCs
fed with the primary sludge acted mostly as the “modified” anaerobic digesters.
Diverting some organic compounds to direct electricity generation in an MFC could reduce
biogas processing and conversion, resulting in some (potentially) economic benefits, but
we also need to understand the challenges of MFC application. For example, MFCs
generally have much more complex structures and higher capital cost than anaerobic
digesters. The use of high surface-area electrodes and high-solid substrate like sludge can
create problems such as reactor clogging. Unlike anaerobic digesters that can be
constructed in a single reactor with a large volume, MFCs are expected to be built in small-
scale modules to form an MFC assembly; a single MFC with a very large volume will have
a larger distance between the anode and the cathode electrodes, thereby increasing the

100
internal resistance and decreasing electricity generation. With multiple small-scale MFC
modules, the heating and feeding of the anolytes will be very challenging.
Furthermore, there will be losses during harvesting the electricity from MFCs or other
bioelectrochemical systems (Zhang and He, 2012), and the “useful” electricity will be less
than what was presented here. Therefore, without significant advantages in energy
production, MFCs may not be suitable for treating primary sludge; however, as stated
earlier, MFCs could function as a post-treatment process to polish the supernatant of
digested sludge. In that way, energy production is not a key factor to performance; instead,
with satisfactory treatment performance and reduced energy consumption via anaerobic
treatment, energy recovery will be an additional benefit.
6.4 Conclusions
A long-term investigation was conducted on the technical performance of MFCs used to
treat sewage sludge. The MFCs satisfactorily reduced of both organics and suspend solids.
The total energy production from primary sludge in the two-stage MFC system was
comparable to that of anaerobic digesters; however, direct electricity generation had a
minor contribution while energy from biogas still dominated the overall energy production.
It will be very challenging to apply MFC technology to treat primary sludge; but MFCs
may be used to polish the digested effluent from anaerobic digesters, offering potential
benefits in energy savings compared with aerobic treatment.

101
CHAPTER 7
An Effective Dipping Method for Coating Activated Carbon Catalyst on The Cathode Electrodes of Microbial Fuel Cells
(This section has been published as: Ge, Z. and He, Z.* (2015) An effective dipping method
for coating activated carbon catalysts on the cathode electrodes of microbial fuel cells.
RSC Advances. Vol 5, pp 36933-36937.)
7.1 Introduction
Microbial fuel cells (MFCs) offer a promising bioelectrochemical approach for energy-
efficient water/wastewater treatment and bioenergy recovery.(Logan et al., 2006; Wang &
Ren, 2013; Xiao et al., 2014) MFCs rely on electrochemically-active bacteria to oxidize
organic matters and respire with an electrode as an electron acceptor. This oxidation
process in the anode produces electrons and protons, both of which move towards the
cathode where the electrons and protons are consumed in the reduction reaction with a
terminal electron acceptor, such as oxygen. Although oxygen is readily available in a large
quantity (in the air), the oxygen reduction reaction (ORR) requires a catalyst to overcome
the high energy potential. Many types of catalysts have been studied, including the most
commonly used platinum (Pt) and a variety of other materials such as gold,(Kargi & Eker,
2007) cobalt,(Zhao et al., 2006) lead,(Morris et al., 2007) iron,(Zhao et al., 2005) and
activated carbon.(Deng et al., 2010; Dong et al., 2012; Rismani-Yazdi et al., 2008; Watson
et al., 2013; Zhang et al., 2009; Zhang et al., 2013) In particular, activated carbon (AC) is
very attractive as a cathode catalyst for MFCs, because of its low cost, a high specific
surface area, and effective ORR catalysis;(Zhang et al., 2009) in addition, AC catalysts
have been examined in MFCs for a long period of time and/or with actual wastewater,
demonstrating its long-term stability.(Zhang et al., 2013; Zhang et al., 2011) These findings

102
suggest that AC can be used as an effective (in terms of both cost and performance) ORR
catalyst for MFC application.
A widely used method for coating catalysts onto a cathode electrode is brushing, which
applied the mixture of catalysts and a binding agent (e.g., Nafion or PTFE) to the surface
of the electrode by using a brush (Cheng et al., 2006; Huang et al., 2010). The brushing
method is relatively simple and straightforward; however, it leaves a non-homogenous
distribution of binder/catalyst mixture on the electrode, and may also cause catalyst loss to
the brush (via adsorption). To prepare a large area of electrode, the brushing method will
require a significant amount of manual operation. Recently, a rolling method was
developed to fabricate the cathode electrodes for MFCs (Dong et al., 2012). Unlike the
brushing method, the rolling method omits carbon cloth and instead uses stainless steel
mesh as a supporting material. It is possible to have mess production of cathode electrode
by using the rolling method; however, it should be noted that the rolling method requires
special equipment for operation and the produced electrodes have not been used as widely
as the one produced by the brushing method (though the rolling method is receiving
increasing attention and interests).
In this study, we have explored an alternative method for catalyst coating, the dipping
method, which has been applied in fuel cell study (Zhang et al., 2004). To examine its
effectiveness for MFC application, the dipping method, linked to the heat treatment, was
studied with mixture of AC powder (catalyst) and polytetrafluoroethylene (PTFE, binding
agent). The prepared electrodes were analyzed using electrochemical techniques and
examined in two types of MFCs. The effects of dipping concentration and frequency were
investigated. The dipping method was compared with the brushing method for catalyst

103
loading and electrode performance. It should be noted that the cathode electrode prepared
by the dipping method is for the application of “wet cathode” as explained in the
Experimental section, instead of “air cathode” that is for membrane-less MFCs.
7.2 Materials and Methods
To perform the dipping method, 100 mL ethanol was gradually transferred into an air-tight
container (150 mL) with selected amount of AC powder (2, 4, 8, or 12 g). Meanwhile,
gentle stirring was provided for several seconds to mix and disperse the AC powder. Finally,
2.5 mL of 60% PTFE solution was added with stirring to form the slurry for dipping. The
liquid mixture was stored in a 150 mL air-tight container. Dipping duration was fixed to 2
s for each piece of carbon cloth with the same size of 4 cm × 1 cm. Carbon cloth (PANEX
30PW03 at a cost of $44.4 m−2, Zoltek Corporation, St. Louis, MO, USA) was pretreated
by acetone as described in a previous study.18 After dipping, the carbon cloth was dried
and heated at 350 °C for 30 min. For comparison, multiple cathode electrodes were coated
with AC by using the brushing method described as previous study18 with a design AC
loading rate of 5 and 10 mg cm−2 (the actual AC loading was determined experimentally).
Electrochemical experiments were conducted as described in previous study in a 140 mL
glass bottle with 130 mL of 50 mM PBS solution (2.65 g KH2PO4 and 5.35 g K2HPO4 per
liter of tap water), where the cathode electrode served as a working electrode, a platinum
mesh (002250 platinum gauze electrode 80 mesh, ALS Co., Ltd, Japan) served as a counter
electrode, and an Ag/AgCl electrode (CH Instruments, Inc., Austin, TX, USA) functioned
as a reference electrode. Air was pumped into the bottle for 30 min before each test to
create O2-saturated condition. The electrode samples were submerged into 50 mM PBS

104
solution for 30 min before any electrochemical tests. Tafel plots (scan rate: 1 mV s−1) were
carried out by a potentiostat (Reference 600, Gamry Instruments, Warminster, PA, USA).
Two types of MFCs were used for the experiments. First, a two-chamber MFC as described
in previous study (Zhang et al., 2014) was used for examining electricity generation with
the prepared cathode electrodes. The polarization tests were conducted by using the Gamry
potentiostat (scan rate: 0.2 mV s−1). The anode electrode was a 5 cm carbon brush with
titanium wire collector. Second, to further examine the performance of dipping cathode, a
15-cm long tubular MFC was setup and operated with a wet cathode, which was coated
with AC on carbon cloth; the cathode was exposed to air and rinsed with PBS instead of
being submerged into the catholyte (Zhang et al., 2013; Zhang et al., 2010). The catholyte
concentration was 50 mM PBS. Both two-chamber and tubular MFCs were inoculated with
digested sludge from a local wastewater treatment facility (Peppers Ferry Regional
Wastewater Treatment Plant, Radford, VA), and operated in a batch mode with the anolyte
containing per liter of tap water: sodium acetate, 2 g; NH4Cl, 0.15 g; NaCl, 0.5 g; MgSO4,
0.015 g; CaCl2, 0.02 g; KH2PO4, 2.65 g; K2HPO4, 5.35 g; and trace element, 1 mL.22 The
voltage of the MFC (across 100 Ω in the two-chamber MFC or 15 Ω in the tubular MFC)
was recorded by multimeter (Model 2700; Keithley Instruments, Inc., OH, USA) with 5
min interval.
7.3 Results and Discussion
A commonly designed loading rate of AC by using the brushing method is about 5 mg
cm−2,8 but the exact amount of the AC coated on carbon-base materials (e.g., carbon cloth)

105
is usually not quantified. By weighing the carbon cathode before and after coating, we
found that the actual coated AC using the brushing method was 1.46 ± 0.55 mg cm−2, much
lower than the designed loading of 5 mg cm−2, indicating that about 70% of AC powder
was not loaded onto carbon cloth. By increasing the design loading rate to 10 mg cm−2
(which means more AC would be applied by the brush), the coated AC reached 2.45 ± 0.71
mg cm−2, which still had over 70% loss. The actual loading rate by using the brushing
method could vary depending on the brush used, exact procedure, and skills of the person
who performs it. The loss of AC could be due to the use of painting tools (painting brush)
whose bristles absorbed a large amount of carbon powder/PTFE mixture. Another possible
reason could be due to binding capability of PTFE. A higher concentration of PTFE is able
to enhance the attachment of carbon powder with less loss but it also decreases the
performance for catalytic reaction. To keep the testing condition consistent, the amount of
PTFE (60%) was fixed at 2.5 mL per 100 mL ethanol for dipping, which was equivalent to
the dosage applied for the brushing method (6.67 μL mg−1 AC).
The dipping method, on the other hand, has created more uniform distribution of AC with
less variance. The actual AC loading by using the dipping method could be increased in
two ways, repeated dipping to create multiple layers of AC catalysts and increasing the
initial AC concentration in the mixture. Fig. 7.1 shows that both approaches could
effectively improve the AC loading on carbon cloth. For example, at an initial AC input of
4 g per 100 mL ethanol, the actual AC loading on carbon cloth was 1.62 ± 0.15, 3.09 ±
0.21, and 4.60 ± 0.23 mg cm−2 for dipping 1, 2, and 3 times, respectively. When dipping
one time, the coated AC on carbon cloth was increased from 0.56 ± 0.23 to 5.00 ± 0.88 mg

106
cm−2 as the AC concentration was changed from 2 to 12 g per 100 mL ethanol. The
concentration of 4 g per 100 mL ethanol had a same PTFE/AC ratio as that used in brushing
method (6.67 μL mg−1), and it also resulted in a similar actual AC loading of 1.62 ± 0.15
mg cm−2 (one time dipping) to that by the brushing method (1.46 ± 0.59 mg cm−2) but with
obviously less fluctuation. Thus, it is reasonable to conclude that, comparing with the
brushing method, the dipping method is better for controlling or adjusting the actual
loading of AC on carbon cloth.
To determine the relationship between carbon loading and electrochemical kinetics of ORR
on the cathode electrode, Tafel plots were constructed to compare electrode reaction rate
among the electrodes prepared in different ways. The mechanism of ORR with AC as a
cathode catalyst has been investigated in the previous studies (Zhang et al., 2014); thus, it
is not the focus of this study and the Tafel results were used to compare the variance based
on the numerical magnitude. The ORR on the cathode followed Tafel behavior when
Figure 7.1 The actual AC loading rates (Y axis) on the electrodes with different initial AC input of 2, 4, 8, and 12 g per 100 mL ethanol, and multiple dipping times.

107
overpotential was larger than 0.118 V.19 Tafel equation relationship described by eq. (1)
(Faulkner, 2000) reveals that current (i) can change linearly as overpotential (η) and
exchange current (i0) is involved in constant term as intercept when η is zero (equilibrium
status).
i0 can be calculated and compared for its proportional relationship to reaction kinetics, and
a high current value indicates a faster reaction rate with a lower overpotential demand, and
vice versa (Faulkner, 2000). Because AC was the only catalyst involved and the loading of
PTFE was fixed at 6.67 μL mg−1 AC, the main difference created by different dipping
methods would be the amount of the coated AC and PTFE; the latter may affect the
diffusion and adsorption of oxygen for ORR. As shown in Fig. 7.2A, the Tafel plots
exhibited significant improvement by increasing the initial concentration of AC in the
dipping mixture; the corresponding exchange current (i0) increased almost two-hundred
times from 4 ± 3 (2 g) to 889 ± 149 μA (12 g AC), confirming that increasing the initial
AC concentration in the dipping mixture could promote electrode reaction effectively.
Apparently, the carbon loading is crucial that the more AC powder is per unit area cathode,
the more active sites are for ORR. However, despite increased loading, repeated dipping
did not show the expected improved performance; for example, the improvement at the
low concentration of 2 g AC in 100 mL ethanol was limited, and for a high initial AC
concentration (12 g AC), the extra dipping did not benefit the electron transfer notably (as
shown in Fig. 7.2B).

108
Table 7.1 shows the exchange current extracted from the Tafel plots. The results confirm
that a high initial AC concentration could effectively improve the reaction rate with high
exchange current, whereas repeated dipping had limited improvement at low AC
concentrations. At the initial AC concentration of 8 or 12 g per 100 mL ethanol, the second
dipping resulted in improved exchanged current, but one more dipping (third dipping)
actually decreased exchange current. For comparison, coating by brushing method with an
initial designed loading rate of 5 mg cm−2 resulted in an exchange current of 54 ± 34 μA
but coating more AC had limited improvement (∼20%) when the designed loading rate
was doubled (10 mg cm−2).
Figure 7.2 Tafel plots of the cathode electrodes with different initial loading AC load (A) and different coating layers (CLs) by dipping (B).

109
Coating methods
Exchange current (µA)
2[a] 4[a] 8[a] 12[a]
One dipping 4 ± 3 57 ± 39 601 ± 424 889 ± 149
Twice dipping 4 ± 3 52 ± 5 669 ± 78 997 ± 96
Thrice dipping 4 ± 3 87 ± 81 142 ± 101 613 ± 230
[a] Initial concentration of AC in the dipping mixture (g per 100 mL ethanol).
Figure 7.3 Variation of voltage and power density with current density in the MFC containing cathode electrode prepared in different ways: (A and B) cathode electrode
coated with different initial AC input and one prepared by the brushing method for comparison
Table 7.1 Exchange current generated with the cathode electrodes with different initial AC input and multiple dipping times

110
The decreased exchange current with repeated dipping likely resulted from overly applied
PTFE that could decrease active sites for catalytic reaction and oxygen transfer/adsorption.
In addition, more AC layers would also decrease the diffusion of oxygen onto the surface
of inner electrode material. Those results indicate that AC loading rate is not the only factor
that controls the ORR; the distribution of AC particles and PTFE can also significantly
influence ORR and thus current generation. Determining the optimal loading rate will be
critical to avoiding overly applying catalysts and/or binding agent, thereby minimizing the
amount of catalysts and associated cost.
The cathode electrodes prepared by the dipping method were further examined in a two-
chamber H type MFC operated in a batch mode, as shown in Fig. 7.3. A cathode electrode
prepared by the brushing method (designed AC loading rate of 5 mg cm−2) was used for
comparison. Both power density and current production with the cathode prepared by one-
time dipping (Fig. 7.3A and B) increased as the initial AC concentration changed from 2 g
to 12 g per 100 mL ethanol, in a good agreement with the electrochemical tests. The
electrodes prepared with low initial AC input (2 and 4 g) exhibited similar performance,
but a higher AC input at 8 g increased the maximum power density by more than 25%,
which was further improved by another 26% with 12 g. The minor difference in power
output by the electrode between 2 and 4 g, despite doubled AC loading, indicates that the
carbon amount might need to be maintained at a certain level for a linear improvement of
electricity generation, but this needs further investigation. The cathode prepared by the

111
brushing method resulted in a similar maximum power density as that of the dipping with
4 g AC (which had similar actual AC loading as the one by the brushing), but current
generation after the maximum power output became much lower, indicating a lower kinetic
activity in the high current zone.
The MFC tests showed some difference in electricity by the repeated dipping (Fig. 7.3C
and D). At the low initial AC input of 2 g, the single and triple dipping led to better
performance than dipping twice, in terms of both maximum power density and current
generation. At the high initial AC input of 12 g, the double dipping generated the highest
power density. Those results are close to those of Tafel plots with some deviation. However,
it is clear that multiple dipping does not always improve ORR and electricity generation,
although AC loading is increased. This indication is important to minimizing the use of
AC catalyst and the time of electrode preparation.
To further demonstrate the effectiveness of the dipping method, the prepared electrodes
were examined in a tubular MFC that had a wet cathode as previously reported.8,20 Three
loading rates, prepared with three different initial AC inputs, 4, 12, and 18 g, were
investigated. We could not conduct dipping with an initial AC input higher than 18 g,
because carbon powder could not be well dispersed in the solvent. The initial AC input of
18 g could achieve actual loading of 14.5 mg cm−2 with one-time dipping. As shown in Fig.
7.4, both current density and total coulomb in the tubular MFC became higher at a higher
AC loading rate. The current generation with the initial AC input of 18 g was more than
twice that with 4 g, while the total charge production presented an approximate linear
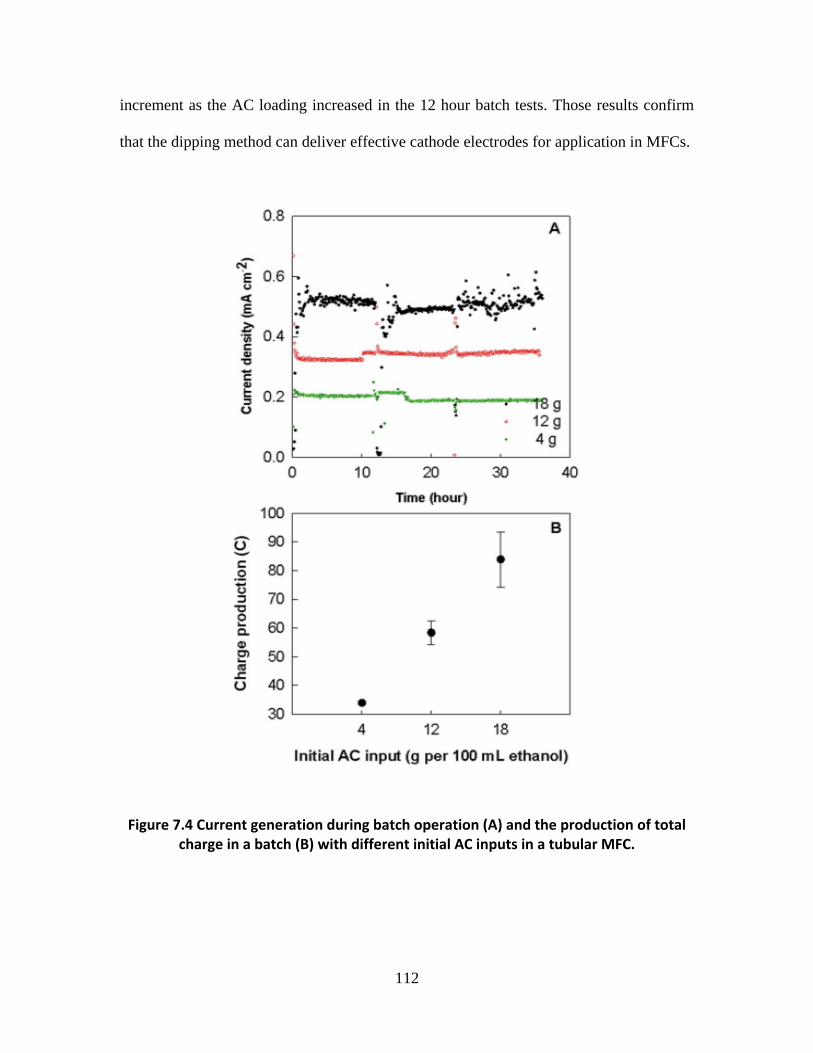
112
increment as the AC loading increased in the 12 hour batch tests. Those results confirm
that the dipping method can deliver effective cathode electrodes for application in MFCs.
Figure 7.4 Current generation during batch operation (A) and the production of total charge in a batch (B) with different initial AC inputs in a tubular MFC.

113
7.4 Conclusions
To conclude, the dipping method is a promising alternative to coat AC catalysts on the
MFC cathode electrode with several advantages. First, the dipping method is much easier
and faster to be applied for preparing large-scale electrodes than the brushing method. By
using the dipping method, a large piece of carbon cloth can be soaked in a tank containing
the AC mixture for coating, while the brushing method requires intensive manpower or
development of automatically-controlled brushes for coating. Second, the dipping method
will have less loss of AC catalysts during the coating process, since the mixture can be
reused with addition of AC catalysts, while the brushing method can result in significant
loss of AC powder due to absorption, which also requires extensive cleaning after each
coating. Third, the dipping method can deliver a more homogeneous surface coating, which
is important to the use of the electrode material (avoiding the dead zones that are short of
catalysts due to heterogeneous coating). Last, the dipping method can better control or
manipulate the amount of catalyst coating on carbon cloth, which is critical to determining
the precise amount of catalysts for large-scale MFC systems. Although some of the above
advantages need to be verified with actual large-scale MFC development, the results in this
work have demonstrated the effectiveness and promise of the dipping method, and
encouraged further investigation.

114
CHAPTER 8
Energy Extraction from A Large-Scale Microbial Fuel Cell System Treating Municipal Wastewater
(This section has been published as: Ge, Z., Wu, L., Zhang, F. and He, Z.* (2015) Energy
extraction from a large-scale microbial fuel cell system treating municipal wastewater.
Journal of Power Sources. Vol 297, pp 260-264.)
8.1 Introduction
Microbial fuel cells (MFCs) have been intensively studied as an emerging technology for
sustainable wastewater treatment with bioenergy recovery. Through interaction between
microorganisms and solid electron acceptors/donors, MFCs can directly generate
electricity from oxidation of organic contaminants (Li et al., 2014; Logan et al., 2006).
With advancement of this technology in various aspects such as microbiology and
materials, a key question arises: how to extract and apply the produced energy. While most
studies only report the performance of electricity generation in MFCs, some have
investigated energy extraction and application to power small electronics such as wireless
sensors (Donovan et al., 2008; Shantaram et al., 2005; Tender et al., 2008; Zhang et al.,
2011) or charge batteries and capacitors (Erbay et al., 2014; Hatzell et al., 2013; Ieropoulos
et al., 2013; Wang et al., 2015; Yang et al., 2012; Zhang & He, 2012). It has been realized
that the difficulty of utilizing energy from MFCs is mainly due to the relatively low power
and voltage output, which would limit efficiency and application for powering electronics
by using commercial power conversion circuits.
Several customized energy harvesting systems have been developed for MFCs applications,
such as the ones based on capacitor, charge pump, and boost converter, to increase the

115
output voltage and power output efficiency (Erbay et al., 2014; Hatzell et al., 2013; Nghia
et al., 2015; Wang et al., 2015). However, due to the limitation of the size of single MFC
and the number of MFCs in one system, the studies of energy harvesting are still focusing
on small-load applications because the output energy is too small to drive electronics with
high-power requirement. The electric devices such as DC motors (pumps) with a demand
for amp-level current and high voltage input (>5 V) are rarely investigated in the MFC
studies except a recent study of a 90 L-scale MFC treating brewery wastewater that a 3-6
V DC pump was successfully used as to feed solution, powered by electricity generated by
the MFC (Dong et al.). Clearly, more studies with the MFCs at large scale (>50 L) treating
actual wastewater should be conducted for further understanding of the system (and its
limitation).
To extract energy from MFCs, maximum power point tracking (MPPT) could be an
efficient strategy, which optimizes the power output by tracking the maximum power
voltage (MPV) of power sources (e.g., MFCs). The purpose of MPPT is to reduce the
power loss by matching the load impedance dynamically (Erbay et al., 2014), and it has
been adapted with different algorithms such as perturb and observe (P&O) (Degrenne et
al., 2012; Molognoni et al., 2014), partial open circuit voltage (OCV) tracking (Erbay et
al., 2014; INSTRUMENTS, 2011), and multiunit optimization (Woodward et al., 2010)
(Molognoni et al., 2014; Park & Ren, 2012) for MFCs applications. The system without
MPPT could have 50% loss of output power while the voltage reversal might also be
avoided by applying MPPT devices for each cell in one system (Boghani et al., 2014;
Woodward et al., 2010).

116
Although multiple high-efficiency energy harvesting devices have been developed for
single MFC with low voltage input, they have not been well investigated for an MFC
system consisting of multiple modules at a large scale treating actual wastewater, and it is
not clear whether one EHS per MFC module would work in a multiple-module MFC
system, associated energy loss and maintenance/operation issues. In addition, most of the
prior studies were based on bench-scale systems treating synthetic organic solution, or
sediment-type MFCs (Xu et al., 2015), and very few of them had MFC systems treating
actual wastewater and/or at a large scale (e.g., > 50 L). In this study, energy production and
conversion efficiency from a large-scale MFC system treating actual municipal wastewater
(installed in a local wastewater treatment plant) was evaluated through parallel and serial
electrical connection of 48 MFC modules (total anode volume of ~ 100 L) by using a
commercially available device TI BQ 25504 with MPPT using a partial OCV method.
Because the efficiency of an EHS may vary as the input of voltage and current fluctuates
due to the changes of operation and environmental conditions, it is necessary to examine
the final power output, MPPT function, and conversion efficiency when actual wastewater
is used as a substrate and multiple MFC modules are involved in one system. The
performance of energy extraction from multiple connections with various voltage input
ranging from 0.8 to 2.4 V (OCV) were examined as well to determine the optimized
electrical connection of MFCs for energy conversion. It should be noted that the present
paper focuses on energy extraction with brief introduction of the performance of this MFC
system, and its long-term treatment performance will be reported in a separate publication.
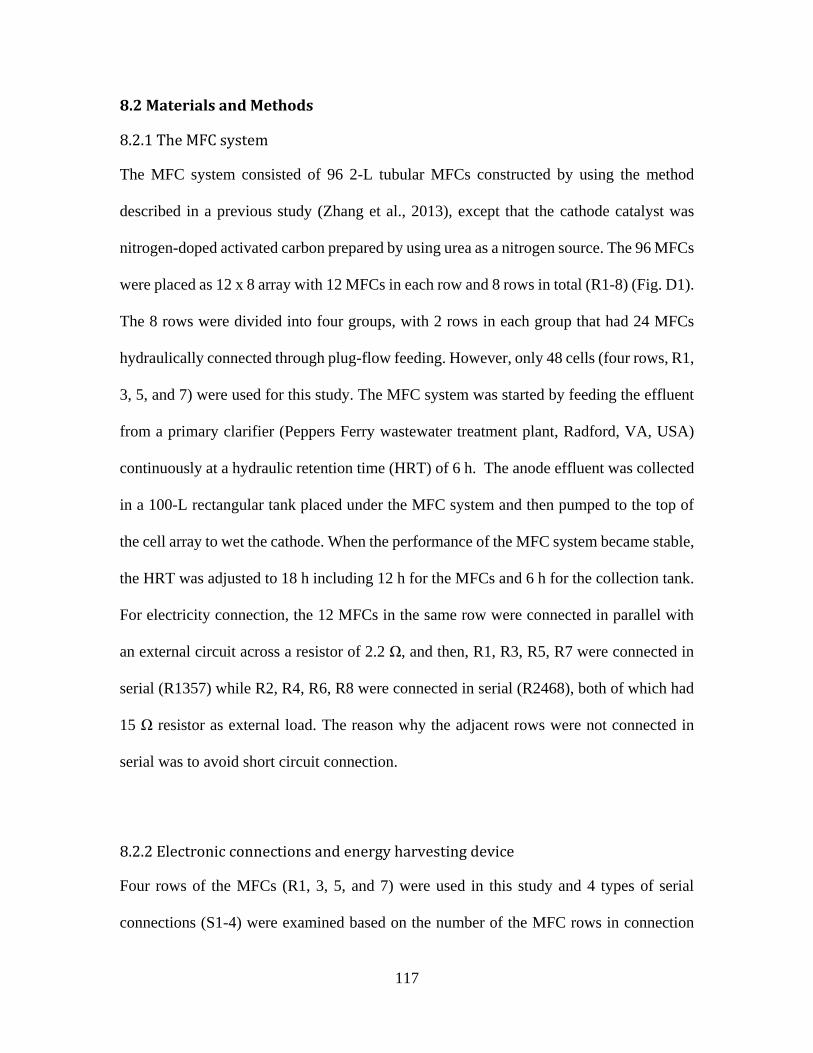
117
8.2 Materials and Methods
8.2.1 The MFC system
The MFC system consisted of 96 2-L tubular MFCs constructed by using the method
described in a previous study (Zhang et al., 2013), except that the cathode catalyst was
nitrogen-doped activated carbon prepared by using urea as a nitrogen source. The 96 MFCs
were placed as 12 x 8 array with 12 MFCs in each row and 8 rows in total (R1-8) (Fig. D1).
The 8 rows were divided into four groups, with 2 rows in each group that had 24 MFCs
hydraulically connected through plug-flow feeding. However, only 48 cells (four rows, R1,
3, 5, and 7) were used for this study. The MFC system was started by feeding the effluent
from a primary clarifier (Peppers Ferry wastewater treatment plant, Radford, VA, USA)
continuously at a hydraulic retention time (HRT) of 6 h. The anode effluent was collected
in a 100-L rectangular tank placed under the MFC system and then pumped to the top of
the cell array to wet the cathode. When the performance of the MFC system became stable,
the HRT was adjusted to 18 h including 12 h for the MFCs and 6 h for the collection tank.
For electricity connection, the 12 MFCs in the same row were connected in parallel with
an external circuit across a resistor of 2.2 Ω, and then, R1, R3, R5, R7 were connected in
serial (R1357) while R2, R4, R6, R8 were connected in serial (R2468), both of which had
15 Ω resistor as external load. The reason why the adjacent rows were not connected in
serial was to avoid short circuit connection.
8.2.2 Electronic connections and energy harvesting device
Four rows of the MFCs (R1, 3, 5, and 7) were used in this study and 4 types of serial
connections (S1-4) were examined based on the number of the MFC rows in connection

118
(Fig. D2). S1 had only 1 row as a power source and S4 had all 4 rows connected in serial.
S2 (R3 and R7) and S3 (R3, R5, and R7) were the connection with 2 and 3 rows,
respectively. To extract electric energy from the MFCs, BQ25504 battery management
evaluation module (EVM) board (TI Instruments, TX, USA) was used and modified with
a MPPT ratio of 0.5, because the ratio of MPV to OCV is close to a constant (0.5 in most
cases) for a functioning MFC system (Fig. 8.1 and S8.3). The overvoltage was set at 5 V
so that the circuit would stop when the output voltage reached the value (INSTRUMENTS,
2011). Two serial-connected 5-F ultracapacitors (Maxwell, 2.7V) were used as energy
storage media for charging and discharging tests. Fig. D2 shows the schematic of the circuit
connection with BQ 25504 EVM and ultracapacitors.
8.2.3 Measurement and analysis
The voltage and current of the MFC output and the PMS output was recorded every 10 sec
by a digital multimeter (2700, Keithley Instruments, Inc., Cleveland, OH, USA).
Polarization tests were conducted using a potentiostat (Reference 600, Gamry Instruments,
Warminster, PA, USA) at a scan rate of 1 mV s−1. The concentration of chemical oxygen
demand (COD) was measured using a colorimeter according to the manufacturer’s
instructions (Hach Company, Loveland, CO, USA). Total suspended solids (TSS) was
measured using standard methods (L.S. Clesceri, 1998). The power was calculated by eq.
(8.1):
𝑃 = 𝑉𝐼 (8.1)
where P is power (W), V is voltage (V), and I is current (A). The conversion efficiency of
BQ 25504 was calculated based on eq. (8.2):

119
𝜂 = 𝑃𝑀𝐹𝐶/𝑃𝐵𝑄 (8.2)
where ɳ is efficiency (%), PMFC and PBQ are power output of MFC and BQ 25504,
respectively, based on eq. (8.1).
8.3 Results and Discussion
8.3.1 Performance of the MFC system
The performance of the MFC system was briefly summarized in Table 8.1. The system
effectively removed more than 75% organics and 80% solid content. The current
generation during regular operation from the S4 connection of the R1357 ranged from 75
to 93 mA with a power output between 84 and130 mW. Polarization curves with four types
of connection are shown in Fig. 8.1. Among the single row of the MFCs, the R1 produced
a maximum power of ~17 mW with a short-circuit current of ~110 mA, lower than that of
the R3, R5 and R7 (55, 50, and 65 mW, Fig. D3). When two rows of the MFCs were
connected as the S2 (containing R5 and R7), the power output was improved 40% from the
S1 (R5 only). When more rows of the MFCs connected to the circuit (S3 and S4), the OCV
was increased from 1.6 to 2.4 V but the power was only improved by 10%; the performance
of the S3 was even better than the S4. The voltage reversal was not observed as reported
from other studies on single MFCs (An et al., 2015; Boghani et al., 2014; Oh & Logan,
2007). It seems that the power output of serial connection of multiple MFC rows was
affected by the limitation of the weakest current production in each row. In addition, the
large difference between the R1 and the other three rows could result in little improvement
in the S4 connection.

120
8.3.2 Energy extraction and conversion efficiency by using BQ 25504
BQ 25504 was applied to extract energy from the MFC system under four types of
connection and to charge the ultracapacitors with charging kinetics shown in Fig. 8.2. It is
obvious that more MFC modules could accelerate the charging process. It took almost 100
min to charge the 5-F ultracapacitors to 5 V with the S1 connection, while the S3 and the
S4 connection achieved the same voltage in 8 min. The S3 exhibited better performance
than the S4, likely due to the limitation of the R1 on current and voltage (the S3 did not
Figure 8.1 Polarization curves of the MFCs with four types of serial connection: (A) S4 (R1357), (B) S3 (R 357), (C) S2 (R57), and (D) S1 (R5).

121
contain the R1). As more MFC modules increased the power output (which was the power
input of BQ 25504), the “cold-start” period was significantly shorten from 52 min (S1) to
1 min (S3). The MPPT did not function until the voltage reached ~1.6 V, which was the
end point of the warm-up period for self-starting when the input voltage was higher than
300 mV (Texas Instruments, 2011). Therefore, the S1 and the S2 may not have advantage
for charging a depleted energy storage element because of a long pre-charging period and
a slow charging rate.
Parameters Influent Effluent
TCOD (mg L-1) 156 ± 42 33 ± 15
SCOD (mg L-1) 67 ± 26 27 ± 8
TSS (mg L-1) 94 ± 61 14 ± 13
Current production (mA) 75-93
Power output (mW) 84-130
Table 8.1. Performance of the MFC system (four groups in serial connection) in contaminants removal and current production.
Figure 8.2 Charging profiles of the ultracapacitors by the MFCs with four types of serial connection using BQ 25504.

122
Fig. 8.3 shows the power output from BQ 25504 and its conversion efficiency applied for
different types of serial connection. The S1 (containing only R5) supplied ~30 mW when
the MPPT functioned and about 55% power was transferred to charge the ultracapacitors.
The S2 (R5 and R7) produced 1.6 V OCV and ~100 mW power with much higher
Figure 8.3 The efficiency of the BQ25504 with different voltage input under four types of connection: (A) S4 (R1357), (B) S3 (R 357), (C) S2 (R57), and (D) S1 (R5).

123
efficiency of ~72% in BQ 25504. It was expected that BQ 25504 would be more efficient
with a higher input voltage from the S2, not only because of the higher conversion
efficiency but also due to the better capability to extract energy from the MFCs with higher
power input to BQ 25504. The power production of the S2 was very close to the MPP
obtained from the polarization curve, which was ~110 mW and about 9% lower than the
total power production of R5 and R7 (Fig. 8.1C and Fig. D3). The S3 (R3, R5, and R7)
generated an even higher power input of ~140 mW, which is about 12% lower than the
sum of maximum power output from group R3, R5, and R7 (Fig. D3), but 17% higher than
that of the S4 (~120 mW). The conversion efficiency with the S3 was over 80%, which is
comparable with many other customized converters (McBride et al., 2006; Wang et al.,
2012a; Wang et al., 2012b; Zhang & He, 2012). Higher conversion efficiency of BQ 25504
with the S2 and the S3 indicates that a weak power source (e.g., R1 in this study) could
negatively affect the power transfer. In general, BQ 25504 has promoted higher power
output at a point close the MPP of the MFCs but could not reduce the negative impact from
the weak power source. Therefore, it is critical to cautiously select (grouped) MFCs with
similar electrochemical performance as power source when they are connected in serial,
and there are many non-global factors causing the variance of power output from the single
MFC such as bioactivity, difference in reactor manufacturing, distribution and gradient of
substrate concentration, etc.

124
8.3.3 Charging and discharging
Because the S3 (R357) exhibited the best performance, this connection was examined with
the 25 F ultracapacitors for charging/discharging test. The undervoltage and overvoltage
for charging was set as 3.5 and 4.5 V, respectively, according to the working voltage of a
DC motor (3-5V). As shown in Fig. 8.4, when the voltage of the ultracapacitors reached
4.5 V, it was discharged by powering the motor and when the voltage was lower than 3.5
V, they were disconnected from the motor and charged by the MFCs until the voltage was
4.5 V. It took ~15 min for the MFC system (S3) to charge the ultracapacitor from 3.5 to
4.5 V during each cycle while the input voltage was maintained at ~1 V, which was close
to the half value of OCV as shown in Fig. 8.1B. BQ 25504 worked well for the MFCs with
Figure 8.4 Charging and discharging of the ultracapacitors by the MFC system (S3 connection) and BQ25504.

125
good conversion efficiency and flexible power management function to charge capacitors.
In addition, because the voltage increment by connecting 3 or more MFCs may become
less efficient (Oh & Logan, 2007), BQ 25504 can be used to stabilize the output voltage
level with 3 or less rows of MFCs connected in serial. Although BQ 25504 EVM is
designed specifically for DC sources like solar and thermal electric generators and the
efficiency can be over 90% as reported by manufacturer, the large variation in current and
voltage from the MFCs would result in unsteady MPP that causes the MPPT to function
imperfectly with MFCs. It is possible to use this approach to boost output voltage to a
higher level like 12 V by a secondary converter system rather than connect 20 or more
(grouped) MFCs to minimize the negative effects from weak power source in serial
connection.
8.4 Conclusions
Energy can be effectively extracted from a large-scale MFC system treating municipal
wastewater. The power was efficiently converted through BQ 25504 to charge
ultracapacitors and run a DC motor. The use of the MPPT promoted energy extraction
from the MFCs. The presence of weakly performed MFC modules could negatively impact
the performance of the whole MFC system and thus energy extraction/transfer. The
successful extraction of the energy from such a large-scale MFC system operated with
actual wastewater will encourage further development of this technology for sustainable
and energy efficient wastewater treatment. Future investigation will focus on application
of the produced energy to offset energy consumption by the MFC system.

126
CHAPTER 9
Perspectives
Through the studies included in this dissertation, MFCs was proofed to be effective for
removing organic contaminants and solid content from domestic wastewater. However,
MFCs cannot be used as a standalone process that post treatment is necessary for further
COD reduction and nitrification. The residual organic content could be higher than
discharge limit under 12 h HRT. The increase of HRT may reduce the final effluent COD
but low COD concentration and high concentration gradient along the reactor are not
beneficial for electricity energy collection. From the results of this dissertation, ~100 mg/L
COD could be a set point for effluent COD from anode chamber that either aerobic
treatment or anaerobic ammonia oxidation (ANAMMOX) could be alternative polish
treatment after MFCs to achieve ammonia removal. However, the significant benefit from
MFCs system could be a very low demand of sludge treatment and disposal. Throughout
over 300-day operation, little sludge were wasted from the system, which means the
general sludge handling facilities used in activated sludge based wastewater treatment plant
could be significant simplified with much smaller digester and dewatering equipment. In
addition, the future work could focus on treating domestic wastewater without primary
clarification that primary sludge may not be by-product appeared in MFCs based treatment
process.
For energy recovery, the commercialized DC-DC converter such as BQ 25504 was
evaluated and demonstrated to be efficient to extract and stabilize the electricity energy

127
output from multiple MFC units. Therefore, the strategy of using converter would be
appropriate for large-scale MFCs with multiple cells instead of connecting too many MFCs
in serial to rise voltage output. The serial connection must be operated cautiously because
it is the major reason for most voltage reversal cases reported in MFCs studies due to the
variation in MFCs. The weakest MFC in one connection could limit the current production
and would be overdrew due to the limitation of mass transfer or electrode reaction. When
certain MFC cannot generate enough electron to maintain the current flow in the whole
circuit, this cell would transform from power generator to energy consumer. It was found
that three serial-connected units could be the optimized connection to provide enough
voltage input for DC-DC converter with less risk of reversing the electrode potential. On
the other side, although parallel connection uniform the voltage output from MFCs and
increase the current capacity to avoid voltage reversal to some extent, the MFC units in
one connection should be identical to minimize the energy loss from uniformization, which
also means the MFCs selected for one parallel connection should be operated similarly.
It should be noticed that there are still several obstacles prevent MFCs from practical
applications. Till now, there is no commercialized-scale system developed for wastewater
treatment. Even though multiple configurations have been designed for scaling-up efforts,
little progress has been achieved due to the complexity of “fuel cell” concept. Besides, the
capital costs of MFCs system would be another concern for practical application that
catalyst, electrodes, separators, and wires for electrical connection are all specialized in
MFCs comparing with conventional treatment equipment.

128
Reference
Achilli, A., Cath, T., Childress, A. 2010. Selection of inorganic-based draw solutions for
forward osmosis applications. Journal of Membrane Science, 364(1-2), 233-241.
Achilli, A., Cath, T.Y., Marchand, E.A., Childress, A.E. 2009. The forward osmosis
membrane bioreactor: A low fouling alternative to MBR processes. Desalination,
239, 10-21.
Aelterman, P., Rabaey, K., Pham, H.T., Boon, N., Verstraete, W. 2006. Continuous
Electricity Generation at High Voltages and Currents Using Stacked Microbial
Fuel Cells. Environmental Science & Technology, 40(10), 3388-3394.
An, J., Kim, B., Chang, I.S., Lee, H.-S. 2015. Shift of voltage reversal in stacked
microbial fuel cells. Journal of Power Sources, 278(0), 534-539.
Anderson, J. 2003. The environmental benefits of water recycling and reuse. Water
Science and Technology: Water Supply, 3(4), 1-10.
Angenent, L.T., Karim, K., Al-Dahhan, M.H., Wrenn, B.A., Domiguez-Espinosa, R.
2004. Production of bioenergy and biochemicals from industrial and agricultural
wastewater. Trends in Biotechnology, 22(9), 477-485.
Angenent, L.T., Sung, S. 2001. Development of anaerobic migrating blanket reactor
(AMBR), a novel anaerobic treatment system. Water Research, 35(7), 1739-1747.
Appels, L., Baeyens, J., Degrève, J., Dewil, R. 2008. Principles and potential of the
anaerobic digestion of waste-activated sludge. Progress in Energy and
Combustion Science, 34(6), 755–781.
Arends, J.B.A., Verstraete, W. 2012. 100 years of microbial electricity production: three
concepts for the future. Microbial Biotechnology, 5(3), 333–346.
Boghani, H.C., Papaharalabos, G., Michie, I., Fradler, K.R., Dinsdale, R.M., Guwy, A.J.,
Ieropoulos, I., Greenman, J., Premier, G.C. 2014. Controlling for peak power
extraction from microbial fuel cells can increase stack voltage and avoid cell
reversal. Journal of Power Sources, 269(0), 363-369.
Brindle, K., Stephenson, T. 1996. The application of membrane biological reactors for
the treatment of wastewaters. Biotechnology and Bioengineering, 49(6), 601-610.
Cao, X., Huang, X., Liang, P., Xiao, K., Zhou, Y., Zhang, X., Logan, B.E. 2009. A new
method for water desalination using microbial desalination cells. Environmental
Science & Technology, 43(18), 7148-52.
Cao, Y., Pawłowski, A. 2012. Sewage sludge-to-energy approaches based on anaerobic
digestion and pyrolysis: Brief overview and energy efficiency assessment.
Renewable and Sustainable Energy Reviews, 16(3), 1657–1665.
Cath, T.Y., Childress, A.E., Elimelech, M. 2006. Forward osmosis: principles,
applications, and recent developments. Journal of Membrane Science 281, 70-87.
Cath, T.Y., Nathan T. Hancock, Carl D. Lundin, Christiane Hoppe-Jones, Drewes, J.E.
2010. A multi-barrier osmotic dilution process for simultaneous desalination and
purification of impaired water. Journal of Membrane Science, 362, 417–426.
Çetinkaya, A.Y., Köroğlu, E.O., Demir, N.M., Baysoy, D.Y., Özkaya, B., Çakmakçı, M.
2015. Electricity production by a microbial fuel cell fueled by brewery
wastewater and the factors in its membrane deterioration. Chinese Journal of
Catalysis, 36(7), 1068-1076.
129
Cheng, S., Liu, H., Logan, B.E. 2006. Increased performance of single-chamber
microbial fuel cells using an improved cathode structure. Electrochemistry
Communications, 8(3), 489-494.
Choi, J., Ahn, Y. 2013. Continuous electricity generation in stacked air cathode microbial
fuel cell treating domestic wastewater. Journal of Environmental Management,
130, 146-152.
Chung, T.-S., Zhang, S., Wang, K.Y., Su, J., Ling, M.M. 2011. Forward osmosis
processes: yesterday, today and tomorrow Desalination,
doi:10.1016/j.desal.2010.12.019.
Chung, T.-S., Zhang, S., Wang, K.Y., Su, J., Ling, M.M. 2012. Forward osmosis
processes: yesterday, today and tomorrow Desalination, 287, 78–81.
Clauwaert, P., Rabaey, K., Aelterman, P., Schamphelaire, L.D., Pham, T.H., Boeckx, P.,
Boon, N., Verstraete, W. 2007. Biological denitrification in microbial fuel cells.
Environmental Science and Technology, 41(9), 3354-3360.
Clesceri, L.S., Greenberg, A.E., Eaton, A.D. 1998. Standard Methods for the
Examination of Water and Wastewater. 20th ed. American Public Health
Association, Washington, DC.
Cord-Ruwisch, R., Law, Y., Cheng, K.Y. 2011. Ammonium as a sustainable proton
shuttle in bioelectrochemical systems. Bioresource Technology, 102(20), 9691-
9696
Degrenne, N., Buret, F., Allard, B., Bevilacqua, P. 2012. Electrical energy generation
from a large number of microbial fuel cells operating at maximum power point
electrical load. Journal of Power Sources, 205(0), 188-193.
Deng, Q., Li, X., Zuo, J., Ling, A., Logan, B.E. 2010. Power generation using an
activated carbon fiber felt cathode in an upflow microbial fuel cell. Journal of
Power Sources, 195(4), 1130-1135.
Dong, H., Yu, H., Wang, X., Zhou, Q., Feng, J. 2012. A novel structure of scalable air-
cathode without Nafion and Pt by rolling activated carbon and PTFE as catalyst
layer in microbial fuel cells. Water Research, 46(17), 5777-5787.
Dong, Y., Qu, Y., He, W., Du, Y., Liu, J., Han, X., Feng, Y. 2015. A 90-liter stackable
baffled microbial fuel cell for brewery wastewater treatment based on energy self-
sufficient mode. Bioresource Technology, 195, 66-72.
Dong, Y., Qu, Y., He, W., Du, Y., Liu, J., Han, X., Feng, Y. A 90-liter stackable baffled
microbial fuel cell for brewery wastewater treatment based on energy self-
sufficient mode. Bioresource Technology(0).
Donovan, C., Dewan, A., Heo, D., Beyenal, H. 2008. Batteryless, Wireless Sensor
Powered by a Sediment Microbial Fuel Cell. Environmental Science &
Technology, 42(22), 8591-8596.
Douglas C. Montgomery, G.C.R. 2011. Applied Statistics and Probablity for Engineers.
5th ed. John Wiley & Sons, Inc.
Erbay, C., Carreon-Bautista, S., Sanchez-Sinencio, E., Han, A. 2014. High Performance
Monolithic Power Management System with Dynamic Maximum Power Point
Tracking for Microbial Fuel Cells. Environmental Science & Technology, 48(23),
13992-13999.

130
Fang, Z., Song, H.-l., Cang, N., Li, X.-n. 2015. Electricity production from Azo dye
wastewater using a microbial fuel cell coupled constructed wetland operating
under different operating conditions. Biosensors and Bioelectronics, 68, 135-141.
Faulkner, A.J.B.a.L.R. 2000. Electrochemical Methods: Fundamentals and Applications.
2nd ed. Wiley.
Feng, Y., He, W., Liu, J., Wang, X., Qu, Y., Ren, N. 2014a. A horizontal plug flow and
stackable pilot microbial fuel cell for municipal wastewater treatment.
Bioresource Technology, 156(0), 132-138.
Feng, Y., He, W., Liu, J., Wang, X., Qu, Y., Ren, N. 2014b. A horizontal plug flow and
stackable pilot microbial fuel cell for municipal wastewater treatment.
Bioresource Technology, 156, 132-138.
Gander, M., Jefferson, B., Judd, S. 2000. Aerobic MBRs for domestic wastewater
treatment: a review with cost considerations. Separation and Purification
Technology, 18, 119–130.
Gao, D., Peng, Y., Li, B., Liang, H. 2009. Shortcut nitrification-denitrification by real-
time control strategies. Bioresour Technol, 100(7), 2298-300.
Ge, Z., He, Z. 2012. Effects of draw solutions and membrane conditions on electricity
generation and water flux in osmotic microbial fuel cells. Bioresource
Technology, 109, 70-76.
Ge, Z., Li, J., Xiao, L., Tong, Y., He, Z. 2013a. Recovery of Electrical Energy in
Microbial Fuel Cells. Environmental Science & Technology Letters, 1(2), 137-
141.
Ge, Z., Ping, Q., He, Z. 2013b. Hollow-fiber membrane bioelectrochemical reactor for
domestic wastewater treatment. Journal of Chemical Technology &
Biotechnology, DOI: 10.1002/jctb.4009.
Ge, Z., Ping, Q., Xiao, L., He, Z. 2013c. Reducing effluent discharge and recovering
bioenergy in an osmotic microbial fuel cell treating domestic wastewater.
Desalination, 312, 52–59.
Ge, Z., Wu, L., Zhang, F., He, Z. 2015. Energy extraction from a large-scale microbial
fuel cell system treating municipal wastewater. Journal of Power Sources, 297,
260-264.
Ge, Z., Zhang, F., Grimaud, J., Hurst, J., He, Z. 2013d. Long-term investigation of
microbial fuel cells treating primary sludge or digested sludge. Bioresource
Technology, 136, 509-514.
Ghyoot, W., Verstraete, W. 1997. Anaerobic digestion of primary sludge from chemical
pre-precipitation. Water Science and Technology, 36, 357–365.
Gil, G.C., Chang, I.S., Kim, B.H., Kim, M., Jang, J.K., Park, H.S., Kim, H.J. 2003.
Operational parameters affecting the performance of a mediator-less microbial
fuel cell. Biosens. Bioelectron., 18(4), 327-334.
Halalsheh, M., Kassab, G., Yazajeen, H., Qumsieh, S., Field, J. 2011. Effect of increasing
the surface area of primary sludge on anaerobic digestion at low temperature.
Bioresource Technology, 102(2), 748–752.
Hancock, N.T., Cath, T.Y. 2009. Solute coupled diffusion in osmotically driven
membrane processes. Environ Sci Technol, 43(17), 6769-75.

131
Hatzell, M.C., Kim, Y., Logan, B.E. 2013. Powering microbial electrolysis cells by
capacitor circuits charged using microbial fuel cell. Journal of Power Sources,
229(0), 198-202.
He, Z. 2013. Microbial fuel cells: now let us talk about energy. Environmental Science &
Technology, 47, 332-333.
He, Z. 2012. One more function for microbial fuel cells in treating wastewater: producing
high-quality water. CHEMIK, 66, 7-10.
He, Z., Wagner, N., Minteer, S., Angenent, L. 2006a. An upflow microbial fuel cell with
an interior cathode: Assessment of the internal resistance by impedance
Spectroscopy. Environmental Science & Technology, 40(17), 5212-5217.
He, Z., Wagner, N., Minteer, S.D., Angenent, L.T. 2006b. An upflow microbial fuel cell
with an interior cathode: assessment of the internal resistance by impedance
spectroscopy. Environmental Science & Technology, 40(17), 5212-5217.
Heidrich, E.S., Curtis, T.P., Dolfing, J. 2011. Determination of the Internal Chemical
Energy of Wastewater. Environmental Science & Technology, 45(2), 827-832.
Hoover, L.A., Phillip, W.A., Tiraferri, A., Yip, N.Y., Elimelech, M. 2011. Forward with
osmosis: emerging applications for greater sustainability. Environ Sci Technol,
45(23), 9824-30.
Hu, Z. 2008. Electricity generation by a baffle-chamber membraneless microbial fuel
cell. Journal of Power Sources, 179(1), 27–33.
Huang, Y., He, Z., Mansfeld, F. 2010. Performance of microbial fuel cells with and
without Nafion solution as cathode binding agent. Bioelectrochemistry, 79(2),
261-264.
Huang, Z., Ong, S.L., Ng, H.Y. 2011. Submerged anaerobic membrane bioreactor for
low-strength wastewater treatment: effect of HRT and SRT on treatment
performance and membrane fouling. Water Res, 45(2), 705-13.
Ieropoulos, I.A., Ledezma, P., Stinchcombe, A., Papaharalabos, G., Melhuish, C.,
Greenman, J. 2013. Waste to real energy: the first MFC powered mobile phone.
Physical Chemistry Chemical Physics, 15(37), 15312-15316.
Inglesby, A.E., Fisher, A.C. 2012. Enhanced methane yields from anaerobic digestion of
Arthrospira maxima biomass in an advanced flow-through reactor with an
integrated recirculation loop microbial fuel cell. Energy & Environmental Science
5, 7996-8006.
INSTRUMENTS, T. 2011. bq25504 EVM – Ultra Low Power Boost Converter with
Battery Management for Energy Harvester Applications.
Jacobson, K.S., Drew, D., He, Z. 2011. Use of a liter-scale microbial desalination cell as
a platform to study bioelectrochemical desalination with salt solution or artificial
seawater. Environmental Science & Technology, 45, 4652-4657.
Jiang, J., Zhao, Q., Zhang, J., Zhang, G., Lee, D.-J. 2009. Electricity generation from bio-
treatment of sewage sludge with microbial fuel cell. Bioresource Technology,
100, 5808–5812.
Jiang, J.Q., Zhao, Q.L., Wang, K., Wei, L.L., Zhang, G.D., Zhang, J.N. 2010. Effect of
ultrasonic and alkaline pretreatment on sludge degradation and electricity
generation by microbial fuel cell. Water Science and Technology, 61(11), 2915-
2921.
132
Judd, S. 2008. The status of membrane bioreactor technology. Trends in Biotechnology,
26(2), 109–116.
Kargi, F., Eker, S. 2007. Electricity generation with simultaneous wastewater treatment
by a microbial fuel cell (MFC) with Cu and Cu–Au electrodes. Journal of
Chemical Technology & Biotechnology, 82(7), 658-662.
Kim, J., Kim, K., Ye, H., Lee, E., Shin, C., McCarty, P.L., Bae, J. 2011a. Anaerobic
fluidized bed membrane bioreactor for wastewater treatment. Environ Sci
Technol, 45(2), 576-81.
Kim, J., Kim, K., Ye, H., Lee, E., Shin, C., McCarty, P.L., Bae, J. 2011b. Anaerobic
Fluidized Bed Membrane Bioreactor for Wastewater Treatment. Environmental
Science & Technology, 45(2), 576-581.
Kim, J.R., Premier, G.C., Hawkes, F.R., Rodríguez, J., Dinsdale, R.M., Guwy, A.J.
2010a. Modular tubular microbial fuel cells for energy recovery during sucrose
wastewater treatment at low organic loading rate. Bioresource Technology,
101(4), 1190–1198.
Kim, J.R., Premier, G.C., Hawkes, F.R., Rodríguez, J., Dinsdale, R.M., Guwy, A.J.
2010b. Modular tubular microbial fuel cells for energy recovery during sucrose
wastewater treatment at low organic loading rate. Bioresource Technology,
101(4), 1190-1198.
Kim, J.R., Zuo, Y., Regan, J.M., Logan, B.E. 2008. Analysis of ammonia loss
mechanisms in microbial fuel cells treating animal wastewater. Biotechnology and
Bioengineering, 99(5), 1120-1127.
Kim, Y., Logan, B.E. 2013. Microbial desalination cells for energy production and
desalination. Desalination, 308, 122–130.
Kuntke, P., Smiech, K.M., Bruning, H., Zeeman, G., Saakes, M., Sleutels, T.H.,
Hamelers, H.V., Buisman, C.J. 2012. Ammonium recovery and energy production
from urine by a microbial fuel cell. Water Res, 46(8), 2627-36.
L.S. Clesceri, A.E.G., A.D. Eaton. 1998. Standard Methods for the Examination of Water
and Wastewater. 20th ed. ed, American Public Health Association. Washington,
DC.
Lackner, S., Gilbert, E.M., Vlaeminck, S.E., Joss, A., Horn, H., van Loosdrecht, M.C.M.
2014. Full-scale partial nitritation/anammox experiences – An application survey.
Water Research, 55, 292-303.
Ledezma, P., Stinchcombe, A., Greenman, J., Ieropoulos, I. 2013. The first self-
sustainable microbial fuel cell stack. Physical Chemistry Chemical Physics, 15(7),
2278-2281.
Lee, S., Boo, C., Elimelech, M., Hong, S. 2010. Comparison of fouling behavior in
forward osmosis (FO) and reverse osmosis (RO). Journal of Membrane Science,
1-2, 34–39.
Li, W.-W., Sheng, G.-P., Liu, X.-W., Yu, H.-Q. 2011. Recent advances in the separators
for microbial fuel cells. Bioresource Technology, 102, 244-252.
Li, W.-W., Yu, H.-Q., He, Z. 2014a. Towards sustainable wastewater treatment by using
microbial fuel cells-centered technologies. Energy Environ. Sci., 7(3), 911-924.
Li, W.-W., Yu, H.-Q., He, Z. 2014b. Towards sustainable wastewater treatment by using
microbial fuel cells-centered technologies. Energy & Environmental Science,
7(3), 911-924.

133
Li, Z.Y., Yangali-Quintanilla, V., Valladares-Linares, R., Li, Q., Zhan, T., Amy, G. 2012.
Flux patterns and membrane fouling propensity during desalination of seawater
by forward osmosis. Water Res, 46(1), 195-204.
Liang, P., Wei, J., Li, M., Huang, X. 2013. Scaling up a novel denitrifying microbial fuel
cell with an oxic-anoxic two stage biocathode. Frontiers of Environmental
Science & Engineering, 7(6), 913-919.
Liao, B.-Q., Kraemer, J.T., Bagley, D.M. 2006. Anaerobic Membrane Bioreactors:
Applications and Research Directions. Critical Reviews in Environmental Science
and Technology, 36(6), 489-530.
Ling, M.M., Wang, K.Y., Chung, T.-S. 2010. Highly water-soluble magnetic
nanoparticles as novel draw solutes in forward osmosis for water reuse. Industrial
& Engineering Chemistry Research, 49(12), 5869–5876.
Liu, H., Logan, B.E. 2004. Electricity Generation Using an Air-Cathode Single Chamber
Microbial Fuel Cell in the Presence and Absence of a Proton Exchange
Membrane. Environmental Science & Technology, 38(14), 4040-4046.
Liu, X., Wang, W., Shi, Y., Zheng, L., Gao, X., Qiao, W., Zhou, Y. 2012. Pilot-scale
anaerobic co-digestion of municipal biomass waste and waste activated sludge in
China: effect of organic loading rate. Waste Manag, 32(11), 2056-60.
Logan, B., Rabaey, K. 2012. Conversion of wastes into bioelectricity and chemicals using
microbial electrochemical technologies. Science, 337, 686-690.
Logan, B., Regan, J. 2006. Electricity-producing bacterial communities in microbial fuel
cells. Trends in Microbiology, 14(12), 512-518.
Logan, B.E. 2010. Scaling up microbial fuel cells and other bioelectrochemical systems.
Applied Microbiology and Biotechnology, 85(6), 1665-1671.
Logan, B.E., Call, D., Cheng, S., Hamelers, H.V., Sleutels, T.H., Jeremiasse, A.W.,
Rozendal, R.A. 2008. Microbial electrolysis cells for high yield hydrogen gas
production from organic matter. Environmental Science & Technology, 42(23),
8630-40.
Logan, B.E., Hamelers, B., Rozendal, R., Schröder, U., Keller, J., Freguia, S., Aelterman,
P., Verstraete, W., Rabaey, K. 2006a. Microbial Fuel Cells: Methodology and
Technology†. Environmental Science & Technology, 40(17), 5181-5192.
Logan, B.E., Hamelers, B., Rozendal, R.A., Schroder, U., Keller, J., Freguia, S.,
Aelterman, P., Verstraete, W., Rabaey, K. 2006b. Microbial fuel cells:
methodology and technology. Environmental Science and Technology, 40(17),
5181-5192.
Logan, B.E., Hamelers, B., Rozendal, R.A., Schrorder, U., Keller, J., Freguia, S.,
Aelterman, P., Verstraete, W., Rabaey, K. 2006c. Microbial fuel cells:
Methodology and technology. Environmental Science & Technology, 40(17),
5181-5192.
Logan, B.E., Murano, C., Scott, K., Gray, N.D., Head, I.M. 2005. Electricity generation
from cysteine in a microbial fuel cell. Water Research, 39(5), 942-952.
Marrot, B., Barrios-Martinez, A., Moulin, P., Roche, N. 2004. Industrial wastewater
treatment in a membrane bioreactor: A review. Environmental Progress, 23(1),
59-68.
Masters, G.M., Ela, W.P. 2008. Introduction to environmental engineering and science.
Third ed. Prentice-Hall, Inc., Upper Saddle River, New Jersey.

134
Mata-Alvarez, J., Macé, S., Llabrés, P. 2000. Anaerobic digestion of organic solid
wastes. An overview of research achievements and perspectives. Bioresource
Technology, 74(1), 3-16.
McBride, L.R., Girguis, P., Reimers, C.E. 2006. Power Storage and Conversion from an
Ocean Microbial Energy Source. OCEANS 2006, 18-21 Sept. 2006. pp. 1-5.
McCarty, P.L., Bae, J., Kim, J. 2011a. Domestic Wastewater Treatment as a Net Energy
Producer–Can This be Achieved? Environ. Sci. Technol., 45(17), 7100–7106.
McCarty, P.L., Bae, J., Kim, J. 2011b. Domestic Wastewater Treatment as a Net Energy
Producer–Can This be Achieved? Environmental Science & Technology, 45(17),
7100-7106.
McCutcheon, J.R., McGinnis, R.L., Elimelech, M. 2005. A novel ammonia—carbon
dioxide forward (direct) osmosis desalination process Desalination, 174(1), 1-11.
Mi, B., Elimelech, M. 2008. Chemical and physical aspects of organic fouling of forward
osmosis membranes. Journal of Membrane Science, 320, 292–302.
Molognoni, D., Puig, S., Balaguer, M.D., Liberale, A., Capodaglio, A.G., Callegari, A.,
Colprim, J. 2014. Reducing start-up time and minimizing energy losses of
Microbial Fuel Cells using Maximum Power Point Tracking strategy. Journal of
Power Sources, 269(0), 403-411.
Morris, J.M., Jin, S., Wang, J., Zhu, C., Urynowicz, M.A. 2007. Lead dioxide as an
alternative catalyst to platinum in microbial fuel cells. Electrochemistry
Communications, 9(7), 1730-1734.
Nghia, T., Wookpyo, H., Ewing, T., Beyenal, H., Jong-Hoon, K., Deukhyoun, H. 2015. A
Self-Sustainable Power Management System for Reliable Power Scaling Up of
Sediment Microbial Fuel Cells. Power Electronics, IEEE Transactions on, 30(9),
4626-4632.
Oh, S.E., Logan, B.E. 2007. Voltage reversal during microbial fuel cell stack operation.
Journal of Power Sources, 167(1), 11-17.
Pant, D., Van Bogaert, G., Diels, L., Vanbroekhoven, K. 2010. A review of the substrates
used in microbial fuel cells (MFCs) for sustainable energy production
Bioresource Technology, 101(6), 1533-1543
Park, J.-D., Ren, Z. 2012. Hysteresis controller based maximum power point tracking
energy harvesting system for microbial fuel cells. Journal of Power Sources,
205(0), 151-156.
Pham, T.H., Rabaey, K., Aelterman, P., Clauwaert, P., De Schamphelaire, L., Boon, N.,
Verstraete, W. 2006. Microbial fuel cells in relation to conventional anaerobic
digestion technology. Engineering in Life Sciences, 6(3), 285-292.
Phillip, W.A., Yong, J.S., Elimelech, M. 2010. Reverse draw solute permeation in
forward osmosis: modeling and experiments. Environmental Science &
Technology, 44(13), 5170-6.
Phuntsho, S., Shon, H.K., Hong, S., Lee, S., Vigneswaran, S. 2011. A novel low energy
fertilizer driven forward osmosis desalination for direct fertigation: Evaluating the
performance of fertilizer draw solutions. Journal of Membrane Science, 375, 172-
181.
Plappally, A.K., Lienhard V, J.H. 2012a. Energy requirements for water production,
treatment, end use, reclamation, and disposal. Renewable and Sustainable Energy
Reviews, 16(7), 4818-4848.

135
Plappally, A.K., Lienhard V, J.H. 2012b. Energy requirements for water production,
treatment, end use, reclamation, and disposal. Renewable & Sustainable Energy
Reviews, 16(7), 4818–4848.
Prieto, A.L. 2011. Sequential Anaerobic and Algal Membrane Bioreactor (A2MBR)
System for Sustainable Sanitation and Resource Recovery from Domestic
Wastewater. in: Civil and Environmental Engineering, Vol. PhD, University of
South Florida. Tampa, FL, pp. 3296.
Quan, X., Wang, F., Zhao, Q., Zhao, T., Xiang, J. 2009. Air stripping of ammonia in a
water-sparged aerocyclone reactor. Journal of Hazardous Materials, 170(2-3),
983-8.
Rabaey, K., Boon, N., Höfte, M., Verstraete, W. 2005a. Microbial Phenazine Production
Enhances Electron Transfer in Biofuel Cells. Environmental Science &
Technology, 39(9), 3401-3408.
Rabaey, K., Butzer, S., Brown, S., Keller, J., Rozendal, R.A. 2010. High current
generation coupled to caustic production using a lamellar bioelectrochemical
system. Environmental Science & Technology, 44(11), 4315-21.
Rabaey, K., Clauwaert, P., Aelterman, P., Verstraete, W. 2005b. Tubular Microbial Fuel
Cells for Efficient Electricity Generation. Environmental Science & Technology,
39(20), 8077-8082.
Rabaey, K., Verstraete, W. 2005. Microbial fuel cells: novel biotechnology for energy
generation. Trends Biotechnol., 23(6), 291-298.
Rabiller-Baudry, M., Maux, M.L., Chaufer, B., Begoin, L. 2002. Characterisation of
cleaned and fouled membrane by ATR—FTIR and EDX analysis coupled with
SEM: application to UF of skimmed milk with a PES membrane. Desalination,
146(1-3), 123–128.
Rinaldi, A., Mecheri, B., Garavaglia, V., Licoccia, S., Di Nardo, P., Traversa, E. 2008.
Engineering materials and biology to boost performance of microbial fuel cells: a
critical review. Energy & Environmental Science, 1(4), 417-429.
Rismani-Yazdi, H., Carver, S.M., Christy, A.D., Tuovinen, O.H. 2008. Cathodic
limitations in microbial fuel cells: An overview. Journal of Power Sources,
180(2), 683-694.
Rozendal, R.A., Hamelers, H.V.M., Buisman, C.J.N. 2006. Effects of membrane cation
transport on pH and microbial fuel cell performance. Environmental Science and
Technology, 40(17), 5206-5211.
Rozendal, R.A., Leone, E., Keller, J., Rabaey, K. 2009. Efficient hydrogen peroxide
generation from organic matter in a bioelectrochemical system. Electrochemistry
Communications, 11(9), 1752-1755.
Samsudeen, N., Radhakrishnan, T.K., Matheswaran, M. 2015. Performance comparison
of triple and dual chamber microbial fuel cell using distillery wastewater as a
substrate. Environmental Progress & Sustainable Energy, 34(2), 589-594.
Shannon, M.A., Bohn, P.W., Elimelech, M., Georgiadis, J.G., Marinas, B.J., Mayes,
A.M. 2008. Science and technology for water purification in the coming decades.
Nature, 452(7185), 301-10.
Shantaram, A., Beyenal, H., Veluchamy, R.R.A., Lewandowski, Z. 2005. Wireless
Sensors Powered by Microbial Fuel Cells. Environmental Science & Technology,
39(13), 5037-5042.

136
Smith, A.L., Stadler, L.B., Love, N.G., Skerlos, S.J., Raskin, L. 2012. Perspectives of
anaerobic membrane bioreactor treatment of domestic wastewater: a cricial
review. Bioresource Technology, DOI: 10.1016/j.biortech.2012.04.055.
Smith, R.G.W. 2002. U.S. Electricity Consumption for Water Supply & Treatment - The
Next Half Century. in: Water & Sustainability, Vol. 4.
Sun, J., Hu, Y., Bi, Z., Cao, Y. 2009. Improved performance of air-cathode single
chamber microbial fuel cell for wastewater treatment using microfiltration
membranes and multiple sludge inoculation. Journal of Power Sources, 187(2),
471-479.
Sun, G., Thygesen, A., Ale, M., Mensah, M., Poulsen, F., Meyer, A. 2014. The
significance of the initiation process parameters and reactor design for
maximizing the efficiency of microbial fuel cells. Applied Microbiology and
Biotechnology, 98(6), 2415-2427
Sung, S., Liu, T. 2003. Ammonia inhibition on thermophilic anaerobic digestion.
Chemosphere, 53(1), 43-52.
Tchobanoglous, G., Burton, F.L., Stensel, H.D. 2002. Wastewater Engineering:
Treatment and Reuse. 4th ed. McGraw-Hill.
Tender, L.M., Gray, S.A., Groveman, E., Lowy, D.A., Kauffman, P., Melhado, J., Tyce,
R.C., Flynn, D., Petrecca, R., Dobarro, J. 2008. The first demonstration of a
microbial fuel cell as a viable power supply: Powering a meteorological buoy.
Journal of Power Sources, 179(2), 571-575.
Ting, C.H., Lee, D.J. 2007. Production of hydrogen and methane from wastewater sludge
using anaerobic fermentation. International Journal of Hydrogen Energy, 32, 677
– 682.
Tugtas, A.E., Cavdar, P., Calli, B. 2011. Continuous flow membrane-less air cathode
microbial fuel cell with spunbonded olefin diffusion layer. Bioresource
Technology, 102(22), 10425–10430.
van Nieuwenhuijzen, A.F., Evenblij, H., Uijterlinde, C.A., Schulting, F.L. 2008. Review
on the state of science on membrane bioreactors for municipal wastewater
treatment. Water Science and Technology, 57(7), 979-986.
Wang, H., Park, J.-D., Ren, Z. 2012a. Active Energy Harvesting from Microbial Fuel
Cells at the Maximum Power Point without Using Resistors. Environmental
Science & Technology, 46(9), 5247-5252.
Wang, H., Park, J.-D., Ren, Z.J. 2015. Practical Energy Harvesting for Microbial Fuel
Cells: A Review. Environmental Science & Technology, 49(6), 3267-3277.
Wang, H., Park, J.D., Ren, Z. 2012b. Active energy harvesting from microbial fuel cells
at the maximum power point without using resistors. Environ Sci Technol, 46(9),
5247-52.
Wang, H., Ren, Z., Park, J.-D. 2012c. Power electronic converters for microbial fuel cell
energy extraction: Effects of inductance, duty ratio, and switching frequency.
Journal of Power Sources, 220(0), 89-94.
Wang, H., Ren, Z.J. 2013. A comprehensive review of microbial electrochemical systems
as a platform technology. Biotechnology Advances, 31(8), 1796-1807.
Wang, X., Cheng, S., Feng, Y., Merrill, M.D., Saito, T., Logan, B.E. 2009. Use of carbon
mesh anodes and the effect of different pretreatment methods on power

137
production in microbial fuel cells. Environmental Science & Technology, 43(17),
6870-6874.
Wang, Y.-K., Sheng, G.-P., Li, W.-W., Huang, Y.-X., Yu, Y.-Y., Zeng, R.J., Yu, H.-Q.
2011. Development of a novel bioelectrochemical membrane reactor for
wastewater treatment. Environmental Science and Technology, 45(21), 9256–
9261.
Wang, Y.-P., Liu, X.-W., Li, W.-W., Li, F., Wang, Y.-K., Sheng, G.-P., Zeng, R.J., Yu,
H.-Q. 2012d. A microbial fuel cell–membrane bioreactor integrated system for
cost-effective wastewater treatment. Applied Energy, 98, 230–235.
Wang, Z., Mei, X., Ma, J., Wu, Z. 2012e. Recent Advances in Microbial Fuel Cells
Integrated with Sludge Treatment. Chemical Engineering & Technology, 35(10),
1733–1743.
Watson, V.J., Nieto Delgado, C., Logan, B.E. 2013. Influence of Chemical and Physical
Properties of Activated Carbon Powders on Oxygen Reduction and Microbial
Fuel Cell Performance. Environmental Science & Technology, 47(12), 6704-6710.
Woodward, L., Perrier, M., Srinivasan, B., Pinto, R.P., Tartakovsky, B. 2010.
Comparison of real-time methods for maximizing power output in microbial fuel
cells. AIChE Journal, 56(10), 2742-2750.
Xiao, B., Yang, F., Liu, J. 2011. Enhancing simultaneous electricity production and
reduction of sewage sludge in two-chamber MFC by aerobic sludge digestion and
sludge pretreatments. J Hazard Mater, 189(1-2), 444-9.
Xiao, L., Ge, Z., Kelly, P., Zhang, F., He, Z. 2014. Evaluation of normalized energy
recovery (NER) in microbial fuel cells affected by reactor dimensions and
substrates. Bioresource Technology, 157(0), 77-83.
Xiao, L., Young, E.B., Berges, J.A., He, Z. 2012. Integrated photo-bioelectrochemical
system for contaminants removal and bioenergy production. Environmental
Science & Technology, 46, 11459-11466.
Xu, B., Ge, Z., He, Z. 2015. Sediment microbial fuel cells for wastewater treatment:
challenges and opportunities. Environmental Science: Water Research &
Technology, 1(3), 279-284.
Yang, F., Ren, L., Pu, Y., Logan, B.E. 2013. Electricity generation from fermentation
solution of primary sludge using single-chambered air-cathode microbial fuel
cells. Bioresource Technology, DOI: 10.1016/j.biortech.2012.10.021.
Yang, F., Zhang, D., Shimotori, T., Wang, K.-C., Huang, Y. 2012. Study of transformer-
based power management system and its performance optimization for microbial
fuel cells. Journal of Power Sources, 205(0), 86-92.
Yang, Q., Wang, K.Y., Chung, T.S. 2009. Dual-layer hollow fibers with enhanced flux as
novel forward osmosis membranes for water production. Environmental Science
& Technology, 43(8), 2800-5.
Yang, W., Cicek, N., Ilg, J. 2006. State-of-the-art of membrane bioreactors: Worldwide
research and commercial applications in North America. Journal of Membrane
Science, 270, 201–211.
Ye, Z., Zhang, B., Liu, Y., Wang, Z., Tian, C. 2014. Continuous electricity generation
with piggery wastewater treatment using an anaerobic baffled stacking microbial
fuel cell. Desalination and Water Treatment, 55(8), 2079-2087.

138
Yip, N.Y., Tiraferri, A., Phillip, W.A., Schiffman, J.D., Elimelech, M. 2010. High
performance thin-film composite forward osmosis membrane. Environmental
Science & Technology, 44(10), 3812-8.
Yuan, H., Li, J., Yuan, C., He, Z. 2014. Facile Synthesis of MoS2@CNT as an Effective
Catalyst for Hydrogen Production in Microbial Electrolysis Cells.
ChemElectroChem, 1(11), 1828-1833.
Zhang, B., He, Z. 2012a. Energy production, use and saving in a bioelectrochemical
desalination system. RSC Advances, 2(28), 10673-10679.
Zhang, B., He, Z. 2012b. Integrated salinity reduction and water recovery in an osmotic
microbial desalination cells. RSC Advances, 2, 3265-3269.
Zhang, B., Wen, Z., Ci, S., Mao, S., Chen, J., He, Z. 2014. Synthesizing Nitrogen-Doped
Activated Carbon and Probing its Active Sites for Oxygen Reduction Reaction in
Microbial Fuel Cells. ACS Applied Materials & Interfaces, 6(10), 7464-7470.
Zhang, F., Brastad, K., He, Z. 2011a. Integrating forward osmosis into microbial fuel
cells for wastewater treatment, water extraction and bioelectricity generation.
Environmental Science & Technology, 45, 6690-6696.
Zhang, F., Cheng, S., Pant, D., Bogaert, G.V., Logan, B.E. 2009. Power generation using
an activated carbon and metal mesh cathode in a microbial fuel cell.
Electrochemistry Communications, 11(11), 2177-2179.
Zhang, F., Ge, Z., Grimaud, J., Hurst, J., He, Z. 2013a. Improving electricity production
in tubular microbial fuel cells through optimizing the anolyte flow with spiral
spacers. Bioresource Technology, Under review.
Zhang, F., Ge, Z., Grimaud, J., Hurst, J., He, Z. 2013b. Long-term performance of liter-
scale microbial fuel cells installed in a municipal wastewater treatment facility.
Environmental Science & Technology, 47, 4941-4948.
Zhang, F., Ge, Z., Grimaud, J., Hurst, J., He, Z. 2013c. Long-Term Performance of Liter-
Scale Microbial Fuel Cells Treating Primary Effluent Installed in a Municipal
Wastewater Treatment Facility. Environmental Science & Technology, 47(9),
4941-4948.
Zhang, F., Jacobson, K.S., Torres, P., He, Z. 2010a. Effects of anolyte recirculation rates
and catholytes on electricity generation in a liter-scale upflow microbial fuel cell.
Energy & Environmental Science, 3, 1347-1352.
Zhang, F., Jacobson, K.S., Torres, P., He, Z. 2010b. Effects of anolyte recirculation rates
and catholytes on electricity generation in a litre-scale upflow microbial fuel cell.
Energy & Environmental Science, 3(9), 1347-1352.
Zhang, F., Pant, D., Logan, B.E. 2011b. Long-term performance of activated carbon air
cathodes with different diffusion layer porosities in microbial fuel cells.
Biosensors and Bioelectronics, 30(1), 49-55.
Zhang, F., Tian, L., He, Z. 2011c. Powering a wireless temperature sensor using sediment
microbial fuel cells with vertical arrangement of electrodes. Journal of Power
Sources, 196(22), 9568-9573.
Zhang, Y., Gao, J., Peng, D., Guangyao, M., Liu, X. 2004. Dip-coating thin yttria-
stabilized zirconia films for solid oxide fuel cell applications. Ceramics
International, 30(6), 1049-1053.

139
Zhao, F., Hamisch, F., Schroder, U., Scholz, F., Bogdanoff, P., Hermann, I. 2006a.
Challenges and constraints of using oxygen cathodes in microbial fuel cells.
Environmental Science and Technology, 40(17), 5193-5199.
Zhao, F., Harnisch, F., Schröder, U., Scholz, F., Bogdanoff, P., Herrmann, I. 2005.
Application of pyrolysed iron(II) phthalocyanine and CoTMPP based oxygen
reduction catalysts as cathode materials in microbial fuel cells. Electrochemistry
Communications, 7(12), 1405-1410.
Zhao, F., Harnisch, F., Schröder, U., Scholz, F., Bogdanoff, P., Herrmann, I. 2006b.
Challenges and Constraints of Using Oxygen Cathodes in Microbial Fuel Cells.
Environmental Science & Technology, 40(17), 5193-5199.
Zhao, F., Slade, R.C.T., Varcoe, J.R. 2009. Techniques for the study and development of
microbial fuel cells: an electrochemical perspective Chemical Society Reviews 38,
1926-1939.
Zhou, M., Chi, M., Luo, J., He, H., Jin, T. 2011. An overview of electrode materials in
microbial fuel cells. Journal of Power Sources, 196, 4427-4435.
Zou, S., Gu, Y., Xiao, D., Tang, C.Y. 2011. The role of physical and chemical parameters
on forward osmosis membrane fouling during algae separation Journal of
Membrane Science, 366(1-2), 356-362
Zuo, Y., Cheng, S., Call, D., Logan, B.E. 2007. Tubular membrane cathodes for scalable
power generation in microbial fuel cells. Environ Sci Technol, 41(9), 3347-53.

140
Appendices
Appendix A Supplemental Information to Chapter 4
Additional Measurement and Analysis
Elemental analysis was performed on an X-ray energy dispersive spectrometer (EDS)
(TopCon ABT-32). The EDS was conducted with an accelerating voltage of 15 kV and a
working distance of 30 mm. The target elements included nitrogen, oxygen, sodium,
magnesium, aluminum, silicon, phosphate, calcium, and copper.
The electrochemical impedance spectroscopy (EIS) measurements were performed in a cell
of two compartments separated by the FO membrane. The impedance across the membrane
was measured by using a potentiostat (Gamry reference 600) in a four-electrode mode. The
four-electrode system includes two platinum electrodes as the working electrode and the
counter electrode, respectively, and two Ag/AgCl electrodes as the reference electrodes
(according to Gamry technical note). The frequency was set at the range of
0.01Hz~100kHz. The electrolyte used was NaCl solution of 30g/L. The resistance
measured at high frequency represents the combined solution and membrane resistance
Rm+s. To obtain the pure membrane resistance Rm, the combined resistance is deducted
by the solution resistance Rs obtained from a blank experiment that did not contain the
membrane over the same frequency range.
For scanning electron microscopy (SEM), small pieces of the FO membrane were fixed
with glutaraldehyde for one night and OsO4 for one hour, and then dehydrated with a

141
graded ethanol series: 10%, 25%, 50%, 75%, 95%, 100% and 100%. The samples were
critical-point dried via liquid CO2 in a Balzers CPD 020 critical point drying apparatus
(Balzers Union, Liechtenstein). After drying, the samples were glued on the specimens and
then coated with 5.0 nm Iridium in the Emitech K575X Sputter Coater (Emitech, Polaron,
Britain). The morphology of microorganisms was observed by SEM (S-4800 Hitachi,
Japan).
Water flux tests were
carried out at the end of this study to examine the membrane fouling using a U-shape two-
chamber reactor (Figure S1). Both new and fouled membranes were tested for baseline and
fouling flux tests, respectively. The active layer of membrane was facing the feed solution;
there was no recirculation in the feed chamber. The recirculation rate was 500 mL/min to
enhance the mixture in the draw solution chamber. The excess water drawn through
membrane was collected in a conical flask and weighed by a digital balance. During the 4-
hr test, the weight was recorded every hour for flux calculation. DI water was used as feed
Figure A1. The U-shape reactor used for the water flux test.

142
solution; the draw solution was 2M NaCl stored in a 1-L glass bottle that had a total volume
of 1050 mL, while the volume of the feed solution was 50 mL.
Table A1 The composition of the scaling compounds on the side of the FO membrane facing the anode (wastewater)
Table A2 The composition of the scaling compounds on the side of the FO membrane facing the cathode (draw solution)

143
Figure A2 EDS spectrum of the scaling compounds on the side of the FO membrane facing the anode (wastewater).
Figure A3 EDS spectrum of the scaling compounds on the side of the FO membrane facing the cathode (draw solution).

144
Appendix B Supplemental Information to Chapter 5
Substrate HRT (h)
Power Consumption (kW)
Influent Permeate Recirculation Total
Acetate Solution
27 3.20×10⁻⁸ 1.83×10⁻⁷ 9.00×10⁻⁷ 1.11×10⁻⁶
Acetate Solution
19 4.57×10⁻⁸ 3.92×10⁻⁷ 9.00×10⁻⁷ 1.34×10⁻⁶
Primary Effluent
36 2.45×10⁻⁸ 1.03×10⁻⁷ 9.00×10⁻⁷ 1.03×10⁻⁶
Primary Effluent
26 3.35×10⁻⁸ 2.06×10⁻⁷ 9.00×10⁻⁷ 1.14×10⁻⁶
Primary Effluent
19 4.73×10⁻⁸ 4.31×10⁻⁷ 9.00×10⁻⁷ 1.38×10⁻⁶
Primary Effluent
15 5.83×10⁻⁸ 6.96×10⁻⁷ 9.00×10⁻⁷ 1.65×10⁻⁶
Substrate HRT
(h)
Energy
Production
(kWh/m3)
Energy Consumption (kWh/m3)
Influent Permeate Recirculation Total
Acetate
Solution 27 0.038 9.53×10⁻⁴ 5.44×10⁻³ 2.68×10⁻² 0.033
Acetate
Solution 19 0.035 9.53×10⁻⁴ 8.17×10⁻³ 1.87×10⁻² 0.028
Primary
Effluent 36 0.003 9.53×10⁻⁴ 4.02×10⁻³ 3.51×10⁻² 0.040
Primary
Effluent 26 0.010 9.53×10⁻⁴ 5.85×10⁻³ 2.56×10⁻² 0.032
Primary
Effluent 19 0.021 9.53×10⁻⁴ 8.69×10⁻³ 1.81×10⁻² 0.028
Primary
Effluent 15 0.025 9.53×10⁻⁴ 1.14×10⁻² 1.47×10⁻² 0.027
Table B1. Power consumption by the pumping system at different HRTs.
TABLE B2 Analysis of energy production and consumption of the MBER with different substrates and HRTs.

145
Time Cleaning methods Testing Flux (LMH)
Before After
Day 120 pH 12, submerged for 30 min, backwash for 30 min
117 at 25.8 C 154 at 25.7 C
Day 163 106 at 25.1 C 138 at 25.3 C
Day 178 93 at 25.3 C 146 at 25.3 C
Day 192 pH 12, 100 ppm NaClO submerged for 30 min, backwash for 30 min
53 at 25.1 C 93 at 25.2 C
Day 202 pH 12, 400 ppm NaClO submerged for 30 min, backwash for 30 min
96 at 25.3 C 146 at 25.7 C
Membrane Nitrogen C/F O/F
New Interior 0 0.83 0.49
Exterior 0 1.01 0.53
Fouled Interior 18.1 ± 1.7 % 0.88 0.68
Exterior 16.2 ± 2.1 % 1.16 0.68
Table B3 Membrane cleaning methods and water flux during treatment of primary effluent.
Table B4 The mass ratio of the new and the fouled membrane.

146
Time (day)
33 34 35 36 37 38 39
Cu
rre
nt
(mA
)
0
5
10
15
20
Time (day)
35 36 37 38 39
TM
P (
kP
a)
0
10
20
30
40
50
60
Figure B1 Current generation in the MBER fed with the acetate solution at HRT 19 h.
Figure B2 The TMP increase in the MBER fed with the acetate solution at HRT 19 h

147
Figure B3 Hollow-fiber membranes before (left) and after (right) chemical cleaning (day 202).
Figure B4 The weight percentages (WT%) of the elements in the new and the fouled membrane from EDS analysis: A) the interior and B) the exterior.

148
New Membrane
Fouled Membrane
Figure B5 FTIR spectra of the new and the fouled membranes.

149
Appendix C Supplemental Information to Chapter 6
Energy Calculation
Energy is calculated from power according to the following equation:
𝐸 = 𝑃 × 𝑡
Where, E is the energy (J), P is the power (W) and t is the time (s).
To convert energy from J to kWh, we can use the following relationship:
1 𝑘𝑊ℎ = 3.6 × 10⁶ 𝐽
Current density (A/m3)
0 5 10 15 20
Vo
lta
ge
(V
)
0.0
0.2
0.4
0.6
0.8
1.0
Po
we
r d
en
sit
y (
W/m
3)
0
1
2
3
4
5
6
7MFC-1
MFC-2
Figure C1 Power and voltage curves of the two MFCs during Phase I. MFC-1 was fed with the primary sludge and MFC-2 was supplied with the digested sludge. The scan
rate was 0.1 mV/s.

150
Time (day)
64 66 68 70 72 74
Cu
rre
nt
(A/m
3)
0
5
10
15
20
25
250 mL/min 300 mL/min 400 mL/min
Time (day)
60 70 80 90 100 110 120
Cu
rre
nt
(A/m
3)
0
5
10
15
20
25
PBS NaHCO3
Figure C2 Current generation of MFC-1 with different recirculation rates in Phase I.
Figure C3 Current generation of MFC-1 buffered with two different solutions in Phase I.

151
Vo
ltag
e (
V)
0.0
0.2
0.4
0.6
0.8
1.0
1.2
Po
wer
den
sit
y (
W/m
3)
0
2
4
6
8
10
12
Current density (A/m3)
0 5 10 15 20 25 30
Vo
ltag
e (
V)
0.0
0.2
0.4
0.6
0.8
1.0
Po
wer
den
sit
y (
W/m
3)
0
2
4
6
8
10
12
MFC-1
MFC-2
A
B
Figure C4 Power and voltage curves of the two MFCs during Phase II: (A) using acidified water as a catholyte; and (B) using neutralized water as a catholyte. The scan
rate was 0.1 mV/s.

152
Appendix D Supplemental Information to Chapter 8
Figure D1. Schematic of MFCs system.

153
Figure D2 Schematic of electric connections: serial connections (top) and charging/discharging circuit connection (bottom).

154

155

156
Figure D3 Polarization curves of MFCs with various serial connections.

157
CURRICULUM VITAE
Zheng Ge
Department of Civil and Environmental Engineering
Virginia Polytechnic Institute and State University
1303 University City BLVD., APT. 11
Blacksburg, VA 24060
Cell phone: (540)-577-6888
Email: [email protected]
Webpage: https://sites.google.com/a/vt.edu/zhengge/
Education Ph.D. Environmental Engineering
Virginia Tech 08/2013-present
M.S. Environmental Engineering
Polytechnic Institute of NYU 08/2009-05/2011
B.S. Environmental Science
Wuhan University of Technology, China 09/2004-07/2008
Intern and Work experience Teaching assistant
Virginia Tech 08/2015 – present
Summer Intern
CHA Companies 05/2015 – 08/2015
Research assistant
Virginia Tech
08/2013 – 05/2015
Research assistant
University of Wisconsin – Milwaukee 06/2011 – 06/2013
Water treatment technician
Aqucell Membrane Technology Co., Ltd, Wuhan, China 07/2008 – 02/2009
Design intern
Wuhuan Engineering Co., Ltd, Wuhan, China Summer, 2007
158
Research interest Biological wastewater treatment, membrane separation, desalination, nutrients removal
and recovery, bioenergy production, bioelectrochemical systems,
Honors and awards Sussman Foundation Scholarship 05/2015
WaterJAM, the 10th Annual Student Water Challenge, first place 09/2013
UWM CEAS annual graduate student poster competition, third place
05/2012
R. E. Speece Fellowship for the anaerobic treatment short course
at Marquette University 09/2011
UWM Chancellor Rewards 2011-2013
Poly NYU Grade merit scholarships 2009 – 2011
Publications 1. Ge, Z., Wu, L., Zhang, F. and He, Z.* (2015) Energy extraction from a large-scale
microbial fuel cell system treating municipal wastewater. Journal of Power Sources.
Vol 297, pp 260-264.
2. Ge, Z. and He, Z.* (2015) An effective dipping method for coating activated carbon
catalysts on the cathode electrodes of microbial fuel cells. RSC Advances. Vol 5,
pp 36933-36937.
3. Xu, B., Ge, Z. and He, Z.* (2015) Sediment microbial fuel cells for wastewater
treatment: challenges and opportunities. Environmental Science: Water Research &
Technology. Vol 1, pp 279-284.
4. Zhi, W., Ge, Z., He, Z. and Zhang H.* (2014) Methods for understanding microbial
community structure and functions in microbial fuel cells: a review. Bioresource
Technology. Vol 171, pp 461-468.
5. Li, J., Ge, Z. and He, Z.* (2014) A fluidized bed membrane bioelectrochemical
reactor for energy-efficient wastewater treatment. Bioresource Technology. Vol 167,
pp 310-315
6. Ge, Z., Dosoretz, C. and He, Z.* (2014) Effects of numbers of cell pairs on the
performance of microbial desalination cells. Desalination. Vol 341, pp 101-106.
7. Xiao, L., Ge, Z., Kelly P., Zhang, F. and He, Z.* (2014) Evaluation of normalized
energy recovery (NER) in microbial fuel cells affected by reactor dimension and
substrates. Bioresource Technology. Vol 157, pp 77-83.
8. Li, J., Ge, Z. and He, Z.* (2014) Advancing membrane bioelectrochemical reactor
(MBER) with hollow-fiber membranes installed in the cathode compartment.
Journal of Chemical Technology & Biotechnology. Vol 89, pp 1330-1336.
9. Ge, Z., Li, J., Xiao, L., Tong, Y. and He, Z.* (2014) Recovery of electrical energy
in microbial fuel cells. Environmental Science & Technology Letters. Vol 1, pp 137-
141.
10. Zhang, F., Ge, Z., Grimaud, J., Hurst, J. and He, Z.* (2013) Long-term performance
of liter-scale microbial fuel cells installed in a municipal wastewater treatment

159
facility. Environmental Science & Technology. Vol 47, pp 4941-4948.
11. Zhang, F., Ge, Z., Grimaud, J., Hurst, J. and He, Z.* (2013) In situ investigation of
tubular microbial fuel cell deployed in an aeration tank at a municipal wastewater
treatment plant. Bioresource Technology. Vol 136, pp 316-321.
12. Ge, Z., Zhang, F., Grimaud, J., Hurst, J. and He, Z.* (2013) Long-term investigation
of microbial fuel cells treating primary sludge or digested sludge. Bioresource
Technology. In press
13. Zhang, F., Ge, Z., Grimaud, J., Hurst, J. and He, Z.* (2013) Improving electricity
production in tubular microbial fuel cell system through optimizing the anode flow
with spiral spacers. Bioresource Technology. Vol 134, pp 251-256.
14. Ge, Z., Ping, Q. and He, Z.* (2013) Hollow-fiber membrane bioelectrochemical
reactor for domestic wastewater treatment. Journal of Chemical Technology &
Biotechnology. In press.
15. Ge, Z., Ping, Q., Xiao, L. and He, Z.* (2013) Reducing effluent discharge and
recovering bioenergy in an osmotic microbial fuel cell treating domestic wastewater.
Desalination. Vol 312, pp 52-59. (Special Issue: Recent Advances in Forward
Osmosis)
16. Ge, Z. and He, Z.* (2012) Effects of draw solutions and membrane conditions on
electricity generation and water flux in osmotic microbial fuel cells. Bioresource
Technology. Vol 109, pp 70-76.
Conference Presentations and Posters (*Presenter) 1. Ge, Z.*, Zhang, F., and He, Z. Microbial Fuel Cells for Energy-efficient Wastewater
Treatment: can we do it? VA AWWA & VWEA Water JAM 2015, Virginia Beach,
VA.
2. Ge, Z.*, Veltman, S., and He, Z. Treatability Evaluation of N-Methyl-2-Pyrrolidone
under Anaerobic Condition. VA AWWA & VWEA Water JAM 2015, Virginia
Beach, VA (Poster)
3. Ge, Z.*, Zhang, F., and He, Z. Development of large-scale Microbial Fuel Cells.
The North American Meeting of the ISMET. May 13-15, 2014, State College, PA.
(Poster) 4. Ge, Z.*, Zhang, F., and He, Z. Development of Microbial Fuel Cells for Energy-efficient
Wastewater Treatment. Borchardt Conference, Feb 25-26, 2014, Ann Arbor, MI. (Poster)
5. Jacobson, K., Xiao, Li., Ge, Z., Brastad, K. and He, Z. Development of Photo-
Bioelectrochemical Systems for Wastewater Treatment and Bioenergy Production.
National Sustainable Design Expo, April 18-19, 2013, Washington D.C.
6. Ge, Z.* and He, Z. Reducing effluent discharge and recovering bioenergy in an
osmotic microbial fuel cell treating domestic wastewater. The North American
Meeting of the ISMET. October 9-10, 2012, Ithaca, NY.