Embed Size (px)
Citation preview

ENERGY-EFFICIENT DESIGN OF AN
ASYNCHRONOUS NETWORK-ON-CHIP
by
Daniel J. Gebhardt
A dissertation submitted to the faculty ofThe University of Utah
in partial fulfillment of the requirements for the degree of
Doctor of Philosophy
in
Computer Science
School of Computing
The University of Utah
August 2011

Copyright c© Daniel J. Gebhardt 2011
All Rights Reserved

T h e U n i v e r s i t y o f U t a h G r a d u a t e S c h o o l
STATEMENT OF DISSERTATION APPROVAL
The dissertation of
has been approved by the following supervisory committee members:
, Chair Date Approved
, Member Date Approved
, Member Date Approved
, Member Date Approved
, Member Date Approved
and by , Chair of
the Department of
and by Charles A. Wight, Dean of The Graduate School.
Daniel J. Gebhardt
Kenneth S. Stevens 21-June-2011
Rajeev Balasubramonian 23-June-2011
Erik Brunvand 23-June-2011
Alan L. Davis 22-June-2011
Prashant Saxena 17-June-2011
Alan L. Davis
School of Computing
ABSTRACT
Portable electronic devices will be limited to available energy of existing battery
chemistries for the foreseeable future. However, system-on-chips (SoCs) used in these
devices are under a demand to offer more functionality and increased battery life. A
difficult problem in SoC design is providing energy-efficient communication between
its components while maintaining the required performance. This dissertation intro-
duces a novel energy-efficient network-on-chip (NoC) communication architecture. A
NoC is used within complex SoCs due it its superior performance, energy usage, mod-
ularity, and scalability over traditional bus and point-to-point methods of connecting
SoC components.
This is the first academic research that combines asynchronous NoC circuits, a
focus on energy-efficient design, and a software framework to customize a NoC for
a particular SoC. Its key contribution is demonstrating that a simple, asynchronous
NoC concept is a good match for low-power devices, and is a fruitful area for additional
investigation. The proposed NoC is energy-efficient in several ways: simple switch
and arbitration logic, low port radix, latch-based router buffering, a topology with the
minimum number of 3-port routers, and the asynchronous advantages of zero dynamic
power consumption while idle and the lack of a clock tree. The tool framework
developed for this work uses novel methods to optimize the topology and router
oorplan based on simulated annealing and force-directed m ovement. It studies link
pipelining techniques that yield improved throughput in an energy-efficient manner.
A simulator is automatically generated for each customized NoC, and its traffic
generators use a self-similar message distribution, as opposed to Poisson, to better
match application behavior. Compared to a conventional synchronous NoC, this
design is superior by achieving comparable message latency with half the energy.

This dissertation is dedicated to those who are curious and compassionate –
qualities that help advance humanity’s well-being.
CONTENTS
ABSTRACT . . . . . . . . . . . . . . . . . . . . . . . . . . . . . . . . . . . . . . . . . . . . . . . . . . iii
LIST OF FIGURES . . . . . . . . . . . . . . . . . . . . . . . . . . . . . . . . . . . . . . . . . . . . vii
LIST OF TABLES . . . . . . . . . . . . . . . . . . . . . . . . . . . . . . . . . . . . . . . . . . . . . ix
LIST OF ACRONYMS . . . . . . . . . . . . . . . . . . . . . . . . . . . . . . . . . . . . . . . . . x
ACKNOWLEDGEMENTS . . . . . . . . . . . . . . . . . . . . . . . . . . . . . . . . . . . . . xi
CHAPTERS
1. INTRODUCTION . . . . . . . . . . . . . . . . . . . . . . . . . . . . . . . . . . . . . . . . . 1
1.1 A Case for Specialization . . . . . . . . . . . . . . . . . . . . . . . . . . . . . . . . . . . 21.2 Network-on-Chip Overview . . . . . . . . . . . . . . . . . . . . . . . . . . . . . . . . . 41.3 The Problem of NoC Energy . . . . . . . . . . . . . . . . . . . . . . . . . . . . . . . . 51.4 The Solution of Customized, Asynchronous Simplicity . . . . . . . . . . . . 71.5 Dissertation Outline . . . . . . . . . . . . . . . . . . . . . . . . . . . . . . . . . . . . . . . 9
2. RELATED WORK . . . . . . . . . . . . . . . . . . . . . . . . . . . . . . . . . . . . . . . . . 11
2.1 Interconnect Optimization . . . . . . . . . . . . . . . . . . . . . . . . . . . . . . . . . . 112.2 Asynchronous NoCs . . . . . . . . . . . . . . . . . . . . . . . . . . . . . . . . . . . . . . . 152.3 Link Pipelining . . . . . . . . . . . . . . . . . . . . . . . . . . . . . . . . . . . . . . . . . . 162.4 Modeling and Simulation . . . . . . . . . . . . . . . . . . . . . . . . . . . . . . . . . . . 17
3. NOC DESIGN CONSIDERATIONS . . . . . . . . . . . . . . . . . . . . . . . . . 20
3.1 Background . . . . . . . . . . . . . . . . . . . . . . . . . . . . . . . . . . . . . . . . . . . . . 203.2 Network Customization . . . . . . . . . . . . . . . . . . . . . . . . . . . . . . . . . . . . 263.3 Asynchronous Networks . . . . . . . . . . . . . . . . . . . . . . . . . . . . . . . . . . . . 29
4. NETWORK AND CIRCUIT DESIGN . . . . . . . . . . . . . . . . . . . . . . . 31
4.1 Overview . . . . . . . . . . . . . . . . . . . . . . . . . . . . . . . . . . . . . . . . . . . . . . . 324.2 Router and Link Buffer Circuit Design . . . . . . . . . . . . . . . . . . . . . . . . 344.3 Evaluation . . . . . . . . . . . . . . . . . . . . . . . . . . . . . . . . . . . . . . . . . . . . . . 404.4 Summary . . . . . . . . . . . . . . . . . . . . . . . . . . . . . . . . . . . . . . . . . . . . . . . 42
5. DESIGN AUTOMATION FRAMEWORK . . . . . . . . . . . . . . . . . . . . 43
5.1 Topology and Placement . . . . . . . . . . . . . . . . . . . . . . . . . . . . . . . . . . . 475.2 Self-similar Traffic Generator . . . . . . . . . . . . . . . . . . . . . . . . . . . . . . . . 585.3 Simulator . . . . . . . . . . . . . . . . . . . . . . . . . . . . . . . . . . . . . . . . . . . . . . . 60
5.4 Link Pipelining . . . . . . . . . . . . . . . . . . . . . . . . . . . . . . . . . . . . . . . . . . 62
6. EVALUATION . . . . . . . . . . . . . . . . . . . . . . . . . . . . . . . . . . . . . . . . . . . . 66
6.1 Methods and Experiment Setup . . . . . . . . . . . . . . . . . . . . . . . . . . . . . 666.2 Metrics . . . . . . . . . . . . . . . . . . . . . . . . . . . . . . . . . . . . . . . . . . . . . . . . . 736.3 Results – Comparison To Baseline Network . . . . . . . . . . . . . . . . . . . . . 756.4 Results – Link Pipelining . . . . . . . . . . . . . . . . . . . . . . . . . . . . . . . . . . . 826.5 Results – Path Criticality . . . . . . . . . . . . . . . . . . . . . . . . . . . . . . . . . . 906.6 Tool Run Time . . . . . . . . . . . . . . . . . . . . . . . . . . . . . . . . . . . . . . . . . . 906.7 Summary . . . . . . . . . . . . . . . . . . . . . . . . . . . . . . . . . . . . . . . . . . . . . . . 91
7. CONCLUSIONS . . . . . . . . . . . . . . . . . . . . . . . . . . . . . . . . . . . . . . . . . . . 93
7.1 Router Circuit Design and Architecture . . . . . . . . . . . . . . . . . . . . . . . 937.2 Optimization and Simulation Tools . . . . . . . . . . . . . . . . . . . . . . . . . . . 937.3 Link Pipelining Strategies . . . . . . . . . . . . . . . . . . . . . . . . . . . . . . . . . . 947.4 Validation of this Novel NoC Design . . . . . . . . . . . . . . . . . . . . . . . . . . 947.5 Lessons . . . . . . . . . . . . . . . . . . . . . . . . . . . . . . . . . . . . . . . . . . . . . . . . 947.6 Limitations . . . . . . . . . . . . . . . . . . . . . . . . . . . . . . . . . . . . . . . . . . . . . 957.7 Future Work . . . . . . . . . . . . . . . . . . . . . . . . . . . . . . . . . . . . . . . . . . . . 96
REFERENCES . . . . . . . . . . . . . . . . . . . . . . . . . . . . . . . . . . . . . . . . . . . . . . . . 98
vi
LIST OF FIGURES
1.1 Organization of a SoC with an asynchronous NoC. . . . . . . . . . . . . . . . . 6
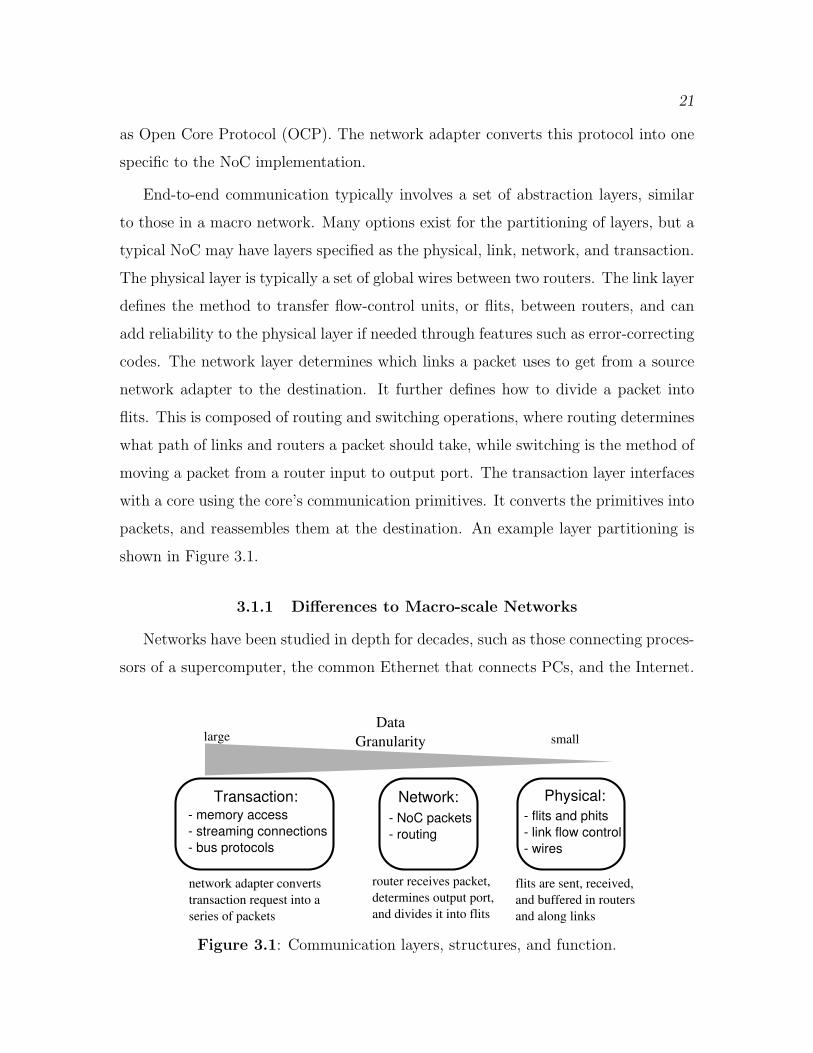
3.1 Communication layers, structures, and function. . . . . . . . . . . . . . . . . . . 21
3.2 Two topology options for connecting eight IP blocks. . . . . . . . . . . . . . . 28
3.3 CCG graph example . . . . . . . . . . . . . . . . . . . . . . . . . . . . . . . . . . . . . . . . 29
3.4 Signals of an asynchronous channel handshake. . . . . . . . . . . . . . . . . . . . 30
4.1 Pareto front of NoC design targets . . . . . . . . . . . . . . . . . . . . . . . . . . . . . 31
4.2 Architecture of the 3-port asynchronous router. . . . . . . . . . . . . . . . . . . . 33
4.3 Block diagram of link pipeline buffer. . . . . . . . . . . . . . . . . . . . . . . . . . . . 34
4.4 Link protocol comparison of energy-delay product . . . . . . . . . . . . . . . . . 35
4.5 Block diagrams of switch and merge modules. . . . . . . . . . . . . . . . . . . . . 36
4.6 Schematics of the switch and merge modules. . . . . . . . . . . . . . . . . . . . . 37
4.7 Asynchronous circuit design flow. . . . . . . . . . . . . . . . . . . . . . . . . . . . . . . 38
4.8 Petri net of linear controller. . . . . . . . . . . . . . . . . . . . . . . . . . . . . . . . . . 40
4.9 Petri net of merge controller. . . . . . . . . . . . . . . . . . . . . . . . . . . . . . . . . . 40
4.10 Schematic of a two-phase protocol link pipeline buffer. . . . . . . . . . . . . . 41
5.1 ANetGen input and output interface. . . . . . . . . . . . . . . . . . . . . . . . . . . . 44
5.2 ANetGen flow from a user’s perspective. . . . . . . . . . . . . . . . . . . . . . . . . 46
5.3 Tree topology possibilities . . . . . . . . . . . . . . . . . . . . . . . . . . . . . . . . . . . 48
5.4 Topology and placement exploration. . . . . . . . . . . . . . . . . . . . . . . . . . . . 49
5.5 Balanced tree topology generation . . . . . . . . . . . . . . . . . . . . . . . . . . . . . 51
5.6 Neighbor state generation. . . . . . . . . . . . . . . . . . . . . . . . . . . . . . . . . . . . 53
5.7 Force directed movement . . . . . . . . . . . . . . . . . . . . . . . . . . . . . . . . . . . . 55
5.8 Algorithm for router placement. . . . . . . . . . . . . . . . . . . . . . . . . . . . . . . . 56
5.9 AssignForce subroutine. . . . . . . . . . . . . . . . . . . . . . . . . . . . . . . . . . . . . . 57
5.10 Structural partitioning of traffic generation. . . . . . . . . . . . . . . . . . . . . . . 59
5.11 Self-similar traffic generation . . . . . . . . . . . . . . . . . . . . . . . . . . . . . . . . . 60
5.12 NoC link and pipeline buffer components . . . . . . . . . . . . . . . . . . . . . . . . 63
6.1 Radix-3 async router replacements for a higher radix router. . . . . . . . . . 68
6.2 Topologies of the ADSTB benchmark. . . . . . . . . . . . . . . . . . . . . . . . . . . 69
6.3 Floorplans of the TI-SoC benchmark. . . . . . . . . . . . . . . . . . . . . . . . . . . 70
6.4 Floorplans showing link pipeline buffer insertion . . . . . . . . . . . . . . . . . . 73
6.5 Structural partitioning of traffic generation. . . . . . . . . . . . . . . . . . . . . . . 75
6.6 Energy-per-flit for routers of various radix . . . . . . . . . . . . . . . . . . . . . . . 77
6.7 Message latency for each source-to-destination path. . . . . . . . . . . . . . . . 80
6.8 Power-latency product of link pipelining . . . . . . . . . . . . . . . . . . . . . . . . 83
6.9 Per-path latencies with path-specific buffers . . . . . . . . . . . . . . . . . . . . . 87
6.10 Per-path latencies with addition of CTMBs . . . . . . . . . . . . . . . . . . . . . . 88
6.11 Per-path latency histograms of link buffer additions for TI-SoC . . . . . . 89
6.12 Path criticality adjustment . . . . . . . . . . . . . . . . . . . . . . . . . . . . . . . . . . . 90
viii
LIST OF TABLES
4.1 Router parameters for various flit widths (data+routing) . . . . . . . . . . . 41
6.1 Average path bandwidths for the ADSTB design. . . . . . . . . . . . . . . . . . 69
6.2 Orion 2.0 model parameters used in COSI. . . . . . . . . . . . . . . . . . . . . . . 71
6.3 Latency and power for various COSI packet sizes. . . . . . . . . . . . . . . . . 72
6.4 Power consumption (mW) of all routers and wires during simulation . . 76
6.5 Message latencies (ns); absolute maximum and 95% interval. . . . . . . . . 79
6.6 Output buffer packet delay (ns). . . . . . . . . . . . . . . . . . . . . . . . . . . . . . . 81
6.7 Power (mW) of various buffer configurations. . . . . . . . . . . . . . . . . . . . . 84
6.8 Mean latency (ns) of buffer configurations. . . . . . . . . . . . . . . . . . . . . . . 85
LIST OF ACRONYMS
ABW available bandwidthAES advanced encryption standardANoC asynchronous network-on-chipCCG core communication graphCCS Calculus of Communicating SystemsCMP chip multi-processorCOSI COmmunication Synthesis Infrastructure frameworkCPU central processing unitCTG communication trace graphCTMB core-throughput matching bufferEDA electronic design automationGALS globally asynchronous, locally synchronousIP intellectual propertyMUX multiplexerNA network adapterOCP open core protocolOCP-IP Open Core Protocol International Partnership Association, Inc.PSB path-specific bandwidthRTC relative-timing constraintRTL register transfer levelSoC system-on-chipSF store-and-forwardTLM transaction level modelingVCT virtual cut-throughVLIW very large instruction word

ACKNOWLEDGEMENTS
I am grateful for the diverse experiences I have had at the University of Utah,
from computer architecture and network research to seminars on data visualization
and computational biochemistry. Of course, there has also been the spectacular
mountains and deserts to explore. A special thanks goes to my advisor, Ken Stevens,
for many years of technical discussion and encouragement that greatly helped make
this a successful dissertation. My committee members, Rajeev Balasubramonian,
Erik Brunvand, Al Davis, and Prashant Saxena, deserve significant acknowledgement
for their technical input and career advice, and especially for asking questions that
tempered and improved my research methods. Ivan Sutherland and Marly Roncken
have been friendly and inspirational colleagues during our many conversations on
innumerable topics. Many thanks to Junbok You for his help in circuit design and
analysis, and to all my lab’s members. The Flux Research Group and the Architecture
Reading Club provided a valuable foundation of research and publication skills, and
exposure to many research projects.
My family and friends have been a tremendous help while I walked this path.
I thank them with all my heart for the emotional, physical, and financial support
they have provided me, not least through the frequent barbecues, coffee, and outdoor
activities. My mother and father, Joyce and Karl, listened to all my frustrations,
offered encouragement, and from an early age allowed me to find my own path while
showing me what truly matters in life. Katie, my sister, has always been there for
a meaningful chat or light-hearted fun. I am very appreciative of my aunts, uncles,
and cousins for all the time we’ve spent together. Finally, I would like to thank my
grandparents who each uniquely inspired me.

CHAPTER 1
INTRODUCTION
In the growing system-on-chip (SoC) market for portable electronics, the In-
ternational Technology Roadmap for Semiconductors (ITRS) predicts the demand
on processing performance will increase 100× within ten years, but device power
consumption will remain limited to current levels. Design effort is also expected to
remain constant; re-use of existing designs will become more frequent, but this is
countered by increased difficulty of designing new components. Due to these trends,
the ITRS expresses increasing importance of application-specific technology drivers
within microchip development [50]. Application-specific development makes chip
design decisions based on the specific needs of a particular end application. This
is opposed to a general approach in which design decisions are guided by the needs
of all possible uses, and the end products adapt the general-purpose chips to their
use. With this focus comes a need to improve processing-per-watt efficiency through
a greater functional specialization, while also meeting time-to-market requirements.
The concept of an intellectual property hardware block (IP block) addresses both of
these concerns. It is a modular component that can be re-used in multiple designs,
reducing development time for a more power-efficient, application-specific SoC. A
growing challenge is the design of the communication methods between these IP blocks
as the number of blocks within a SoC and their diversity increase, while maintaining
existing development time.
This dissertation addresses the challenge of designing an energy-efficient commu-
nication fabric between the IP blocks of an embedded SoC. Its contributions include
several novel technologies that reduce power consumption in application-specific SoCs.
These contributions are:
2
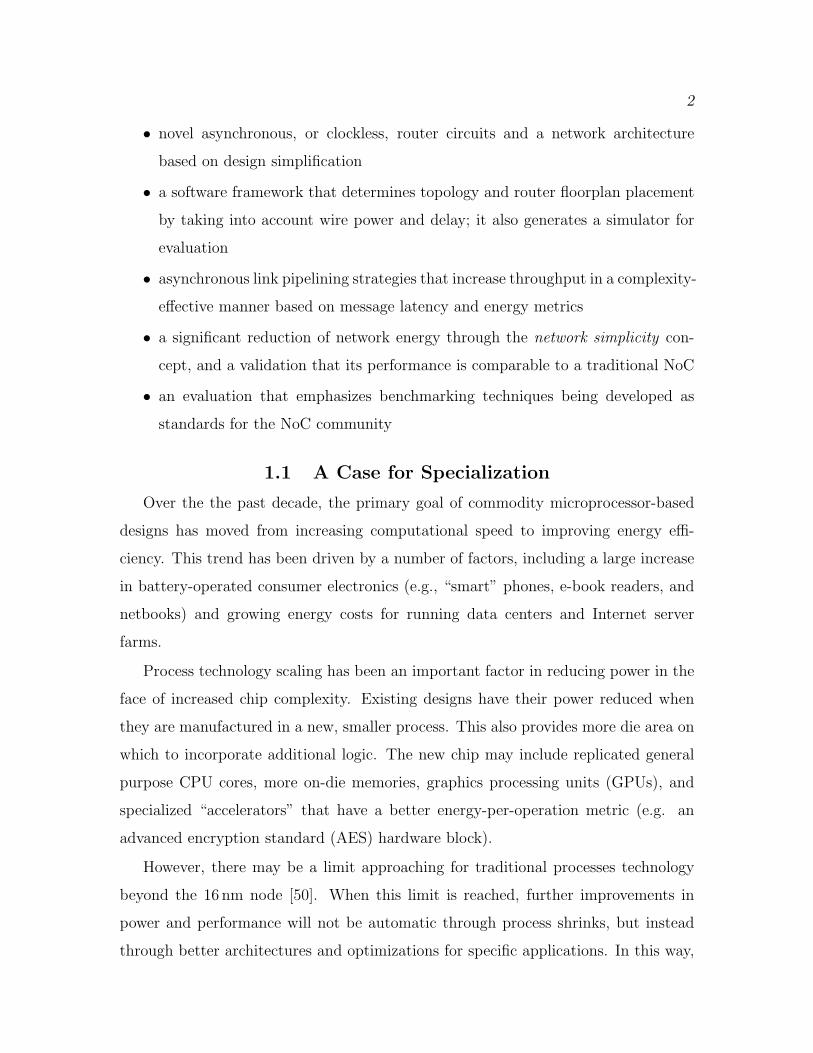
• novel asynchronous, or clockless, router circuits and a network architecture
based on design simplification
• a software framework that determines topology and router floorplan placement
by taking into account wire power and delay; it also generates a simulator for
evaluation
• asynchronous link pipelining strategies that increase throughput in a complexity-
effective manner based on message latency and energy metrics
• a significant reduction of network energy through the network simplicity con-
cept, and a validation that its performance is comparable to a traditional NoC
• an evaluation that emphasizes benchmarking techniques being developed as
standards for the NoC community
1.1 A Case for Specialization
Over the the past decade, the primary goal of commodity microprocessor-based
designs has moved from increasing computational speed to improving energy effi-
ciency. This trend has been driven by a number of factors, including a large increase
in battery-operated consumer electronics (e.g., “smart” phones, e-book readers, and
netbooks) and growing energy costs for running data centers and Internet server
farms.
Process technology scaling has been an important factor in reducing power in the
face of increased chip complexity. Existing designs have their power reduced when
they are manufactured in a new, smaller process. This also provides more die area on
which to incorporate additional logic. The new chip may include replicated general
purpose CPU cores, more on-die memories, graphics processing units (GPUs), and
specialized “accelerators” that have a better energy-per-operation metric (e.g. an
advanced encryption standard (AES) hardware block).
However, there may be a limit approaching for traditional processes technology
beyond the 16 nm node [50]. When this limit is reached, further improvements in
power and performance will not be automatic through process shrinks, but instead
through better architectures and optimizations for specific applications. In this way,
3
the end-users’ experience of Moore’s law can continue in that more functionality is
gained year after year.
Another trend relates to the economics of chip manufacturing. The non-recurring
engineering (NRE) costs of a new design have grown significantly with smaller process
technology nodes. Manufacturing NRE costs millions of dollars per silicon “spin,” and
design NRE is on the order of tens of millions of dollars. However, a new design is prof-
itable if it has high enough sales volume. The high NRE cost often makes high-volume,
general-purpose designs more attractive to invest in than specialized designs that have
similar NRE costs. As a process node matures and industry refines its methods, the
NRE costs may be sufficiently reduced such that specialized designs are economically
feasible. This specialization will help enable greater energy-efficiency. From these
trends, it follows that there is great value in developing methods that reduce the
time and manpower required for complex designs. In fact, increasing productivity is
required to control design NRE cost, thus keeping the planned semiconductor industry
roadmap in place [50].
An example of integrating specialized functionality is with H.264 video encoding.
It is a very computationally intensive task, but it can be done by cellular telephones
and other portable, energy-constrained devices. They can perform this task due to
an application-specific integrated circuit (ASIC). Recent results have shown an ASIC
is 500× more energy-efficient than a general-purpose chip multiprocessor (CMP).
However, customizing the CMP with specific functional units tailored to the algorithm
improved its energy usage to within 3× that of the ASIC [44].
Customization of very large instruction word (VLIW) processors is a similar area
of development, with designs capable of being made to the needs of a SoC devel-
oper [108]. Even general-purpose CPUs are increasing function-specific hardware.
The Intel Sandy Bridge CPU, for example, has special AES encryption instructions
and associated hardware that improve both its energy and computation time.
An increasingly common style of embedded SoC is platform-based design [119].
This design method considers a particular class of end-applications, and architects a
SoC as a platform to support them with slight configuration changes. This platform
4
is then adapted for a particular product with a specific application’s requirements
in mind. This is beneficial in that the NRE costs are spread over a high volume
product (the platform), each of which can then be easily specialized into lower volume
products. A platform may have, for example, efficient hardware implementations
for image and video processing, as opposed to general purpose CMPs. For now,
both platform-based design and general purpose design see sufficient benefit from
traditional process scaling.
However, a possible future scenario will yield an increase in specialization beyond
the platform. This can happen if the process scaling wall is reached, and further
developments reduce the cost of new chip manufacturing, such as the expensive mask
layers. Another key will be new electronic design automation (EDA) methods and
tools that improve development efficiency. With these in place, more specialized SoCs
will be possible that deliver increased functionality at lower energy and cost.
1.2 Network-on-Chip Overview
A network-on-chip (NoC) is a method providing communication between the cores
or IP blocks of a many-core chip design [28, 10]. Information to be transferred between
cores is formed into packets and sent through links and switching circuits similar to
macro-scale computer networks. Many details of NoC design concepts can be found
in [70].
The use of NoCs is growing more common as scaling limitations of traditional bus
and point-to-point interconnect designs are reached. The number of point-to-point in-
terconnections required increases dramatically as the number of IP blocks are added to
the system, and this exacerbates wire routing, area, power, and signal integrity issues.
A bus is better in this regard, but suffers from lack of bandwidth and high power
when the wire segments are long, and often uses centralized arbitration for access
that limits concurrency. Multi-segment and crossbar-derived multi-layer buses are
improvements, but still have a tight coupling between the IP block’s interface protocol
and bus implementation. For example, adding pipelined buffers to meet timing may
require adjustment of the protocol, thus changing the IP block interface. NoCs solve
5
this problem by layering communication transactions, similar to the common Open
Systems Interconnect (OSI) model employed by macro-scale networks [127]. With this
method, the IP block and its interface are agnostic to the details of the mechanism
that transfers information between the interfaces across the network. The IP interface
is typically an industry standard protocol, such as Open Core Protocol (OCP). The
network adapter converts this protocol into one specific to the NoC implementation.
The layered protocol approach comes at the cost of energy and latency overhead, but
achieves standardization that allows for efficient SoC development, and thus lower
design cost.
The scope of NoC design ranges from general-purpose CMPs to embedded, application-
specific SoCs. A NoC’s components are similar to that of a macro-scale network.
Network adapters provide the interface for an IP core, and routers and switches allow
sharing of the physical link resources between many transactions. The design space
of a NoC is very large and includes choices of topology (mesh, torus, star, irregular,
etc.), circuit switched or packet switched, addressing methods, routing algorithms,
and many other parameters such as link widths and frequency.
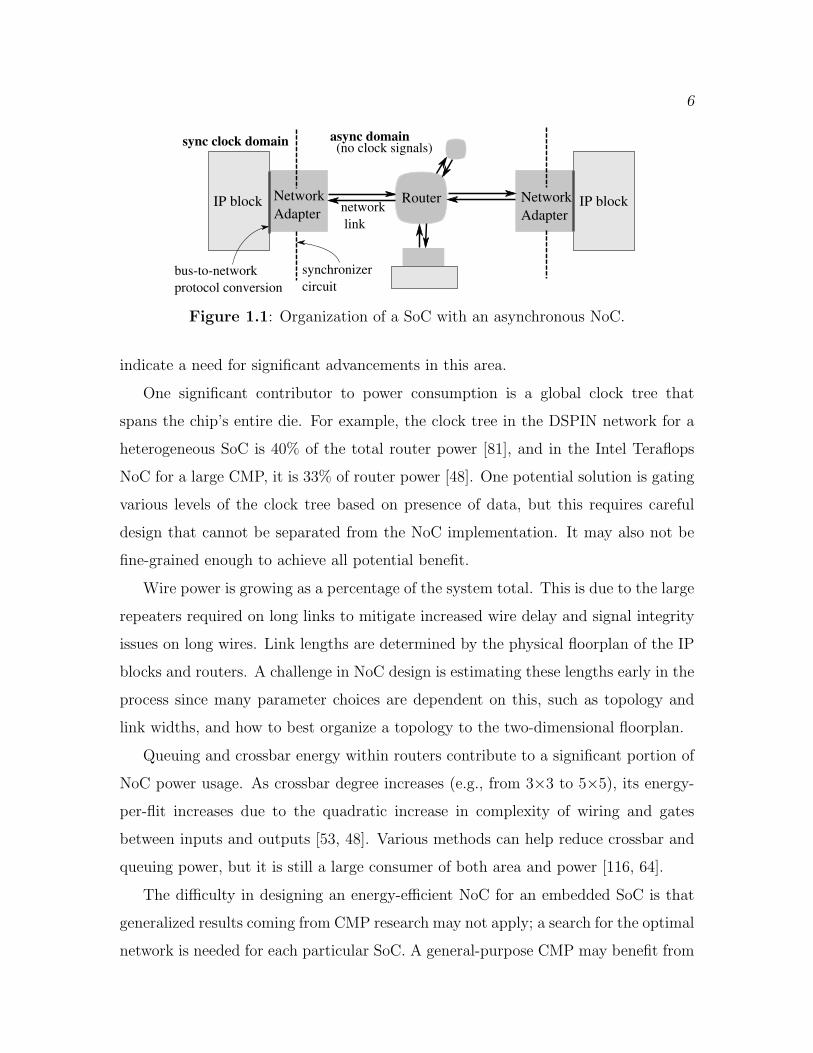
Figure 1.1 shows the functional components of an asynchronous (async) NoC, and
how it interfaces with IP blocks of a SoC. An IP block has an interface using a standard
protocol such as OCP, AMBA AHB, or a custom data streaming protocol. The
network adapter (NA) converts this protocol into the specific protocol and link-level
signaling used by the particular NoC design. It can also synchronize between two
timing domains; either two synchronous clock domains, or between the core’s clock
and an async network domain. This strategy also enables each core to operate at
its own frequency, referred to as globally-asynchronous locally-synchronous (GALS)
design. An example network adapter implementation of this concept is presented
in [15].
1.3 The Problem of NoC Energy
It is increasingly difficult to design an energy-efficient on-chip interconnect. The
physical implications of process scaling and demands on embedded computation
6
IP block
sync clock domain async domain
Network
Adapter
bus-to-network
protocol conversion
synchronizer
circuit
network
link
Router
(no clock signals)
Network
AdapterIP block
Figure 1.1: Organization of a SoC with an asynchronous NoC.
indicate a need for significant advancements in this area.
One significant contributor to power consumption is a global clock tree that
spans the chip’s entire die. For example, the clock tree in the DSPIN network for a
heterogeneous SoC is 40% of the total router power [81], and in the Intel Teraflops
NoC for a large CMP, it is 33% of router power [48]. One potential solution is gating
various levels of the clock tree based on presence of data, but this requires careful
design that cannot be separated from the NoC implementation. It may also not be
fine-grained enough to achieve all potential benefit.
Wire power is growing as a percentage of the system total. This is due to the large
repeaters required on long links to mitigate increased wire delay and signal integrity
issues on long wires. Link lengths are determined by the physical floorplan of the IP
blocks and routers. A challenge in NoC design is estimating these lengths early in the
process since many parameter choices are dependent on this, such as topology and
link widths, and how to best organize a topology to the two-dimensional floorplan.
Queuing and crossbar energy within routers contribute to a significant portion of
NoC power usage. As crossbar degree increases (e.g., from 3×3 to 5×5), its energy-
per-flit increases due to the quadratic increase in complexity of wiring and gates
between inputs and outputs [53, 48]. Various methods can help reduce crossbar and
queuing power, but it is still a large consumer of both area and power [116, 64].
The difficulty in designing an energy-efficient NoC for an embedded SoC is that
generalized results coming from CMP research may not apply; a search for the optimal
network is needed for each particular SoC. A general-purpose CMP may benefit from
7
a new router queuing mechanism and a Clos topology [56], but many SoCs with known
traffic patterns will benefit from customization of the NoC’s topology, floorplan, link
widths, buffer sizes, and other such parameters [122, 74]. The optimal network can
be quite different from one SoC to another, and tools can aid in the search.
1.4 The Solution of Customized,Asynchronous Simplicity
This dissertation is based on the premise that an asynchronous NoC has qualities
ideally suited to heterogeneous power-constrained SoCs. Additionally, a simplified
asynchronous network will have lower energy and achieve competitive performance
compared to a traditional general-purpose NoC. This network decreases energy usage
by addressing the key areas in Section 1.3.
1.4.1 Asynchronous Nature
An asynchronous network does not require a global clock tree and has automatic
clock gating at every latch, thus it has a significant potential for power reduction over
many synchronous methods. The async protocols and data encodings are chosen to be
energy-efficient. Links use two-phase bundled-data which has twice the throughput of
a four-phase protocol over long wires, and better wire utilization than delay-insensitive
data encoding [102]. Internal to a router, four-phase and bundled-data are used to
give smaller and more efficient circuits.
1.4.2 Network Architecture
The network is composed of routers that have three bi-directional ports. Each port
is input and output buffered with a 1-flit latch, saving area over flip-flop based designs.
Buffering space is low within a router to reduce area, and pipelining links can be a
more efficient use of buffer logic [60]. The small radix crossbar implementation using
2-to-1 multiplexers (MUXs) reduces area and energy of the switch. The intuition
behind low-radix routers when used in small process technology is that repeater logic
needs to be placed along wires at periodic intervals regardless of the router design,
so there could be benefit to performing a routing and buffering function in that logic
8
area as well.
A routing path for a packet is formed at a source NA, where each bit in a series
of bits determines the direction to route a packet at each hop through the network.
This method is referred to as source routing and improves latency through a router
by eliminating address decoding logic. A packet is a single flit consisting of the
source-route bits and data bits in parallel on a link. Short packets reduce worst-case
delay with wormhole switching because long “worms” of flits belonging to one packet
do not block multiple routers. The downside of this method is more routing operations
and potential protocol overhead. Partitioning route bits onto their own wires takes
more area than using a header flit. However, it presents an opportunity for reducing
dynamic wire power. Packets in a series often belong to the same source-to-destination
path and thus have identical routing bits. In this case, the route wires do not change
state between each packet as they would in a design in which route information and
data share the link wires.
Routers are connected together in a tree topology. This decision is driven by
the fact that a tree requires the least number of routers (N − 2), and a balanced
tree requires 2 log2N − 2 routing bits, where N is the number of cores. This is
favorable compared to a ring topology that requires N routers and ⌊N/2⌋+1 routing
bits assuming the same packet format. The downside to this topology is minimal
bisection bandwidth, so it causes long latency for global or uniformly distributed
traffic. However, high traffic locality among cores lends itself to this topology, and we
show capacity is adequate for a number of designs based on real SoC traffic patterns.
1.4.3 Topology Optimization
Even though the topology is limited to a tree, there are many options for how
cores should be mapped to it, and how balanced the tree should be. These choices
are determined by the expected traffic patterns within the SoC. The general idea is to
put frequently communicating cores within as few hops as possible. This reduces the
chance of contention with other core-to-core paths, and reduces total router power.
The search for the best topology is done with a simulated annealing algorithm. The

9
process is complicated by the fact that wire power can be significant, and thus link
lengths need to be known and factored into the topology search. A contribution of
this approach is the integration of a unique router floorplanning method into the
topology search.
1.4.4 Router Floorplan Optimization
Wire power is a large contributor to total network power, and thus this work
optimizes wirelength by specifying router placements on the floorplan. This is done
using a novel force-directed movement approach to locate routers such that links
carrying high traffic volume are shortened, reducing power and latency.
1.4.5 Link Pipelining
Pipelining synchronous links is often done solely to meet clock frequency require-
ments. However, async links can be pipelined independently, only where needed, to
improve throughput and add network buffering easily due to flow control inherent to
async design.. This work formalizes and evaluates methods to determine which links
to pipeline, and to what depth. Link pipelining can be effective at improving network
throughput in a simple and energy-efficient manner, especially in small processes.
1.4.6 Early-Design Modeling
An important aspect of this work is evaluation of the energy and performance
early in the SoC design stages, allowing changes to be made and quickly re-evaluated.
For this purpose, novel SystemC models were developed of the asynchronous routers
and wires that are used in a simulator automatically generated for each particular
NoC instance. This work also showed the effect of traffic burstiness on latency and
incorporated a self-similar, bursty traffic generator into the simulator.
1.5 Dissertation Outline
Chapter 2 describes the related body of research that is the foundation of this
work. Details of NoC design options and a background in async NoCs is presented in
Chapter 3. The circuit design and architecture of the routers and link buffers, and
their characteristics is given in Chapter 4. The optimization and evaluation framework

10
is titled ANetGen, and described in detail in Chapter 5. The methodology and results
of a system-level evaluation is given in Chapter 6. Finally, a conclusion in Chapter 7
summarizes this dissertation and provides insight and direction for future research.
CHAPTER 2
RELATED WORK
The past decade has seen the rise of the NoC concept and a slew of research
targeting many design aspects. The work in this dissertation is related to several
areas of research, namely those of optimizing a network for a particular SoC design,
asynchronous router and channel design, and traffic modeling and simulation. In this
chapter, we describe the body of related work.
2.1 Interconnect Optimization
Many others have focused on generating or optimizing on-chip interconnects.
Regardless of the specific interconnect details, the problems are similar, in that search-
ing the solution space is complex and usually requires heuristics or approximation
methods.
Bus-based interconnects have been optimized based on latency requirements and
physical design early in the design stage [32, 31]. This methodology includes commu-
nication profiling for an application, bus partitioning, and floorplanning definitions.
It attempts to find the bus solution with the highest communication throughput by
exploring possible floorplans and bus partitions using simulated annealing.
Crossbars are used in bus-based SoC interconnects to increase communication
parallelism. A large crossbar allows more cores to communicate simultaneously, but
will take more power and chip area. Cores also need to be properly mapped to
the various bus partitions to reduce contention and power. A linear programming
solution, and a unique “window” based simulation of actual traffic and floorplan is
presented in [73].
A methodology to optimize the mapping of cores of a SoC onto a predefined
communication topology is presented in [61]. Using abstractions of core-to-core
12
communication requirements, its algorithms heuristically find a high performance
solution. The methodology is geared towards memoryless bus-based communication
methods, and only consider performance, not power, in the optimization.
The OIDIPUS tool maps cores of an SoC in a pre-defined topology, such as a
partitioned ring, using simulated annealing [2]. It estimates the physical wire length
from core dimensions, and verifies that the traffic requirements are met. The intention
is to use this for asynchronous routers, thus wire length is used to estimate delay
between cores. It does not consider power and size of the routers themselves, nor
explore other topologies beyond what is given.
PIRATE is a design framework for NoCs that estimates power and packet latency
of various topologies and router configurations [79]. It generates power models for
a set of router parameterizations and uses these to explore a range of topology op-
tions through cycle-accurate simulation. A benchmark SoC performing cryptographic
functions indicated that the ring and ad-hoc topologies offered the lowest power and
nearly the best packet latency. This study did not consider chip floorplans nor the
energy of wires and repeaters.
NetChip is a synthesis flow for NoCs that performs regular topology selection from
among a library of possibilities, determines the mapping of cores onto that topology,
and instantiates the network using SystemC and register transfer level (RTL) mod-
els [12]. The topology generation has been later refined to consider physical concerns
of the floorplan, link length, and wire energy [74]. It is part of a larger workflow to
automatically synthesize a NoC [5]. Core communication requirements, a floorplan,
and router energy and performance models are used to drive a heuristic search for the
most suitable topology and router parameters. The algorithms avoid routing paths
which can deadlock. An additional tool, xpipesCompiler then generates SystemC
and synthesizable RTL descriptions [51]. Experiments on SoC benchmarks show the
optimized network significantly reduces power and hop-count versus the best mesh
topologies. The mesh topology is 2.78x and 1.59x greater than the custom topology
for the respective metrics.
The concept of an application specific NoC was first described in [122]. It is a
13
workflow to construct a hierarchical, irregular topology optimized to reduce power
and improve performance. Behavioral and/or statistical models of communication
between cores can be used during the topology optimization. K-way partitioning,
using average communication requirements between cores, clusters cores together that
frequently communicate, forming the topology. They then generate a floorplan of the
SoC. Power and area models of the routers and links, along with the communication
models, drives a simulation-based analysis that checks if the performance and power
constraints are met. For two SoC designs, they claim a large improvement in power,
area, and performance over an unoptimized mesh-based network. This work does not
incorporate power and physical estimates early in the optimization heuristic.
The COSI framework generates an application-specific NoC and floorplan, taking
as input such constraints as core areas and average bandwidth between cores [82].
While it is extensible with new algorithms and components, it does not consider
asynchronous network components and, as future work, cites the need for integrating
traffic burstiness.
A linear programming based method for finding an optimal floorplan and irregular
topology is presented in [100]. The same authors also used a lower complexity
heuristic to obtain results for larger designs, which were intractable under their
previous method [99]. However, neither of these consider the generation of deadlock-
free routing tables. A method for producing a deadlock-free routing model in an
irregularly-connected, but grid-based network is presented in [76]. It is unclear if it
is a general enough solution for nongrid based, irregular networks, as done in [74].
The KAIST laboratory developed a low-power NoC for heterogeneous SoCs [64].
This design uses a hierarchical star topology, as their study showed better energy
efficiency over various forms of meshes, buses, and flat star topologies. They also
use a number of low-power technologies: low-swing signaling, a MUX-tree based
round-robin scheduler, partial activation of the crossbar, and low-energy serial coding
on links was possible due to high data correlation in multimedia applications.
Æthereal offers guaranteed service through its time-division multiple-access
(TDMA) connections, and has a supporting framework targeting application-specific
14
SoC design [41]. The major contribution is verifying that system constraints are
met using an analytical method instead of simulation. This is possible due to the
guaranteed service approach, and benefits the SoC designer by being able iterate
quickly between possible NoC designs.
Intel developed the Scalable Communications Core for wireless protocol baseband
processing. It relies on a NoC for communicating between heterogeneous cores [4].
The NoC is designed to be scalable and low-power, and is optimized based on the
streaming data flow between various cores. Compared to crossbar solutions, it offered
lower latency and power, and easily meets the minimum bandwidth requirements [46].
Application-specific optimization is discussed for the QNoC routers in [43]. It
focuses on mapping logical resources of a mesh-style topology, and does not address
physical concerns of the chip.
The topology synthesis problem has also been approached by decomposing a given
communication pattern into subpattern primitives that can be solved optimally [77].
Each primitive is characterized with an energy cost. The algorithms search the
original pattern for the combination of primitives with the lowest cost.
Certain embedded devices do multiple things, but only one at a time. Thus, the
idea of a reconfigurable NoC has arisen. A regularly-structured topology is modified
by adding a layer of physical circuit-switch “wrappers” around each packet-switched
router in [101]. This layer can be reconfigured to move packets past routers which
are known to always switch in a particular direction. A significant power savings was
demonstrated. Reconfiguration of a network has significant tradeoffs which need to
be considered. Algorithms and architectural changes are presented in [45], as well
as an analysis of run-time reconfiguration overhead. It shows that the tear-down
process in changing the “use case” can be unpredictable, and must be considered
by the application-layer scheduling policies. A reconfigurable source-synchronous
NoC and fabricated 801.11a receiver chip was presented in [114]. Bandwidths and
circuit-switched paths spanning multiple routers can be customized at runtime for a
particular application, and their design was optimized for low power.
15
2.2 Asynchronous NoCs
Jens Sparsø, in a 2004 invited talk, predicted the future of networks-on-chip to
most likely be asynchronous [96]. Previous research on asynchronous interconnects is
rich, but these designs are either hand-designed for a particular application, or have a
general design, but possibly have over-provisioned resources for a power-constrained
SoC. All but one of these existing routers use quasi delay-insensitive encodings be-
tween routers, rather than bundled-data.
Fulcrum Microsystems created a large asynchronous crossbar to interconnect cores
of a SoC [66]. The commercial startup Silistix, based on earlier academic research [6],
sells EDA software and circuits that provide an customized asynchronous NoC, but
has no published methods for the optimization process.
The MANGO router and interfaces [16, 15] provide both best-effort and guaranteed-
service traffic, but did not focus on low area or low power design.
FAUST [62] is a platform-based SoC and fabricated chip used in 4G telephony
development, and uses an asynchronous mesh-based NoC [8]. The MAGALI chip
extends FAUST and offers an open platform for development of the multiple modes
of the LTE standards [23, 24, 22]. It uses an asynchronous NoC to support mode
reconfiguration as well as the datapath between heterogeneous blocks. Similar func-
tionality was implemented with homogeneous cores, and compared to MAGALI [52].
Although in the general case heterogeneous systems are more efficient, this particular
study showed that if functionality of multiple cores can be combined into a single
homogeneous core design, overall power can be reduced due to the reduction in
network adapters and interface logic.
The QNoC group has developed an asynchronous router that provides multiple
service levels and dynamically allocated virtual channels per level [30].
Low latency and energy-per-packet is achieved by using simple async routing
connected in a mesh-of-trees topology for a CMP [47]. It is similar this work,
primarily in its use of individually controlled buffering latches and bundled-data async
design. Results showed that compared to a similar synchronous network the async
routing component had 82% less energy-per-packet and 63% less area. The arbitration
16
component had 91% and 84% less, respectively. Control of individually latches for
buffering is also done for clocked designs, including latch-to-latch flow control, with
the elastic buffer concept [71].
The insertion of link pipeline buffers in an async NoC was explored in [126]. It
compared the async network to a similarly-designed synchronous “elastic” network,
and showed the async network consumed 29% less power than the synchronous version
for the same latency. The addition of async pipeline buffers provided 35% less
aggregate packet latency for a 6.1% power increase.
A comparison between the asynchronous network ANOC, and the mesochronous
clocked network DSPIN, was performed in [81]. For both designs, a physical layout
and functional traffic simulation was done for analysis. While DSPIN had 33% less
area and 33% higher bandwidth than ANOC, ANOC had shorter packet latency
and at least 37% lower power consumption. DSPIN was also compared against its
asynchronous analog, ASPIN [92]. Average power, latency, and saturation threshold
are superior in ASPIN with similar die area. The main benefit of DSPIN is it allows
standard EDA tools to be used for design synthesis and place-and-route. ANOC and
many asynchronous designs require specialized tools and libraries.
Prior to NoC development, interchip networks connected many computing ele-
ments on the same board. The Post Office chip is an asynchronous co-processor,
with routing functionality. They are composed into a hexagonal mesh topology and
implement packetized data transfer between parallel processors [25].
2.3 Link Pipelining
There have been a number of NoC proposals for incorporating storage and/or
control logic within interrouter links. The work of iDEAL [60] showed that the
performance penalty of low-complexity routers with few input/output buffers can
be improved by putting storage elements on the links. For a traditional synchronous
NoC and mesh topology, moving storage to the links significantly reduced network
power at a very slight performance reduction. Link pipelining is described for the
Xpipes network components [5]. These are placed primarily to meet clock timing
17
requirements. Error detecting link pipeline circuits were designed to achieve greater
NoC robustness while maintaining high throughput [107]. Elastic buffers, similar to
the asynchronous buffers used in this work, were used to reduce router complexity by
using the link as a distributed FIFO buffer [71]. Throughput per energy was improved
by 8% compared to the baseline architecture. Elastic and asynchronous link pipelining
was explored in [126], but with an ad hoc approach in determining where and when a
buffer should be inserted on a link. It also did not evaluate effects on large-message
latency. A number of energy-efficient proposals, including pipelined links shared
between multiple sources, is given by [57]. It uses a standard mesh topology and
homogeneous SoC for evaluation and does not address the optimization problem of
determining the number of buffers on each link. Link pipelining for a delay-insensitive
asynchronous NoC is described in [17], where multiple virtual channels can overlap
packet transmissions at the flit level to maintain high link utilization. The paper did
not describe the conditions or depth of the pipeline, nor was a system-level evaluation
of the proposal given.
2.4 Modeling and Simulation
Traffic modeling for NoCs is one of the major outstanding problems in the field [68].
NoC design space exploration is best performed early in a SoC’s development, and
this requires a model of expected traffic. Traditional CMP or multiprocessor bench-
marks are often not applicable for evaluation of embedded, heterogeneous SoCs at
the stage of development when the NoC is defined. A proposed CMP design is
often evaluated across a variety of benchmarks, such as the SPLASH and PARSEC
suites [121, 98, 13, 14] to show it can run many application types well. These
are focused on improving and evaluating computation rather than communication.
Some benchmark suites are designed for a specific task in mind, such as media
processing [63] and embedded computing [109], but they require compilation for
specific processors and execution on full processor models. Trace-driven simulations of
these benchmarks is an alternative, but it lacks flexibility should the SoC change, and
needs a full implementation to produce the traces. A NoC benchmark framework must
18
be flexible enough to support a wide range of CPU architectures and communication
styles (message-passing, shared memory, or streaming). Its execution should be fast
enough to allow for multiple runs while changing various parameters, and include a
detailed measurement infrastructure to help locate problem areas within the NoC.
These are driving goals of a NoC benchmark specification under development by the
Open Core Protocol International Parternship Association, Inc. (OCP-IP) [87, 67].
The evaluation methods we use in this study is based on these standardization efforts.
The b-model [118] provides a simple method to produce and analyze the bursti-
ness of self-similar traffic with a single parameter. This is in contrast with other
bursty generators, which tend to be complex, or rely on the non-self-similar Poisson
distribution. Self-similarity is described in more depth in Section 5.2. The b-model
has been adapted to study burstiness effects in the Nostrum NoC [110].
Evidence of traffic self-similarity and burstiness in MPEG-2 video applications
has been shown [115, 18]. Several analytic models of network performance have
been developed for NoC design. A model has been developed to capture spatial and
temporal characteristics of traffic for regular, homogeneous NoCs [94].
The application-level communication requirements can be important to evaluate,
not just the point-to-point properties. Work by Qualcomm, Inc. has used these
application-level requirements to optimize a NoC [11]. In their work, timing in-
formation and simulation rely on the sequence of communication operations from
one IP block, to another, and to another, forming an application-level end-to-end
requirement. Optimization is done by simulated annealing of MxN mesh topologies,
and link bandwidth is tuned by changing flit widths. By considering end-to-end
constraints, router area is reduced by up to 40% and link area up to 49%. Additionally,
more than one virtual channel was seen to not be a area-effective solution.
A generalized analytic router model was developed in [78]. It provides detailed
statistics during expected traffic, and is applicable to heterogeneous, irregular net-
works, but relies on the Poisson arrival process and a synchronously-clocked router.
The Polaris tool [93] explores a large NoC solution space covering different traffic
patterns, design goals (e.g., energy or performance), forming a “roadmap” for pruning
19
the number of possible NoC configurations. It does not generate any RTL or actual
network instances. It is for a multiprocessor-based SoC or CMP that can run a variety
of software, and will be built using a regular-structured NoC. The estimation routines
use general abstractions of common router configurations [117] rather than specific
circuit designs. Accuracy is quite good for the type of system it targets, but it does
not consider heterogeneous topologies or asynchronous routers.
Wire models are needed to quickly estimate energy and latency of an interconnect.
One of the latest is an analytic model incorporating process technology parameters
and user-provided power or latency optimal repeater sizing and spacing [21]. Valida-
tion was done for a variety of parameterizations (process tech, single-vs-double width,
etc.) against industry simulation tools (SoC Encounter to NanoRoute to Primetime
SI), and showed much better accuracy compared to other methods [7, 80]. Its wire
models were derived from those used in the Orion 2.0 NoC router models [55].
In [40], the authors developed a simulator that uses transaction level modeling
(TLM) with RTL descriptions of network components. TLM increased the simula-
tion speed so that they could explore network configurations using more accurate
RTL descriptions. Additionally, they demonstrated that physical place and route
constraints can alter the theoretical results. For their 16-core SoC, a 4-hypercube
required only 25% more wiring than a 2D mesh, which is far less than expected. This
is due to the small system size, the asymmetric dimensions of computation tiles, and
the particular wire constraints such as no over-cell routing.

CHAPTER 3
NOC DESIGN CONSIDERATIONS
This chapter describes the design space of a NoC, and introduces concepts used
in the novel NoC and optimization framework presented in later chapters. Many
NoC parameters need to be carefully chosen in order to meet the SoC’s design
goal. Parameter choices are complicated by their interrelated system effects, and the
difficulty of evaluating their quality. For example, network topology is influenced by
the chip floorplan, which itself is influenced by router radix and buffering size choices.
In order to determine if a particular topology improves NoC power consumption,
knowledge of the floorplan, router energy, and physical wire properties are needed.
The sections below describe general properties, trade-offs, and strategies that give a
starting point to NoC design.
3.1 Background
A NoC will provide communication for a range of many-core chip designs due to
the scaling limitations of traditional bus and point-to-point interconnect designs [28].
These designs include general-purpose chip-multiprocessors (CMPs) as well as em-
bedded, application-specific system-on-chips (SoCs). A NoC’s components are sim-
ilar to that of a macro-scale network. Network adapters provide an interface from
a communicating node to the network. Routers, or switches, allow physical link
resources to be shared between multiple node-to-node paths The design space of a
NoC includes many parameters and architectural choices such as topology definition
(mesh, torus, star, irregular, etc.), circuit switched or packet switched techniques,
link widths, synchronous clock frequency, and others. A NoC helps SoC development
by abstracting away the communication details, and provides a rapid integration of
IP hardware components. The IP interface is typically an industry standard, such
21
as Open Core Protocol (OCP). The network adapter converts this protocol into one
specific to the NoC implementation.
End-to-end communication typically involves a set of abstraction layers, similar
to those in a macro network. Many options exist for the partitioning of layers, but a
typical NoC may have layers specified as the physical, link, network, and transaction.
The physical layer is typically a set of global wires between two routers. The link layer
defines the method to transfer flow-control units, or flits, between routers, and can
add reliability to the physical layer if needed through features such as error-correcting
codes. The network layer determines which links a packet uses to get from a source
network adapter to the destination. It further defines how to divide a packet into
flits. This is composed of routing and switching operations, where routing determines
what path of links and routers a packet should take, while switching is the method of
moving a packet from a router input to output port. The transaction layer interfaces
with a core using the core’s communication primitives. It converts the primitives into
packets, and reassembles them at the destination. An example layer partitioning is
shown in Figure 3.1.
3.1.1 Differences to Macro-scale Networks
Networks have been studied in depth for decades, such as those connecting proces-
sors of a supercomputer, the common Ethernet that connects PCs, and the Internet.
Transaction:- memory access
- streaming connections
- bus protocols
Network:
- NoC packets
- routing
Physical:
- flits and phits
- link flow control
- wires
router receives packet,
determines output port,
and divides it into flits
network adapter converts
transaction request into a
series of packets
flits are sent, received,
and buffered in routers
and along links
large small
Data
Granularity
Figure 3.1: Communication layers, structures, and function.
22
Much of the theory of these studies applies to NoCs, but there are key differences
that differentiate this field of research from others [53]. On-chip link widths can be
wider than with off-chip networks, but wires are constrained to be routed in only
two dimensions and on a limited number of metal layers. Wires need repeater logic
to traverse long distances which makes it difficult or impossible to route wires over
certain IP blocks, further limiting available wire area. Designs should make links as
short as possible to minimize energy usage that is used by these repeaters. It follows
that on-chip bandwidth is not cheap in terms of area and energy.
Power consumption is a concern for both networks types, but it is more constrained
for NoCs that share a chip-limited power budget with processing cores. The NoC for a
many-core chip consumes 35% of total chip power in one example [58], and in another,
28% of a core’s power is taken by it’s NoC components [48]. This can drive the NoC
design choices in a different direction than macro-scale networks. For example, the
topologically superior high-dimension networks are common for supercomputers, but
require crossbars and links that consume significant area and power, and not often
chosen for NoCs.
The application traffic in a SoC is generally more specific than that of an off-chip
network. This allows the NoC to be customized based on this information at design
time, and opens up unique optimization potential. For example, if two cores do not
need to communicate, the topology and switches an be simplified by removing that
route. Most off-chip networks are designed such that all nodes can communicate
to each other because it often must support a wide variety of software applications
unknown at design time.
In general, individual NoC components such as routers are simpler than their
macro-scale network counterparts regarding their set of features (e.g., adaptive rout-
ing), and silicon area. However, this simplicity does not necessarily make design
easier; it increases the importance of determining a NoC configuration that has the
desired qualities unique to each particular SoC.
23
3.1.2 Globally-Asynchronous Locally-Synchronous SoCs
As process scaling continues, more complex designs that use many more transistors
can fit on a SoC. The design difficulty of SoCs is increasing with multiple clock
domains and a large variety of IP. For CMPs, chips are becoming so large with
respect to transistor count that a fully centralized and synchronized clock is more
and more difficult to implement and make low power. Additionally, heterogeneous
cores may become more common in a CMP. An answer to this problem is a concept
called globally asynchronous locally synchronous (GALS) communication. A GALS
architecture separates the clock domains of each core from other cores, and from the
network timing domain. Figure 1.1 shows this separation for synchronous IP blocks
and an asynchronous network domain, but the network could also operate with one or
more clocks. In each case, a synchronizer circuit is required at the interface between
timing domain crossings [9].
3.1.3 Application-specific SoCs
Embedded, energy-constrained SoC designs can be roughly separated into two
classes: platform-based and application-specific (also called fixed-function). The
former is concerned with performing a wide variety of tasks, many of which cannot be
foreseen at design time. The latter is targeted towards a particular function, or a few
functions, that have known properties. An application-specific design might consist
of a number of highly specialized cores and memories, and fewer general-purpose
processors. The network-on-chip (NoC) for both these classes should be optimized
for minimal energy usage while meeting the predicted performance requirements;
however, the application-specific NoC may be more specialized as it has a priori
knowledge of the communication patterns between cores. This is in contrast to
general-purpose interconnects that are often evaluated with traffic patterns such as
spatially-uniform, bit-transpose, hot spot, and others. The domain of this work is for
application-specific SoCs, rather than platform-based SoCs.
24
3.1.4 Design Space
The design of a NoC requires consideration of many parameters, similar to macro
networks. Some of these are described here.
3.1.4.1 Switching and Flow-Control Granularity
The granularity of resource sharing, or switching, is partitioned into circuit-
switching and packet-switching methods. Circuit-switched networks implement flow
control at the granularity of a message, and reserve network resources dedicated to an
end-to-end route. Packet-switched networks divide a message into packets, where each
one is routed separately from source to destination with flow-control between routers.
Each type has its advantages and disadvantages; circuit switching can often be done
with fewer buffers and offers low guaranteed latency once a circuit is established, while
packet switching offers higher link utilization, bandwidth, and concurrency. Most
published NoCs use packet switching, with some providing guaranteed service and
traffic priority [16]. Circuit switching has been investigated for coherence mechanisms,
service guarantees, and long connection-oriented traffic [54, 120]. Virtual circuits are
often established through packet switching networks using various methods, including
time-division multiple-access mode (TDMA) [86, 42].
3.1.4.2 Data Division
Data is divided into successively smaller pieces in its traversal through the network.
Amessage, or transaction, refers to the largest granularity of communication for which
the network has information. For example, it may be a memory write operation for
a large many-word block, or a shorter interrupt signal. Messages are converted into
packets by the sending network adapter to be transported through the routers to
the receiving adapter. This exchange of messages is done at the transaction layer,
including breaking down these messages into a series of packets.
Packet size can have a large impact on network performance and power, with
small packets being advantageous in certain networks and for certain traffic, and large
packets in others. Common sizes range from 16 bytes to 256 bytes. A study of the
packetization process and packet size comparison for a many-core, general-purpose
25
CMP is shown in [124]. Packet size can also be either fixed or variable in length.
Generally, fixed packets allow for simpler hardware, while variable length packets
give a higher network saturation bandwidth. These methods have been compared in
macro-scale fast packet switching network [91].
Flits, or flow control units, are a subdivision of a packet that are transferred over
a link. These flits have link-level flow control that allows the transfer to be paused
to prevent buffer overflow and lost flits. The size of a flit is generally fixed, and often
the same as the link’s width. In this case, one flit is transferred per clock or a link’s
cycle time. Sometimes a flit is further serialized into physical units, or phits. This
can be useful if the link is narrower than a flit. However, flow control does not apply
at this granularity, thus the receiver must have appropriate buffering available.
3.1.4.3 Routing and Switching Techniques
The path that a packet takes through the network is defined by the routing
method. The path can be determined at either the source (source-routed) or by each
router along the path (distributed routing or address-routed) based on the destination.
Source-based routing can allow for a simpler router implementation, as it does not
require address decoding or routing tables at each router. However, source-routing
does not scale as well for networks with many communicating pairs, as the route
table needed in the sending node may be excessively large. Another choice is static or
dynamic routing. Static routes are fixed and cannot change, while dynamic routing
allows packets for the same destination to take different paths. Dynamic routing
introduces more complexity such as out-of-order packet reception, but provides better
latency when the network operates near saturation.
Common switching techniques include store-and-forward (SF), virtual cut-through
(VCT), and wormhole. In SF, a receiving router stores all flits of an incoming packet
before switching that packet to an output port. It must have sufficient buffer space
at its input port for an entire packet. Once all flits are received, it makes a routing
decision, switches the packet, and puts it on the output port. VCT has the same
buffering requirement as SF, but a receiving router immediately routes, switches, and
26
sends the flits of a packet before all are received. Wormhole reduces the buffering
requirement of an input port to, at minimum one flit, by stalling remaining flits at
the previous router. Wormhole is the most common technique for NoCs because it
allows faster and smaller routers due to fewer buffers. However, it is also the most
susceptible to long periods of contention because the “worm” of flits blocks other
packets in multiple routers along its path. One solution around this is to use virtual
channels [27]. These are divisions of the FIFO buffer connecting a physical channel
such that a division is associated with a particular type of traffic. This allows a
packet to switch through a router when it is destined for a different output of the
next router, or to support priority levels.
3.1.4.4 Topology
The topology selection of a NoC affects its bandwidth, latency, energy-consumption,
and physical layout. The topology is often constrained by available area for routers
and links, power budget, floorplan (if defined prior to the topology), and selection of
available router configurations, such as only radix-4 and radix-5 routers. A commonly
used property of a topology is bisection bandwidth which is the aggregate bandwidth
of links that divide the network into two equal halves. It is a measure of global
connectivity. Topologies with high bisection bandwidth, namely those with high-
dimensionality, are desirable to achieve high throughput. However, physical design
concerns of wiring, router delay, area, and power often prevent their use. The most
common topologies used in NoCs are a mesh (k-ary 2-cube), torus, ring, Clos, and
hierarchical star. The best topology is dependent on the details of the particular SoC
it is designed for. The silicon process technology, die size, traffic, and other concerns
all influence the choice. An example of this is an SoC with multiple voltage and
frequency islands, where that system detail affects topology choice [88].
3.2 Network Customization
Communication requirements between cores of a SoC dictate, in part, the optimal
choice of network parameters. The traffic of a general-purpose CMP may not be
known in detail at design time, as they run a wide variety of software applications
27
such as web-servers, photo-realistic 3D graphics rendering, and scientific computing
applications. For these systems, a general-purpose and regularly structured NoC
will probably be the best choice. However, traffic properties of many SoCs can be
known at design time, and can be used to optimize the network. In many embedded
applications, maximizing peak performance (i.e., bandwidth or latency) is not the
optimization goal. Power, energy×delay, or monetary cost are more important as
long as the system can meet a minimum performance bound. This optimization
process is driven by one or more of these goals, as selected by the SoC engineer, and
the expected traffic patterns.
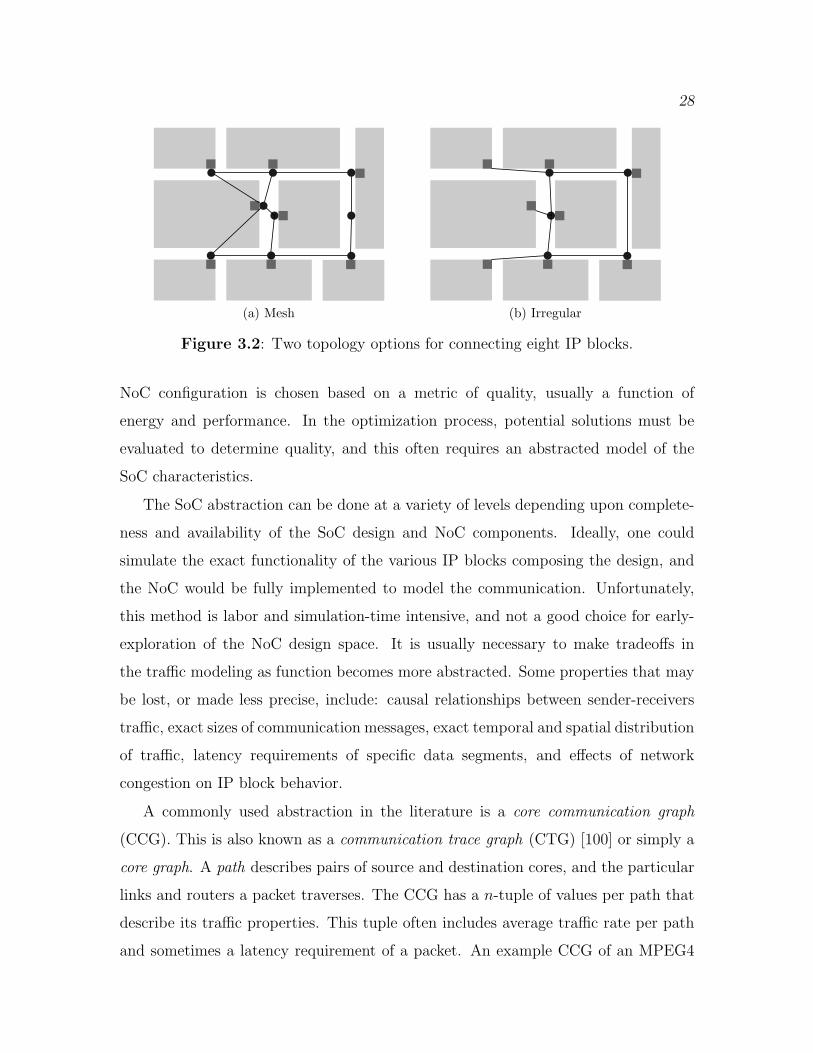
One major focus of customization is on the topology. For application-specific
SoCs, a custom-generated topology is of utmost importance, and yields better latency
and power metrics than a regular-pattern network [74]. A representative example
illustrating the difference between a regular mesh network and an irregular network
is shown in Figures 3.2a and 3.2b, respectively. Lightly shaded boxes represent
the IP blocks in an SoC’s floorplan. The circles show router locations, and the
small squares show network adapter locations within the cores. The dark lines show
link connectivity (the network’s topology), and a connection is implied between an
adjacent router and network adapter. The regular mesh has more total wirelength,
and even an unneeded router on the rightmost link. This illustrates the potential
inefficiency of regular, homogeneous topologies when used in a heterogeneous SoC.
Other network parameters that may be considered by the optimization process in-
clude buffer sizes, link lengths, link widths, routing methods, and switching methods.
Some of these will be constrained by the available network components, while others
may be specified. The choices of buffers and links is important, as they can consume
a large percentage of the total NoC power [99]. Physical placement on the floorplan
is also often considered at this stage of NoC design because wirelength is a primary
point of optimization to reduce power and meet timing requirements [74, 82, 89].
Design automation techniques and software tools are commonly used to generate
a NoC for a specific SoC design. These methods can decrease time of development in
commercial products or allow a researcher to explore a larger design space. The
28
(a) Mesh (b) Irregular
Figure 3.2: Two topology options for connecting eight IP blocks.
NoC configuration is chosen based on a metric of quality, usually a function of
energy and performance. In the optimization process, potential solutions must be
evaluated to determine quality, and this often requires an abstracted model of the
SoC characteristics.
The SoC abstraction can be done at a variety of levels depending upon complete-
ness and availability of the SoC design and NoC components. Ideally, one could
simulate the exact functionality of the various IP blocks composing the design, and
the NoC would be fully implemented to model the communication. Unfortunately,
this method is labor and simulation-time intensive, and not a good choice for early-
exploration of the NoC design space. It is usually necessary to make tradeoffs in
the traffic modeling as function becomes more abstracted. Some properties that may
be lost, or made less precise, include: causal relationships between sender-receivers
traffic, exact sizes of communication messages, exact temporal and spatial distribution
of traffic, latency requirements of specific data segments, and effects of network
congestion on IP block behavior.
A commonly used abstraction in the literature is a core communication graph
(CCG). This is also known as a communication trace graph (CTG) [100] or simply a
core graph. A path describes pairs of source and destination cores, and the particular
links and routers a packet traverses. The CCG has a n-tuple of values per path that
describe its traffic properties. This tuple often includes average traffic rate per path
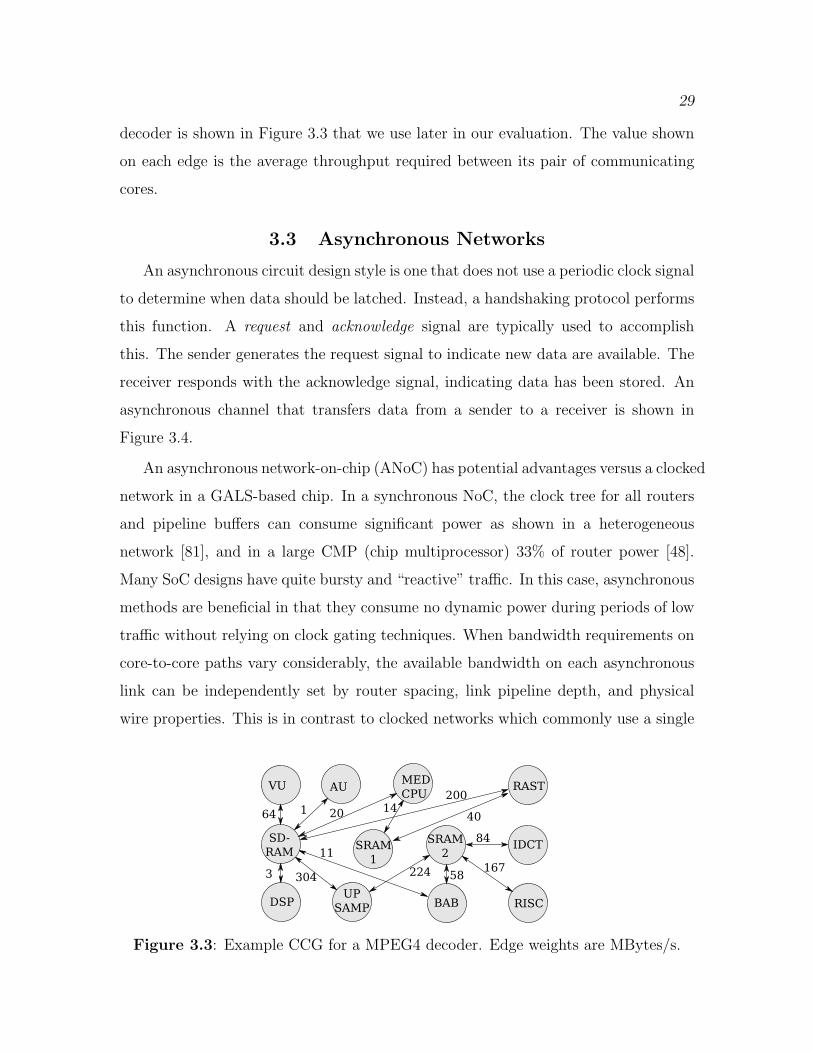
and sometimes a latency requirement of a packet. An example CCG of an MPEG4
29
decoder is shown in Figure 3.3 that we use later in our evaluation. The value shown
on each edge is the average throughput required between its pair of communicating
cores.
3.3 Asynchronous Networks
An asynchronous circuit design style is one that does not use a periodic clock signal
to determine when data should be latched. Instead, a handshaking protocol performs
this function. A request and acknowledge signal are typically used to accomplish
this. The sender generates the request signal to indicate new data are available. The
receiver responds with the acknowledge signal, indicating data has been stored. An
asynchronous channel that transfers data from a sender to a receiver is shown in
Figure 3.4.
An asynchronous network-on-chip (ANoC) has potential advantages versus a clocked
network in a GALS-based chip. In a synchronous NoC, the clock tree for all routers
and pipeline buffers can consume significant power as shown in a heterogeneous
network [81], and in a large CMP (chip multiprocessor) 33% of router power [48].
Many SoC designs have quite bursty and “reactive” traffic. In this case, asynchronous
methods are beneficial in that they consume no dynamic power during periods of low
traffic without relying on clock gating techniques. When bandwidth requirements on
core-to-core paths vary considerably, the available bandwidth on each asynchronous
link can be independently set by router spacing, link pipeline depth, and physical
wire properties. This is in contrast to clocked networks which commonly use a single
�� �����
����AB
��
A���
C��BA�D
��A��
E
�A� F�F CA�
A��
�
�� E ��
���E�
��
��
E�������
EE
����
Figure 3.3: Example CCG for a MPEG4 decoder. Edge weights are MBytes/s.
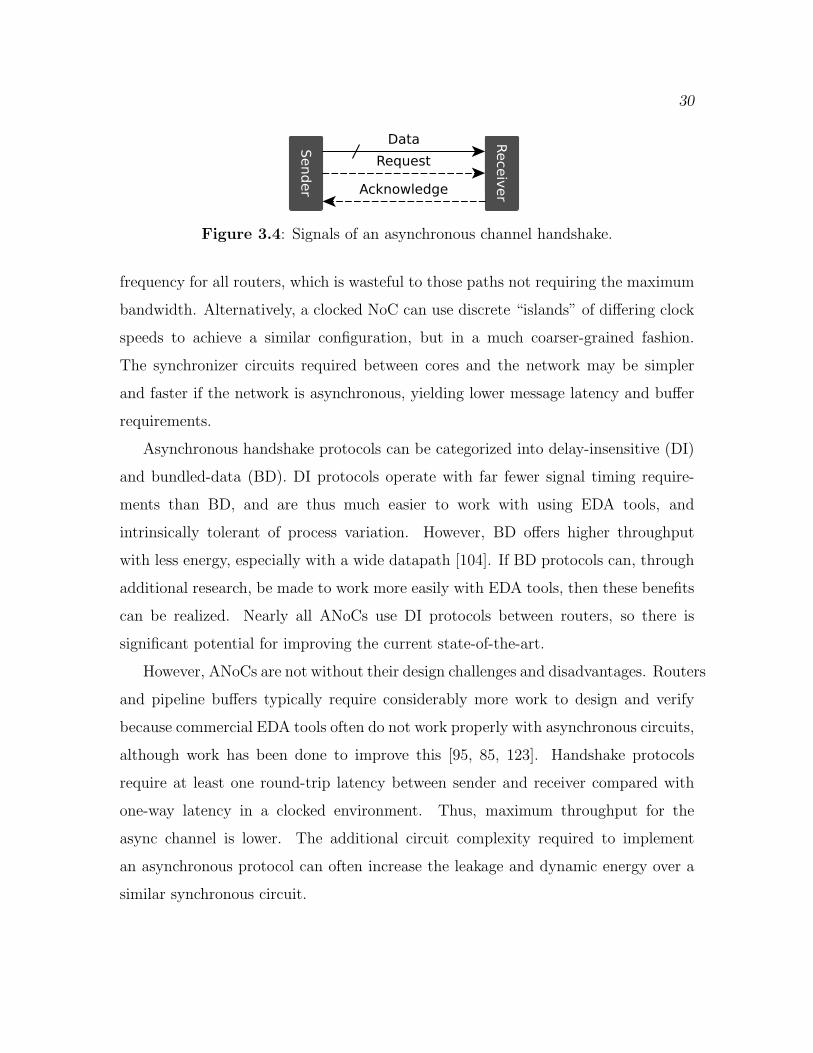
30
������
�������
ABCB
��DE�FC
�����������
Figure 3.4: Signals of an asynchronous channel handshake.
frequency for all routers, which is wasteful to those paths not requiring the maximum
bandwidth. Alternatively, a clocked NoC can use discrete “islands” of differing clock
speeds to achieve a similar configuration, but in a much coarser-grained fashion.
The synchronizer circuits required between cores and the network may be simpler
and faster if the network is asynchronous, yielding lower message latency and buffer
requirements.
Asynchronous handshake protocols can be categorized into delay-insensitive (DI)
and bundled-data (BD). DI protocols operate with far fewer signal timing require-
ments than BD, and are thus much easier to work with using EDA tools, and
intrinsically tolerant of process variation. However, BD offers higher throughput
with less energy, especially with a wide datapath [104]. If BD protocols can, through
additional research, be made to work more easily with EDA tools, then these benefits
can be realized. Nearly all ANoCs use DI protocols between routers, so there is
significant potential for improving the current state-of-the-art.
However, ANoCs are not without their design challenges and disadvantages. Routers
and pipeline buffers typically require considerably more work to design and verify
because commercial EDA tools often do not work properly with asynchronous circuits,
although work has been done to improve this [95, 85, 123]. Handshake protocols
require at least one round-trip latency between sender and receiver compared with
one-way latency in a clocked environment. Thus, maximum throughput for the
async channel is lower. The additional circuit complexity required to implement
an asynchronous protocol can often increase the leakage and dynamic energy over a
similar synchronous circuit.
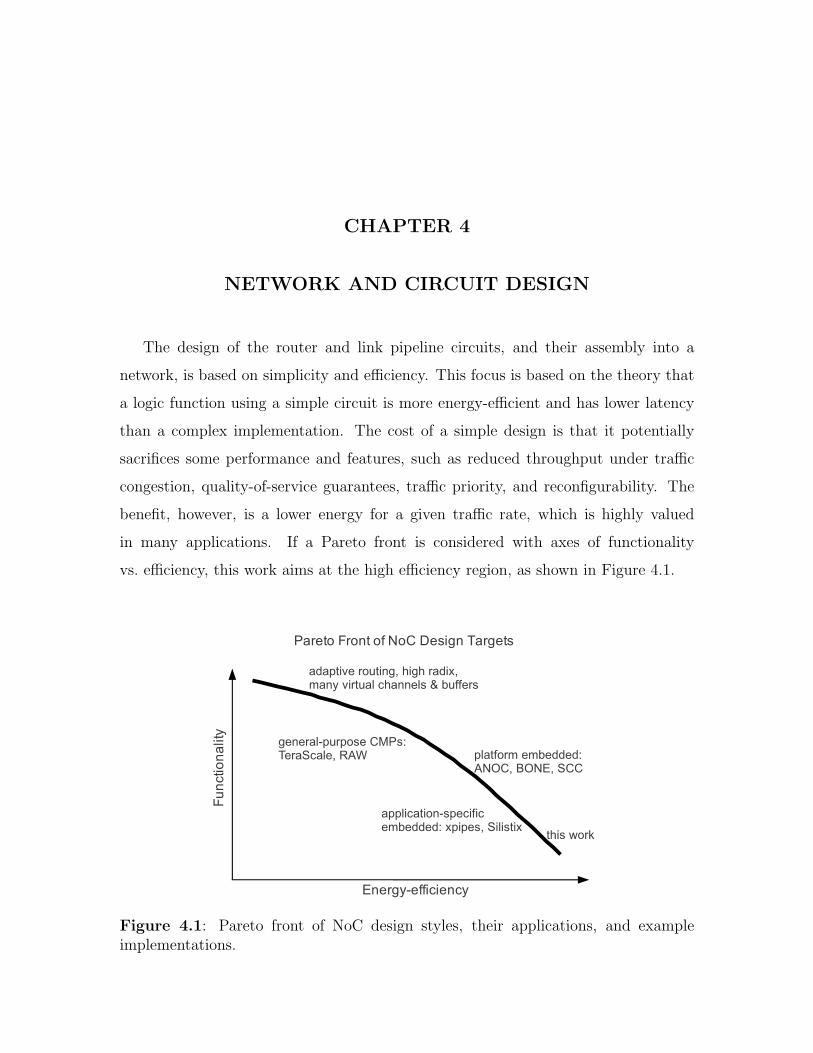
CHAPTER 4
NETWORK AND CIRCUIT DESIGN
The design of the router and link pipeline circuits, and their assembly into a
network, is based on simplicity and efficiency. This focus is based on the theory that
a logic function using a simple circuit is more energy-efficient and has lower latency
than a complex implementation. The cost of a simple design is that it potentially
sacrifices some performance and features, such as reduced throughput under traffic
congestion, quality-of-service guarantees, traffic priority, and reconfigurability. The
benefit, however, is a lower energy for a given traffic rate, which is highly valued
in many applications. If a Pareto front is considered with axes of functionality
vs. efficiency, this work aims at the high efficiency region, as shown in Figure 4.1.
Figure 4.1: Pareto front of NoC design styles, their applications, and exampleimplementations.
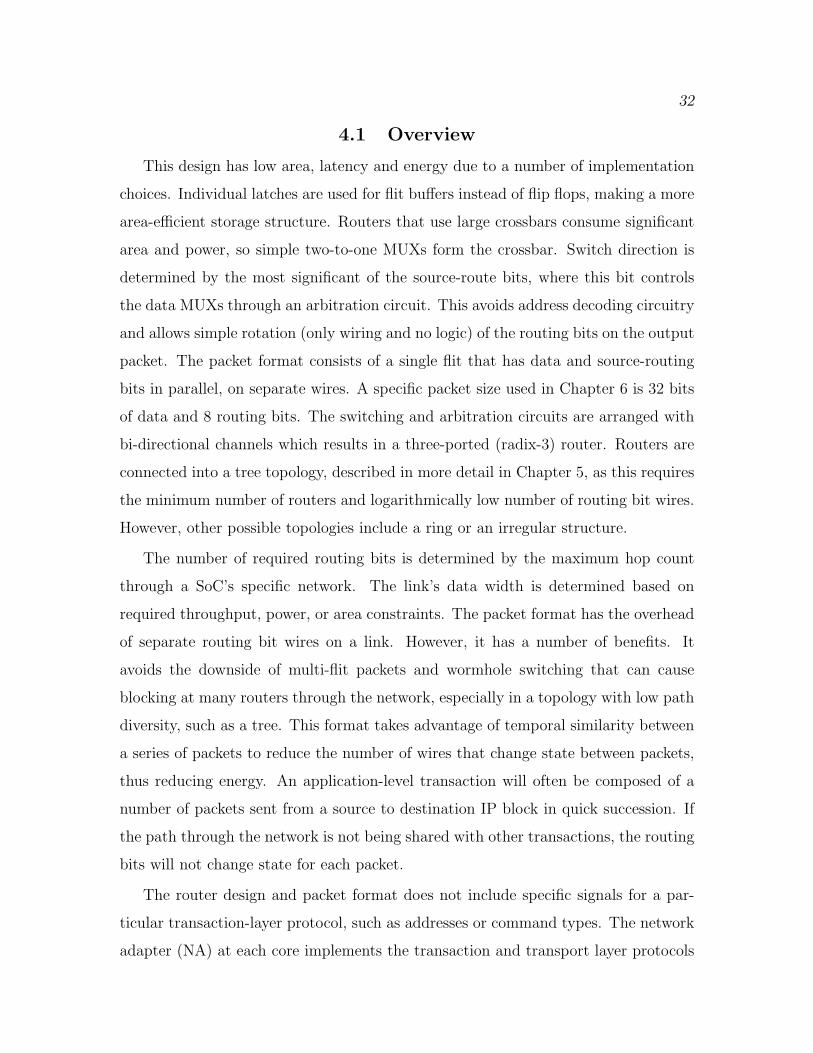
32
4.1 Overview
This design has low area, latency and energy due to a number of implementation
choices. Individual latches are used for flit buffers instead of flip flops, making a more
area-efficient storage structure. Routers that use large crossbars consume significant
area and power, so simple two-to-one MUXs form the crossbar. Switch direction is
determined by the most significant of the source-route bits, where this bit controls
the data MUXs through an arbitration circuit. This avoids address decoding circuitry
and allows simple rotation (only wiring and no logic) of the routing bits on the output
packet. The packet format consists of a single flit that has data and source-routing
bits in parallel, on separate wires. A specific packet size used in Chapter 6 is 32 bits
of data and 8 routing bits. The switching and arbitration circuits are arranged with
bi-directional channels which results in a three-ported (radix-3) router. Routers are
connected into a tree topology, described in more detail in Chapter 5, as this requires
the minimum number of routers and logarithmically low number of routing bit wires.
However, other possible topologies include a ring or an irregular structure.
The number of required routing bits is determined by the maximum hop count
through a SoC’s specific network. The link’s data width is determined based on
required throughput, power, or area constraints. The packet format has the overhead
of separate routing bit wires on a link. However, it has a number of benefits. It
avoids the downside of multi-flit packets and wormhole switching that can cause
blocking at many routers through the network, especially in a topology with low path
diversity, such as a tree. This format takes advantage of temporal similarity between
a series of packets to reduce the number of wires that change state between packets,
thus reducing energy. An application-level transaction will often be composed of a
number of packets sent from a source to destination IP block in quick succession. If
the path through the network is not being shared with other transactions, the routing
bits will not change state for each packet.
The router design and packet format does not include specific signals for a par-
ticular transaction-layer protocol, such as addresses or command types. The network
adapter (NA) at each core implements the transaction and transport layer protocols
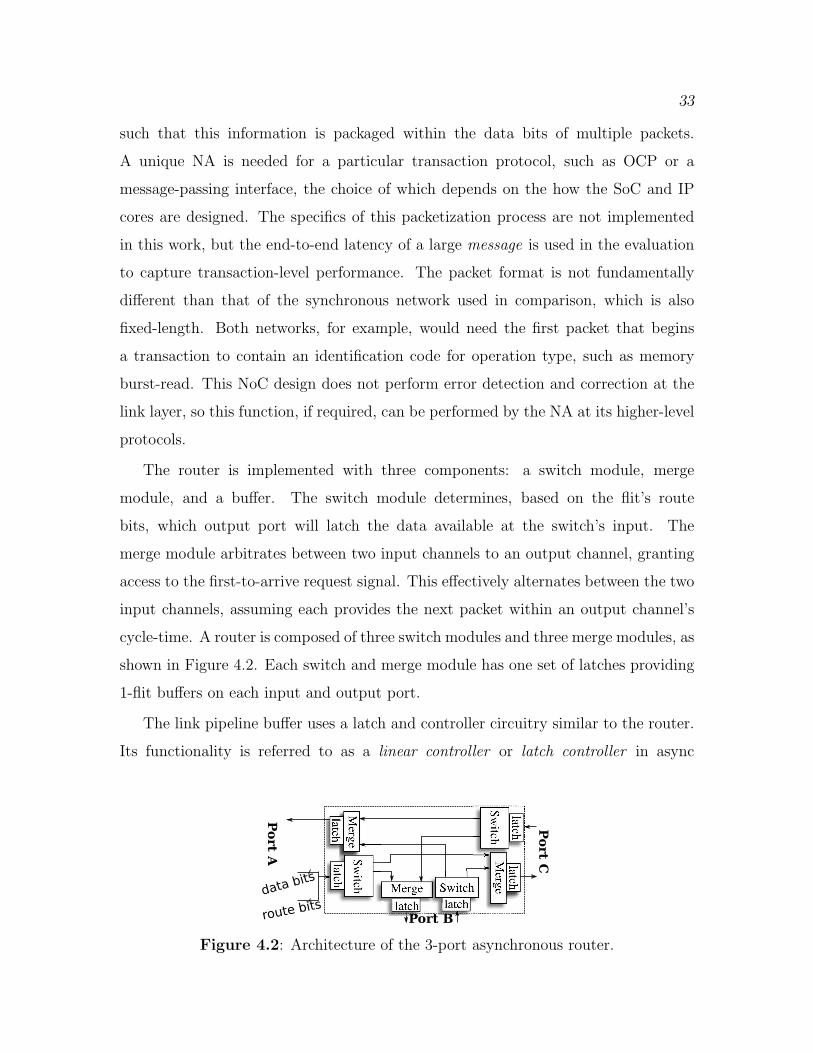
33
such that this information is packaged within the data bits of multiple packets.
A unique NA is needed for a particular transaction protocol, such as OCP or a
message-passing interface, the choice of which depends on the how the SoC and IP
cores are designed. The specifics of this packetization process are not implemented
in this work, but the end-to-end latency of a large message is used in the evaluation
to capture transaction-level performance. The packet format is not fundamentally
different than that of the synchronous network used in comparison, which is also
fixed-length. Both networks, for example, would need the first packet that begins
a transaction to contain an identification code for operation type, such as memory
burst-read. This NoC design does not perform error detection and correction at the
link layer, so this function, if required, can be performed by the NA at its higher-level
protocols.
The router is implemented with three components: a switch module, merge
module, and a buffer. The switch module determines, based on the flit’s route
bits, which output port will latch the data available at the switch’s input. The
merge module arbitrates between two input channels to an output channel, granting
access to the first-to-arrive request signal. This effectively alternates between the two
input channels, assuming each provides the next packet within an output channel’s
cycle-time. A router is composed of three switch modules and three merge modules, as
shown in Figure 4.2. Each switch and merge module has one set of latches providing
1-flit buffers on each input and output port.
The link pipeline buffer uses a latch and controller circuitry similar to the router.
Its functionality is referred to as a linear controller or latch controller in async
������
������
������
���������
AB�B����
Figure 4.2: Architecture of the 3-port asynchronous router.

34
literature. Figure 4.3 shows the block diagram of the pipeline buffer. The async
handshaking signals from the previous stage and next stage enter and exit the latch
controller. A flit is stored in the bank of latches. The controller allows the previous
stage’s flit through the latch when the next stage is ready to receive. This handshaking
is done with the req and ack signals using a two-phase protocol [97].
4.2 Router and Link Buffer Circuit Design
Asynchronous protocols and their circuit implementations normally fall into two
categories: quasi delay-insensitive (QDI) and bundled-data (BD). Generally, QDI is
more robust to variations while BD allows simpler circuits. BD has a lower wire
count compared to QDI’s common encodings (e.g. 1-of-4 and dual-rail). This is
potentially more energy-efficient as it needs fewer wire repeaters, especially with wide
links [102]. The choice of four-phase or two-phase protocol impacts performance and
circuit complexity. The throughput across long links is limited by wire latency, thus
a two-phase protocol achieves almost twice the throughput as a four-phase protocol
(but it has half the bandwidth of a synchronous or source-synchronous link). However,
a four-phase, level-sensitive protocol typically allows more simple circuits. A more
detailed description of these protocols and encodings is given in [97]. Figure 4.4 shows
a comparison between common async styles. For a 5mm long link between sender
and receiver, bandwidth was increased by adding link pipeline stages. The energy
and latency of sending one data word across the link was measured, and the product
plotted on the y-axis. The BD protocols have much better efficiency and scalability
latch
bank
latch
controller
req_inack_out
Link from router, buffer,
or network adapter
data bits
route bits
req_outack_in
Link to router, buffer,
or network adapter
data bits
route bits
Figure 4.3: Block diagram of link pipeline buffer.
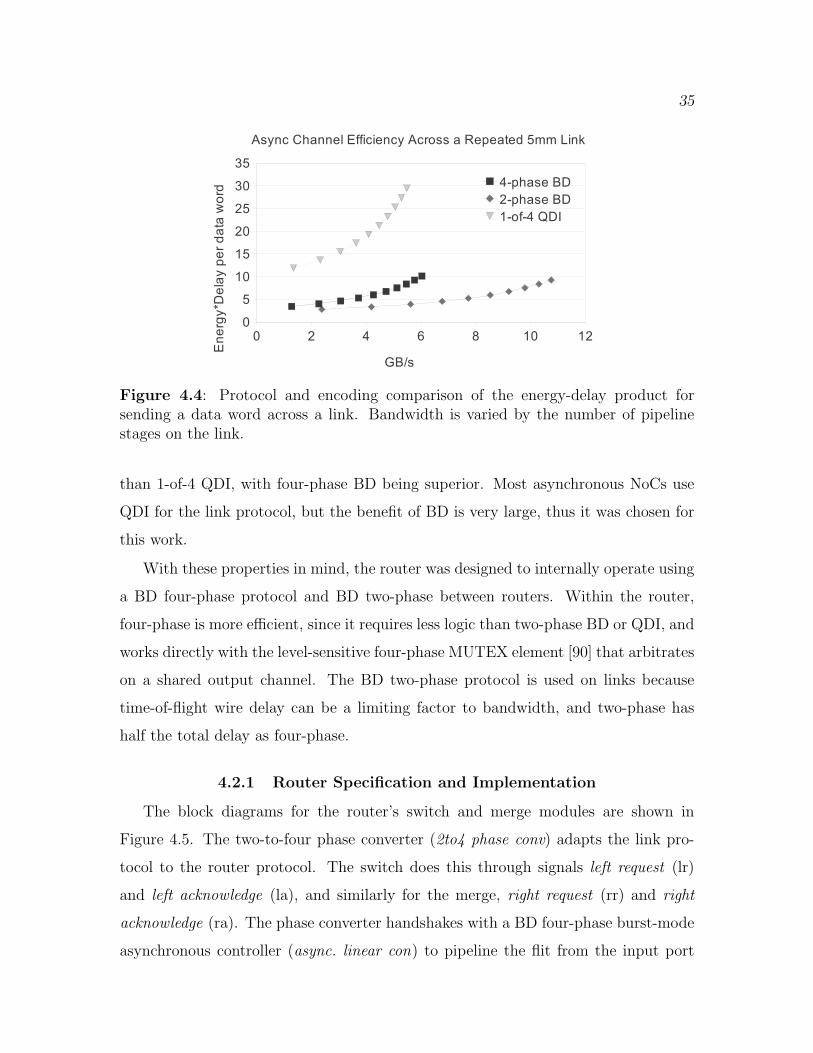
35
Figure 4.4: Protocol and encoding comparison of the energy-delay product forsending a data word across a link. Bandwidth is varied by the number of pipelinestages on the link.
than 1-of-4 QDI, with four-phase BD being superior. Most asynchronous NoCs use
QDI for the link protocol, but the benefit of BD is very large, thus it was chosen for
this work.
With these properties in mind, the router was designed to internally operate using
a BD four-phase protocol and BD two-phase between routers. Within the router,
four-phase is more efficient, since it requires less logic than two-phase BD or QDI, and
works directly with the level-sensitive four-phase MUTEX element [90] that arbitrates
on a shared output channel. The BD two-phase protocol is used on links because
time-of-flight wire delay can be a limiting factor to bandwidth, and two-phase has
half the total delay as four-phase.
4.2.1 Router Specification and Implementation
The block diagrams for the router’s switch and merge modules are shown in
Figure 4.5. The two-to-four phase converter (2to4 phase conv) adapts the link pro-
tocol to the router protocol. The switch does this through signals left request (lr)
and left acknowledge (la), and similarly for the merge, right request (rr) and right
acknowledge (ra). The phase converter handshakes with a BD four-phase burst-mode
asynchronous controller (async. linear con) to pipeline the flit from the input port
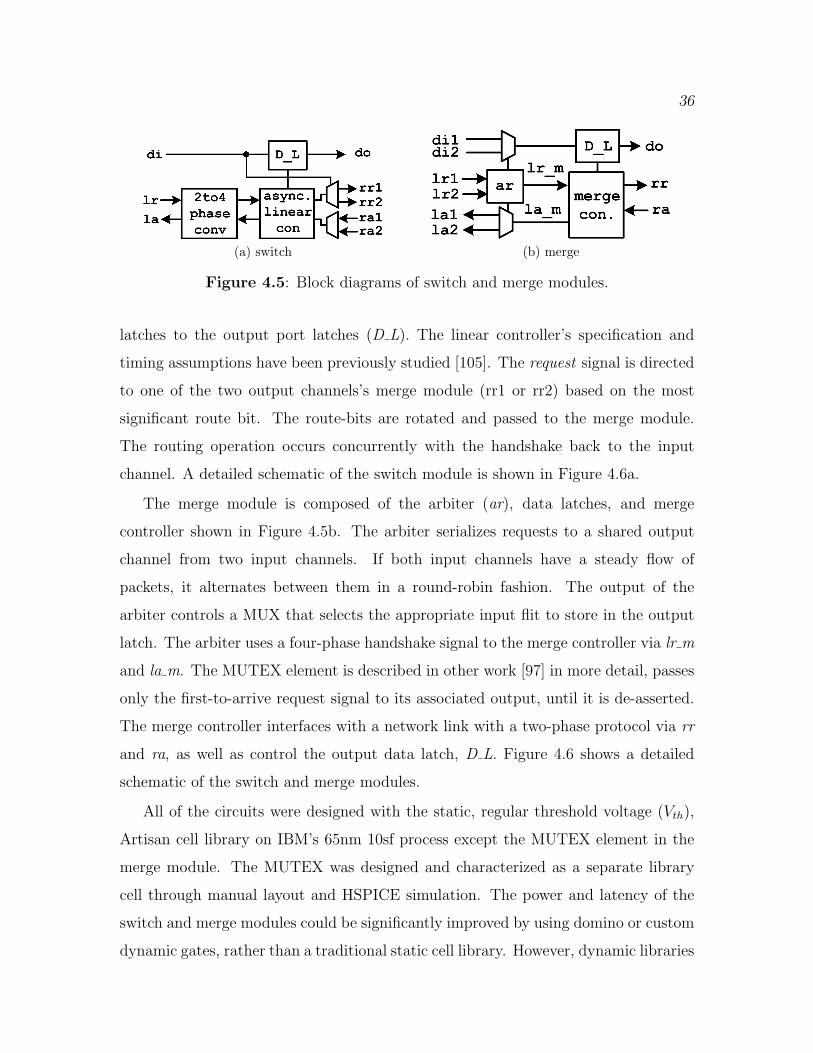
36
(a) switch (b) merge
Figure 4.5: Block diagrams of switch and merge modules.
latches to the output port latches (D L). The linear controller’s specification and
timing assumptions have been previously studied [105]. The request signal is directed
to one of the two output channels’s merge module (rr1 or rr2) based on the most
significant route bit. The route-bits are rotated and passed to the merge module.
The routing operation occurs concurrently with the handshake back to the input
channel. A detailed schematic of the switch module is shown in Figure 4.6a.
The merge module is composed of the arbiter (ar), data latches, and merge
controller shown in Figure 4.5b. The arbiter serializes requests to a shared output
channel from two input channels. If both input channels have a steady flow of
packets, it alternates between them in a round-robin fashion. The output of the
arbiter controls a MUX that selects the appropriate input flit to store in the output
latch. The arbiter uses a four-phase handshake signal to the merge controller via lr m
and la m. The MUTEX element is described in other work [97] in more detail, passes
only the first-to-arrive request signal to its associated output, until it is de-asserted.
The merge controller interfaces with a network link with a two-phase protocol via rr
and ra, as well as control the output data latch, D L. Figure 4.6 shows a detailed
schematic of the switch and merge modules.
All of the circuits were designed with the static, regular threshold voltage (Vth),
Artisan cell library on IBM’s 65nm 10sf process except the MUTEX element in the
merge module. The MUTEX was designed and characterized as a separate library
cell through manual layout and HSPICE simulation. The power and latency of the
switch and merge modules could be significantly improved by using domino or custom
dynamic gates, rather than a traditional static cell library. However, dynamic libraries
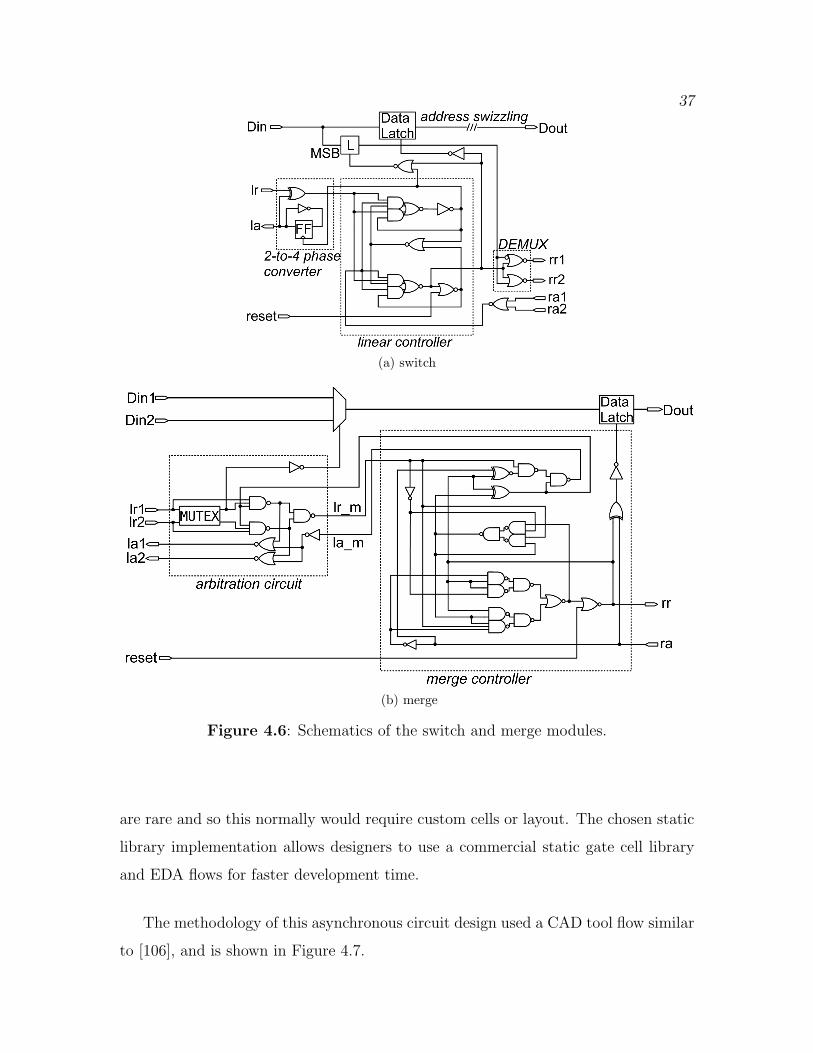
37
(a) switch
(b) merge
Figure 4.6: Schematics of the switch and merge modules.
are rare and so this normally would require custom cells or layout. The chosen static
library implementation allows designers to use a commercial static gate cell library
and EDA flows for faster development time.
The methodology of this asynchronous circuit design used a CAD tool flow similar
to [106], and is shown in Figure 4.7.
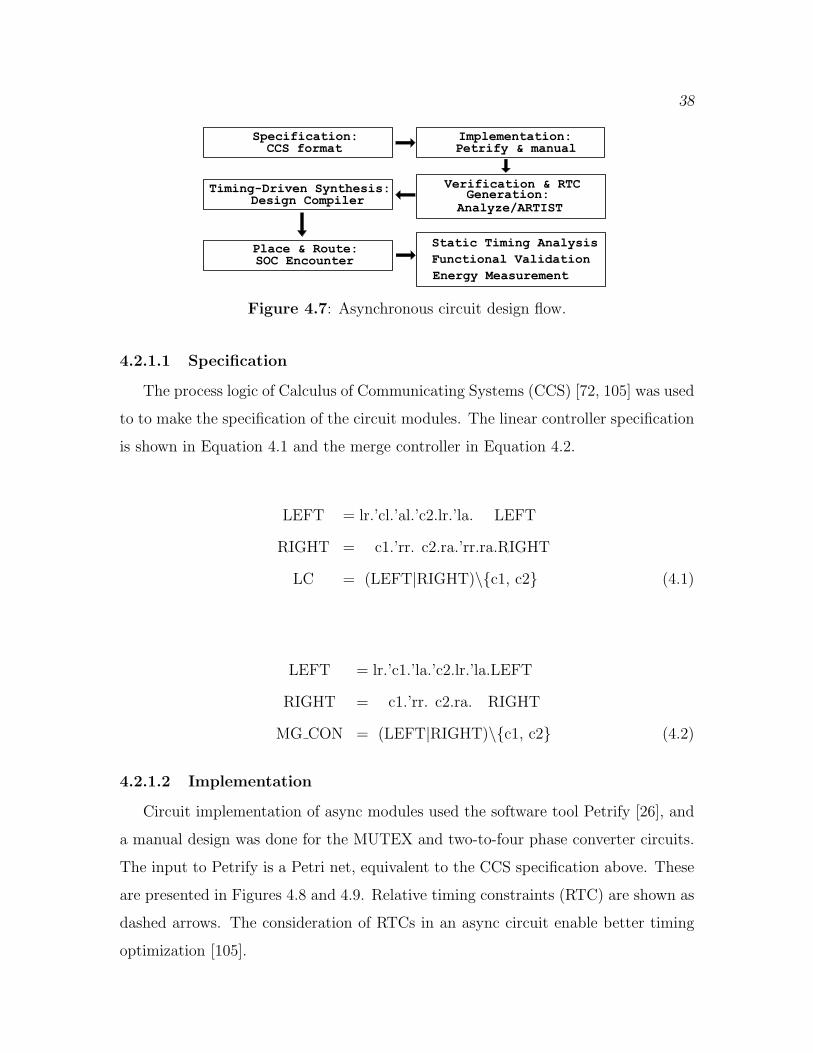
38
�����������AB
C�D�AEF�����A���A������B
������������B�������C�D�AE��A������
����������D�A�����
��A���A�����������A
A��E��!������D�A�
""����D��#D���D�A����AB��
����������A����C"��
�A���$�%��C#�C��&�A�����AB����
����EA�"D�����
�'"� A��A���
Figure 4.7: Asynchronous circuit design flow.
4.2.1.1 Specification
The process logic of Calculus of Communicating Systems (CCS) [72, 105] was used
to to make the specification of the circuit modules. The linear controller specification
is shown in Equation 4.1 and the merge controller in Equation 4.2.
LEFT = lr.’cl.’al.’c2.lr.’la. LEFT
RIGHT = c1.’rr. c2.ra.’rr.ra.RIGHT
LC = (LEFT|RIGHT)\{c1, c2} (4.1)
LEFT = lr.’c1.’la.’c2.lr.’la.LEFT
RIGHT = c1.’rr. c2.ra. RIGHT
MG CON = (LEFT|RIGHT)\{c1, c2} (4.2)
4.2.1.2 Implementation
Circuit implementation of async modules used the software tool Petrify [26], and
a manual design was done for the MUTEX and two-to-four phase converter circuits.
The input to Petrify is a Petri net, equivalent to the CCS specification above. These
are presented in Figures 4.8 and 4.9. Relative timing constraints (RTC) are shown as
dashed arrows. The consideration of RTCs in an async circuit enable better timing
optimization [105].
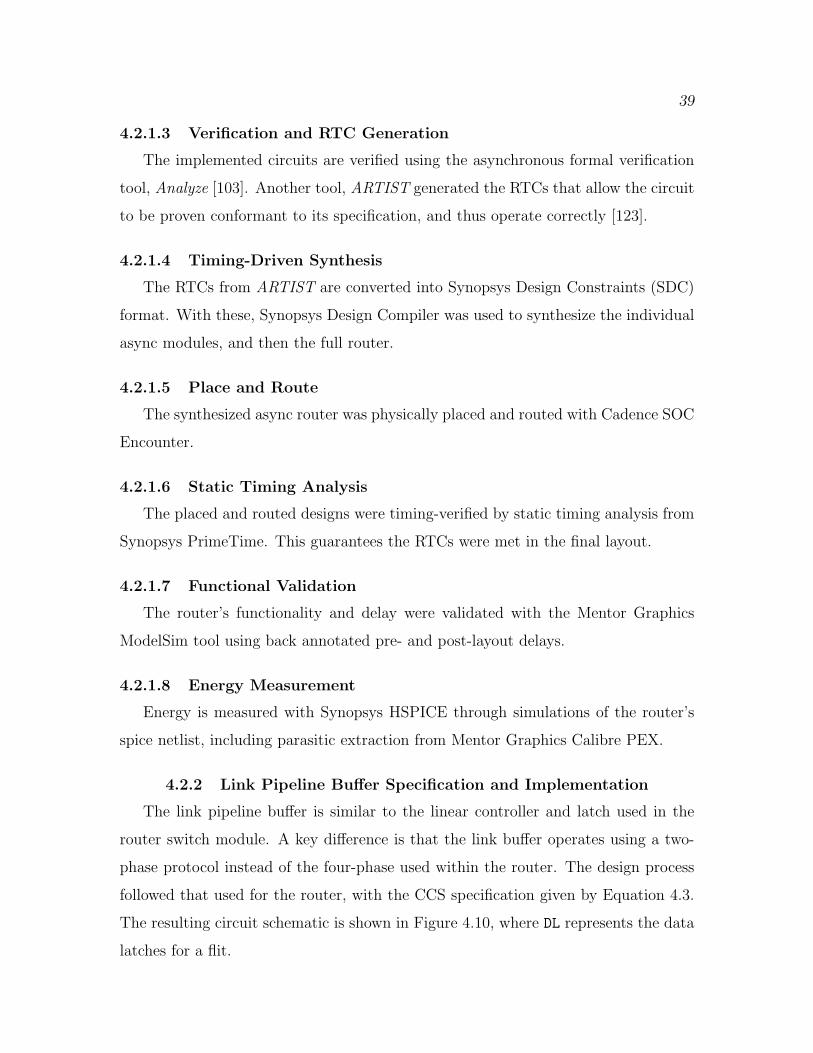
39
4.2.1.3 Verification and RTC Generation
The implemented circuits are verified using the asynchronous formal verification
tool, Analyze [103]. Another tool, ARTIST generated the RTCs that allow the circuit
to be proven conformant to its specification, and thus operate correctly [123].
4.2.1.4 Timing-Driven Synthesis
The RTCs from ARTIST are converted into Synopsys Design Constraints (SDC)
format. With these, Synopsys Design Compiler was used to synthesize the individual
async modules, and then the full router.
4.2.1.5 Place and Route
The synthesized async router was physically placed and routed with Cadence SOC
Encounter.
4.2.1.6 Static Timing Analysis
The placed and routed designs were timing-verified by static timing analysis from
Synopsys PrimeTime. This guarantees the RTCs were met in the final layout.
4.2.1.7 Functional Validation
The router’s functionality and delay were validated with the Mentor Graphics
ModelSim tool using back annotated pre- and post-layout delays.
4.2.1.8 Energy Measurement
Energy is measured with Synopsys HSPICE through simulations of the router’s
spice netlist, including parasitic extraction from Mentor Graphics Calibre PEX.
4.2.2 Link Pipeline Buffer Specification and Implementation
The link pipeline buffer is similar to the linear controller and latch used in the
router switch module. A key difference is that the link buffer operates using a two-
phase protocol instead of the four-phase used within the router. The design process
followed that used for the router, with the CCS specification given by Equation 4.3.
The resulting circuit schematic is shown in Figure 4.10, where DL represents the data
latches for a flit.
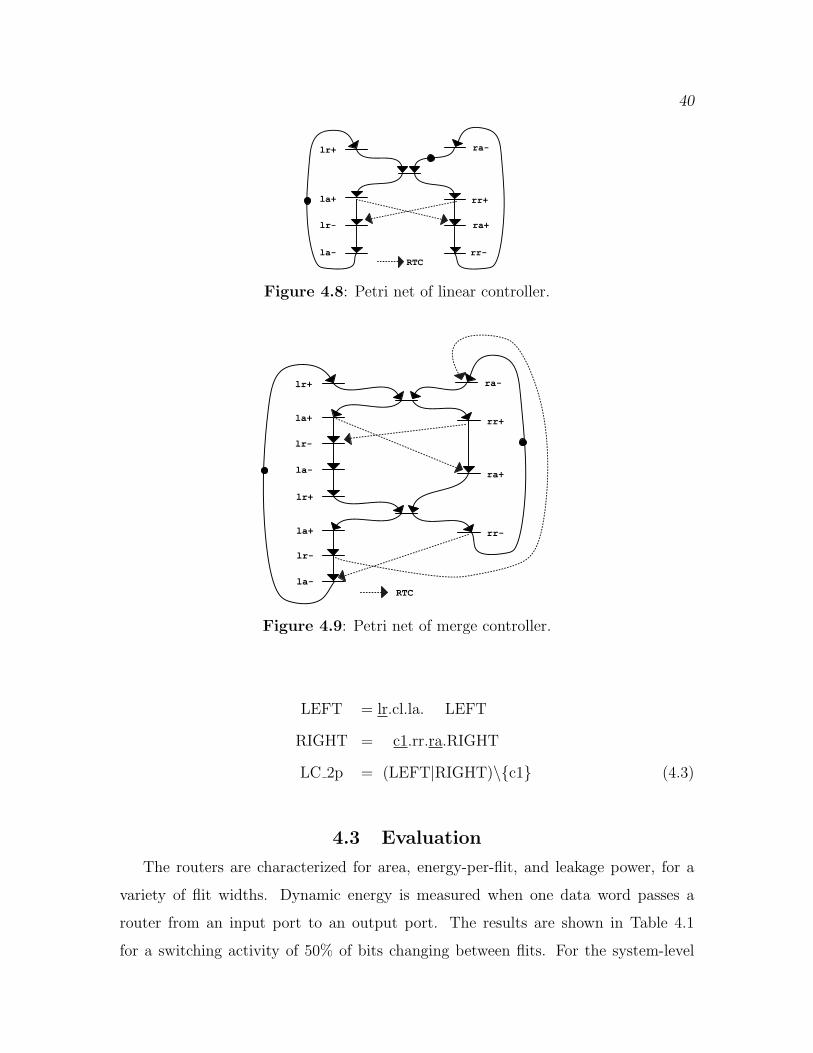
40
���
���
���
���
���
���
���
���
���
Figure 4.8: Petri net of linear controller.
���
���
���
���
���
���
���
���
���
���
���
���
���
Figure 4.9: Petri net of merge controller.
LEFT = lr.cl.la. LEFT
RIGHT = c1.rr.ra.RIGHT
LC 2p = (LEFT|RIGHT)\{c1} (4.3)
4.3 Evaluation
The routers are characterized for area, energy-per-flit, and leakage power, for a
variety of flit widths. Dynamic energy is measured when one data word passes a
router from an input port to an output port. The results are shown in Table 4.1
for a switching activity of 50% of bits changing between flits. For the system-level
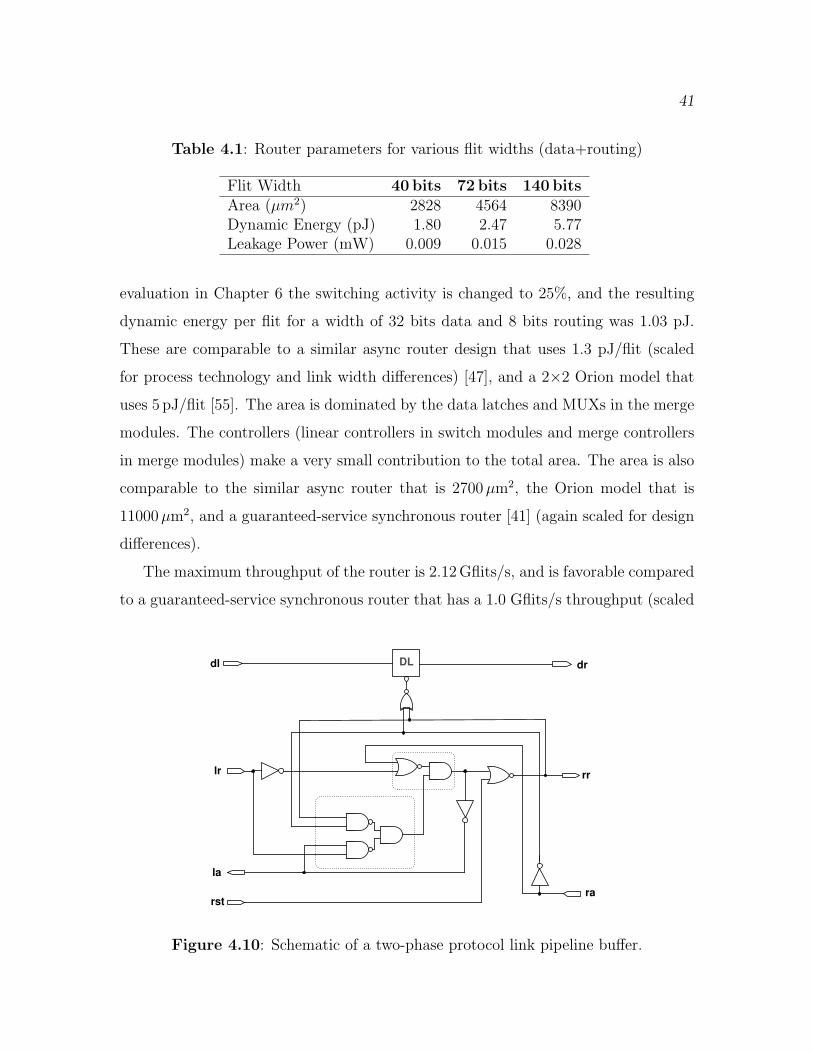
41
Table 4.1: Router parameters for various flit widths (data+routing)
Flit Width 40 bits 72 bits 140 bitsArea (µm2) 2828 4564 8390Dynamic Energy (pJ) 1.80 2.47 5.77Leakage Power (mW) 0.009 0.015 0.028
evaluation in Chapter 6 the switching activity is changed to 25%, and the resulting
dynamic energy per flit for a width of 32 bits data and 8 bits routing was 1.03 pJ.
These are comparable to a similar async router design that uses 1.3 pJ/flit (scaled
for process technology and link width differences) [47], and a 2×2 Orion model that
uses 5 pJ/flit [55]. The area is dominated by the data latches and MUXs in the merge
modules. The controllers (linear controllers in switch modules and merge controllers
in merge modules) make a very small contribution to the total area. The area is also
comparable to the similar async router that is 2700µm2, the Orion model that is
11000µm2, and a guaranteed-service synchronous router [41] (again scaled for design
differences).
The maximum throughput of the router is 2.12Gflits/s, and is favorable compared
to a guaranteed-service synchronous router that has a 1.0 Gflits/s throughput (scaled
DLdl dr
lr
la
rstra
rr
Figure 4.10: Schematic of a two-phase protocol link pipeline buffer.

42
for technology process differences) [41]. This was measured by providing data into the
input ports at a maximum rate and allowing the output port to communicate with
another router with no wire delay. The backward latency of a router is the delay from
a request on an incoming channel to the acknowledgment on that channel, completing
the handshake of the two-phase protocol. Fast backward latency is desirable because
it frees the previous router’s output port for another transaction. Forward latency
of a router is the delay from a request on an incoming channel of a router to the
associated request on an output channel, assuming no contention or stalling in the
arbitration circuit. This is determined by the delay to buffer the data, arbitrate
control, and switch to the outbound channel. The router has a 250 ps backward
latency and 460 ps forward latency.
The link pipeline buffer is a smaller circuit than the router, as its energy and
performance reflect. With a data width of 40 bits, it has energy per flit of 0.45 pJ,
leakage power of 1.21µW, a forward latency of 130 ps and a throughput of 4.1Gflits/s.
4.4 Summary
Our router’s low power and area are due to its simple architecture and the
use of latches, rather than flip-flops, for the storage elements. Since much of the
area and power of router architectures is from memory elements, this advantage
makes a significant difference. Furthermore, the simplicity of the control circuits also
contributes to high throughput and low energy. The router employs a bundled data
protocol rather than delay insensitive codes which results in fewer wires per channel
and efficient use of standard cell libraries. The cost of these choices is that the
circuit timing must be carefully specified and controlled to ensure correct operation.
System-level power and performance results of a network using this router are shown
in Chapter 6.
CHAPTER 5
DESIGN AUTOMATION FRAMEWORK
The goal of interconnect design for the embedded SoCs this work targets is to
specify the network parameters so that power is minimized while performance needs
are met. A challenging aspect is determining the optimal parameter choices when
they are interrelated and dependent on each other.
The search for optimal parameter values is often aided by design automation
software. We have developed such a tool that performs the following operations:
determines the network topology, places routers and pipeline buffers on the physical
chip floorplan, and generates an executable simulator suitable for detailed comparison
and analysis. This tool is composed of a number of components that form a framework
titled ANetGen. It has been used to compare the asynchronous network described
herein to a synchronous network in an initial study [37], and another study with an
improved comparison and more implementation details [39].
ANetGen is used in the domain of designing a SoC that performs a small set of
fixed functions in an energy-constrained environment. The SoC is assembled from a
variety of IP blocks in a GALS manner, where IP blocks may be hard (post-layout)
or soft (synthesizable RTL), each with a standardized socket interface (like OCP).
The contributions of this framework are:
• Novel method of determining the router locations on the floorplan
• Exploring topology options while considering physical properties and constraints
• Self-similar traffic generator, portable to other simulators
ANetGen assists the design engineer in constructing a network formed from the
components described in Chapter 4. The input and output interfaces of ANetGen
are shown in Figure 5.1.
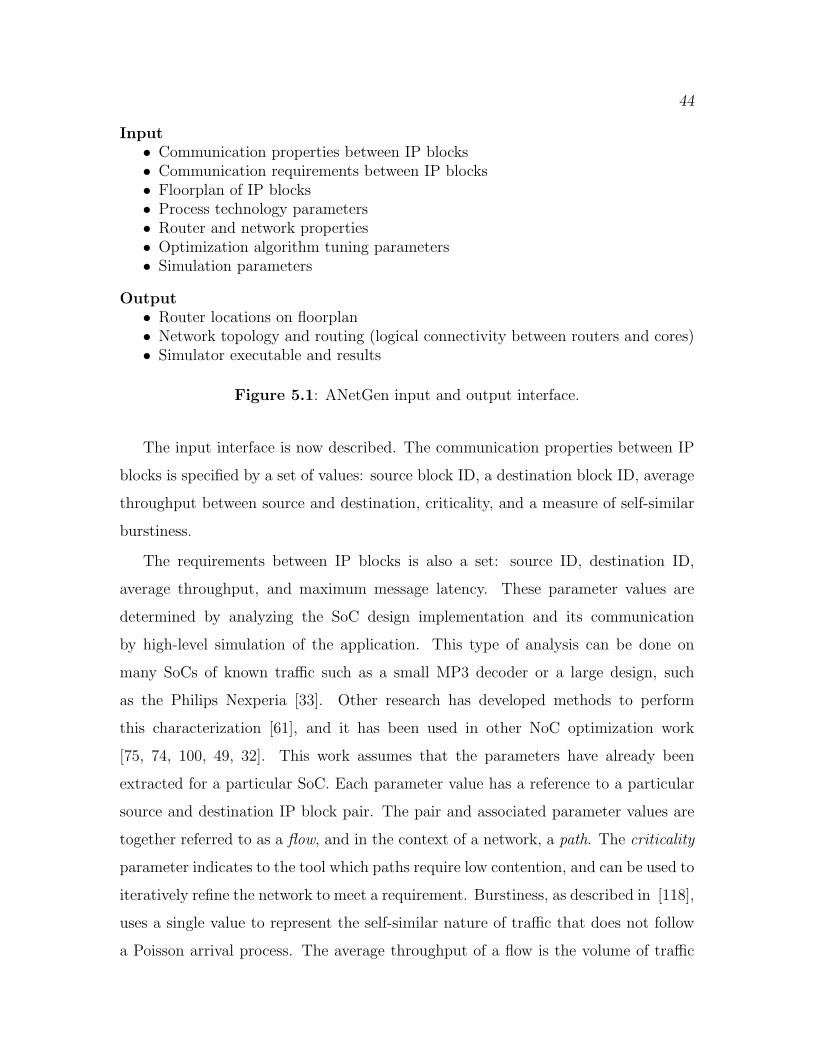
44
Input• Communication properties between IP blocks• Communication requirements between IP blocks• Floorplan of IP blocks• Process technology parameters• Router and network properties• Optimization algorithm tuning parameters• Simulation parameters
Output• Router locations on floorplan• Network topology and routing (logical connectivity between routers and cores)• Simulator executable and results
Figure 5.1: ANetGen input and output interface.
The input interface is now described. The communication properties between IP
blocks is specified by a set of values: source block ID, a destination block ID, average
throughput between source and destination, criticality, and a measure of self-similar
burstiness.
The requirements between IP blocks is also a set: source ID, destination ID,
average throughput, and maximum message latency. These parameter values are
determined by analyzing the SoC design implementation and its communication
by high-level simulation of the application. This type of analysis can be done on
many SoCs of known traffic such as a small MP3 decoder or a large design, such
as the Philips Nexperia [33]. Other research has developed methods to perform
this characterization [61], and it has been used in other NoC optimization work
[75, 74, 100, 49, 32]. This work assumes that the parameters have already been
extracted for a particular SoC. Each parameter value has a reference to a particular
source and destination IP block pair. The pair and associated parameter values are
together referred to as a flow, and in the context of a network, a path. The criticality
parameter indicates to the tool which paths require low contention, and can be used to
iteratively refine the network to meet a requirement. Burstiness, as described in [118],
uses a single value to represent the self-similar nature of traffic that does not follow
a Poisson arrival process. The average throughput of a flow is the volume of traffic
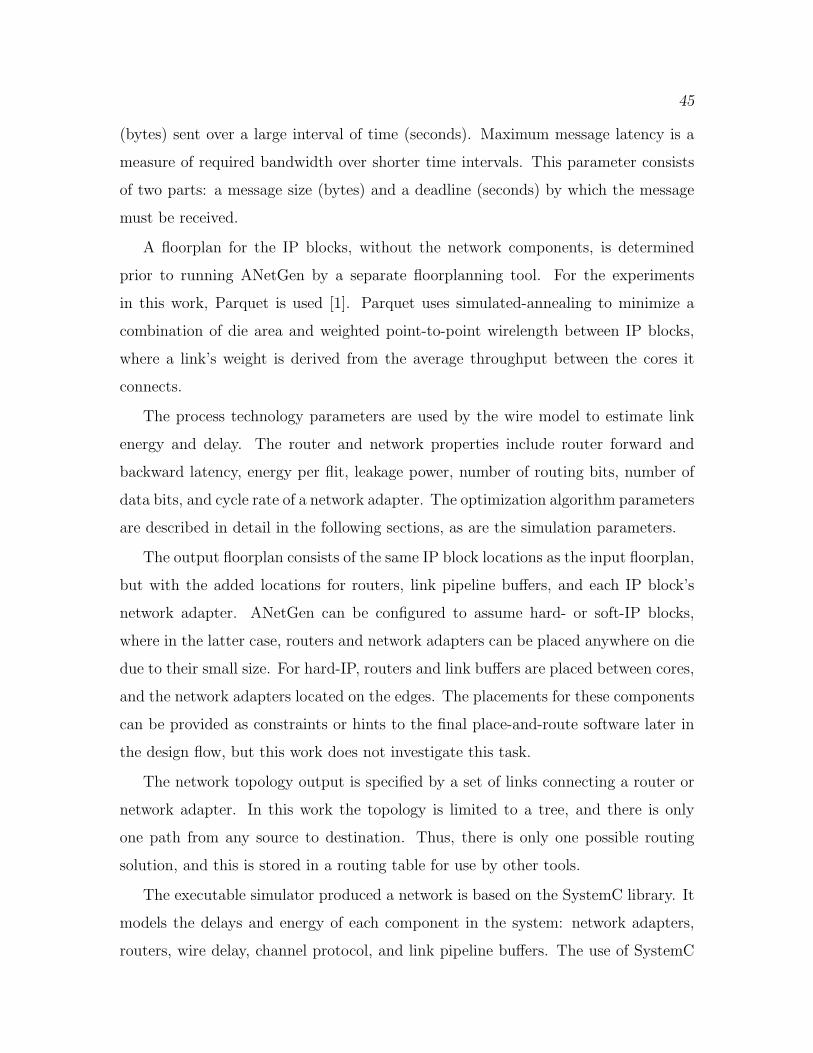
45
(bytes) sent over a large interval of time (seconds). Maximum message latency is a
measure of required bandwidth over shorter time intervals. This parameter consists
of two parts: a message size (bytes) and a deadline (seconds) by which the message
must be received.
A floorplan for the IP blocks, without the network components, is determined
prior to running ANetGen by a separate floorplanning tool. For the experiments
in this work, Parquet is used [1]. Parquet uses simulated-annealing to minimize a
combination of die area and weighted point-to-point wirelength between IP blocks,
where a link’s weight is derived from the average throughput between the cores it
connects.
The process technology parameters are used by the wire model to estimate link
energy and delay. The router and network properties include router forward and
backward latency, energy per flit, leakage power, number of routing bits, number of
data bits, and cycle rate of a network adapter. The optimization algorithm parameters
are described in detail in the following sections, as are the simulation parameters.
The output floorplan consists of the same IP block locations as the input floorplan,
but with the added locations for routers, link pipeline buffers, and each IP block’s
network adapter. ANetGen can be configured to assume hard- or soft-IP blocks,
where in the latter case, routers and network adapters can be placed anywhere on die
due to their small size. For hard-IP, routers and link buffers are placed between cores,
and the network adapters located on the edges. The placements for these components
can be provided as constraints or hints to the final place-and-route software later in
the design flow, but this work does not investigate this task.
The network topology output is specified by a set of links connecting a router or
network adapter. In this work the topology is limited to a tree, and there is only
one path from any source to destination. Thus, there is only one possible routing
solution, and this is stored in a routing table for use by other tools.
The executable simulator produced a network is based on the SystemC library. It
models the delays and energy of each component in the system: network adapters,
routers, wire delay, channel protocol, and link pipeline buffers. The use of SystemC
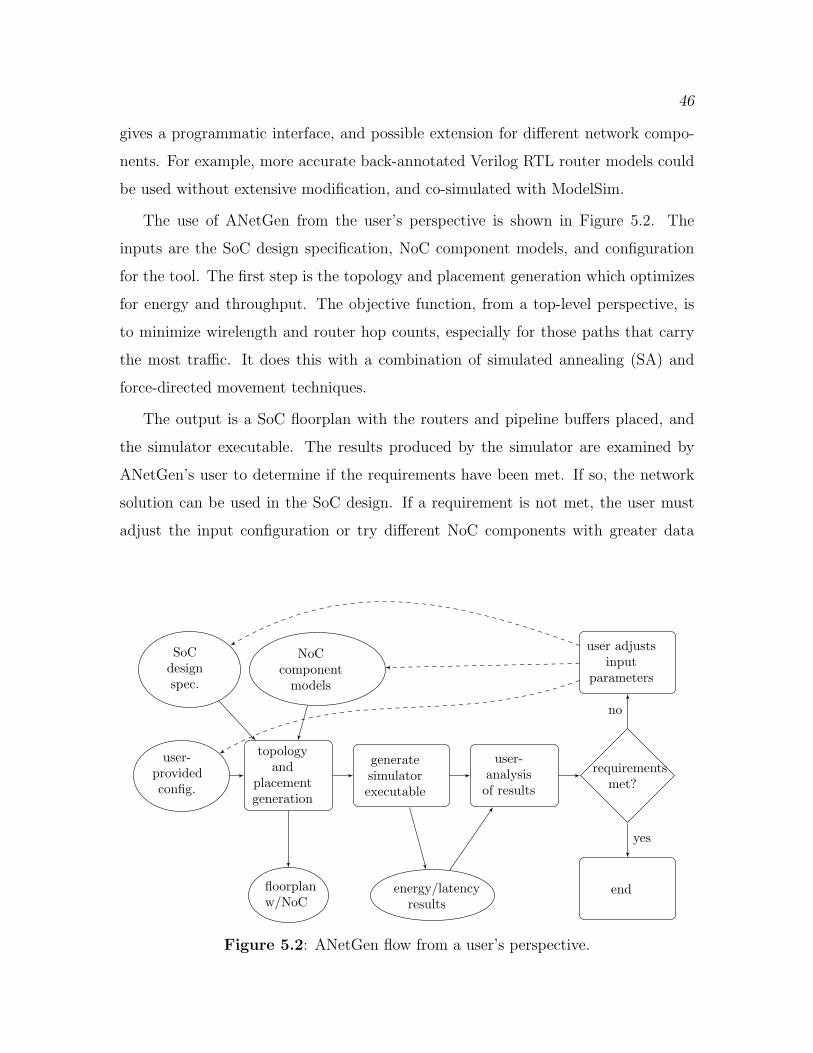
46
gives a programmatic interface, and possible extension for different network compo-
nents. For example, more accurate back-annotated Verilog RTL router models could
be used without extensive modification, and co-simulated with ModelSim.
The use of ANetGen from the user’s perspective is shown in Figure 5.2. The
inputs are the SoC design specification, NoC component models, and configuration
for the tool. The first step is the topology and placement generation which optimizes
for energy and throughput. The objective function, from a top-level perspective, is
to minimize wirelength and router hop counts, especially for those paths that carry
the most traffic. It does this with a combination of simulated annealing (SA) and
force-directed movement techniques.
The output is a SoC floorplan with the routers and pipeline buffers placed, and
the simulator executable. The results produced by the simulator are examined by
ANetGen’s user to determine if the requirements have been met. If so, the network
solution can be used in the SoC design. If a requirement is not met, the user must
adjust the input configuration or try different NoC components with greater data
topologyand
placementgeneration
SoCdesignspec.
user-providedconfig.
NoCcomponentmodels
generatesimulatorexecutable
floorplanw/NoC
energy/latencyresults
user-analysisof results
requirementsmet?
user adjustsinput
parameters
end
yes
no
Figure 5.2: ANetGen flow from a user’s perspective.
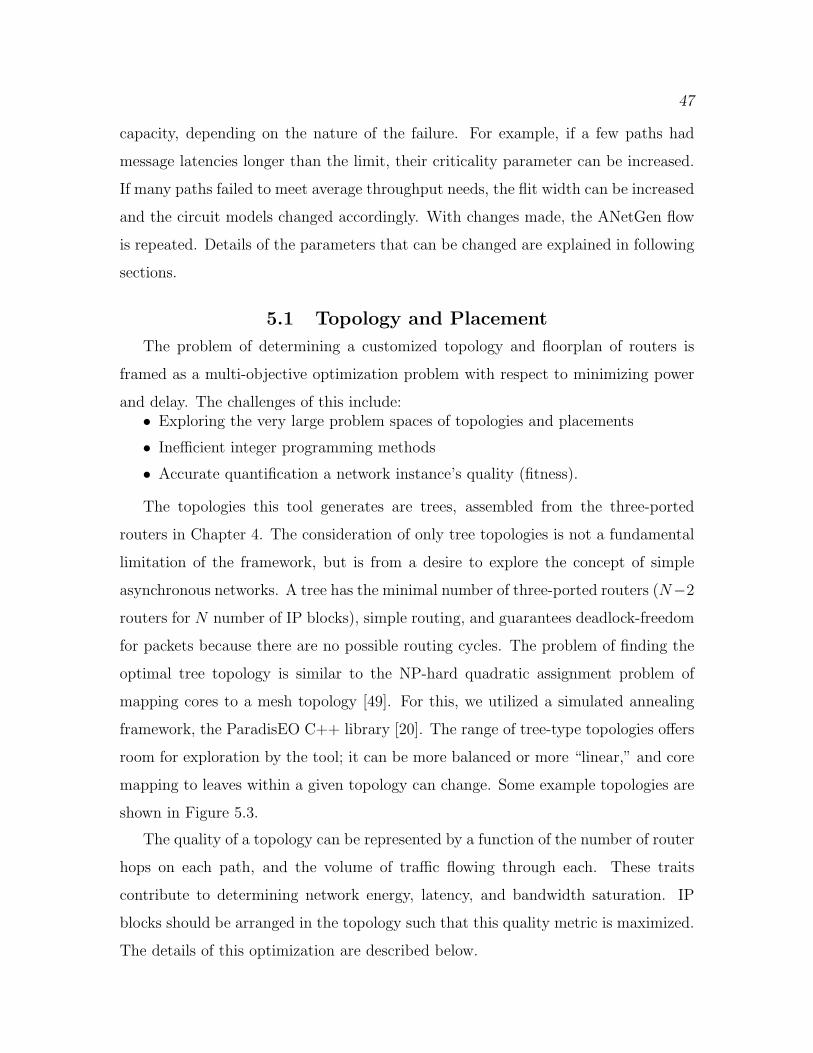
47
capacity, depending on the nature of the failure. For example, if a few paths had
message latencies longer than the limit, their criticality parameter can be increased.
If many paths failed to meet average throughput needs, the flit width can be increased
and the circuit models changed accordingly. With changes made, the ANetGen flow
is repeated. Details of the parameters that can be changed are explained in following
sections.
5.1 Topology and Placement
The problem of determining a customized topology and floorplan of routers is
framed as a multi-objective optimization problem with respect to minimizing power
and delay. The challenges of this include:• Exploring the very large problem spaces of topologies and placements
• Inefficient integer programming methods
• Accurate quantification a network instance’s quality (fitness).
The topologies this tool generates are trees, assembled from the three-ported
routers in Chapter 4. The consideration of only tree topologies is not a fundamental
limitation of the framework, but is from a desire to explore the concept of simple
asynchronous networks. A tree has the minimal number of three-ported routers (N−2
routers for N number of IP blocks), simple routing, and guarantees deadlock-freedom
for packets because there are no possible routing cycles. The problem of finding the
optimal tree topology is similar to the NP-hard quadratic assignment problem of
mapping cores to a mesh topology [49]. For this, we utilized a simulated annealing
framework, the ParadisEO C++ library [20]. The range of tree-type topologies offers
room for exploration by the tool; it can be more balanced or more “linear,” and core
mapping to leaves within a given topology can change. Some example topologies are
shown in Figure 5.3.
The quality of a topology can be represented by a function of the number of router
hops on each path, and the volume of traffic flowing through each. These traits
contribute to determining network energy, latency, and bandwidth saturation. IP
blocks should be arranged in the topology such that this quality metric is maximized.
The details of this optimization are described below.
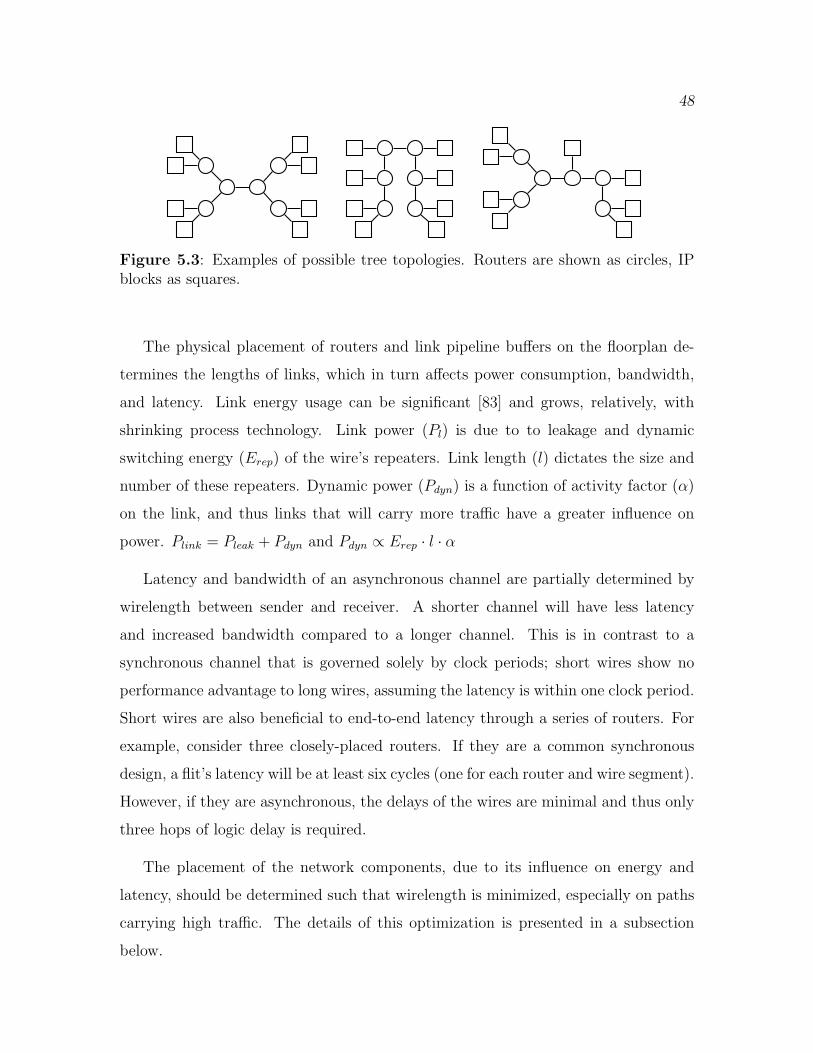
48
Figure 5.3: Examples of possible tree topologies. Routers are shown as circles, IPblocks as squares.
The physical placement of routers and link pipeline buffers on the floorplan de-
termines the lengths of links, which in turn affects power consumption, bandwidth,
and latency. Link energy usage can be significant [83] and grows, relatively, with
shrinking process technology. Link power (Pl) is due to to leakage and dynamic
switching energy (Erep) of the wire’s repeaters. Link length (l) dictates the size and
number of these repeaters. Dynamic power (Pdyn) is a function of activity factor (α)
on the link, and thus links that will carry more traffic have a greater influence on
power. Plink = Pleak + Pdyn and Pdyn ∝ Erep · l · α
Latency and bandwidth of an asynchronous channel are partially determined by
wirelength between sender and receiver. A shorter channel will have less latency
and increased bandwidth compared to a longer channel. This is in contrast to a
synchronous channel that is governed solely by clock periods; short wires show no
performance advantage to long wires, assuming the latency is within one clock period.
Short wires are also beneficial to end-to-end latency through a series of routers. For
example, consider three closely-placed routers. If they are a common synchronous
design, a flit’s latency will be at least six cycles (one for each router and wire segment).
However, if they are asynchronous, the delays of the wires are minimal and thus only
three hops of logic delay is required.
The placement of the network components, due to its influence on energy and
latency, should be determined such that wirelength is minimized, especially on paths
carrying high traffic. The details of this optimization is presented in a subsection
below.
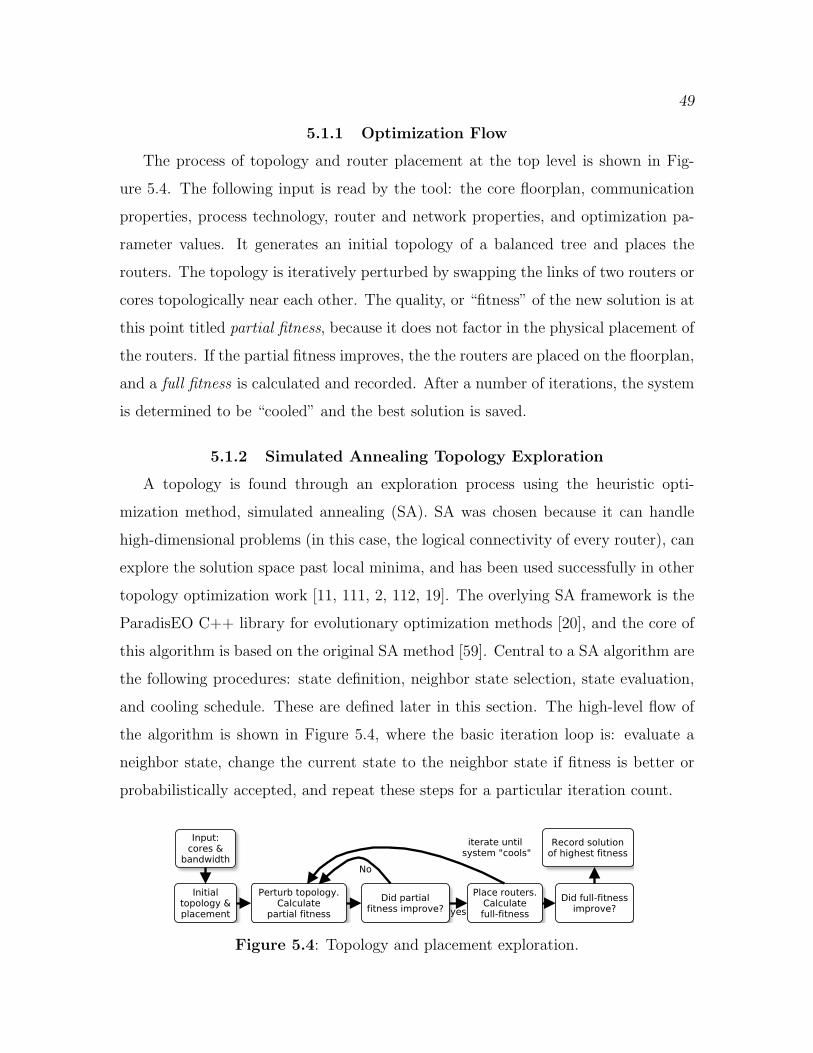
49
5.1.1 Optimization Flow
The process of topology and router placement at the top level is shown in Fig-
ure 5.4. The following input is read by the tool: the core floorplan, communication
properties, process technology, router and network properties, and optimization pa-
rameter values. It generates an initial topology of a balanced tree and places the
routers. The topology is iteratively perturbed by swapping the links of two routers or
cores topologically near each other. The quality, or “fitness” of the new solution is at
this point titled partial fitness, because it does not factor in the physical placement of
the routers. If the partial fitness improves, the the routers are placed on the floorplan,
and a full fitness is calculated and recorded. After a number of iterations, the system
is determined to be “cooled” and the best solution is saved.
5.1.2 Simulated Annealing Topology Exploration
A topology is found through an exploration process using the heuristic opti-
mization method, simulated annealing (SA). SA was chosen because it can handle
high-dimensional problems (in this case, the logical connectivity of every router), can
explore the solution space past local minima, and has been used successfully in other
topology optimization work [11, 111, 2, 112, 19]. The overlying SA framework is the
ParadisEO C++ library for evolutionary optimization methods [20], and the core of
this algorithm is based on the original SA method [59]. Central to a SA algorithm are
the following procedures: state definition, neighbor state selection, state evaluation,
and cooling schedule. These are defined later in this section. The high-level flow of
the algorithm is shown in Figure 5.4, where the basic iteration loop is: evaluate a
neighbor state, change the current state to the neighbor state if fitness is better or
probabilistically accepted, and repeat these steps for a particular iteration count.
Figure 5.4: Topology and placement exploration.

50
5.1.2.1 State Definition
A possible solution, or state, is represented by the topology and router placement
on the floorplan. The initial state is generated using an algorithm that constructs a
balanced binary tree topology, and then physically places the routers. This process
puts frequently communicating cores topologically near each other, with a worst-case
hop count (and thus number of required routing bits) of O(log2 n), where n is the
number of cores. Cores, or groups of cores, are recursively paired, so that those paths
with a high average throughput contain as few routers as possible in order to reduce
power and contention delay. Figure 5.5 outlines the process of determining the initial
solution, and its data structures and terminology include:
• Group: a single IP block, or two groups joined by a router.
• Topology Graph T (Vt, Et), where each vi ∈ Vt is a group and each ek = {vi, vj} ∈
Et is a physical network link between groups. Note that as this graph is being
built, it may not be a connected graph.
• Core Communication Graph C(Vc, Ec), where each vi ∈ Vc is initially an IP
block and each ek = {vi, vj} ∈ Ec shows communication between vi and vj. As
the algorithm progresses, two vertices combine to form a new vertex in C and
a corresponding group in T containing the same IP blocks.
• Map of edge weights, W [e → w]. For every ek ∈ Ec, wk is the path weight.
5.1.2.2 Fitness Representation
The fitness of a network instance is based on two properties: power and a rep-
resentation of router contention. It is necessary to quantify an instance’s fitness so
that it can be compared with others during the simulated-annealing process. Power is
estimated from the flit throughput of each router, and with the circuit-level energy/flit
value ER, and the throughput over each link using the Orion 2.0 wire models which
are part of a synchronous router model package [55]. For a router, R, the flits it
switches per time period (its throughput, TR) is
TR =∑
path p using R
T avep

51
Initialize T with vertices of Vc and no edges.while Vc contains two or more vertices (groups) doUnmark all vi ∈ Vc to indicate ungrouped.while two or more vi ∈ Vc marked grouped doFind (vi, vj) ∈ Vc connected with the highest weighted edge, emax, that are notmarked. An edge of weight 0 is implied between a vertex pair with no incidentedge.Create a new router vtnew in T . Connect vtnew to vertices in Vt correspondingto vi and vj in Vc.Group vi and vj of emax to form new vc.Mark vc to grouped.Combine edges incident to both vc and any one vi ∈ Vc by making a singleedge from vc to vi with weight equal to the sum of the separate edge weights.
end whileend whileRemove unneeded “root” router from T , connecting its children groups directly.T contains the generated topology.
Figure 5.5: Balanced tree topology generation by connecting IP blocks togetherwith routers.
where a path p from source to destination uses the router Rk, and T avep is the average
throughput, in flits/sec, of p. For a link, ℓ, its dynamic power is
Pdynℓ =∑
path p using ℓ
T avepEflitℓ
where Eflitℓ is the energy per flit traversal, with a default fraction of switching bits.
The Orion wire model estimates this energy. Total router leakage power, PleakR is the
sum of leakage from all routers. This work has one router type, and thus it is simply
the number of routers multiplied by the leakage of one, found from circuit-level design.
Total wire leakage power, Pleakℓ, is the sum leakage from all link segments. The
Orion wire model estimates this, using provided process technology data. Therefore,
the total power of the network is as shown in Equation 5.1.
Pnet =∑
foreach R
(TRER) +∑
foreach ℓ
Pdynℓ + PleakR + Pleakℓ (5.1)
Router contention within a network instance is represented as a unitless value,
calculated as follows. It is useful in comparing different topology options for the same
52
traffic patterns, but is not relevant for comparing across different traffic patterns of
various SoCs. The definition of contention is shown in Equation 5.2.
Contn =∑
path p
(
(HOPSp)k × (T avep + CRITp)
)
(5.2)
where k is an exponent giving geometrically worse (higher) fitness to solutions with
many-hop paths. The effect of a higher k value is a more balanced tree topology
which requires fewer routing bits. A value of 1.5 is used for these studies, and was
arrived at after experimenting with several values. This parameter should be adjusted
for a particular design if the number of routing bits required is excessive. CRIT
is the measure of path criticality, provided as input to ANetGen, that adjusts a
path’s impact on fitness, independent of its average throughput T avep is the average
throughput of path p.
The partial fitness of a network instance is simply the contention metric defined
above:
Fitpart = Contn
This is computationally less demanding than finding a router placement for a par-
ticular topology, and is used to evaluate quality of a new topology candidate. The
contention metric is also proportional to router power because each varies linearly with
traffic volume, and thus partial fitness also factors in router power. Full fitness, with
which network instances are ultimately compared, is the value of a single aggregate
objective function. This function is a weighted sum of total power and contention as
shown in Equation 5.3, where the user must specify the relative influence of each based
on network design goals. In this way, a single-objective optimization can be used,
but at the sacrifice of multiple Pareto-optimal solutions being found in one run [29,
Chapter 2.3]. However, true multi-objective methods would require more solution
evaluations, which may be limiting given the computational costs of evaluating fitness.
Fitfull = w · Pnet + (1− w) · Contn ·N (5.3)
where w is the user-specified weight in [0, 1], and N is a normalization factor to
adjust the magnitude of the unitless contention to be similar to power. N is set at
the beginning of optimization for the initial solution such that Contn ·N = Pnet.
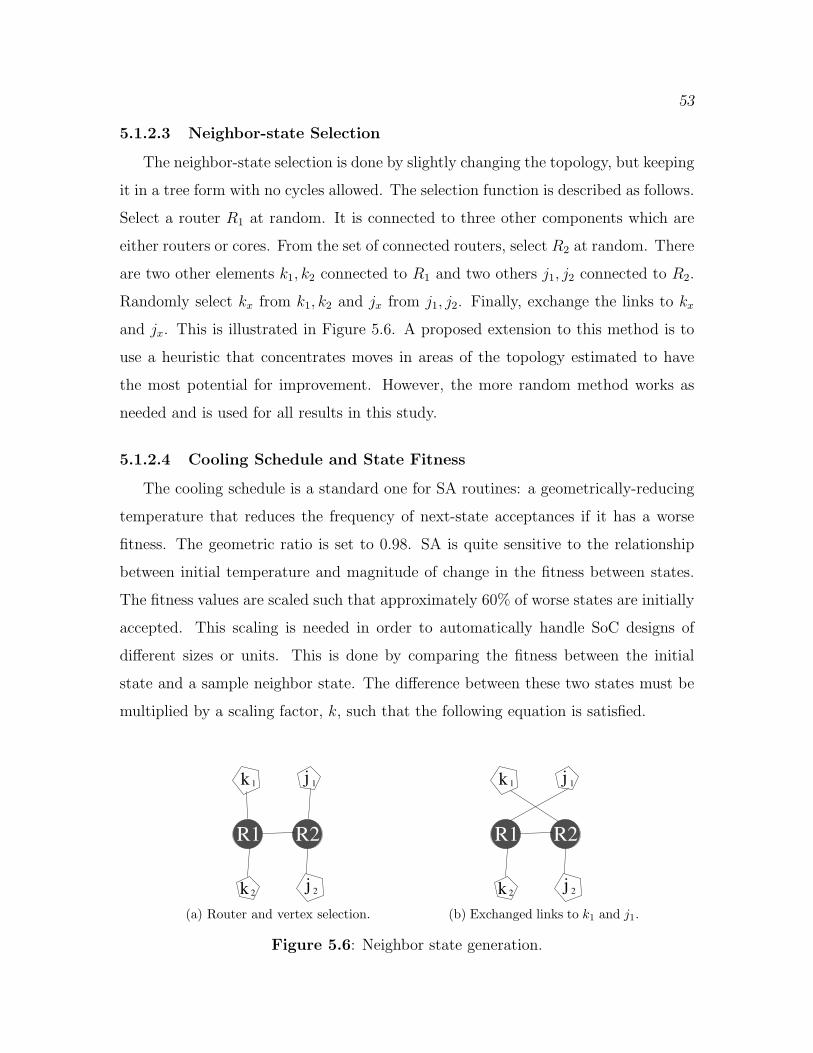
53
5.1.2.3 Neighbor-state Selection
The neighbor-state selection is done by slightly changing the topology, but keeping
it in a tree form with no cycles allowed. The selection function is described as follows.
Select a router R1 at random. It is connected to three other components which are
either routers or cores. From the set of connected routers, select R2 at random. There
are two other elements k1, k2 connected to R1 and two others j1, j2 connected to R2.
Randomly select kx from k1, k2 and jx from j1, j2. Finally, exchange the links to kx
and jx. This is illustrated in Figure 5.6. A proposed extension to this method is to
use a heuristic that concentrates moves in areas of the topology estimated to have
the most potential for improvement. However, the more random method works as
needed and is used for all results in this study.
5.1.2.4 Cooling Schedule and State Fitness
The cooling schedule is a standard one for SA routines: a geometrically-reducing
temperature that reduces the frequency of next-state acceptances if it has a worse
fitness. The geometric ratio is set to 0.98. SA is quite sensitive to the relationship
between initial temperature and magnitude of change in the fitness between states.
The fitness values are scaled such that approximately 60% of worse states are initially
accepted. This scaling is needed in order to automatically handle SoC designs of
different sizes or units. This is done by comparing the fitness between the initial
state and a sample neighbor state. The difference between these two states must be
multiplied by a scaling factor, k, such that the following equation is satisfied.
R1 R2
k 1
k 2
j 1
j 2
(a) Router and vertex selection.
R1 R2
k 1
k 2
j 1
j 2
(b) Exchanged links to k1 and j1.
Figure 5.6: Neighbor state generation.

54
0.6 = e
(
−|k ·∆Fitness|
T0
)
where T0 is a given initial temperature of the system. State fitnesses for the rest of
the SA operation are multiplied by this scaling factor.
We made a modification to the classical SA method: a state “reset” that after a
certain number of cooling steps, returns the state to that with the best fitness thus
far. The reasoning behind this is that often a random acceptance of a worse state
will not recover to a fruitful region of the solution space. Resetting the state back to
one of known good quality helps prevent this.
5.1.3 Router Placement
When a full fitness is needed for a particular state, the router locations need to
be determined for accurate wirelength, and thus energy information. We developed
a novel approach based on force-directed movement to place the routers on the
floorplan. Force directed movement has been used in many research areas; the seminal
work related to placement of components on a printed circuit board [84], and other
popular uses include chip floorplanning [35] and graph visualization [34]. The initial
description of our algorithm was previously published [36], but it has been modified,
and is described later in this chapter.
The process is iterative, where each iteration a router moves a distance based on
the sum of its force vectors. Force vectors are applied to routers each iteration that
are proportional to: (a) average throughput of paths using each router, (b) distance
from a router to IP blocks that use it to communicate, and (c) wirelengths of a
router’s connected links. The purpose of (a) and (b) is to decrease total distances
on high-traffic paths to reduce wire power, while (c) spaces routers evenly along long
links to maximize throughput. After some time, movement halts and the placement
is complete. If hard IP blocks are used in the design, the tool performs a de-overlap
of the routers that moves those placed within the bounds of an IP block to outside
of it. The algorithms are described in detail below. The input to this algorithm is a
CCG, statically-routed network topology, and IP block floorplan.

55
The description of the force application uses similar terminology and definitions
for the CCG, topology, and edge weights as defined in Section 5.1.2. The CCG edge
weights are the average throughputs between cores. These weights cause force to be
asserted on certain routers along the topological path between source and destination.
The goal is to move them such that the physical end-to-end path length is shortened.
A force is only applied to a router if that router is considered critical to a path. A
router that is not critical, given a path and axis, means that movement along that axis
does not yield a shorter path distance. This property arises due to the Manhattan
wire routing used in VLSI chip design, requiring distances in force-directed placement
to be a summation of x and y axes’ length. In more detail, a critical router for an edge
in Ec on either the x or y axis is a router on the path from vci to vcj in the topology
graph that has the following property. Its incident edges connect two vertices on
that path with distances on the given axis of the same sign or zero. In other words,
given a router R with coordinates (xR, yR), edges to vertices vt1 = (xv1, yv1) and
vt2 = (xv2, yv2) on the path, and axis a (either x or y): R is a critical router if d1
and d2 do not have opposite signs, where: d1 = aR − av1 and d2 = aR − av2. An
example is shown in Figure 5.7a, where R2 is critical and R1 is not critical along
the path from IP block A to B, on the y-axis. For R2, d1 and d2 are both negative
because its y-coordinate is less than both R1 and R3. R1 is not critical because it its
y-coordinate is less than A and greater than R2.
The algorithm starts by placing all routers in initial positions. Each router is
placed at the midpoint between its connected edges. This is done first for those
AB
R1
R2
R3
(a) Starting locations
AB
R1 R2R3
(b) Near stopping locations
Figure 5.7: Router movement to reduce path length from A to B.
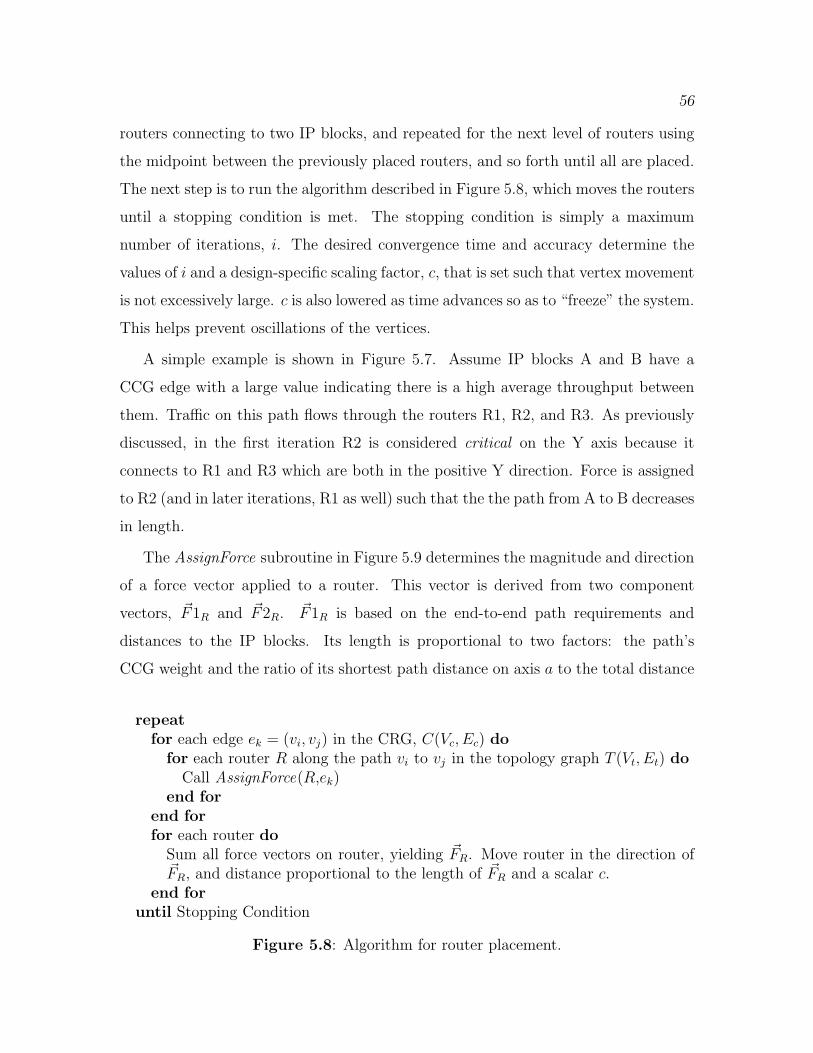
56
routers connecting to two IP blocks, and repeated for the next level of routers using
the midpoint between the previously placed routers, and so forth until all are placed.
The next step is to run the algorithm described in Figure 5.8, which moves the routers
until a stopping condition is met. The stopping condition is simply a maximum
number of iterations, i. The desired convergence time and accuracy determine the
values of i and a design-specific scaling factor, c, that is set such that vertex movement
is not excessively large. c is also lowered as time advances so as to “freeze” the system.
This helps prevent oscillations of the vertices.
A simple example is shown in Figure 5.7. Assume IP blocks A and B have a
CCG edge with a large value indicating there is a high average throughput between
them. Traffic on this path flows through the routers R1, R2, and R3. As previously
discussed, in the first iteration R2 is considered critical on the Y axis because it
connects to R1 and R3 which are both in the positive Y direction. Force is assigned
to R2 (and in later iterations, R1 as well) such that the the path from A to B decreases
in length.
The AssignForce subroutine in Figure 5.9 determines the magnitude and direction
of a force vector applied to a router. This vector is derived from two component
vectors, ~F1R and ~F2R. ~F1R is based on the end-to-end path requirements and
distances to the IP blocks. Its length is proportional to two factors: the path’s
CCG weight and the ratio of its shortest path distance on axis a to the total distance
repeatfor each edge ek = (vi, vj) in the CRG, C(Vc, Ec) dofor each router R along the path vi to vj in the topology graph T (Vt, Et) doCall AssignForce(R,ek)
end forend forfor each router doSum all force vectors on router, yielding ~FR. Move router in the direction of~FR, and distance proportional to the length of ~FR and a scalar c.
end foruntil Stopping Condition
Figure 5.8: Algorithm for router placement.

57
AssignForce(R,ec): returning force vector ~FR
for each axis ~a in {~x, ~y} doif R is a critical router thenAssign a force vector ~F1R to R on axis ~a as follows:Find the shortest distance, d~a, on ~a comparing:R to incident vt1 added to vt1 to vc1 andR to incident vt2 added to vt2 to vc2where vc1 and vc2 are endpoints of ec, and vt1 and vt2 in Vt are incident to Ralong paths to vc1 and vc2.
~F1Rlength =d~a
d~a + d~a′
· wij
where wij is the weight of the CCG edge ec = (vc1, vc1), and d~a′ is the distancebetween vc1 and vc2 along the opposite axis a′.~F1Rdir is positive if the location on ~a of vt1 or vt2 is greater than R. Otherwise,~F1Rdir is negative.
end ifend forfor each link lk connecting R to vertex vk doset length lk as the Manhattan distance from R to vkget unit vector, ~vk, from R to vertex vkset link force vector ~F lk = ~vk · lk · wij
end forset force vector ~F2R =
∑
∀k
~F lk
return ~FR = ~F1R · s+ ~F2R · (1− s)where s is a user-provided scalar [0,1]
Figure 5.9: AssignForce subroutine.
on both axes. Highly weighted, i.e., important, paths will enact proportionally higher
forces. The distance factor is a ratio of both axis distances so that those paths with
a significant fraction of total length on a have more influence than those with a small
fraction. ~F2R is based on the wirelengths of the links that connect a router to other
routers or IP blocks, and the total throughput those links carry. It is the sum of
vectors calculated for each link individually (lk). Each of these is directed towards
its connected vertex with a magnitude of the CCG edge’s weight multiplied by the
Manhattan length of the link. The final force applied to the router is the weighted
addition of ~F1R and ~F2R. The user specifies this weighting, where larger values
of s will make end-to-end path lengths shorter, saving power, but perhaps at the
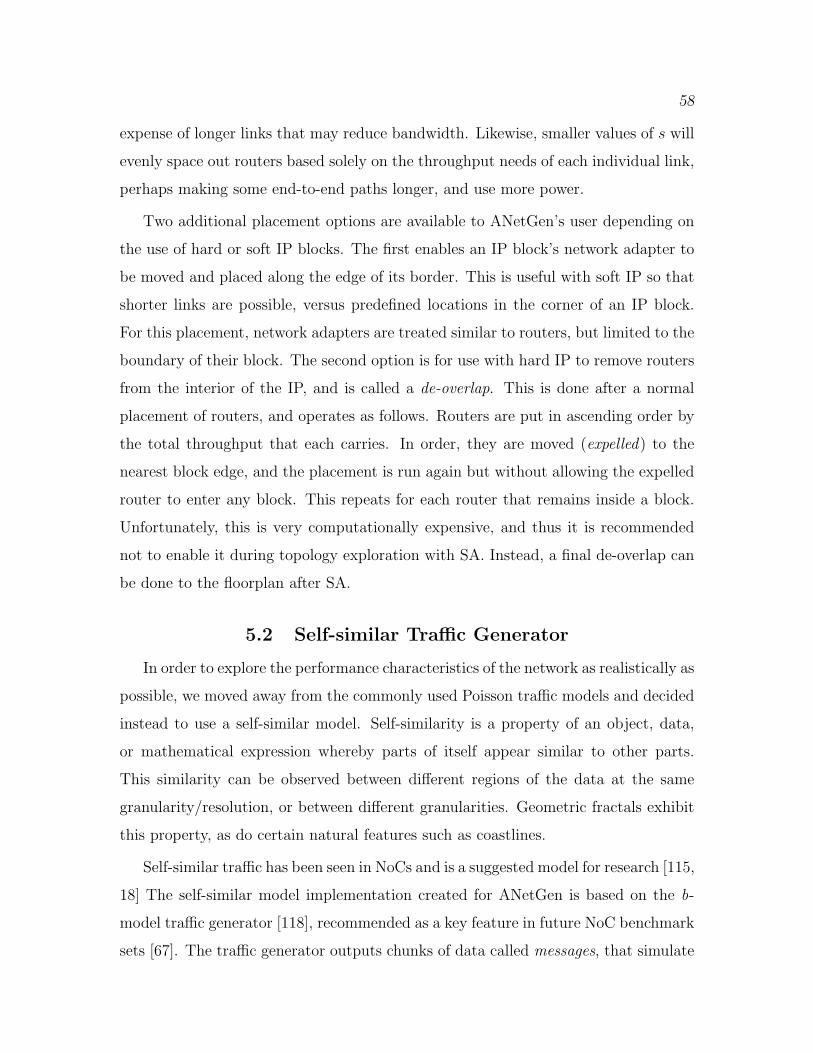
58
expense of longer links that may reduce bandwidth. Likewise, smaller values of s will
evenly space out routers based solely on the throughput needs of each individual link,
perhaps making some end-to-end paths longer, and use more power.
Two additional placement options are available to ANetGen’s user depending on
the use of hard or soft IP blocks. The first enables an IP block’s network adapter to
be moved and placed along the edge of its border. This is useful with soft IP so that
shorter links are possible, versus predefined locations in the corner of an IP block.
For this placement, network adapters are treated similar to routers, but limited to the
boundary of their block. The second option is for use with hard IP to remove routers
from the interior of the IP, and is called a de-overlap. This is done after a normal
placement of routers, and operates as follows. Routers are put in ascending order by
the total throughput that each carries. In order, they are moved (expelled) to the
nearest block edge, and the placement is run again but without allowing the expelled
router to enter any block. This repeats for each router that remains inside a block.
Unfortunately, this is very computationally expensive, and thus it is recommended
not to enable it during topology exploration with SA. Instead, a final de-overlap can
be done to the floorplan after SA.
5.2 Self-similar Traffic Generator
In order to explore the performance characteristics of the network as realistically as
possible, we moved away from the commonly used Poisson traffic models and decided
instead to use a self-similar model. Self-similarity is a property of an object, data,
or mathematical expression whereby parts of itself appear similar to other parts.
This similarity can be observed between different regions of the data at the same
granularity/resolution, or between different granularities. Geometric fractals exhibit
this property, as do certain natural features such as coastlines.
Self-similar traffic has been seen in NoCs and is a suggested model for research [115,
18] The self-similar model implementation created for ANetGen is based on the b-
model traffic generator [118], recommended as a key feature in future NoC benchmark
sets [67]. The traffic generator outputs chunks of data called messages, that simulate
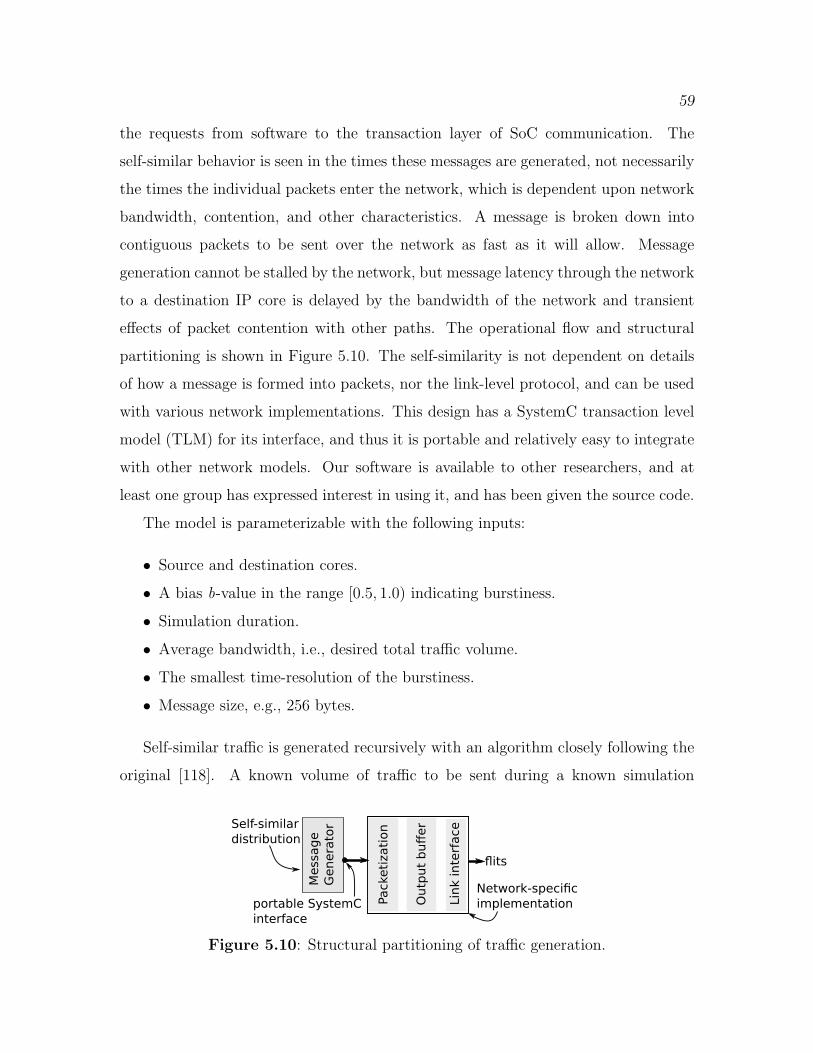
59
the requests from software to the transaction layer of SoC communication. The
self-similar behavior is seen in the times these messages are generated, not necessarily
the times the individual packets enter the network, which is dependent upon network
bandwidth, contention, and other characteristics. A message is broken down into
contiguous packets to be sent over the network as fast as it will allow. Message
generation cannot be stalled by the network, but message latency through the network
to a destination IP core is delayed by the bandwidth of the network and transient
effects of packet contention with other paths. The operational flow and structural
partitioning is shown in Figure 5.10. The self-similarity is not dependent on details
of how a message is formed into packets, nor the link-level protocol, and can be used
with various network implementations. This design has a SystemC transaction level
model (TLM) for its interface, and thus it is portable and relatively easy to integrate
with other network models. Our software is available to other researchers, and at
least one group has expressed interest in using it, and has been given the source code.
The model is parameterizable with the following inputs:
• Source and destination cores.
• A bias b-value in the range [0.5, 1.0) indicating burstiness.
• Simulation duration.
• Average bandwidth, i.e., desired total traffic volume.
• The smallest time-resolution of the burstiness.
• Message size, e.g., 256 bytes.
Self-similar traffic is generated recursively with an algorithm closely following the
original [118]. A known volume of traffic to be sent during a known simulation
����
�������
�A�B��CB
D�EF�������CA
�����������B
��AF��A��B��E������������B
����B�����CA
����CBF����E� E
�������A����CA�CB�������!����"
�A��B��E�
Figure 5.10: Structural partitioning of traffic generation.
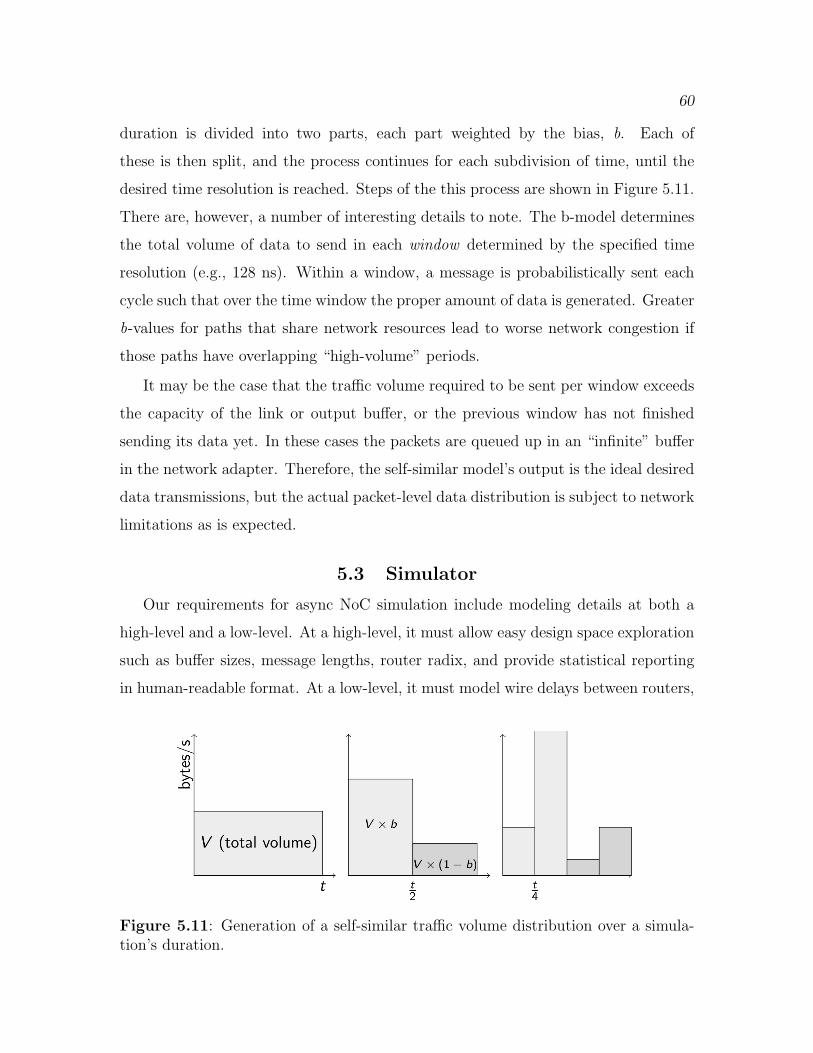
60
duration is divided into two parts, each part weighted by the bias, b. Each of
these is then split, and the process continues for each subdivision of time, until the
desired time resolution is reached. Steps of the this process are shown in Figure 5.11.
There are, however, a number of interesting details to note. The b-model determines
the total volume of data to send in each window determined by the specified time
resolution (e.g., 128 ns). Within a window, a message is probabilistically sent each
cycle such that over the time window the proper amount of data is generated. Greater
b-values for paths that share network resources lead to worse network congestion if
those paths have overlapping “high-volume” periods.
It may be the case that the traffic volume required to be sent per window exceeds
the capacity of the link or output buffer, or the previous window has not finished
sending its data yet. In these cases the packets are queued up in an “infinite” buffer
in the network adapter. Therefore, the self-similar model’s output is the ideal desired
data transmissions, but the actual packet-level data distribution is subject to network
limitations as is expected.
5.3 Simulator
Our requirements for async NoC simulation include modeling details at both a
high-level and a low-level. At a high-level, it must allow easy design space exploration
such as buffer sizes, message lengths, router radix, and provide statistical reporting
in human-readable format. At a low-level, it must model wire delays between routers,
Figure 5.11: Generation of a self-similar traffic volume distribution over a simula-tion’s duration.
61
logic delays within routers, energy consumption of links and routers, and be relatively
easy to automate network setup, simulator execution, and results analysis. Addition-
ally, the ability to substitute an RTL router model for a functional C++ model is
important for a more accurate post circuit design energy and latency evaluation.
With these considerations in mind we built an async network simulator using
the SystemC library. The following modules were developed: an arbiter, an inport
to the router, an outport from the router, and input and output port FIFOs, and
a self-similar traffic generator. The SystemC Transaction Level Modeling (TLM)
library is used for inter-router links and traffic generation. We chose this method to
allow easier extensibility of the channels if needed, and TLM provides a convenient
way to model link and protocol delays. It also allows more abstraction than standard
SystemC signals. Channel abstraction is desired so that other protocols can be studied
(e.g., two-phase vs. four-phase handshaking) without changing the interface of the
software modules.
The traffic generator and router ports use a simple socket to receive a generic
payload transaction object that contains packet and routing information. When a
TLM object is received by the inport ’s socket, a wait is performed to model the wire
delay. The wire delay model can come from a variety of sources. For our studies
we used an interpolation of HSPICE simulations of various wirelengths in IBM’s
65nm technology with nearly delay-optimal repeater sizing and spacing [65]. Another
possibility is to incorporate an analytical wire model [21] for more flexibility. The
wire energy per transfer is calculated using the Orion 2.0 model [55]. The router
waits an additional time period to model forward logic delay. The flit is written
to the FIFO, which triggers the arbiter. Another wait models the acknowledgment
delay to the sender. It should be noted that these channel delays are specific to the
asynchronous protocol used, e.g. two-phase or four-phase, and are easily changed.
The router circuits used a two-phase asynchronous protocol on inter-router links.
Within the arbiter, a doSwitching SC METHOD is called whenever a packet is
received by an input FIFO or acknowledged by an output FIFO. The arbitration
mechanism is that described in Chapter 4, and it results in round-robin arbitration
62
between the two input ports if they both have streams of packets arriving. Appro-
priate energy is logged at each switching operation. This energy was measured from
transistor-level router simulations shown in Chapter 4.
Each outport operates in its own thread, waiting for a packet to be passed to it
by the arbiter, or for a TLM response indicating that the channel is free. When there
is data in the FIFO and the channel is free, it sends a new TLM generic payload.
The outport also records wire energy of the transmitting link. The fraction of data
bits that switch every flit is assumed to be constant. Our studies use either 0.5 or
0.25. For the source-routing bits, the actual number of switching bits is used, rather
than an assumed fraction. For example, if a series of packets arrives to a router from
the same source and to the same destination, they will not cause any of the routing
wires to change state using switching energy. This modeling detail is needed to allow
exploration of the energy trade-offs in using separate wires for a packet’s routing bits
vs. using a header in a multi-flit packet.
5.4 Link Pipelining
A link of a NoC can be pipelined using latch or register-based buffers when its
wire delay is a limiting factor in throughput. This often occurs with long links,
small process technology, and relatively fast clock speeds. Another benefit is reduced
network congestion leading to improved throughput from the additional buffering
space it provides, assuming a compatible link-level flow-control. This section describes
two strategies for determining which links should be pipelined, and to what depth.
In an asynchronous channel, the goal of pipelining a link is to reduce the cycle-time
created by wire delay by inserting a buffer between sender and receiver. Throughput
along a link is improved, at the expense of single-flit forward latency and a slight power
increase over only wire repeaters. This organization is illustrated in Figure 5.12, where
a buffer is placed between a router and network adapter. Our asynchronous pipeline
buffer is composed of a bank of latches (rather than flip flops) and a handshake
controller. This arrangement is called a linear controller. The use of latches saves
almost half the area, and potentially power, compared to a traditional synchronous
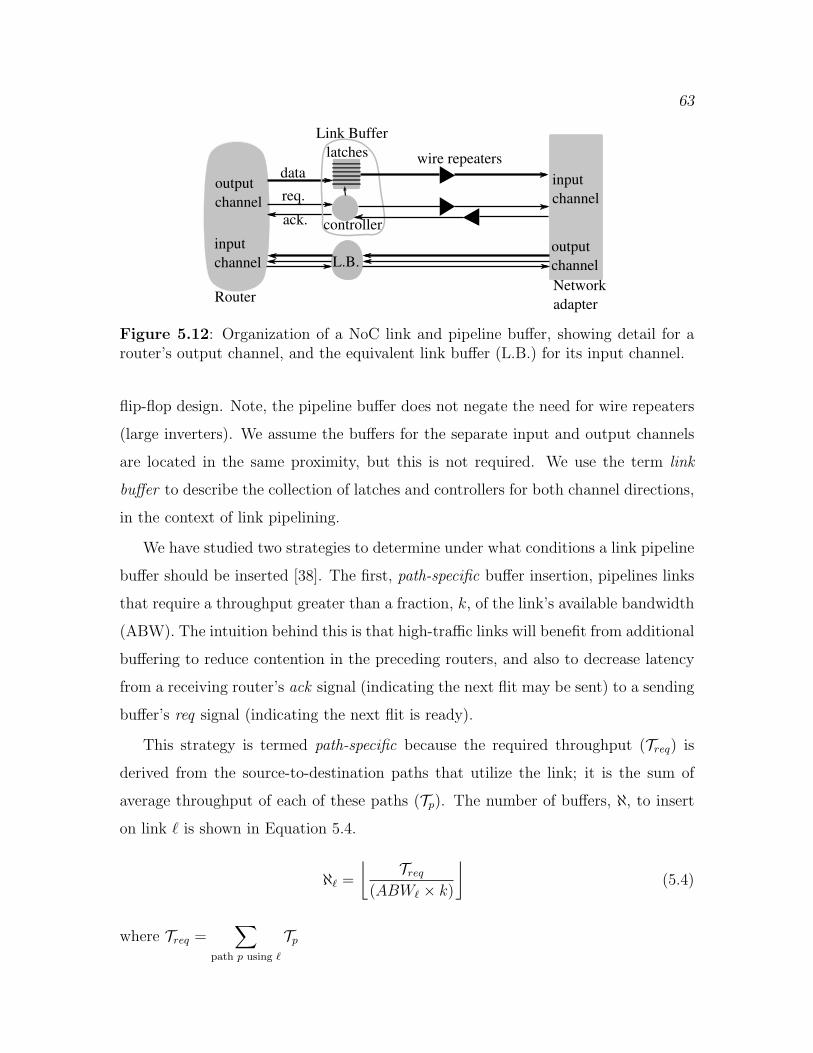
63
req.
ack.
data
latches
controller
Link Buffer
L.B.
wire repeaters
input
channel
output
channel
output
channel
input
channel
RouterNetwork
adapter
Figure 5.12: Organization of a NoC link and pipeline buffer, showing detail for arouter’s output channel, and the equivalent link buffer (L.B.) for its input channel.
flip-flop design. Note, the pipeline buffer does not negate the need for wire repeaters
(large inverters). We assume the buffers for the separate input and output channels
are located in the same proximity, but this is not required. We use the term link
buffer to describe the collection of latches and controllers for both channel directions,
in the context of link pipelining.
We have studied two strategies to determine under what conditions a link pipeline
buffer should be inserted [38]. The first, path-specific buffer insertion, pipelines links
that require a throughput greater than a fraction, k, of the link’s available bandwidth
(ABW). The intuition behind this is that high-traffic links will benefit from additional
buffering to reduce contention in the preceding routers, and also to decrease latency
from a receiving router’s ack signal (indicating the next flit may be sent) to a sending
buffer’s req signal (indicating the next flit is ready).
This strategy is termed path-specific because the required throughput (Treq) is
derived from the source-to-destination paths that utilize the link; it is the sum of
average throughput of each of these paths (Tp). The number of buffers, ℵ, to insert
on link ℓ is shown in Equation 5.4.
ℵℓ =
⌊
Treq
(ABWℓ × k)
⌋
(5.4)
where Treq =∑
path p using ℓ
Tp
64
The value of k is a user-parameter that varies the number of buffers to insert
based on the percentage of link utilization. The required throughput is an input
to ANetGen. The ABW is based on link wirelength, as shorter links have faster
cycle-time.
The second strategy adds pipeline buffers to links with an ABW less than the
throughput of the network adapters. These are called core-throughput matching
buffers (CTMBs). For example, if a network adapter had a maximum throughput of
2Gflits/s (yielding 64Gbits/s with 32-bit flits), and a long link had a handshake delay
of 700 ps (yielding 46Gbits/s), the link would need one CTMB. This is analogous to
wire pipelining for clocked networks when a link fails to meet the timing requirement
derived from the clock period. For async systems, however, this is optional; links
can be slower than the sending or receiving component and don’t have to meet the
“clock period.” The intuition driving this strategy is to make sure cores are never
slowed down by a wire delay in sending or receiving a flit. Even paths with low
average bandwidth will send a series of flits one after another, and benefit from the
increased link bandwidth. This advantage may or may not be worth the additional
power overhead of the buffers, depending on system requirements and communication
properties.
These strategies are incorporated into the topology and placement methodology. If
these options are enabled during simulated annealing, buffers are added to a topology
that has a better partial fitness than the current topology, prior to placement and full
fitness evaluation. For every link, CTMBs are first inserted if its wire delay reduces
throughput to less than that of a network adapter’s. The path-specific buffers are
inserted next if the CTMBs did not already add sufficient pipeline stages. This
requires the weight (wij) for each link based on average throughput, as calculated
by the AssignForce routine, and the available bandwidth of the link. The location
of the buffers is set to evenly divide the link’s length between its endpoints. During
placement, however, buffers are treated in the same manner as routers in that they
can move based on forces applied in AssignForce. If buffers fall within the boundary
of an IP block, and hard IP is used, the same de-overlap process applies as for routers,

65
but buffers are the last to be expelled from the IP blocks, after all routers.
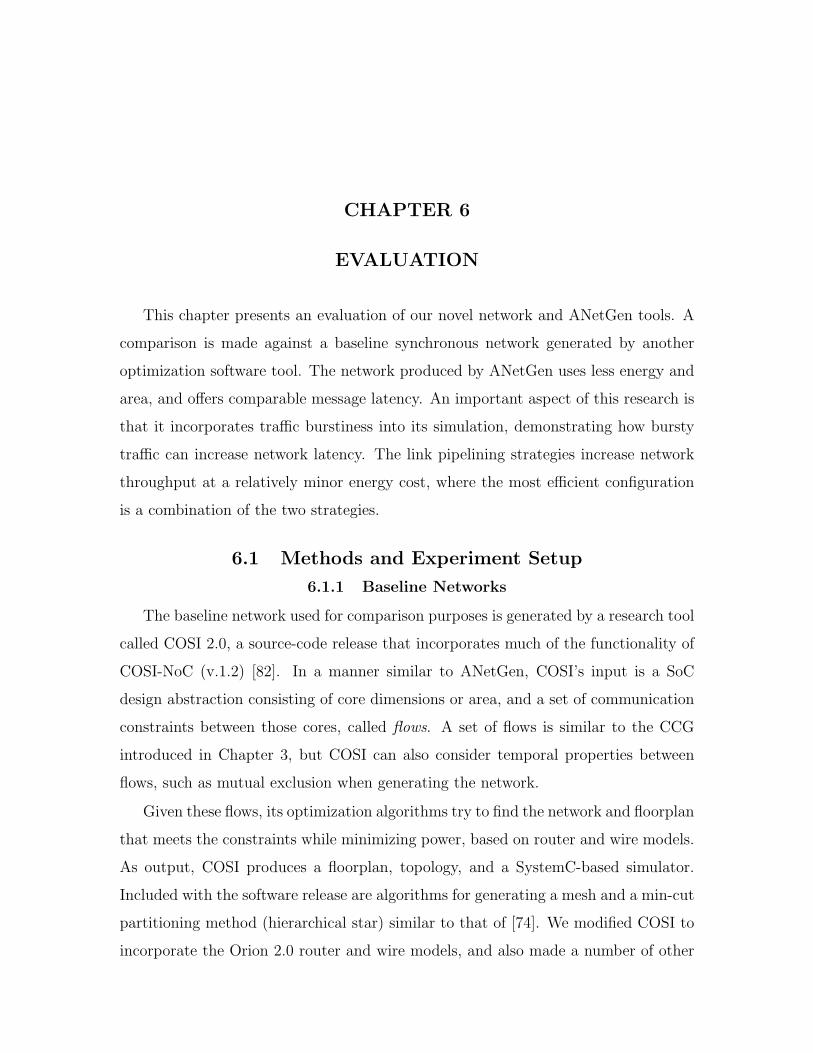
CHAPTER 6
EVALUATION
This chapter presents an evaluation of our novel network and ANetGen tools. A
comparison is made against a baseline synchronous network generated by another
optimization software tool. The network produced by ANetGen uses less energy and
area, and offers comparable message latency. An important aspect of this research is
that it incorporates traffic burstiness into its simulation, demonstrating how bursty
traffic can increase network latency. The link pipelining strategies increase network
throughput at a relatively minor energy cost, where the most efficient configuration
is a combination of the two strategies.
6.1 Methods and Experiment Setup
6.1.1 Baseline Networks
The baseline network used for comparison purposes is generated by a research tool
called COSI 2.0, a source-code release that incorporates much of the functionality of
COSI-NoC (v.1.2) [82]. In a manner similar to ANetGen, COSI’s input is a SoC
design abstraction consisting of core dimensions or area, and a set of communication
constraints between those cores, called flows. A set of flows is similar to the CCG
introduced in Chapter 3, but COSI can also consider temporal properties between
flows, such as mutual exclusion when generating the network.
Given these flows, its optimization algorithms try to find the network and floorplan
that meets the constraints while minimizing power, based on router and wire models.
As output, COSI produces a floorplan, topology, and a SystemC-based simulator.
Included with the software release are algorithms for generating a mesh and a min-cut
partitioning method (hierarchical star) similar to that of [74]. We modified COSI to
incorporate the Orion 2.0 router and wire models, and also made a number of other
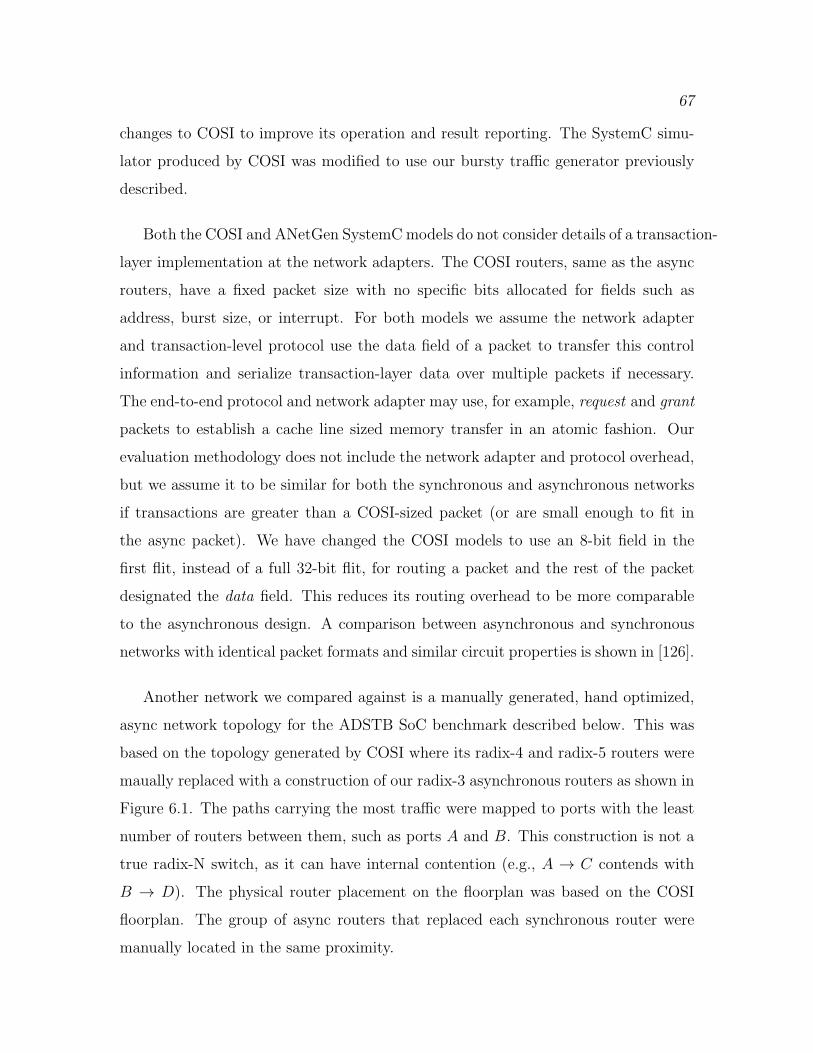
67
changes to COSI to improve its operation and result reporting. The SystemC simu-
lator produced by COSI was modified to use our bursty traffic generator previously
described.
Both the COSI and ANetGen SystemCmodels do not consider details of a transaction-
layer implementation at the network adapters. The COSI routers, same as the async
routers, have a fixed packet size with no specific bits allocated for fields such as
address, burst size, or interrupt. For both models we assume the network adapter
and transaction-level protocol use the data field of a packet to transfer this control
information and serialize transaction-layer data over multiple packets if necessary.
The end-to-end protocol and network adapter may use, for example, request and grant
packets to establish a cache line sized memory transfer in an atomic fashion. Our
evaluation methodology does not include the network adapter and protocol overhead,
but we assume it to be similar for both the synchronous and asynchronous networks
if transactions are greater than a COSI-sized packet (or are small enough to fit in
the async packet). We have changed the COSI models to use an 8-bit field in the
first flit, instead of a full 32-bit flit, for routing a packet and the rest of the packet
designated the data field. This reduces its routing overhead to be more comparable
to the asynchronous design. A comparison between asynchronous and synchronous
networks with identical packet formats and similar circuit properties is shown in [126].
Another network we compared against is a manually generated, hand optimized,
async network topology for the ADSTB SoC benchmark described below. This was
based on the topology generated by COSI where its radix-4 and radix-5 routers were
maually replaced with a construction of our radix-3 asynchronous routers as shown in
Figure 6.1. The paths carrying the most traffic were mapped to ports with the least
number of routers between them, such as ports A and B. This construction is not a
true radix-N switch, as it can have internal contention (e.g., A → C contends with
B → D). The physical router placement on the floorplan was based on the COSI
floorplan. The group of async routers that replaced each synchronous router were
manually located in the same proximity.
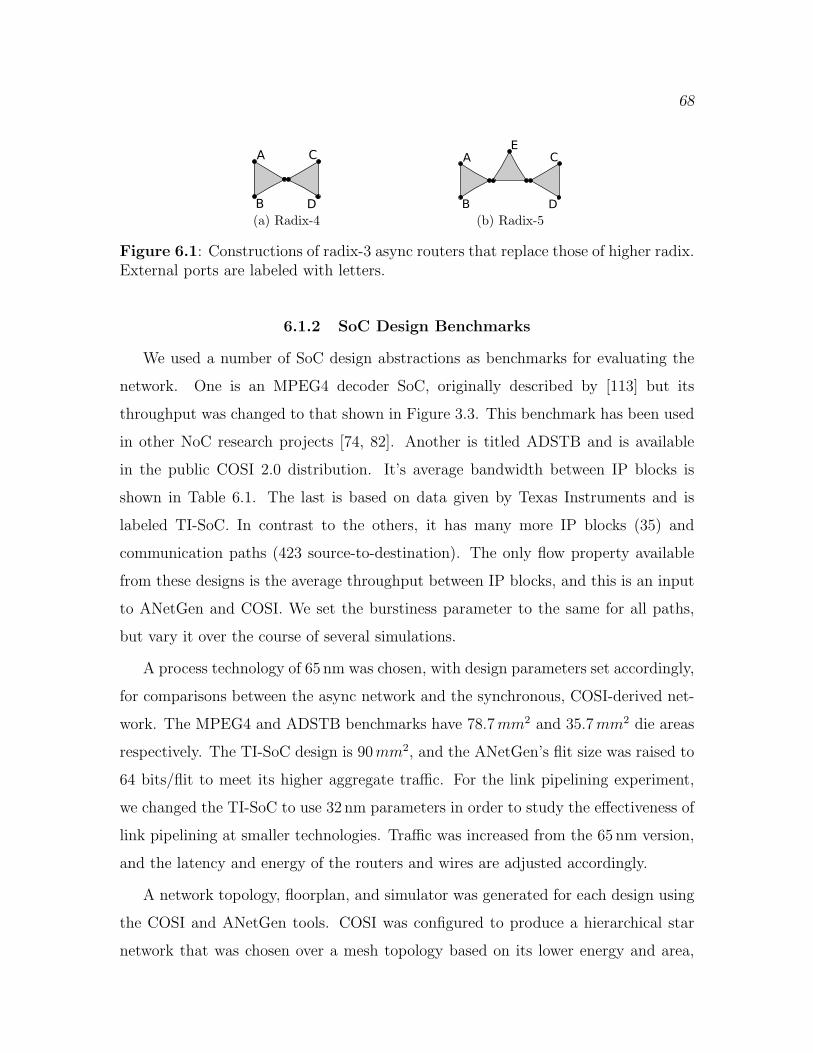
68
�
�
�
�
(a) Radix-4
�
�
�
�
�
(b) Radix-5
Figure 6.1: Constructions of radix-3 async routers that replace those of higher radix.External ports are labeled with letters.
6.1.2 SoC Design Benchmarks
We used a number of SoC design abstractions as benchmarks for evaluating the
network. One is an MPEG4 decoder SoC, originally described by [113] but its
throughput was changed to that shown in Figure 3.3. This benchmark has been used
in other NoC research projects [74, 82]. Another is titled ADSTB and is available
in the public COSI 2.0 distribution. It’s average bandwidth between IP blocks is
shown in Table 6.1. The last is based on data given by Texas Instruments and is
labeled TI-SoC. In contrast to the others, it has many more IP blocks (35) and
communication paths (423 source-to-destination). The only flow property available
from these designs is the average throughput between IP blocks, and this is an input
to ANetGen and COSI. We set the burstiness parameter to the same for all paths,
but vary it over the course of several simulations.
A process technology of 65 nm was chosen, with design parameters set accordingly,
for comparisons between the async network and the synchronous, COSI-derived net-
work. The MPEG4 and ADSTB benchmarks have 78.7mm2 and 35.7mm2 die areas
respectively. The TI-SoC design is 90mm2, and the ANetGen’s flit size was raised to
64 bits/flit to meet its higher aggregate traffic. For the link pipelining experiment,
we changed the TI-SoC to use 32 nm parameters in order to study the effectiveness of
link pipelining at smaller technologies. Traffic was increased from the 65 nm version,
and the latency and energy of the routers and wires are adjusted accordingly.
A network topology, floorplan, and simulator was generated for each design using
the COSI and ANetGen tools. COSI was configured to produce a hierarchical star
network that was chosen over a mesh topology based on its lower energy and area,
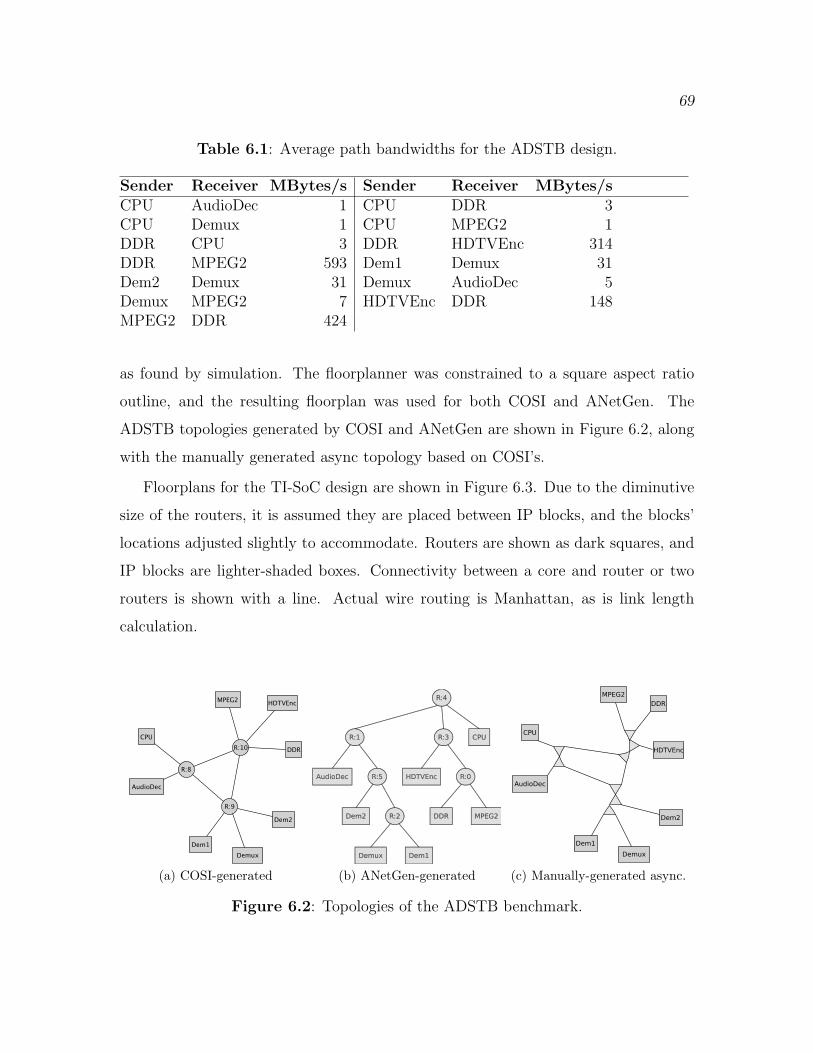
69
Table 6.1: Average path bandwidths for the ADSTB design.
Sender Receiver MBytes/s Sender Receiver MBytes/sCPU AudioDec 1 CPU DDR 3CPU Demux 1 CPU MPEG2 1DDR CPU 3 DDR HDTVEnc 314DDR MPEG2 593 Dem1 Demux 31Dem2 Demux 31 Demux AudioDec 5Demux MPEG2 7 HDTVEnc DDR 148MPEG2 DDR 424
as found by simulation. The floorplanner was constrained to a square aspect ratio
outline, and the resulting floorplan was used for both COSI and ANetGen. The
ADSTB topologies generated by COSI and ANetGen are shown in Figure 6.2, along
with the manually generated async topology based on COSI’s.
Floorplans for the TI-SoC design are shown in Figure 6.3. Due to the diminutive
size of the routers, it is assumed they are placed between IP blocks, and the blocks’
locations adjusted slightly to accommodate. Routers are shown as dark squares, and
IP blocks are lighter-shaded boxes. Connectivity between a core and router or two
routers is shown with a line. Actual wire routing is Manhattan, as is link length
calculation.
(a) COSI-generated (b) ANetGen-generated
��������
AB
��C
��DE
��DF
��D��
�������
�A��F
(c) Manually-generated async.
Figure 6.2: Topologies of the ADSTB benchmark.
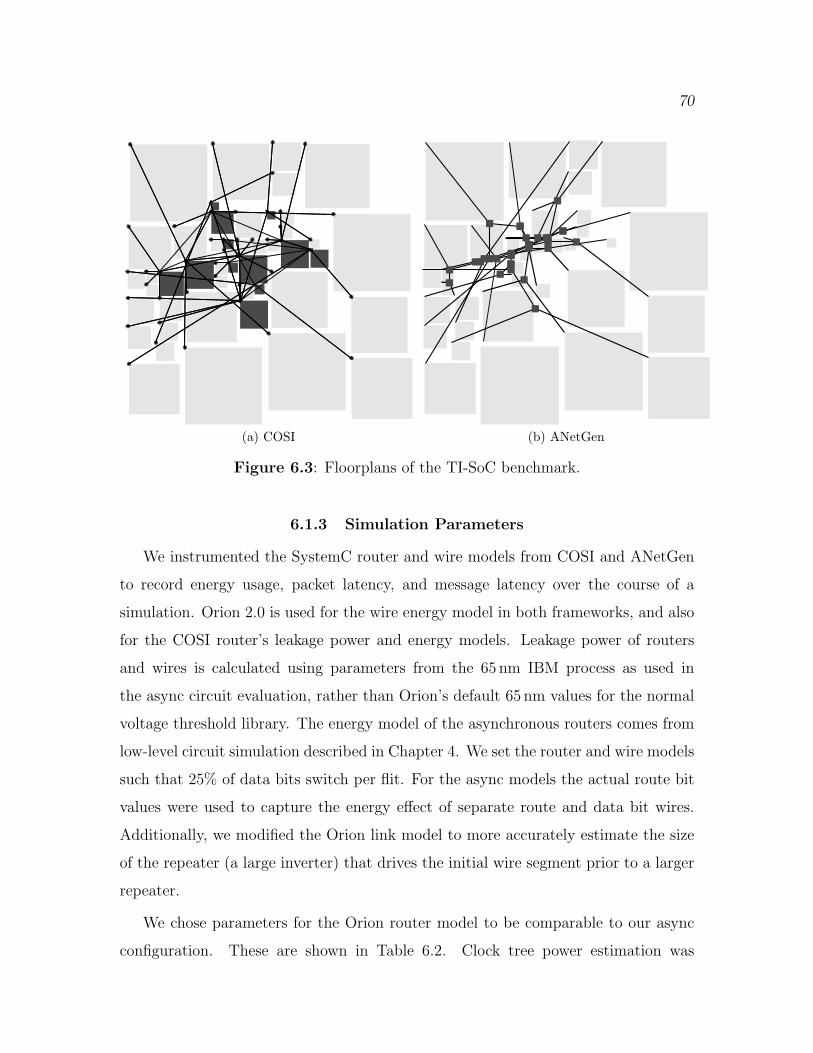
70
(a) COSI (b) ANetGen
Figure 6.3: Floorplans of the TI-SoC benchmark.
6.1.3 Simulation Parameters
We instrumented the SystemC router and wire models from COSI and ANetGen
to record energy usage, packet latency, and message latency over the course of a
simulation. Orion 2.0 is used for the wire energy model in both frameworks, and also
for the COSI router’s leakage power and energy models. Leakage power of routers
and wires is calculated using parameters from the 65 nm IBM process as used in
the async circuit evaluation, rather than Orion’s default 65 nm values for the normal
voltage threshold library. The energy model of the asynchronous routers comes from
low-level circuit simulation described in Chapter 4. We set the router and wire models
such that 25% of data bits switch per flit. For the async models the actual route bit
values were used to capture the energy effect of separate route and data bit wires.
Additionally, we modified the Orion link model to more accurately estimate the size
of the repeater (a large inverter) that drives the initial wire segment prior to a larger
repeater.
We chose parameters for the Orion router model to be comparable to our async
configuration. These are shown in Table 6.2. Clock tree power estimation was
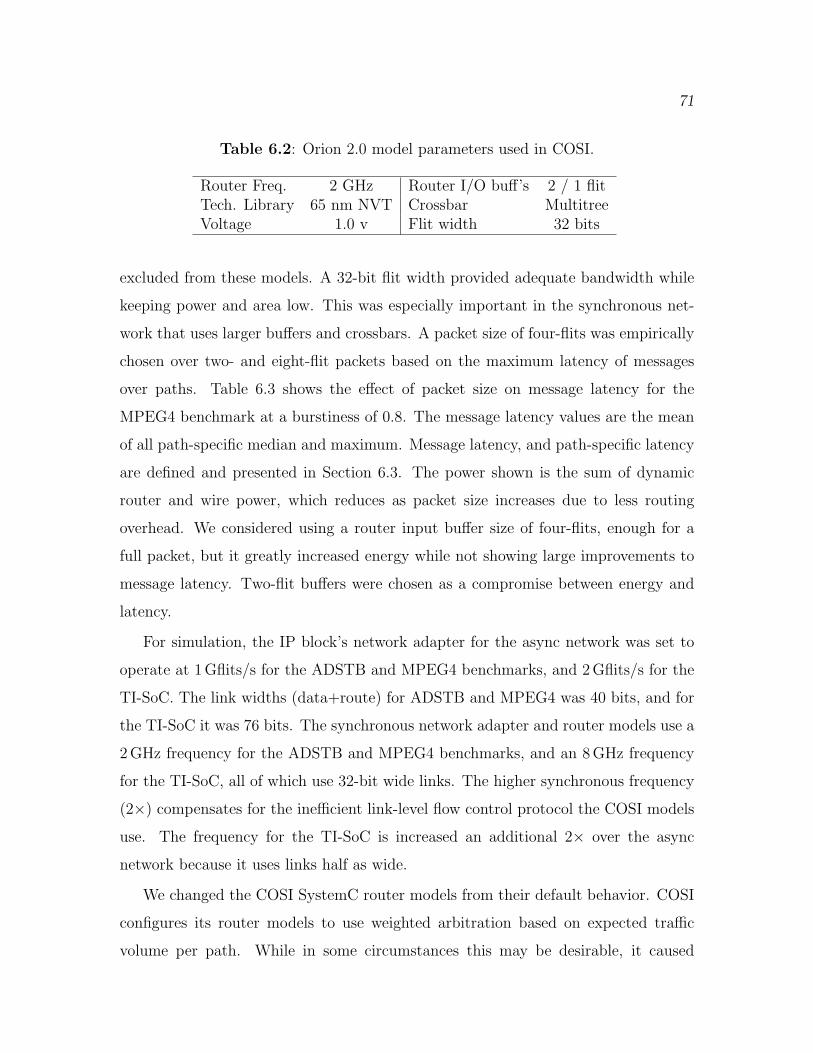
71
Table 6.2: Orion 2.0 model parameters used in COSI.
Router Freq. 2 GHz Router I/O buff’s 2 / 1 flitTech. Library 65 nm NVT Crossbar MultitreeVoltage 1.0 v Flit width 32 bits
excluded from these models. A 32-bit flit width provided adequate bandwidth while
keeping power and area low. This was especially important in the synchronous net-
work that uses larger buffers and crossbars. A packet size of four-flits was empirically
chosen over two- and eight-flit packets based on the maximum latency of messages
over paths. Table 6.3 shows the effect of packet size on message latency for the
MPEG4 benchmark at a burstiness of 0.8. The message latency values are the mean
of all path-specific median and maximum. Message latency, and path-specific latency
are defined and presented in Section 6.3. The power shown is the sum of dynamic
router and wire power, which reduces as packet size increases due to less routing
overhead. We considered using a router input buffer size of four-flits, enough for a
full packet, but it greatly increased energy while not showing large improvements to
message latency. Two-flit buffers were chosen as a compromise between energy and
latency.
For simulation, the IP block’s network adapter for the async network was set to
operate at 1Gflits/s for the ADSTB and MPEG4 benchmarks, and 2Gflits/s for the
TI-SoC. The link widths (data+route) for ADSTB and MPEG4 was 40 bits, and for
the TI-SoC it was 76 bits. The synchronous network adapter and router models use a
2GHz frequency for the ADSTB and MPEG4 benchmarks, and an 8GHz frequency
for the TI-SoC, all of which use 32-bit wide links. The higher synchronous frequency
(2×) compensates for the inefficient link-level flow control protocol the COSI models
use. The frequency for the TI-SoC is increased an additional 2× over the async
network because it uses links half as wide.
We changed the COSI SystemC router models from their default behavior. COSI
configures its router models to use weighted arbitration based on expected traffic
volume per path. While in some circumstances this may be desirable, it caused
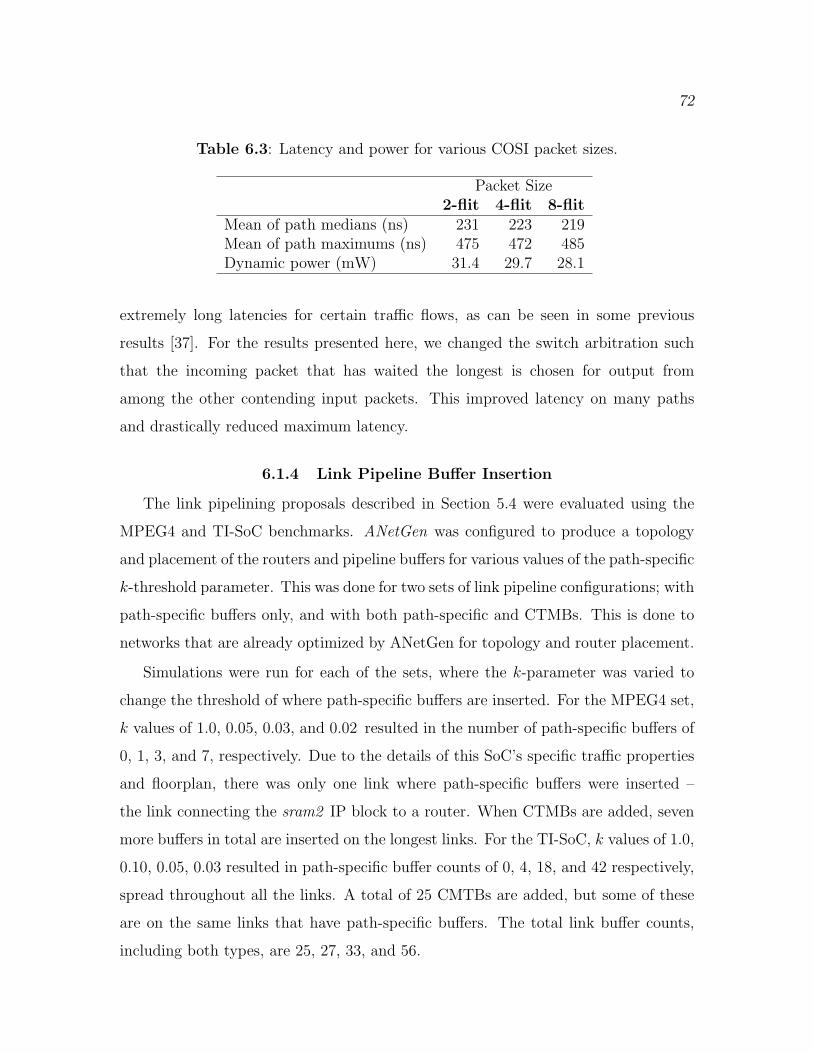
72
Table 6.3: Latency and power for various COSI packet sizes.
Packet Size2-flit 4-flit 8-flit
Mean of path medians (ns) 231 223 219Mean of path maximums (ns) 475 472 485Dynamic power (mW) 31.4 29.7 28.1
extremely long latencies for certain traffic flows, as can be seen in some previous
results [37]. For the results presented here, we changed the switch arbitration such
that the incoming packet that has waited the longest is chosen for output from
among the other contending input packets. This improved latency on many paths
and drastically reduced maximum latency.
6.1.4 Link Pipeline Buffer Insertion
The link pipelining proposals described in Section 5.4 were evaluated using the
MPEG4 and TI-SoC benchmarks. ANetGen was configured to produce a topology
and placement of the routers and pipeline buffers for various values of the path-specific
k-threshold parameter. This was done for two sets of link pipeline configurations; with
path-specific buffers only, and with both path-specific and CTMBs. This is done to
networks that are already optimized by ANetGen for topology and router placement.
Simulations were run for each of the sets, where the k-parameter was varied to
change the threshold of where path-specific buffers are inserted. For the MPEG4 set,
k values of 1.0, 0.05, 0.03, and 0.02 resulted in the number of path-specific buffers of
0, 1, 3, and 7, respectively. Due to the details of this SoC’s specific traffic properties
and floorplan, there was only one link where path-specific buffers were inserted –
the link connecting the sram2 IP block to a router. When CTMBs are added, seven
more buffers in total are inserted on the longest links. For the TI-SoC, k values of 1.0,
0.10, 0.05, 0.03 resulted in path-specific buffer counts of 0, 4, 18, and 42 respectively,
spread throughout all the links. A total of 25 CMTBs are added, but some of these
are on the same links that have path-specific buffers. The total link buffer counts,
including both types, are 25, 27, 33, and 56.
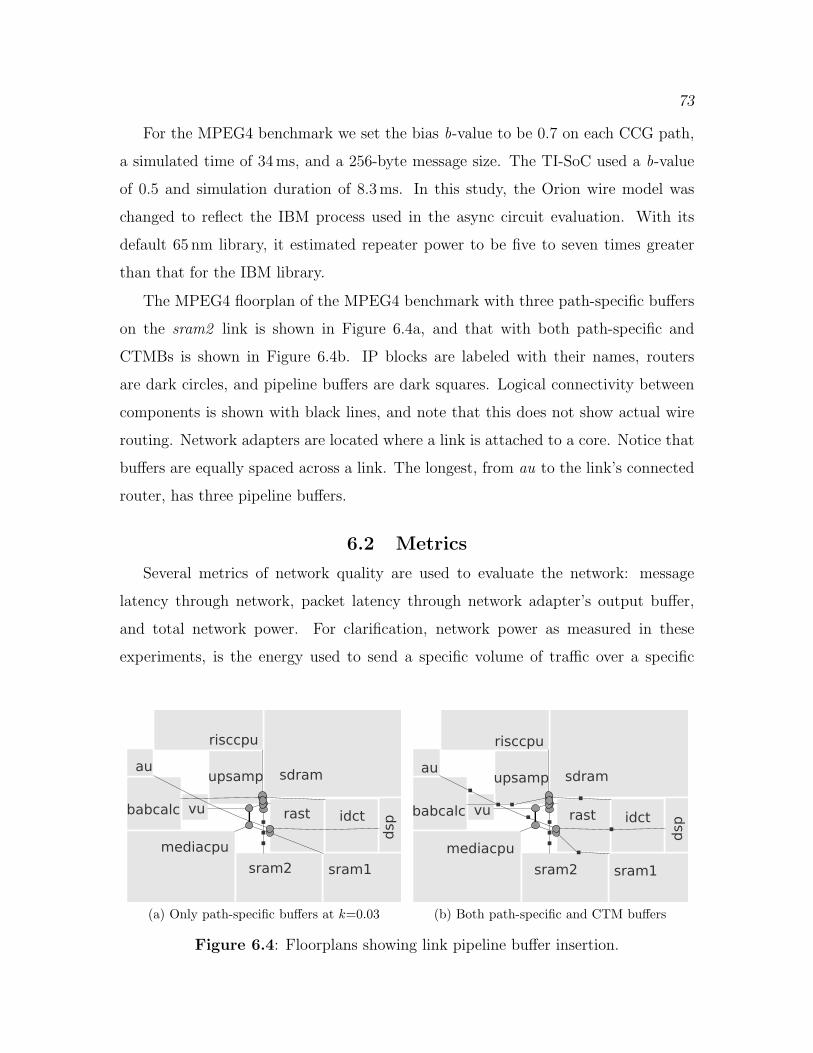
73
For the MPEG4 benchmark we set the bias b-value to be 0.7 on each CCG path,
a simulated time of 34ms, and a 256-byte message size. The TI-SoC used a b-value
of 0.5 and simulation duration of 8.3ms. In this study, the Orion wire model was
changed to reflect the IBM process used in the async circuit evaluation. With its
default 65 nm library, it estimated repeater power to be five to seven times greater
than that for the IBM library.
The MPEG4 floorplan of the MPEG4 benchmark with three path-specific buffers
on the sram2 link is shown in Figure 6.4a, and that with both path-specific and
CTMBs is shown in Figure 6.4b. IP blocks are labeled with their names, routers
are dark circles, and pipeline buffers are dark squares. Logical connectivity between
components is shown with black lines, and note that this does not show actual wire
routing. Network adapters are located where a link is attached to a core. Notice that
buffers are equally spaced across a link. The longest, from au to the link’s connected
router, has three pipeline buffers.
6.2 Metrics
Several metrics of network quality are used to evaluate the network: message
latency through network, packet latency through network adapter’s output buffer,
and total network power. For clarification, network power as measured in these
experiments, is the energy used to send a specific volume of traffic over a specific
��
�������
�����A
BC�����
D��A
D�����
��D�B
�D�BE�D�BF
��
����B�
(a) Only path-specific buffers at k=0.03
��
�������
�����A
BC�����
D��A
D�����
��D�B
�D�BE�D�BF
��
����B�
(b) Both path-specific and CTM buffers
Figure 6.4: Floorplans showing link pipeline buffer insertion.
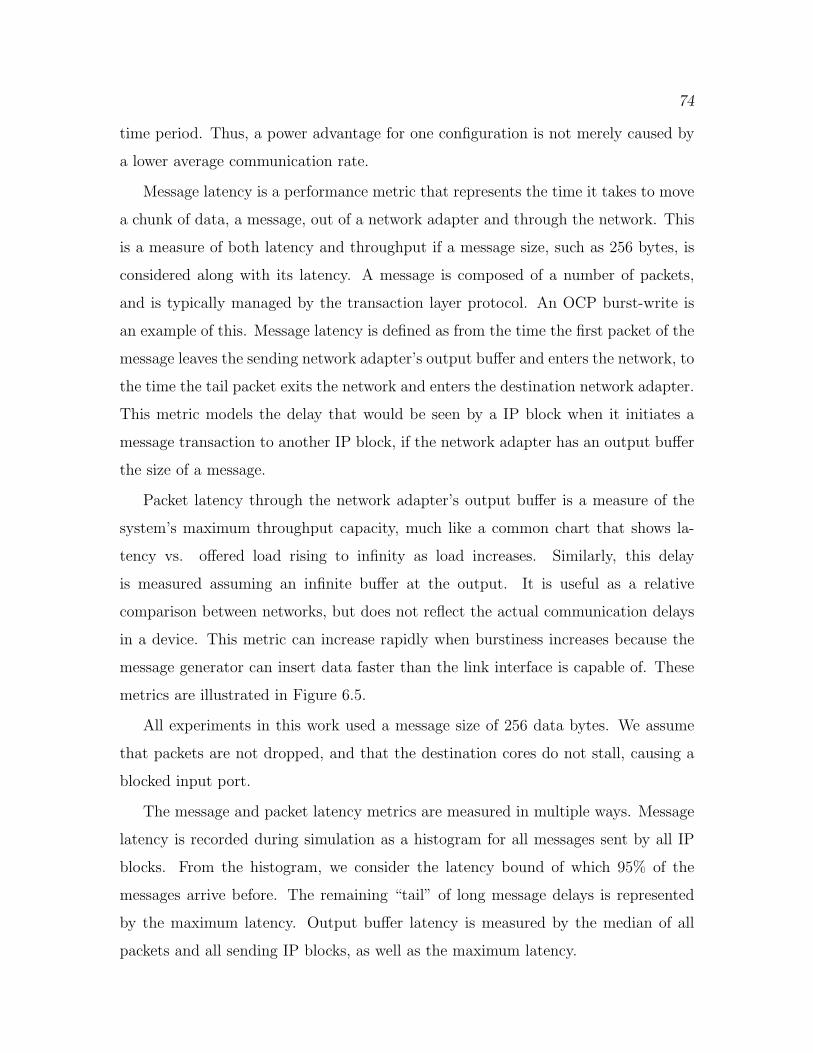
74
time period. Thus, a power advantage for one configuration is not merely caused by
a lower average communication rate.
Message latency is a performance metric that represents the time it takes to move
a chunk of data, a message, out of a network adapter and through the network. This
is a measure of both latency and throughput if a message size, such as 256 bytes, is
considered along with its latency. A message is composed of a number of packets,
and is typically managed by the transaction layer protocol. An OCP burst-write is
an example of this. Message latency is defined as from the time the first packet of the
message leaves the sending network adapter’s output buffer and enters the network, to
the time the tail packet exits the network and enters the destination network adapter.
This metric models the delay that would be seen by a IP block when it initiates a
message transaction to another IP block, if the network adapter has an output buffer
the size of a message.
Packet latency through the network adapter’s output buffer is a measure of the
system’s maximum throughput capacity, much like a common chart that shows la-
tency vs. offered load rising to infinity as load increases. Similarly, this delay
is measured assuming an infinite buffer at the output. It is useful as a relative
comparison between networks, but does not reflect the actual communication delays
in a device. This metric can increase rapidly when burstiness increases because the
message generator can insert data faster than the link interface is capable of. These
metrics are illustrated in Figure 6.5.
All experiments in this work used a message size of 256 data bytes. We assume
that packets are not dropped, and that the destination cores do not stall, causing a
blocked input port.
The message and packet latency metrics are measured in multiple ways. Message
latency is recorded during simulation as a histogram for all messages sent by all IP
blocks. From the histogram, we consider the latency bound of which 95% of the
messages arrive before. The remaining “tail” of long message delays is represented
by the maximum latency. Output buffer latency is measured by the median of all
packets and all sending IP blocks, as well as the maximum latency.
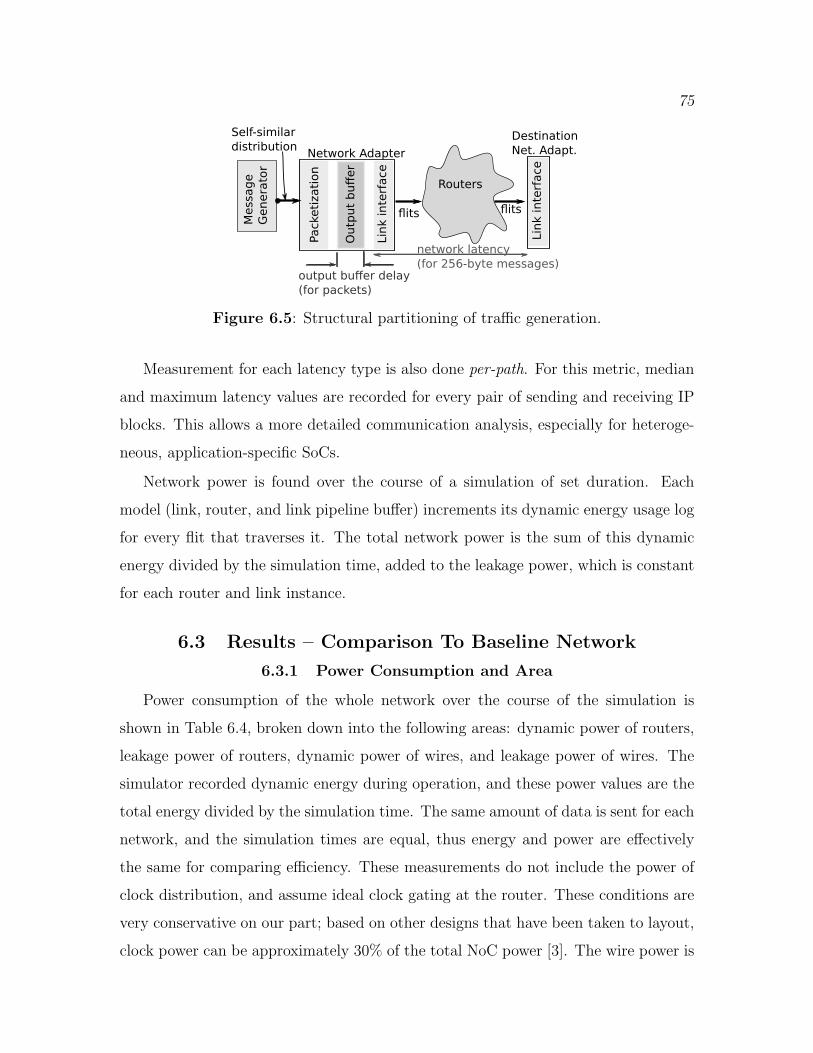
75
�������
������A�
B�CD�EF�EA�
����������
�E�D�E�����C�
������E�E���
�E��E��EA�
�E�
�A����
�E�
�� A�D�!�����
�E�D�E�����C�
"��E��EA�
��#�!���#
A��������������$
%�A����CD��&
�� A�D�����C$
%�A��'()��$����������&
Figure 6.5: Structural partitioning of traffic generation.
Measurement for each latency type is also done per-path. For this metric, median
and maximum latency values are recorded for every pair of sending and receiving IP
blocks. This allows a more detailed communication analysis, especially for heteroge-
neous, application-specific SoCs.
Network power is found over the course of a simulation of set duration. Each
model (link, router, and link pipeline buffer) increments its dynamic energy usage log
for every flit that traverses it. The total network power is the sum of this dynamic
energy divided by the simulation time, added to the leakage power, which is constant
for each router and link instance.
6.3 Results – Comparison To Baseline Network
6.3.1 Power Consumption and Area
Power consumption of the whole network over the course of the simulation is
shown in Table 6.4, broken down into the following areas: dynamic power of routers,
leakage power of routers, dynamic power of wires, and leakage power of wires. The
simulator recorded dynamic energy during operation, and these power values are the
total energy divided by the simulation time. The same amount of data is sent for each
network, and the simulation times are equal, thus energy and power are effectively
the same for comparing efficiency. These measurements do not include the power of
clock distribution, and assume ideal clock gating at the router. These conditions are
very conservative on our part; based on other designs that have been taken to layout,
clock power can be approximately 30% of the total NoC power [3]. The wire power is
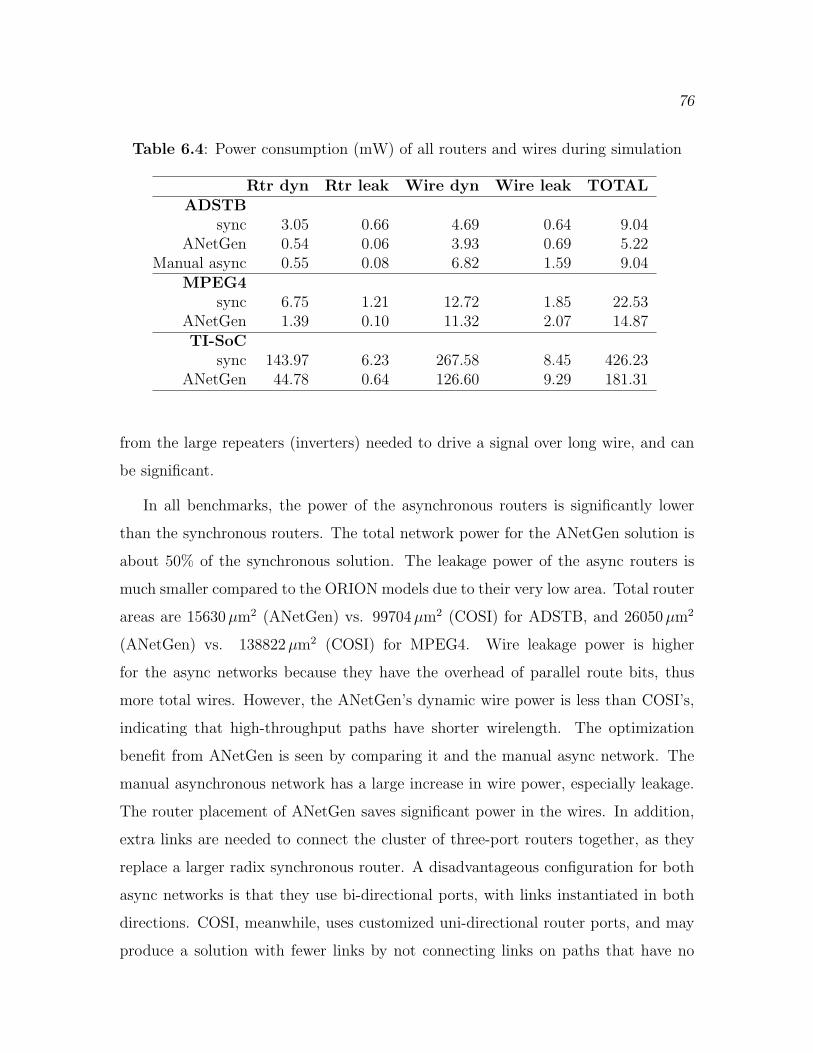
76
Table 6.4: Power consumption (mW) of all routers and wires during simulation
Rtr dyn Rtr leak Wire dyn Wire leak TOTALADSTB
sync 3.05 0.66 4.69 0.64 9.04ANetGen 0.54 0.06 3.93 0.69 5.22
Manual async 0.55 0.08 6.82 1.59 9.04MPEG4
sync 6.75 1.21 12.72 1.85 22.53ANetGen 1.39 0.10 11.32 2.07 14.87TI-SoC
sync 143.97 6.23 267.58 8.45 426.23ANetGen 44.78 0.64 126.60 9.29 181.31
from the large repeaters (inverters) needed to drive a signal over long wire, and can
be significant.
In all benchmarks, the power of the asynchronous routers is significantly lower
than the synchronous routers. The total network power for the ANetGen solution is
about 50% of the synchronous solution. The leakage power of the async routers is
much smaller compared to the ORION models due to their very low area. Total router
areas are 15630µm2 (ANetGen) vs. 99704µm2 (COSI) for ADSTB, and 26050µm2
(ANetGen) vs. 138822µm2 (COSI) for MPEG4. Wire leakage power is higher
for the async networks because they have the overhead of parallel route bits, thus
more total wires. However, the ANetGen’s dynamic wire power is less than COSI’s,
indicating that high-throughput paths have shorter wirelength. The optimization
benefit from ANetGen is seen by comparing it and the manual async network. The
manual asynchronous network has a large increase in wire power, especially leakage.
The router placement of ANetGen saves significant power in the wires. In addition,
extra links are needed to connect the cluster of three-port routers together, as they
replace a larger radix synchronous router. A disadvantageous configuration for both
async networks is that they use bi-directional ports, with links instantiated in both
directions. COSI, meanwhile, uses customized uni-directional router ports, and may
produce a solution with fewer links by not connecting links on paths that have no
77
traffic. The problem with COSI’s arrangement is that there is no possibility for
communication back to a sending node, which may be required for implementing an
end-to-end network protocol.
Another comparison is the energy-per-flit that each type of router uses, and is
shown in Figure 6.6. The ANetGen router has airity between a 2×2 and 3×3 Orion
router, as it has three inputs and three outputs, but only two output possibilities
for each input. The energy value of the ANetGen asynchronous router includes the
routing bits, while the Orion energy values do not consider the packet’s required
header flit energy overhead. The energy-per-flit is much lower for our design than
what the Orion models predict for traditional synchronous routers. However, Orion’s
process technology estimates do not match well to the IBM process used in the async
router evaluation, as described in Section 6.1.4. More investigation is needed to
more accurately quantify the energy advantage of this async design. However, other
research suggests it is indeed significant. A router, very similar to the one presented
here, has 82% less energy-per-packet than a comparable synchrounous router, based
on a circuit-level evaluation of each [47].
In summary, the significant energy reduction of the async network comes from
both router and wire improvements. However, these results indicate further power
improvements should come from more efficient interrouter channel implementations,
as the wiring resources consume the majority of the power. Wirelength minimization,
especially when very low-energy routers are used, is critical. As such, with our async
Figure 6.6: Energy-per-flit for ANetGen and Orion routers of various radix.
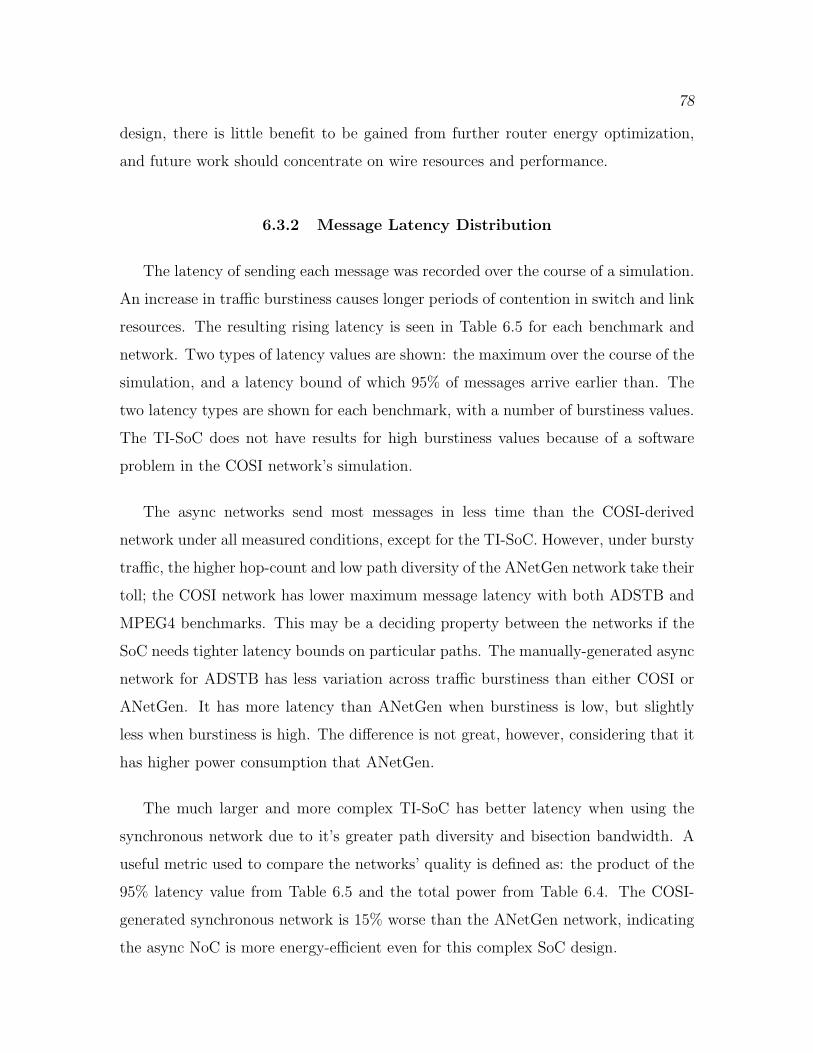
78
design, there is little benefit to be gained from further router energy optimization,
and future work should concentrate on wire resources and performance.
6.3.2 Message Latency Distribution
The latency of sending each message was recorded over the course of a simulation.
An increase in traffic burstiness causes longer periods of contention in switch and link
resources. The resulting rising latency is seen in Table 6.5 for each benchmark and
network. Two types of latency values are shown: the maximum over the course of the
simulation, and a latency bound of which 95% of messages arrive earlier than. The
two latency types are shown for each benchmark, with a number of burstiness values.
The TI-SoC does not have results for high burstiness values because of a software
problem in the COSI network’s simulation.
The async networks send most messages in less time than the COSI-derived
network under all measured conditions, except for the TI-SoC. However, under bursty
traffic, the higher hop-count and low path diversity of the ANetGen network take their
toll; the COSI network has lower maximum message latency with both ADSTB and
MPEG4 benchmarks. This may be a deciding property between the networks if the
SoC needs tighter latency bounds on particular paths. The manually-generated async
network for ADSTB has less variation across traffic burstiness than either COSI or
ANetGen. It has more latency than ANetGen when burstiness is low, but slightly
less when burstiness is high. The difference is not great, however, considering that it
has higher power consumption that ANetGen.
The much larger and more complex TI-SoC has better latency when using the
synchronous network due to it’s greater path diversity and bisection bandwidth. A
useful metric used to compare the networks’ quality is defined as: the product of the
95% latency value from Table 6.5 and the total power from Table 6.4. The COSI-
generated synchronous network is 15% worse than the ANetGen network, indicating
the async NoC is more energy-efficient even for this complex SoC design.
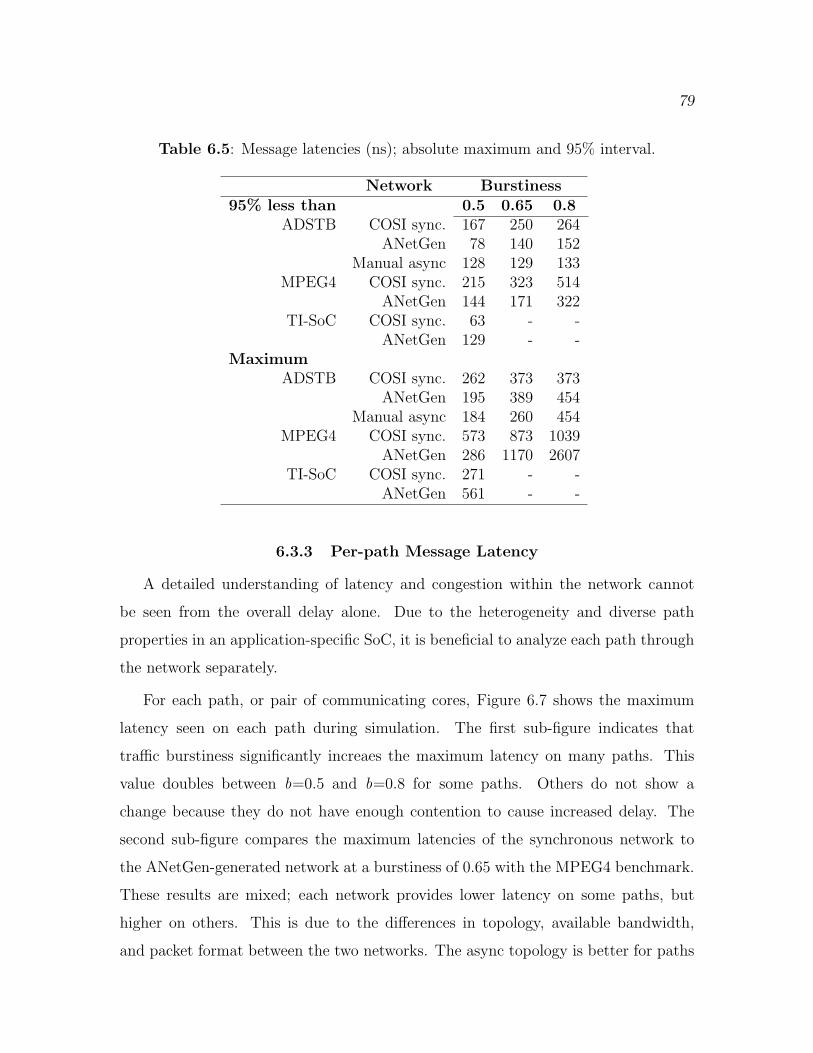
79
Table 6.5: Message latencies (ns); absolute maximum and 95% interval.
Network Burstiness95% less than 0.5 0.65 0.8
ADSTB COSI sync. 167 250 264ANetGen 78 140 152
Manual async 128 129 133MPEG4 COSI sync. 215 323 514
ANetGen 144 171 322TI-SoC COSI sync. 63 - -
ANetGen 129 - -Maximum
ADSTB COSI sync. 262 373 373ANetGen 195 389 454
Manual async 184 260 454MPEG4 COSI sync. 573 873 1039
ANetGen 286 1170 2607TI-SoC COSI sync. 271 - -
ANetGen 561 - -
6.3.3 Per-path Message Latency
A detailed understanding of latency and congestion within the network cannot
be seen from the overall delay alone. Due to the heterogeneity and diverse path
properties in an application-specific SoC, it is beneficial to analyze each path through
the network separately.
For each path, or pair of communicating cores, Figure 6.7 shows the maximum
latency seen on each path during simulation. The first sub-figure indicates that
traffic burstiness significantly increaes the maximum latency on many paths. This
value doubles between b=0.5 and b=0.8 for some paths. Others do not show a
change because they do not have enough contention to cause increased delay. The
second sub-figure compares the maximum latencies of the synchronous network to
the ANetGen-generated network at a burstiness of 0.65 with the MPEG4 benchmark.
These results are mixed; each network provides lower latency on some paths, but
higher on others. This is due to the differences in topology, available bandwidth,
and packet format between the two networks. The async topology is better for paths
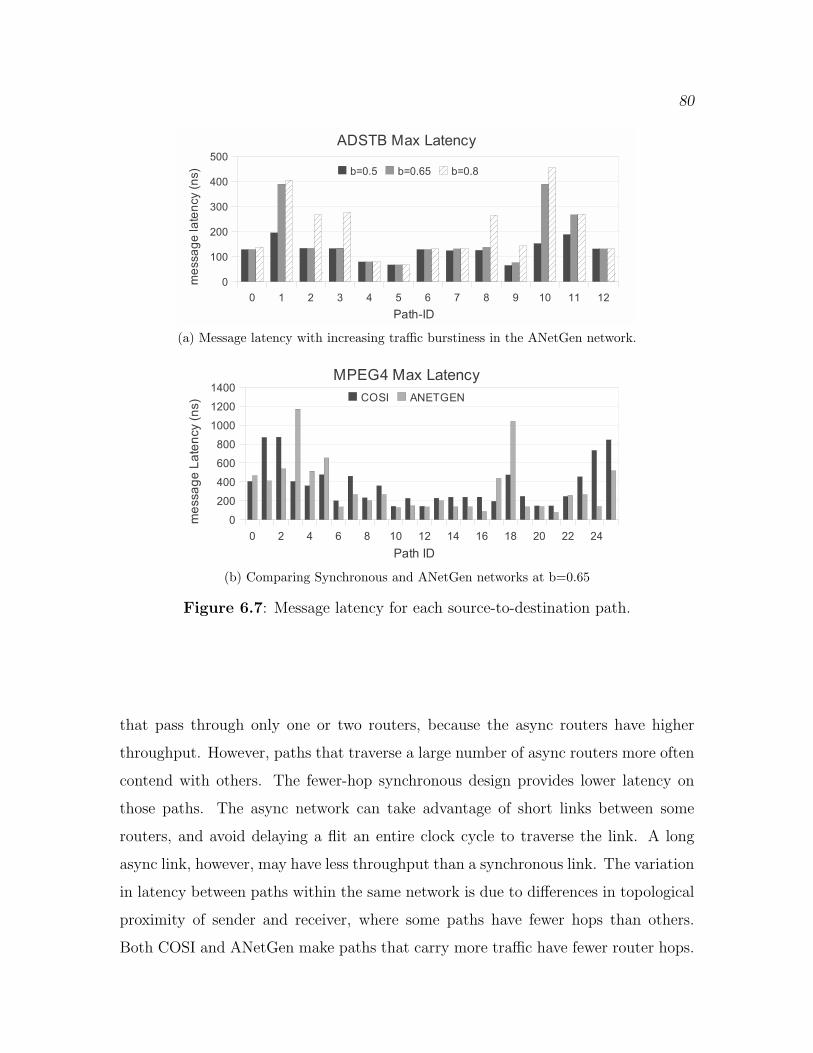
80
(a) Message latency with increasing traffic burstiness in the ANetGen network.
(b) Comparing Synchronous and ANetGen networks at b=0.65
Figure 6.7: Message latency for each source-to-destination path.
that pass through only one or two routers, because the async routers have higher
throughput. However, paths that traverse a large number of async routers more often
contend with others. The fewer-hop synchronous design provides lower latency on
those paths. The async network can take advantage of short links between some
routers, and avoid delaying a flit an entire clock cycle to traverse the link. A long
async link, however, may have less throughput than a synchronous link. The variation
in latency between paths within the same network is due to differences in topological
proximity of sender and receiver, where some paths have fewer hops than others.
Both COSI and ANetGen make paths that carry more traffic have fewer router hops.
81
6.3.4 Output Buffer Delay
Another metric of measuring the network performance is the output buffer delay,
which is defined as the time from when a message from the traffic generator is formed
into packets and placed in the output buffer, to the time a packet exits the network
adapter and enters the network. The buffer entry time is set for each packet by the
traffic generator when it pushes an entire message to the buffer at once. Therefore, the
last packet of a 64-packet message would have a minimum delay of 64 sender-cycles.
The traffic generator operates detached from the network flow control so an infinite
buffer is needed to accept its traffic at any time. The network then empties that
buffer as quickly as possible. As burstiness increases, the additional delay comes not
only from contention within the network, but also from the local traffic generator’s
attempt to send more data in a shorter time period, possibly exceeding the network’s
maximum bandwidth. This grows the buffer more rapidly, increasing delay, even if
the network was uncongested. The results in Table 6.6 show that the async networks
consistently have a lower delay for both median and maximum values. This is provided
by the higher available bandwidth within the async network.
Table 6.6: Output buffer packet delay (ns).
Network BurstinessMedian 0.5 0.65 0.8
ADSTB COSI sync. 58 170 127367ANetGen 38 55 33388
Manual async 62 149 158584MPEG4 COSI sync. 53.5 108 99176
ANetGen 43 62 25789Maximum
ADSTB COSI sync. 689 142066 945523ANetGen 313 34513 430515
Manual async 1174 231168 1.2e6MPEG4 COSI sync. 821 135506 889027
ANetGen 433 32298 416332
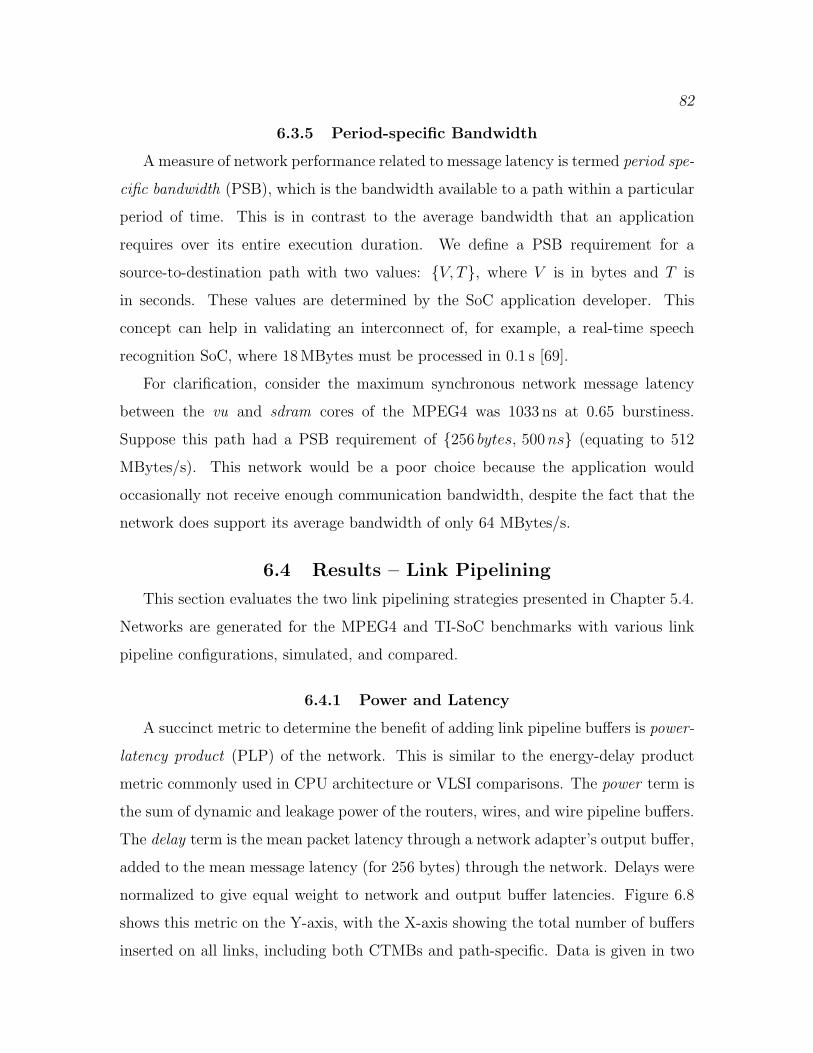
82
6.3.5 Period-specific Bandwidth
Ameasure of network performance related to message latency is termed period spe-
cific bandwidth (PSB), which is the bandwidth available to a path within a particular
period of time. This is in contrast to the average bandwidth that an application
requires over its entire execution duration. We define a PSB requirement for a
source-to-destination path with two values: {V, T}, where V is in bytes and T is
in seconds. These values are determined by the SoC application developer. This
concept can help in validating an interconnect of, for example, a real-time speech
recognition SoC, where 18MBytes must be processed in 0.1 s [69].
For clarification, consider the maximum synchronous network message latency
between the vu and sdram cores of the MPEG4 was 1033 ns at 0.65 burstiness.
Suppose this path had a PSB requirement of {256 bytes, 500ns} (equating to 512
MBytes/s). This network would be a poor choice because the application would
occasionally not receive enough communication bandwidth, despite the fact that the
network does support its average bandwidth of only 64 MBytes/s.
6.4 Results – Link Pipelining
This section evaluates the two link pipelining strategies presented in Chapter 5.4.
Networks are generated for the MPEG4 and TI-SoC benchmarks with various link
pipeline configurations, simulated, and compared.
6.4.1 Power and Latency
A succinct metric to determine the benefit of adding link pipeline buffers is power-
latency product (PLP) of the network. This is similar to the energy-delay product
metric commonly used in CPU architecture or VLSI comparisons. The power term is
the sum of dynamic and leakage power of the routers, wires, and wire pipeline buffers.
The delay term is the mean packet latency through a network adapter’s output buffer,
added to the mean message latency (for 256 bytes) through the network. Delays were
normalized to give equal weight to network and output buffer latencies. Figure 6.8
shows this metric on the Y-axis, with the X-axis showing the total number of buffers
inserted on all links, including both CTMBs and path-specific. Data is given in two
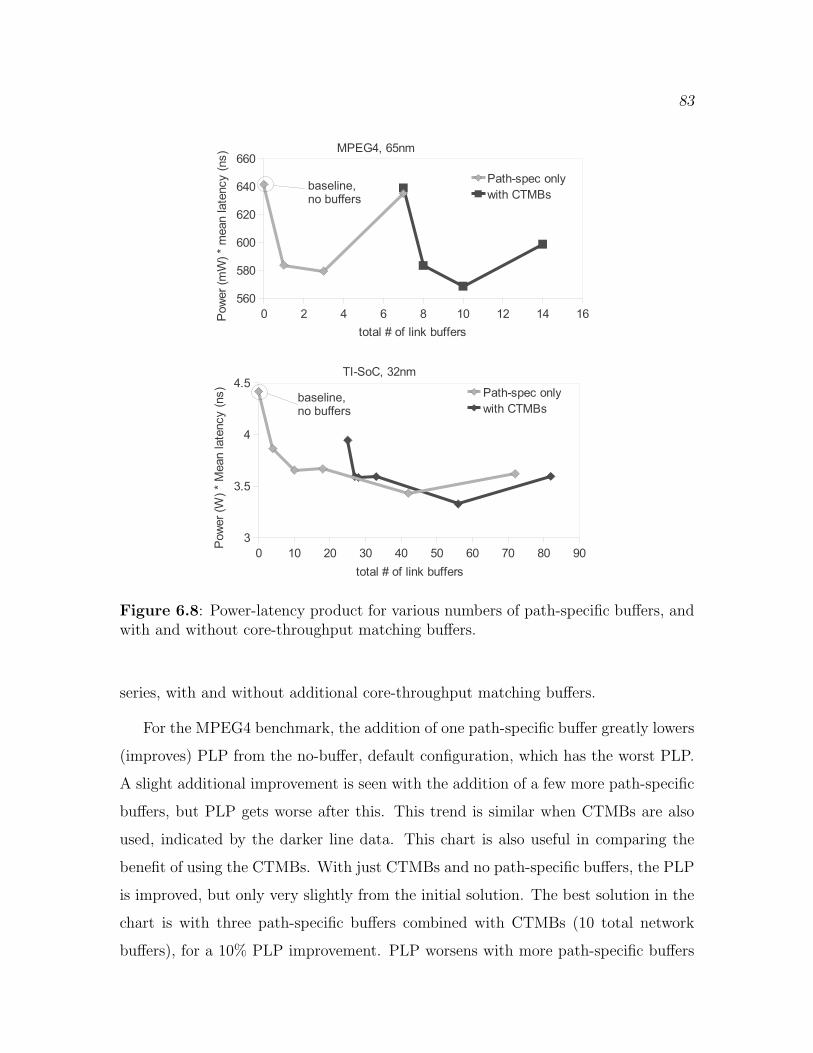
83
Figure 6.8: Power-latency product for various numbers of path-specific buffers, andwith and without core-throughput matching buffers.
series, with and without additional core-throughput matching buffers.
For the MPEG4 benchmark, the addition of one path-specific buffer greatly lowers
(improves) PLP from the no-buffer, default configuration, which has the worst PLP.
A slight additional improvement is seen with the addition of a few more path-specific
buffers, but PLP gets worse after this. This trend is similar when CTMBs are also
used, indicated by the darker line data. This chart is also useful in comparing the
benefit of using the CTMBs. With just CTMBs and no path-specific buffers, the PLP
is improved, but only very slightly from the initial solution. The best solution in the
chart is with three path-specific buffers combined with CTMBs (10 total network
buffers), for a 10% PLP improvement. PLP worsens with more path-specific buffers
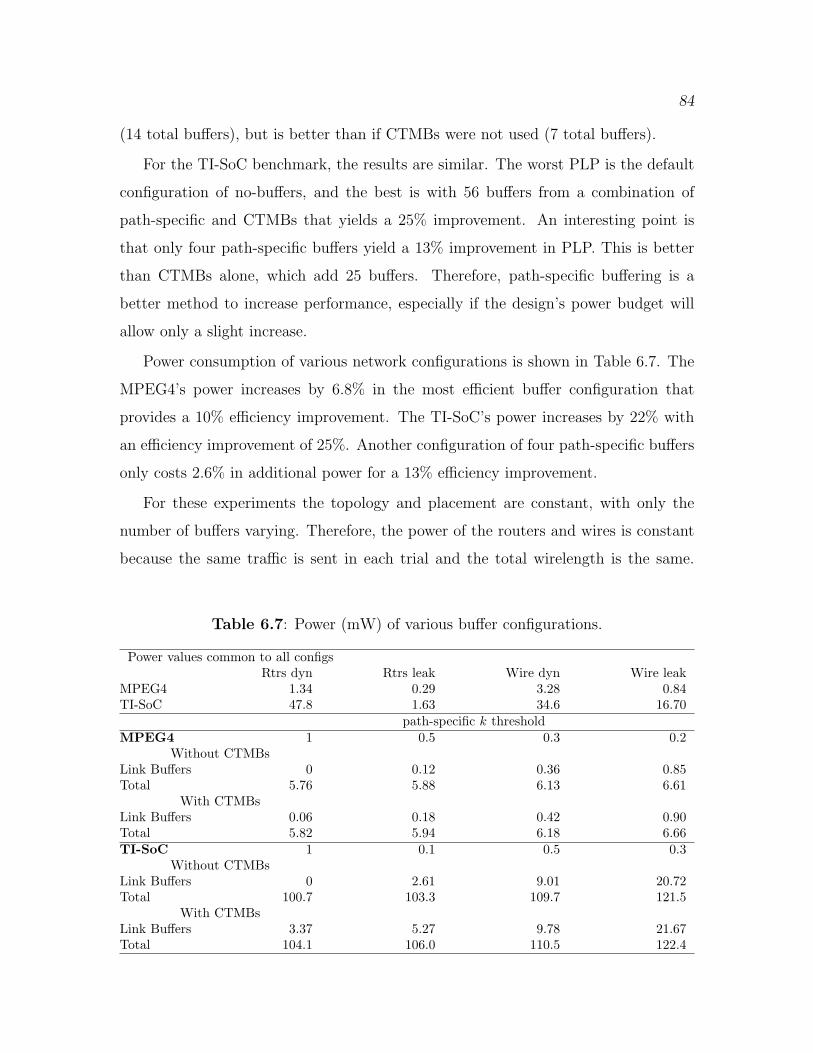
84
(14 total buffers), but is better than if CTMBs were not used (7 total buffers).
For the TI-SoC benchmark, the results are similar. The worst PLP is the default
configuration of no-buffers, and the best is with 56 buffers from a combination of
path-specific and CTMBs that yields a 25% improvement. An interesting point is
that only four path-specific buffers yield a 13% improvement in PLP. This is better
than CTMBs alone, which add 25 buffers. Therefore, path-specific buffering is a
better method to increase performance, especially if the design’s power budget will
allow only a slight increase.
Power consumption of various network configurations is shown in Table 6.7. The
MPEG4’s power increases by 6.8% in the most efficient buffer configuration that
provides a 10% efficiency improvement. The TI-SoC’s power increases by 22% with
an efficiency improvement of 25%. Another configuration of four path-specific buffers
only costs 2.6% in additional power for a 13% efficiency improvement.
For these experiments the topology and placement are constant, with only the
number of buffers varying. Therefore, the power of the routers and wires is constant
because the same traffic is sent in each trial and the total wirelength is the same.
Table 6.7: Power (mW) of various buffer configurations.
Power values common to all configsRtrs dyn Rtrs leak Wire dyn Wire leak
MPEG4 1.34 0.29 3.28 0.84TI-SoC 47.8 1.63 34.6 16.70
path-specific k thresholdMPEG4 1 0.5 0.3 0.2
Without CTMBsLink Buffers 0 0.12 0.36 0.85Total 5.76 5.88 6.13 6.61
With CTMBsLink Buffers 0.06 0.18 0.42 0.90Total 5.82 5.94 6.18 6.66TI-SoC 1 0.1 0.5 0.3
Without CTMBsLink Buffers 0 2.61 9.01 20.72Total 100.7 103.3 109.7 121.5
With CTMBsLink Buffers 3.37 5.27 9.78 21.67Total 104.1 106.0 110.5 122.4
85
The dynamic and leakage power of routers and wires, common to all configurations,
is shown at the top of Table 6.7. Configurations are organized in sets, separated by
benchmark (MPEG4 and TI-SoC) and by buffer insertion type (only path-specific
buffers and both path-specific and CTMBs). A lower value of k-threshold represents
an increased number of path-specific buffers, with a value of 1 having none. For
each of these, the buffer power (sum of dynamic and leakage) is shown, along with
the total network power. The greater power consumption of the TI-SoC is due to
it sending far more aggregate traffic. The total power consumption rises slightly in
both benchmarks with the addition of more link buffers, as expected.
Mean latencies are shown in Table 6.8 for packets through the network adapter’s
output buffer for messages through the network. Both of these metrics generally
improve when more path-specific buffers are used. The MPEG4 benchmark has a
7.2% lower message latency and a 26% lower output buffer latency in its most efficient
configuration compared to the no-buffer baseline. The TI-SoC’s latency lowers by 47%
for the network and 28% for the output buffer. The large output buffer latency in the
MPEG4 benchmark is an effect of lack of backpressure to the traffic generator; it is a
useful relative comparison, but does not reflect latencies expected in an actual system.
The network message latency is more representative of actual system behavior.
Table 6.8: Mean latency (ns) of buffer configurations.
Measurement Location path-specific k thresholdMPEG4 1 0.5 0.3 0.2
Without CTMBsCore’s Output Buffer 15281 12257 11430 11644Network 55.74 54.58 52.92 53.58
With CTMBsCore’s Output Buffer 15332 12400 11248 10693Network 54.92 53.78 51.72 51.59TI-SoC 1 0.1 0.5 0.3
Without CTMBsCore’s Output Buffer 11.8 9.7 8.4 6.5Network 21.9 19.4 17.8 16.2
With CTMBsCore’s Output Buffer 10.1 8.6 8.2 6.2Network 19.1 17.9 17.3 15.7
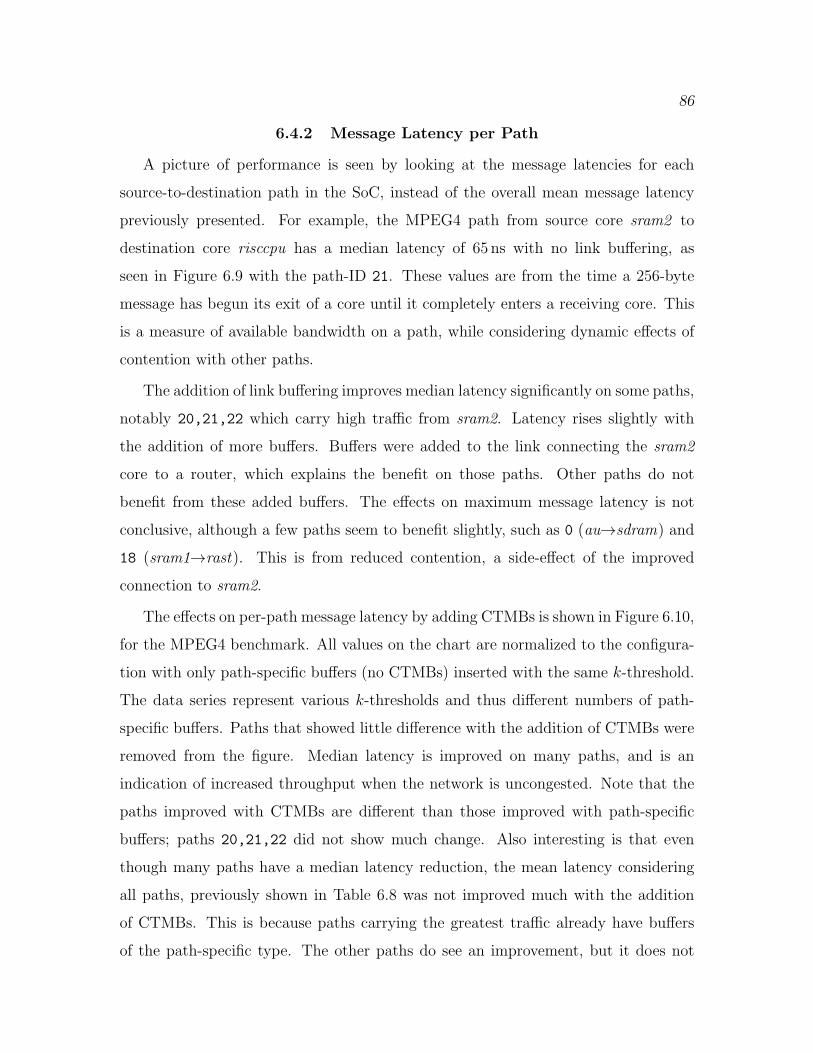
86
6.4.2 Message Latency per Path
A picture of performance is seen by looking at the message latencies for each
source-to-destination path in the SoC, instead of the overall mean message latency
previously presented. For example, the MPEG4 path from source core sram2 to
destination core risccpu has a median latency of 65 ns with no link buffering, as
seen in Figure 6.9 with the path-ID 21. These values are from the time a 256-byte
message has begun its exit of a core until it completely enters a receiving core. This
is a measure of available bandwidth on a path, while considering dynamic effects of
contention with other paths.
The addition of link buffering improves median latency significantly on some paths,
notably 20,21,22 which carry high traffic from sram2. Latency rises slightly with
the addition of more buffers. Buffers were added to the link connecting the sram2
core to a router, which explains the benefit on those paths. Other paths do not
benefit from these added buffers. The effects on maximum message latency is not
conclusive, although a few paths seem to benefit slightly, such as 0 (au→sdram) and
18 (sram1→rast). This is from reduced contention, a side-effect of the improved
connection to sram2.
The effects on per-path message latency by adding CTMBs is shown in Figure 6.10,
for the MPEG4 benchmark. All values on the chart are normalized to the configura-
tion with only path-specific buffers (no CTMBs) inserted with the same k-threshold.
The data series represent various k-thresholds and thus different numbers of path-
specific buffers. Paths that showed little difference with the addition of CTMBs were
removed from the figure. Median latency is improved on many paths, and is an
indication of increased throughput when the network is uncongested. Note that the
paths improved with CTMBs are different than those improved with path-specific
buffers; paths 20,21,22 did not show much change. Also interesting is that even
though many paths have a median latency reduction, the mean latency considering
all paths, previously shown in Table 6.8 was not improved much with the addition
of CTMBs. This is because paths carrying the greatest traffic already have buffers
of the path-specific type. The other paths do see an improvement, but it does not
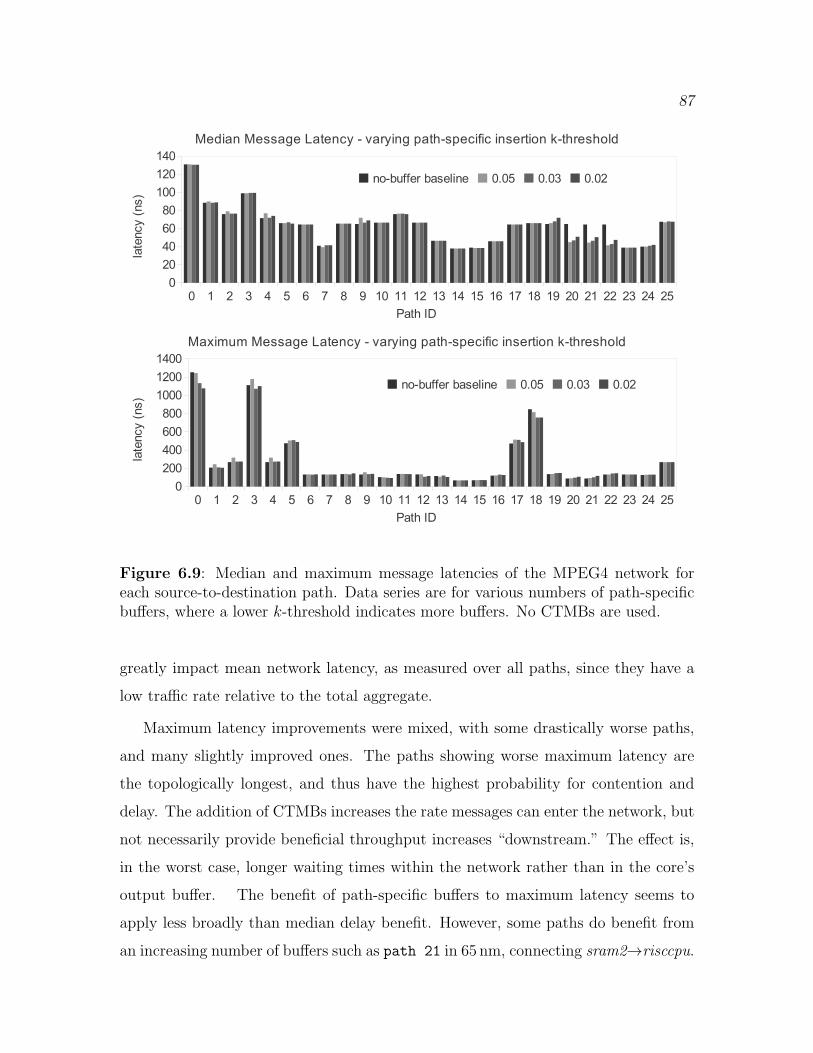
87
Figure 6.9: Median and maximum message latencies of the MPEG4 network foreach source-to-destination path. Data series are for various numbers of path-specificbuffers, where a lower k-threshold indicates more buffers. No CTMBs are used.
greatly impact mean network latency, as measured over all paths, since they have a
low traffic rate relative to the total aggregate.
Maximum latency improvements were mixed, with some drastically worse paths,
and many slightly improved ones. The paths showing worse maximum latency are
the topologically longest, and thus have the highest probability for contention and
delay. The addition of CTMBs increases the rate messages can enter the network, but
not necessarily provide beneficial throughput increases “downstream.” The effect is,
in the worst case, longer waiting times within the network rather than in the core’s
output buffer. The benefit of path-specific buffers to maximum latency seems to
apply less broadly than median delay benefit. However, some paths do benefit from
an increasing number of buffers such as path 21 in 65 nm, connecting sram2→risccpu.
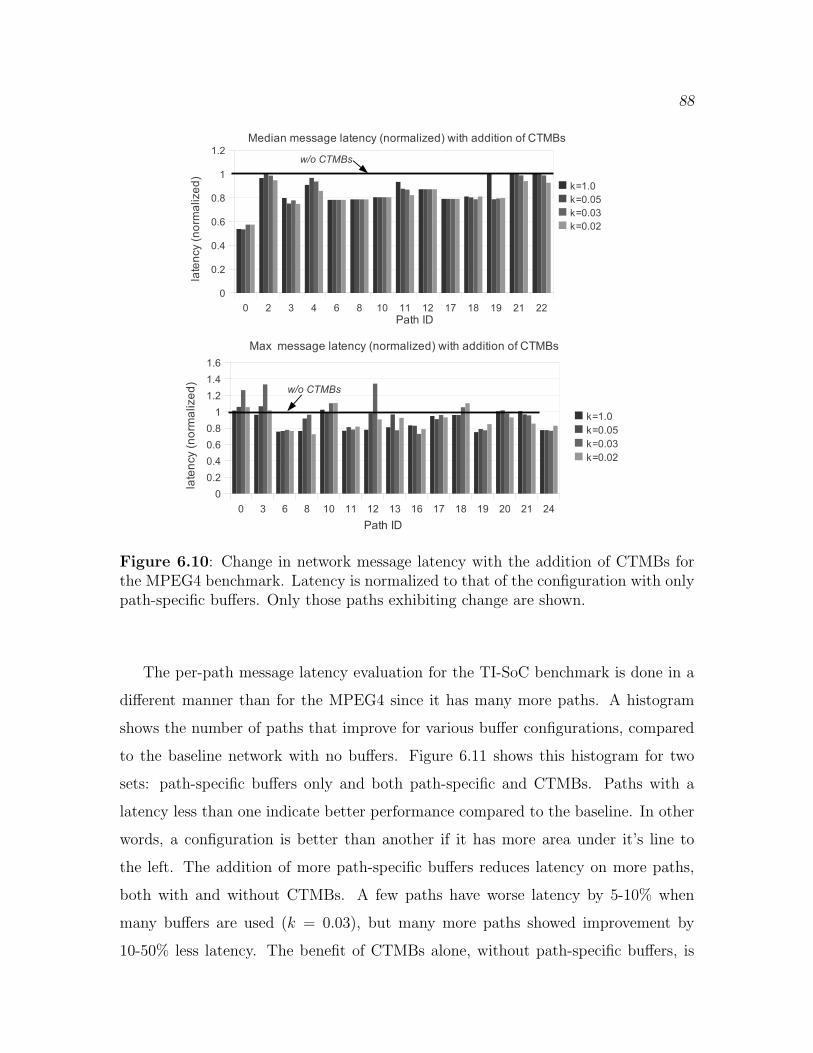
88
Figure 6.10: Change in network message latency with the addition of CTMBs forthe MPEG4 benchmark. Latency is normalized to that of the configuration with onlypath-specific buffers. Only those paths exhibiting change are shown.
The per-path message latency evaluation for the TI-SoC benchmark is done in a
different manner than for the MPEG4 since it has many more paths. A histogram
shows the number of paths that improve for various buffer configurations, compared
to the baseline network with no buffers. Figure 6.11 shows this histogram for two
sets: path-specific buffers only and both path-specific and CTMBs. Paths with a
latency less than one indicate better performance compared to the baseline. In other
words, a configuration is better than another if it has more area under it’s line to
the left. The addition of more path-specific buffers reduces latency on more paths,
both with and without CTMBs. A few paths have worse latency by 5-10% when
many buffers are used (k = 0.03), but many more paths showed improvement by
10-50% less latency. The benefit of CTMBs alone, without path-specific buffers, is
89
seen in 6.11b with the 1.0 k-threshold series. Many paths improve with just CTMBs,
but path-specific buffers benefit additional paths when they are added.
(a) insertion of various numbers of path-specific buffers, and no CTMBs
(b) CTMBs added, with increasing numbers of path-specific buffers
Figure 6.11: Histograms showing the number of paths with various latency improve-ments for the TI-SoC benchmark with link pipelining. Latencies are normalized tothe baseline configuration with no link buffers. The series of decreasing k-thresholdsrepresent increased path-specific buffers.
These results show that link pipeline buffers can improve performance, as mea-
sured by message latency, at a greater margin than it costs in additional power. The
optimal insertion parameters are design-specific, and the space should be explored
by the SoC designer. In both benchmarks, the most benefit came from path-specific
buffers, but CTMBs were also needed to achieve the most efficient PLP configuration.
CTMBs seem to improve the median latency a larger number of paths than solely
path-specific buffers, but worsen the maximum latency on more paths. If a design’s
power budget does not allow for a large number of link buffers, path-specific buffers
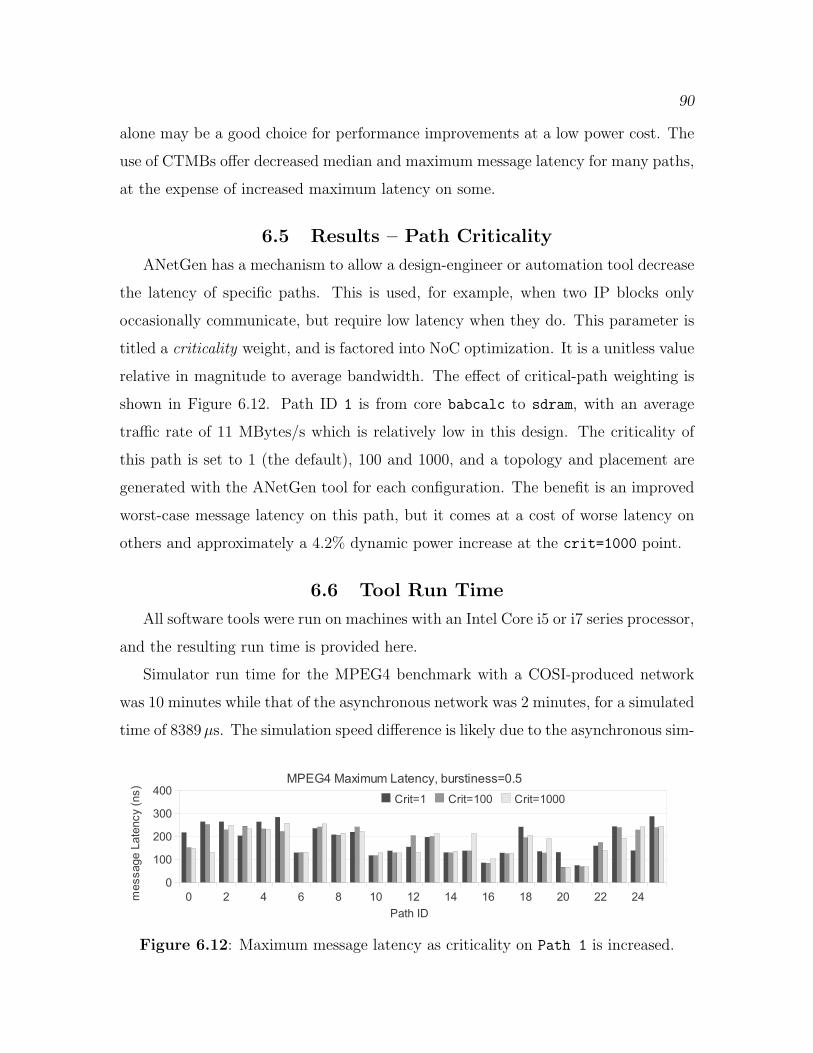
90
alone may be a good choice for performance improvements at a low power cost. The
use of CTMBs offer decreased median and maximum message latency for many paths,
at the expense of increased maximum latency on some.
6.5 Results – Path Criticality
ANetGen has a mechanism to allow a design-engineer or automation tool decrease
the latency of specific paths. This is used, for example, when two IP blocks only
occasionally communicate, but require low latency when they do. This parameter is
titled a criticality weight, and is factored into NoC optimization. It is a unitless value
relative in magnitude to average bandwidth. The effect of critical-path weighting is
shown in Figure 6.12. Path ID 1 is from core babcalc to sdram, with an average
traffic rate of 11 MBytes/s which is relatively low in this design. The criticality of
this path is set to 1 (the default), 100 and 1000, and a topology and placement are
generated with the ANetGen tool for each configuration. The benefit is an improved
worst-case message latency on this path, but it comes at a cost of worse latency on
others and approximately a 4.2% dynamic power increase at the crit=1000 point.
6.6 Tool Run Time
All software tools were run on machines with an Intel Core i5 or i7 series processor,
and the resulting run time is provided here.
Simulator run time for the MPEG4 benchmark with a COSI-produced network
was 10 minutes while that of the asynchronous network was 2 minutes, for a simulated
time of 8389µs. The simulation speed difference is likely due to the asynchronous sim-
Figure 6.12: Maximum message latency as criticality on Path 1 is increased.
91
ulator’s use of transaction-level-modeling for the links, rather than using a SystemC
signal for each physical wire. The much more complex TI-SoC simulation completed
in approximately one hour for both networks with the same simulated time.
The duration of topology and placement generation is dependent on the given
parameters, and desired quality of solution. For the results presented here, run times
were between fifteen minutes for the smaller benchmarks to two hours for the TI-SoC.
6.7 Summary
The results presented in this chapter highlight the benefit of the proposed NoC
design. The network power is significantly less, by 40 to 50%, for this simplified
async NoC than for the standard synchronous NoC. Most of this difference is due to
a dramatic reduction in the routers’ dynamic power consumption, but there was
also a reduction in the dynamic power of the wires. Additional reductions, not
quantitatively evaluated here, come from the removal of a synchronous global clock
tree needed for all synchronous routers.
The async network’s message latency was competitive to the synchronous design
for the ADSTB and MPEG4 SoC benchmarks. With low traffic burstiness, the async
NoC had between 33% and 53% better latency for most messages, and was 26%
and 50% better considering the message with the worst latency over the course of
simulation. As burstiness increases, the worst-case latency of the async network
grows beyond that of the standard NoC by 18% for ADSTB and 60% for MPEG4, at
the highest burstiness. However, most messages still have significantly lower latency
in the async NoC at high burstiness. The async network’s latency improvement is
due to its higher bandwidth, about twice that of the COSI router models and its link
protocol. The variation in latency between paths was greater in the async network due
to its topology. The paths with the most router hops suffered as burstiness increased,
while shorter paths, carrying the most traffic, did not worsen nearly as much.
Link pipelining has shown to be a complexity-effective method to decrease message
latency at a small increase in power. An advantage of an async network is that
specific links can be targeted for buffering and thus increased bandwidth, as guided
92
by expected traffic over the links. This is in contrast to a classic synchronous
NoC (not including source-synchronous methods) that must change frequency on the
whole network, or use additional synchronizers between clock domains of different
frequencies. Both strategies presented are beneficial, but a SoC design may be more
sensitive to one type or the other. Generally, the most efficient configuration is
with a combination of path-specific buffers and CTMBs. However, path-specific
buffers alone provide a significant message latency reduction at a very low power
cost. These strategies offer the NoC engineer another knob to turn for specifying the
power–performance point in the design.

CHAPTER 7
CONCLUSIONS
This work has brought improvements to energy-constrained on-chip communi-
cation design for embedded devices, which is a growing concern as communication
requires an increasing amount of energy and time compared with computation re-
quirements. This is the first academic research that studies an energy-efficient, async
NoC that is customized for a particular heterogeneous SoC with automation tools.
Contributions of this work to the field are as follows.
7.1 Router Circuit Design and Architecture
A unique NoC architecture and circuit design was presented brings increased
NoC energy-efficiency. It does this through simple operation and simple structure.
These design choices reduce the size of the most power-consuming elements of a
NoC, specifically the crossbar and buffers. Properties inherent to asynchronous
communication provide a significant benefit, namely the ability for link pipelining
on specific links, perfect “clock gating,” and lack of a clock tree. This architecture
was published in the NOCS 2010 conference [37].
7.2 Optimization and Simulation Tools
Several optimization methods, tailored for this NoC design concept and aiming to
reduce power and latency, were developed and implemented in a software framework
titled ANetGen. ANetGen is used as a tool to aid a NoC engineer in evaluating
possible network configurations. It automates topology specification, router floorplan
placement, and simulation of the optimized network. This can be a key part of a
generalized SoC design tool, but more importantly it is an enabling technology for
other studies. ANetGen has recently been used to aid in another’s research [125], and
94
its SystemC self-similar traffic models were shared with a researcher, Jonas Diemer,
at Technische Universitat Braunschweig. Optimization methods were published in
the TCAD IEEE journal [39] and FMGALS workshop [36].
7.3 Link Pipelining Strategies
This work compared several strategies for pipelining links of an async NoC for
an improved energy×latency metric in a complexity-effective manner. The strategies
were integrated into ANetGen for rapid evaluation. The idea of pipelining specific
links for this network was first noted in the FMGALS 2007 workshop proceedings [36].
Link pipelining in a comparison between this async and a similarly-designed clocked
network was shown in the ICCD 2010 conference [126]. A pipelining strategy com-
parison using ANetGen was published at the NOCS 2011 conference [38].
7.4 Validation of this Novel NoC Design
A primary contribution of this research is that it validates its unconventional and
novel NoC, while providing the groundwork for additional advancements in the field
based on its concepts. The energy savings is significant, and performance comparable
to traditional NoCs, indicating its design style is worthy of further investigation. To
this end, care has been taken to perform an evaluation that is based on methods set
forth by the NoC research community. This includes end-to-end measurements of
large messages, rather than single packets, and traffic generation using a self-similar
model, rather than the more common, but less realistic, Poisson distribution. These
results, including a comparison to a traditional synchronous NoC, are published in
the NOCS 2010 conference [37] and TCAD journal [39].
7.5 Lessons
This study has provided a number of interesting lessons that will be helpful to the
research community:
• Traditional network research indicates which topologies are theoretically unde-
sirable. However, these “bad” topologies can be acceptable or advantageous
when considering a SoC’s physical properties and requirements. In this case, a
95
binary tree has low bisection bandwidth and no path diversity, yet due to an
implementation with fast and efficient circuits, it yields enough throughput to
be a viable choice, and achieves the primary aim of high energy-efficiency.
• Link pipelining on async channels is an efficient way to improve overall through-
put by increasing network buffering and decreasing cycle-time between con-
trollers. The choices of which links to pipeline and by how much are dependent
upon the traffic of a particular SoC. Generally, pipelining links with a path-
specific strategy, or those with the most traffic compared to their bandwidths
– will improve message latency in an energy-efficient manner.
• Traffic burstiness is an important characteristic to consider during evaluation,
but is often not used in other NoC research. The difference in message latency
between low and high burstiness can be dramatic, and design choices should take
this into account, along with the commonly used metric of average throughput.
• Analysis of a NoC, especially for heterogeneous SoCs, should consider traffic
properties on a per-path basis, and not solely the results of all paths in aggregate.
Some paths may have dramatically higher latencies, beyond what the average
across all paths indicates.
• The algorithm choices and their implementation (simulated annealing and force-
directed placement) produced acceptable results, and they are easily adaptable
to other topologies. They may not, however, scale to large numbers of IP blocks
and communication paths. For larger SoCs, other optimization methods may
be considered.
7.6 Limitations
The network design and methods described in this dissertation provide results
and lessons general enough to be applied to the field as a whole. However, several
limitations should be noted:
• The tree topology used for this work allows the async network to be comparable
to a synchronous NoC, even one with greater path diversity. This was due to the
particular SoC traffic patterns and circuit properties. However, the theoretical
96
weakness of the tree may limit its scalability in chips with hundreds of cores,
unless traffic locality is very high. It may also not work well in a CMP design
that has general, unspecified traffic patterns.
• The source-routing method of parallel route and data bits on a link requires
many wires if the number if IP blocks is high. The width will also increase
if more path-diverse topologies are constructed from the radix-3 routers. This
may require a prohibitive amount of wiring in large SoC designs, and limit the
scope of this specific NoC architecture’s application.
• The algorithms and their implementation are computationally demanding. Larger
designs may require excessive time for topology and placement optimization.
• Reconfigurable platform-based SoCs are able to support a number of specific
functions, and ideally use a network that also supports reconfiguration for more
efficient operation. The application-specific topology and placement optimiza-
tions described in this work are not ideal in such a SoC.
• Certain SoCs require network-provided guaranteed service requirements as spec-
ified by the software application (i.e., configurable at runtime). The described
network does not support such functionality, except with a calculation of worst-
case packet latency [125].
• Like many asynchronous designs, commercial acceptance will be difficult with-
out compatible interaction with existing EDA design tools and flows. This is a
task addressed by other research but currently limits the commercial viability
of this NoC.
7.7 Future Work
This dissertation lays the foundation for design and evaluation of a NoC consisting
of efficient circuits and a simple architecture. In doing so, it spawns a number
of needed research goals to better characterize and improve upon its simple async
network concept. Some useful directions are described here.
The comparison performed in this work between synchronous and async NoC
models relies on parameterized, analytical models for the synchronous routers and
97
wires. More insight can be gained through an evaluation of both NoCs after layout
that would include more accurate clock tree, wire repeater, and router power analysis.
The network adapter is a key component of a NoC that provides easy interfacing
to various IP blocks. Future work should develop and evaluate network adapters for a
variety of core interface protocols, such as OCP or AMBA AXI. The transaction-level
protocol for the network needs to be defined and implemented. This will provide a
quantification of protocol overhead in this network and how it is affected by packet
size.
A benefit to using SystemC as the basis for simulation is the potential to co-
simulate the network with the RTL router models while maintaining SystemC traffic
generators and wire models. This can be done by placing SystemC “wrappers”
around the router RTL that interfaces with a link’s TLM model, back-annotate
with circuit delay from layout timing analysis, and by using the ModelSim software
product by Mentor Graphics, Inc. The purpose of such a simulation is to determine
more accurate latency and throughput measurements than what the current SystemC
models provide.
The idea of network simplicity should be studied for many other parameter-
izations, such as different router radix, multi-flit packets, routing methods, and
topologies. These other options may lend themselves to different applications, such
as a reconfigurable network or CMP.
This network may be ideal for constructing a subnetwork within a hierarchical
interconnect, rather than the sole network in a SoC. For example, it may work
well for connecting the components of a fixed-function MPEG4 encoder that itself
is integrated into a general-purpose platform SoC that uses another network.
REFERENCES
[1] Adya, S., and Markov, I. Fixed-outline floorplanning: Enabling hierarchi-cal design. In IEEE Trans. on VLSI (2003).
[2] Ahonen, T., Tortosa, D. S., and Nurmi, J. Topology optimization forapplication-specific networks-on-chip. In Proc. 6th International Workshop onSystem Level Interconnect Prediction (2004).
[3] Angiolini, F., Meloni, P., Carta, S. M., Raffo, L., and Benini, L.A layout-aware analysis of networks-on-chip and traditional interconnects formpsocs. Trans. Comp.-Aided Des. Integ. Cir. Sys. (March 2007).
[4] Arditti Ilitzky, D., Hoffman, J. D., Chun, A., and Perez Esparza,B. Architecture of the scalable communications core’s network on chip. IEEEMicro 27 (September 2007), 62–74.
[5] Atienza, D., Angiolini, F., Murali, S., Pullini, A., Benini, L.,and De Micheli, G. Network-On-Chip Design and Synthesis Outlook.Integration-The VLSI Journal 41, 3 (2008), 340–359.
[6] Bainbridge, W. J., and Furber, S. B. CHAIN: A Delay Insensitive CHipArea INterconnect. IEEE Micro special issue on Design and Test of System onChip 142, No.4. (Sept. 2002), 16–23.
[7] Bakoglu, H. Circuits, Interconnections, and Packaging for VLSI. Addison-Wesley, 1990.
[8] Beigne, E., Clermidy, F., Vivet, P., Clouard, A., and Renaudin, M.An asynchronous noc architecture providing low latency service and its multi-level design framework. In Proc. Int’l Symposium on Asynchronous Circuitsand Systems (2005), pp. 54–63.
[9] Beigne, E., and Vivet, P. Design of on-chip and off-chip interfaces for agals noc architecture. In Proc. Int’l Symposium on Asynchronous Circuits andSystems (Los Alamitos, CA, USA, 2006), IEEE Computer Society, pp. 172–183.
[10] Benini, L., and Micheli, G. D. Networks on chips: A new soc paradigm.Computer 35, 1 (2002), 70–78.
[11] Beraha, R., Walter, I., Cidon, I., and Kolodny, A. Leveragingapplication-level requirements in the design of a noc for a 4g soc: a case study.In Proc. Design, Automation, and Test in Europe (2010), pp. 1408–1413.
99
[12] Bertozzi, D., Jalabert, A., Murali, S., Tamhankar, R., Stergiou,S., Benini, L., and Micheli, G. D. NoC Synthesis Flow for Customized Do-main Specific Mutliprocessor Systems-on-Chip. IEEE Transactions on Paralleland Distributed Systems 16, 2 (2005), 113–129.
[13] Bienia, C., Kumar, S., Singh, J. P., and Li, K. The parsec benchmarksuite: Characterization and architectural implications. In Proceedings of the17th International Conference on Parallel Architectures and Compilation Tech-niques (October 2008).
[14] Bienia, C., and Li, K. Parsec 2.0: A new benchmark suite for chip-multiprocessors. In Proceedings of the 5th Annual Workshop on Modeling,Benchmarking and Simulation (June 2009).
[15] Bjerregaard, T., Mahadevan, S., Olsen, R. G., and Sparsø, J.An OCP compliant network adapter for GALS-based SoC design using theMANGO network-on-chip. In Proc. of Int’l Symp. on System-on-Chip (2005),pp. 171–174.
[16] Bjerregaard, T., and Sparsø, J. A router architecture for connection-oriented service guarantees in the MANGO clockless network-on-chip. In Proc.Design, Automation, and Test in Europe (2005), pp. 1226–1231.
[17] Bjerregaard, T., and Sparso, J. Implementation of guaranteed servicesin the mango clockless network-on-chip. Computers and Digital Techniques 153,4 (2006), 217 – 229.
[18] Bogdan, P., Kas, M., Marculescu, R., and Mutlu, O. Quale: Aquantum-leap inspired model for non-stationary analysis of noc traffic in chipmulti-processors. In Proc. Int’l Symp. on Networks-on-Chips (Los Alamitos,CA, USA, 2010), IEEE Computer Society, pp. 241–248.
[19] Bollinger, S., and Midkiff, S. Heuristic technique for processor and linkassignment in multicomputers. IEEE Transactions on Computers 40, 3 (Mar.1991), 325 –333.
[20] Cahon, S., Melab, N., and Talbi, E.-G. Paradiseo: a framework formetaheuristics. In International Workshop on Optimization Frameworks forIndustrial Applications (Oct. 2005).
[21] Carloni, L. P., Kahng, A. B., Muddu, S. V., Pinto, A., Samadi, K.,and Sharma, P. Accurate predictive interconnect modeling for system-leveldesign. IEEE Trans. Very Large Scale Integr. Syst. 18 (April 2010), 679–684.
[22] Clermidy, F., Bernard, C., Lemaire, R., Martin, J., Miro-Panades,I., Thonnart, Y., Vivet, P., and Wehn, N. A 477mw noc-based digitalbaseband for mimo 4g sdr. In IEEE Solid-State Circuits Conference Digest ofTechnical Papers (Feb. 2010), pp. 278–279.
100
[23] Clermidy, F., Bernard, C., Lemaire, R., Martin, J., Miro-Panades,I., Thonnart, Y., Vivet, P., and Wehn, N. Magali: A network-on-chipbased multi-core system-on-chip for mimo 4g sdr. In IEEE Int’l Conference onIC Design and Technology (2010), pp. 74–77.
[24] Clermidy, F., Lemaire, R., Popon, X., Ktenas, D., and Thonnart,Y. An open and reconfigurable platform for 4g telecommunication: Conceptsand application. In Euromicro Conference on Digital System Design, Architec-tures, Methods and Tools (Aug. 2009), pp. 449–456.
[25] Coates, B., Davis, A., and Stevens, K. The post office experience:designing a large asynchronous chip. Integration, the VLSI Journal 15, 3 (1993),341 – 366. Special Issue on asynchronous systems.
[26] Cortadella, J., Kishinevsky, M., Kondratyev, A., Lavagno, L., andYakovlev, A. Petrify: A tool for manipulating concurrent specifications andsynthesis of asynchronous controllers. IEICE Transactions on Information andSystems E80-D, 3 (March 1997), 315–325.
[27] Dally, W. J. Virtual-channel flow control. IEEE Trans. Parallel Distrib.Syst. 3 (March 1992), 194–205.
[28] Dally, W. J., and Towles, B. Route packets, not wires: On-chip intercon-nection networks. In Proc. ACM/IEEE Design Automation Conference (2001),pp. 684–689.
[29] Deb, K., and Kalyanmoy, D. Multi-Objective Optimization Using Evolu-tionary Algorithms, 1 ed. Wiley, June 2001.
[30] Dobkin, R. R., Ginosar, R., and Kolodny, A. Qnoc asynchronousrouter. Integr. VLSI J. 42, 2 (2009), 103–115.
[31] Drinic, M., Kirovski, D., Megerian, S., and Potkonjak, M. Latency-guided on-chip bus-network design. Trans. Comp.-Aided Des. Integ. Cir. Sys.25, 12 (Dec. 2006), 2663 –2673.
[32] Drinic, M., Kirovski, D., Meguerdichian, S., and Potkonjak, M.Latency-guided on-chip bus network design. In Proc. Int’l Conf. on Computer-Aided Design (2000), ICCAD ’00, pp. 420–423.
[33] Dutta, S., Jensen, R., and Rieckmann, A. Viper: A multiprocessor socfor advanced set-top box and digital tv systems. IEEE Design and Test 18, 5(2001), 21–31.
[34] Eades, P. A Heuristic for Graph Drawing. Congressus Numerantium 42(1984), 149–160.
[35] Eisenmann, H., and Johannes, F. M. Generic global placement andfloorplanning. In DAC ’98: Proceedings of the 35th annual conference on DesignAutomation (New York, NY, USA, 1998), ACM Press, pp. 269–274.

101
[36] Gebhardt, D., and Stevens, K. S. Elastic flow in an application specificnetwork-on-chip. Electron. Notes Theor. Comput. Sci. 200, 1 (2008), 3–15.Proc. Int’l Workshop on Formal Methods for GALS.
[37] Gebhardt, D., You, J., and Stevens, K. S. Comparing Energy andLatency of Asynchronous and Synchronous NoCs for Embedded SoCs. In Proc.Int’l Symp. on Networks-on-Chips (May 2010), pp. 115–122.
[38] Gebhardt, D., You, J., and Stevens, K. S. Link Pipelining Strateies foran Application-Specific Asynchronous NoC. In Proc. Int’l Symp. on Networks-on-Chips (May 2011).
[39] Gebhardt, D., You, J., and Stevens, K. S. Design of an energy-efficientasynchronous noc and its optimization tools for heterogeneous socs. Trans.Comp.-Aided Des. Integ. Cir. Sys. (to appear).
[40] Gilabert, F., Medardoni, S., Bertozzi, D., Benini, L., Gomez, M. E.,Lopez, P., and Duato, J. Exploring high-dimensional topologies for nocdesign through an integrated analysis and synthesis framework. In Proc. Int’lSymp. on Networks-on-Chips (2008), pp. 107–116.
[41] Goossens, K., Dielissen, J., Gangwal, O. P., Pestana, S. G., Rad-ulescu, A., and Rijpkema, E. A design flow for application-specificnetworks on chip with guaranteed performance to accelerate soc design andverification. Design, Automation and Test in Europe Conference and Exhibition2 (2005), 1182–1187.
[42] Goossens, K., and Hansson, A. The aethereal network on chip afterten years: goals, evolution, lessons, and future. In Proc. ACM/IEEE DesignAutomation Conference (2010), pp. 306–311.
[43] Guz, Z., Walter, I., Bolotin, E., Cidon, I., Ginosar, R., andKolodny, A. Network delays and link capacities in application-specificwormhole nocs. VLSI Design 2007 (2007).
[44] Hameed, R., Qadeer, W., Wachs, M., Azizi, O., Solomatnikov,A., Lee, B. C., Richardson, S., Kozyrakis, C., and Horowitz, M.Understanding sources of inefficiency in general-purpose chips. In Proc. Int’lSymp. on Computer Architecture (2010), pp. 37–47.
[45] Hansson, A., and Goossens, K. Trade-offs in the configuration of a networkon chip for multiple use-cases. In Proc. Int’l Symp. on Networks-on-Chip (May2007), pp. 233–242.
[46] Hoffman, J., Ilitzky, D. A., Chun, A., and Chapyzhenka, A. Ar-chitecture of the scalable communications core. In Proc. Int’l Symp. onNetworks-on-Chip (May 2007), pp. 40–52.

102
[47] Horak, M., Nowick, S., Carlberg, M., and Vishkin, U. A low-overheadasynchronous interconnection network for gals chip multiprocessors. Trans.Comp.-Aided Des. Integ. Cir. Sys. 30, 4 (2011), 494–507.
[48] Hoskote, Y., Vangal, S., Singh, A., Borkar, N., and Borkar, S. A5-ghz mesh interconnect for a teraflops processor. IEEE Micro 27, 5 (2007),51–61.
[49] Hu, J., and Marculescu, R. Energy-aware mapping for tile-based nocarchitectures under performance constraints. In Proc. Asia and South PacificDesign Automation Conference (2003), pp. 233–239.
[50] International Technology Roadmap for Semiconductors. http://www.itrs.net, 2009.
[51] Jalabert, A., Murali, S., Benini, L., and Micheli, G. D. xpipesCom-piler: A tool for instantiating application specific Networks on Chip. In Proc.Design, Automation, and Test in Europe (Feb. 2004), pp. 884–889.
[52] Jalier, C., Lattard, D., Jerraya, A. A., Sassatelli, G., Benoit,P., and Torres, L. Heterogeneous vs homogeneous mpsoc approaches fora mobile lte modem. In Proceedings of the Conference on Design, Automationand Test in Europe (2010), Proc. Design, Automation, and Test in Europe,pp. 184–189.
[53] Jayasimha, D., Zafar, B., and Hoskote, Y. On-Chip InterconnectionNetworks: Why They are Different and How to Compare Them. Intel TechnicalReport (2006).
[54] Jerger, N. D. E., Peh, L.-S., and Lipasti, M. H. Circuit-switchedcoherence. In Proc. Int’l Symp. on Networks-on-Chips (2008), pp. 193–202.
[55] Kahng, A., Li, B., Peh, L.-S., and Samadi, K. Orion 2.0: A fast andaccurate noc power and area model for early-stage design space exploration. InProc. Design, Automation, and Test in Europe (April 2009), pp. 423–428.
[56] Kao, Y.-H., Alfaraj, N., Yang, M., and Chao, H. J. Design ofhigh-radix clos network-on-chip. In Proceedings of the 2010 Fourth ACM/IEEEInternational Symposium on Networks-on-Chip (Washington, DC, USA, 2010),NOCS ’10, IEEE Computer Society, pp. 181–188.
[57] Kim, J. Low-cost router microarchitecture for on-chip networks. In Proc. Int’lSymp. on Microarchitecture (2009), pp. 255–266.
[58] Kim, J. S., Taylor, M. B., Miller, J., and Wentzlaff, D. Energycharacterization of a tiled architecture processor with on-chip networks. In Proc.of the Intl. Symp. on Low power Electronics and Design (2003), pp. 424–427.
[59] Kirkpatrick, S., Gelatt, C. D., and Vecchi, M. P. Optimization bysimulated annealing. Science 220 (1983), 671–680.

103
[60] Kodi, A. K., Sarathy, A., and Louri, A. ideal: Inter-router dual-functionenergy and area-efficient links for network-on-chip (noc) architectures. In Proc.Int’l Symp. on Computer Architecture (2008), pp. 241–250.
[61] Lahiri, K., Raghunathan, A., and Dey, S. Design space exploration foroptimizing on-chip communication architecture. In Trans. Comp.-Aided Des.Integ. Cir. Sys. (2004), pp. 952–961.
[62] Lattard, D., Beigne, E., Bernard, C., Bour, C., Clermidy, F., Du-rand, Y., Durupt, J., Varreau, D., Vivet, P., Penard, P., Bouttier,A., and Berens, F. A telecom baseband circuit based on an asynchronousnetwork-on-chip. Solid-State Circuits Conference, Digest of Technical Papers(Feb. 2007), 258–601.
[63] Lee, C., Potkonjak, M., and Mangione-Smith, W. Mediabench: a toolfor evaluating and synthesizing multimedia and communications systems. InProc. IEEE/ACM Int’l Symp. on Microarchitecture (1997), p. 330.
[64] Lee, K., Lee, S.-J., and Yoo, H.-J. Low-power network-on-chip for high-performance soc design. IEEE Trans. on Very Large Scale Integration Systems14, 2 (2006), 148–160.
[65] Lee, W. S. Transmission lines on integrated circuits for high speed communi-cation. Master’s thesis, University of Utah, 2008.
[66] Lines, A. Asynchronous interconnect for synchronous soc design. IEEE Micro24, 1 (2004), 32–41.
[67] Lu, Z., Jantsch, A., Salminen, E., and Grecu, C. Network-on-chipbenchmarking specification part 2: Micro-benchmark specification. TechnicalReport, OCP International Partnership Association, Inc. (2008).
[68] Marculescu, R., Ogras, U., Peh, L.-S., Jerger, N., and Hoskote,Y. Outstanding research problems in noc design: System, microarchitecture,and circuit perspectives. Trans. Comp.-Aided Des. Integ. Cir. Sys. 28, 1 (2009),3–21.
[69] Mathew, B., Davis, A., and Fang, Z. A low-power accelerator for thesphinx 3 speech recognition system. In Proc. on Compilers, Architecture andSynthesis for Embedded Systems (2003), ACM, pp. 210–219.
[70] Micheli, G. D., and Benini, L. Networks on Chips: Technology and Tools(Systems on Silicon). Morgan Kaufmann Publishers Inc., San Francisco, CA,USA, 2006.
[71] Michelogiannakis, G., Balfour, J., and Dally, W. Elastic-bufferflow control for on-chip networks. In Proc. Int’l Symp. on High PerformanceComputer Architecture (2009), pp. 151–162.

104
[72] Milner, R. Communication and Concurrency. London. U.K.:Prentice-Hall,1989.
[73] Murali, S., Benini, L., and De Micheli, G. An application-specific designmethodology for on-chip crossbar generation. Trans. Comp.-Aided Des. Integ.Cir. Sys. 26, 7 (2007), 1283–1296.
[74] Murali, S., Meloni, P., Angiolini, F., Atienza, D., Carta, S., Benini,L., Micheli, G. D., and Raffo, L. Designing application-specific networkson chips with floorplan information. In Proc. Int’l Conf. on Computer-AidedDesign (2006), pp. 355–362.
[75] Murali, S., and Micheli, G. D. Sunmap: A tool for automatic topologyselection and generation for nocs. In Proc. ACM/IEEE Design AutomationConference (2004), pp. 914–919.
[76] Neeb, C., and Wehn, N. Designing efficient irregular networks for hetero-geneous systems-on-chip. In Proceedings of the 9th EUROMICRO Conferenceon Digital System Design (2006), pp. 665–672.
[77] Ogras, U. Y., and Marculescu, R. Energy- and performance-driven noccommunication architecture synthesis using a decomposition approach. In Proc.Design, Automation, and Test in Europe (Mar. 2005), pp. 352–357.
[78] Ogras, U. Y., and Marculescu, R. Analytical router modeling fornetworks-on-chip performance analysis. In Proc. of Design, Automation andTest in Europe (2007), pp. 1096–1101.
[79] Palermo, G., and Silvano, C. Pirate: A framework for power/performanceexploration of network-on-chip architectures. In Lecture Notes in ComputerScience (2004), pp. 521–531.
[80] Pamunuwa, D., Zheng, L.-R., and Tenhunen, H. Maximizing through-put over parallel wire structures in the deep submicrometer regime. Trans. onVery Large Scale Integration Systems 11, 2 (2003), 224–243.
[81] Panades, I. M., Clermidy, F., Vivet, P., and Greiner, A. Physicalimplementation of the dspin network-on-chip in the faust architecture. In Proc.Int’l Symp. on Networks-on-Chips (2008), pp. 139–148.
[82] Pinto, A., Carloni, L. P., and Vincentelli, A. L. S. A methodologyfor constraint-driven synthesis of on-chip communications. IEEE Transactionson Computer Aided Design 28, 3 (2009), 364–377.
[83] Pullini, A., Angiolini, F., Meloni, P., Atienza, D., Murali, S.,Raffo, L., Micheli, G. D., and Benini, L. NoC design and implemen-tation in 65nm technology. In Proc. Int’l Symp. on Networks-on-Chip (May2007), pp. 273–282.
105
[84] Quinn, N., and Breuer, M. A forced directed component placement pro-cedure for printed circuit boards. IEEE Transactions on Circuits and Systems26, 6 (June 1979), 377–388.
[85] Quinton, B. R., Greenstreet, M. R., and Wilton, S. J. E. Practicalasynchronous interconnect network design. IEEE Trans. Very Large ScaleIntegr. Syst. 16, 5 (2008), 579–588.
[86] Rijpkema, E., Goossens, K., Radulescu, J. D. A., van Meerbergen,J., Wielage, P., and Waterlander, E. Trade offs in the design of arouter with both guaranteed and best-effort services for networks on chip. IEEProceedings on Computers and Digital Technique 150, 5 (Sept. 2003), 294–302.
[87] Salminen, E., Srinivasan, K., and Lu, Z. OCP-IP Network-on-ChipBenchmarking Work Group Overview. Technical Report, OCP InternationalPartnership Association, Inc. (Feb. 2011).
[88] Seiculescu, C., Murali, S., Benini, L., and De Micheli, G. Noctopology synthesis for supporting shutdown of voltage islands in socs. In Proc.ACM/IEEE Design Automation Conference (2009), pp. 822–825.
[89] Seiculescu, C., Murali, S., Benini, L., and De Micheli, G. Sunfloor3d: a tool for networks on chip topology synthesis for 3d systems on chips. InProc. Design, Automation, and Test in Europe (2009), pp. 9–14.
[90] Seitz, C. System timing. Addison-Wesley, 1980, ch. 7. In C.A. Mead andL.A. Conway, editors, Introduction to VLSI Systems.
[91] Shaw, A. Fixed-length packets versus variable-length packets in fast packetswitching networks. In Tech. Report, Massachusetts Inst. Technology (1994).
[92] Sheibanyrad, A., Panades, I. M., and Greiner, A. Systematic com-parison between the asynchronous and the multi-synchronous implementationsof a network on chip architecture. In Proc. Design, Automation, and Test inEurope (2007), pp. 1090–1095.
[93] Soteriou, V., Eisley, N., Wang, H., Li, B., and Peh, L.-S. Polaris: Asystem-level roadmap for on-chip interconnection networks. In Proc. Int’l Conf.on Computer Design (October 2006), pp. 134–141.
[94] Soteriou, V., Wang, H., and Peh, L.-S. A statistical traffic model foron-chip interconnection networks. In Proc. Int’l Symp. on Modeling, Analysis,and Simulation (2006), pp. 104–116.
[95] Sotiriou, C. P. Implementing asynchronous circuits using a conventionaleda tool-flow. In Proc. ACM/IEEE Design Automation Conference (2002),pp. 415–418.
106
[96] Sparsø, J. Future networks-on-chip; will they be synchronous or asyn-chronous? (invited talk). In SSoCC’04 (Swedish System on Chip Conference,Bastad) (2004).
[97] Sparsø, J., and Furber, S. Principles of asynchronous circuit design: asystems perspective. European low-power initiative for electronic system design.Kluwer Academic Publishers, 2001.
[98] SPEC. The standard performance evaluation corporation. http://www.spec.org/hpg/.
[99] Srinivasan, K., and Chatha, K. S. A low complexity heuristic for sign ofcustom network-on-chip architectures. In Proc. Design, Automation, and Testin Europe (Mar. 2006), pp. 1–6.
[100] Srinivasan, K., Chatha, K. S., and Konjevod, G. Linear-programming-based techniques for synthesis of network-on-chip architectures. IEEE Trans.Very Large Scale Integr. Syst. 14, 4 (2006), 407–420.
[101] Stensgaard, M. B., and Sparsø, J. Renoc: A network-on-chip architecturewith reconfigurable topology. In Proc. Int’l Symp. on Networks-on-Chips (LosAlamitos, CA, USA, 2008), vol. 0, IEEE Computer Society, pp. 55–64.
[102] Stevens, K., Golani, P., and Beerel, P. Energy and performance modelsfor synchronous and asynchronous communication. Trans. on Very Large ScaleIntegration Systems 19, 3 (2011), 369–382.
[103] Stevens, K. S. Practical Verification and Synthesis of Low Latency Asyn-chronous Systems. PhD thesis, Univ. of Calgary, Sept. 1994.
[104] Stevens, K. S. Energy and performance models for clocked and asynchronouscommunication. In Int’l Symp. on Asynchronous Circuits and Systems (May2003), pp. 56–66.
[105] Stevens, K. S., Ginosar, R., and Rotem, S. Relative timing. IEEETrans. on VLSI Systems 11, 1 (2003), 129–140.
[106] Stevens, K. S., Xu, Y., and Vij, V. Characterization of asynchronoustemplates for integration into clocked cad flows. In Int’l Symp. on AsynchronousCircuits and Systems (May 2009), pp. 151–161.
[107] Tamhankar, R. R., Murali, S., and De Micheli, G. Performance drivenreliable link design for networks on chips. In Proc. Asia and South PacificDesign Automation Conference (2005), pp. 749–754.
[108] Tensilica, Inc. Xtensa Products. http://www.tensilica.com/products/xtensa-customizable.htm.
[109] The Embedded Microprocessor Benchmark Consortium. http://http://eembc.org.
107
[110] Thid, R., Sander, I., and Jantsch, A. Flexible bus and noc performanceanalysis with configurable synthetic workloads. In Proc. EUROMICRO Conf.on Digital System Design (2006), pp. 681–688.
[111] Thomadsen, T., and Clausen, J. Hierarchical network design using simu-lated annealing. Tech. rep., Informatics and Mathematical Modelling, TechnicalUniversity of Denmark, DTU, Richard Petersens Plads, Building 305, DK-2800Kgs. Lyngby, sep 2002.
[112] Thompson, D., and Bilbro, G. Comparison of a genetic algorithm witha simulated annealing algorithm for the design of an atm network. IEEECommunications Letters 4, 8 (Aug. 2000), 267–269.
[113] Tol, E. B. V. D., and Jaspers, E. G. T. Mapping of mpeg-4 decoding ona flexible architecture platform. In Media Processors (2002), pp. 1–13.
[114] Tran, A. T., Truong, D. N., and Baas, B. A reconfigurable source-synchronous on-chip network for gals many-core platforms. Trans. Comp.-AidedDes. Integ. Cir. Sys. 29 (June 2010), 897–910.
[115] Varatkar, G. V., and Marculescu, R. On-chip traffic modeling andsynthesis for mpeg-2 video applications. Trans. on Very Large Scale IntegrationSystems 12, 1 (2004), 108–119.
[116] Wang, H., Peh, L.-S., and Malik, S. Power-driven design of routermicroarchitectures in on-chip networks. In Proc. IEEE/ACM Int’l Symp. onMicroarchitecture (2003), pp. 105–116.
[117] Wang, H., Zhu, X., Peh, L.-S., and Malik, S. Orion: A Power-Performance Simulator for Interconnection Networks. In Proc. IEEE/ACMInt’l Symp. on Microarchitecture (Nov. 2002), pp. 294–305.
[118] Wang, M., Madhyastha, T., Chan, N. H., Papadimitriou, S., andFaloutsos, C. Data mining meets performance evaluation: fast algorithms formodeling bursty traffic. In Proc. International Conference on Data Engineering(2002), pp. 507–516.
[119] Wolf, W., Jerraya, A. A., and Martin, G. Multiprocessor System-on-Chip (MPSoC) Technology. IEEE Transactions on Computer-Aided Design ofIntegrated Circuits and Systems 27, 10 (Oct. 2008), 1701–1713.
[120] Wolkotte, P. T., Smit, G. J. M., Rauwerda, G. K., and Smit, L. T.An energy-efficient reconfigurable circuit-switched network-on-chip. In Proc.Int’l Parallel and Distributed Processing Symposium (Los Alamitos, CA, USA,2005), vol. 4, IEEE Computer Society, p. 155.
[121] Woo, S. C., Ohara, M., Torrie, E., Singh, J. P., and Gupta, A.The splash-2 programs: characterization and methodological considerations.SIGARCH Comput. Archit. News 23 (May 1995), 24–36.
108
[122] Xu, J., Wolf, W., Henkel, J., and Chakradhar, S. A design methodol-ogy for application-specific networks-on-chip. Trans. on Embedded ComputingSys. 5, 2 (2006), 263–280.
[123] Xu, Y., and Stevens, K. S. Automatic synthesis of computation interferenceconstraints for relative timing verification. In Proc. of the 26th Intl. Conf. onComputer Design (2009), pp. 16–22.
[124] Ye, T. T., Benini, L., and De Micheli, G. Packetization and routinganalysis of on-chip multiprocessor networks. Journal of Systems Architecture50 (February 2004), 81–104.
[125] You, J. Asynchronous Network-On-Chip Design and Evaluation. PhD thesis,University of Utah, May 2011.
[126] You, J., Gebhardt, D., and Stevens, K. S. Bandwidth Optimizationin Asynchronous NoCs by Customizing Link Wire Length. In InternationalConference on Computer Design (2010), pp. 455–461.
[127] Zimmermann, H. Osi reference model–the iso model of architecture for opensystems interconnection. IEEE Transactions on Communications 28, 4 (Apr.1980), 425–432.