Embed Size (px)
Citation preview
ENERGY EFFICIENCY STUDY AT EL ARENAL DRINKING WATER FACILITY (PAITA – PERU) FINAL REPORT
July 2005 This publication was produced for review by the United States Agency for International Development. It was prepared by International Resources Group (IRG).

COVER PHOTO Arrangement of pumps at El Arenal pumping station Nº 1.
ENERGY EFFICIENCY STUDY AT EL ARENAL DRINKING WATER PRODUCTION FACILITY (PAITA, PERU) FINAL REPORT July 2005
International Resources Group 1211 Connecticut Avenue, NW, Suite 700 Washington, DC 20036 202-289-0100 Fax 202-289-7601 www.irgltd.com DISCLAIMER The author’s views expressed in this publication do not necessarily reflect the views of the United States Agency for International Development or the United States Government.


ENERGY EFFICIENCY STUDY IN EL ARENAL DRINKING WATER PRODUCTION FACILITY i
CONTENTS
Acronyms and Abbreviations................................................................................ v
Executive Summary ............................................................................................... 1
1 Introduction......................................................................................... 7 1.1 Background ................................................................................................................................ 7 1.2 Objectives .................................................................................................................................. 8 1.3 Scope of Work ......................................................................................................................... 8 1.4 Methodology.............................................................................................................................. 8 1.5 Participants...............................................................................................................................11
2 General Information about the Facility.......................................... 13 2.1 Facility Identification and Geographical Location ..........................................................13 2.2 Drinking Water Production Process .................................................................................13 2.3 Description of the Facility .................................................................................................... 15 2.4 Operation Regime..................................................................................................................17 2.5 Physical Condition of the Electrical Installations ...........................................................17
3 Energy Supply and Distribution...................................................... 19 3.1 Electricity Supply and Billing ................................................................................................19 3.2 Emergency System .................................................................................................................19 3.3 Electricity Distribution ..........................................................................................................20 3.4 Energy Historical Consumption and Peak Demand......................................................21 3.5 Electricity Costs......................................................................................................................21
4 Institutional Analysis......................................................................... 23 4.1 The Players...............................................................................................................................23 4.2 Issues .........................................................................................................................................23 4.3 Recommendation ...................................................................................................................23
5 Description and Analysis of the Improvements ............................ 25 5.1 Installation of a Reactive Compensation System ............................................................25 5.2 Selection of the Optimum Load and Self-Generation in Peak Hours ......................26 5.3 Selection of Optimum Feed line Tariff— Treatment Plant.........................................27 5.4 Substitution of Conventional motors by High-Efficiency ones....................................29 5.5 Control of Water-Pumping Equipment.............................................................................31 5.6 Maintenance and Application of Water Pump Coating ...............................................31 5.7 Other Improvements ............................................................................................................34

Contents
ii ENERGY EFFICIENCY STUDY IN EL ARENAL DRINKING WATER PRODUCTION FACILITY
6 Final Results....................................................................................... 37 6.1 Summary of the Most Attractive Options........................................................................37 6.2 Conclusions and Recommendations..................................................................................38
Annex 1. Energy Analysis of the Facility ............................................................ 41 Energy Analysis of Electrical Installations.....................................................................................42 Energy Analysis of Mechanical Installations .................................................................................45 Analysis of Control and Measurement Instruments..................................................................47 Summary of Energy Diagnostic of the Installations ..................................................................48

Contents
ENERGY EFFICIENCY STUDY IN EL ARENAL DRINKING WATER PRODUCTION FACILITY iii
LIST OF FIGURES
Figure 2-1. Geographic Location of Facility...............................................................................................................13 Figure 2-2. Drinking Water Production Process .....................................................................................................14 Figure 2-3. Layout Diagram...........................................................................................................................................16 Figure 3-1. Electricity Distribution ..............................................................................................................................20 Figure 5-4. Comparison of Motor Efficiencies (%)...................................................................................................29 Figure A1-1. Actions Matrix: Energy Diagnostic ......................................................................................................49

Contents
iv ENERGY EFFICIENCY STUDY IN EL ARENAL DRINKING WATER PRODUCTION FACILITY
LIST OF TABLES
Table ES-1. Identified Energy-saving Measures and Potential Savings ................................................................... 4 Figure 1-1. Work Methodology ...................................................................................................................................10 Table 2-1. Technical Data of Pumping Equipment ...................................................................................................15 Table 2-2. Characteristics of Conduction and Impulse Pipelines.........................................................................16 Table 3-1. EPS Grau Paita-Talara System Feed Lines (Water Production) ......................................................19 Table 3-2. Feed Line Nº 12317150..............................................................................................................................21 Table 3-3. Electricity Costs ...........................................................................................................................................21 Table 5-1. Summary of Reactive Compensation ......................................................................................................25 Table 5-2. Tariff Options Invoicing..............................................................................................................................26 Table 5-3. Optimum Tariff Options for EPS Grau...................................................................................................28 Table 5-4. Assessment for the Substitution of Conventional Motors by High-Efficiency Ones..................30 Table 5-5. Assessment for the Substitution of the ALSTHOM BELFORT Motor..........................................30 Table 5-6. Pump Efficiencies..........................................................................................................................................31 Table 5-7. Summary of Energy and Economical Savings of Pumps.......................................................................33 Table 6-1. Best Energy Savings Options and Potential Savings .............................................................................37 Table A1-1. Motor – Pump #1: 500 kW, 6000V, 1190 rpm, Cos Ф= 0.825....................................................42 Table A1-2. Motor – Pump #3: 700 hp, 6000V, 1785 rpm. ..................................................................................42 Table A1-3. Fans:440 V...................................................................................................................................................42 Table A1-4. Motor – Pump #1: 250 hp, 440V, 1780 rpm. ....................................................................................43 Table A1-5. Motor – Pump #2: 250 hp, 440V, 1780 rpm. ....................................................................................43 Table A1-6. Total Motor – Pumps #1 and #2 .........................................................................................................43 Table A1-7. Total Motor – Pumps #2 and #3 .........................................................................................................43 Table A1-8. Motor – Pump #1: 600 hp, 6050V, 1787 rpm. ..................................................................................43 Table A1-9. Motor – Pump #2: 600 hp, 6050V, 1787 rpm. ..................................................................................44

ENERGY EFFICIENCY STUDY IN EL ARENAL DRINKING WATER PRODUCTION FACILITY v
ACRONYMS AND ABBREVIATIONS
B/C Benefit/Cost
BT Baja tension or LOW VOLTAGE
DN Diametro Nominal or Nominal Diameter
EAP El Arena Piata (facility)
EGAT Economic Growth, Agriculture and Trade (Bureau of)
ENOSA Local electric utility
EPS Empresa Proveedora de Servicios or Service Company
ESCO Energy Service Company
GOJ Government of Japan
GOP Government of Peru
HP Horse Power
IDB Inter-American Development Bank
IQC Indefinite Quantity Contract
KV KiloVolt
KVA KiloVolt Ampere
KVAr KiloVolt Ampere reactive
KW KiloWatt
KWh KiloWatt-hour
MT Media Tension or Medium Voltage
NPV Net Present Value
O&M Operation and Maintenance
OPH Off Peak Hours
PSP Private Service Provider
Sol/Soles Peruvian currency. 1 US $= 3.26 Peruvian Soles
USAID United States Agency for International Development


ENERGY EFFICIENCY STUDY IN EL ARENAL DRINKING WATER PRODUCTION FACILITY 1
EXECUTIVE SUMMARY
The El Arenal-Paita (EAP) water system, located in northern Peru near the main city of Piura, is a combined drinking water-production (El Arenal) and -distribution (Paita) service. Built as a modern, efficient concern in 1979 by the French company, Degrémont, its performance had deteriorated significantly by the 1990s. El Niño hit EAP twice; and recurrent financial, operational, and managerial problems plagued the system. In the early 1990s, these difficulties and accompanying deterioration in service led to change: Operation and management (O&M) of the broader regional Piura system was transferred to a new municipal service company, EPS Grau, S.A., a publicly owned, commercially managed entity having local provincial and municipal authorities as shareholders.
Unsatisfactory reforms. Unfortunately, this reform has not been as successful as originally expected. In particular, the quality of service—water quality, availability and pressure at the distribution level, and wastewater treatment—has continued to deteriorate. Managerial and commercial difficulties have resulted in major financial stress and an alarming level of indebtedness. Thus, EPS Grau has often been insolvent and unable to finance investments needed for service improvements.
Problems have been exacerbated over the last 10 years by a culture where local government has routinely interfered in the company’s operation and management. This has led to, for example, too many people being employed, many of whom have not received adequate training.
Restructuring. Faced with this difficult context, the shareholders and the creditors agreed in early 2004 to implement a 30-year restructuring plan. The plan’s key component, private sector participation (PSP), involves the private sector as a management alternative to improve service quality. PROINVERSION, a division of the Peruvian Ministry of Housing, Construction, and Sanitation, supports this plan, which will integrate a private O&M operator into EPS Grau in 2005. In parallel, the government of Peru (GOP) negotiated a loan with the government of Japan (GOJ) and other creditors for an investment program of US$79.5 million, which also includes a provision for a private operator within EPS Grau.
The InterAmerican Development Bank (IDB) is part of the overall rehabilitation project and plans to approve a loan to the GOP to finance programs to improve drinking water and drainage systems in inland cities. The Sanitation Sector Support Program Phase II (IDB Project PE-0142), with approval planned for August 2005, has a budget of US$90 millions (US$50 million from IDB, US$25 million in German assistance, and US$15 million for local counterpart funding). EPS Grau will be one of the loan beneficiaries. Its El Arenal Water system (design capacity of 780 l/sec, operational capacity of 570 l/sec) is one of the systems owned by EPS Grau that will be the object of a major rehabilitation program. The El Arenal system is in poor shape overall and operates inter alia with relatively high energy costs (more than 1 kWh/m3 versus an international range of 0.6-0.8, with Brazil and Mexico having the best operations).
Rapid energy enhancements. To make the transition to the private operator as efficient as possible while providing immediate relief to EPS Grau and its customers, the IDB
Built as a modern, efficient concern in 1979, the El Arenal-Piata water system’s performance had deteriorated significantly by the 1990s.
EPS Grau’s shareholders and creditors agreed in early 2004 to implement a restructuring plan over a period of 30 years. The plan involves the private sector as a management alternative to improve service quality.

Executive Summary
2 ENERGY EFFICIENCY STUDY IN EL ARENAL DRINKING WATER PRODUCTION FACILITY
sought to identify opportunities for enhancing energy efficiency that could be realized rapidly. Financing these very short-term efforts would enhance the concession’s financial attractiveness. EPS Grau had begun work in this area with energy conservation studies, particularly with a preliminary assessment of power factor improvements at various pumping stations. However, identifying, evaluating, and prioritizing the most attractive energy- and cost-saving options required a more detailed analysis.
Assessment. To accomplish this, the IDB requested assistance from USAID’s Bureau for Economic Growth, Agriculture, and Trade (USAID/EGAT) to fund a limited, quick-turn-around study to identify and quantify attractive energy-efficiency measures that EPS Grau could implement quickly. USAID/EGAT agreed to fund such a study through its Energy IQC II.
USAID/EGAT requested International Resources Group (IRG), one of its Energy IQC II contractors with relevant experience in Peru, to carry out this assignment. The original scope of the El Arenal-Paita production and distribution system analysis was later expanded to include a study of the two pumping stations of the western system, Talara 1 and Talara 2. From May 16 through June 22, 2005, IRG and its local subcontractors performed the required analysis in Peru.
The objective of the study was to identify the most attractive energy-efficiency opportunities at the El Arenal-Paita and Talara facilities and propose an action plan for these measures to be implemented in the short term. Most attractive opportunities are defined here as those with Simple Payback Periods of 18 months or less and that can be easily implemented at the site.
Specifically, IRG’s scope of work aimed to accomplish the following:
1. Visit the installations and compile basic information about energy consumption (electricity invoices) and main electricity-consuming equipment (engines, pumps, etc.);
2. Review the preliminary investment plan of the service company in the energy-efficiency component of the IDB loan and assess its feasibility;
3. Conduct a diagnosis of the electrical installations and determine the energy consumption and power demand for each process of the drinking water treatment plant;
4. Assess the physical condition of the electrical installations;
5. Perform an electricity tariff analysis, based on load diagrams and historical consumption, to define the best tariff option for the service-providing company;
6. Assess the need to improve power factors and reduce distribution losses;
7. Assess the benefits of automatic control of the water pumps, including variable-speed controls; and
8. Prepare an action plan to improve plant efficiency in the short, medium, and long term, including the introduction of new technologies.
Methodology and approach. The methodology used for the study, previously proven effective by IRG in similar studies, focused particularly on short-term results. For rapid identification of the most promising areas of potential savings, our two-pronged approach featured a focused visual inspection of the overall facility under guidance by EPS Grau. The approach’s other component was the use of a template, or checklist, of applicable energy-
The IDB sought to identify
opportunities for enhancing energy
efficiency that could be realized rapidly. Financing these very short-
term efforts would enhance
the concession’s financial
attractiveness.
Executive Summary
ENERGY EFFICIENCY STUDY IN EL ARENAL DRINKING WATER PRODUCTION FACILITY 3
saving measures in medium-sized water utilities. We developed a list of candidate measures (Action Matrix) by adapting those presented in recently published reports* by the US Alliance to Save Energy in its USAID-sponsored Watergy program. This Action Matrix matches a number of recognized energy-efficiency options, for example, more efficient controls, better maintenance of each major energy-using piece of equipment (see Table A1-1 in Annex 1).
The average cost of electricity in 2005 has been assessed based on existing electricity tariff schedules (deregulated tariff MT1 I 2004 and regulated 2005 utility tarries) of 3.6 US cents in 2004 and 4.8 US cents in 2005, using an exchange rate of Peruvian Sol S/. 3.26 Per US $.
We also used a discount rate of 12 % as recommend for other studies on similar systems and equipment costs were based on several quotes from local suppliers, inclusive of all taxes. Because of the short horizon for the study and the need to focus on the most attractive investments in the very short term (6 to 18 months), we used the Simple Payback Period as basic financial performance indicator Simple Payback Period for all measures and Net Present Value for investments of over US$ 10,000
With each measure now characterized by its technical and financial merits, we then organize them into three categories:
• Category 1: Low cost/no cost (less than $1,000 per measure and simple payback period of less than 6 months);
• Category 2: Medium term investment ( simple payback period of less than 18 months); and
• Category 3 Longer term investments(up to seven years’ simple payback period)
Final results are presented according to this format (see Table ES-1), which allows an immediate understanding of implementation priorities.
The field work consisted primarily of carrying out detailed measurements of equipment performance; collecting of technical and cost information (including tariffs and utility bills); and interviews of key personnel.
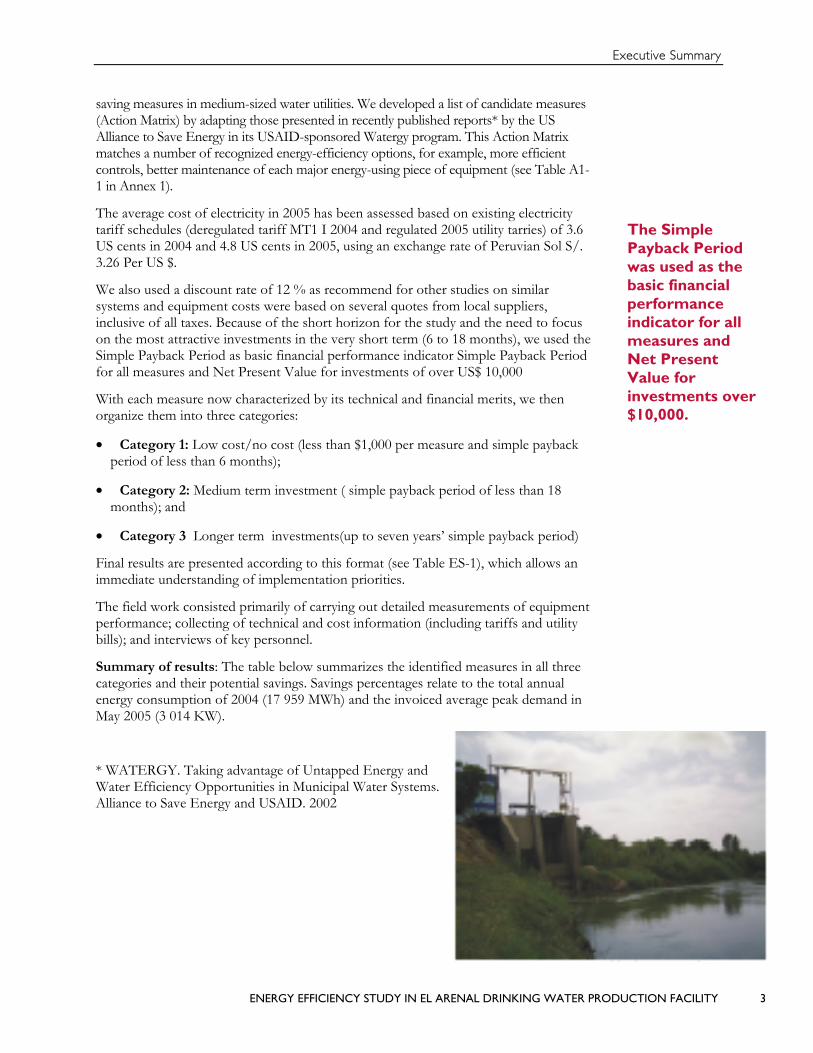
Summary of results: The table below summarizes the identified measures in all three categories and their potential savings. Savings percentages relate to the total annual energy consumption of 2004 (17 959 MWh) and the invoiced average peak demand in May 2005 (3 014 KW).
* WATERGY. Taking advantage of Untapped Energy and Water Efficiency Opportunities in Municipal Water Systems. Alliance to Save Energy and USAID. 2002
The Simple Payback Period was used as the basic financial performance indicator for all measures and Net Present Value for investments over $10,000.

Executive Summary
4 ENERGY EFFICIENCY STUDY IN EL ARENAL DRINKING WATER PRODUCTION FACILITY
Table ES-1. Identified Energy-saving Measures and Potential Savings
Measures
Max Demand Savings (KW)
Energy Savings (KWH)
Cost Savings (US$/Year)
Investment (US$)
Simple Payback Period (Months)
Benefit / Cost Relation
CATEGORY 1: Low-cost/No-cost Measures (Operations & Maintenance)
Selection of optimum tariff in collection plant
- - 23,382 0 - -
Selection of optimum tariff in treatment plant
- - 8,331 1,300 - -
Operational control of pumping equipment
- - 864 - - -
Pump basic maintenance
151 587,520 15,149 0 -
CATEGORY 2: Medium Term Measures
Installation of Reactive Power Compensation System ( capacitors)
65,466 52,000 10
Pumps major maintenance
127 625,802 30,805 33,054 13
Total savings 1+2 278 1,213,322 143,997 86,354 7
CATEGORY 3: Long-tem Measures
Generation plant for self-generation in peak hours
255,000 7 years
Substitution of two conventional motors (125 HP each) by high-efficiency ones
4 64,756 2,686 9,100 4.4 years 2.21
Replacement of ASTHOM BELFORT motor (500 KW) from collection plant
78 373,638 20,717 100,000 4.8 years 1.54
Total savings 3 82 438,394 23,403 364,100 4.4–7 years
Total savings (1 + 2+3)
359 1,651,717 167,400 450,454 2.7 years
Reference (total 2004 demand, power consumption...)
3,014 17,958,785 612,694
Savings percentage 11.9 9.2 27.3
CONCLUSIONS • The energy analysis of the El Arenal drinking water production system equipment
and installations showed that the general conditions of these old installations (with some motor changes) varies from average to bad, as evidenced through low efficiencies, mainly in pumps (see Actions Matrix: Diagnostic of Installations).
• The analysis of potential improvements, shown in Table ES-1: Identified Energy-saving Measures and Potential demand, energy and cost Savings, identified a number
Executive Summary
ENERGY EFFICIENCY STUDY IN EL ARENAL DRINKING WATER PRODUCTION FACILITY 5
of low-cost, short-term investment measures that could be implemented by EPS Grau. The table also lists medium investment improvements that EPS Grau could carry out. The analysis identified only one longer-term measure: self-generation in peak hours.
• Implementing all the measures listed in the table above would result in total cost savings of 27.3 percent, with an investment of $450,000. However, a more attractive program would be to implement only low-cost/no-cost and medium term measures at this time, because they would lead to cost savings of 23.5 percent at an investment cost of only $86,354 and an average payback period of 7 months.
MAJOR RECOMMENDATIONS Implementing first the low cost and medium investment measures would mean to carry out the following actions: • As the first priority, implement a small maintenance program for the pumps.
Electricity consumption will be reduced by up to 3.3 percent, representing a cost saving equivalent to 7.8 percent.
• Concurrently with the previous measure, EPS Grau should negotiate an electricity tariff change with ENOSA (from MT3FP to MT2) in Collection Plant (Feed line Nº 12517661) and, likewise, move from tariff BT3FP to BT5A in Treatment Plant (Feed line N° 12517670). These changes will allow a financial saving of up to 5.2 percent of the current electricity bill.
• In the very short term, implement operational control of the pumping equipment.
• Install capacitors at all major pumping stations.
• Replace the two 125-HP motors from Old Plant Pumping Station with others having the same capacity but higher efficiency; likewise, replace the 500-KW ALSTHOM BELFORT motor from the collection plant. At this time, a major maintenance activity is not justified.
• Institute a routine maintenance program on pumps throughout the system, with a special emphasis on the largest ones.
OTHER RECOMMENDATIONS To ensure continuity and sustainability of an energy-efficiency culture at the facility, we recommend two additional management actions. The first is to establish an ongoing energy-monitoring system; the second is to establish an energy committee within EPS Grau that would routinely assess energy consumption and cost patterns and make recommendations for further improvements in plant energy efficiency and energy cost containment.
FINAL NOTE If the recommended program is implemented, the El Arenal Paita facity would become more attractive to future Private Sector Providers because its specific costs of electricity per cubic meter would get closer to the regional average. In addition, the future concessionaire will have the opportunity to implement additional capital-intensive projects that could bring the energy performance in line with the best performance in the region.
The analysis of potential improvements identified a number of low-cost, short-term investment measures that could be implemented by EPS Grau.


ENERGY EFFICIENCY STUDY IN EL ARENAL DRINKING WATER PRODUCTION FACILITY 7
1 INTRODUCTION
1.1 BACKGROUND The El Arenal-Paita (EAP) water system, located in northern Peru near the main city of Piura, is a combined drinking water-production (El Arenal) and -distribution (Paita) service. Built as a modern, efficient concern in 1979 by the French company, Degrémont, its performance had deteriorated significantly by the 1990s. El Niño hit EAP twice; and recurrent financial, operational, and managerial problems plagued the system. In the early 1990s, these difficulties and accompanying deterioration in service led to change: Operation and management of the broader regional Piura system was transferred to a new municipal service company, EPS Grau, S.A., a publicly owned, commercially managed entity having local provincial and municipal authorities as shareholders.
Unfortunately, this reform has not been as successful as originally expected. In particular, the quality of service—water quality, availability and pressure at the distribution level, and wastewater treatment—has continued to deteriorate. Managerial and commercial difficulties have resulted in major financial stress and an alarming level of indebtedness. Thus, EPS Grau has often been insolvent and unable to finance investments needed for service improvements.
Problems have been exacerbated over the last 10 years by a culture where local government has routinely interfered in the company’s operation and management. This has led to, for example, too many people being employed, many of whom have not received adequate training.
Faced with this difficult context, the shareholders and the creditors agreed in early 2004 to implement a 30-year restructuring plan. The plan’s key component, private sector participation (PSP), involves the private sector as a management alternative to improve service quality. PROINVERSION, a division of the Peruvian Ministry of Housing, Construction, and Sanitation, supports this plan, which will integrate a private O&M operator into EPS Grau in 2005. In parallel, the government of Peru (GOP) negotiated a loan with the government of Japan (GOJ) for an investment program of US$79.5 million, which also includes a provision for a private operator within EPS Grau.
The InterAmerican Development Bank (IDB) is also part of the overall rehabilitation project and plans to approve a loan to the GOP to finance programs to improve drinking water and drainage systems in inland cities. The Sanitation Sector Support Program Phase II (IDB Project PE-0142), with approval planned for August 2005, has a budget of US$90 millions (US$50 million from IDB, US$25 million in German assistance, and US$15 million for local counterpart funding). EPS Grau will be one of the loan beneficiaries, as will be its El Arenal Water Treatment Plant (design capacity of 780 l/sec, operational capacity of 570 l/sec). The El Arenal system is in poor shape overall and operates inter alia with relatively high energy costs (more than 1 kWh/m3 versus an international range of 0.6-0.8, with Brazil and Mexico having the best operations).
To make the transition to the private operator as efficient as possible while providing immediate relief to EPS Grau and its customers, the IDB sought to identify opportunities for enhancing energy efficiency that could be realized rapidly. Financing
Built as a modern, efficient concern in 1979, the El Arenal-Piata water system’s performance had deteriorated significantly by the 1990s.
EPS Grau’s shareholders and creditors agreed in early 2004 to implement a restructuring plan over a period of 30 years. The plan involves the private sector as a management alternative to improve service quality.

Introduction
8 ENERGY EFFICIENCY STUDY IN EL ARENAL DRINKING WATER PRODUCTION FACILITY
these very short-term efforts would enhance the concession’s financial attractiveness. EPS Grau had begun work in this area with energy conservation studies, particularly with a preliminary assessment of power factor improvements at various pumping stations. However, identifying, evaluating, and prioritizing the most attractive energy- and cost-saving options required a more detailed analysis.
To accomplish this, the IDB requested assistance from USAID/EGAT to fund a limited, quick-turn-around study to identify and quantify attractive energy-efficiency measures that EPS Grau could implement quickly. USAID/EGAT agreed to fund such a study through its Energy IQC II.
USAID/EGAT requested International Resources Group (IRG), one of its Energy IQC II contractors with relevant experience in Peru, to carry out this assignment. The original scope of the El Arenal-Paita production and distribution system analysis was later expanded to include a study of the two pumping stations of the western system, Talara 1 and Talara 2. From May 16 through June 22, 2005, IRG and its local subcontractors performed the required analysis in Peru.
1.2 OBJECTIVES The objective of the study was to identify the most attractive energy-efficiency opportunities at the El Arenal-Paita and Talara facilities and propose an action plan for these measures to be implemented in the short term.
1.3 SCOPE OF WORK Specifically, IRG’s scope of work aimed to accomplish the following:
1. Visit the installations and compile basic information about energy consumption (electricity invoices) and main electricity-consuming equipment (engines, pumps, etc.);
2. Review the preliminary investment plan of the service company in the energy-efficiency component of the IDB loan and assess its feasibility;
3. Conduct a diagnosis of the electrical installations and determine the energy consumption and power demand for each process of the drinking water treatment plant;
4. Assess the physical condition of the electrical installations;
5. Perform an electricity tariff analysis, based on load diagrams and historical consumption, to define the best tariff option for the service-providing company;
6. Assess the need to improve power factors and reduce distribution losses;
7. Assess the benefits of automatic control of the water pumps, including variable-speed controls; and
8. Prepare an action plan to improve plant efficiency in the short, medium, and long term, including the introduction of new technologies.
1.4 METHODOLOGY
The IDB sought to identify
opportunities for enhancing energy
efficiency that could be realized rapidly. Financing these very short-
term efforts would enhance
the concession’s financial
attractiveness.
A view of the El Arenal raw-water pumping plant

Introduction
ENERGY EFFICIENCY STUDY IN EL ARENAL DRINKING WATER PRODUCTION FACILITY 9
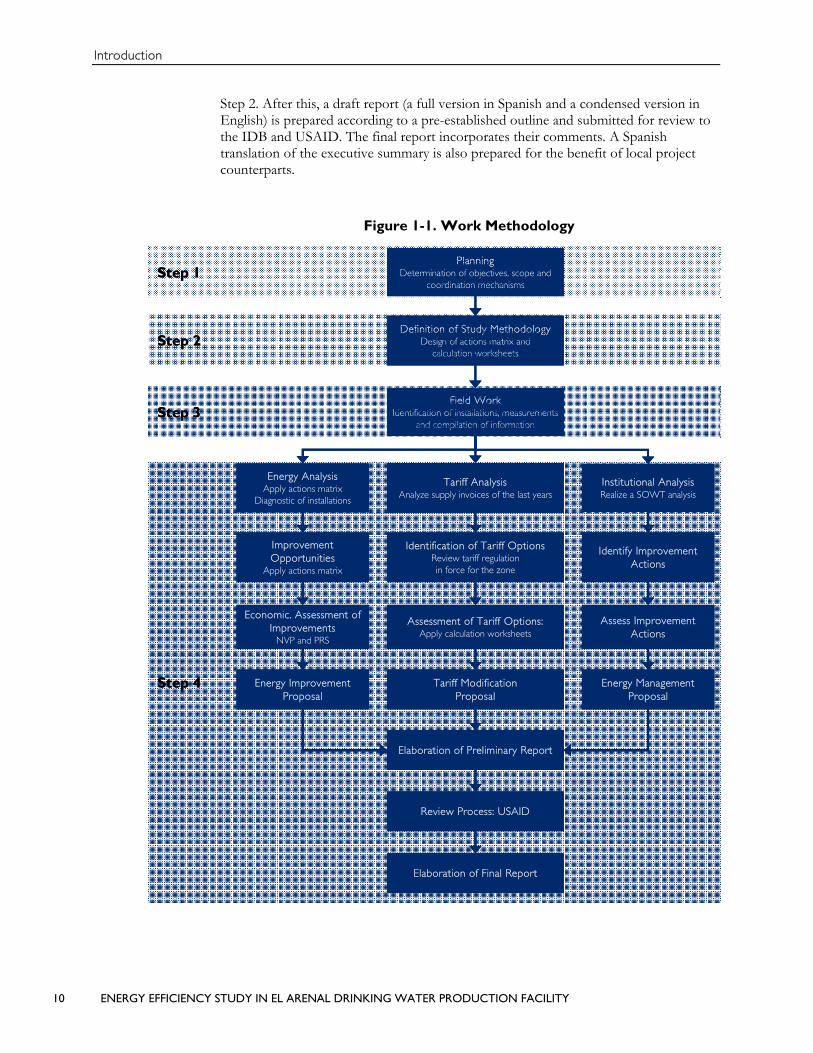
The methodology used for the study, previously proven effective by IRG in similar studies, focused particularly on short-term results. As shown in Figure 1-1, below, and presented in more detail in Annex 1, the study involved the following four major steps:
STEP 1 PLANNING This step involved developing a work plan for each individual involved in the study together with a schedule, expected deliverables, and coordination mechanisms. It also included organizing the rental of measuring equipment, local transportation, and counterpart roles).
STEP 2 DEFINITION OF STUDY METHODOLOGY We then developed our methodology for identifying, quantifying, and evaluating the financial merits of selected energy-efficiency measures within the study’s time constraints. For rapid identification of the most promising areas of potential savings, our two-pronged approach featured a focused visual inspection of the overall facility under guidance from EPS Grau senior technical staff members who were knowledgeable about specific parts of the system. The approach’s other component was the use of a template, or checklist, of applicable energy-saving measures in medium-sized water utilities. We developed a list of candidate measures, shown in Table 1-1 Action Matrix, by adapting those presented in recently published reports by the US Alliance to Save Energy in its USAID-sponsored Watergy program.
FINANCIAL ASSUMPTIONS Power costs: existing tariffs or US c 4.80 per KWh (2005 prices)
• Discount rate: 12 percent
• Equipment costs: based on several quotes from local suppliers, inclusive of all taxes
• Financial performance indicators: simple payback for all measures and Net Present Value (NPV) for investments of over US$10,000
With each measure now characterized by its technical and financial merits, we then organize them into three categories:
• Category 1: Low cost/no cost (Payback of 0 to 6 months)
• Category 2: Medium term (less than 18 months)
• Category 3: Longer term (up to 7 years given selected discount rate of 12%)
Final results are presented according to this format, which allows an immediate understanding of implementation priorities.
STEP 3 FIELD WORK The field work consisted primarily of carrying out detailed measurements of equipment performance; collecting of technical and cost information (including tariffs and utility bills); and interviews of key personnel.
STEP 4 ANALYSIS AND REPORT PREPARATION This step involves validating the data gathered in the field (pre-existing or new from measurements); running technical computations of possible savings for each specific measure; and evaluating their costs and benefits using the worksheets developed in
METHODOLOGY Step 1: Planning
Step 2: Definition of study methodology
Step 3: Field work
Step 4: Analysis and report preparation
DEFINITIONS Low cost/ nocost: less than 6 months payback
Medium term: less than 18 months payback
Longer term ( up to 7 years payback)
Introduction
10 ENERGY EFFICIENCY STUDY IN EL ARENAL DRINKING WATER PRODUCTION FACILITY
Step 2. After this, a draft report (a full version in Spanish and a condensed version in English) is prepared according to a pre-established outline and submitted for review to the IDB and USAID. The final report incorporates their comments. A Spanish translation of the executive summary is also prepared for the benefit of local project counterparts.
Figure 1-1. Work Methodology
Step 4
Institutional AnalysisRealize a SOWT analysis
Identify Improvement Actions
Assess Improvement Actions
Energy Management Proposal
Energy AnalysisApply actions matrix
Diagnostic of installations
Improvement Opportunities
Apply actions matrix
Economic. Assessment of Improvements
NVP and PRS
Energy Improvement Proposal
PlanningDetermination of objectives, scope and
coordination mechanisms
Definition of Study MethodologyDesign of actions matrix and
calculation worksheets
Field Work Identification of installations, measurements
and compilation of information
Tariff AnalysisAnalyze supply invoices of the last years
Identification of Tariff OptionsReview tariff regulationin force for the zone
Assessment of Tariff Options:Apply calculation worksheets
Tariff Modification Proposal
Elaboration of Preliminary Report
Review Process: USAID
Elaboration of Final Report
Step 1
Step 2
Step 3
Step 4
Institutional AnalysisRealize a SOWT analysis
Identify Improvement Actions
Assess Improvement Actions
Energy Management Proposal
Energy AnalysisApply actions matrix
Diagnostic of installations
Improvement Opportunities
Apply actions matrix
Economic. Assessment of Improvements
NVP and PRS
Energy Improvement Proposal
PlanningDetermination of objectives, scope and
coordination mechanisms
Definition of Study MethodologyDesign of actions matrix and
calculation worksheets
Field Work Identification of installations, measurements
and compilation of information
Tariff AnalysisAnalyze supply invoices of the last years
Identification of Tariff OptionsReview tariff regulationin force for the zone
Assessment of Tariff Options:Apply calculation worksheets
Tariff Modification Proposal
Elaboration of Preliminary Report
Review Process: USAID
Elaboration of Final Report
Step 1
Step 2
Step 3

Introduction
ENERGY EFFICIENCY STUDY IN EL ARENAL DRINKING WATER PRODUCTION FACILITY 11
1.5 PARTICIPANTS A team of foreign and local consultants, working closely with EPS Grau S.A. and the IDB, performed this study. The following specialists participated in its development:
• Alain Streicher, international expert, IRG.
• Amadeo Carrillo, local expert
• Fredy Apaza, electrical measurement expert
The following local energy audit specialists also collaborated in the field work:
• Israel De La Cruz
• José Aguilar
• Elsa Carbajal.


ENERGY EFFICIENCY STUDY IN EL ARENAL DRINKING WATER PRODUCTION FACILITY 13
2 GENERAL INFORMATION ABOUT THE FACILITY
2.1 FACILITY IDENTIFICATION AND GEOGRAPHICAL LOCATION
The drinking water production system of Paita–Talara (El Arenal Water Treatment Plant), managed by the municipal service provider, EPS Grau S.A., is located in the northern department, Piura, Peru, approximately 1,100 kilometers (km). from Lima. Figure 2-1 shows the geographic location of the facility.
Figure 2-1. Geographic Location of Facility
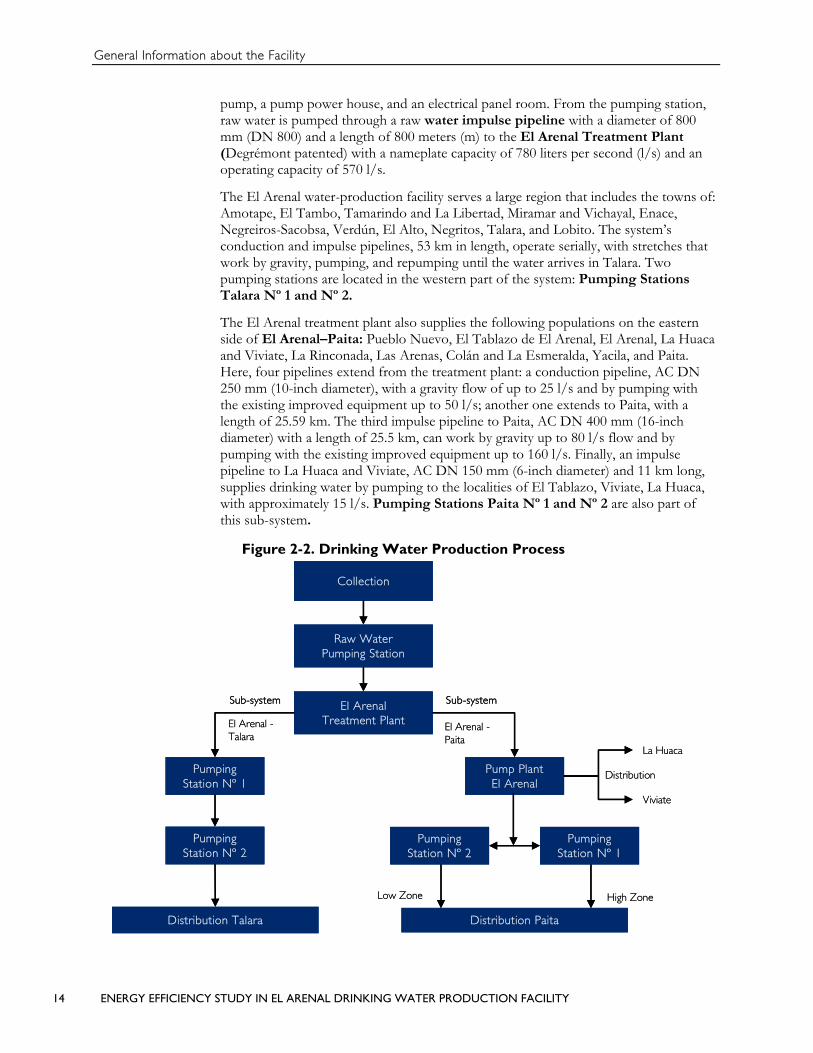
2.2 DRINKING WATER PRODUCTION PROCESS As shown in Figure 2-2, below, the Paita–Talara drinking water production system includes a raw water collection plant that takes water from Chira River through two reinforced concrete structures; one for water collection and the other for raw water pumping, both being connected by a 800-mm pipeline. The raw water pumping station consists of a suction tunnel, a tunnel cleaning box replaced by the submersion
General Information about the Facility
14 ENERGY EFFICIENCY STUDY IN EL ARENAL DRINKING WATER PRODUCTION FACILITY
pump, a pump power house, and an electrical panel room. From the pumping station, raw water is pumped through a raw water impulse pipeline with a diameter of 800 mm (DN 800) and a length of 800 meters (m) to the El Arenal Treatment Plant (Degrémont patented) with a nameplate capacity of 780 liters per second (l/s) and an operating capacity of 570 l/s.
The El Arenal water-production facility serves a large region that includes the towns of: Amotape, El Tambo, Tamarindo and La Libertad, Miramar and Vichayal, Enace, Negreiros-Sacobsa, Verdún, El Alto, Negritos, Talara, and Lobito. The system’s conduction and impulse pipelines, 53 km in length, operate serially, with stretches that work by gravity, pumping, and repumping until the water arrives in Talara. Two pumping stations are located in the western part of the system: Pumping Stations Talara Nº 1 and Nº 2.
The El Arenal treatment plant also supplies the following populations on the eastern side of El Arenal–Paita: Pueblo Nuevo, El Tablazo de El Arenal, El Arenal, La Huaca and Viviate, La Rinconada, Las Arenas, Colán and La Esmeralda, Yacila, and Paita. Here, four pipelines extend from the treatment plant: a conduction pipeline, AC DN 250 mm (10-inch diameter), with a gravity flow of up to 25 l/s and by pumping with the existing improved equipment up to 50 l/s; another one extends to Paita, with a length of 25.59 km. The third impulse pipeline to Paita, AC DN 400 mm (16-inch diameter) with a length of 25.5 km, can work by gravity up to 80 l/s flow and by pumping with the existing improved equipment up to 160 l/s. Finally, an impulse pipeline to La Huaca and Viviate, AC DN 150 mm (6-inch diameter) and 11 km long, supplies drinking water by pumping to the localities of El Tablazo, Viviate, La Huaca, with approximately 15 l/s. Pumping Stations Paita Nº 1 and Nº 2 are also part of this sub-system.
Figure 2-2. Drinking Water Production Process
Collection
Sub-system
Raw Water Pumping Station
Pumping Station Nº 1
El ArenalTreatment Plant
Pump Plant El Arenal
Pumping Station Nº 2
Distribution Talara
Distribution
La Huaca
Viviate
Sub-system
El Arenal -Talara
El Arenal -Paita
Distribution Paita
Low Zone High Zone
Pumping Station Nº 2
Pumping Station Nº 1

General Information about the Facility
ENERGY EFFICIENCY STUDY IN EL ARENAL DRINKING WATER PRODUCTION FACILITY 15
2.3 DESCRIPTION OF THE FACILITY This section describes the technical characteristics of the main equipment and installations. The study assessed pumps, electric motors, and pipelines.
2.3.1 ELECTRIC PUMPS AND MOTORS The following chart shows the main characteristics of all motors and pumps located in every pumping station.
Table 2-1. Technical Data of Pumping Equipment Motor Pump
Nº Brand Power (HP) Brand Power (HP) Speed (RPM)
Raw water pumping plant
Pump Nº 1 Alsthom Belfort 670 Rateau 505 1,190
Pump Nº 2 US Motors 700 Goulds Pump 629 1,800
Pump Nº 3 US Motors 700 Goulds Pump 629 1,800
Pump Nº 4 Alsthom Belfort 670 Rateau 505 1,190
Old Plant pumping station
Pump Nº 1 Delcrosa S.A. 125 Hidrostal 100 1,770
Pump Nº 2 Delcrosa S.A. 125 Hidrostal 100 1,770
Pump Nº 3 Delcrosa S.A. 125 Hidrostal 100 1,770
Pumping station N° 1 Arenal – Paita Sub-system
Pump Nº 1 US Motors 50 Hidrostal 50 1,760
Pump Nº 2 US Motors 50 Hidrostal 50 1,760
Pump Nº 3 US Motors 50 Hidrostal 50 1,760
Pumping station N° 2 Arenal – Paita Sub-system
Pump Nº 1 Sihi Halberg 50 WEG 60 1,775
Pumping station N° 1 Arenal – Talara Sub-system
Pump Nº 1 US Motors 600 Ernest Vogel 509 1,780
Pump Nº 2 US Motors 600 Ernest Vogel 509 1,780
Pump Nº 3 US Motors 600 Ernest Vogel 509 1,780
Pump Nº 4 Alsthom Belfort 603 Rateau 603 1,750
Pumping station N° 2 Arenal – Talara Sub-system
Pump Nº 1 US Motors 600 Ernest Vogel 509 1,780
Pump Nº 2 US Motors 600 Ernest Vogel 509 1,780
Pump Nº 3 US Motors 600 Ernest Vogel 509 1,780
Pump Nº 4 Alsthom Belfort 603 Rateau 603 1,750
General Information about the Facility
16 ENERGY EFFICIENCY STUDY IN EL ARENAL DRINKING WATER PRODUCTION FACILITY
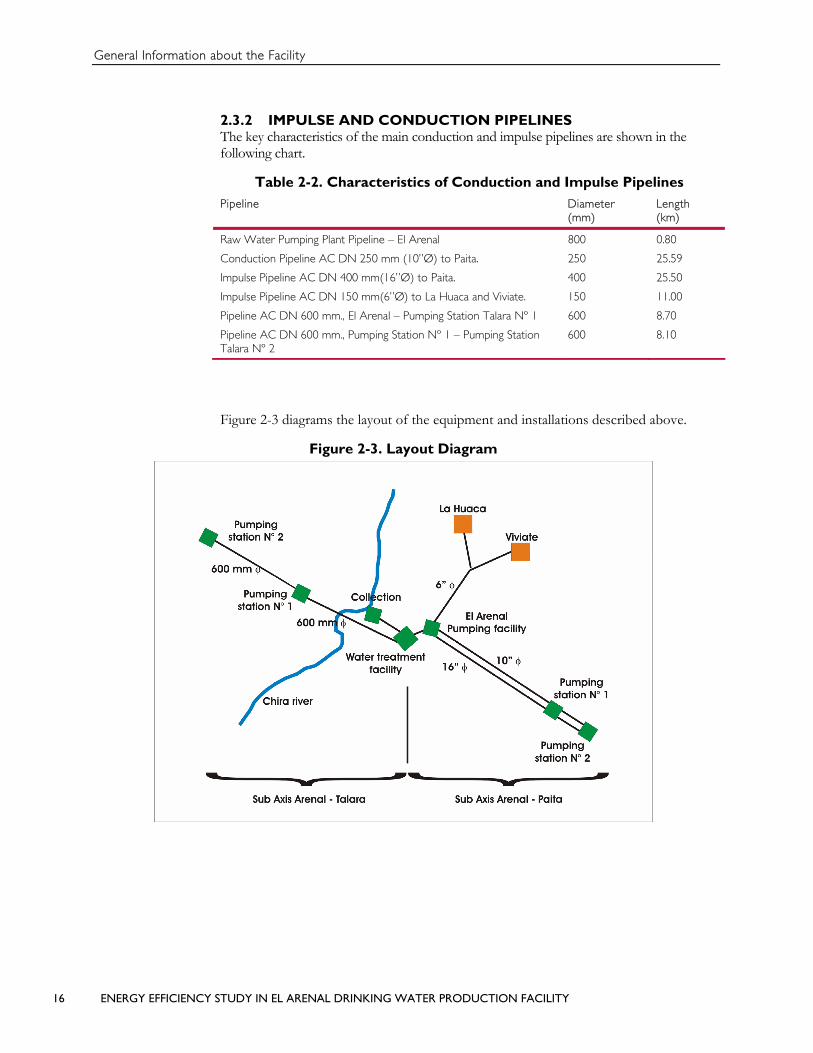
2.3.2 IMPULSE AND CONDUCTION PIPELINES The key characteristics of the main conduction and impulse pipelines are shown in the following chart.
Table 2-2. Characteristics of Conduction and Impulse Pipelines Pipeline Diameter
(mm) Length (km)
Raw Water Pumping Plant Pipeline – El Arenal 800 0.80
Conduction Pipeline AC DN 250 mm (10ӯ) to Paita. 250 25.59
Impulse Pipeline AC DN 400 mm(16ӯ) to Paita. 400 25.50
Impulse Pipeline AC DN 150 mm(6ӯ) to La Huaca and Viviate. 150 11.00
Pipeline AC DN 600 mm., El Arenal – Pumping Station Talara Nº 1 600 8.70
Pipeline AC DN 600 mm., Pumping Station Nº 1 – Pumping Station Talara Nº 2
600 8.10
Figure 2-3 diagrams the layout of the equipment and installations described above.
Figure 2-3. Layout Diagram

General Information about the Facility
ENERGY EFFICIENCY STUDY IN EL ARENAL DRINKING WATER PRODUCTION FACILITY 17
2.4 OPERATION REGIME The production plant operates in the following way:
• Collection: The raw water pumping station operates 24 hours daily, seven days a week, with two 500kW-pumps, with a peak demand of 983 kW in off-peak hours and one 400 kW-pump in peak hours (18:00 to 23:00 hours).
• Treatment Plant: Operates 24 hours per day all year long, with pumps that operate intermittently according to the requirements of treatment processes: filter washing pumps (30 kW), washing water pumps (7.5 kW), washing compressor (30 kW), with a total demand of (56.2 kW).
• Treated water pumping station for Paita: Operates 24 hours per day all year long with two 125HP-pumps, with a peak demand of 162 kW.
• Pumping station Talara Nº1: Operates 19 hours per day, from Monday to Sunday, with two 600HP-pumps, with a peak demand of 837 kW in off-peak hours.
• Pumping station Talara Nº2: Operates 19 hours per day, from Monday to Sunday, with two 600HP-pumps (837 kW) in off-peak hours.
Likewise, distribution-pumping stations Nº 1 (EB1) and Nº 2 (EB2) for the city of Paita operate 24 hours intermittently. The EB1 supplies Paita Alta zone and operates according to the level of the water reception tank of 800 m3. The EB2 supplies the zones of Yacila, Tablazo, SIPESA, FONAVI, and Keiko Sofia. It operates according to the drinking water dispatch program given by the Zonal Office.
2.5 PHYSICAL CONDITION OF THE ELECTRICAL INSTALLATIONS
A thorough walk-through of the five main pumping units and of the Paita distribution system revealed two major problems. First, a general lack of adequate maintenance, mainly as a result of insufficient budgets, has left many systems or units in very poor operating condition, as shown in the photos below.

General Information about the Facility
18 ENERGY EFFICIENCY STUDY IN EL ARENAL DRINKING WATER PRODUCTION FACILITY
Second, a several major design and repair anomalies were observed, all leading to poor energy performance (see photos below).
Based on our three weeks of field work, we rank the overall condition of the electrical installations from bad to average.

ENERGY EFFICIENCY STUDY IN EL ARENAL DRINKING WATER PRODUCTION FACILITY 19
3 ENERGY SUPPLY AND DISTRIBUTION
3.1 ELECTRICITY SUPPLY AND BILLING Electricity supply to the EPS Grau water production plant for Talara-Paita system comes from the energy distribution company ENOSA’s El Arenal substation through six feed lines—four medium-voltage (13.8 kV.) and two low-voltage.
It is important to mention that, since December 2004, EPS Grau has had only one feed line in El Arenal to supply the El Arenal water production plant and pumping stations. The free tariff contract (MT1) for this feed line was finished in December 2004, and this dramatically raised the energy and power costs. Consequently, EPS Grau decided to divide the MT1 feed line into six feed lines with regulated tariff.
The two treated water distribution stations in Paita have two additional medium-voltage supplies. Table 3-1 shows details of each mentioned line.
Table 3-1. EPS Grau Paita-Talara System Feed Lines (Water Production)
Reference Nº of Lines Tariff Contracted Power (kV)
Collection 12517661 MT3FP 950
El Arenal drinking water treatment plant 12517670 12517680
BT3FP BT3P
10 80
Treated water pumping station to Paita. 12517634 MT3FP 300
Pumping Station Nº1 to Talara. 12517643 MT2 1,000
Pumping Station Nº2 to Talara. 12517652 MT2 1,000
Treated water pumping station Paita 1. 12458079 MT3FP 86.8
Treated water pumping station Paita 2. 12317212 MT4FP 53.7
Each of the supplies is connected to main distribution panels. From these, energy is distributed to each pumping station’s equipment and other EPS Grau equipment.
3.2 EMERGENCY SYSTEM In a case of electricity supply interruption, there is currently no emergency electricity-generation set-up. Guaranteeing a continuous supply of drinking water to the people of Paita and Talara, including during energy service interruptions in ENOSA, will require having emergency generation sets in the collection and water treatment plants and pumping stations of Paita and Talara.
Energy Supply and Distribution
20 ENERGY EFFICIENCY STUDY IN EL ARENAL DRINKING WATER PRODUCTION FACILITY
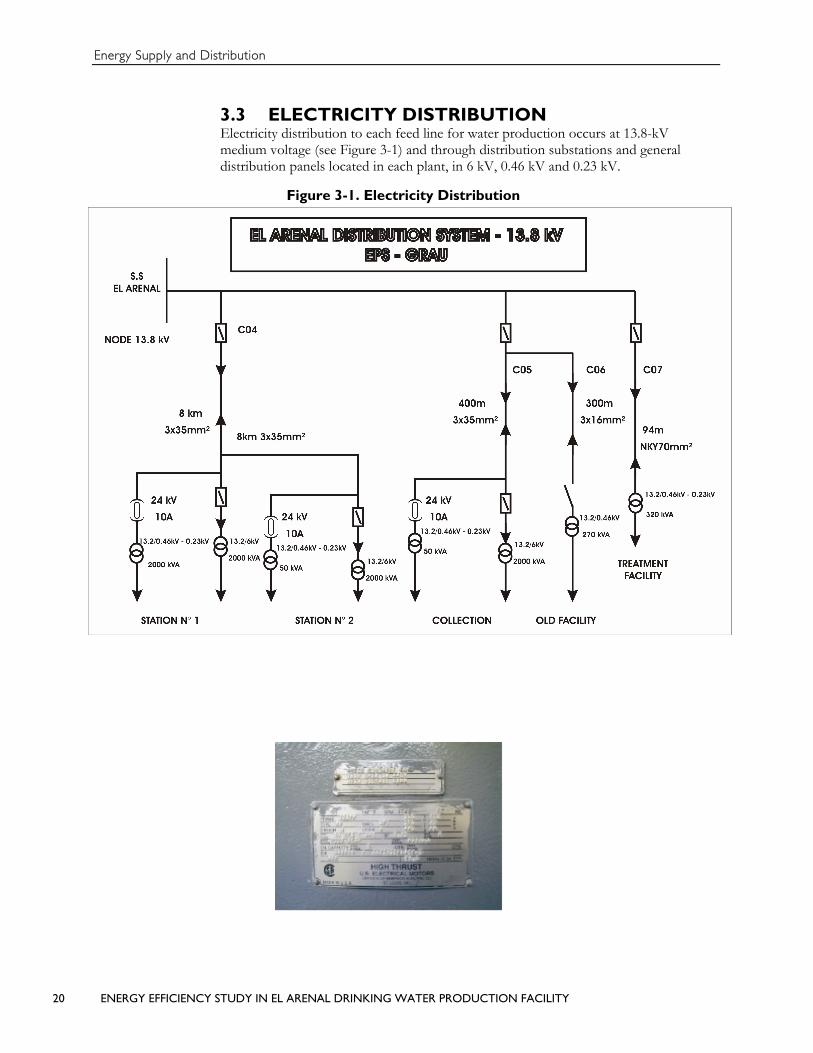
3.3 ELECTRICITY DISTRIBUTION Electricity distribution to each feed line for water production occurs at 13.8-kV medium voltage (see Figure 3-1) and through distribution substations and general distribution panels located in each plant, in 6 kV, 0.46 kV and 0.23 kV.
Figure 3-1. Electricity Distribution
Energy Supply and Distribution
ENERGY EFFICIENCY STUDY IN EL ARENAL DRINKING WATER PRODUCTION FACILITY 21
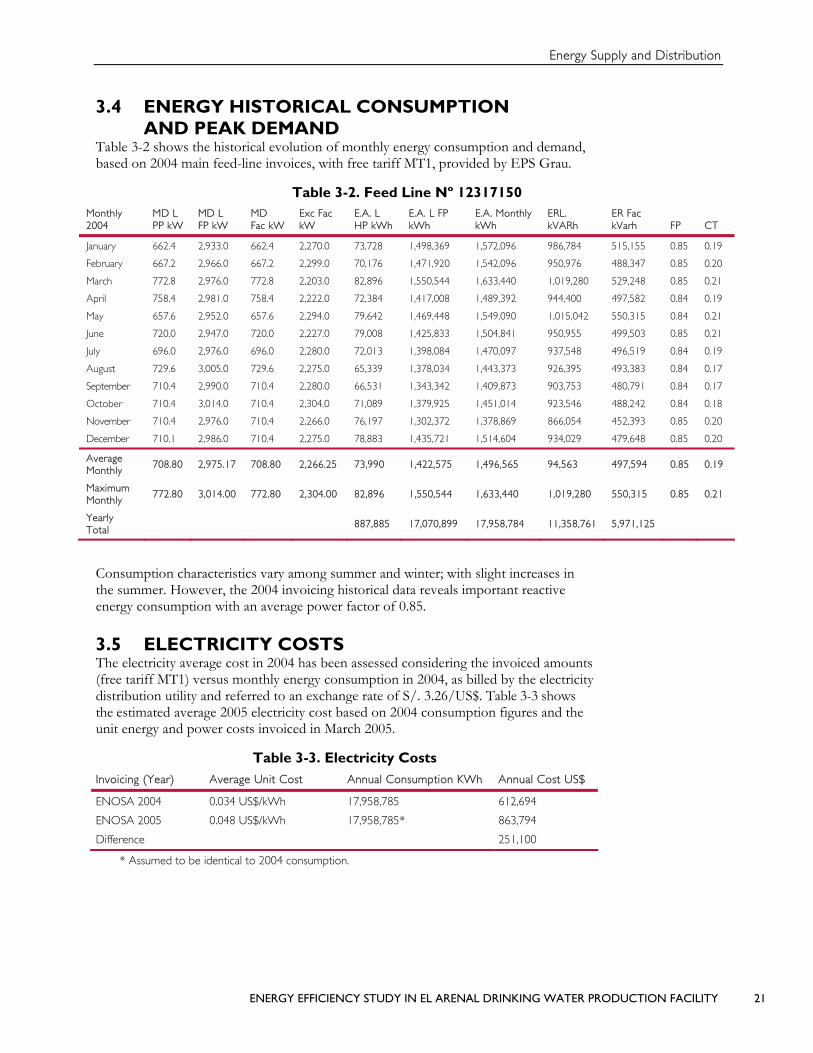
3.4 ENERGY HISTORICAL CONSUMPTION AND PEAK DEMAND
Table 3-2 shows the historical evolution of monthly energy consumption and demand, based on 2004 main feed-line invoices, with free tariff MT1, provided by EPS Grau.
Table 3-2. Feed Line Nº 12317150 Monthly 2004
MD L PP kW
MD L FP kW
MD Fac kW
Exc Fac kW
E.A. L HP kWh
E.A. L FP kWh
E.A. Monthly kWh
ERL. kVARh
ER Fac kVarh FP CT
January 662.4 2,933.0 662.4 2,270.0 73,728 1,498,369 1,572,096 986,784 515,155 0.85 0.19
February 667.2 2,966.0 667.2 2,299.0 70,176 1,471,920 1,542,096 950,976 488,347 0.85 0.20
March 772.8 2,976.0 772.8 2,203.0 82,896 1,550,544 1,633,440 1,019,280 529,248 0.85 0.21
April 758.4 2,981.0 758.4 2,222.0 72,384 1,417,008 1,489,392 944,400 497,582 0.84 0.19
May 657.6 2,952.0 657.6 2,294.0 79,642 1,469,448 1,549,090 1,015,042 550,315 0.84 0.21
June 720.0 2,947.0 720.0 2,227.0 79,008 1,425,833 1,504,841 950,955 499,503 0.85 0.21
July 696.0 2,976.0 696.0 2,280.0 72,013 1,398,084 1,470,097 937,548 496,519 0.84 0.19
August 729.6 3,005.0 729.6 2,275.0 65,339 1,378,034 1,443,373 926,395 493,383 0.84 0.17
September 710.4 2,990.0 710.4 2,280.0 66,531 1,343,342 1,409,873 903,753 480,791 0.84 0.17
October 710.4 3,014.0 710.4 2,304.0 71,089 1,379,925 1,451,014 923,546 488,242 0.84 0.18
November 710.4 2,976.0 710.4 2,266.0 76,197 1,302,372 1,378,869 866,054 452,393 0.85 0.20
December 710.1 2,986.0 710.4 2,275.0 78,883 1,435,721 1,514,604 934,029 479,648 0.85 0.20
Average Monthly
708.80 2,975.17 708.80 2,266.25 73,990 1,422,575 1,496,565 94,563 497,594 0.85 0.19
Maximum Monthly
772.80 3,014.00 772.80 2,304.00 82,896 1,550,544 1,633,440 1,019,280 550,315 0.85 0.21
Yearly Total
887,885 17,070,899 17,958,784 11,358,761 5,971,125
Consumption characteristics vary among summer and winter; with slight increases in the summer. However, the 2004 invoicing historical data reveals important reactive energy consumption with an average power factor of 0.85.
3.5 ELECTRICITY COSTS The electricity average cost in 2004 has been assessed considering the invoiced amounts (free tariff MT1) versus monthly energy consumption in 2004, as billed by the electricity distribution utility and referred to an exchange rate of S/. 3.26/US$. Table 3-3 shows the estimated average 2005 electricity cost based on 2004 consumption figures and the unit energy and power costs invoiced in March 2005.
Table 3-3. Electricity Costs Invoicing (Year) Average Unit Cost Annual Consumption KWh Annual Cost US$
ENOSA 2004 0.034 US$/kWh 17,958,785 612,694
ENOSA 2005 0.048 US$/kWh 17,958,785* 863,794
Difference 251,100
* Assumed to be identical to 2004 consumption.

Energy Supply and Distribution
22 ENERGY EFFICIENCY STUDY IN EL ARENAL DRINKING WATER PRODUCTION FACILITY
As observed, there would be an additional planned extra payment for 2005, with regard to 2004, of 29 percent, because unit costs of the new regulated supplies (MT2 and MT3) are bigger than the costs of tariff MT1 in force until 2004. However, had EPS Grau had remained on the deregulated tariff, its average cost would have been even higher (above 0.06 US$/KWh).

ENERGY EFFICIENCY STUDY IN EL ARENAL DRINKING WATER PRODUCTION FACILITY 23
4 INSTITUTIONAL ANALYSIS
4.1 THE PLAYERS To be successful, energy-efficiency programs must not only be technically and financially sound—they must also be understood and accepted by all stakeholders involved in their development, implementation, and operation. In the El Arenal, Paita project, the broad layer of actors makes the task particularly difficult.
At the highest level, is the Government of Peru, via services of the Ministry of Housing (Vivienda, Construcción y Saneamiento) and the Ministry of Finance and Economy and PROINVERSION. At the regional and local level, the municipalities (Piura, Paita) are key actors in the utility’s overall management. Financing for modernization and for the establishment of the future private concession will come from several foreign donors, namely the IDB, the Japanese Bank for International Cooperation, and other bilateral institutions. Each of these agencies will review and have a say in the final projects.
At the operational level, three entities might be involved: EPS Grau, S.A., which is currently the owner and operator of the facilities; the future private operator; and, eventually, an energy service company (ESCO).
4.2 ISSUES Two main institutional issues call for concern:
First, most of the proposed energy-efficiency measures are to be implemented almost immediately, that is, between the summer/fall of 2005 and early 2006. This period will be one of management transition between EPS Grau and the new private operator. Because these measures will have a payback of a few or up to eight months, the benefits will likely be divided between the two. Therefore, costs should be allocated accordingly.
Second, if a third party (ESCO) is involved, the shared savings contract will have to be modified with the change of owners (collateral).
4.3 RECOMMENDATION Because it is unlikely that the new concessionaire will take ownership of the facilities before the latter part of 2006, we recommend installing all the recommended equipment as soon as possible during the summer of 2005 so that all the costs and benefits can be allocated to EPS Grau. This will also enable the new concessionaire to start from a lower cost basis immediately.
At this time, EPS Grau clearly does not have the financial means to implement any capital project, even those costing as little as a few thousand dollars. Indeed, some of the operators mentioned to us during our fieldwork that they did not have funds even to “replace a burnt fuse, let alone get transport in case of an emergency.” In addition, EPS Grau may not have enough qualified staff to go through the procurement, installation, and operation of some of the recommended measures, such as better control systems. Poorly qualified personnel often gave the assessment team
To be successful, energy-efficiency programs must not only be technically and financially sound—they must also be understood and accepted by all stakeholders involved in their development, implementation, and operation.
Institutional Analysis
24 ENERGY EFFICIENCY STUDY IN EL ARENAL DRINKING WATER PRODUCTION FACILITY
contradictory information regarding operation and maintenance schedules, equipment characteristics, and the like.
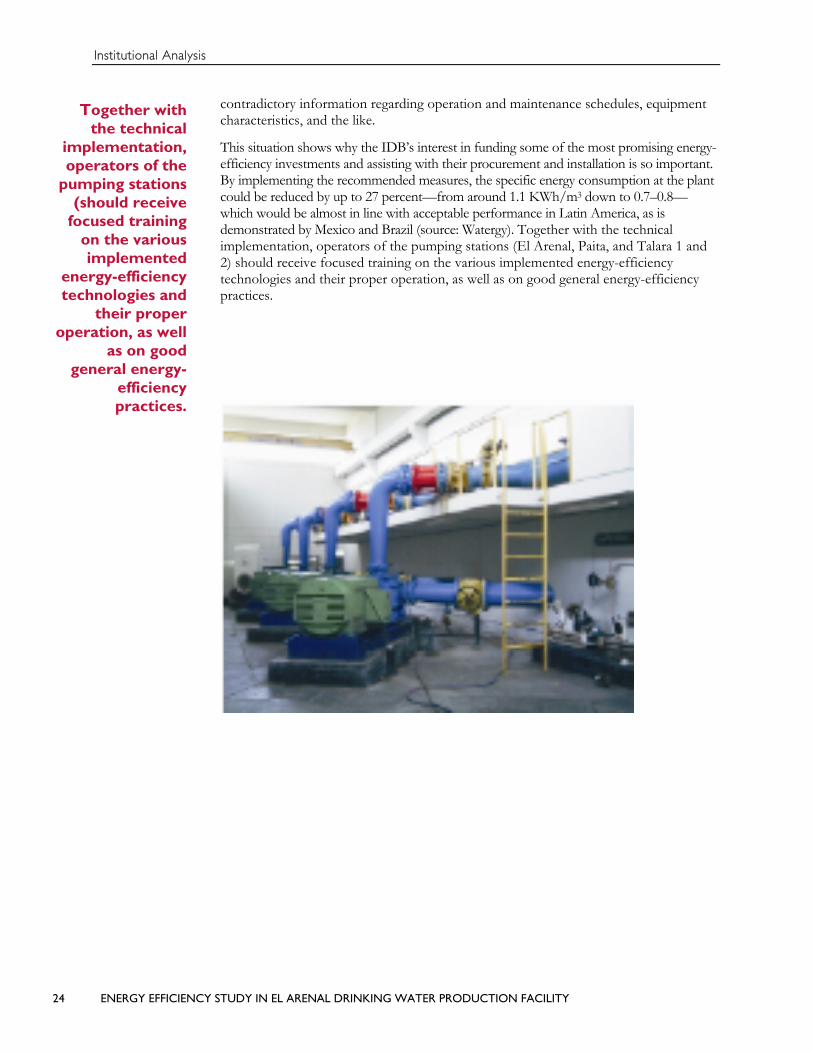
This situation shows why the IDB’s interest in funding some of the most promising energy-efficiency investments and assisting with their procurement and installation is so important. By implementing the recommended measures, the specific energy consumption at the plant could be reduced by up to 27 percent—from around 1.1 KWh/m3 down to 0.7–0.8—which would be almost in line with acceptable performance in Latin America, as is demonstrated by Mexico and Brazil (source: Watergy). Together with the technical implementation, operators of the pumping stations (El Arenal, Paita, and Talara 1 and 2) should receive focused training on the various implemented energy-efficiency technologies and their proper operation, as well as on good general energy-efficiency practices.
Together with the technical
implementation, operators of the
pumping stations (should receive
focused training on the various implemented
energy-efficiency technologies and
their proper operation, as well
as on good general energy-
efficiency practices.

ENERGY EFFICIENCY STUDY IN EL ARENAL DRINKING WATER PRODUCTION FACILITY 25
5 DESCRIPTION AND ANALYSIS OF THE IMPROVEMENTS
The following energy analysis of EPS Grau’s El Arenal Plant installations was carried out based on the observations during field work (see annex for details) and our measurement campaign (see annex for the list of equipment used). Improvements were identified, in general operations, electric installations, and personnel practices regarding proper use and maintenance of equipment. The table below summarizes the characteristics and cost of identified improvements to reduce electricity consumption and costs and while increasing the reliability of the installations.
5.1 INSTALLATION OF A REACTIVE COMPENSATION SYSTEM
This alternative considers the installation of a bank of capacitor in the following sections:
Table 5-1. Summary of Reactive Compensation Plant Quantity Total kVAR Voltage V Number of Steps Reduction Payment US$
Collection 2 X 200 400 6,000 2 24,095
EB1 – Talara 2 X 160 320 6,000 2 20,685
EB1 – Talara 2 X 160 320 6,000 2 20,685
Total 1 040 65,466
Investment: Considering US$ 50,00 / kVAR
Investment: 1040*50 52,000 US$ (American)
With the installation of a bank of capacitors, the payment of reactive energy will be decreased by an estimated US$ 65,466 per year. The simple return of investment will be:
Simple Payback Period = (52,000 US$/ 65,466 US$ x 12) = 10 months
With the implementation of the capacitor bank, the following additional benefits will be obtained:
• Improvement of the feed line voltage level,
• Reduction of losses,
• Avoidance of premature damage of the conductors and equipment, and
• Higher production capacity.

Des
crip
tion
and
Ana
lysi
s of
the
Impr
ovem
ents
26
ENER
GY
EFF
ICIE
NC
Y S
TU
DY
IN E
L A
REN
AL
DR
INK
ING
WA
TER
PR
OD
UC
TIO
N F
AC
ILIT
Y
5.2
SE
LE
CT
ION
OF
TH
E O
PT
IMU
M L
OA
D A
ND
S
EL
F-G
EN
ER
AT
ION
IN
PE
AK
HO
UR
S
Hist
orica
l con
sum
ptio
n an
d th
e cu
rren
t fee
d lin
e ta
riff a
t the
Col
lect
ion
Plan
t Nº 1
2517
661
wer
e an
alyze
d.
The
curr
ent t
ariff
is n
ot o
ptim
um, a
ccor
ding
to th
e fo
llow
ing
analy
sis:
Tab
le 5
-2. T
ariff
Op
tio
ns
Invo
icin
g
Tar
iff S
cena
rios
C
onsu
mpt
ion/
M
onth
U
nit
Tar
iff M
T2
Tar
iff M
T$
(PP)
T
ariff
MT
3 (P
P)
Tar
iff M
T4
(FP)
T
ariff
MT
3 (F
P)
Load
R
ead
Bille
d.
(U)
Uni
t Pr
ice
(US$
/U)
Tot
al
(US$
/U)
Uni
t Pr
ice
(US$
/U)
Tot
al
(US$
/U)
Uni
t Pr
ice
(US$
/U)
Tot
al
(US$
/U)
Uni
t Pr
ice
(US$
/U)
Tot
al
(US$
/U)
Uni
t Pr
ice
(US$
/U)
Tot
al
(US$
/U)
Fixe
d m
onth
ly c
harg
e
1.
94
1.94
1.23
1.
23
1.23
1.
231.
23
1.23
1.23
1.
23
Max
imum
dem
and
and
char
ge(r
ead)
H.P
. (M
T2)
390
390
kW
12.1
07
4,72
2
Cha
rge
for
exce
edin
g H
.F. P
. (M
T2)
58
4kW
1.
880
1,09
8
Cha
rge
for
max
imum
dem
and
(rea
d) (
MT3
/MT4
) 97
4 98
9kW
9.5
9,43
0.8
9.5
9,43
0.8
7.9
7,76
9.1
7.9
7,76
9.1
Cha
rge
for
activ
e en
ergy
H.P
. 27
,911
27
,911
kWh
0.04
4 1,
235.
4
0.
044
1,23
5.4
1,23
5.4
Cha
rge
for
activ
e en
ergy
H.F
. P.
440,
654
440,
654
kWh
0.03
5 15
,341
.8
0.03
5 15
,341
.8
0.
035
15,3
41.8
Cha
rge
for
activ
e en
ergy
Tot
al
468,
565
468,
565
kWh
0.
037
17,5
06.5
0.03
7 17
,506
.5
Cha
rge
for
reac
tive
ener
gy
Tota
l 29
8,29
7 15
7,72
8kV
ARh
0.
013
2,00
7.9
0.01
3 2,
007.
9 0.
013
2,00
7.9
0.01
3 2,
007.
90.
013
2,00
7.9
Tota
l Cos
t (U
S$/m
onth
)
24,4
06.9
28,9
46.5
28,0
17.2
27,2
84.7
26
,355
.4
Mon
thly
sav
ings
(U
S$/m
onth
)
1,94
8.5
Perc
enta
ge s
avin
gs (
%)
8.
0%
Ann
ual s
avin
gs (
US$
/yea
r)
23
,382
Best
Tar
iff
M
T2
– O
ff-pe
ak a
nd V
aria
ble
Load
Tar
iff
Not
e: A
nális
is ba
sed
on t
he y
ear
2004

Description and Analysis of the Improvements
ENERGY EFFICIENCY STUDY IN EL ARENAL DRINKING WATER PRODUCTION FACILITY 27
CASE 1: TARIFF OPTION CHANGE FROM TARIFF MT3FP TO MT2 As we can see from table 5-2, when we compare the various tariff options, if EPS Grau changes from tariff MT3FP to tariff MT2, annual savings of US $23,382 can be achieved.
Action: The respective tariff change must be requested from the electricity utility ENOSA. There is no investment there, because the change is free of charge.
CASE 2: SELF-GENERATION IN PEAK HOURS AND TARIFF OPTION CHANGE FROM TARIFF MT3FP TO MT2
The possibility of purchasing a generator set for the collecting plant, which can be used during electricity interruptions or ENOSA blackouts, was analyzed. Likewise, the possibility of self-generation in peak hours was also analyzed.
As shown in table 5-2 comparing the different tariff options, the change from tariff MT3FP to tariff MT2 and self-generation in peak hours is attractive. Annual savings of US$37,620 can be estimated.
The following investment would be required:
US$
Generator set, 750 kW, 460 V 230,000
Transformer from 0.46/6 kV and 800 KVA: 10,000
Assembling and installation: 15,000
TOTAL US$ 255,000
Taking into account that the simple payback period is approximately seven years, this measure is not recommended for short-term implementation, but it should be considered in the medium term by the new concessionaire.
5.3 SELECTION OF OPTIMUM FEED LINE TARIFF— TREATMENT PLANT
Historical consumptions and present tariff options of the two supplies of the water treatment plant were analyzed; one of the supplies, Nº 12517670, has not an adequate tariff, according to the following analysis:

Des
crip
tion
and
Ana
lysi
s of
the
Impr
ovem
ents
28
ENER
GY
EFF
ICIE
NC
Y S
TU
DY
IN E
L A
REN
AL
DR
INK
ING
WA
TER
PR
OD
UC
TIO
N F
AC
ILIT
Y
CA
SE
1: T
AR
IFF
OP
TIO
N C
HA
NG
E O
F F
EE
D L
INE
FO
R N
º 12
5176
70,
FR
OM
TA
RIF
F B
T3F
P T
O B
T5A
Tab
le 5
-3. O
pti
mu
m T
ariff
Op
tio
ns
for
EP
S G
rau
Fe
ed #
. : 1
2517
670
Cur
rent
Tar
iffl
: BT3
FP
Max
imum
Con
trac
ted
Dem
and
: 80
kW
Tar
iff S
cena
rio/
Cat
egor
y of
use
R
ead
Bille
d BT
2 U
S$
Cos
t U
S$/u
BT
3P
US$
BT
3FP
US$
C
ost
US$
/u
BT4P
U
S$
BT4F
P U
S$
Cos
t U
S$/u
BT
5B
US$
C
ost
US$
/u
BT5A
U
S$
Cos
t U
S$/u
Cos
t fo
r fix
ed m
onth
ly c
harg
e
1.
94
1.94
1.
23
1.23
1.
23
1.23
1.
23
1.23
1.
23
1.23
1.
23
1.23
Cos
t fo
r m
axim
um d
eman
d H
.P.
26
46
1,07
2 23
.202
89
0
19.2
50
890
19
.258
0.00
0 0
0.00
Cos
t fo
r ex
ceed
ing
F.P.
or
M.D
.F.P
. 45
19
14
4 7.
690
80
4 17
.402
804
17.4
02
141
9.37
6 7
9.74
Cos
t fo
r ac
tive
ener
gy H
.P.
696
696
31
0.04
5 31
31
0.
045
17
7 0.
25
Cos
t fo
r ac
tive
ener
gy F
.P.
3,71
6 3,
716
136
0.03
7 13
6 13
6 0.
037
13
6 0.
04
Cos
t fo
r ac
tive
ener
gy T
otal
4,
412
4,41
2 0
0
0
171
171
0.03
9 50
6 0.
115
0 0.
00
Cos
t fo
r re
activ
e en
ergy
3,
384
3,38
4 43
0.
013
43
43
0.01
3 43
43
0.
013
0 0.
000
0 0.
00
Tota
l mon
thly
cos
t (U
S$/m
onth
)
1,
427
1,
101
1,01
5
1,10
5 1,
019
64
8
321
Mon
thly
sav
ings
(U
S$/m
onth
)
69
4
Ann
ual s
avin
gs (
US$
/yea
r)
8,33
1
Porc
enta
ge o
f sav
ings
(%
)
68
%
Best
Tar
iff O
ptio
n
BT5A
As w
e ca
n se
e in
the
prev
ious
tabl
e co
mpa
ring
the
diff
eren
t tar
iff o
ptio
ns, t
he c
hang
e fr
om ta
riff B
T3FP
to ta
riff B
T5A
wou
ld b
e be
nefic
ial. A
nnua
l co
st sa
ving
s of U
S$ 8
,331
.00
can
be a
chie
ved.
Act
ion:
The
resp
ectiv
e ta
riff c
hang
e to
the
elec
trici
ty u
tility
EN
OSA
shou
ld b
e m
ade.
Iet w
ould
onl
y re
quire
a m
inim
um in
vest
men
t of U
S$ 1
,300
for
the
adju
stm
ent o
f the
ele
ctro
nic
met
er a
nd th
e in
stall
atio
n of
the
ther
mo
mag
netic
switc
hgea
r.

Description and Analysis of the Improvements
ENERGY EFFICIENCY STUDY IN EL ARENAL DRINKING WATER PRODUCTION FACILITY 29
5.4 SUBSTITUTION OF CONVENTIONAL MOTORS BY HIGH-EFFICIENCY ONES
When considering replacing a motor near the end of its lifetime, one must consider high-efficiency motors, which are specifically designed to minimize energy losses.
Likewise, before deciding to rewire a motor, it is necessary to take into account some specific considerations, for example, the efficiency of rewired motors. At present, high-efficiency motors to reduce operative costs are available. Figure 5-4 compares motor efficiencies.
Figure 5-4. Comparison of Motor Efficiencies (%)
The computation of the possible savings is performed using the following equation:
S = kW * C * N * (100/Na - 100/Nb) US$/year Where:
S : Economic saving (US$/year) N : Operation period (h/year) KW : Mechanical power at axis in kW Na : Conventional motor efficiency C : Energy cost (US$/kWh) Nb : High-efficiency motor efficiency
The substitution by more efficient motors is analyzed for two cases:
CASE 1: SUBSTITUTION OF USED CONVENTIONAL MOTORS BY NEW, HIGH-EFFICIENCY MOTORS
Table 5-4 summarizes results for the 3.125-hp motors.
Minimum efficiencies (%)

Description and Analysis of the Improvements
30 ENERGY EFFICIENCY STUDY IN EL ARENAL DRINKING WATER PRODUCTION FACILITY
Table 5-4. Assessment for the Substitution of Conventional Motors by High-Efficiency Ones
Results of the Assessment
Number of motors 2
Power reduction (kW) 3.9
Energy saving (kWh/year) 64,756
Useful lifetime period of the project 20
Annual economical saving US$/year 2,686
Present value of the benefits US$ 20,063
Investment (US$) 13,000
Present value of the costs (US$/year) 13,000
Net Present Value US$ 7,063
Benefit/cost relation 1.54
Discount rate 12%
This analysis determined that used motor efficiency decreases as a result of wear by 1 percent with regard to its nominal efficiency. Considering a recovery value for used motors equivalent to 30 percent of the value of the high-efficiency new motor, a net investment of US$9,100 is required (NPV = US$ 10,963 and benefit/cost [B/C] relation = 2.21). Economic measures (NPV and B/C) demonstrate that the ALSTHOM motor-substitution project is financially viable.
CASE 2: SUBSTITUTION OF THE ALSTHOM BELFORT 500-KWMOTOR FROM COLLECTION PLANT
Table 5-5 shows the results of the financial evaluation of 500kW-motor substitution. Economical indexes (NPV and B/C) demonstrate that the ALSTHOM motor substitution project is feasible.
Table 5-5. Assessment for the Substitution of the ALSTHOM BELFORT Motor
Results of the assessment
Number of assessed motors 1
Number of profitable motors 1
Power reduction (kW) 77.8
Energy saving (kWh/year) 373,638
Useful lifetime period of the project 20
Annual economical saving US$/year 20,717
Present value of the benefits US$ 154,744
Investment (US$) 100,000
Present value of the costs (US$/year) 100,000
Net Present Value US$ 54,744
Benefit/cost relation 13.54
Discount rate 12%

Description and Analysis of the Improvements
ENERGY EFFICIENCY STUDY IN EL ARENAL DRINKING WATER PRODUCTION FACILITY 31
5.5 CONTROL OF WATER-PUMPING EQUIPMENT According to utility norms (Resolution OSINERG Nº 2120-2001 OS/CD), Sundays and holidays are considered off-peak hours when pumps should remain in operation 24 hours without restriction. Yet, on Sundays during peak hours (18.00 to 23:00), the water production-plant and pumping-station pumps stopped working. If they worked 24 hours as they should, higher water volume could be dispatched each week to the cities of Paita and Talara or peak-hour collection pump operation could be avoided on one weekday. Operating the pumps on Sundays and holidays, and thus avoiding peak-hour operations, results in the following savings:
Average consumption per motor = 500 KWh/hour
No necessary ignition time = 4 hrs/day (16 hrs/month)
Difference between unit costs of PH (peak hours) regarding OPH (off-peak hours):
0.044 – 0.035 = 0.009 US$/kWh
Economical savings = 500 x 16 x 12 x 0.009 = 864 US$/year
Economical savings = 864 US$/year
At this time, and given the age and general condition of the equipment, we did not find that installing automatic and variable speed controls on the motor pump sets would make sense.
However, if and when the motor pump sets are replaced with new, more modern and efficient ones, then the application of such technology should be revisited.
5.6 MAINTENANCE AND APPLICATION OF WATER PUMP COATING
5.6.1 DETERMINATION OF PUMPS AND MOTOR-PUMP COUPLE EFFICIENCIES
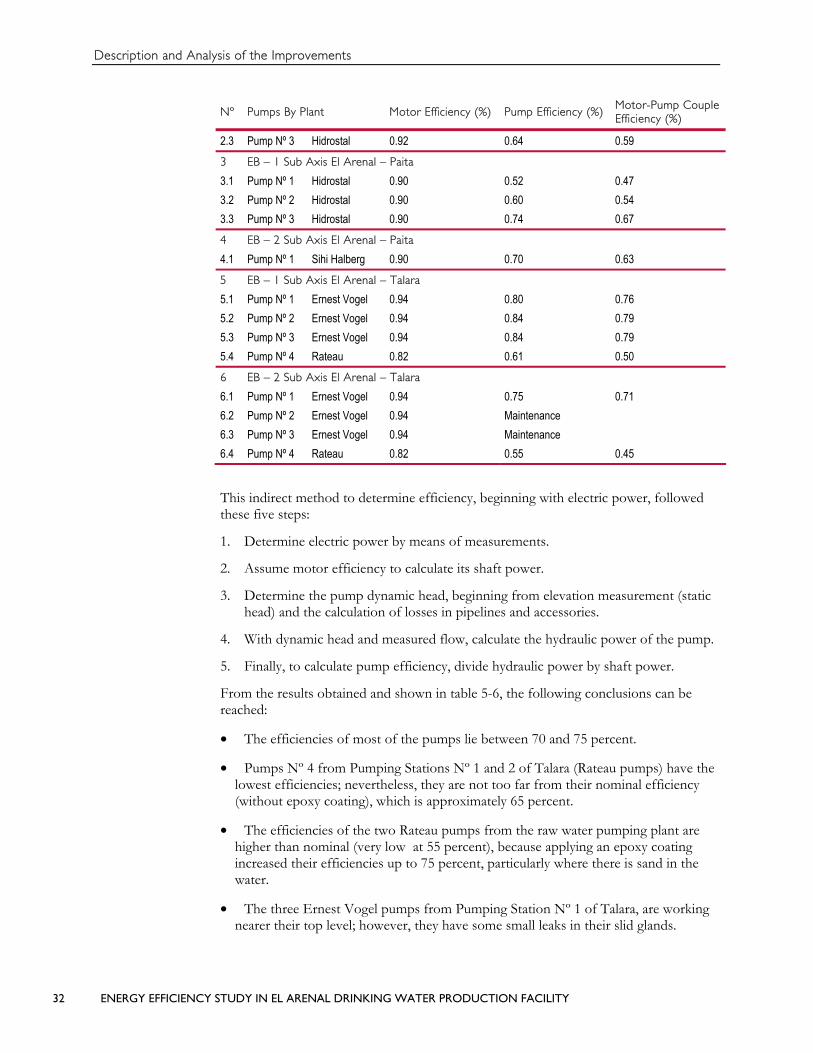
During field work, measurements of electrical (voltage, current and power factor) and mechanical parameters (flow and static head) were carried out. Complemented with motor and pump information provided by EPS Grau (characteristic curves, technical data, plans, etc.) and data from other information sources, these measurements were incorporated into an indirect method of determining present pump efficiencies. Table 5-6 indicates the resulting values.
Table 5-6. Pump Efficiencies
Nº Pumps By Plant Motor Efficiency (%) Pump Efficiency (%) Motor-Pump Couple Efficiency (%)
1 Hard Water Pumping Plant
1.1 Pump Nº 1 Rateau 0.82 Maintenance
1.2 Pump Nº 2 Goulds Puma 0.94 0.72 0.68
1.3 Pump Nº 3 Goulds Puma 0.94 0.71 0.67
1.4 Pump Nº 4 Rateau 0.83 0.75 0.62
2 Old Plant Pumping Station
2.1 Pump Nº 1 Hidrostal 0.92 0.64 0.59 2.2 Pump Nº 2 Hidrostal 0.92 0.64 0.59
Description and Analysis of the Improvements
32 ENERGY EFFICIENCY STUDY IN EL ARENAL DRINKING WATER PRODUCTION FACILITY
Nº Pumps By Plant Motor Efficiency (%) Pump Efficiency (%) Motor-Pump Couple Efficiency (%)
2.3 Pump Nº 3 Hidrostal 0.92 0.64 0.59 3 EB – 1 Sub Axis El Arenal – Paita
3.1 Pump Nº 1 Hidrostal 0.90 0.52 0.47 3.2 Pump Nº 2 Hidrostal 0.90 0.60 0.54 3.3 Pump Nº 3 Hidrostal 0.90 0.74 0.67 4 EB – 2 Sub Axis El Arenal – Paita
4.1 Pump Nº 1 Sihi Halberg 0.90 0.70 0.63 5 EB – 1 Sub Axis El Arenal – Talara
5.1 Pump Nº 1 Ernest Vogel 0.94 0.80 0.76 5.2 Pump Nº 2 Ernest Vogel 0.94 0.84 0.79 5.3 Pump Nº 3 Ernest Vogel 0.94 0.84 0.79 5.4 Pump Nº 4 Rateau 0.82 0.61 0.50 6 EB – 2 Sub Axis El Arenal – Talara
6.1 Pump Nº 1 Ernest Vogel 0.94 0.75 0.71 6.2 Pump Nº 2 Ernest Vogel 0.94 Maintenance 6.3 Pump Nº 3 Ernest Vogel 0.94 Maintenance 6.4 Pump Nº 4 Rateau 0.82 0.55 0.45
This indirect method to determine efficiency, beginning with electric power, followed these five steps:
1. Determine electric power by means of measurements.
2. Assume motor efficiency to calculate its shaft power.
3. Determine the pump dynamic head, beginning from elevation measurement (static head) and the calculation of losses in pipelines and accessories.
4. With dynamic head and measured flow, calculate the hydraulic power of the pump.
5. Finally, to calculate pump efficiency, divide hydraulic power by shaft power.
From the results obtained and shown in table 5-6, the following conclusions can be reached:
• The efficiencies of most of the pumps lie between 70 and 75 percent.
• Pumps Nº 4 from Pumping Stations Nº 1 and 2 of Talara (Rateau pumps) have the lowest efficiencies; nevertheless, they are not too far from their nominal efficiency (without epoxy coating), which is approximately 65 percent.
• The efficiencies of the two Rateau pumps from the raw water pumping plant are higher than nominal (very low at 55 percent), because applying an epoxy coating increased their efficiencies up to 75 percent, particularly where there is sand in the water.
• The three Ernest Vogel pumps from Pumping Station Nº 1 of Talara, are working nearer their top level; however, they have some small leaks in their slid glands.

Description and Analysis of the Improvements
ENERGY EFFICIENCY STUDY IN EL ARENAL DRINKING WATER PRODUCTION FACILITY 33
With pump efficiency known and motor efficiency assumed, present efficiency of motor-pump couple is determined (See table 6-6 Present System Efficiency). An overview of these results shows the motor-pump couple with the lowest efficiency (and, thus, should be stand-bys), are the two Rateau pumps from Pumping Station Nº 1 and Nº 2 Sub Axis El Arenal – Talara.
5.6.2 ENERGY IMPROVEMENT BY MAINTENANCE AND COATING APPLICATION
Poor maintenance—maintenance that is not carried out until corrective action is needed—shortens equipment and installation lifetimes and increases their repair frequency and costs. Poor maintenance on EAP pumps has resulted in them having regular or bad conservation conditions (See Actions Matrix: Diagnostic of equipment and installations) and low efficiencies, as previously determined.
On the basis of the Actions Matrix Diagnostic of installations and efficiencies determined earlier, we can conclude that, from the 19 pumps which we analyzed in detail (with measuring equipment), all of those from the Collection Plants and from the Old Plant Pumping Stations need better maintenance; the rest only need small repairs. Further, because of fluid characteristics (water with sand particles), it is recommended to apply epoxy coating to the collection plant Rateau pumps in order to increase their efficiency.
If main maintenance and small repairs previously suggested are carried out, an improvement of present efficiencies of motor-pump couple will be achieved. The energy savings resulting from decreased use of electric power and energy thus translate into economic savings.
While payment for this maintenance works comes out of plant operating expenses, 50 percent of these main maintenance costs would be considered project investments; epoxy-coating costs are also considered as an investment. Small repairs are considered operating costs. Table 5-7 summarizes energy and economic savings derived from substitution, maintenance, and coating application of the pumps that were analyzed. It also shows the simple payback period of realized investments.
Table 5-7. Summary of Energy and Economical Savings of Pumps
Place Improvement type Power decrease (KW)
Energy decrease (KWh)
Total economical savings (US$/year)
Investment (US$)
Simple Payback Period (months)
Raw water pumping plant
Main maintenance in all pumps + Coating in 2 pumps (Rateau)
107.81 517,506.15 25,639 31,447 15
Old Plant Pumping Station
Main maintenance 18.80 108,296.67 5,166 1,606.5 4
Pumping Station N° 1 Sub Axis El Arenal – Paita
Small maintenance 20.69 44,686.49 2,855 (*)
Pumping Station N° 2 Sub Axis El Arenal – Paita
Small maintenance 3.94 28,761.47 1,373 (*)
Pumping Station N° 1 Sub Axis El Arenal – Talara
Small maintenance 20.57 83,928.28 3,386 (*)
Pumping Station N° 2 Sub Axis El Arenal – Talara
Small maintenance 105.43 430,144.30 7,535 (*)

Description and Analysis of the Improvements
34 ENERGY EFFICIENCY STUDY IN EL ARENAL DRINKING WATER PRODUCTION FACILITY
Place Improvement type Power decrease (KW)
Energy decrease (KWh)
Total economical savings (US$/year)
Investment (US$)
Simple Payback Period (months)
Total 277.24 1,213,323.36 45,684 33,053.80 9
From Table 5-7, one can summarize the costs and benefits of a program to improve the efficacy of the pumps, as follows:
Power savings : 277.24 KW
Energy savings : 1,213,323 KWh
Economical savings : 45,954 US$/year
Investment : 33,054 US$
Simple payback period : 4 to 15 months (average 9 months)
5.7 OTHER IMPROVEMENTS Although they are not quantified, we recommend undertaking other improvements, such as the following:
• Install measurement instruments, such as manometers and flow meters, for pump discharge (at least the first one) to verify the good operation of equipment and to avoid operating equipment far from its maximum level. Cavitation occurs because pumps work outside of their recommended operation levels.
• Verify proper operation of check valves.
• Study loss levels for water transmission systems (impulse and conduction pipelines); if they are high, consider replacing them with high-technology materials that ensure very low energy loss.
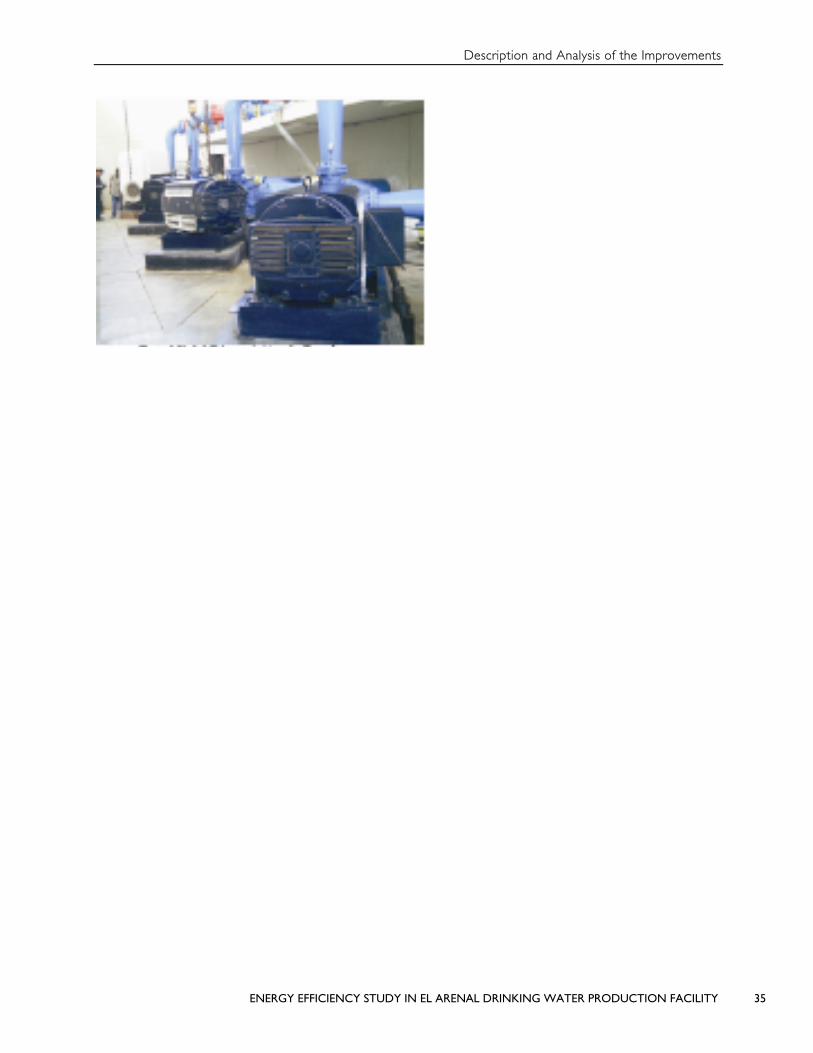
Description and Analysis of the Improvements
ENERGY EFFICIENCY STUDY IN EL ARENAL DRINKING WATER PRODUCTION FACILITY 35


ENERGY EFFICIENCY STUDY IN EL ARENAL DRINKING WATER PRODUCTION FACILITY 37
6 FINAL RESULTS
6.1 SUMMARY OF THE MOST ATTRACTIVE OPTIONS Table 6-1 shows a summary of the best options and their potential savings. Saving percentages relate to the total annual energy consumption of 2004 (17 958 785 KWh) and the invoiced average peak demand in May 2005 (3 014 KW).
Table 6-1. Best Energy Savings Options and Potential Savings
Measures
Max Demand Savings (KW)
Energy Savings (KWH)
Cost Savings (US$/Year)
Investment (US$)
Simple Payback Period (Months)
Benefit / Cost Relation
CATEGORY 1: Low-cost/No-cost Measures (Operations & Maintenance)
Selection of optimum tariff in collection plant
- - 23,382 0 - -
Selection of optimum tariff in treatment plant
- - 8,331 1,300 - -
Operational control of pumping equipment
- - 864 - - -
Pump basic maintenance 151 587,520 15,149 0 -
CATEGORY 2: Medium Term Measures
Installation of Reactive Power Compensation System ( capacitors)
65,466 52,000 10
Pumps major maintenance 127 625,802 30,805 33,054 13
Total savings 1+2 278 1,213,322 143,997 86,354 7
CATEGORY 3: Long-term Measures
Generation plant for self-generation in peak hours
255,000 7 years
Substitution of two conventional motors (125 HP each) by high-efficiency ones
4 64,756 2,686 9,100 4.4 years 2.21
Replacement of ASTHOM BELFORT motor (500 KW) from collection plant
78 373,638 20,717 100,000 4.8 years 1.54
Total savings 3 82 438,394 23,403 364,100 4.4–7 years
Total savings (1 + 2+3) 359 1,651,717 167,400 450,454 2.7 years
Reference (total 2004 demand, power consumption..)
3,014 17,958,785 612,694
Savings percentage 11.9 9.2 27.3

Final Results
38 ENERGY EFFICIENCY STUDY IN EL ARENAL DRINKING WATER PRODUCTION FACILITY
6.2 CONCLUSIONS AND RECOMMENDATIONS
6.2.1 CONCLUSIONS • The energy analysis of the El Arenal drinking water production system equipment
and installations showed that the general conditions of these old installations (with some motor changes) varies from regular to bad, as evidenced through low efficiencies, mainly in pumps (see Actions Matrix: Diagnostic of Installations).
• The analysis of potential improvements, shown in the Actions Matrix: Identification of Improvement Opportunities, identified a number of low-cost, short-term investment measures that could be implemented by EPS Grau. The Actions Matrix also lists medium investment improvements that EPS Grau could carry out. The analysis identified only one longer-term measure: self-generation in peak hours.
• Implementing all the measures listed in the table above would result in total cost savings of 27.3 percent, with an investment of $450,000. However, a more attractive program would be to implement only low-cost/no-cost and medium investment measures at this time, because they would lead to cost savings of 23.5 percent at an investment cost of only $86,354 and an average payback period of 7 months.
6.2.2 MAJOR RECOMMENDATIONS Implementing first the low cost and medium investment measures would mean to carry out the following actions: • As the first priority, implement a small maintenance program for the pumps.
Electricity consumption will be reduced by up to 3.3 percent, representing a cost saving equivalent to 7.8 percent.
• Concurrently with the previous measure, EPS Grau should negotiate an electricity tariff change with ENOSA (from MT3FP to MT2) at the Collection Plant (Feed line Nº 12517661) and, likewise, move from tariff BT3FP to BT5A at the Treatment Plant (Feed line N° 12517670). These changes will allow a financial saving of up to 5.2 percent of the current electricity bill.
• In the very short term, implement operational control of the pumping equipment.
• Install capacitors at all major pumping stations.
• Replace the two 125-HP motors from Old Plant Pumping Station with others having the same capacity but higher efficiency; likewise, replace the 500-KW ALSTHOM BELFORT motor from the collection plant. At this time, a major maintenance activity is not justified.
• Institute a routine maintenance program on pumps throughout the system, with a special emphasis on the largest ones.
6.2.3 ADDITIONAL RECOMMENDATIONS • Improve the lighting system by exchanging the 40-W lamps with 32-W lampss to
reduce energy consumption while maintaining the same lighting level.
The analysis of potential
improvements identified a
number of low-cost, short-term
investment measures that
could be implemented by
EPS Grau.
Final Results
ENERGY EFFICIENCY STUDY IN EL ARENAL DRINKING WATER PRODUCTION FACILITY 39
• Carry out proper identification and labeling of the different outflow circuits of the general distribution panels and sub panels in the buildings and, thus, improve and facilitate electric maintenance; this will give the installations more safety and reliability.
• To guide EPS–GRAU personnel in issues related to saving electricity, place small information notices near electric switches and motors with messages that refer to the optimum control of electric motors and the best use of pumps.
• For maintenance, consider substituting fluorescent lamps after 8,000 hours (two years) when lighting performance diminishes by up to 20 percent of its nominal value.
• Every six months, clean and check the lights to eliminate dust and to verify lamp function and the condition of the lighting system switches and change those in poor condition.
• Carry out a program to test ground-wire resistance, which should be maintained at values lower than 15 ohms (recommendable for industry).
6.2.4 OTHER RECOMMENDATIONS To ensure continuity and sustainability of an energy-efficiency culture at the facility, we recommend two additional management actions. The first is to establish an ongoing energy-monitoring system; the second is to establish an energy committee within EPS Grau.
ENERGY MONITORING SYSTEM The suggested system would carry out the following tasks:
• Development of a centralized energy data-collection and -management system, using available data as well as metered data. to provide an ongoing basis from which to identify energy consumption or cost-reduction opportunities (“you can’t manage what you can’t measure”);
• Development of a consumption baseline and a list of indicators or benchmarks to make it easier to identify new energy-efficiency projects as well as to monitor the actual performance of past projects; and
• Periodic reviews of the operating condition of key energy-using equipment such as pumps.
ENERGY COMMITTEE An energy committee is generally chaired by a senior technical executive, for example, the director of Operations and Maintenance, and composed of four or five concerned technical staff. This committee would do the following:
• Share their collective knowledge and experience to develop ideas for reducing energy costs at the facility;
• Establish realistic goals for reducing energy consumption and disseminate them throughout the facility;
• Promote by example among all employees a culture of energy-efficiency as a main contributor to their company’s financial health and the environment;

Final Results
40 ENERGY EFFICIENCY STUDY IN EL ARENAL DRINKING WATER PRODUCTION FACILITY
• Get commitment from management to achieve the committee’s recommended goals and to provide additional staff training in key energy areas; and
• Be a conduit of knowledge and experience with other similar water companies and promote special events and concepts, as well as share and disseminate relevant international experience.
6.2.5 FINAL NOTE If the recommended program is implemented, the the El Arenal Paita facity would become more attractive to future Private Sector Providers because its specific costs of electricity per cubic meter would get closer to the regional average. In addition, the future concessionaire will have the opportunity to implement additional capital intensive projects that could bring the energy performance in line with the best performance in the region.

ENERGY EFFICIENCY STUDY IN EL ARENAL DRINKING WATER PRODUCTION FACILITY 41
ANNEX 1. ENERGY ANALYSIS OF THE FACILITY
The energy analysis conducted in the facility aims to give necessary technical information that allows assessing the real possibilities for carrying out an optimization program in EPS Grau facility.
The information sources used in this analysis were mainly:
• Measurements conducted directly with instruments and personnel of IRG.
• Historical data provided by EPS Grau.
• Technical characteristics of the equipment and installations, compiled by IRG.
• Other studies related to the El Arenal Treatment Plant1
To determine current electricity consumption in the facility, IRG carried out a work program to assess electricity use at the facility. For this analysis, IRG measured and registered active energy (kWh), reactive energy (kVARh), peak demand (kW), power factor, current (A), and voltage (V) using MEMOBOX and DRANETZ power and energy analyzer equipment, with current transducers for direct connection to the source wires and direct voltage plugs in R, S, T phases, by installing this equipment in motors and main feed line sources.
Likewise, to determine motor-pump couple efficiencies, we measured the following: flow, pressure, voltage, current, axial rotation velocity. For the motors of old plant pumps, carcass and bearing temperature were also measured.
To achieve a realistic analysis, in parallel with the measurements taken, we observed the modes of operation of the pumping equipment. We also carried out a situation diagnostic of the facility through the use of an Actions and Diagnostic Matrix.
The resultant values indicate the current operating situation of the plant. Those values are affected mainly by the work hours, water quality, and operating modes of pumping equipment. Therefore, the completed analysis shows the operating conditions of pumping stations during our observations (from May 17 to 20 and from June 2 to 5, 2005).
1 (1) Aid memoire of the “Project of Improvement and Extension Works for Drinking Water and Drainage Systems
in the City of Talara”, Volume VI, Parsons Association-Cesel, September 2002.
(2) Final Report Socio-economical Assessment of the Investment Program for EPS Grau S.A.- Sanitation Sector Support Program, Phase II – PE 0142 – BID, Consultant Engineer Pedro Sandoval Salazar, January 2005.
LIST OF MEASURING EQUIPMENT USED
Electric analyzer (with storage)
Energy analyzer (with storage)
Multi-meter
Ultrasonic flowmeter
Pyrometer
Optical Tachometer
Light meter
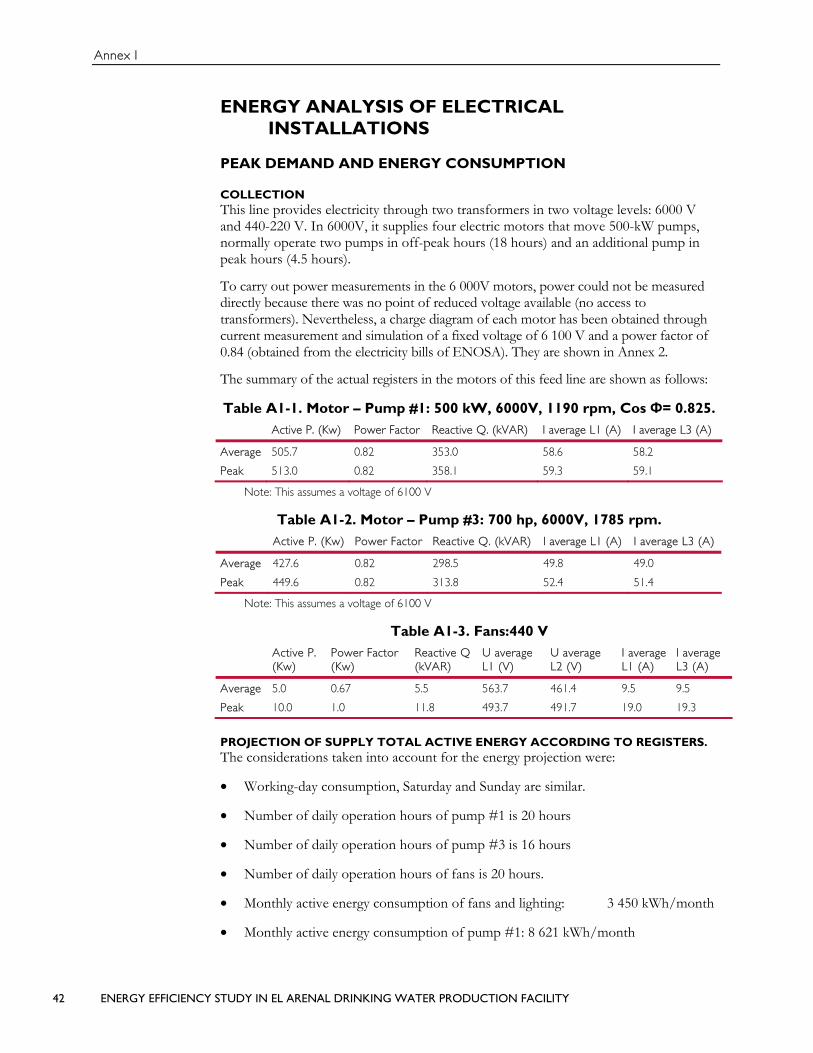
Annex I
42 ENERGY EFFICIENCY STUDY IN EL ARENAL DRINKING WATER PRODUCTION FACILITY
ENERGY ANALYSIS OF ELECTRICAL INSTALLATIONS
PEAK DEMAND AND ENERGY CONSUMPTION
COLLECTION This line provides electricity through two transformers in two voltage levels: 6000 V and 440-220 V. In 6000V, it supplies four electric motors that move 500-kW pumps, normally operate two pumps in off-peak hours (18 hours) and an additional pump in peak hours (4.5 hours).
To carry out power measurements in the 6 000V motors, power could not be measured directly because there was no point of reduced voltage available (no access to transformers). Nevertheless, a charge diagram of each motor has been obtained through current measurement and simulation of a fixed voltage of 6 100 V and a power factor of 0.84 (obtained from the electricity bills of ENOSA). They are shown in Annex 2.
The summary of the actual registers in the motors of this feed line are shown as follows:
Table A1-1. Motor – Pump #1: 500 kW, 6000V, 1190 rpm, Cos Ф= 0.825. Active P. (Kw) Power Factor Reactive Q. (kVAR) I average L1 (A) I average L3 (A)
Average 505.7 0.82 353.0 58.6 58.2
Peak 513.0 0.82 358.1 59.3 59.1
Note: This assumes a voltage of 6100 V
Table A1-2. Motor – Pump #3: 700 hp, 6000V, 1785 rpm. Active P. (Kw) Power Factor Reactive Q. (kVAR) I average L1 (A) I average L3 (A)
Average 427.6 0.82 298.5 49.8 49.0
Peak 449.6 0.82 313.8 52.4 51.4
Note: This assumes a voltage of 6100 V
Table A1-3. Fans:440 V
Active P. (Kw)
Power Factor (Kw)
Reactive Q(kVAR)
U average L1 (V)
U average L2 (V)
I average L1 (A)
I averageL3 (A)
Average 5.0 0.67 5.5 563.7 461.4 9.5 9.5
Peak 10.0 1.0 11.8 493.7 491.7 19.0 19.3
PROJECTION OF SUPPLY TOTAL ACTIVE ENERGY ACCORDING TO REGISTERS. The considerations taken into account for the energy projection were:
• Working-day consumption, Saturday and Sunday are similar.
• Number of daily operation hours of pump #1 is 20 hours
• Number of daily operation hours of pump #3 is 16 hours
• Number of daily operation hours of fans is 20 hours.
• Monthly active energy consumption of fans and lighting: 3 450 kWh/month
• Monthly active energy consumption of pump #1: 8 621 kWh/month
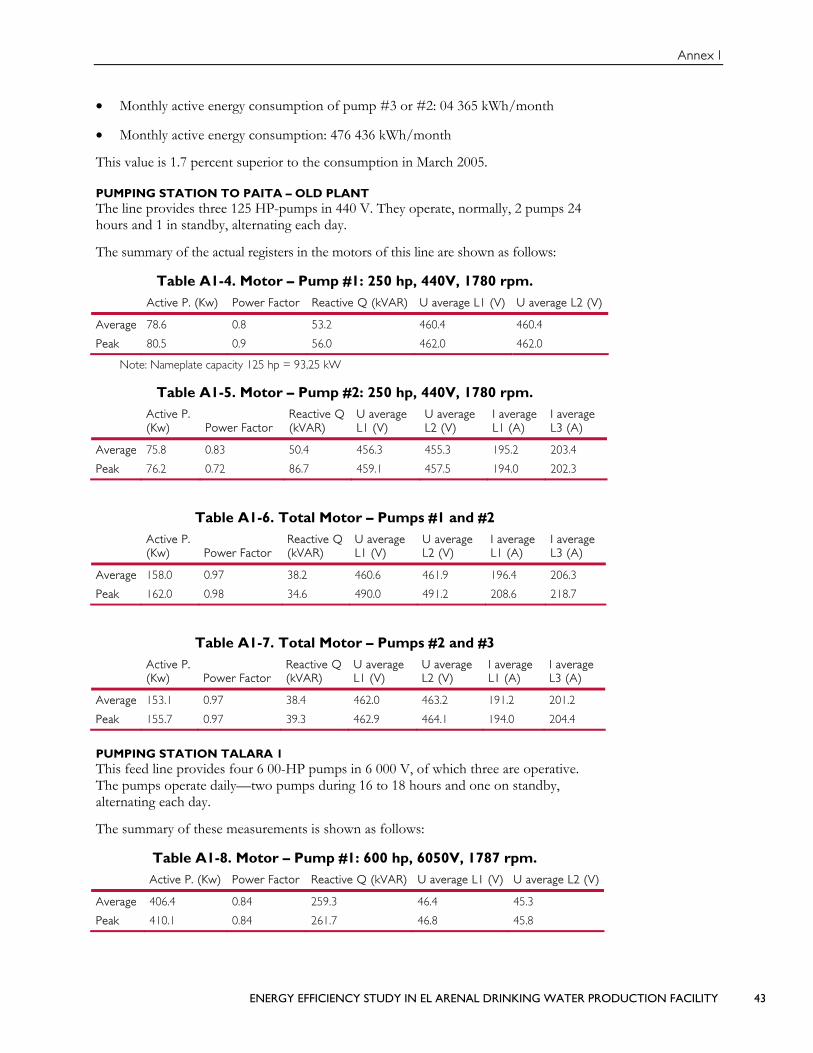
Annex I
ENERGY EFFICIENCY STUDY IN EL ARENAL DRINKING WATER PRODUCTION FACILITY 43
• Monthly active energy consumption of pump #3 or #2: 04 365 kWh/month
• Monthly active energy consumption: 476 436 kWh/month
This value is 1.7 percent superior to the consumption in March 2005.
PUMPING STATION TO PAITA – OLD PLANT The line provides three 125 HP-pumps in 440 V. They operate, normally, 2 pumps 24 hours and 1 in standby, alternating each day.
The summary of the actual registers in the motors of this line are shown as follows:
Table A1-4. Motor – Pump #1: 250 hp, 440V, 1780 rpm. Active P. (Kw) Power Factor Reactive Q (kVAR) U average L1 (V) U average L2 (V)
Average 78.6 0.8 53.2 460.4 460.4
Peak 80.5 0.9 56.0 462.0 462.0
Note: Nameplate capacity 125 hp = 93,25 kW
Table A1-5. Motor – Pump #2: 250 hp, 440V, 1780 rpm.
Active P. (Kw) Power Factor
Reactive Q(kVAR)
U average L1 (V)
U average L2 (V)
I averageL1 (A)
I average L3 (A)
Average 75.8 0.83 50.4 456.3 455.3 195.2 203.4
Peak 76.2 0.72 86.7 459.1 457.5 194.0 202.3
Table A1-6. Total Motor – Pumps #1 and #2
Active P. (Kw) Power Factor
Reactive Q(kVAR)
U average L1 (V)
U average L2 (V)
I averageL1 (A)
I average L3 (A)
Average 158.0 0.97 38.2 460.6 461.9 196.4 206.3
Peak 162.0 0.98 34.6 490.0 491.2 208.6 218.7
Table A1-7. Total Motor – Pumps #2 and #3
Active P. (Kw) Power Factor
Reactive Q(kVAR)
U average L1 (V)
U averageL2 (V)
I averageL1 (A)
I average L3 (A)
Average 153.1 0.97 38.4 462.0 463.2 191.2 201.2
Peak 155.7 0.97 39.3 462.9 464.1 194.0 204.4
PUMPING STATION TALARA 1 This feed line provides four 6 00-HP pumps in 6 000 V, of which three are operative. The pumps operate daily—two pumps during 16 to 18 hours and one on standby, alternating each day.
The summary of these measurements is shown as follows:
Table A1-8. Motor – Pump #1: 600 hp, 6050V, 1787 rpm. Active P. (Kw) Power Factor Reactive Q (kVAR) U average L1 (V) U average L2 (V)
Average 406.4 0.84 259.3 46.4 45.3
Peak 410.1 0.84 261.7 46.8 45.8

Annex I
44 ENERGY EFFICIENCY STUDY IN EL ARENAL DRINKING WATER PRODUCTION FACILITY
Table A1-9. Motor – Pump #2: 600 hp, 6050V, 1787 rpm. Active P. (Kw) Power Factor Reactive Q (kVAR) U average L1 (V) U average L2 (V)
Average 405.1 0.84 258.5 46.4 45.3
Peak 408.8 0.84 260.9 46.8 45.8
NOTE: The completed measurements in Pumping Station Talara 2 are similar to those of EB1 Talara 1.
FEED LINE 1231750 - MT1 Typical normal operating conditions were registered on Tuesday, April 5, 2005, (see Annex 2 B Figure No. 34), and the charge diagram shows a power factor of 0.72. One can observe a demand decrease beginning with 16:00 hours until 23:00 hours. From 01:00 hour until 16:00 hours, the demand holds almost uniform upon 2 800 kW.
The summary of these measurements is shown as follows:
Variable per Day Util 1 Util 2 Saturday Sunday Maximum
Demand per day (kWh) 2,125 2,133 2,010 2,121 2,133
Maximum demand h.p. (kW) 689 620 544 690 6,90
Maximum demand h.f.p. (kW) 2,939 2,938 2,928 2,948 2,948
Active energy per day (kWh) 50,992 51,180 48,246 50,908 51,180
Reactive energy per day (kVARh) 31,321 30,774 29,525 30,458 31,321
Load factor 0.72 0.73 0.69 0.72 0.73
Strength factors 0.85 0.86 0.85 0.86 0.86
The typical charge diagram shows a charge factor of 0.72 and a power factor of 0.86.
SITUATION ANALYSIS OF ELECTRICAL INSTALLATIONS The electrical installations of El Arenal pumping station are mainly in suitable condition. Nevertheless, age and operating conditions have left some panels or feeding circuits in need of repair or replacement. Consequently, an exhaustive review was of control and protection devices, wires, panels, etc., was undertaken to detect overloads, charge imbalances, ground leakages, isolation low level, over- or under voltage, high temperatures, equipment control equipment control faults or other fails that could affect the lifetime of electric equipment and increase electric energy losses.
The electricity installation inspection yielded the following results:
• All motor control panels (MCP) needed cleaning because they had accumulated dust, specially the panels of the Pumping Station to Paita (Old Plant) and the distribution Pumping Station Nº 2 to Paita.
• Each of the circuits belonging to the MCPs must be identified and labeled, with information registered regarding demand data and currents measured in normal conditions; this will facilitate motor operation and maintenance works. MCPs also need painting and general maintenance.
• The more efficient motors and pumps must be selected in order to operate more hours during a day; this selection must take into consideration the efficiency of the system motor-pump.
• Measurements of isolation level in three electric motors of treated water pumping station to Paita (Old Plant) were carried out. Adequate isolation resistances in the coils regarding the ground of 300 to 700 MΩ were registered.
Annex I
ENERGY EFFICIENCY STUDY IN EL ARENAL DRINKING WATER PRODUCTION FACILITY 45
• During measurement, it was detected in the collection plant that the old motor which moves pump Nº 1 operates with a light overload, making it necessary to review the mechanical part of the pump and to carry out the respective vibrational analysis.
ASSESSMENT OF LIGHTING SYSTEM The energy consumption for lighting in El Arenal Plant is minimal. For the interiors, 40W-flourescent lamps are used, with 125W-mercury vapor lamps for outdoor lighting.
For lighting the rooms of Water Collection and Treatment Plant, mainly 2x40W-flourescent lamps without shades are used. For lighting pumping stations, 2x40W-flourescent lamps with or without shades are used.
During measurement days, places (offices, corridors) exhibited lower lighting levels than recommended by international norms.
Regular cleaning of the lamps and shades must be implemented so as to maintain optimum lighting performance.
ENERGY QUALITY MEASUREMENTS To obtain a diagnostic of the voltage levels and to determine the level of electrical distortions in EPS Grau electric installations, measures of power quality were also conducted in the supplies of Old Plant and Pumping Stations Paita 1 and 2. Results obtained results showed the following:
• In the pumping station to Paita (Old Plant) and the pumping stations 1 and 2 to Paita, the registered voltage levels are out of the established rank in the standard +/- 5%. They have over-voltage in peak hours and at dawn, higher than 7%.
• Quality indicators of harmonic distortions and flicker are into the NTCSE permissible rank: VTHD% < 8%.
ENERGY ANALYSIS OF MECHANICAL INSTALLATIONS
ASSESSMENT OF PUMPS
RAW WATER PUMPING STATION As we already mentioned, the pumping power house has four pumps installed—two Rateau pumps (Pump N° 1 and Pump N° 4), which were considered in the original design, and two Goulds pumps (Pump N° 2 y Pump N° 3). From the 2 Rateau pumps, only one operates (Pump N° 4), the other one is in maintenance, having wear, abrasion, and damages because of the cavitation.
Normally, two pumps operate manually. An operator is guided by a walkie talkie and operates the pumps according to the production demand of the treatment plant.
The disposition of the pumps is in parallel, discharging all into a single, 800mm-pipeline. Because the collection does not have a sand filter, sand in the water wears the impellors.

Annex I
46 ENERGY EFFICIENCY STUDY IN EL ARENAL DRINKING WATER PRODUCTION FACILITY
EL ARENAL PUMPING STATION The three existing pumps are Hidrostal, model 150 – 315 with a 324mm-diameter impellor, fitted out with a 125HP-electric motor working under 440V and with a nominal velocity of 1750 RPM.
When the drinking water supply is replenished through pumping, two of the three centrifugal pumps are used. These operating in parallel simultaneously and alternate with a third pump, which stays on standby for a while and then changes off with one of the other pumps.
PUMPING STATION PAITA Nº 1 Pumping Station Paita Nº 1 consists of three 50HP-Hidrostal pumps with a capacity of 60 l/s each.. The pumps work with a voltage of 400 V 66 A and a nominal velocity of 1760 RPM.
For pumping, two of the three centrifugal pumps operate in parallel simultaneously, and alternating with the third, so that each takes a turn staying on standby.
Pump operation accords to the demand and to the rationing program.
PUMPING STATION PAITA Nº 2 The three pumps in this pumping station consist of two 24HP-Hidrostal pumps with a capacity of 15 l/s each and another 60HP-Sihi-Halberg pump with a capacity of 80 l/s. The two Hidrostal pumps are in bad condition; only the Sihi-Halberg pump supplies the demand. As in Station N° 1, this pump operates according to local demand.
PUMPING STATION TALARA Nº 1 The Pumping Station N° 1 of the El Arenal – Talara sub-system has four pumps—three 509 HP (380 kW) Ernest Voegel pumps with a capacity of 200 l/s each and a 603-Rateau pump. All four are in operating condition, and work alternately, two to two in parallel.
PUMPING STATION Nº 2 The four pumps at Pumping Station N° 1 of the El Arenal – Talara sub-system consist of three 509 HP (380 kW) Ernest Voegel pumps with a capacity of 200 l/s each and one 603-Rateau. When this assessment was carried out, only two pumps were in operation: Pump N°1 (Voegel) and pump N° 4 (Rateau). One of the Vogel pumps (Pump N° 2) was disassembled from the motor for repair, and the seals were spoiled on the other Vogel pump (Pump N° 3).
ASSESSMENT OF CONDUCTION AND IMPULSE PIPELINES
RAW WATER PUMPING STATIONS PIPELINE – EL ARENAL TREATMENT PLANT As mentioned above, the pumping pipeline that runs from the raw water pumping station to the El Arenal Treatment Plant has a nominal diameter of 800 mm with an approximately length of 800 m, overcoming a difference in height from 9.2 m.a.s.l. to 103.9 m.a.s.l. This pipeline is in good condition.
CONDUCTION PIPELINE AC DN 250 MM (10ӯ) TO PAITA. The conduction pipeline AC of DN 250 mm has a length of 25.59 km and its course is from the pumping station located in El Arenal (Old Plant) to the locality of Paita. This medium-pressure Magnianni pipeline can work by gravity until 25 l/s flow, as well as by pumping with existing improved equipment up to a 50 l/s flow. The pipeline begins at an elevation of 95.5 m.a.s.l. and ends in the tank R-1 at approximately 67.5 m.a.s.l.
Annex I
ENERGY EFFICIENCY STUDY IN EL ARENAL DRINKING WATER PRODUCTION FACILITY 47
IMPULSE PIPELINE AC DN 400 MM(16ӯ) TO PAITA. This 25.5-km pipeline runs parallel to the 10-inch pipeline. It is an Eternit 7.5-class and was installed at the same time that the new El Arenal Plant was constructed. This pipeline can work by gravity until a 80 l/s flow and by pumping, with existing improved equipment, until 160 l/s flow.
IMPULSE PIPELINE AC DN 150 MM(6ӯ) TO LA HUACA AND VIVIATE. This pipeline is made of asbestos-cement, with a length of 11 km. It supplies drinking water by pumping to the localities of El Tablazo, Viviate, La Huaca, with approximately 15 l/s flow.
The following localities are supplied with drinking water: The A. H. Tablazo de El Arenal has a direct connection from the 16-inch pipeline, it does not have regulation tank. Pueblo Nuevo de Colán is supplied by gravity through a 12-inch pipeline that begins directly at the regulation tanks; it has two tanks, one of 420 m2 and the other of 500 m3. Caserío Rinconada is supplied by a 2-inch direct connection and does not have regulation tank; Residential connections to poultry farms, feature a variable-flow supply; Colán and Playa Esmeralda are supplied by a 6-inch pipeline that has a 200 m3-regulation tank; and each premises in the residential connections and industrial zone located in El Tablazo de Paita has a storage tank.
EL ARENAL PIPELINE – PUMPING STATION Nº 1 TALARA The pipeline that begins from the El Arenal Treatment Plant and supplies water to pumping station N° 1 (El Arenal – Talara sub-system) is approximately 8.7 km long.
In the stretch from El Arenal – Pumping Station N° 1, gravity pulls the water through a HD-pipeline of 600 mm from an elevation of 98.6 m.a.s.l. to the pumping station located at 34.4 m.a.s.l.
Between the treatment plant and pumping station N° 1, water is diverted to the cities of Amotape, El Tambo, Tamarindo, and la Libertad through a 150-mm pipeline—this occurs about 1.8 km from the plant. At 3.2 km downstream, a 200-mm pipeline diverts water to the cities of Vichayal and Miramar.
PUMPING STATION Nº 1 PIPELINE – PUMPING STATION Nº 2 TALARA Pumping Station N° 1 pumps water to the Pumping Station N° 2 through a HD-pipeline of 600 mm, with a length of 8.1 km. Pumping begins on the pipeline at 34.40 m.a.s.l. and the water reaches station N° 2, which is located at 138.10 m.a.s.l..
ANALYSIS OF CONTROL AND MEASUREMENT INSTRUMENTS
RAW WATER PUMPING STATION In this station, we did not find any flow and pressure measurement instruments. The raw water supply control is made from the El Arenal treatment plant, where a few meters before the water arrival chamber a electronic flow mater is installed. It is not non calibrated because of frequent electricity blackouts.
EL ARENAL PUMPING STATION (OLD PLANT) In this station, the following instruments are installed: two manometers in the 16-inch pipeline at the outflow of the main pipeline; one Hemet - Mc Crometer flow meter in the 16-inch pipeline (in bad condition); one Hemet - Mc Crometer flow meter in the

Annex I
48 ENERGY EFFICIENCY STUDY IN EL ARENAL DRINKING WATER PRODUCTION FACILITY
10-inch pipeline; one manometer in the 16-inch pipeline and one manometer in the 6-inch pipeline.
PUMPING STATION Nº 1 PAITA Each Paita Station N° 1 pumps has its own discharge manometer. Likewise, a Hemet – Mc Crometer flow meter at the outflow of the pumping plant is used to monitor the drinking water supply.
PUMPING STATION Nº 2 PAITA Station N° 2 has a WEISS manometer in the discharge of the Sihi pump which operates alone to supply the demand. The supply register is kept with a Hemet – Mc Crometer flow meter at the pumping plant outflow.
PUMPING STATION Nº 1 TALARA We found neither manometers on the pumps nor flow meters at the outflow of the pipeline. The lack of proper control of the valve causes it to work more frequently than it should, causing water losses that are not always reported by the personnel.
PUMPING STATION Nº 2 TALARA During the inspection, we found manometers for pumps N° 1 and N° 2 (Vogel), but they are in bad condition. We also found an electronic flow meter for monitoring pumped water volume; this instrument also needed maintenance.
SUMMARY OF ENERGY DIAGNOSTIC OF THE INSTALLATIONS Figure A1-1 Actions Matrix: Energy Diagnostic, indicates the present situation of the equipment and installations from the energy point of view.
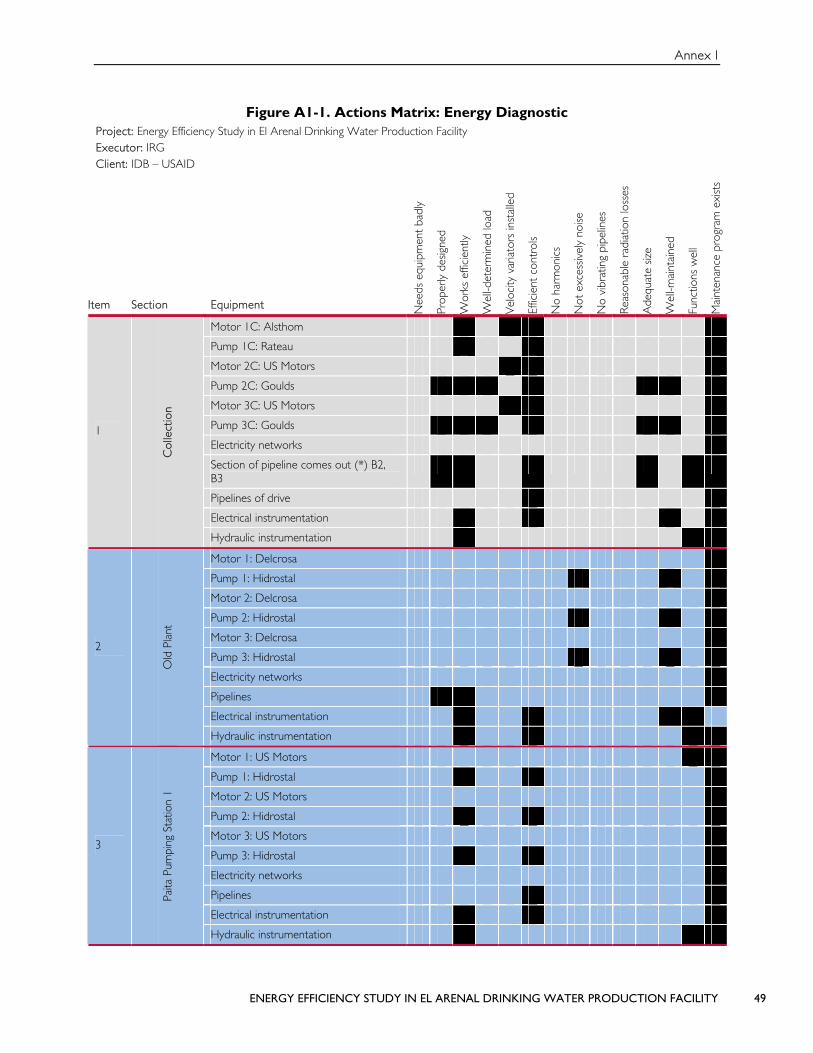
Annex I
ENERGY EFFICIENCY STUDY IN EL ARENAL DRINKING WATER PRODUCTION FACILITY 49
Figure A1-1. Actions Matrix: Energy Diagnostic Project: Energy Efficiency Study in El Arenal Drinking Water Production Facility Executor: IRG Client: IDB – USAID
Item Section Equipment Nee
ds e
quip
men
t ba
dly
Prop
erly
des
igne
d
Wor
ks e
ffici
ently
Wel
l-det
erm
ined
load
Vel
ocity
var
iato
rs in
stal
led
Effic
ient
con
trol
s
No
harm
onic
s
Not
exc
essiv
ely
noise
No
vibr
atin
g pi
pelin
es
Reas
onab
le r
adia
tion
loss
es
Ade
quat
e siz
e
Wel
l-mai
ntai
ned
Func
tions
wel
l
Mai
nten
ance
pro
gram
exi
sts
Motor 1C: Alsthom
Pump 1C: Rateau
Motor 2C: US Motors
Pump 2C: Goulds
Motor 3C: US Motors
Pump 3C: Goulds
Electricity networks
Section of pipeline comes out (*) B2, B3
Pipelines of drive
Electrical instrumentation
1
Col
lect
ion
Hydraulic instrumentation
Motor 1: Delcrosa
Pump 1: Hidrostal
Motor 2: Delcrosa
Pump 2: Hidrostal
Motor 3: Delcrosa
Pump 3: Hidrostal
Electricity networks
Pipelines
Electrical instrumentation
2
Old
Pla
nt
Hydraulic instrumentation
Motor 1: US Motors
Pump 1: Hidrostal
Motor 2: US Motors
Pump 2: Hidrostal
Motor 3: US Motors
Pump 3: Hidrostal
Electricity networks
Pipelines
Electrical instrumentation
3
Paita
Pum
ping
Sta
tion
1
Hydraulic instrumentation

Annex I
50 ENERGY EFFICIENCY STUDY IN EL ARENAL DRINKING WATER PRODUCTION FACILITY
Item Section Equipment Nee
ds e
quip
men
t ba
dly
Prop
erly
des
igne
d
Wor
ks e
ffici
ently
Wel
l-det
erm
ined
load
Vel
ocity
var
iato
rs in
stal
led
Effic
ient
con
trol
s
No
harm
onic
s
Not
exc
essiv
ely
noise
No
vibr
atin
g pi
pelin
es
Reas
onab
le r
adia
tion
loss
es
Ade
quat
e siz
e
Wel
l-mai
ntai
ned
Func
tions
wel
l
Mai
nten
ance
pro
gram
exi
sts
Motor 1: WEG
Pump 1: SIHI-Halberg
Electricity networks
Pipelines
Electrical instrumentation
4
Paita
Pum
ping
Sta
tion
2
Hydraulic instrumentation
Motor 1: US Motors Mexico
Pump 1: Ernest Vogel
Motor 2: US Motors Mexico
Pump 2: Ernest Vogel
Motor 3: US Motors Mexico
Pump 3: Ernest Vogel
Motor 4: Alsthom
Pump 4: Rateau
Electricity networks
Pipelines
Electrical instrumentation
5
Tala
ra P
umpi
ng S
tatio
n 1
Hydraulic instrumentation
Motor 1: US Motors Mexico
Pump 1: Ernest Vogel
Motor 2: US Motors Mexico
Pump 2: Ernest Vogel
Motor 3: US Motors Mexico
Pump 3: Ernest Vogel
Motor 4: Alsthom
Pump 4: Rateau
Electricity networks
Pipelines
Electrical instrumentation
6
Tala
ra P
umpi
ng S
tatio
n 2
Hydraulic instrumentation